Pure appl. geophys. 157 (2000) 449–468 0033 – 4553/00/030449–20 $ 1.50 +0.20/0 Evolution of the Gouge Particle Size Distribution: A Markov Model G. OZKAN 1 and P. J. ORTOLEVA 1 Abstract — The hydrologic and mechanical properties of faults are determined by their internal structures and zoning due to fracturing, grain breakage and diagenesis. The proposed model in this study is a first step in the development of a more complete model of fault internal structure. It describes the evolution of the gouge particle size distribution (PSD) with shear induced grain breakage within a small, assumed uniform volume element. A Markov formalism is applied for binary breakage within each time step over the many time steps constituting the evolution. The particle size, strain- and stress-dependent breaking probability is constructed based on physical arguments and data on natural and simulated gouge PSDs. The model is calibrated by using the results of MORROW and BYERLEE (1989) on Ottawa sand PSD experiments. A perfect fit is obtained between experimental and numerically simulated PSDs for a range of normal effective stress (NES). Results of the numerical simulations capture the bimodal form of gouge PSD and also clearly define two different breakage mechanisms. The gouge development behavior makes a dramatic transition as the normal effective stress exceeds the grain crushing stress of the gouge mineral. For a more complete intrafault structure analysis, the interplay of diagenesis and the mechanics of grain breakage can be integrated into a single mechano-chemical model of the type presented here. The model proposed here has great potential for predicting the complex roles of faults as seals or fluid conduits. Key words: Gouge, partial size distribution, cataclasis, grinding circuit. Introduction The motion of a fault is accompanied by the development of an intrafault structure of zones of fracturing, grain breakage and diagenesis. The internal structure and its temporal evolution are key in determining the hydrologic and mechanical properties of faults. As the structure develops spontaneously due to fault motion, a time-dependent model of all processes is required in order to predict fault behavior. The focus of this study is to present a new dynamic model of gouge develop- ment by grain breaking. The model accounts for breakage due to shearing and its effect on the particle size distribution (PSD). The breakage of a grain in a porous 1 Laboratory for Computational Geodynamics, Indiana University, Bloomington, IN 47405, U.S.A. E-mail: [email protected]
Transcript
Pure appl. geophys. 157 (2000) 449–4680033–4553/00/030449–20 $ 1.50+0.20/0
Evolution of the Gouge Particle Size Distribution: A MarkovModel
G. OZKAN1 and P. J. ORTOLEVA1
Abstract—The hydrologic and mechanical properties of faults are determined by their internalstructures and zoning due to fracturing, grain breakage and diagenesis. The proposed model in thisstudy is a first step in the development of a more complete model of fault internal structure. It describesthe evolution of the gouge particle size distribution (PSD) with shear induced grain breakage within asmall, assumed uniform volume element. A Markov formalism is applied for binary breakage withineach time step over the many time steps constituting the evolution. The particle size, strain- andstress-dependent breaking probability is constructed based on physical arguments and data on naturaland simulated gouge PSDs. The model is calibrated by using the results of MORROW and BYERLEE
(1989) on Ottawa sand PSD experiments. A perfect fit is obtained between experimental and numericallysimulated PSDs for a range of normal effective stress (NES). Results of the numerical simulationscapture the bimodal form of gouge PSD and also clearly define two different breakage mechanisms. Thegouge development behavior makes a dramatic transition as the normal effective stress exceeds the graincrushing stress of the gouge mineral.
For a more complete intrafault structure analysis, the interplay of diagenesis and the mechanics ofgrain breakage can be integrated into a single mechano-chemical model of the type presented here. Themodel proposed here has great potential for predicting the complex roles of faults as seals or fluidconduits.
The motion of a fault is accompanied by the development of an intrafaultstructure of zones of fracturing, grain breakage and diagenesis. The internalstructure and its temporal evolution are key in determining the hydrologic andmechanical properties of faults. As the structure develops spontaneously due tofault motion, a time-dependent model of all processes is required in order to predictfault behavior.
The focus of this study is to present a new dynamic model of gouge develop-ment by grain breaking. The model accounts for breakage due to shearing and itseffect on the particle size distribution (PSD). The breakage of a grain in a porous
1 Laboratory for Computational Geodynamics, Indiana University, Bloomington, IN 47405, U.S.A.E-mail: [email protected]
G. Ozkan and P. J. Ortoleva450 Pure appl. geophys.,
medium is a complex event involving the microstructure of the grain such as flawsand impurities, and, the stress concentration pattern on its surface due to the shapeof the grain and the pinning structure with neighboring ones. The formulation ofthis type of micro model is not attempted here. Rather, a probabilistic andaveraging technique is proposed and calibrated with experimental data. This modelis a first and important step in a more complete fault simulation. The temporalevolution of the PSD due to grain breakage can be incorporated into a morecomprehensive reaction, transport, mechanical (RTM) model of crustal evolutionso that texture dependent fault properties can be predicted. In particular, thepresent model describes the evolution of the PSD within each of the finite elementsconstituting the fault zone.
Abundant observations on natural and experimentally simulated gouge indicatethat the resulting PSD depends on shear strain, confining stress, fluid pressure,mineralogy, and initial particle size distribution (ENDELGER, 1974; ANDERSON etal., 1982; SAMMIS et al., 1987; MARONE and SCHOLZ, 1989; MORROW andBYERLEE, 1989; AN and SAMMIS, 1994). The goal of the present study is tointegrate these effects into a dynamic model that simulates the development of thePSD in time. This is in sharp contrast to other approaches wherein the focus wasto determine whether the final PSD could be fitted to scale-invariant, log normal orfractal formulae (EPSTEIN, 1947; SAMMIS et al., 1987; AN and SAMMIS, 1994). Ourgoal is to transcend other models wherein the particles were assumed to break intoequal-sized fragments (TURCOTTE, 1986; SAMMIS et al., 1987; PALMER andSANDERSON, 1991), and to develop a robust and accurate algorithm for thelong-time simulation of PSD.
In the proposed model, the overall breakage period is divided into consecutiveevents. In one breaking event, one grain may either remain intact or break,depending on the breaking probability assigned to that grain size. Thus in long-timesimulation, an initial grain may break many times. The breaking probability of thegrain is a function of grain size, average medium grain size, and the applied stress.The transition of the total system from time t to t+dt, corresponding to shearstrain levels o and o+do respectively, is the summation of all breakage events for allgrains during the time step. The transition probability that takes the system from o
to o+do depends on a number of factors:
� the size of the grains,� the average size prior to the evolution step,� the incremental shear, do, associated with the time step, and� the effective confining stress on the gouge during this shearing.We find that these effects can naturally be incorporated into a Markov formalism.The basis of such a theory is that the transition of the state of the system from o
to o+do depends only on its state at the strain o. In the present context, this impliesthat the past history of gouge development may be ignored except as it is manifest
A Markov Model 451Vol. 157, 2000
in the present state. This seems quite reasonable for the gouge problem. Further-more, this approach has the advantage of augmentation with fluid/rock interactioneffects (notably grain nucleation and ripening) so that the chemistry of gougeparticle size-limitation and re-consolidation can be accounted for. In the followingsections we introduce our formulation and use it to simulate gouge evolution andcalibrate the model with experiments on Ottawa sand.
Marko6 E6olution Model
Consider a mathematical model of gouge development cast as such a Markovprocess for the PSD. The medium is viewed as a collection of grains that are of onemineral, similar shape and a range of sizes. Assume the grains need only becharacterized by their volume and are subdivided into N classes labeled such thatthe mean volume (xi) within each class is proportional to i (=1, 2, . . . , N). Thetheory of gouge presented here is an attempt to characterize the evolution of thedistribution of grains among the various size classes induced by the breakageprocess.
Let fi(o) be the number of grains in class i when the shear strain state is o. In thisstudy, the shear strain is defined as the shear displacement divided by the gougethickness. After one breakage event associated with the incremental shear strain do,the change in the state of the system is assumed to only depend on its state at strainlevel o and the breaking probabilities redistributing grains among classes as a resultof do. The incremental shear strain is chosen sufficiently small that each grainexperiences, at most, one breakage.
Assume that the only process of major consequence is the binary breaking of aclass i % grain into an i and a j grain as shown schematically in Figure 1.Conservation of grain volume implies
i %= i+ j. (1)
Let ci%� i,j be the conditional probability that an i % grain breaks into an i and a jgrain in do. As the binary processes are assumed to be the only ones allowed,
ci%� i%,0+ %i%−1
i=1
ci%� i,i%− i=1. (2)
Note that ci� i,0 is the conditional probability that an i grain does not divide.With ci%� i,j, one can construct fi(o+do) assuming gouge to be Markov process
via
fi(o+do)=ci� i,0fi(o)+2 %N
i%= i+1
ci%� i,i%− i fi%(o). (3)
Use has been made of the symmetry property ci%� i,j =ci%� j,i.
G. Ozkan and P. J. Ortoleva452 Pure appl. geophys.,
Figure 1Schematic representation of binary breaking of a grain.
Equation (3) is the formal starting point for our analysis. With this formulation,the total volume of grains is conserved in each breakage event. The proof of theconservation of volume is given in Appendix A.
When a grain is broken into two parts, the sizes of the fragments are arbitrary,as long as they add up to the original grain volume. As a simplifying assumption,we adopt a uniform probability for the fragmentation. With this assumption, theconditional probability ci%� i,i%− i depends only on the breaking probability of classi % as
ci%� i,i%− i=
ÁÃÍÃÄ
1−ci% when i= i %
ci%
i %−1i=1, 2, . . . , i %−1
(4)
where ci is the breaking probability of grains of class i in shearing by an amountof do, regardless of the fragment size. With these breaking probabilities, gougeevolution via Equation (3) has the form
fi(o+do)= (1−ci)fi(o)+2 %N
i%= i+1
ci%
i %−1fi%(o). (5)
In the above formulations, the mean volume within each class is proportional toi and the grains cannot be fragmented below the first class (i.e., the breakingprobability of class-1 is zero). The maximum grain size of the range of analysis isdenoted N. The value of N can be chosen to fix the refinement of the characteriza-tion. In AN and SAMMIS (1994), distributions were observed for grains in the rangefrom one micron to several millimeters in diameter. For a system with this range of
A Markov Model 453Vol. 157, 2000
grain diameters, our model needs about 1012 classes (N:1012). For computa-tional efficiency, the PSD evolution via Equation (5) must be converted to anintegral equation as
f( (x, o+do)= (1−c(x))f( (x, o)+2&�
x
c(y)y
f( (y, o) dy (6)
where x is the grain volume, c(x) is the x-dependent breaking probability, andf( (x) is the number of particles in the size interval form x to x+dx. The numberand volume of grains in the range (x, x+dx) are obtained via
number of grains in dx= f( dx
volume of grains in dx=xf( dx. (7)
The number density, f( , is to be solved numerically throughout the grain size (x)domain. The integration in Equation (6) is evaluated by subdividing the integralrange into segments; the total number of which is small compared with thenumber (�1012) of classes. The segment size is chosen to be small enough topreserve all features in f( but also the total number of intervals should be reason-able for a feasible solution. This continuous form in Equation (6) also conservesthe total volume of gouge material during grinding. The proof is similar to thatgiven in Appendix A, with integrals replacing summations.
The Breaking Probability
The physics of the present model is contained in the dependence of thebreaking probability c on normal stress, incremental shear strain, mineralogy,fluid properties (composition and pressure) and, in principle, on PSD itself. In asingle breakage event, the breaking probability for a grain depends not only onits size, but also on the mineralogy and texture of the gouge material around it.In the remainder of this section, a series of particular assumptions are made onthe form of the breaking probability, in an attempt to incorporate observedgouge phenomena. These assumptions are deduced from the experimental andfield observations on gouge texture. Thus, we take a phenomenological approachdue to the absence of an available micro model to otherwise guide the functionalform of breaking probability.
G. Ozkan and P. J. Ortoleva454 Pure appl. geophys.,
A. Size Dependency
Field observations of SAMMIS et al. (1987) and AN and SAMMIS (1994) onSouthern California fault materials, suggest that some large grains remain unbro-ken even after excessive shearing. Therefore, the breaking probability for grainsvastly larger than the average is less than that for medium sized ones. In SAMMIS
et al. (1987), it was also observed that the likelihood of breaking of a given grainincreases when neighboring grains are of similar size. SEM photographs showedthat if two equal-sized grains are in contact they will be more likely to break. Bygeneralizing this observation in a probabilistic sense, one may conclude that grainsclose to the average in size will have a higher breakage probability. Larger grainssurrounded by relatively smaller ones seem to have a greater chance to survivebecause the strain that would be imposed on them is taken up by their manyneighbors rotation and boundary slip for which there are many opportunities in themany small neighbor configurations available. Also, the pores created by largergrains can shelter the very finest particles. Therefore, the breaking probability c hasa maximum around the average size of the gouge material. As the transitionprobability c depends on the average, it is a functional of f( . Thus, the presenttheory is a nonlinear Markov model.
We introduce both the average volume and diameter. Average volume, �x�, isthe total volume of gouge material divided by the total number of grains. Theaverage diameter �d�, is computed by weighing diameters with respect to particlenumbers. The diameter d is assumed to be related to grain volume via d=l 3x forgeometry factor l (equal to (6/p)1/3 for spheres). In the integral form, these averagesizes are calculated from the number densities as
�x�=
&�0
xf( (x, o) dx&�0
f( (x, o) dx
�d�=
&�0
l 3xf( (x, o) dx&�0
f( (x, o) dx. (8)
We assume the average diameter to measure the ability of large grains to survivebecause their breakage is related to a small moment of force which involves adistance. If small grain survival is a matter of packing and grain volume, theirdeviation from the average in volume is considered the appropriate measure ofsmallness. One can form a function having a maximum around the average size sothat the behaviors of small and large grains are governed, respectively, by �x� and�d�, using a multiplication of two simple functions;
A Markov Model 455Vol. 157, 2000
: 1
1+d
�d�
;ÃÃ
Ã
Á
Ä
x�x�
1+x
�x�ÃÃ
Ã
Â
Å
. (9)
The first factor assures that the breaking probability is zero when the graindiameter is very large compared to the average diameter. The second factor sets thebreaking probability to zero for the grains of small volume. This functional impliesthat the breaking probability evolves with each shear increment do, since theaverage medium sizes are continuously changing. For a more generalized shape ofthe breaking probability, we add two parameters in a and b that affect thesharpness. The shape of the breaking probability is then assumed to be propor-tional to a factor H given by
H� x
�x� ,d
�d��
=� 1
hnorm
� 1
1+� d
�d��a
� x�x�
�b
1+� x
�x��b . (10)
The first term is for normalization (see below). In Figure 2, the function H isplotted with different values of a and b, for �d�=l�x�1/3. It can be concludedfrom Figure 2 that as a increases, the lower limit of the range that large grainssurvive approaches the average size. For grains smaller than the average volume, asb increases, the upper limit of the small grain survival range approaches the averagevolume. Since comminution is increased with confining stress (SAMMIS et al., 1986),we expect that both a and b decrease with increasing stress. These parameters areto be calibrated with the experimental data for a range of confining pressures.
B. Strain Dependence
The breaking probability should increase with do. We assume that do is so thatthat for it any grain will experience at most one breaking; consecutive breakingsequences are not allowed if do is taken sufficiently small. The gouge material andconfining stress will determine how small the incremental shear strain must be toavoid multiple breakage. Ductile minerals need more incremental strain for appre-ciable grain breakage than do the brittle minerals. Also, the same amount of shearstrain will cause more grain breakage at higher confining stresses. These effects canbe modeled by introducing a mineral-dependent characteristic shear strain, oc,which is the strain limit for a single Markov step. Thus, when do/oc�1, f( will notchange appreciably as do is applied.
With this, the breaking probability is assumed to have the form
G. Ozkan and P. J. Ortoleva456 Pure appl. geophys.,
Fig. 2.
A Markov Model 457Vol. 157, 2000
�do
oc
�H� x
�x� ,d
�d��
. (11)
Further augmentation is required, however, to incorporate all the richness in gougephenomenology.
C. Grinding Limit
It was observed by MARONE and SCHOLZ (1989), BIEGEL et al. (1989) that thePSD reaches a steady state during experiments after large shear strains. To explainthis phenomenon, AN and SAMMIS (1994) introduced the concept of a grindinglimit into gouge PSD evolution. This limit introduces the minimum grain size forfragmentation and is generally recognized in industrial communition literature(HERBST and SEPULVEDA, 1978; PRASHER, 1987). The experimental grinding limitsare observed to be 1.7 mm for quartz and 4.4 mm for calcite.
In our model, we introduce the function G which dramatically reduces thebreaking probability as the average grain size approaches the grinding limit. Thisbehavior is approximated by using the incomplete gamma function P with twoparameters, n and a, as
G��d�
dlim
�=P
�n,��d�
dlim
�a�(12)
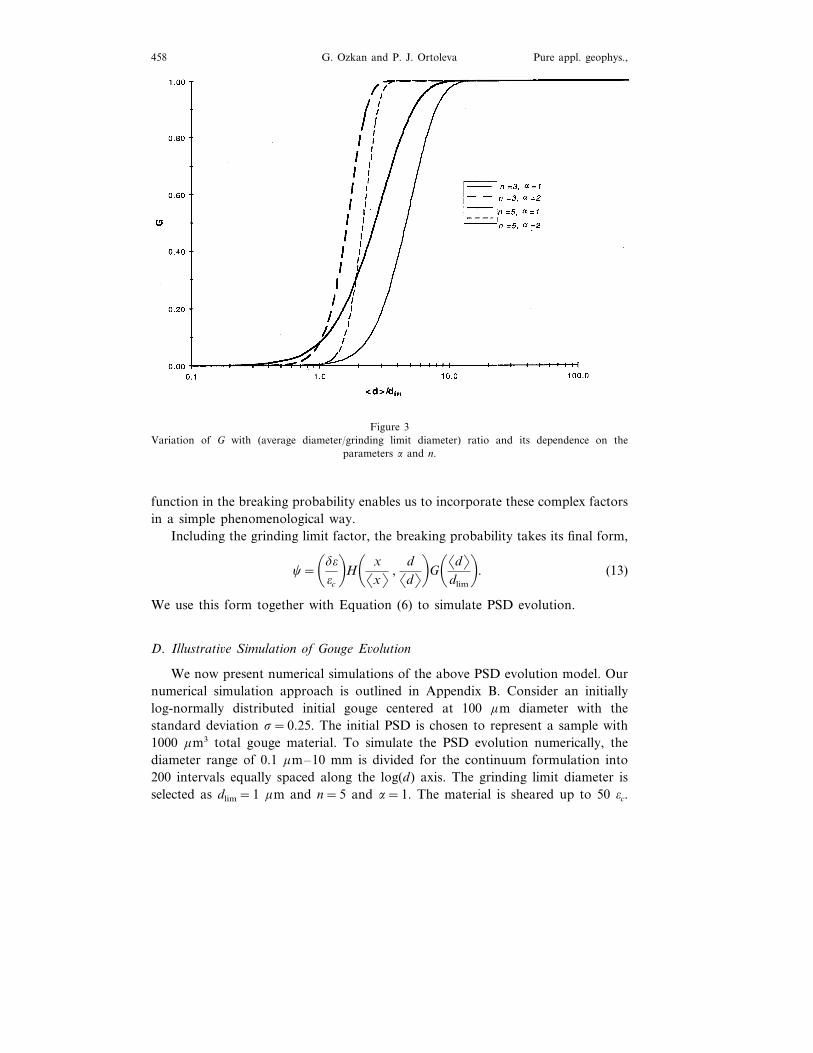
where n is the order of the gamma function. The values of G are plotted for variousn and a values in Figure 3. The function G varies between 0 and 1. When theaverage grain diameter is smaller than the grinding limit diameter, G approacheszero and, if a factor G is included in c, the breaking probability for all grainsapproaches zero. When the average diameter of the gouge material is considerablygreater than the grinding limit, the value of G reaches unity; therefore, there is nogrinding limit effect on the breakage process. For n=5, when the average graindiameter is equal to the grinding limit diameter, the value of G is 0.003 whichcurtails grinding beyond the limit size. Generally, as n increases, the zone ofrepressed breakage shifts towards larger grains. The range of average grain sizeover which grinding ceases increases as a decreases.
The mechanism of steady-state grinding may involve several possible micro-me-chanical and chemical processes: Ostwald ripening whereby find grains tend todissolve and larger ones grow at their expense; flocculation; and effective decreasein medium viscosity with decreasing average medium size. The choice of gamma
Figure 2H function with respect to the ratio of grain volume to average volume plotted in semi-log scale withparameters (a) a=0.2, 1, 2, and b=1. When x/�x�=1000, the H values are 0.90, 0.29, and 0.04corresponding to a=0.2, 1, and 2. (b) a=1 and b=0.2, 1, 2, such as for b=0.2, 1, and 2, theprobabilities at x/�x�=0.001 are 0.69, 0.003 and 0.000002, respectively. With a=b=1, the value of Hfor a grain with diameter 10 times the average diameter (x/�x�=1000) is 0.29, whereas for a grain with
diameter one tenth of the average, H is 0.003.
G. Ozkan and P. J. Ortoleva458 Pure appl. geophys.,
Figure 3Variation of G with (average diameter/grinding limit diameter) ratio and its dependence on the
parameters a and n.
function in the breaking probability enables us to incorporate these complex factorsin a simple phenomenological way.
Including the grinding limit factor, the breaking probability takes its final form,
c=�do
oc
�H� x
�x� ,d
�d��
G��d�
dlim
�. (13)
We use this form together with Equation (6) to simulate PSD evolution.
D. Illustrati6e Simulation of Gouge E6olution
We now present numerical simulations of the above PSD evolution model. Ournumerical simulation approach is outlined in Appendix B. Consider an initiallylog-normally distributed initial gouge centered at 100 mm diameter with thestandard deviation s=0.25. The initial PSD is chosen to represent a sample with1000 mm3 total gouge material. To simulate the PSD evolution numerically, thediameter range of 0.1 mm–10 mm is divided for the continuum formulation into200 intervals equally spaced along the log(d) axis. The grinding limit diameter isselected as dlim=1 mm and n=5 and a=1. The material is sheared up to 50 oc.
A Markov Model 459Vol. 157, 2000
Fig. 4.
G. Ozkan and P. J. Ortoleva460 Pure appl. geophys.,
Figure 4Numerical particle size distribution evolution of initially log-normally distributed material (dmean=100mm and s=0.25) with parameters (a) a=3, b=1, dlim=1 mm, n=5, a=1, (b) a=3, b=1.5, dlim=1
mm, n=5, a=1 and, (c) a=3, b=1, dlim=10 mm, n=5.
For the parameters a=3 and b=1, the numerically simulated PSD is seen inFigure 4a as the shear evolution of the volume versus grain diameter curves insemilogarithmic scale. After each incremental strain step, the PSD broadens to-wards the smaller grain sizes and the average grain size reduces. As shearingcontinues, the surviving large grains tend to remain unbroken through furtherstrain increments. After long-term evolution, the PSD reaches a steady state withmost grains piled up around the grinding limit diameter and those remainingcentered around the initial PSD mean. A gouge simulation with a=3 and b=1.5is given in Figure 4b. The increase in the parameter b increases the breakage of thelarger grains and, the initially unimodal PSD becomes bimodal. During evolution,one of the maxima shifts towards smaller grain sizes while the other is fixed at agrain size almost the same as the maximum of the initial PSD. In Figure 4c thesame shearing simulation of Figure 4a is repeated with the grinding limit atdlim=10 mm. In this case, the final PSD range is narrower than the first simulationbecause of the grinding limit constraint.
A Markov Model 461Vol. 157, 2000
Calibrating the Model Parameters
In 1989, MORROW and BYERLEE (1989) performed gouge experiments onseveral rock types. In one set of these experiments, 3 mm-thick Ottawa sand withgrains between 200 and 710 mm in diameter were sheared by velocity-stepping to atotal displacement of 16 mm under constant effective normal stresses of 12.5, 25,50, and 100 MPa. The grain size analysis of the gouge created after theseexperiments was given in the form of cumulative mass diagrams. In the presentstudy, these diagrams are digitized and converted to the volume data shown inTable 1. The total shear strain used to produce the gouge at the end of anexperiment is calculated from the final gouge thickness and displacement. The finalgouge thickness depends on the pore volume changes during the experiment, sinceby shearing the gouge material becomes denser. The shear strains at the end of eachexperiment, ofinal, are calculated in accordance with the pore volume change andgiven in Table 1.
To start the numerical simulations, the PSD of the undeformed Ottawa sand isfitted to a log-normal distribution. Defining the error between the log-normaldistribution and the observed PSD as
Error=1
Xtotal
%M
i=1
�(Xi)n− (Xi)e � (14)
Table 1
Volume of materials in the size classes for undeformed (initial) and final Ottawa sand after 6elocity-step-ping shear experiments with different effecti6e normal stresses (MORROW and BYERLEE 1989)
G. Ozkan and P. J. Ortoleva462 Pure appl. geophys.,
Table 2
Parameters a and b and the characteristic shear strain minimizing the errorbetween numerical gouge e6olution and experimental results
oc ErrorbExperiments a
sneff=12.5 MPa 1.69 0.82 0.0923.60
0.84 0.1371.18sneff=25 MPa 2.47
2.12sneff=50 MPa 0.56 0.1002.67
sneff=100 MPa 2.14 0.52 0.0802.56
where subscripts n and e denote numerical and observed PSDs, the best fit isobtained for mean dmean=345 mm and standard deviation s=0.133, with an errorof 0.046. In Equation (14), Xi is the volume of material in class i (see Eq. (A-10)),i from 1 to M (M=10 as seen in Table 1), and Xtotal is the total volume of solidcomprising the sheared material.
For the numerical gouge evolution simulations, the grain size ranges from 10mm to 1.6 mm in diameter and is divided into 440 intervals equally spaced in thelog(d) axis. Numerical experiments are carried out with different a and b values andthe PSDs are obtained after each dimensionless strain increment do %=do/oc. Foreach Morrow and Byerlee experiment (shearing with different effective normalstresses), the parameters a and b and o %final yielding the minimum error betweensimulated and observed PSDs, are determined. The characteristic shear strain isthen calculated from the nondimensional final shear via oc=ofinal/o %final. The numer-ical simulations are repeated by decreasing do % in a sensitivity study to check theaccuracy of numerical simulations and thereby to ensure the best choices for a, band oc.
The results of these parametric studies are listed in Table 2 while the PSD afterthe shearing experiments are compared with the numerically simulated distributionsin Figure 5. These figures demonstrate that, with properly selected model parame-ters, the present model captures gouge evolution. From the values in Table 2, onecan conclude that the parameters a and b depend on the normal effective stress(NES). The variations of the variables in Table 2 with NES are shown in Figure 6.From these graphs, two different behaviors are observed depending on whetherNES is below or above a grain crushing stress (50–60 MPa for Ottawa sand notedin ZOBACK, 1975, and MARONE and SCHOLZ, 1989). Within each of these regions,the oc values remain constant, but oc for the low stress region is greater than that ofthe high stress region. In the low NES region, the parameters a and b decrease withincreasing NES whereas for NES equal to or greater than the grain crushing stress,these parameters are almost constant.
The characteristic shear strain oc obtained, reveals much about the fragmenta-tion process. On the single grain scale, one might expect that a grain will typicallybreak if the shear displacement across one grain is its radius (1/2d) and the
AM
arkovM
odel463
Vol.
157,2000
Figure 5Particle size distribution comparisons of the numerical evolution and the observed ones after the shearing experiments of Ottawa sand by MORROW and
BYERLEE (1989).
G. Ozkan and P. J. Ortoleva464 Pure appl. geophys.,
Figure 6Variations of model parameters for Ottawa sand with the effective normal stress (a) parameters a and
b, and (b) the characteristic shear strain.
corresponding distance over which this is applied is roughly d. Thus, the character-istic strain should be of order 1/2d/d=1/2. However, slippage and other accommo-dation processes could make oc greater than this value. From Table 2, one sees thatfor large NES (for which slippage is a minimum) oc is 0.53. For low NES, oc:0.83and there is appreciable slippage. The apparent abrupt change in oc with NES seemsto be associated with a catastrophe in the constraining of the packing induced by
A Markov Model 465Vol. 157, 2000
high NES, i.e., it requires less force to break a grain than to ride over a grain(accommodate) under supra-critical confinement conditions. It should be possibleto estimate the critical effective stress by equating the related grain scale deviatoricstress to that needed to induce breakage of a single grain. One expects that in morelithified media oc should be appreciably less than 0.5 as small values of o would,under elastic conditions, yield large stresses. Thus, we expect that a value of oc=0.5reflects appreciable slippage even in the larger NES case.
Conclusions
A Markov model is proposed for the evolution of the gouge PSD. This modelis based on the binary breaking of individual grains into arbitrary fragment sizesduring each of a sequence of time interval spanning the overall evolution of thesystem. Gouge evolution equations based on this Markov approach are set forthand shown to conserve the material volume during shearing. The physics of gougeevolution is incorporated into the model via the breaking probability. The breakingprobability of a grain at any instant depends on the size of this grain and theaverage properties of the gouge at that instant. For a fixed grain size, the breakingprobability is changing as evolution progresses. In the mathematical expressionused for the breaking probability, there are several parameters to be calibrated withexperiments. In the present study, the model parameters are calibrated with theOttawa sand experimental data of MORROW and BYERLEE (1989). Further experi-mental results on the normal effective stress (NES) and mineral dependence ofgouge evolution are essential for refining and extending our calibration.
The present model simulates several observed gouge phenomena. These includethe development of a bimodal distribution from a unimodal one, survival of largegrains even after extensive shear displacement, and the existence of a steady-statePSD for finite strains. The present model also seems to imply two distinct regimesof grain size reduction with respect to NES; size reduction dominated by shearing,and by NES induced grain crushing.
The present model allows gouge evolution to be placed within the context ofother processes believed to be essential in determining the mechanical and hydraulicproperties of fault zones. The model is a first step in the development of a morecomplete model of gouge evolution. We are now augmenting the model to accountfor variations in grain shape, mineralogy, and grain chemical reactions includingthe effects of surface free energy and Ostwald ripening. Chemical reactions can beintroduced in the present gouge dynamics model by using time-stepping rather thanstrain-stepping in the Markov formulation. Chemical reaction terms similar tothose used in the theory of nucleation and Ostwald ripening thereby enter andprovide a mechanism for accounting for the grinding limit (see ORTOLEVA, 1994,Chapter 9). In this way, the Markov theory presented provides a framework for
G. Ozkan and P. J. Ortoleva466 Pure appl. geophys.,
improving the theory of gouge by accounting for more explicit terms for theunderlying processes.
Appendix
A. Conser6ation Laws
In gouge evolution during shearing, the gouge PSD at the strain level o+do iscalculated from the state of gouge at o strain level via,
fi(o+do)=ci� i,0fi(o)+2 %N
i%= i+1
ci%� i,i%− i fi%(o). (A-1)
To have a consistent mathematical simulation, the total volume of grains should beconserved during the size reduction process. The total volume of grains at strainlevels o and o+do are
Xtotal(o)= %N
i=1
xi fi(o). (A-2)
and
Xtotal(o+do)= %N
i=1
xi fi(o+do), (A-3)
respectively. At o+do, we can evaluate the total volume using Equation (A-1) as
Xtotal(o+do)= %N
i=1
xici� i,0fi(o)+ %N−1
i=1
xi�
2 %N
i%= i+1
ci%� i,i%− i fi%(o)�
. (A-4)
The last term in Equation (A-4) can be rearranged by use of the symmetry propertyof the breaking probability coefficients and proportionality of class volume to indexas:
%N−1
i=1
xi�
2 %N
i%= i+1
ci%� i,i%− i fi(o)�
= %N
i%=2
xi%fi(o)� %
i%−1
i=1
ci%� i,i%− i�
, (A-5)
where the value of the right-hand side parenthesis is (1−ci%� i%,0). Then, Equation(A-4) becomes
Xtotal(o+do)= %N
i=1
xici� i,0fi(o)+ %N
i%=2
xi%fi%(o)(1−ci%� i%,0) (A-6)
and further reduces to
Xtotal(o+do)=x1c1�1,0f1(o)+ %N
i=2
xi fi(o). (A-7)
A Markov Model 467Vol. 157, 2000
Since c1�1,0=1, Equation (A-7) is identical to Equation (A-2) and the totalvolume is conserved during grinding due to the incremental strain do.
B. Numerical Approach
Knowing the breaking probability c and the PSD density f( (o) functions at thestate with shear strain o, the PSD density function at strain o+do can be evaluatedfrom Equation (6). For this purpose, a computer code is developed in this study.The inputs to the code are the initial PSD and the parameters of breakingprobability (a, b, n, a, dlim and oc). In the program, the average grain volume anddiameter are calculated using Equation (8) and the breaking probability function isevaluated at that strain level. Subsequently, the PSD after one strain increment isobtained from Equation (6). Finally, the code initializes the whole process with thenew distribution and proceeds similarly to obtain the PSD during the history ofshearing.
The infinite integral in Equation (6) is evaluated numerically by truncating therange of integration after a reasonably large grain size where the number of grainswith sizes larger than this cut-off size is negligible. The numerical integration isperformed by dividing the range of volume in the integration into intervals, andintegrating c(y)/y by Gaussian quadrature in each interval assuming constant PSDthere. The error introduced to the solution due to the discretization of f( (o) andassuming constant in each integration interval is overcome by changing thecontinuous formulation in Equation (6) to
f( i(o+do)=�
1−2xi−1
3
xi2−xi−1
2
& xi
xi−1
c(y)y
dy�
f( i(o)+2 %M
j= i+1
f( j(o)& xj
xj−1
c(y)y
dy. (A-8)
In Equation (A-8), M is the number of discretization intervals, f( i is the value of thediscretized number density function for the interval i. Interval i is defined by thegrain volume range from xi−1 to xi (i=1, 2, . . . M), and x0=0. In the code, thevalue of f( i is approximated as
f( i= f( (x=xi) for i=1, 2, . . . , M. (A-9)
It can be shown that, at o+do, the total volume of the grains in the ith intervalis the same for both the discretized PSD densities by Equation (A-10) and thecontinuous one by Equation (6). This fact is independent of the interval size. Itshould also be noted that, when the interval size approaches zero (i.e., for very finediscretization), Equation (A-10) is identical to Equation (6).
Starting with the step-like, piece-wise continuous PSD density function andusing Equation (A-8), the piece-wise continuous density function of the next strain
G. Ozkan and P. J. Ortoleva468 Pure appl. geophys.,
level is evaluated. Since the approximated PSD densities are constant within adiscretization interval, one can easily calculate the total number and volume ofgrains for the ith interval, (fi and Xi, respectively) as
fi=& xi
xi−1
f( (x) dx$ (xi−xi−1)f( i
Xi=& xi
xi−1
xf( (x) dx$xi
2−xi−12
2f( i.
(A-10)
This approach was used to obtain the numerical simulations in this study.
REFERENCES
AN, L.-J., and SAMMIS, C. G. (1994), Particle Size Distribution of Cataclastic Fault Materials fromSouthern California: A 3-D Study, Pure appl. geophys. 143 (1/2/3), 203–227.
ANDERSON, J. L., OSBORNE, R. H., and PALMER, D. F. (1982), Petrogenesis of Cataclastic Rock withinthe San Andreas Fault Zone of Southern California, Tectonophysics 67, 221–249.
BIEGEL, L. R., SAMMIS, C. G., and DIETERICH, J. H. (1989), The Frictional Properties of a SimulatedGouge Ha6ing a Fractal Particle Distribution, J. Struct. Geol. 11 (7), 827–846.
ENDELGER, J. T. (1974), Cataclasis and the Generation of Fault Gouge, Bull. Geol. Soc. Am. 85,1515–1522.
EPSTEIN, B. (1947), The Mathematical Description of Certain Breakage Mechanisms Leading to theLogarithmico-normal Distribution, J. Franklin Institute 224, 471–477.
HERBST, J. A., and SEPULVEDA, J. L. (1978), Fundamentals of Fine and Ultrafine Grinding in a StirredBall Mill, Proceedings of Tech. Program Intr. Powder Bulk Handling Process, Rosemont, Ill.,452–470.
MARONE, C., and SCHOLZ, C. H. (1989), Particle Size Distribution and Microstructures within SimulatedFault Gouge, J. Struct. Geol. 11 (7), 799–814.
MORROW, C. A., and BYERLEE, J. D. (1989), Experimental Studies of Compaction and Dilatancy duringFrictional Sliding on Faults Containing Gouge, J. Struct. Geol. 11 (7), 815–825.
ORTOLEVA, P. J. (1994), Geochemical Self-organization, Oxford Monographs in Geology andGeophysics 23, Oxford University Press, Inc., New York, 411.
PALMER, A. C., and SANDERSON, T. J. O. (1991), Fractal Crushing of Ice and Brittle Solids, Proceedingsof Royal Soc. of London A 433, 469–477.
PRASHER, C. L., Crushing and Grinding Handbook (John Wiley and Sons, New York 1987) 474.SAMMIS, C. G., OSBORNE, R. H., ANDERSON, J. L., BANDERT, M., and WHITE, P. (1986), Self-similar
Cataclasis in the Formation of Fault Gouge, Pure appl. geophys. 124, 53–78.SAMMIS, C. G., KING, G., and BIEGEL, R. (1987), The Kinematics of Gouge Deformation, Pure appl.
geophys. 125 (5), 777–812.TURCOTTE, D. L. (1986), Fractals and Fragmentation, J. Geophys. Res. 91 (B2), 1921–1926.ZOBACK, M. D. (1975), High Pressure Deformation and Fluid Flow in Sandstone, Granite and Granular