ENICC@-1084 Distributed Under: UC-70 Nuclear Waste Management EFFEC'I'S OF BEND CONFIGURATION ON DIL'UTE-PHASE PNEUMATIC TRANSPORT by S. S. Bodner May 1981 EXXON NUCLEAR IDAHO COMPANY, Inc. PREPARED FOR THE DEPARTMENT OF ENERGY IDAHO OPERATIONS OFFICE UNDER CONTRACT DE-AC07-791DO1675
Effects of bend configuration onDilute-phase pneumatic transport
May 1981
Idaho Falls, Idaho 83401
EXXON NUCLEAR IDAHO COMPANY, Inc.
Prepared For The
DEPARTMENT OF ENERGY
IDAHO OPERATI.ONS OFFICE UNDER CONTRACT DE-AC07-791DO1675
SUMMARY
In the past, several erosion failures at the Waste Calcining Facility have resulted inradioactive calcine spills and process shutdowns. Therefore, the effects of various bendconfigurations on erosion performance, calcine attrition, pressure drop, and flow profilesin dilute-phase pneumatic solids transport were investigated in an attempt to increase thereliability of pneumatic transport systems at the Idaho Chemical Processing Plant(ICPP).
Accelerated bend-configuration-erosion-comparison-tests were performed usingaluminum test components and sand as the abrasive transport material at the dilute-phasepneumatic transport test facility located at the Test Reactor Area (TRA). Calcine attritiontests were performed at the same facility using simulated zirconium and zirconium-sodium blended calcines produced by the 30-cm-diameter pilot-plant calciner. A widerange of transport velocities and solids loadings was tested in the same facility todetermine the effect of bend configuration on pressure drop. Bend configurationsfabricated from glass were used to determine flow profiles.
Blinded lateral and tee configurations greatly improved the erosion resistance ofpneumatic transport systems as compared to radius or mitered bends. Erosion rates werereduced since the velocities of particles impacting the walls of the blinded configurationswere decreased due to the dissipation of kinetic energy during the initial impact of theparticles on the cushioning accumulation of particles formed in the blinded branch. Theblinded configurations did not alter other transport system operating parameters such assystem pressure drop or calcine attrition rates.
It was, therefore, concluded that blinded lateral or tee configurations, instead ofradius bends, should be included in the design of dilute-phase pneumatic transportsystems; their use will significantly increase the erosion resistance of the system withoutaffecting the operating performance of the system.
III. RESULTS AND DISCUSSION OF EXPERIMENTAL DATA 10
1. Sand-Aluminum Configuration Erosion Tests 10
1.1 The Effect of Bend Configuration on Bend Service Life 101.1.1 Radius Bends 101.1.2 Blinded Bend Configurations 10
1.1.2.1 Blinded Tee 101.1.2.2 Blinded Lateral 111.1.2.3 Blinded Bend 17
1.1.3 Mitered Bends 171.1.3.1 90 Degree Mitered Bend 171.1.3.2 45 Degree Mitered Bend 17
1.2 The Effect of Velocity on Bend Life 17
2. Flow Profile Tests 17
2.1 Radius Bends 172.2 Blinded Tee and Lateral 212.3 Plugged Tee 212.4 Mitered Bend 21
3. Pressure Drop Tests 214. Calcine Attrition Tests 21
4.1 Tees Versus Radius Bends 264.2 Effect of the Number of Bends Encountered 264.3 Zr Versus Zr-Na Calcine 26
IV. CONCLUSIONS 32
V. RECOMMENDATIONS 33
VI. REFERENCES 34
iv
FIGURES
1. Plot of Relative Erosion Versus Particle Impact Angle 2
2. Isometric Diagram of the Dilute-Phase Solids Transport loop 5
3. Bend Configurations Tested in the Dilute-Phase Solids Transport Loop 6
4. Isometric Diagram of the Modified Dilute-Phase Solids Transport Loop 8
5. Typical Radius Bend Section Showing Failure Point 12
6. Typical Radius Bend Showing Wall Thinning and Failure Point 13
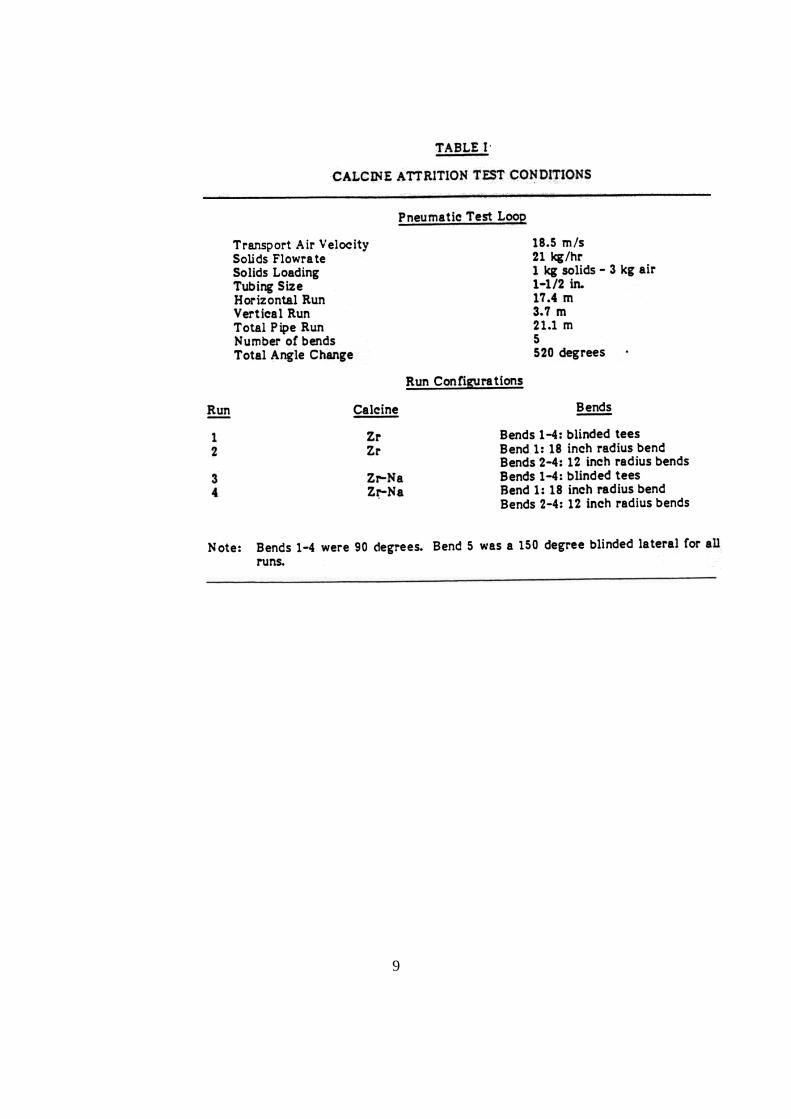
7. Typical Radius Bend Inside Radius Section 14
8. Blinded Tee Section Showing Failure Point 15
9. 30o Blinded Lateral Section Showing Failure Point And Wall Thinning 16
10. Sectioned Blinded Bend Showing Erosion Wear Patterns And Failure Point 18
11. 900 Mitered Bend Showing Sand Pocket And Failure Point 19
12. 450 Mitered Bend Showing Failure Point and Wall Thinning 20
13. Pressure Drop for Bend Configurations as a Function of SuperficialGas Velocity 22
14. Pressure Drop for Bend Configurations as a Function of SuperficialGas Velocity 23
15. Pressure Drop for Bend Configurations as a Function of SuperficialGas Velocity 24
16. Pressure Drop for Bend Configurations as a Function of SuperficialGas Velocity 25
17. Decrease in MMPD During Run I for Zr Calcine With Tees 27
18. Decrease in MMPD During Run 2 for Zr Calcine With Radius Bends 27
19. Decrease in MMPD During Run 3 for Zr-Na Calcine With Tees 28
v
20. Decrease in MMPD During Run 4 for Zr-Ni Calcine With Radius Bends 28
21. Calcine Fines Content During Run I for Zr Calcine With Tees 29
22. Calcine Fines Content Daring Run 2 for Zr Calcine With Radius Bends 29
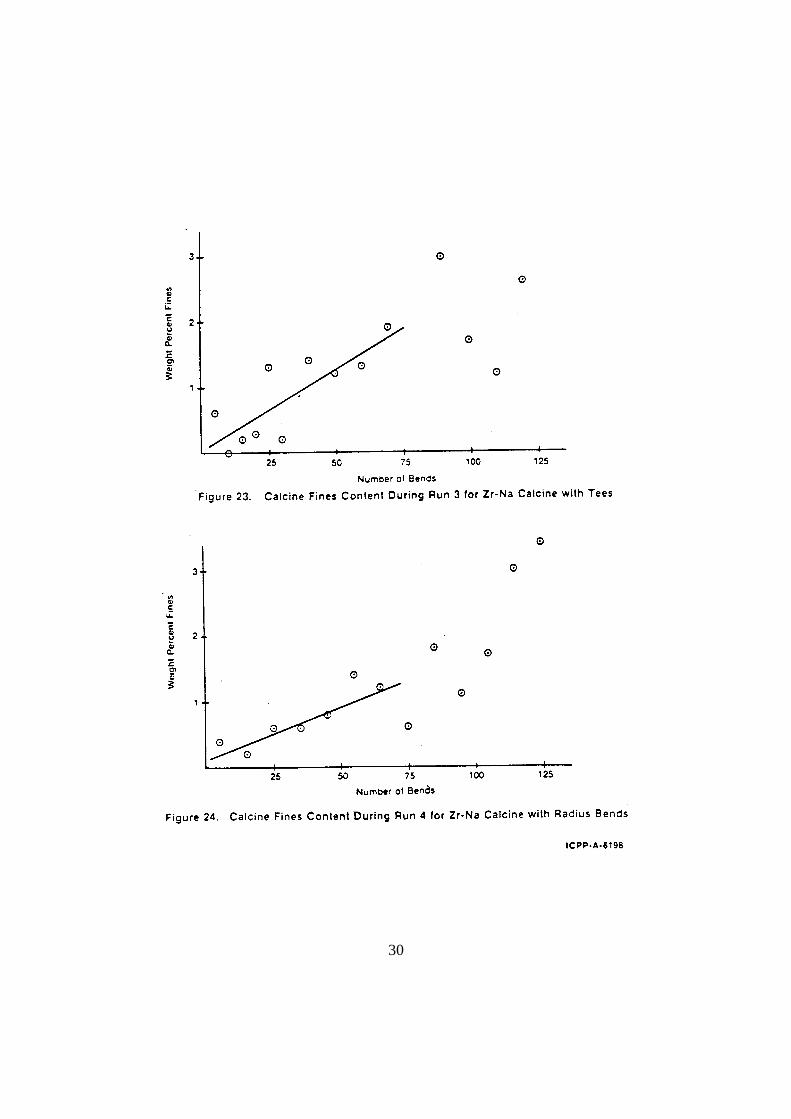
23. Calcine Fines Content During Run 3 for Zr-Na Calcine With Tees 30
24. Calcine Fines Content During Run 4 For Zr-Na Calcine With Radius Bends 30
25. Effect of the Number of Bends Encountered On Calcine MMPD 31
TABLES
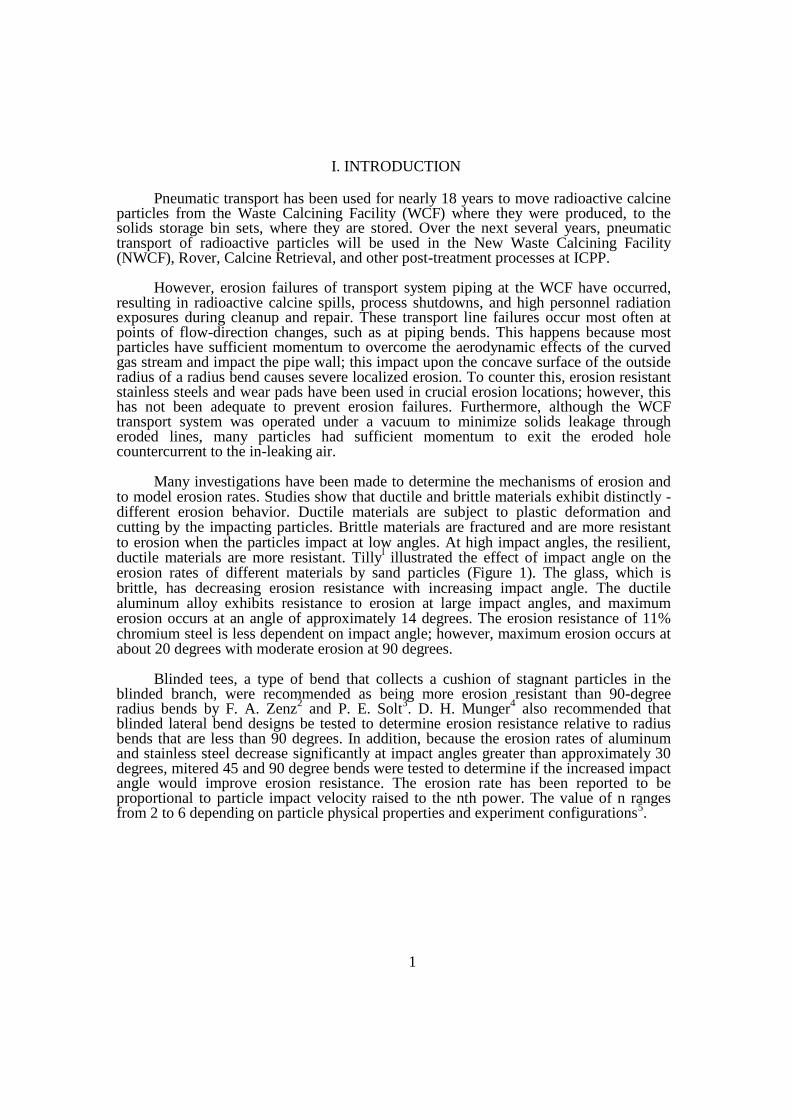
I. Calcine Attrition Test Conditions 9
II. Bend Service Life (Equivalent Hours) 11
III. Calcine Attrition Test Results 26
vi
I. INTRODUCTION
Pneumatic transport has been used for nearly 18 years to move radioactive calcineparticles from the Waste Calcining Facility (WCF) where they were produced, to thesolids storage bin sets, where they are stored. Over the next several years, pneumatictransport of radioactive particles will be used in the New Waste Calcining Facility(NWCF), Rover, Calcine Retrieval, and other post-treatment processes at ICPP.
However, erosion failures of transport system piping at the WCF have occurred,resulting in radioactive calcine spills, process shutdowns, and high personnel radiationexposures during cleanup and repair. These transport line failures occur most often atpoints of flow-direction changes, such as at piping bends. This happens because mostparticles have sufficient momentum to overcome the aerodynamic effects of the curvedgas stream and impact the pipe wall; this impact upon the concave surface of the outsideradius of a radius bend causes severe localized erosion. To counter this, erosion resistantstainless steels and wear pads have been used in crucial erosion locations; however, thishas not been adequate to prevent erosion failures. Furthermore, although the WCFtransport system was operated under a vacuum to minimize solids leakage througheroded lines, many particles had sufficient momentum to exit the eroded holecountercurrent to the in-leaking air.
Many investigations have been made to determine the mechanisms of erosion andto model erosion rates. Studies show that ductile and brittle materials exhibit distinctly -different erosion behavior. Ductile materials are subject to plastic deformation andcutting by the impacting particles. Brittle materials are fractured and are more resistantto erosion when the particles impact at low angles. At high impact angles, the resilient,ductile materials are more resistant. Tillyl illustrated the effect of impact angle on theerosion rates of different materials by sand particles (Figure 1). The glass, which isbrittle, has decreasing erosion resistance with increasing impact angle. The ductilealuminum alloy exhibits resistance to erosion at large impact angles, and maximumerosion occurs at an angle of approximately 14 degrees. The erosion resistance of 11%chromium steel is less dependent on impact angle; however, maximum erosion occurs atabout 20 degrees with moderate erosion at 90 degrees.
Blinded tees, a type of bend that collects a cushion of stagnant particles in theblinded branch, were recommended as being more erosion resistant than 90-degreeradius bends by F. A. Zenz2 and P. E. Solt3. D. H. Munger4 also recommended thatblinded lateral bend designs be tested to determine erosion resistance relative to radiusbends that are less than 90 degrees. In addition, because the erosion rates of aluminumand stainless steel decrease significantly at impact angles greater than approximately 30degrees, mitered 45 and 90 degree bends were tested to determine if the increased impactangle would improve erosion resistance. The erosion rate has been reported to beproportional to particle impact velocity raised to the nth power. The value of n rangesfrom 2 to 6 depending on particle physical properties and experiment configurations5.
1
2
The Pneumatic Transport Test Program was initiated to verity and quantify thepossible improvement in erosion resistance of the bend configurations noted above. Thetest program determined the effects of the bend configurations on the system pressuredrop, on calcine particle attrition, and on flow profiles as well as the effect of particleimpact velocity (in the range of NWCF transport velocities) on erosion rates for radiusbends.
3
II. TEST PROGRAM
The bend configuration test program was divided into four phases: 1) sand-aluminum configuration erosion tests, 2) flow profile tests, 3) pressure drop tests, and 4)calcine attrition tests. The equipment and run conditions are documented in thefollowing sections.
1. Sand-Aluminum Configuration Erosion Tests6
The dilute-phase pneumatic transport loop was used to evaluate the relativeerosion resistance of blinded and mitered bend designs relative to radius bends. The loop(Figure 2) was approximately 60 m in length with 8.5 m of vertical rise. Aluminumtubing, 3.5 cm ID with 0.165 cm walls, was used for the transport line and to fabricatethe configurations. The system operated at negative pressure using a rotary blower tosupply the motive power. Abrasive material, sand in these tests, was metered into thetransport air stream by a screw feeder. Seven bend test locations were in the loop. Asintered-metal filter vessel, with a tangential inlet, separated air from the sand at the endof the loop. A weigh tank was included in the system to determine the amount ofabrasive material charged. An orifice flow element monitored the airflow rate, and acontroller throttled bleed-in of atmospheric air to maintain constant velocities in theloop.
The sand, obtained near Ammon, Idaho, was sieved to obtain a uniform particlesize ranging from +210 to -420 um diameter. The sand had a bulk density of 1.4 g/cm3
and was metered into the loop at a rate of 1.6 kg/min. A constant airflow and solidsaddition rate resulted in a solids-to-air weight ratio of 1.3 throughout the tests.
Abrasiveness of the sand decreased due to particle degradation as it was recycled(about 3.5 times) through the loop. The relationship between abrasiveness and thenumber of sand cycles was correlated experimentally to correct for sand degradationwhen determining the exposure time periods for the tests.
Air velocities ranged from 21 m/see at the solids pick-up point to 29 m/sec at thelast test position. The increase in velocity was due to expansion of the air from an inletpressure of 12.3 psia to 8.6 psia at the filter vessel.
Aluminum test configurations were installed at the seven test locations shown inFigure 2. The bend configurations (radius, blinded lateral, blinded tee, blinded-bend, andmitered bend) are shown in Figure 3. Each bend was left in its test position until failureof the bend occurred.
2. Flow Profile Tests
The dilute-phase pneumatic transport loop was modified to accommodateinstallation of the various bend configurations fabricated from glass tubing in thefollowing flow orientations: horizontal-to-horizontal, horizontal-to-vertical upward,vertical upward-to-horizontal, horizontal-to-vertical downward, and vertical downward-to-horizontal. Flow profiles were recorded on video tape as solids feed rates were variedfor each configuration in each orientation Alfalfa seed was used as the transportmaterial. The seed prevented scratching of the glass surfaces and contained very littledust, which might have coated the glass tubing and obscured visual observations.
4
5
6
3. Pressure Drop Tests
Three pressure taps were installed in the dilute-phase pneumatic transport testloop for this series of tests. The taps were fabricated by drilling 1.6 mm holes into thetransport line wall and then welding a length of 1/4-inch tubing to the surface of thetransport line wall above each hole. The upstream tap was fixed at 25.4 cm upstreamfrom the tangent (point at which curvature begins) of the longest radius bend tested.Two downstream taps were located 25.4 cm and 4.3 m downstream from the tangent(point at which curvature ends) of the same bend. The first downstream pressure tapwas used to measure the local pressure drop occurring for each configuration. Sinceshorter radius bends, blinded tees, and mitered bends required shorter distances tocomplete the flow directional change, spool pieces were inserted between the fixedupstream and downstream taps and the shorter configurations. The second downstreamtap was used to measure the total pressure drop resulting from now directional change,including the local pressure drop and the pressure drop required to fully re-acceleratethe particles. The pressure drops - local and local plus re-acceleration - were measuredusing sand feed rates of 0.0, 0.75, 1.57, and 2.60 kg/min and velocities ranging from15.5 to 34 m/s.
4. Calcine Attrition Tests7
Simulated zirconium (Zr, 30-cm Run 80) and zirconium-sodium blend (Zr-Na, 30-cm Run 67) calcine granules were transported through a modified dilute-phasepneumatic transport test loop (Figure 4). The transport velocity was a nominal 18.5 m/sand the solids loading was 1 kg of calcine to 3 kg of air. Run conditions are summarizedin Table 1. Calcine batches were recycled through the loop up to 30 times because theattrition rates were very low. Calcine samples from each pass through the loop wereobtained at the screw feeder exit and were screened to determine the mass mean particlediameter (MMPD) and fines (particles with diameters <150 μm) content.
7
8
9
III. RESULTS AND DISCUSSION OF EXPERINIENTAL DATA
The results of the four experimental test phases are presented in this section.
1. Sand-Aluminum Configuration Erosion Tests
The relative erosion resistance of the various configurations was determined by thetime of transport exposure required to cause the configurations to fail. Failure data arelisted in Table D as equivalent hours of exposure prior to failure (calculated exposureperiods including the correction for send degradation). Locations listed correspond totest locations shown in Figure 2; bend types listed are shown in Figure 3. Particle impactvelocities were calculated using correlations proposed by Yang.8
1.1 The Effect of Bend Configuration on Bend Service Life
1.1.1 Radius Bends. Failure time periods for long radius bends were notsignificantly increased as expected over short radius bend failure time periods for theparticle velocities and bend radius to pipe diameter ratios (R/D) used. Bends with equalR/D's experience, neglecting aerodynamic effects, the same particle impingement angle.The particle impingement angles for the R/D’s tested are:
.
R/D 8 12 16 24Θ 20o 16o 14o 12o
Normally standard radius bends have a R/D of 5 with a corresponding impactangle of 25 degrees. All these impact angles happen to fall into the regions of the mostsevere erosion shown in Figure 1. Photographs of a typical radius bend (Figures 5 and 6)show the failure point to be at the Intercept of the projected centerline of the upstreamstraight section with the outside radius of the bend. This mode of failure was observed inall tests of both 90 and 30 degree bend types.
The inside radius of the same bend (Figure 7) showed no rebound pattern.Rebound erosion patterns are reported in the literature but were not apparent at the lowvelocities used in these tests. Sand particles had sufficient momentum to exit the bendthrough the failure hole against the inward flow of air caused by the negative pressurewithin the system.
1.1.2 Blinded Bend Configurations. Blinded configurations included blindedtees, blinded laterals, and blinded bends (Figure 3). Generally, as discussed below,blinded designs gave excellent erosion resistance performance when compared to radiusbends.
1.1.2.1 Blinded Tee. This bend design was superior to all types tested. Itexceeded radius bend service life by 15 times when similarly exposed. A second blindedtee was intact at the end of testing with an accumulated exposure 12 times that of failedradius bends.
10
Only one failure (Figure 8) was experienced during the tests. The failure point was onthe inside radius just upstream of the saddle point. Rebound thinning approximately 15cm downstream of the tee on the inside radius was noticed. Apparently the low erosionrates were due to the decreased velocity of the particles during secondary impact on theconfiguration wall. Primary particle impact occurred in the blinded branch. The absenceof the stable particle accumulation in the blinded branch (during periods of low solidsfeed rates) will not have a detrimental effect on erosion performance, since the 90-degree particle impact on the blinding cap will have low erosion potential. The rippleeffect, clearly visible in Figure 8, was a common erosion occurrence throughout thetransport system. Finnie9 indicates that the surface of ductile materials can translate uponimpact, which changes subsequent impact angles and propagates ripple formation. Nofurther investigation was made, as it was not considered to be a principal f actor in theerosion process.
1.1.2.2 Blinded Lateral. Blinded laterals exceeded radius bendperformance by a factor of 7. As shown in Figure 9, the 30 degree blinded lateral failedon the inside radius of the saddle just upstream of the bend point, as did the blinded tee;however, no significant rebound pattern was observed. Blinded laterals are relativelyeasy to fabricate and maintain proper alignment. Alignment is important sincemisalignment can cause severe localized erosion due to eddy formation in the vicinity ofthe misalignment and particle impingement on the misaligned surface.
11
12
13
14
15
16
1.1.2.3 Blinded Bend. The blinded bend is similar to the blinded lateral, asshown in Figure 3. However, the blinded bend failed at 1/3 the service life of the blindedlateral. The blinded bend failed at the junction of the bend and blinded section on theoutside radius, as shown in Figure 10. It is also evident from that figure thatmisalignment of the blinded section and eddy formation caused the early failure.However, even though the bend failed early, it still exceeded radius bend performanceby a factor of 3.
1.1.3 Mitered Bends. Mitered bends were not part of the original test plan butwere included after considering the erosion curve shown in Figure 1. Since the failurepoint for radius bends was on the projected centerline of the upstream straight section onthe outside bend radius, an increased impact angle was suggested to improve service life.
1.1.3.1 90 Degree Mitered Bend. Failure of the mitered 90 degree bendoccurred in two places, each about 1/3 of the pipe circumference ahead of the projectedcenterline impact point (Figure 11). The failure point corresponds to a particle impactangle of approximately 24 degrees. No erosion occurred at the 90 degree impingementangle. Observation of the erosion patterns indicates a pocket of stagnant sand hadprotected most of the exposed bend area. The mitered 90 degree bend outperformed theradius bends by a factor of 4.
1.1.3.2 45 Degree Mitered Bend. The wear pattern on the 45 degreemitered bend (Figure 12) is similar to that of the 90 degree mitered bend; it alsoexperienced two failure points. However, these failure points are closer to the projectedcenterline impact point than those of the 90 degree mitered bend. The particleimpingement angle at the failure points was approximately 35 degrees. No evidence ofan accumulation of a protective stagnant sand pocket in the bend was observed. Theservice lifetime was similar to that of the radius bends.
1.2 The Effect of Velocity on Bend Life
The differing velocities at each of the seven test locations, due to air expansion,allowed a correlation of radius bend service life to velocity. The bend erosion wasproportional to the velocity raised to the 4.2 power.
2. Flow Profile Test
The following observations were made while transporting alfalfa seed at variousfeed rates through the glass test configurations installed in various orientations. Ingeneral, orientation had little effect on the observed flow profiles.
2.1 Radius Bends
The particles impacting on the outer radius of the bend in an area in line with theprojected cross-section of upstream piping were clearly visible. Particles did not reboundsufficiently to create a secondary impact area, but tended to slide along the outer radiusuntil they were re-entrained into the gas stream near the downstream end of the bend.Neither the magnitude of the bend radius nor the orientation had any noticeable effect onflow profiles.
17
18
19
20
2.2 Blinded Tee and Lateral
Formation of a cushioning accumulation of particles occurred in the blinded branch ofthese configurations within seconds of the establishment of solids flow. Depending somewhat onthe depth of the accumulated particles, the blinded branch usually cleared with normal transportair rates within one minute of the cessation of solids flow. Tees with a vertical upward-to-horizontal orientation required a slightly higher solids feed rate to maintain a stable accumulationas compared to tees installed in the other orientations.
The primary particle impact point was on the agitated surface of the accumulated particles.The impacting particles rebounded to a secondary impact point at a much lower velocity near theinside crotch of the tee. The point of secondary impact could be translated downstream a fewcentimeters by either increasing transport velocities or increasing solids feed rate. The blindedlateral configuration had flow profiles similar to those of the blinded tee.
2.3 Plugged Tee
Insertion of a plugging rod into the blinded branch of a tee (to a point where about 1/4 ofthe tee outlet area was covered) appeared to eliminate the secondary impacts and streamline theparticle paths. Several cupped and angled plugs were also tested but were not as effective ineliminating the secondary impacts.
2.4 Mitered Bend
Although an accumulation of particles was established in the corner of the 90 degreemitered bend, the accumulation was not sufficient to cover the entire area in line with theprojected cross-section of upstream piping. No solids accumulated in the 45 degree mitered bend.
3. Pressure Drop Tests
Results of the pressure drop tests for the various configurations are shown in Figures 13through 16. Both local (configuration only) and local plus re-acceleration (configuration plussufficient downstream length for full particle re-acceleration) pressure drops are plotted for foursolids feed rates as a function of superficial transport gas velocity. Local pressure drops for allconfigurations were similar except at the highest feed rate.
A plugged tee was included in the pressure drop tests since it appeared to have the moststreamlined flow profile. Although the local pressure drop for the plugged tee was similar to otherconfigurations, the local plus re-acceleration pressure drop was consistently higher than otherconfigurations, except for the long radius bend. The short radius bend, the blinded tee, and themitered bend had the lowest local plus re-acceleration pressure drops during the tests with solidsfeed (Figures 14, 15, and 16); therefore, these configurations should be used in transport systemsto minimize pressure drop.
4. Calcine Attrition Test's
The effect of blinded tees on Zr and Zr-Na calcine attrition rates during pneumatictransport was compared to that of radius bends using both MMPD and weight percent (wt%) finesrates of change during the tests. Attrition due to both operation of the screw feeder and transportthrough straight run piping was assumed minimal and consistent from test to test.
21
22
23
24
25
The MMPD data and wt% fines data plotted as a function of number of bendsencountered are shown in Figures 17 through 24. Lines were fitted to these data by linearregression; the slope of these lines equals the attrition rate expressed as MMPD decrease(mm/bend) or wt% fines increase per bend. The percentage MMPD decrease per bendwas obtained by dividing the MMPD decrease per bend by the initial calcine MMPD.Most attrition rates were calculated using only data from the first 13 passes (65 bendsencountered) to exclude rate changes that occurred as the particles were recycled.Because the Zr-Na calcine MMPD data were scattered, the attrition rate was calculatedusing data from all 25 passes (125 bends) to obtain a better rate estimate. Attrition ratetest results in terms of percent MMPD decrease and weight percent granules converted tofines on a per bend encountered basis are summarized in Table III
4.1 Tees Versus Radius Bends
The estimated variance of each attrition rate was calculated to determine if thedifferences in the observed attrition rates between radius bends and blinded tees weresignificant. The 95% confidence interval for each rate is shown in Table III. Since theinterval estimates for radius bend and tee attrition rates overlap, the data do notcontradict the hypothesis that there is no difference in radius bend and tee attrition rates.
4.2 Effect of the Number of Bends Encountered
Fines content of the calcine increases approximately linearly as the number ofencountered bends increases (figures 21 through 24). For Zr calcine, the fines contentincreased about 0.066 wt% per bend for both tees and radius bends. The Zr-Na calcinefines fraction increased about 0.021 wt% per bend.
The effect of the number of bends encountered on the percent MMPD decrease forthe two calcines and two bend types is shown in Figure 25. The Zr calcine MMPDdecreased about 0.33% per bend for the first 75 bends. This rate then progressivelydecreased. The rate of Zr-Na calcine MMPD decrease was about 0.061% per bendthroughout the run.
4.3 Zr Versus Zr-Na Calcine
Zirconium calcine degrades five times faster than zirconium-sodium blendedcalcine in terms of MMPD decrease. The Zr calcine generates three times more finesthan Zr-Na calcine for transport through an equal number of bends.
26
27
28
29
30
31
IV. CONCLUSIONS
The dilute-phase pneumatic transport test facility proved to be sufficiently reliableand flexible to complete all bend configuration tests attempted. The use of aluminum testcomponents allowed the collection of relative configuration erosion data withinreasonable lengths of time. The following conclusions were reached based on the testresults:
1. The service life of blinded tee configurations is at least 15 times that for radius bendswith R/D’s ranging from 8 to 24. The service life of blinded lateral configurations is atleast 7 times that of radius bends. The velocity of particles impacting the piping walls ofthe blinded configurations is significantly lower than that for radius or mitered bends,thereby increasing the erosion resistance of the blinded configurations.
2. Pressure drop and calcine attrition rates are not significantly different for blinded teesas compared to radius bends.
3. Long radius bends do not have significantly increased service life relative to shortradius bends.
4. The erosion rate of the radius bends is Proportional to particle velocity raised to the 4.2power.
5. The service life for 30 degree radius bends is similar to that of 90 degree radius bends.
6. Poor alignment of piping sections results in a potential localized erosion failure point.Blinded lateral designs are more easily aligned during fabrication than are blinded benddesigns.
7. Many particles have sufficient momentum to exit failure points countercurrent to thein-leaking air in a vacuum system.
8. Visual tests using glass pipe provided an effective means of analyzing particle flow inthe various bends and straight pipe sections.
32
V. RECONIMENDATIONS
These tests have showed that the use of blinded tee or lateral configurationsinstead of radius bends will significantly improve the erosion resistance of a dilute-phasepneumatic transport system without adversely affecting other performance parameters.Therefore, to increase the reliability of a transport system, blinded configurations shouldbe used instead of long or short radius bends. The installation of reinforcing wear pads tocover the expected points of erosion in the blinded configurations may also be needed insome cases to extend their service life. Knowledge of the absolute expected service lifefor a bend configuration at specified operating conditions would determine wear padrequirements. Accordingly, the following recommendations are made:
1) Accurate records of NWCF transport parameters including transport air flow rate,temperature, and pressure, and quantities and types of solids transported must bemaintained to determine service exposure.
2) Blinded lateral and tee configurations to be installed at the NWCF should includereinforcing wear pads fitted with an airline to the sealed annulus between theconfiguration and the pad. Failure of the configuration can then be determined as air willbegin to flow from the annulus into the transport system through the failure in theconfiguration.
3) A full-scale erosion test program should be initiated to determine erosion rates forblinded configurations while operating at controlled conditions. The effectiveness ofwear pads should also be determined. This information is necessary to designconfigurations, which will be adequate to withstand service requirements.
33
VI. REFERENCES
1. Tilly, G. P. "Erosion Caused by Airborne Particles," Wear, 14, 1969.
2. Zenz, F. A., Othmer, D. F. Fluidization and Fluid-Particle Svstems, New York:Reinhold Publishing Corp. 1960.
3. Solt, P. E., Personal Communication.
4. Munger, D. H. Personal Communication.
5. Finnie, 1. "Erosion by Solid Particles in a Fluid Stream," Symposium on Erosion andCavitation, ASTM S.T.P., 307, 1962.
6. Staiger, M. D., Personal Communication.
7. Pong, M. Y., Personal Communication.
8. Yang, W. C., et.al., State-of-the-Art Survey of Pneumatic Powder Transport, ERDAReport, WCAP-9189, Westinghouse Nuclear Energy Systems, August 1977.
9. Finnie, I., et.al. "On the Formation of Surface Ripples During Erosion," Wear, 8, 1965