Page 1
FABRICATION AND CHARACTERIZATION
OF TERBIUM SUBSTITUTED FERRITES
Ph.D. Thesis
Muhammad Azhar Khan
A Thesis Submitted in Fulfillment of the Requirement for the Degree of Doctor of Philosophy in Physics
DEPARTMENT OF PHYSICS
BAHAUDDIN ZAKARIYA UNIVERSITY
MULTAN – PAKISTAN
(2011)
Page 3
DEDICATED
To
My Parents and Family
Page 4
CERTIFICATE
This is to certify that Mr. Muhammad Azhar Khan has carried out the
experimental work in this dissertation under my supervision in the Department of
Physics, Bahauddin Zakariya, University, Multan, Pakistan and the Department of
Physics, University of Limerick, Ireland. This work is accepted in its present form
by the Department of Physics, Bahauddin Zakariya, University, Multan as
satisfying the dissertation requirement for the degree of Doctor of Philosophy in
Physics.
Submitted through: Supervisor:
Dr. Misbah-ul-Islam
Chairman, Department of Physics
Department of Physics Bahauddin ZakariyaUniversity
Bahauddin Zakariya University Multan, Pakistan.
Multan, Pakistan.
Page 5
Declaration
I hereby declare that I have not submitted this research work titled “Fabrication and
Characterization of Terbium Substituted Ferrites” leading to the degree of Ph.D. in
Physics to other university with in the country or outside Pakistan. I also promise not to
submit the same thesis for the degree of Ph.D. to any other university in future if I am
awarded Doctorate in this regard. Research work on the same topic has never been
submitted before to the best of my knowledge. The responsibility of the contents solely
lies on me.
Muhammad Azhar Khan
Page 6
ACKNOWLEDGEMENTS
All praise to omnipotent Allah, the most merciful, who enabled me to complete
this thesis. I offer my deepest gratitude to the Holy Prophet Muhammad (Peace be upon
him) whose life is forever guidance for the humanity.
I would like to express my sincere gratitude to my supervisor Dr. Misbah Ul Islam,
Associate Professor, Department of Physics, Bahauddin Zakariya University Multan,
whose continuous guidance, stimulating suggestions and encouragement helped me at
every step during my Ph.D. research work. Many thanks to him for suggesting me this
kind of research project and guided me the ways to approach a research problem and the
need to be persistent to accomplish any goal.
I am grateful to Higher Education Commission of Pakistan (HEC) for the
financial support for this project under HEC Indigenous and International Research
Support Initiative Program (IRSIP). My deepest appreciation to the Chairman
Department of Physics, B. Z. University Multan and all the faculty members in helping
me to broaden my view and knowledge. I am really grateful to Prof. Dr. Tahir Abbas for
his scientific guidance and support during the progress of my work. Many thanks to my
friends; Mr. Muhammad Ishaque, Muhammad Farooq Wsiq and Abdul hameed for their
supprt and co-operation.
I can’t help with out appreciating and thanking for the unconditional support of
Dr. I. Z. Rahman, Department of Physics, Material and Surface Science Institute,
University of Limerick, Ireland, for providing lab facilities and valuable suggestions
during my Ph.D. work. I also pay thanks to Prof. Dr. Stuart Hampshire and Dr. Annaik
Genson for valuable suggestions and providing facilities for FTIR Spectroscopy and
dielectric measurements. Many thanks to Professor Carl E Patton at the Department of
Physics, Colorado State University, Fort Collins, USA for providing facilities for FMR
measurements. Last, but not the least, I thank my family and my parents, for giving me
life in the first place, for educating me in sciences, for unconditional support and
encouragement to pursue my research work.
Muhammad Azhar Khan
Page 7
ABSTRACT
This dissertation presents the effect of terbium substitution on the structural, magnetic, electrical
and dielectric properties of ferrites of nominal compositions Ni1−xTbxFe2O4 and Mg1-xTbxFe2O4
(where x = 0, 0.02, 0.04, 0.06, 0.08, 0.10, 0.12, 0.14, 0.16, 0.18 and 0.20). The samples were
initially sintered at 1000 °C and final sintering was performed at 1230 °C in order to prepare
homogeneous ferrites. The said ferrites were characterized by X-ray Diffractometry, Fourier
Transform Infrared Spectroscopy, Scanning Electron Microscopy, Energy Dispersive X-ray
Spectroscopy, Vibrating Sample Magnetometery and Ferromagnetic Resonance.
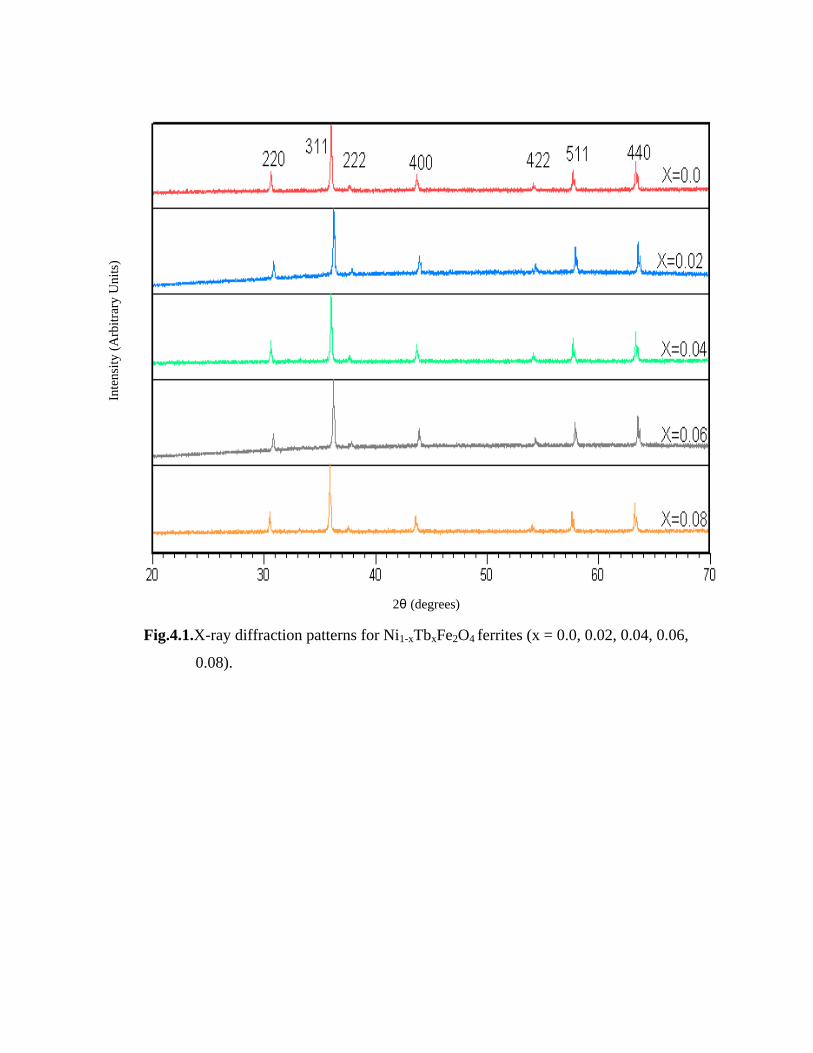
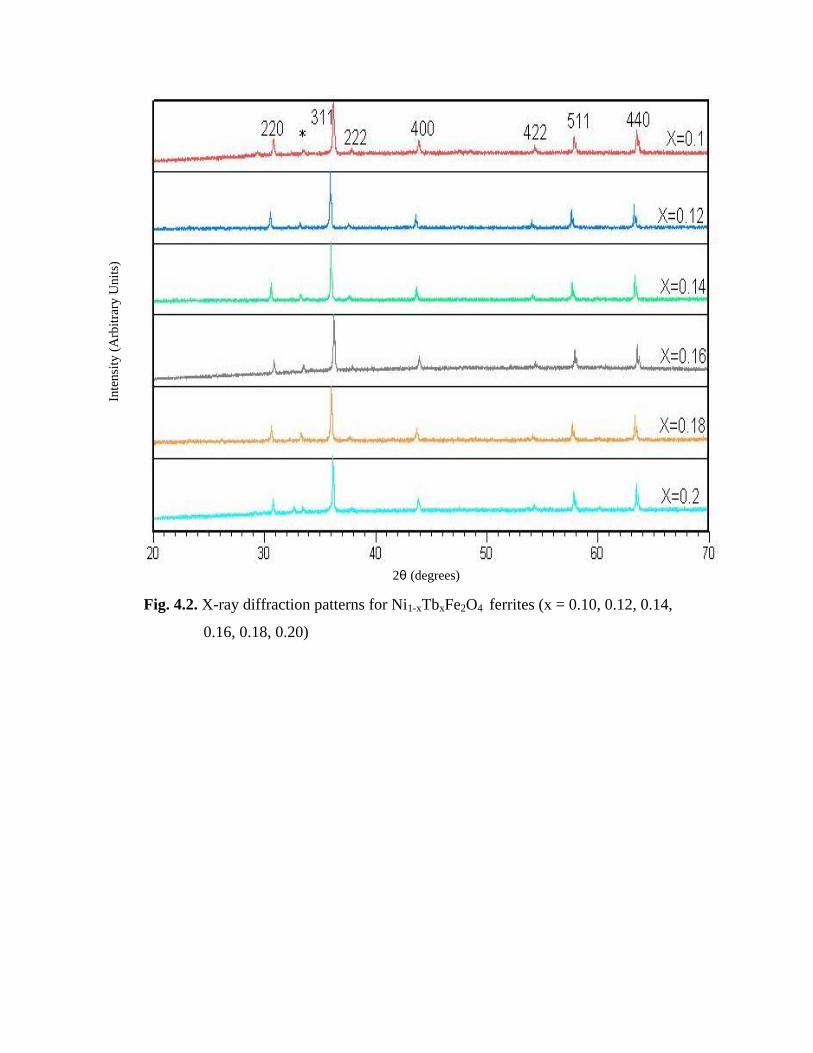
Phase analysis from XRD patterns reveals that the samples have a cubic spinel structure along
with a few traces of second phase recognized as orthorhombic phase (TbFeO3) and this phase
becomes more conspicuous as the terbium (Tb) is substituted in Ni1−xTbxFe2O4 and Mg1-
xTbxFe2O4 ferrites. The lattice parameter changes non-linearly as a function of Tb content in both
series that was attributed to the differences in ionic radii of the cations involved and the solubility
limit of terbium ions. A gradual increase in the bulk density was observed with the increase of
terbium concentration in both series. FTIR absorption spectra of Ni1−xTbxFe2O4 and Mg1-
xTbxFe2O4 ferrites exhibited two main absorption bands in the wave number range 370 cm-1 to
1500 cm-1, thereby confirming the spinel structure. The particle size measured from XRD analysis
found to decrease with the increase of Tb substitution. The morphology of the samples indicates
that samples are crack free along with a few agglomerates. The inclusion of Tb caused the
magnetization index to drop which is due to redistribution of cations on the tetrahedral and
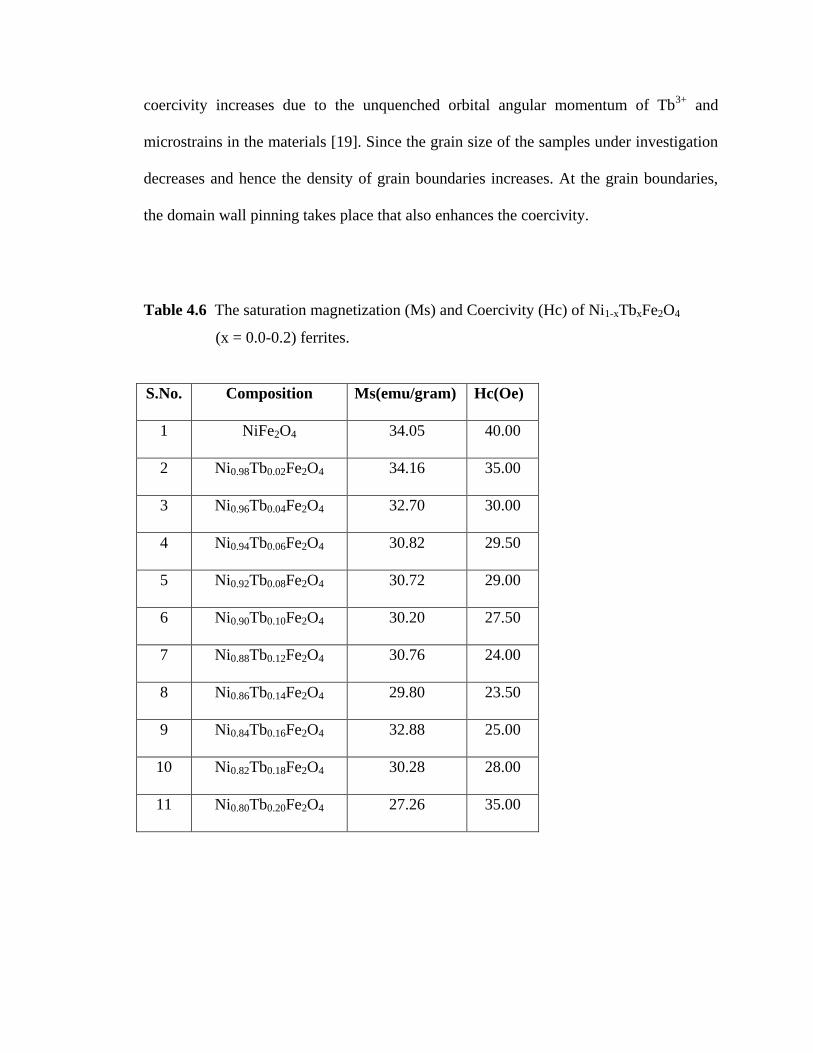
octahedral sites. The coercivity is observed to decrease and this trend is deviated at higher
concentrations of terbium ions in Ni1−xTbxFe2O4 and Mg1-xTbxFe2O4 ferrites.
Ferromagnetic resonance linewidths are ≤ 1000 Oe for most of the samples. The nominal
composition Ni.94Tb.06Fe2O4 have minimum linewidth, ΔH = 593 Oe, which is minimum of the
reported linewidths for spinel ferrites. Hence these ferrites have potential in high frequency
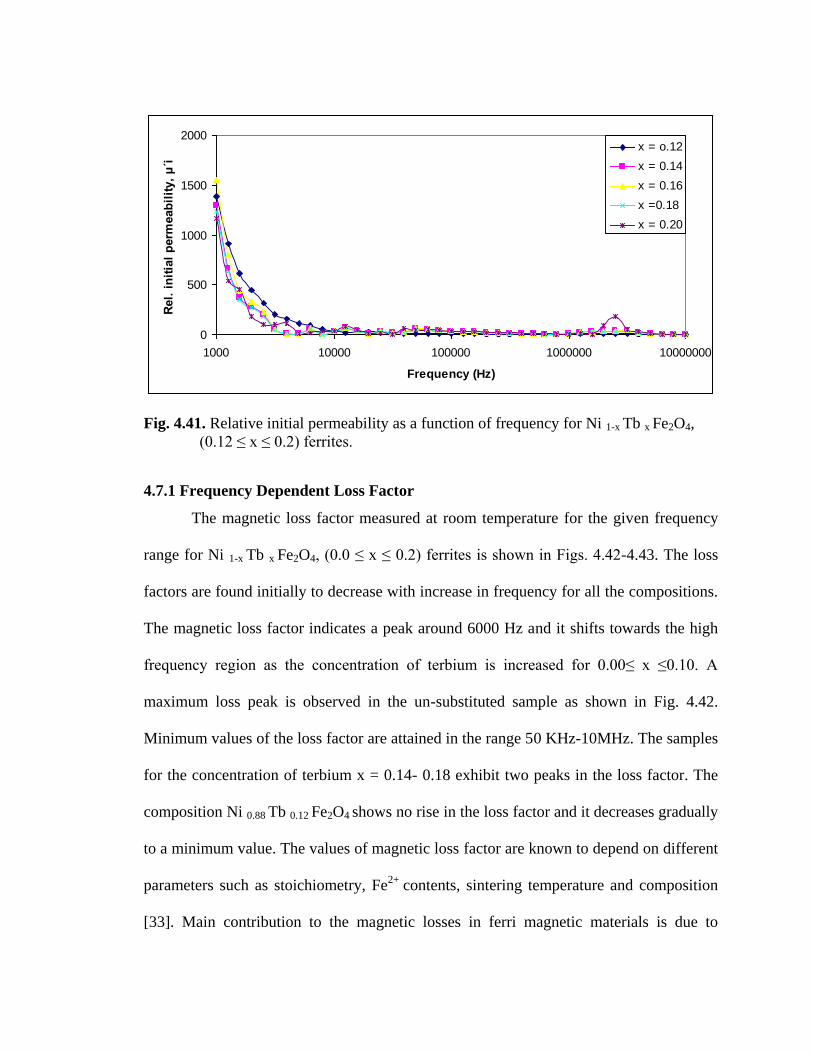
applications. The relative initial permeability generally decreases for all the Tb-substituted
samples and these are attributed to the decrease in magnetization. The magnetic loss factor is
damped with respect to frequency and has very low values in the high frequency region. The
electrical resistivity increases and it is attributed to the hinderence in the hopping mechanism
caused by the presence of Tb-ions in these ferrites which enhance hopping length between the
cations involved in the conduction mechanism. The study on resistivity as a function of
temperature shows that all the samples obey semiconducting behaviour. The drift mobility drops
while the activation energy increases in a similar manner as that of resistivity. The samples
NiFe2O4 and MgFe2O4 have high dielectric constant as compared to the substituted samples.
Page 8
Hence, introduction of Tb-ions in Ni1−xTbxFe2O4 and Mg1-xTbxFe2O4 decrease the dielectric
constant. All the substituted samples indicate small values of dielectric loss. These features make
these ferrites suitable for various applications.
Page 9
Table of Contents
Contents Page No
CHAPTER 1
Introduction 1
1.1 Soft ferrites 1
1.2 Literature review 2
1.3 Aims and objectives 46
References 47
CHAPTER 2
Experimental details 54
2.1 Composition of ferrites 54
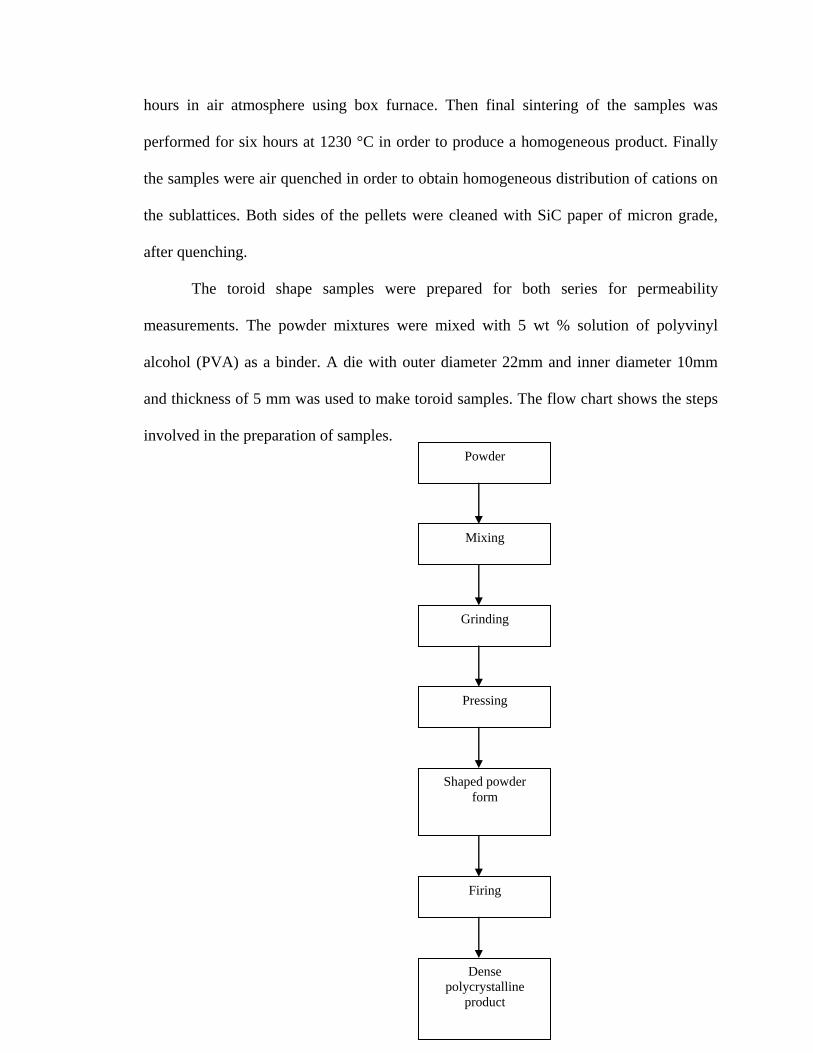
2.2 Preparation technique 54
2.3 Characterization techniques 56
2.3.1 X-ray diffraction 56
2.3.2 Fourier transform infrared spectroscopy 58
2.3.2.1 Principle of FTIR 59
2.3.2.2 Sample preparation for FTIR 59
2.3.3 Dielectric constant measurements 59
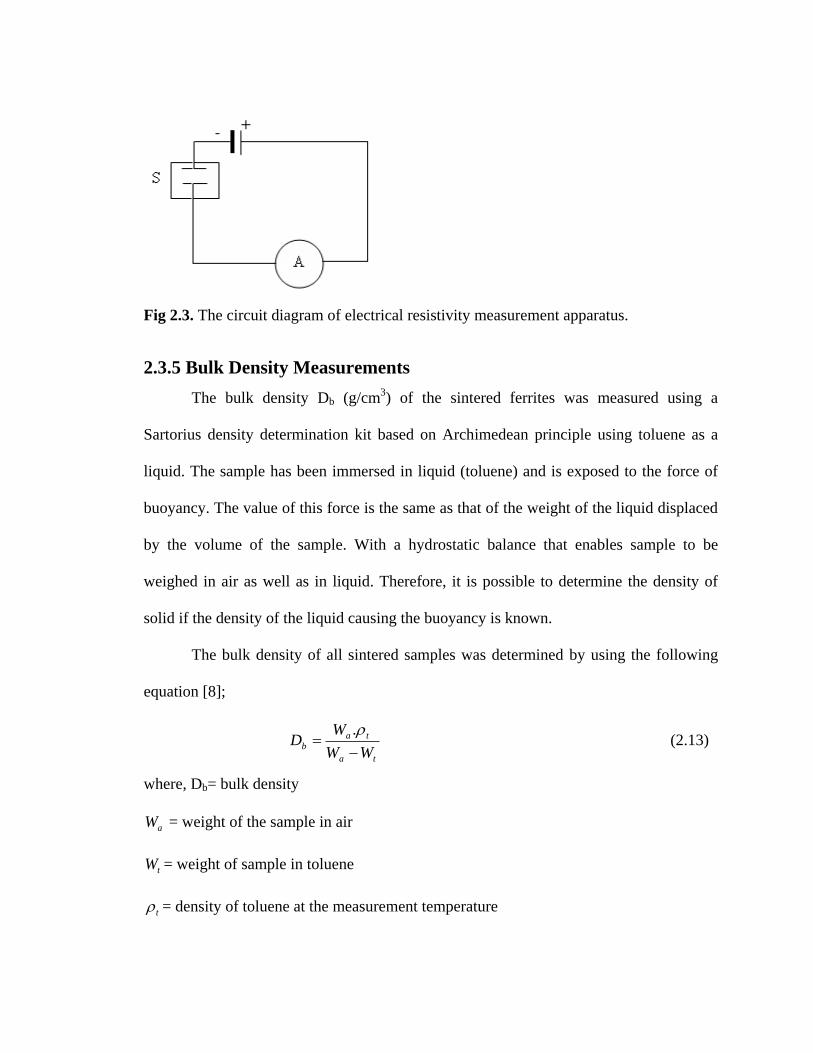
2.3.4 Electrical resistivity measurements 60
2.3.5 Bulk density measurements 62
2.3.6 Scanning electron microscopy 63
2.3.7 Vibrating sample magnetometer 63
2.3.8 The ferromagnetic resonance (FMR) 63
2.3.9 Relative initial permeability measurements 65
References 65
Page 10
CHAPTER 3
Theoretical background 66
3.1 Soft magnetic materials 66
3.2 Structure of ferrites 66
3.3 Electrical properties 69
3.3.1 Electrical resistivity 69
3.3.2 Conduction mechanisms 70
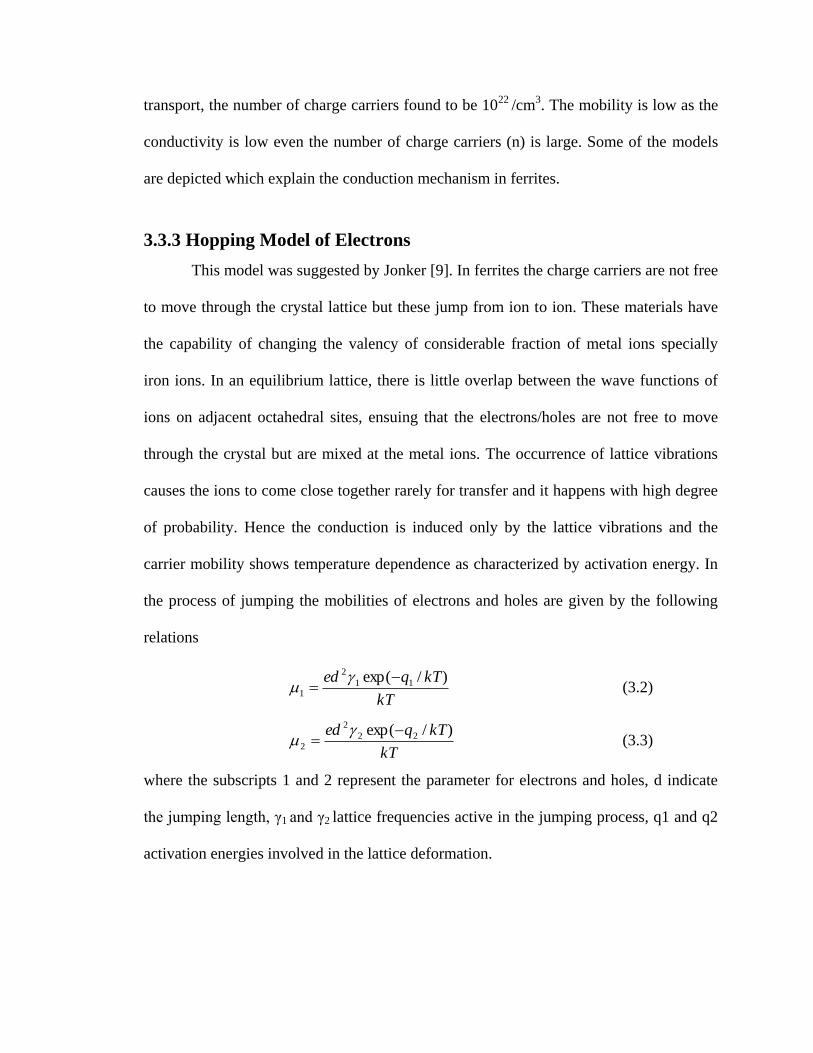
3.3.3 Hopping model of electrons 71
3.3.4 Small polaron model 72
3.4 Frequency dependence of dielectric constant in ferrites 73
3.5 Magnetic properties 74
3.5.1 Diamagnetic materials 74
3.5.2 Paramagnetic materials 74
3.5.3 Ferromagnetic materials 75
3.5.4 Antiferromagnetic materials 75
3.5.5 Ferrimagnetic materials 76
3.6 Magnetization in ferrites 76
3.7 Neel’s theory of ferrimagnetism 77
3.8 Saturation moments 79
3.9 The magnetic interactions 80
3.10 Domains in ferrites 82
3.11 Magnetostatic energy 83
3.12 Magnetocrystalline anisotropy energy 84
3.13 Magnetostrictive energy 84
3.14 Domain Wall energy 85
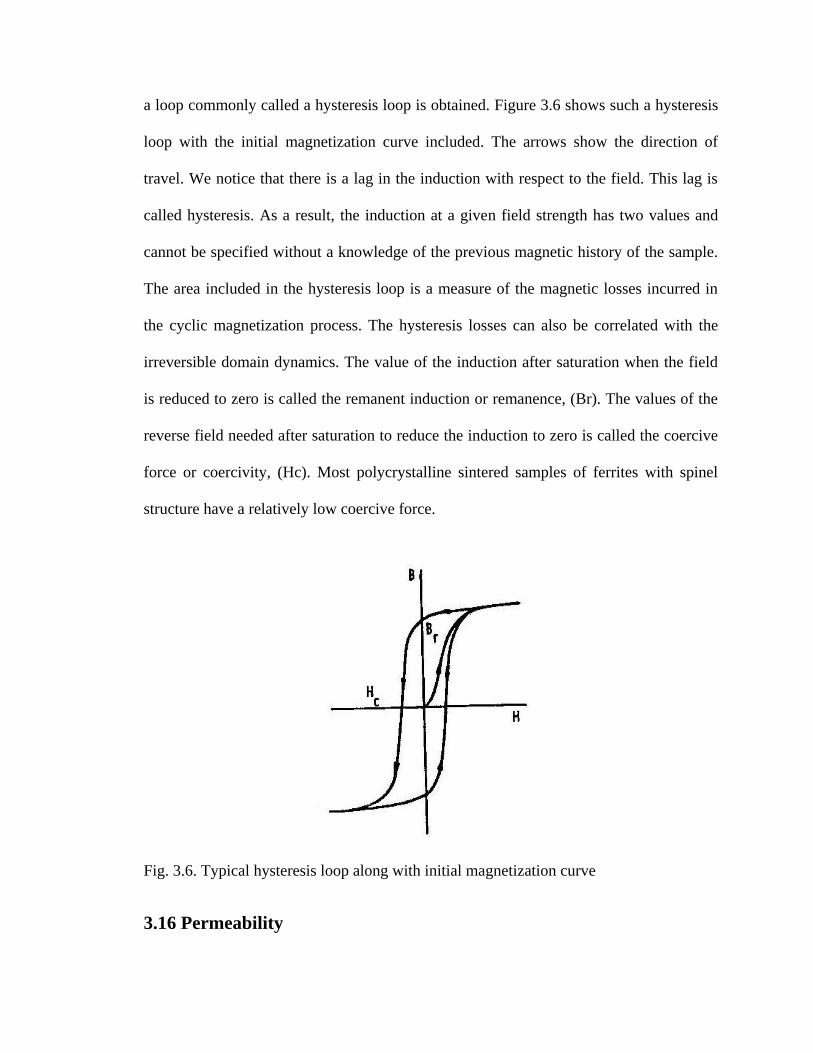
3.15 Hysteresis loop 86
3.16 Permeability 87
Page 11
3.17 Ferromagnetic resonance 96
3.18.1 Ferromagnetic relaxation 98
3.18.2 Gilbert damping model 98
3.18.3 Landau-lifshitz model 99
3.18.4 Other ferromagnetic damping models 99
References 100
CHAPTER 4
Results and discussion 102
Ni1-xTbxFe2O4 Series 102
4.1 Structural analysis 102
4.2 Fourier transform infrared spectroscopy (FTIR) 110
4.3 Scanning electron microscopy (SEM) 115
4.4 Compositional analysis 118
4.5 Static magnetic properties 121
4.5.1 Magnetization 121
4.5.2 Coercivity 122
4.6 Magnetodynamics of Ni-Tb-Fe-O system 130
4.7 Relative initial permeability 137
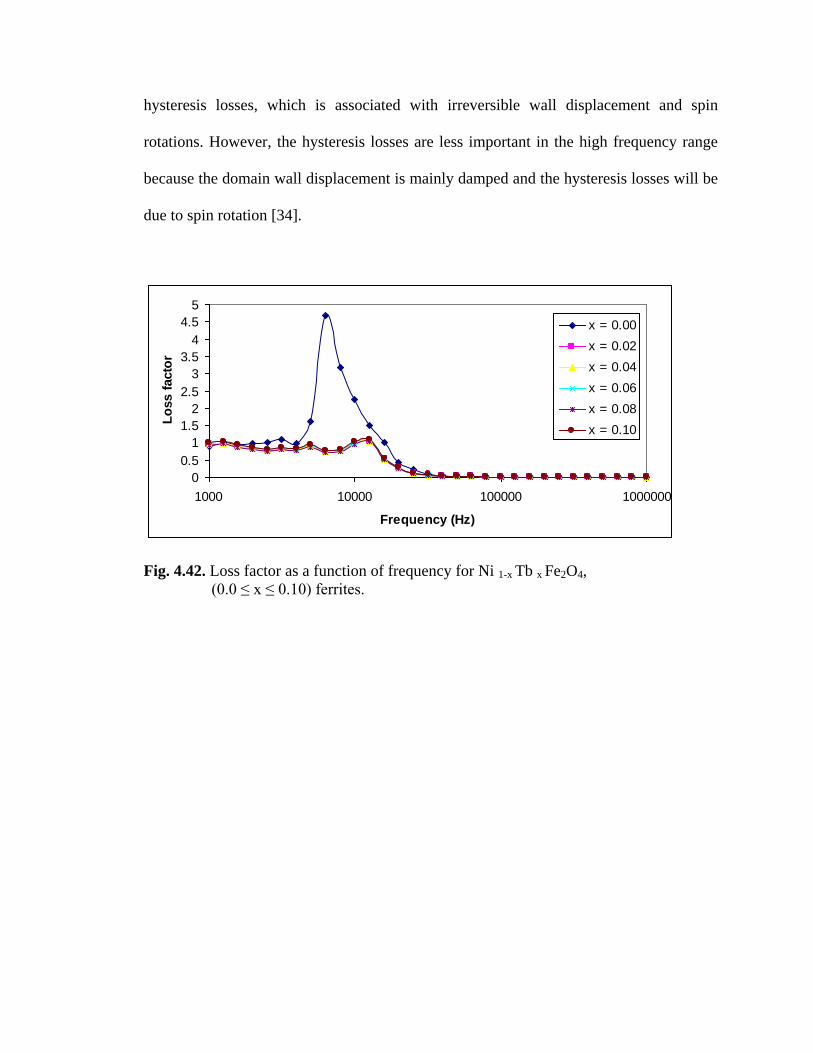
4.7.1 Frequency dependent loss factor 139
4.8 DC electrical resistivity 141
4.8.1 Temperature dependent electrical resistivity 142
4.9 Dielectric properties 148
Page 12
Mg1-xTbxFe2O4 Series 155
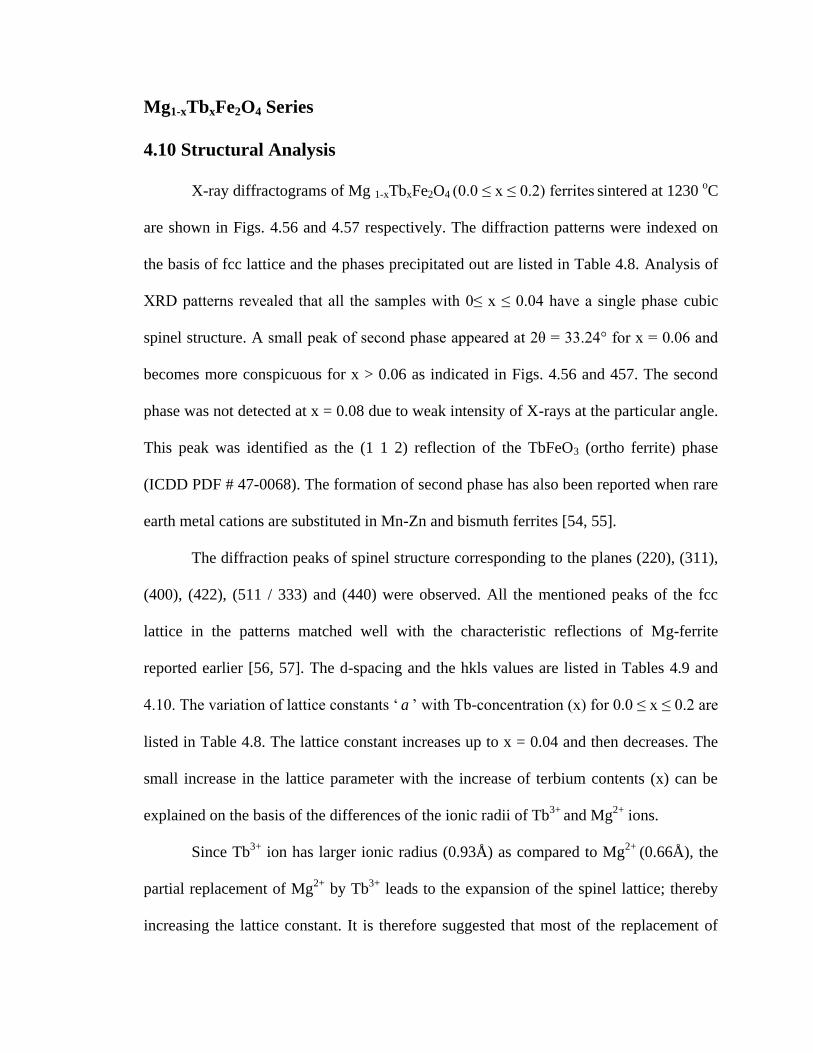
4.10 Structural analysis 155
4.11 Fourier transform infrared spectroscopy (FTIR) 164
4.12 Scanning electron microscopy (SEM) 169
4.13 Compositional analysis 172
4.14 Static magnetic properties 175
4.14.1 Magnetization 175
4.14.2 Coercivity 176
4.15 Magnetodynamics of Mg-Tb-Fe-O system 184
4.16 Relative initial permeability 192
4.16.1 Frequency dependent loss factor 195
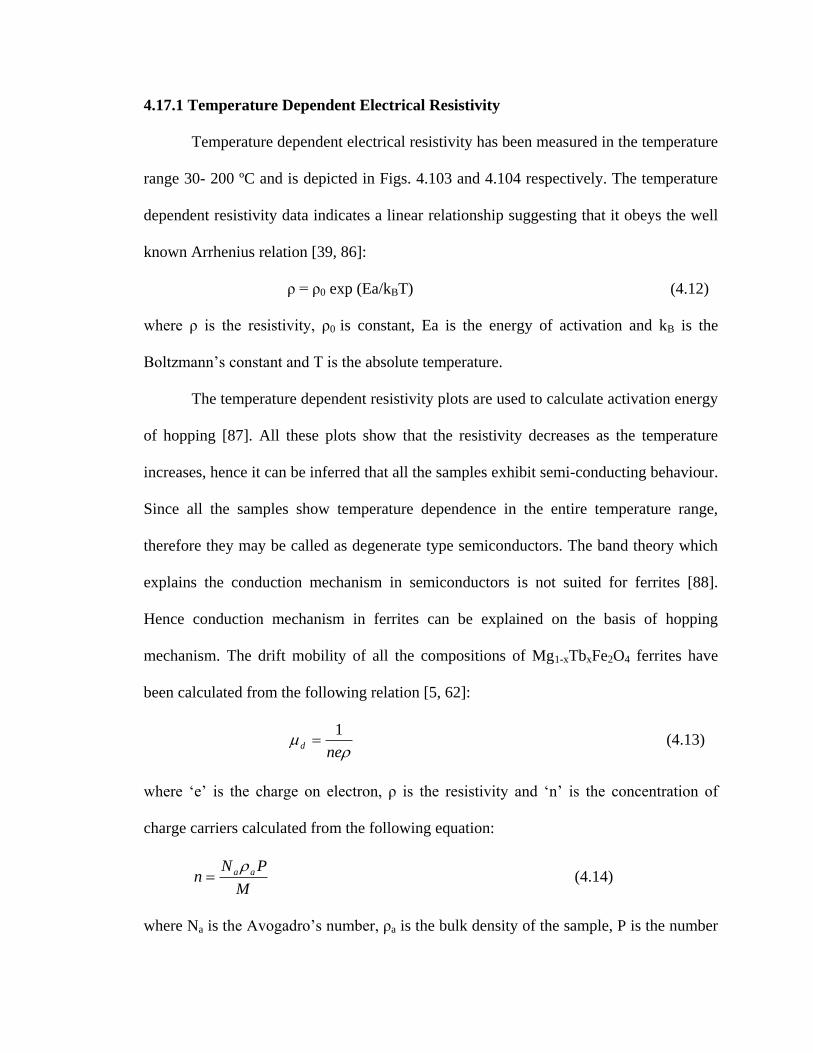
4.17 DC electrical resistivity 197
4.17.1 Temperature dependent electrical resistivity 198
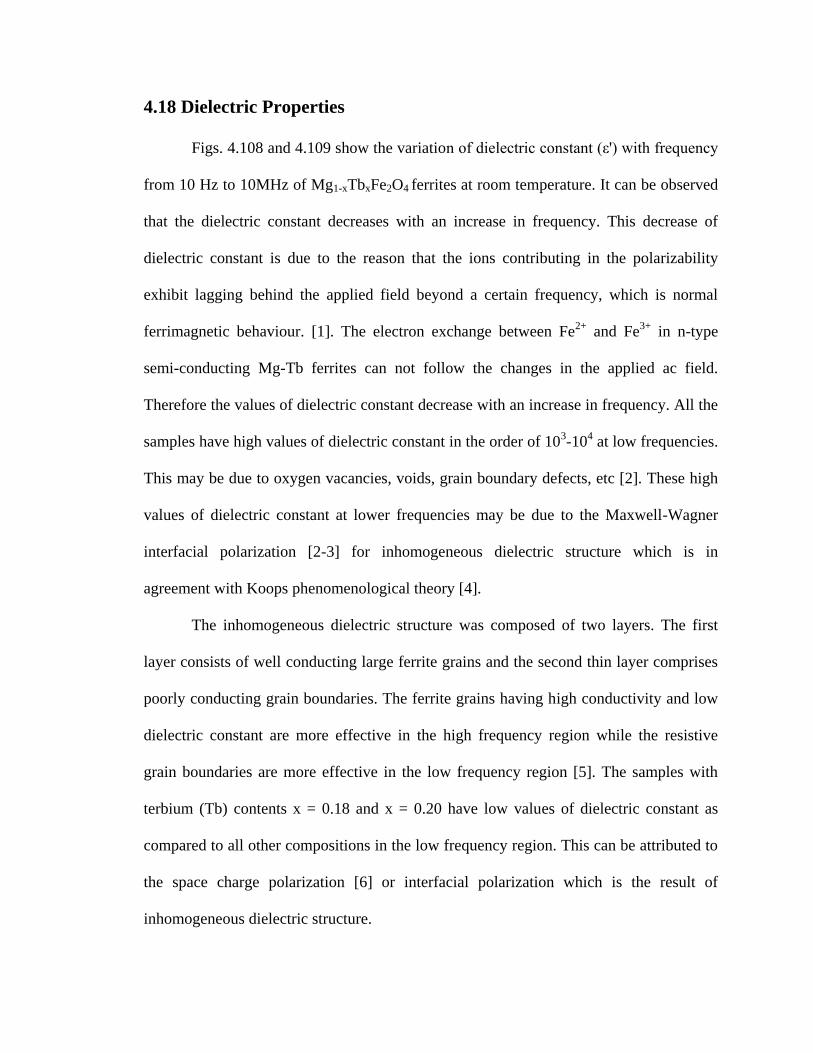
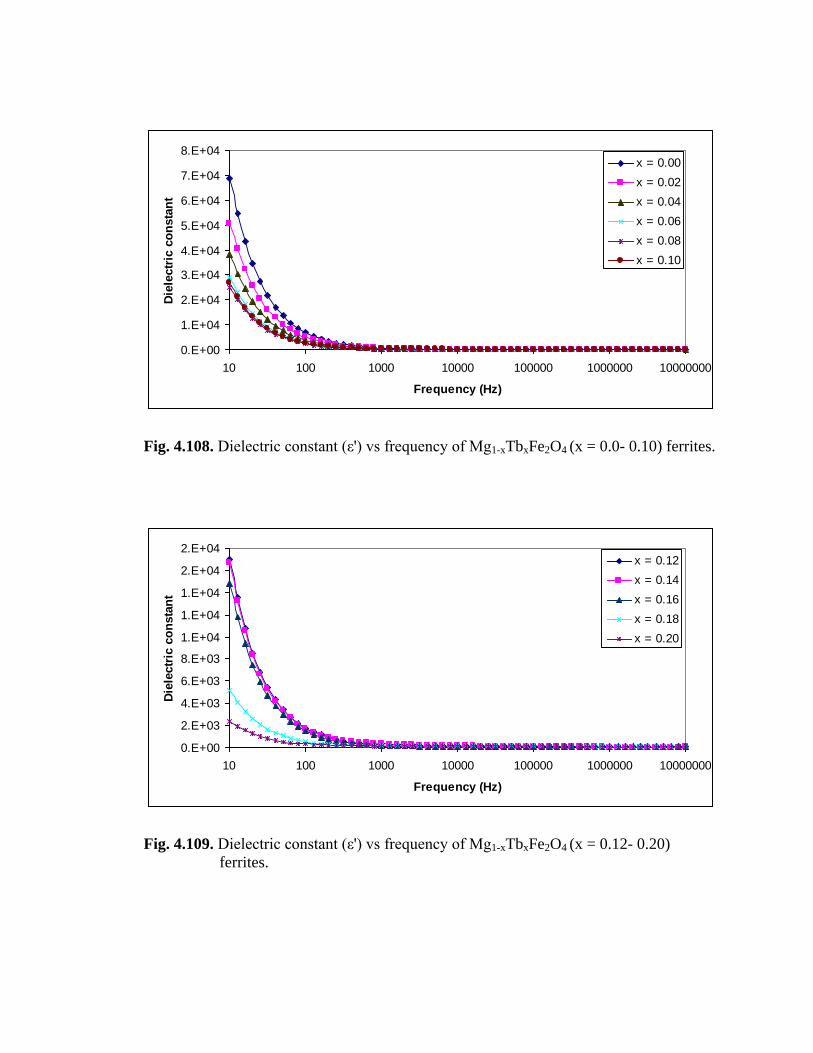
4.18 Dielectric properties 204
Conclusions 212
References 215
Appendix A 221
Appendix B 222
Publications
Page 13
Fig. No. List of Figures Page No
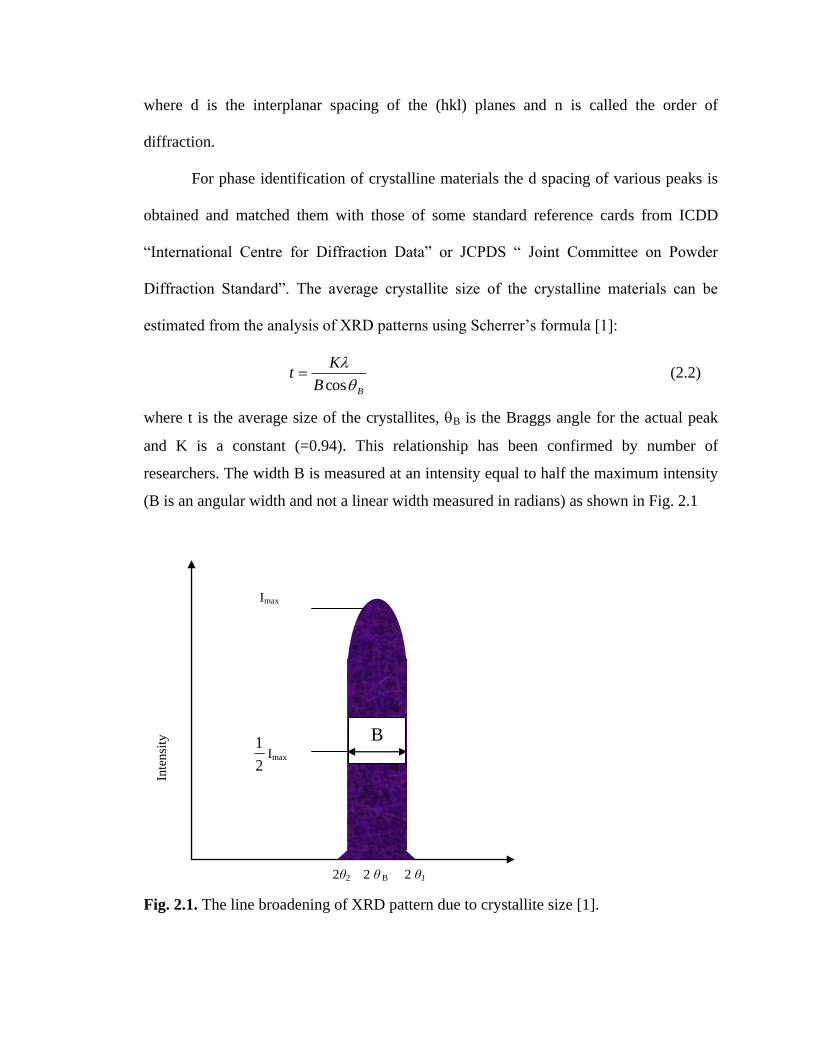
2.1 The line broadening of XRD pattern due to crystallite size 57
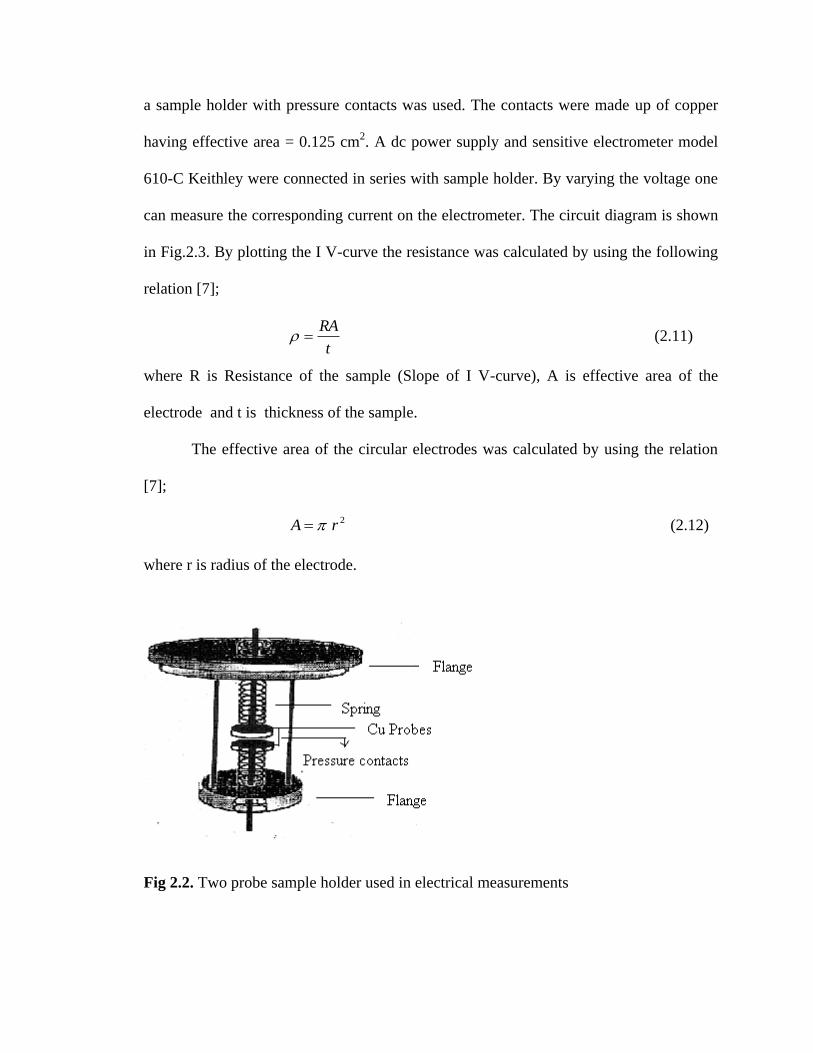
2.2 Two probe sample holder used in electrical measurements 61
2.3 The circuit diagram of electrical resistivity measurement apparatus 62
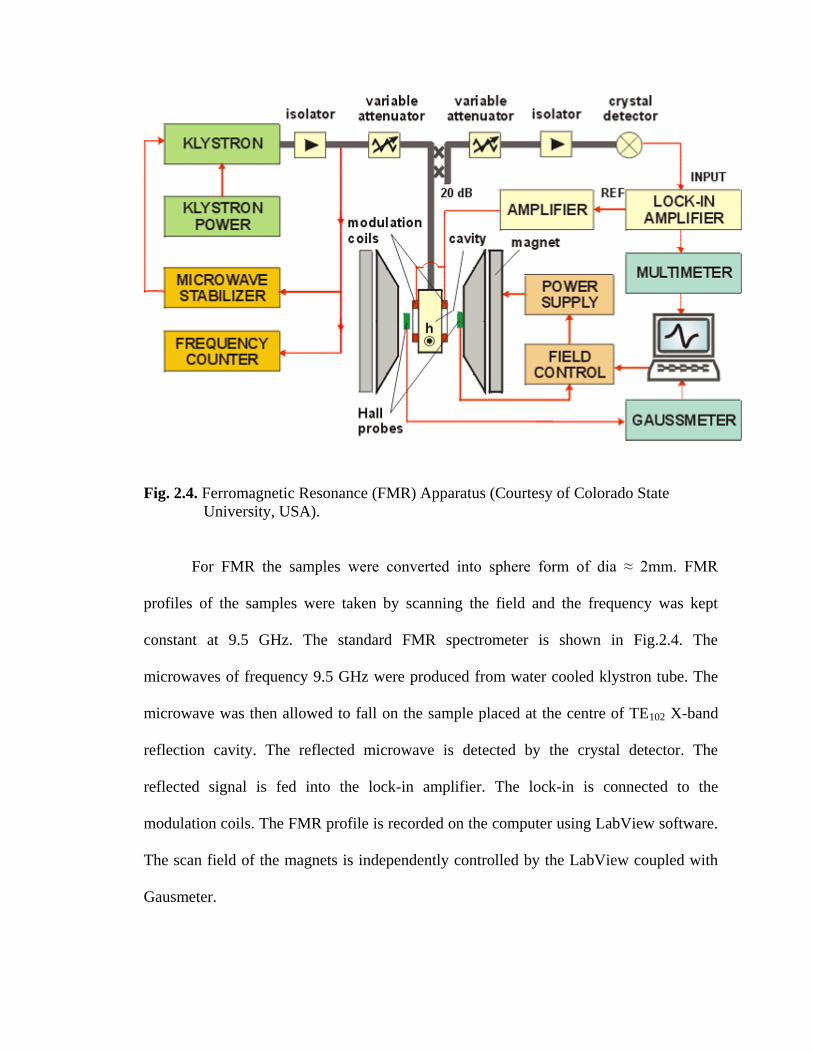
2.4 Ferromagnetic Resonance (FMR) Apparatus 64
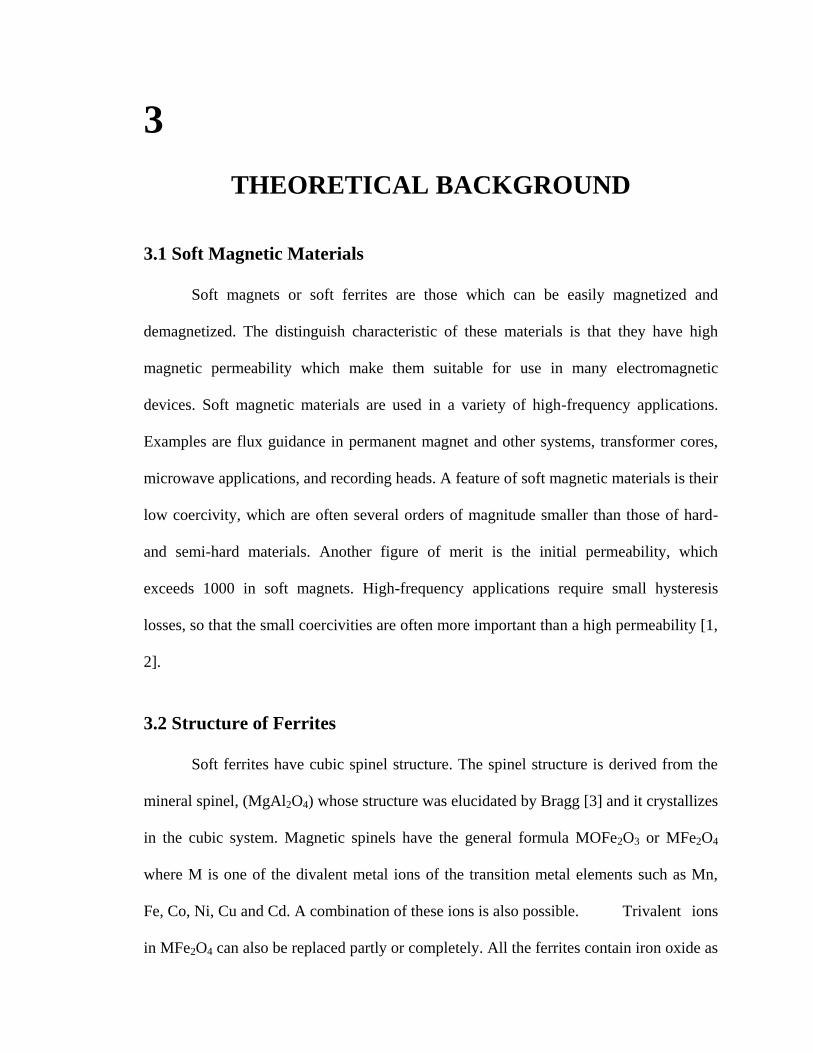
3.1 The spinel structure 68
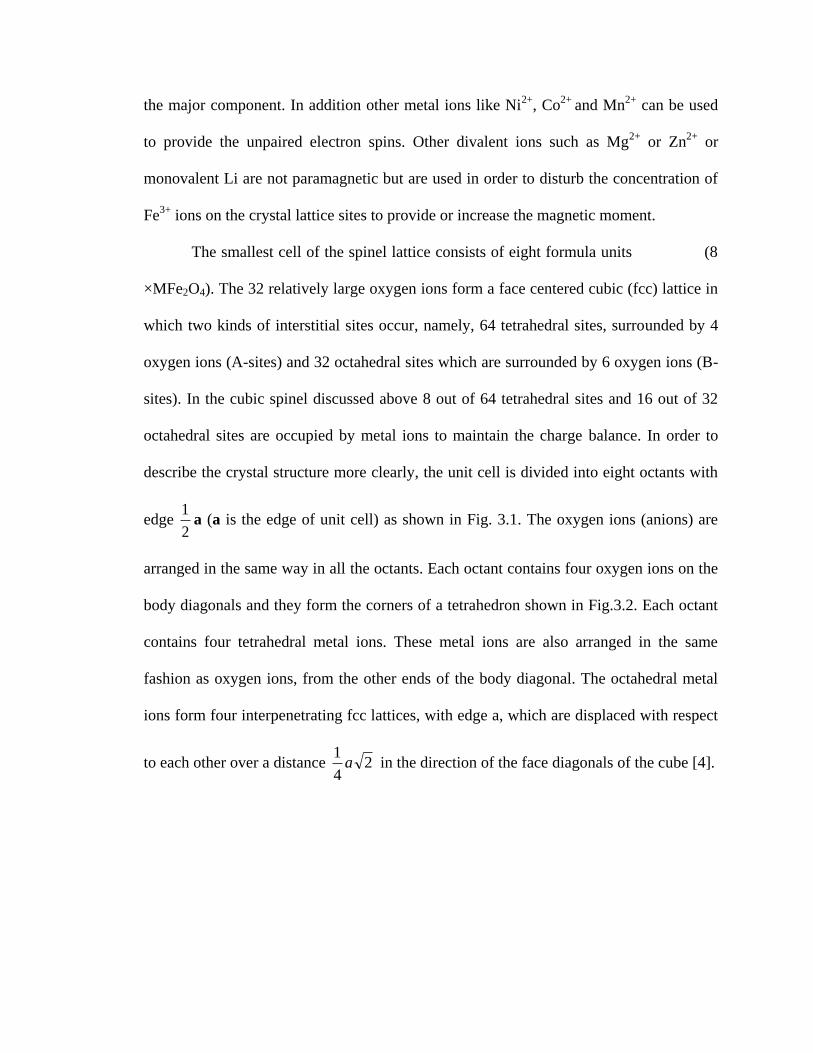
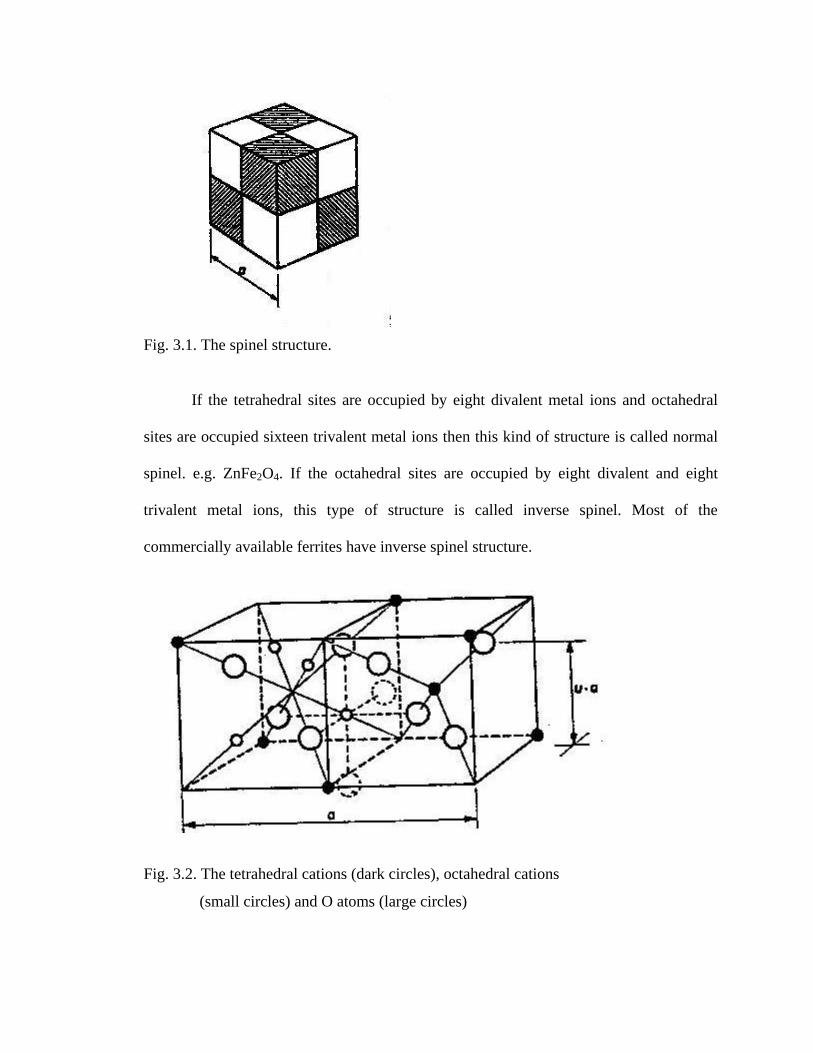
3.2 The tetrahedral cations, octahedral cations and O atoms 68
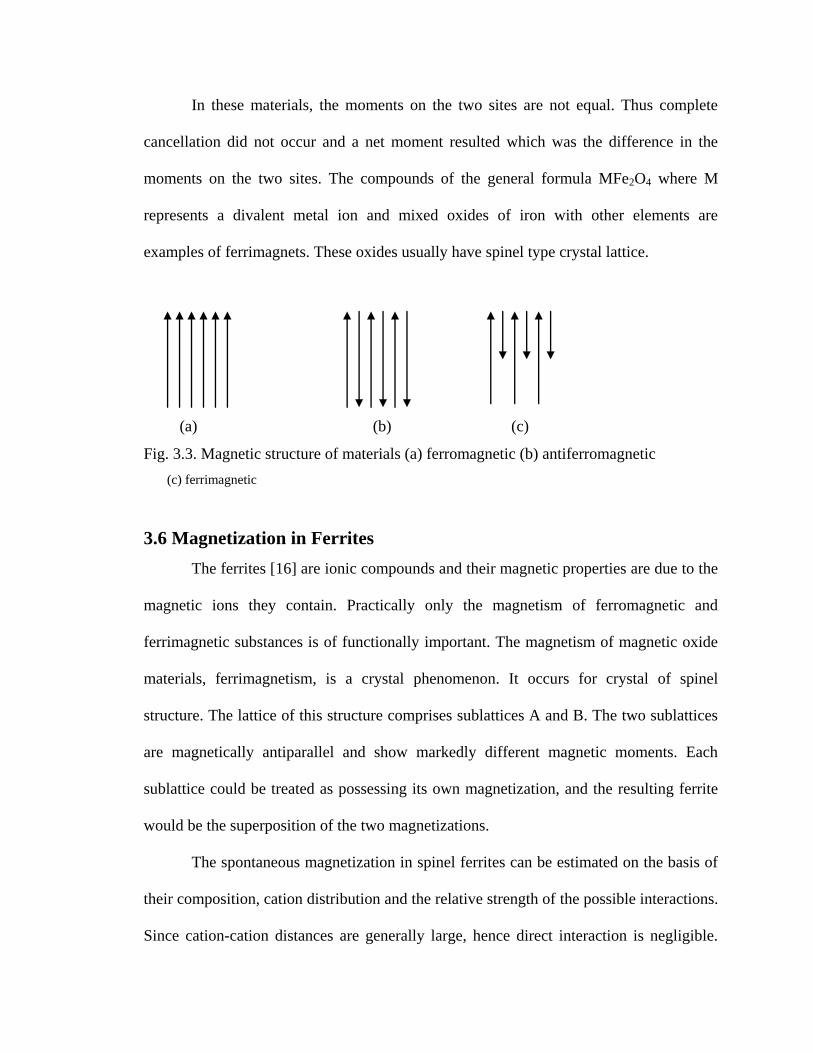
3.3 Magnetic structure of materials (a) ferromagnetic (b) antiferromagnetic
(c) ferromagnetic 76
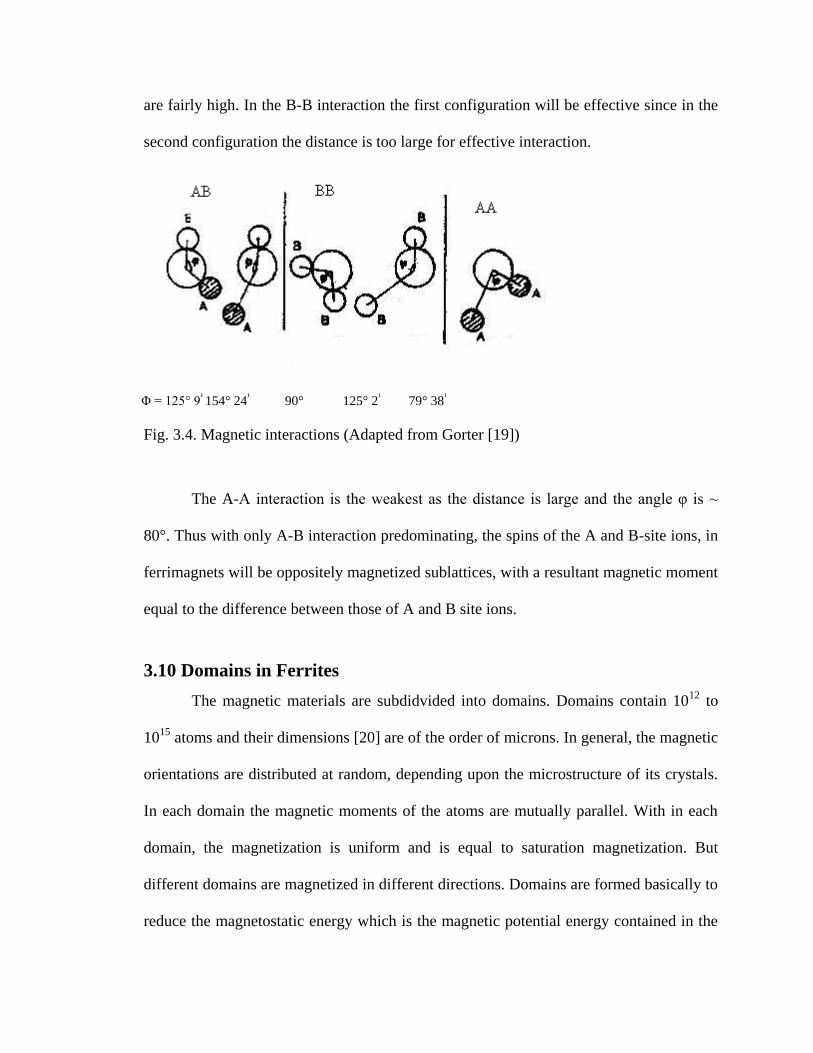
3.4 Magnetic interactions 81
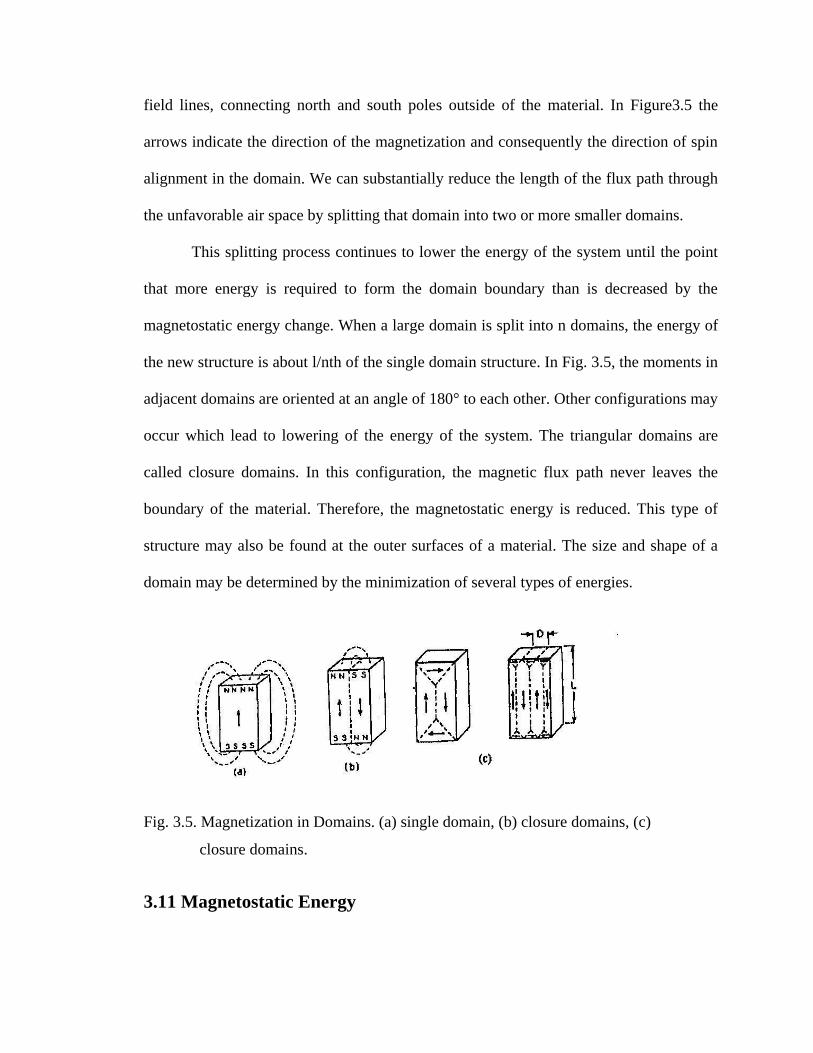
3.5 Magnetization in Domains. (a) single domain, (b) closure domains,
(c) closure Domains 83
3.6 Typical hysteresis loop along with initial magnetization curve
87
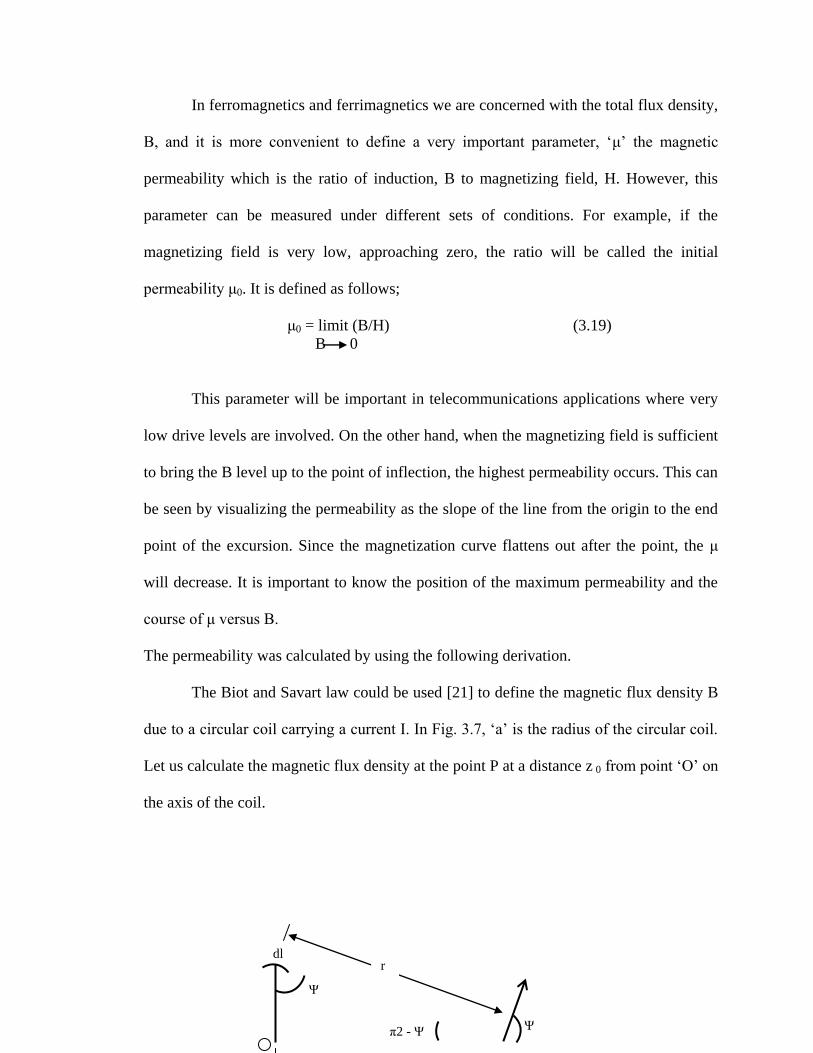
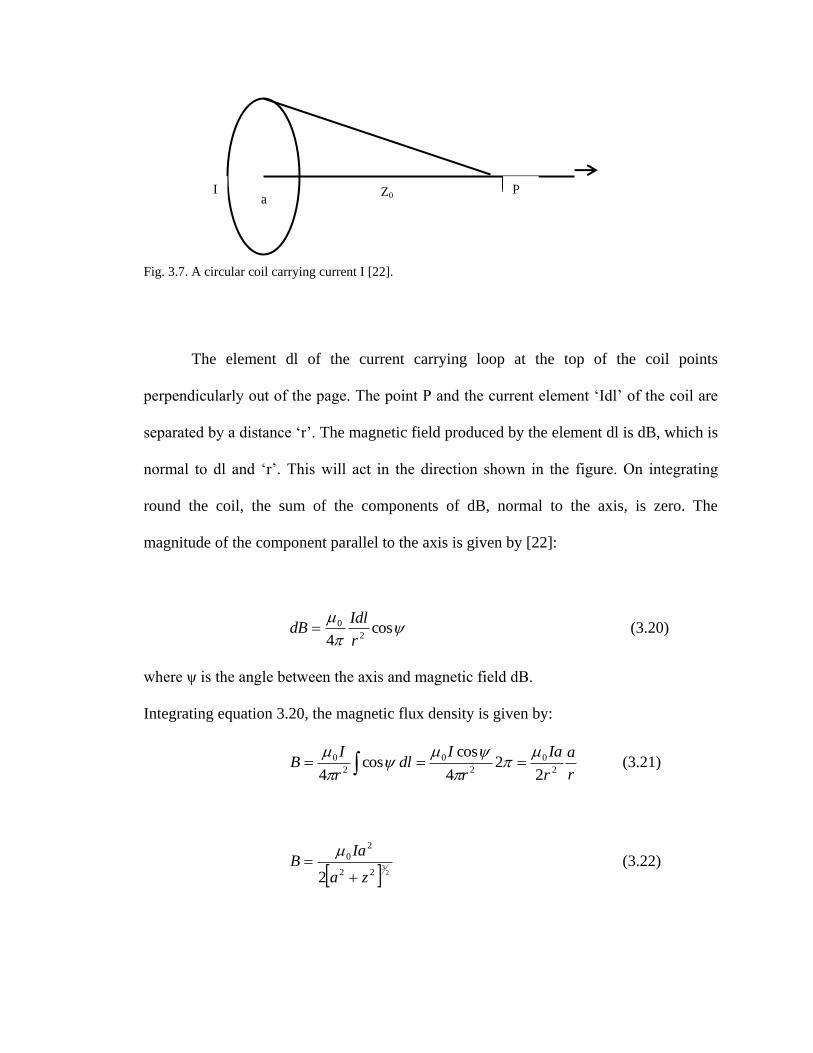
3.7 A circular coil carrying current I 88
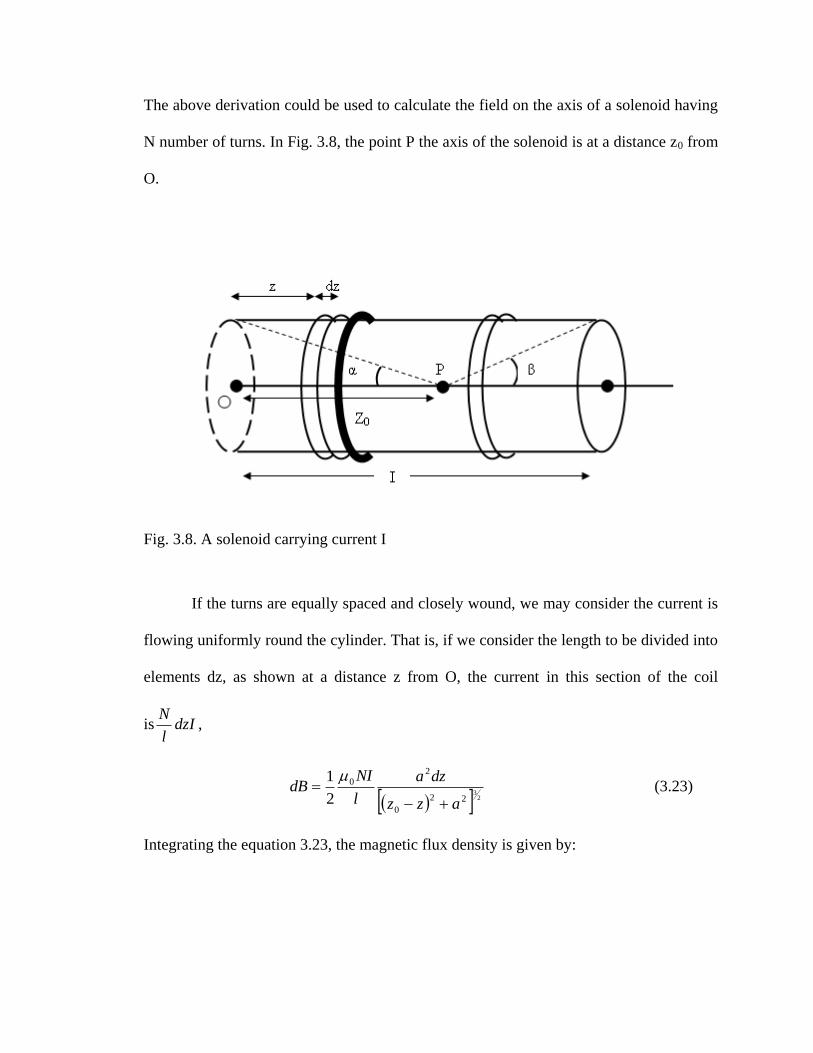
3.8 A solenoid carrying current I 90
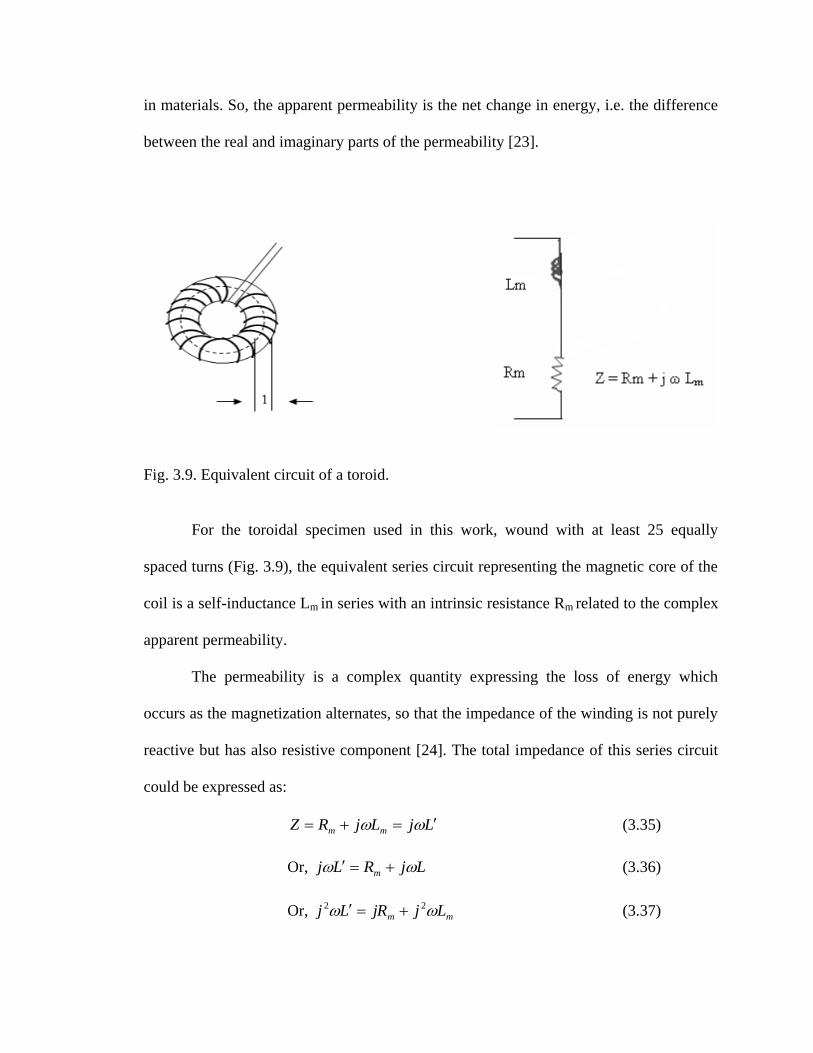
3.9 Equivalent circuit of a toroid 94
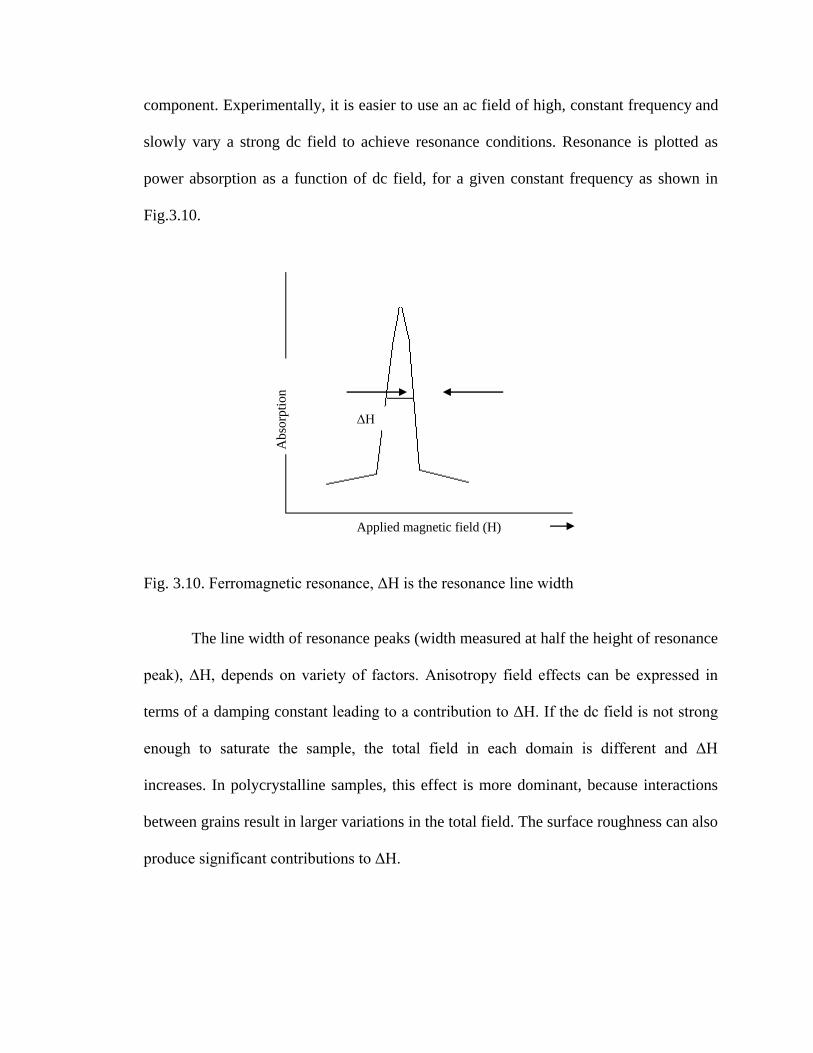
3.10 Ferromagnetic resonance line width ΔH 97
4.1 X-ray diffraction patterns for Ni1-xTbxFe2O4 ferrites
(x = 0.0, 0.02, 0.04, 0.06, 0.08) 103
4.2 X-ray diffraction patterns for Ni1-xTbxFe2O4 ferrites
(x = 0.10, 0.12, 0.14, 0.16, 0.18, 0.20) 104
Page 14
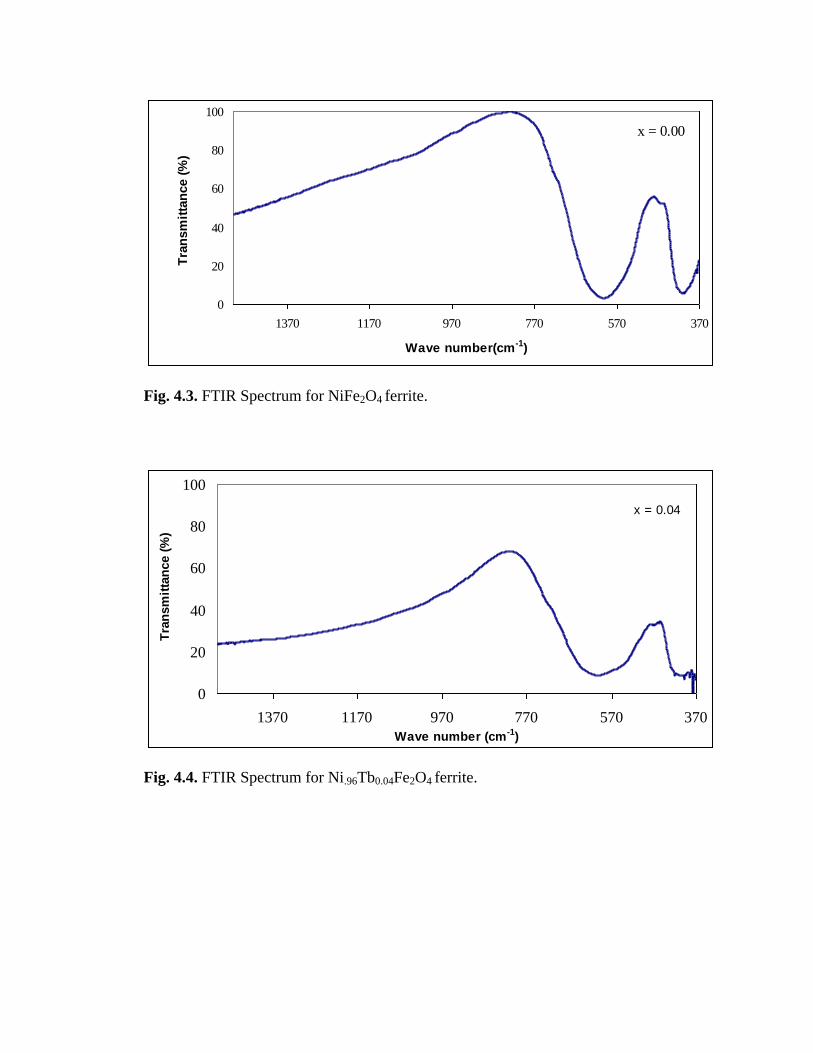
4.3 FTIR Spectrum for NiFe2O4 ferrite 111
4.4 FTIR Spectrum for Ni.96Tb0.04Fe2O4 ferrite 111
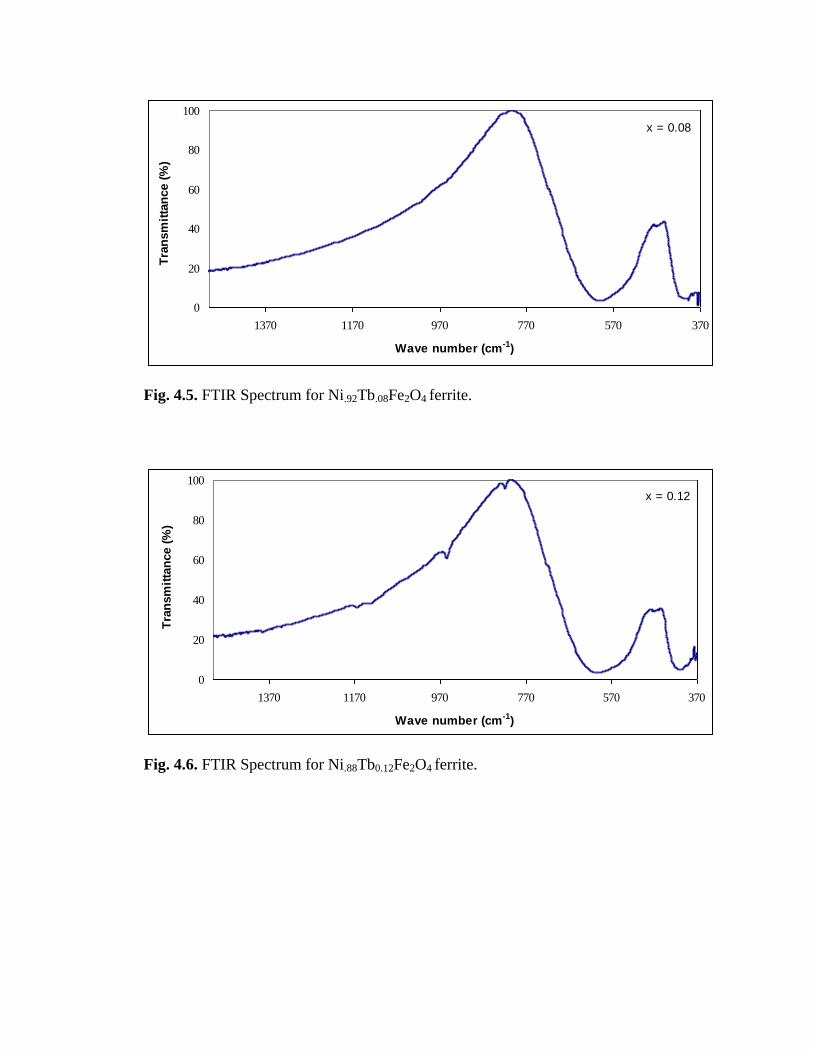
4.5 FTIR Spectrum for Ni.92Tb.08Fe2O4 ferrite 112
4.6 FTIR Spectrum for Ni.88Tb0.12Fe2O4 ferrite 112
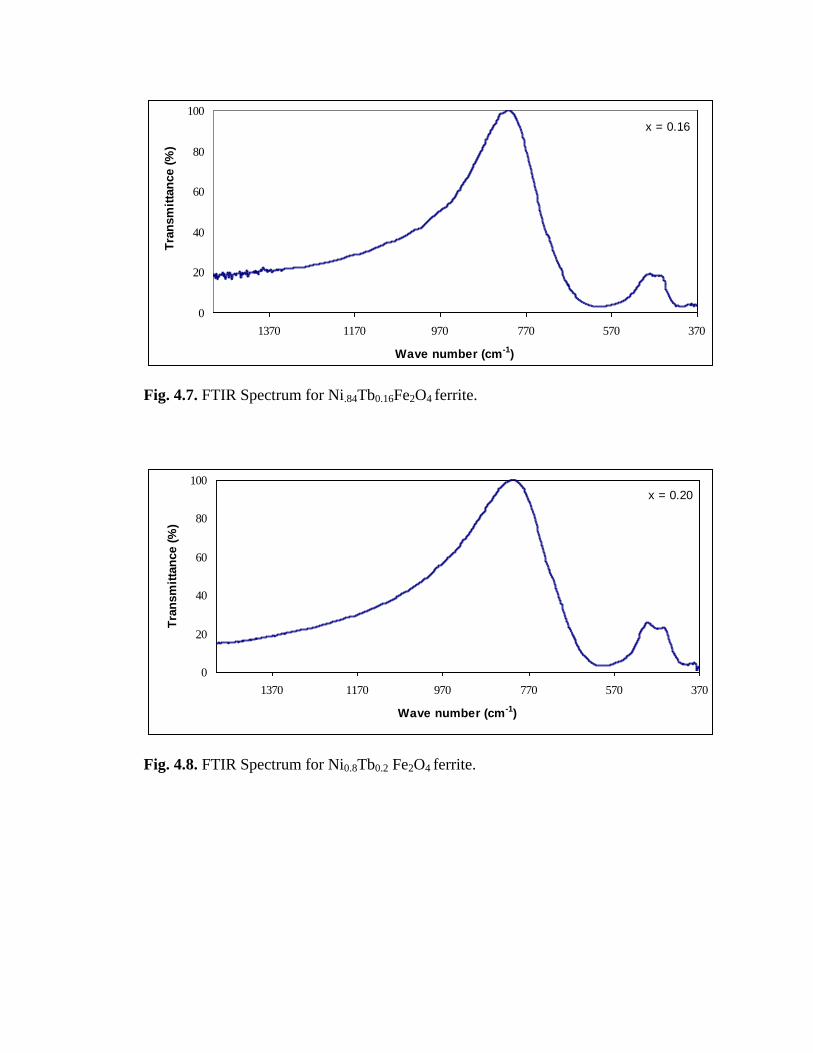
4.7 FTIR Spectrum for Ni.84Tb0.16Fe2O4 ferrite 113
4.8 FTIR Spectrum for Ni0.8Tb0.2 Fe2O4 ferrite 113
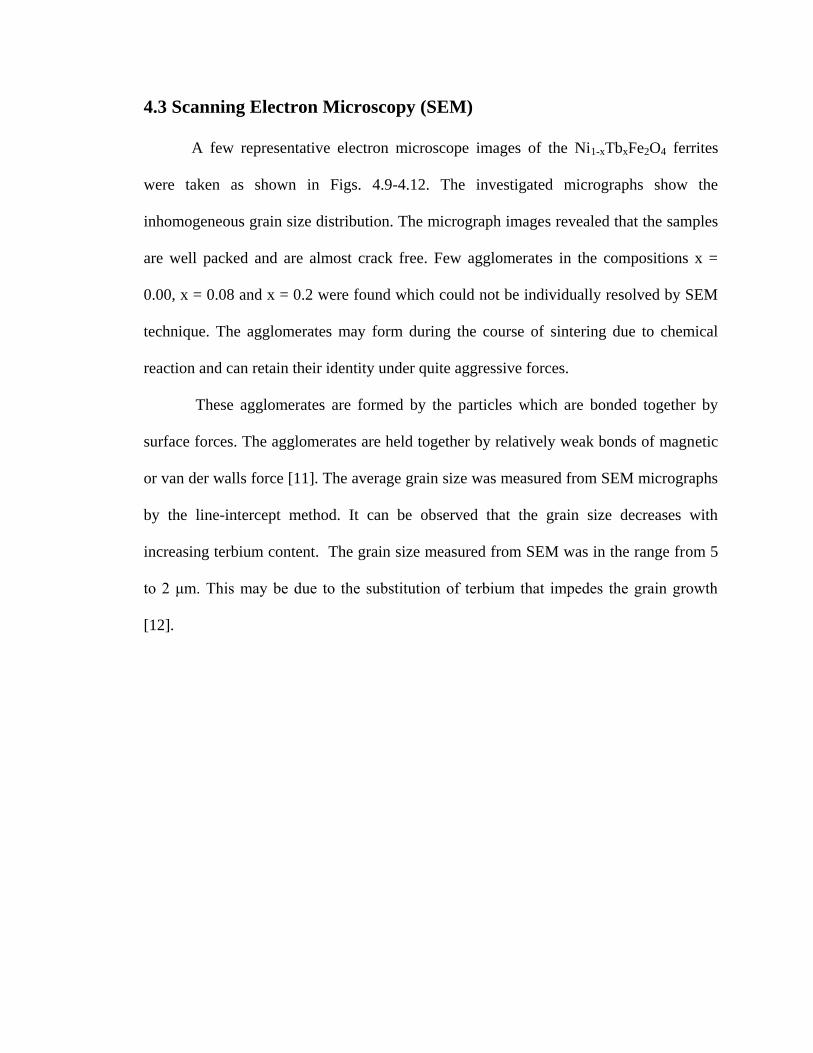
4.9 SEM micrographs of Ni 1-x Tb x Fe2O4 (x = 0.00) ferrite 116
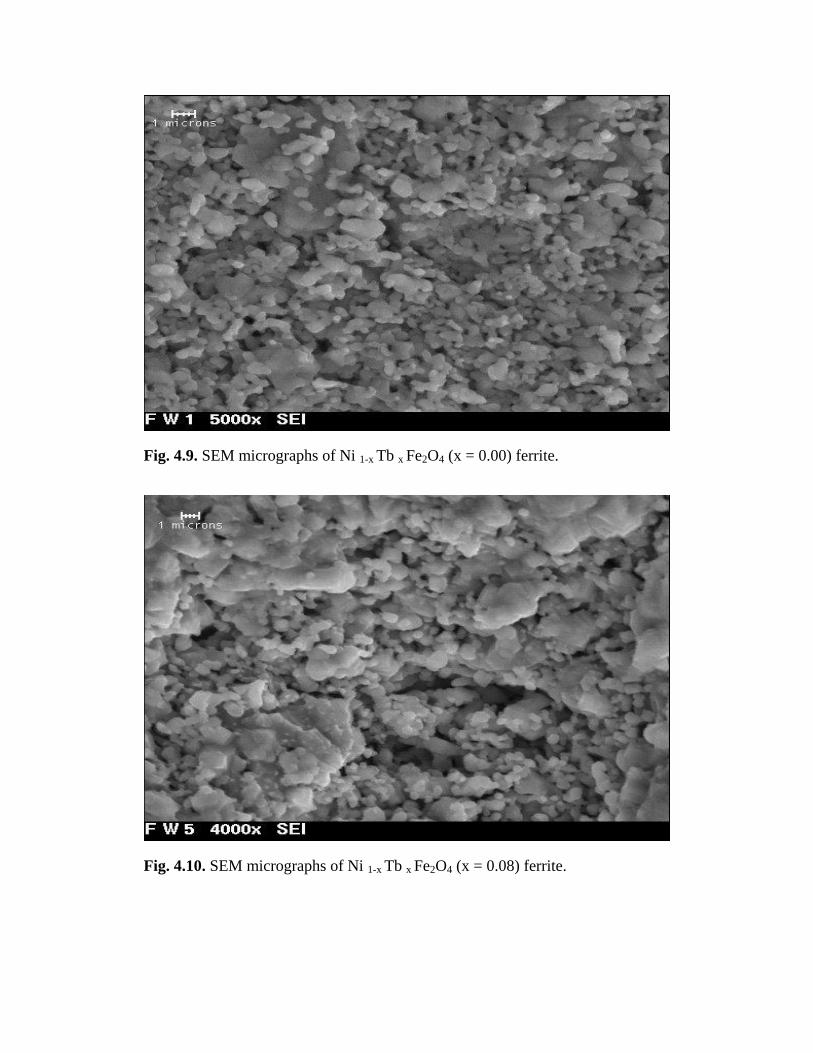
4.10 SEM micrographs of Ni 1-x Tb x Fe2O4 (x = 0.08) ferrite 116
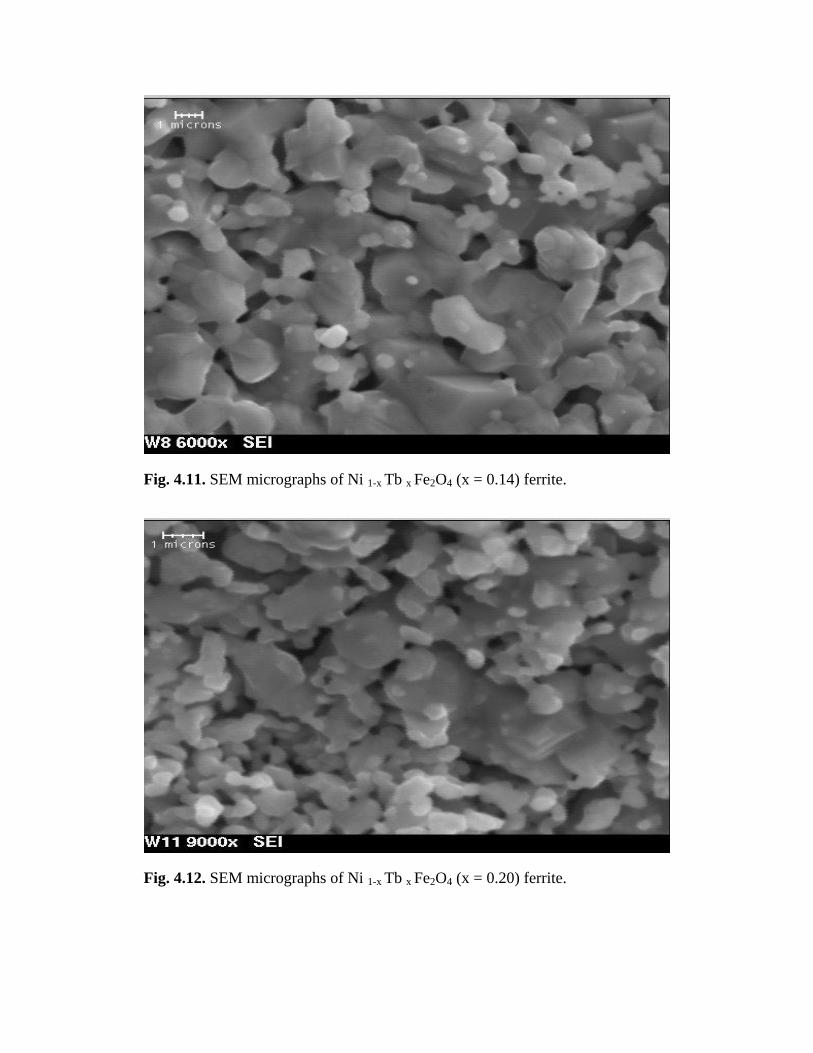
4.11 SEM micrographs of Ni 1-x Tb x Fe2O4 (x = 0.14) ferrite 117
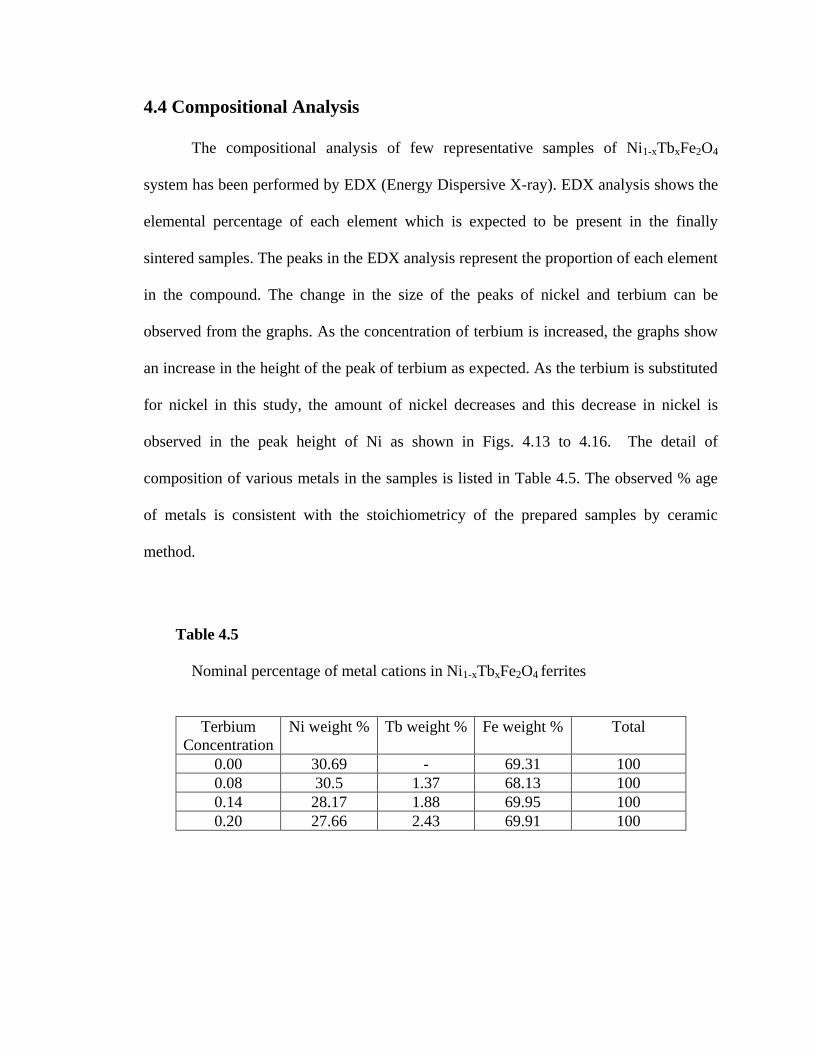
4.12 SEM micrographs of Ni 1-x Tb x Fe2O4 (x = 0.20) ferrite 117
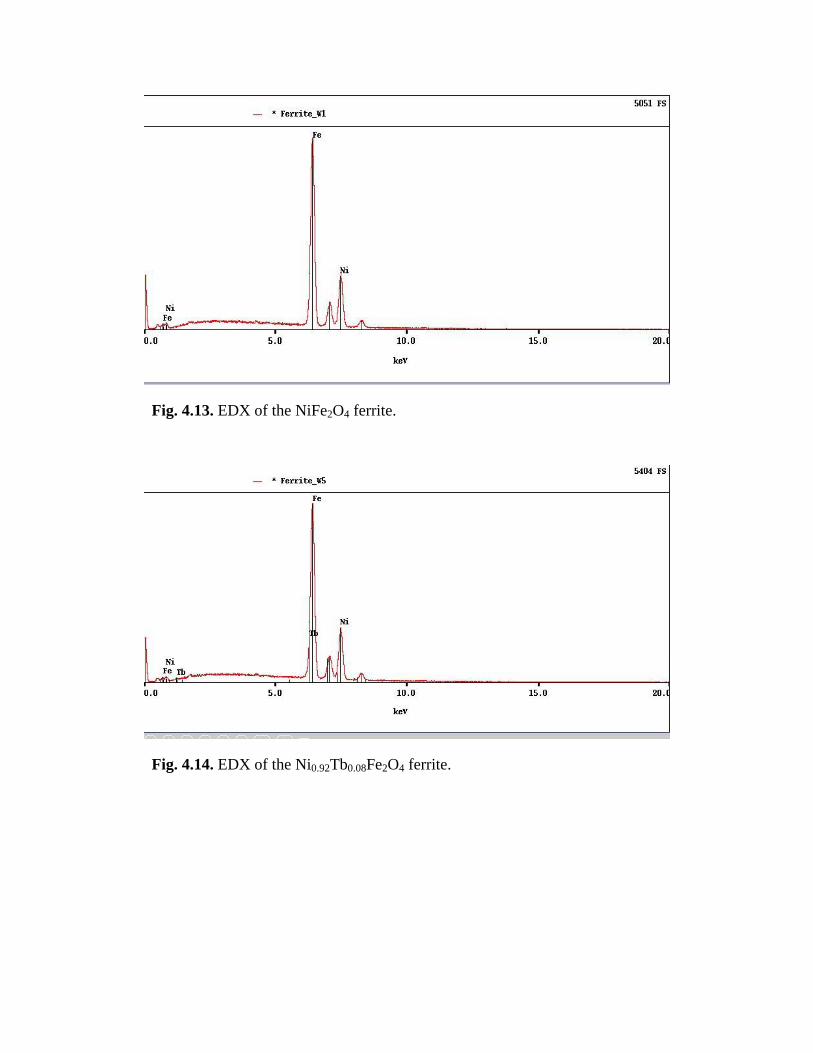
4.13 EDX of the NiFe2O4 ferrite 119
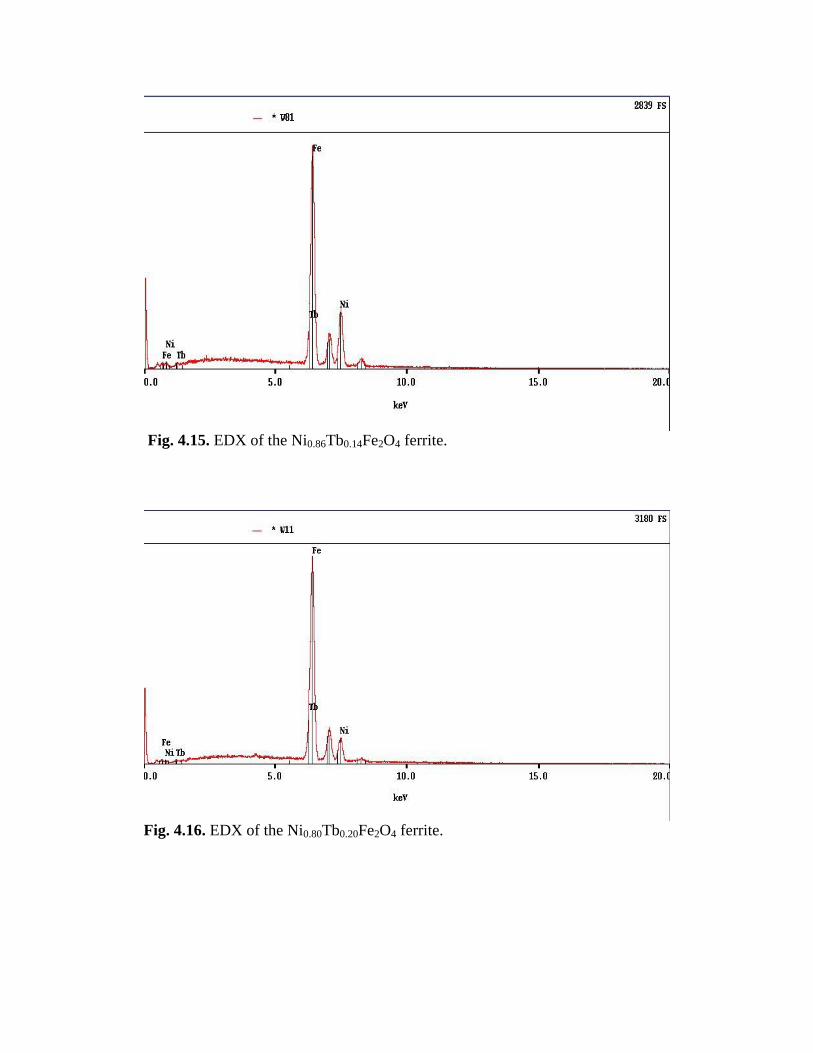
4.14 EDX of the Ni0.92Tb0.08Fe2O4 ferrite 119
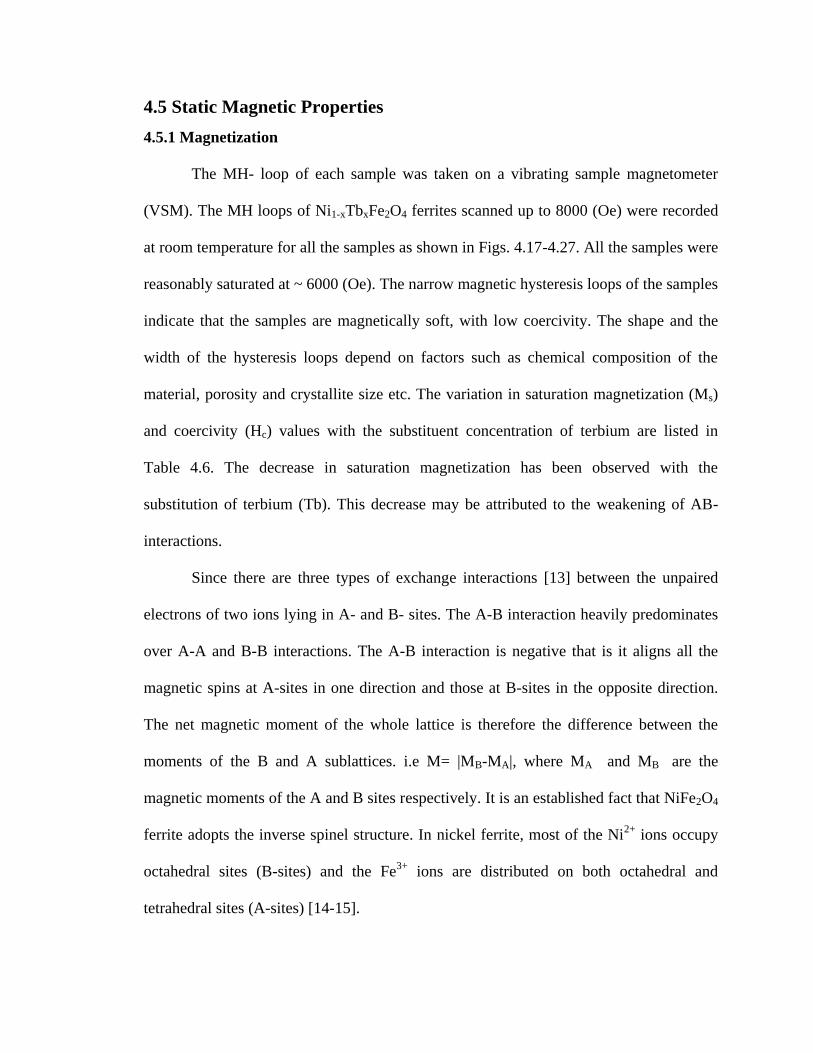
4.15 EDX of the Ni0.86Tb0.14Fe2O4 ferrite 120
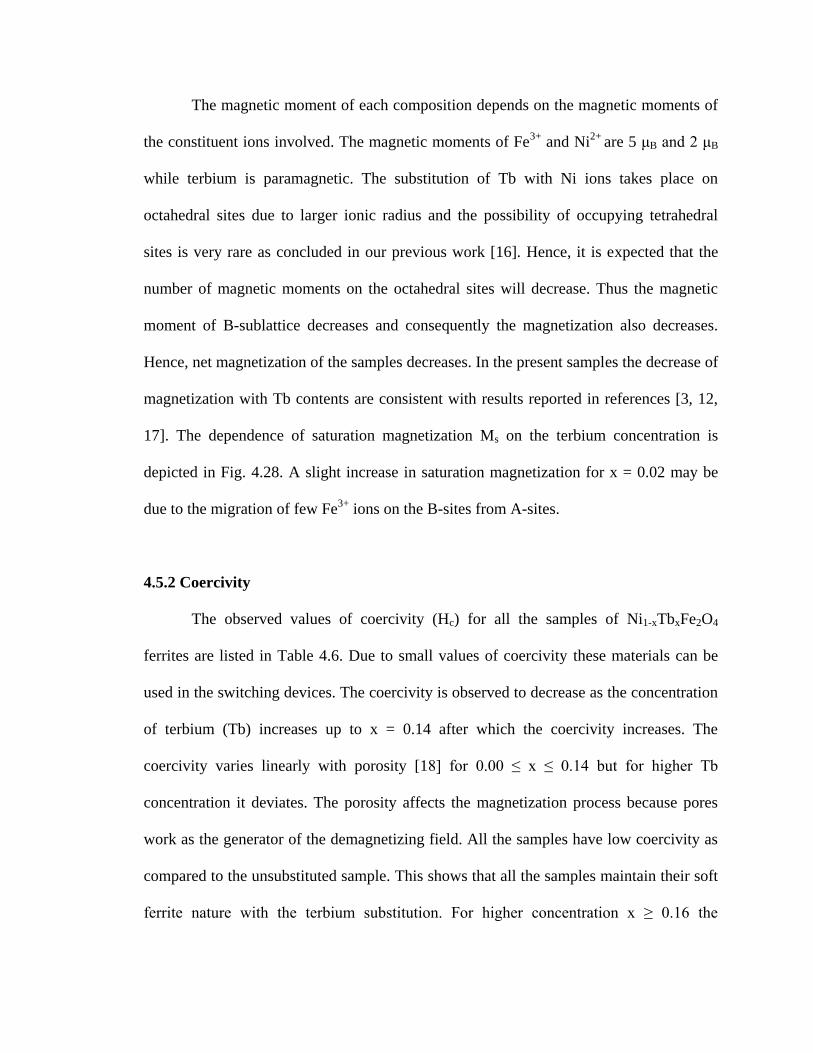
4.16 EDX of the Ni0.80Tb0.20Fe2O4 ferrite 120
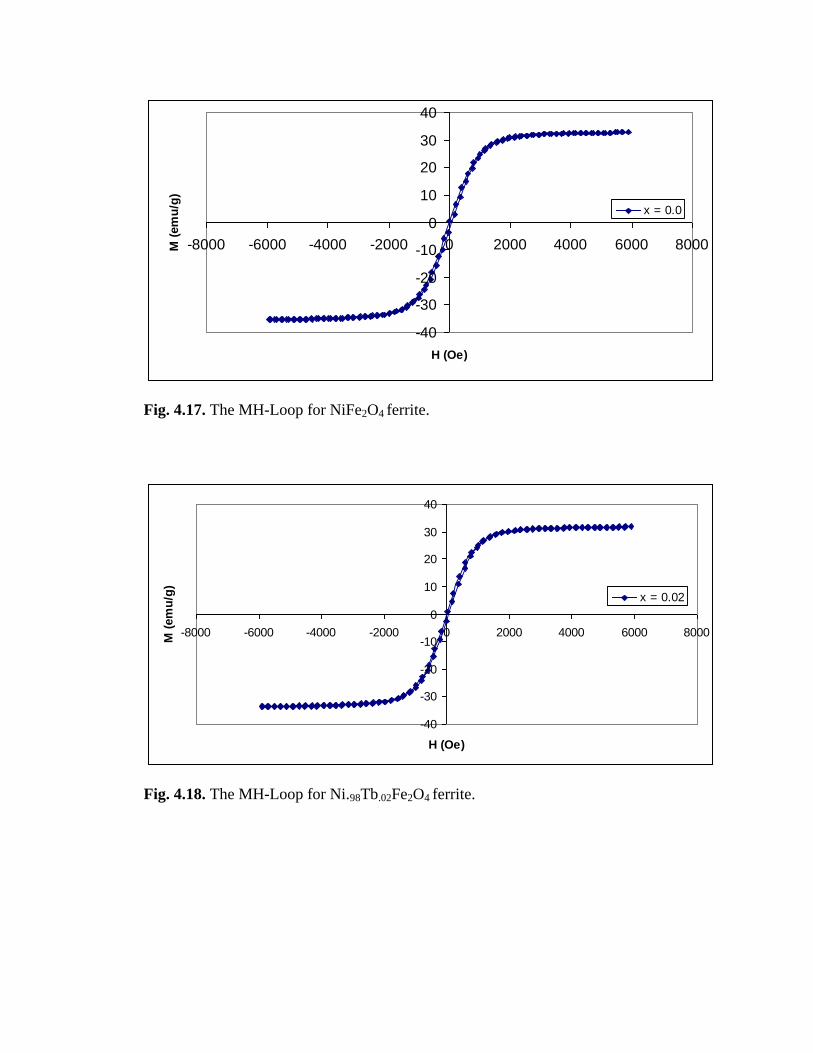
4.17 The MH-Loop for NiFe2O4 ferrite 124
4.18 The MH-Loop for Ni.98Tb.02Fe2O4 ferrite 124
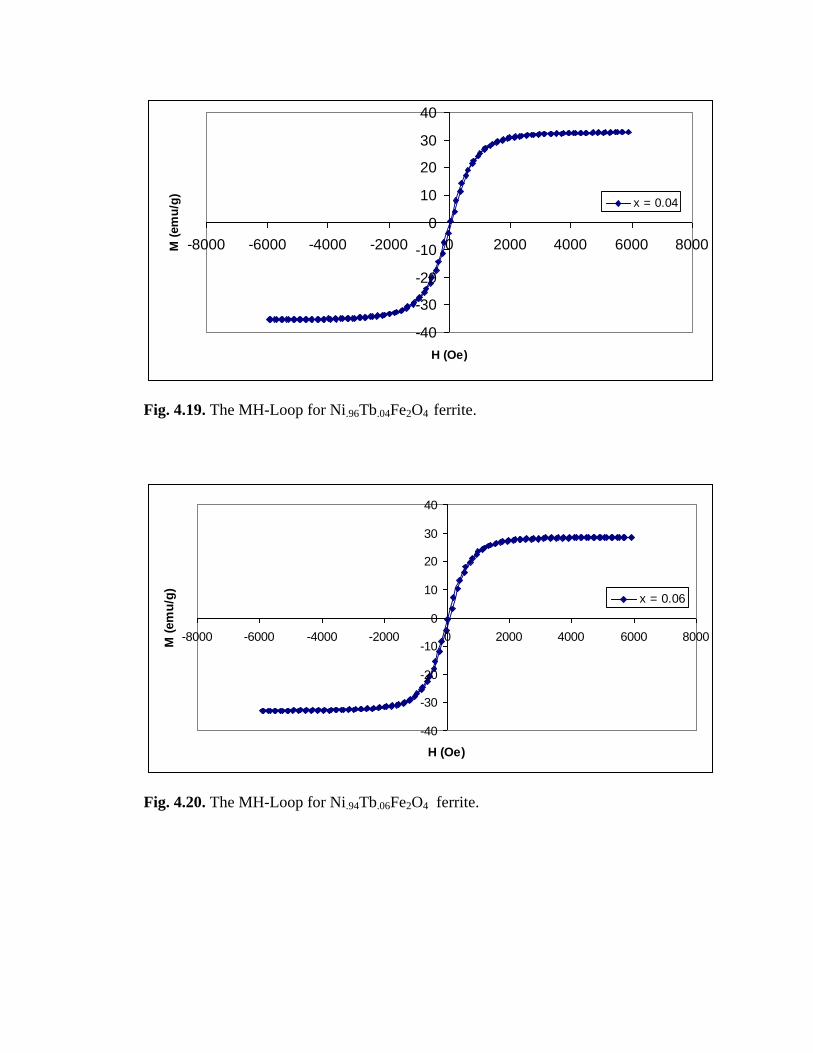
4.19 The MH-Loop for Ni.96Tb.04Fe2O4 ferrite 125
4.20 The MH-Loop for Ni.94Tb.06Fe2O4 ferrite 125
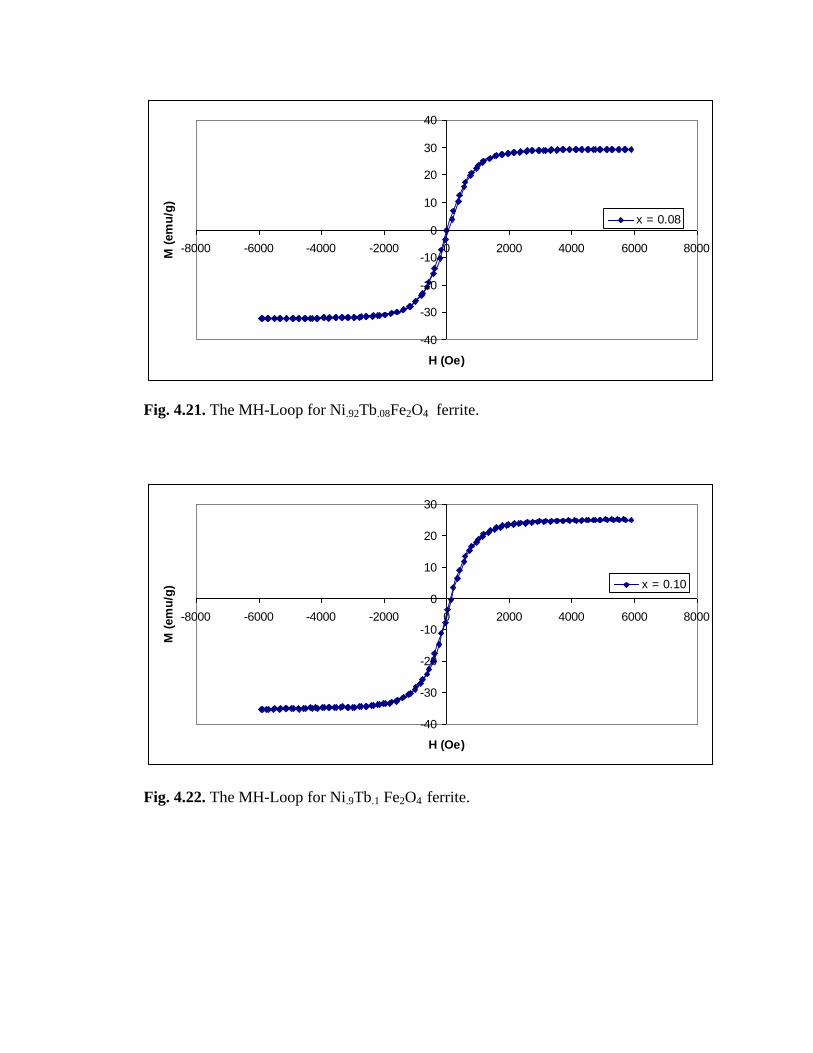
4.21 The MH-Loop for Ni.92Tb.08Fe2O4 ferrite 126
4.22 The MH-Loop for Ni.9Tb.1 Fe2O4 ferrite 126
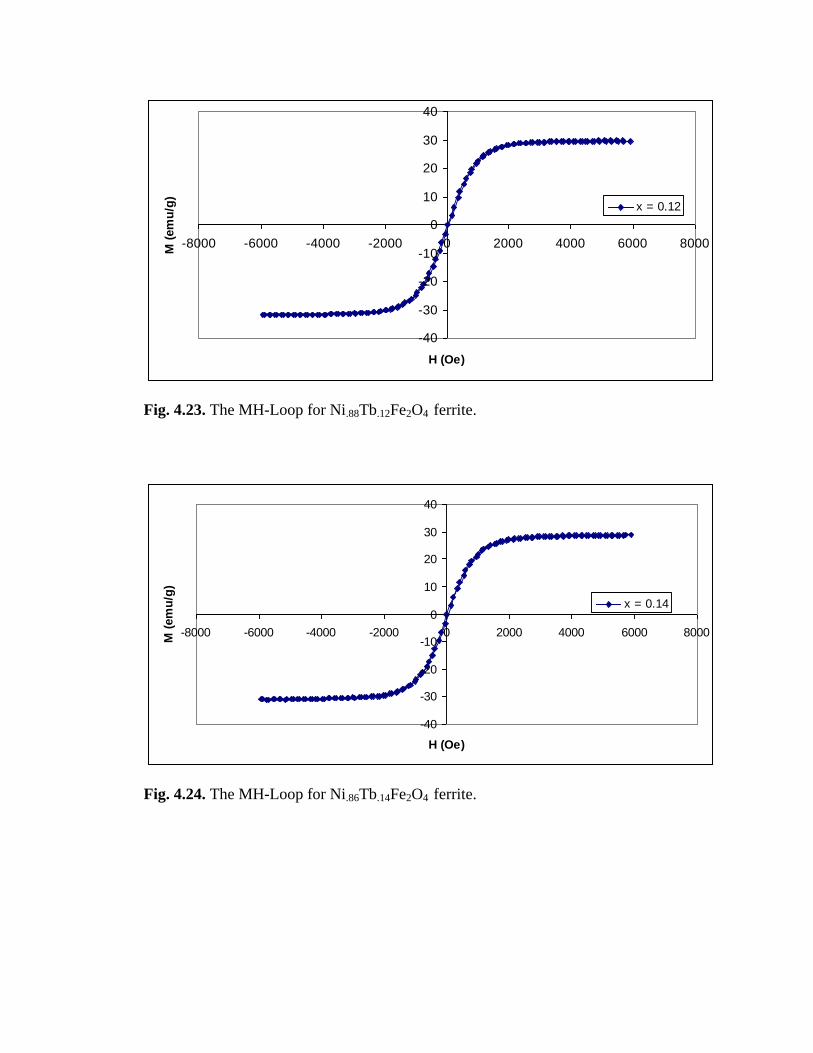
4.23 The MH-Loop for Ni.88Tb.12Fe2O4 ferrite 127
4.24 The MH-Loop for Ni.86Tb.14Fe2O4 ferrite 127
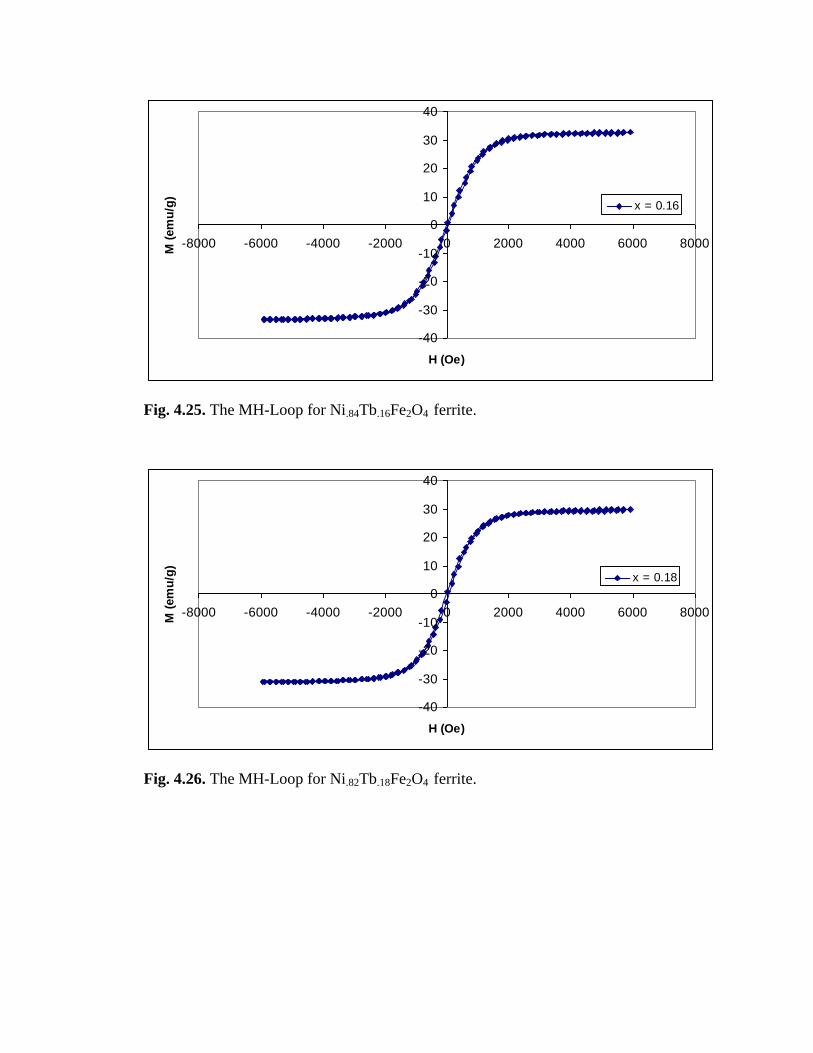
4.25 The MH-Loop for Ni.84Tb.16Fe2O4 ferrite 128
Page 15
4.26 The MH-Loop for Ni.82Tb.18Fe2O4 ferrite 128
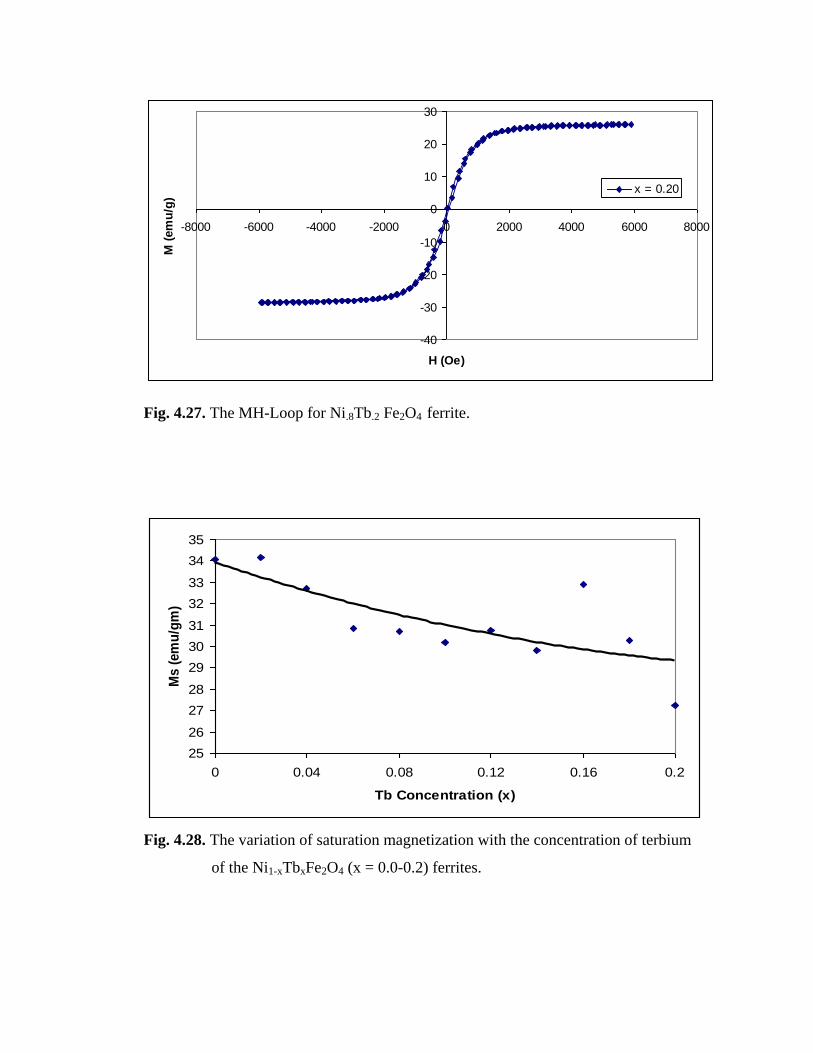
4.27 The MH-Loop for Ni.8Tb.2 Fe2O4 ferrite 129
4.28 The variation of saturation magnetization with the concentration
of terbium of the Ni1-xTbxFe2O4 (x = 0.0-0.2) ferrites 129
4.29 FMR profile of NiFe2O4 ferrite 131
4.30 FMR profile of Ni.98Tb.02Fe2O4 ferrite 131
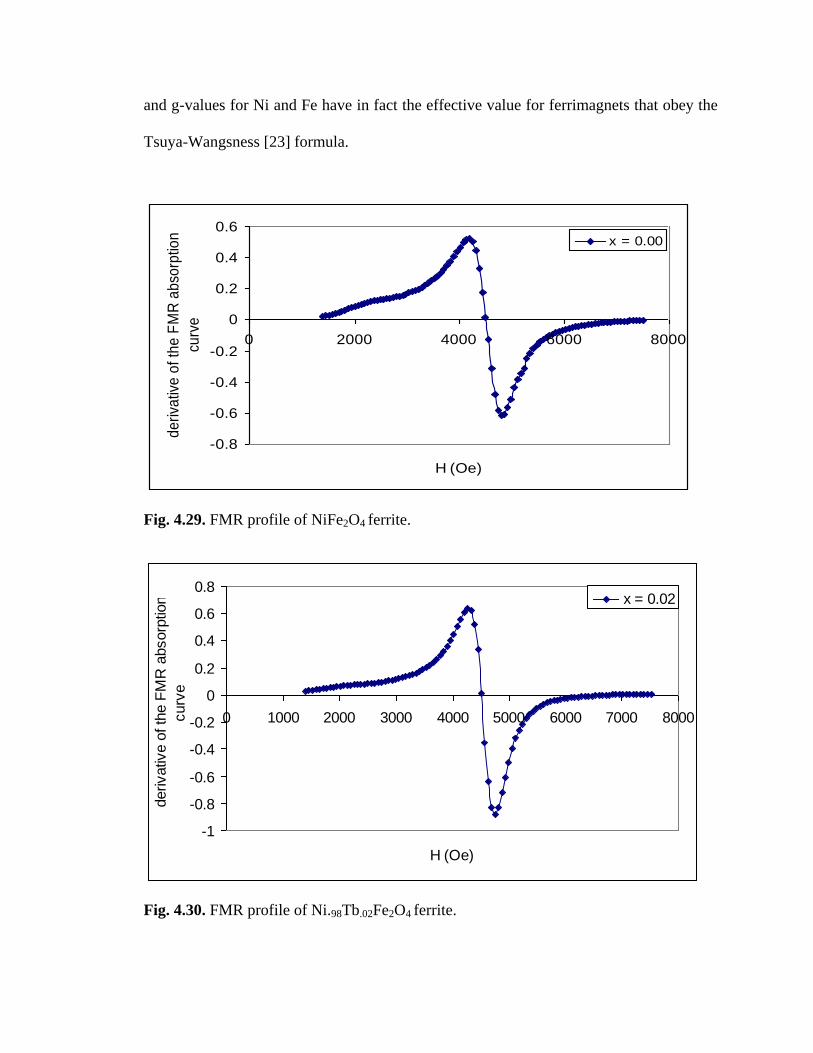
4.31 FMR profile of Ni.96Tb.04Fe2O4 ferrite 132
4.32 FMR profile of Ni.94Tb.06Fe2O4 ferrite 132
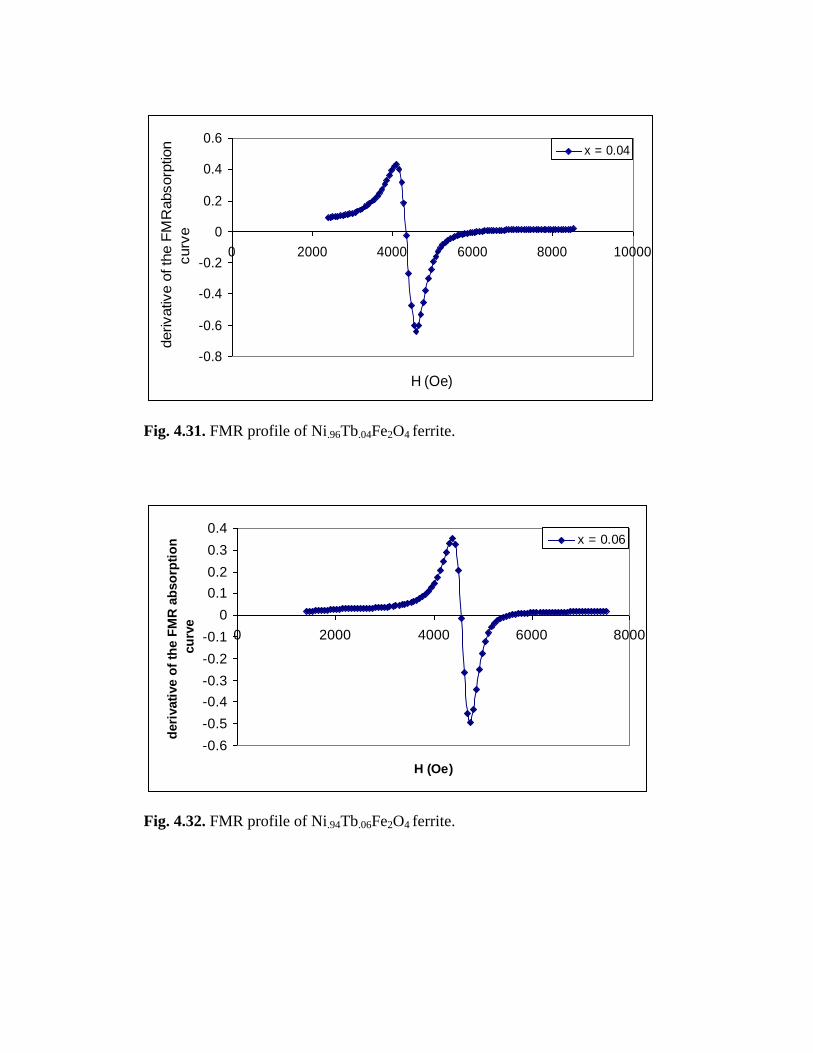
4.33 FMR profile of Ni.92Tb.08Fe2O4 ferrite 133
4.34 FMR profile of Ni.9Tb.1 Fe2O4 ferrite 133
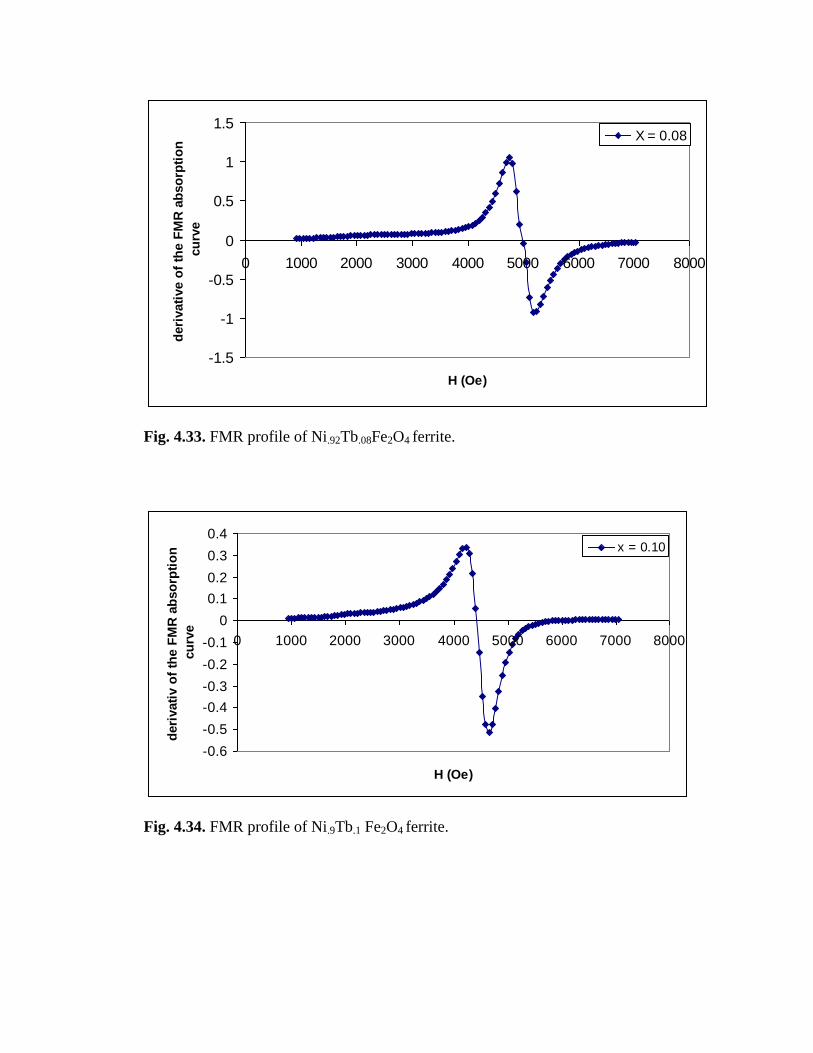
4.35 FMR profile of Ni.88Tb.12Fe2O4 ferrite 134
4.36 FMR profile of Ni.86Tb.14Fe2O4 ferrite 134
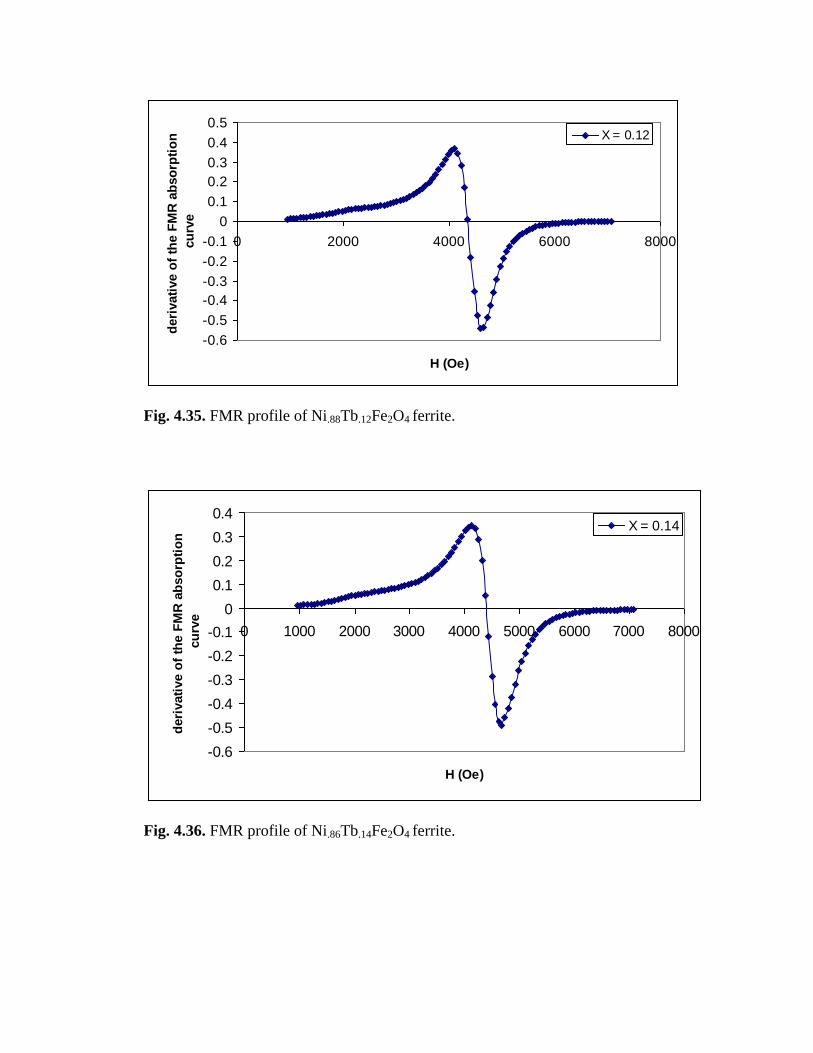
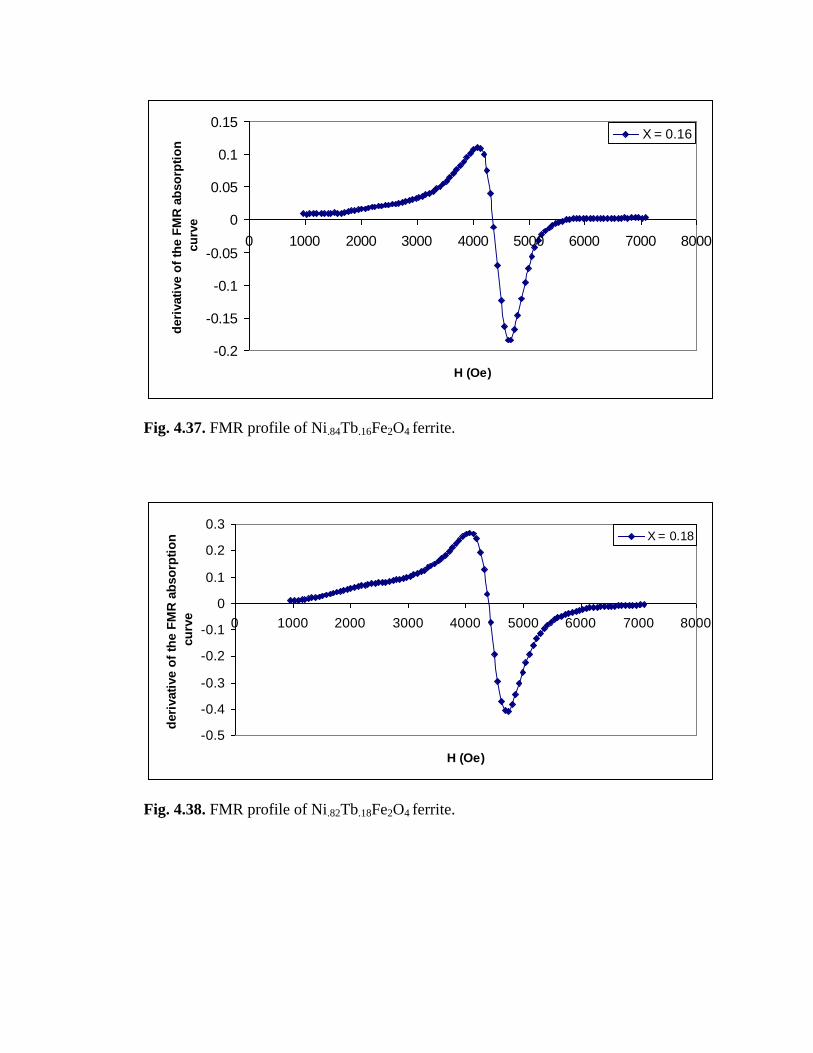
4.37 FMR profile of Ni.84Tb.16Fe2O4 ferrite 135
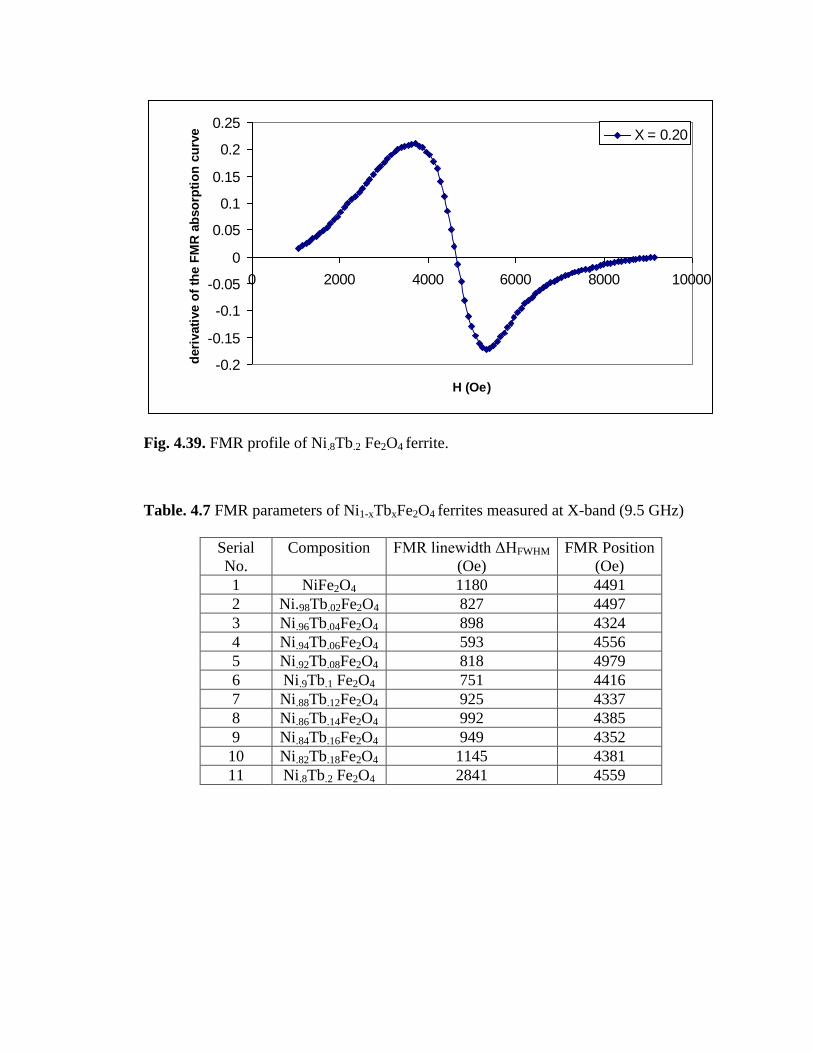
4.38 FMR profile of Ni.82Tb.18Fe2O4 ferrite 135
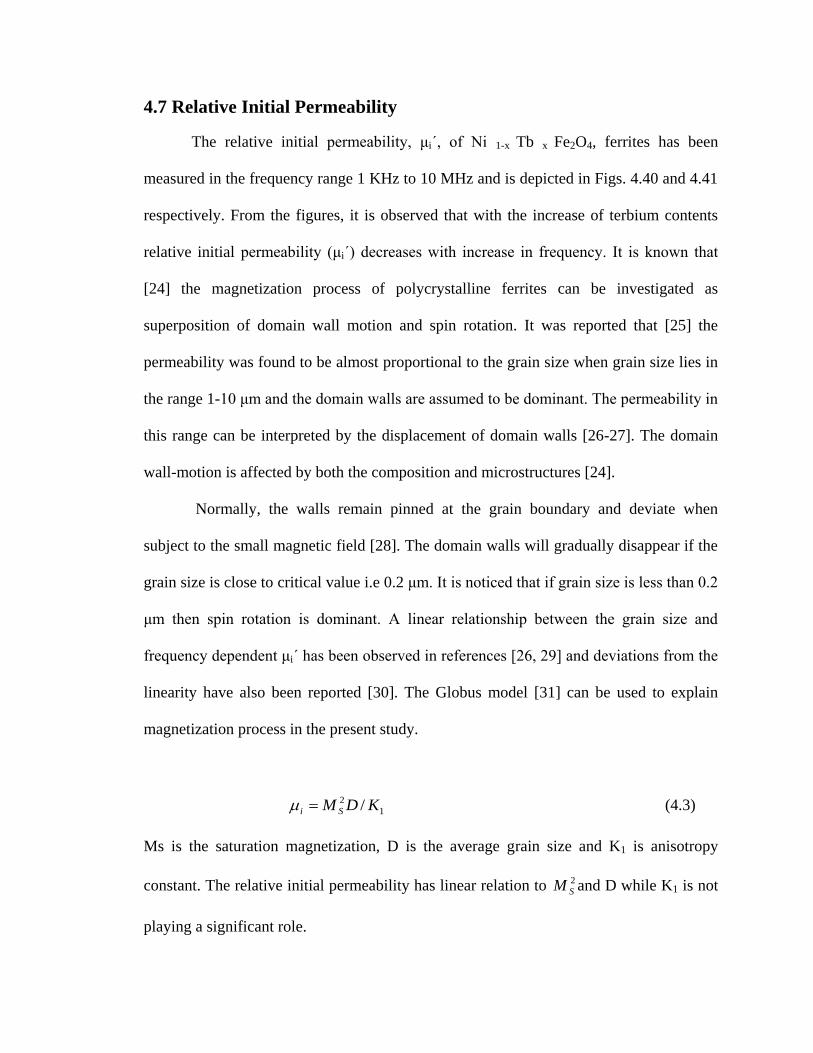
4.39 FMR profile of Ni.8Tb.2 Fe2O4 ferrite 136
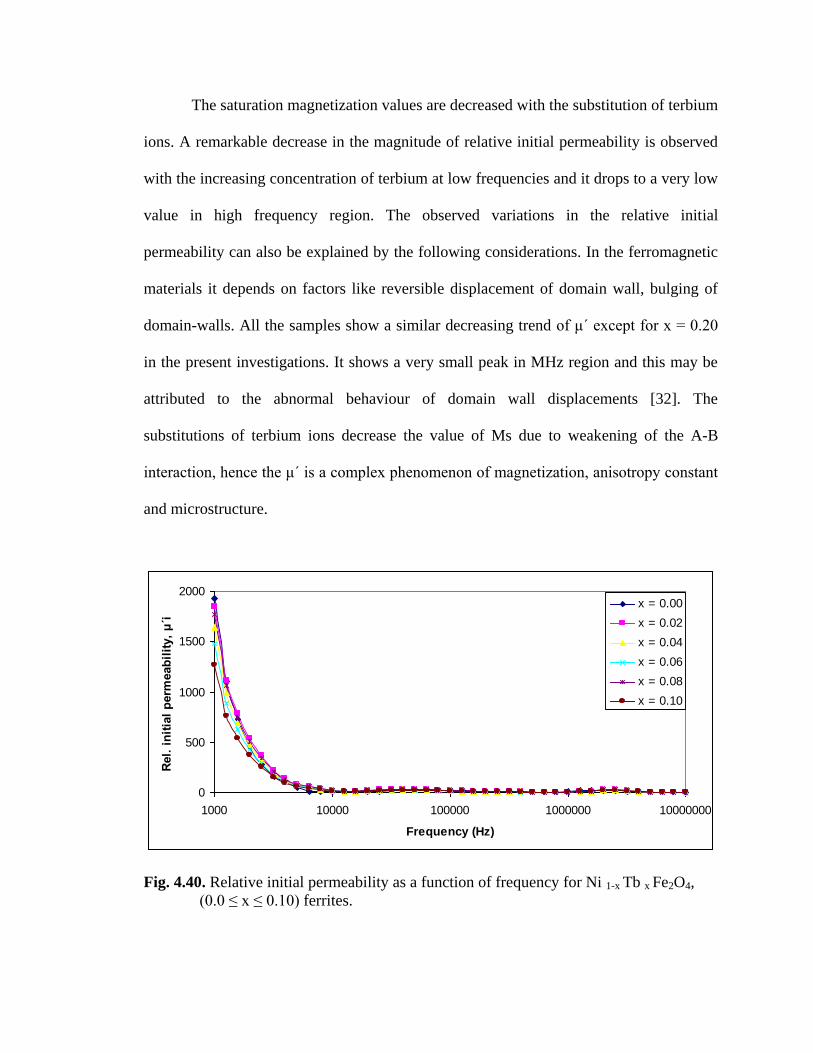
4.40 Relative initial permeability as a function of frequency for
Ni 1-x Tb x Fe2O4, (0.0 ≤ x ≤ 0.10) ferrites 138
4.41 Relative initial permeability as a function of frequency for
Ni 1-x Tb x Fe2O4, (0.12 ≤ x ≤ 0.2) ferrites 139
4.42 Loss factor as a function of frequency for Ni 1-x Tb x Fe2O4,
(0.0 ≤ x ≤ 0.10) ferrites 140
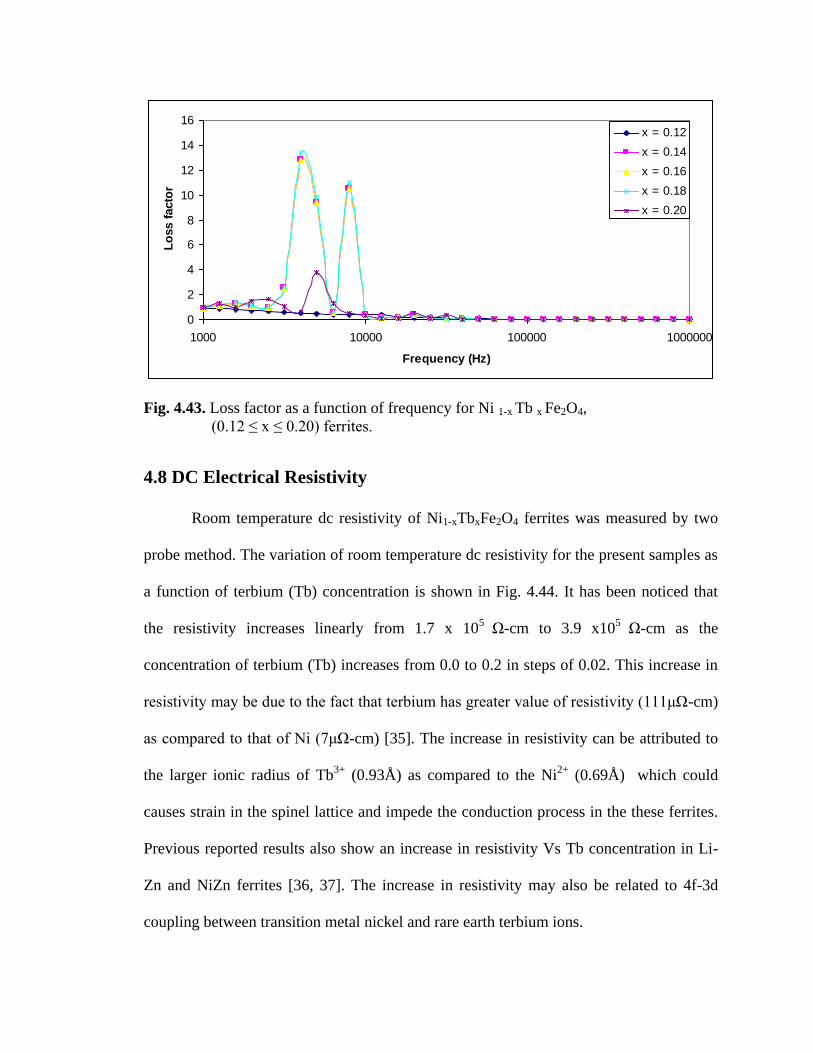
4.43 Loss factor as a function of frequency for Ni 1-x Tb x Fe2O4,
(0.12 ≤ x ≤ 0.20) ferrites 141
Page 16
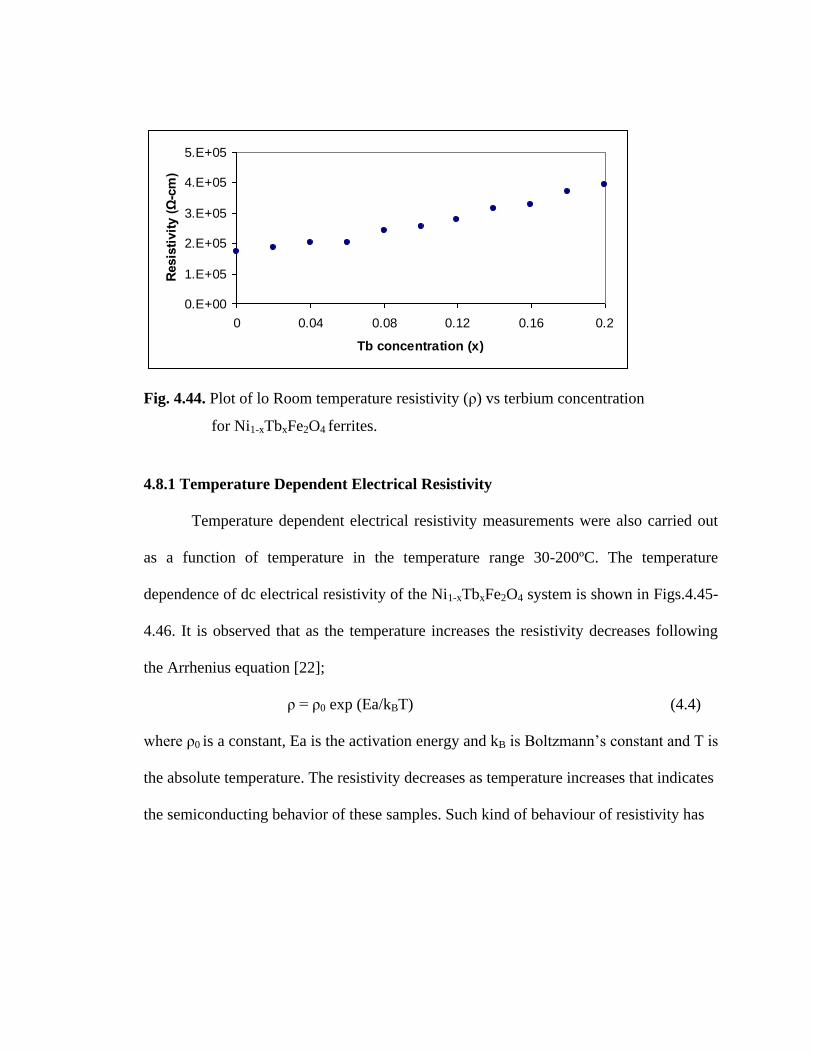
4.44 Plot of lo Room temperature resistivity (ρ) Vs terbium concentration
for Ni1-xTbxFe2O4 ferrites 142
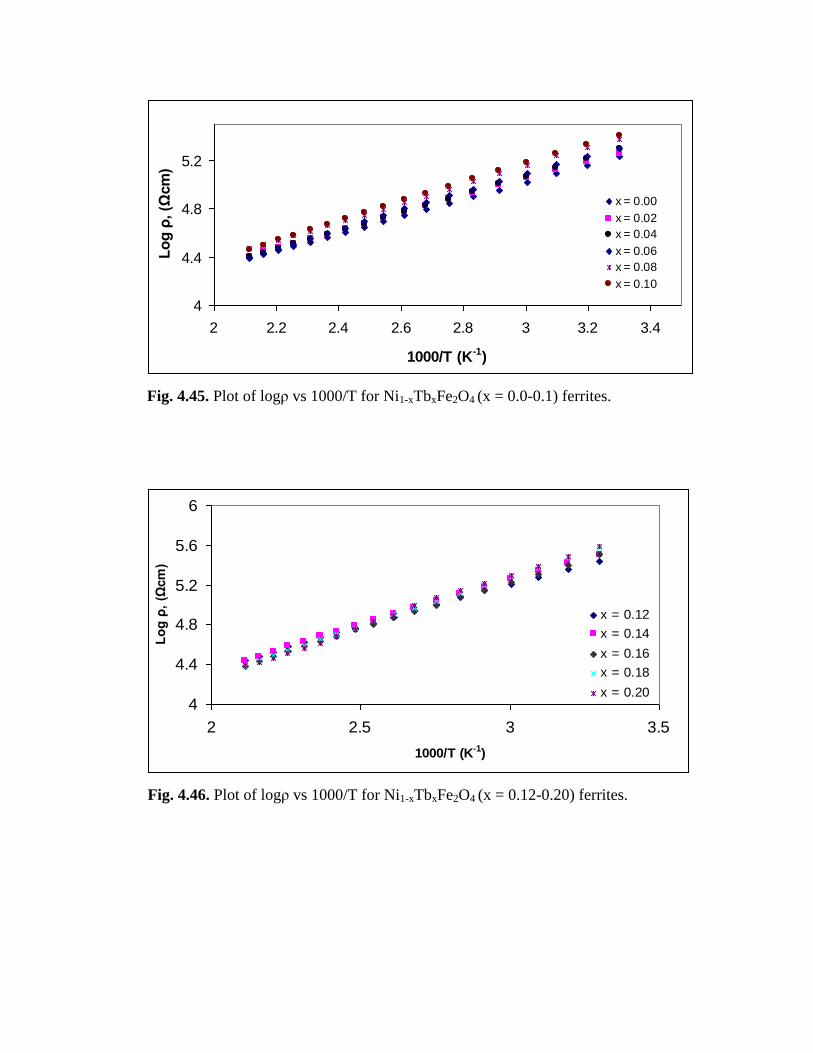
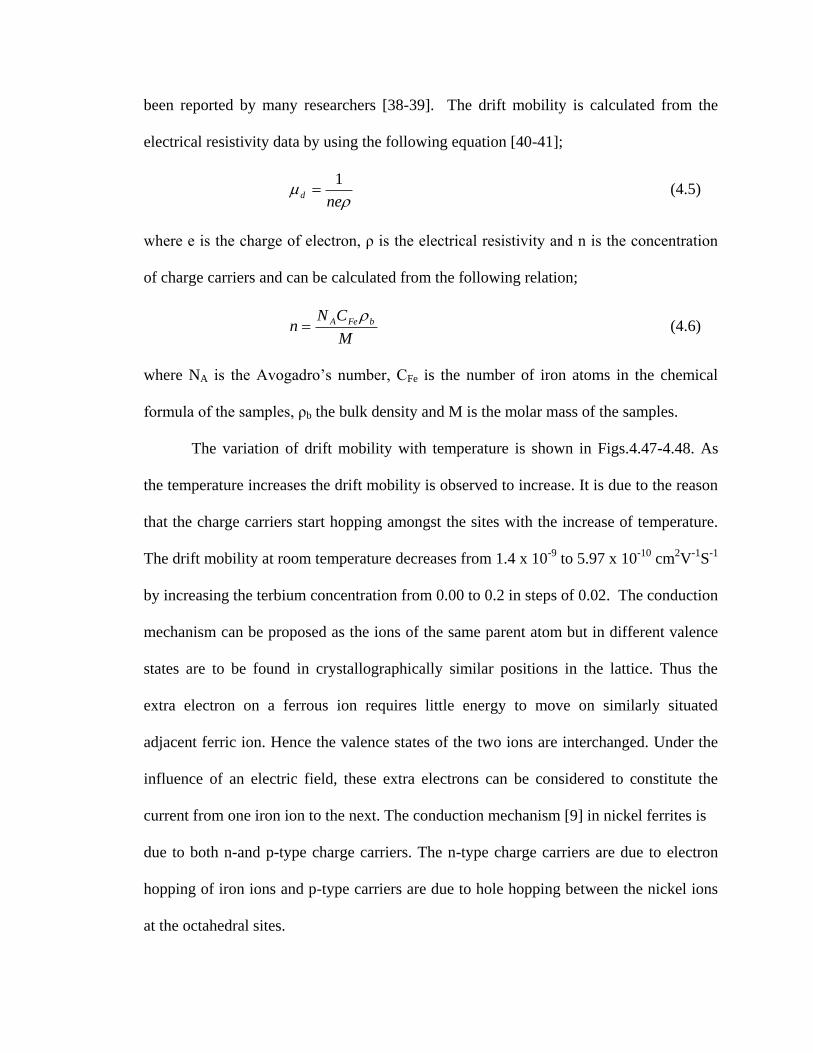
4.45 Plot of logρ Vs 1000/T for Ni1-xTbxFe2O4 (x = 0.0-0.1) ferrites 143
4.46 Plot of logρ Vs 1000/T for Ni1-xTbxFe2O4 (x = 0.12-0.20) ferrites 143
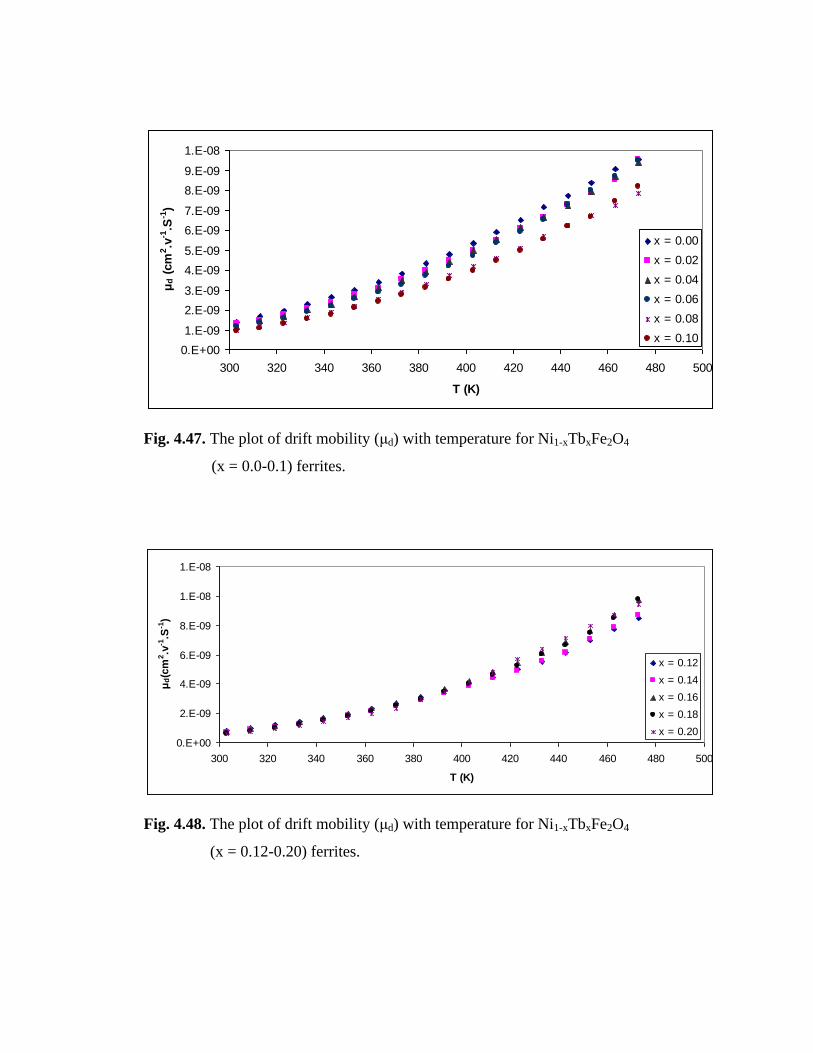
4.47 The plot of drift mobility (μd) with temperature for Ni1-xTbxFe2O4
(x = 0.0-0.1) ferrites 145
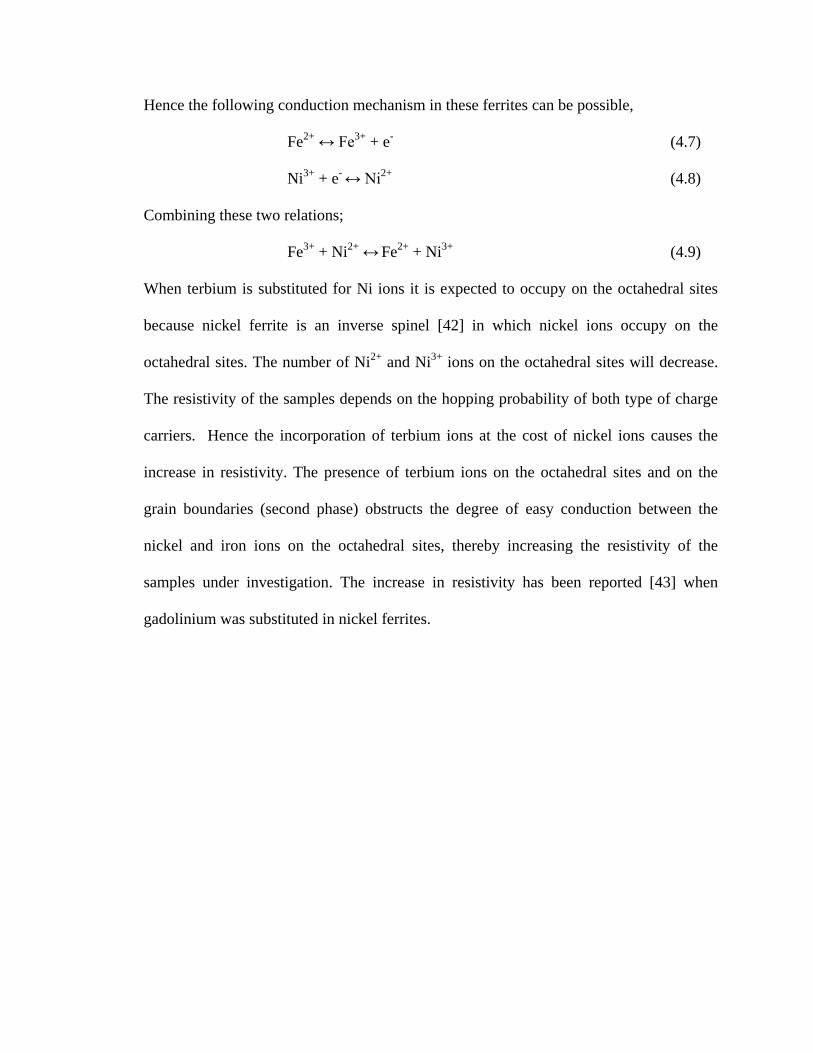
4.48 The plot of drift mobility (μd) with temperature for Ni1-xTbxFe2O4
(x = 0.12-0.20) ferrites 145
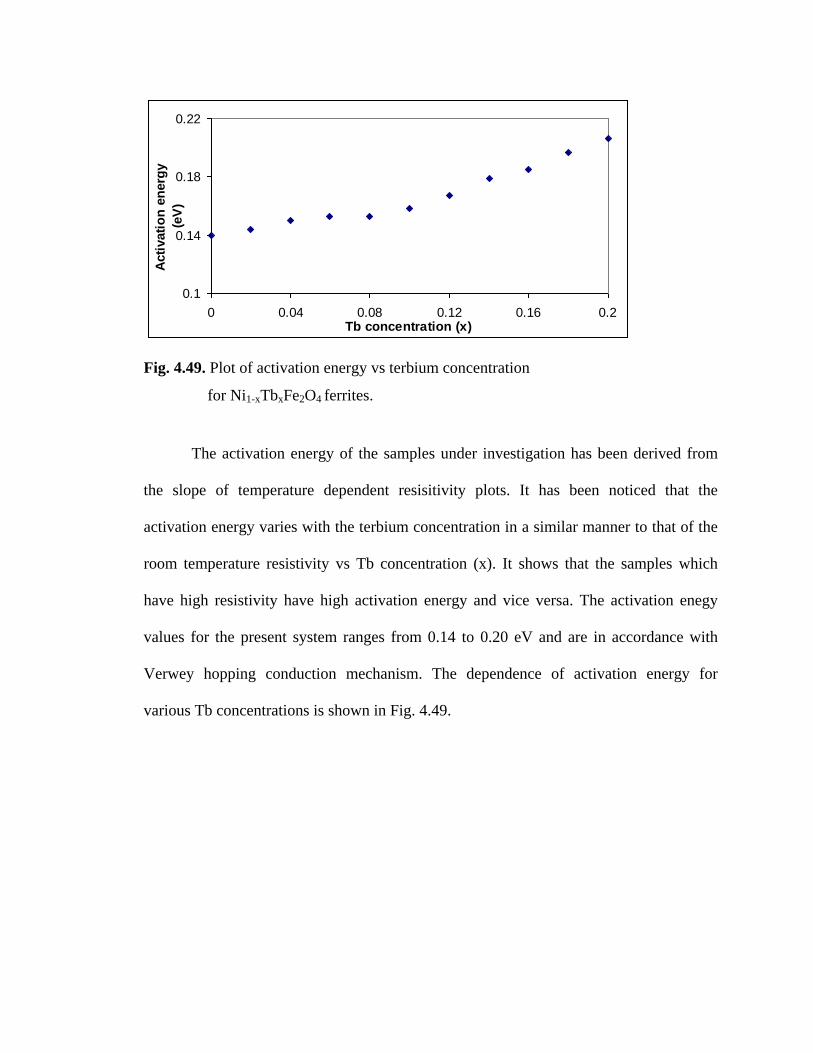
4.49 Plot of activation energy Vs terbium concentration for Ni1-xTbxFe2O4
ferrites 147
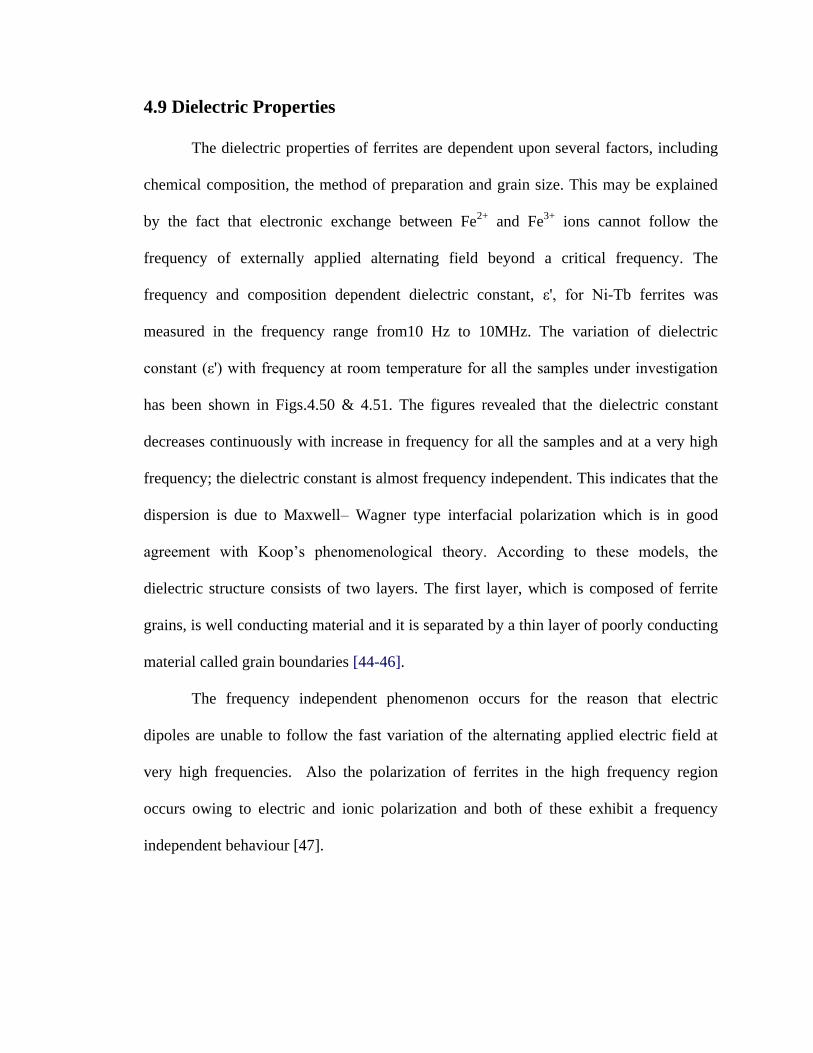
4.50 Dielectric constant (ε') Vs frequency of Ni1-xTbxFe2O4 (x = 0.0- 0.10)
at room temperature 149
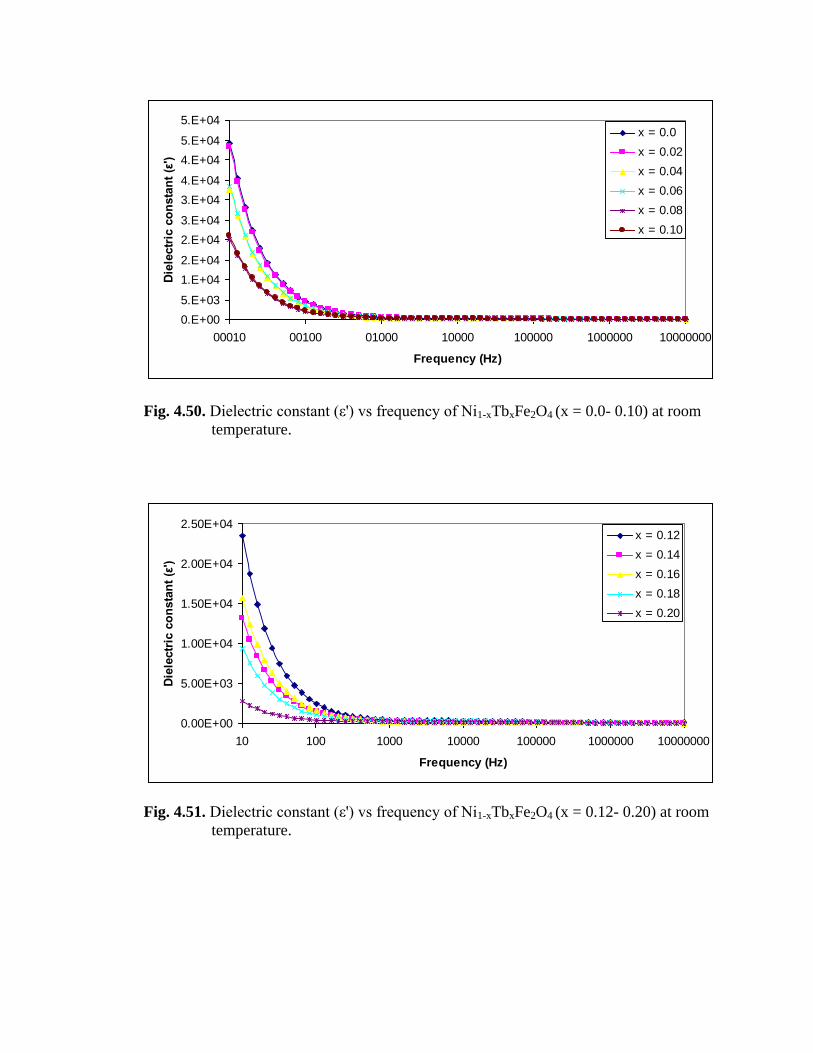
4.51 Dielectric constant (ε') Vs frequency of Ni1-xTbxFe2O4 (x = 0.12- 0.20)
at room Temperature 149
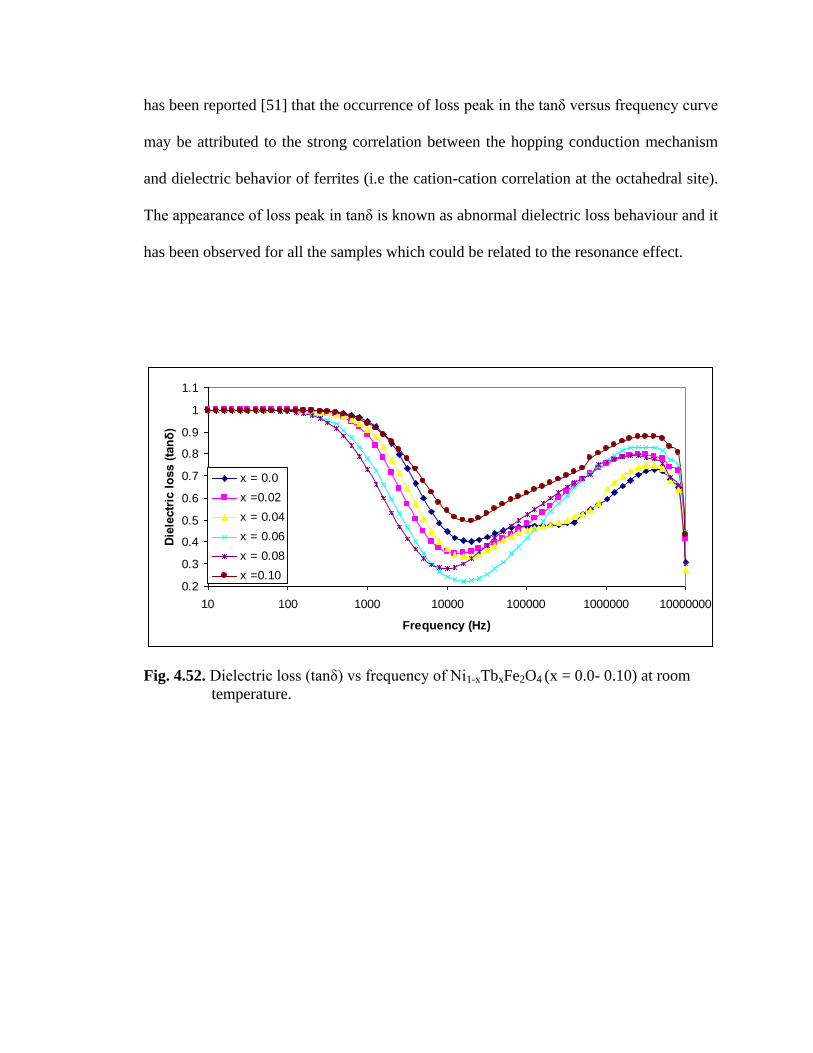
4.52 Dielectric loss (tanδ) Vs frequency of Ni1-xTbxFe2O4 (x = 0.0- 0.10)
at room Temperature 151
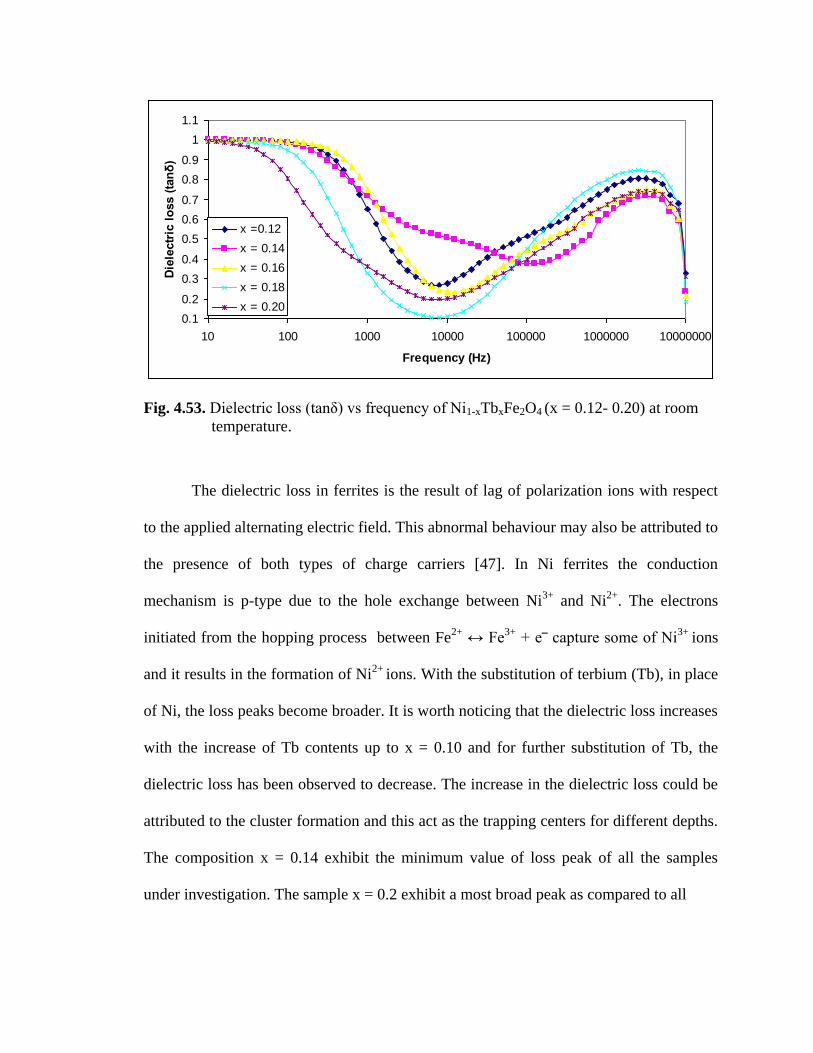
4.53 Dielectric loss (tanδ) Vs frequency of Ni1-xTbxFe2O4 (x = 0.12- 0.20)
at room temperature 152
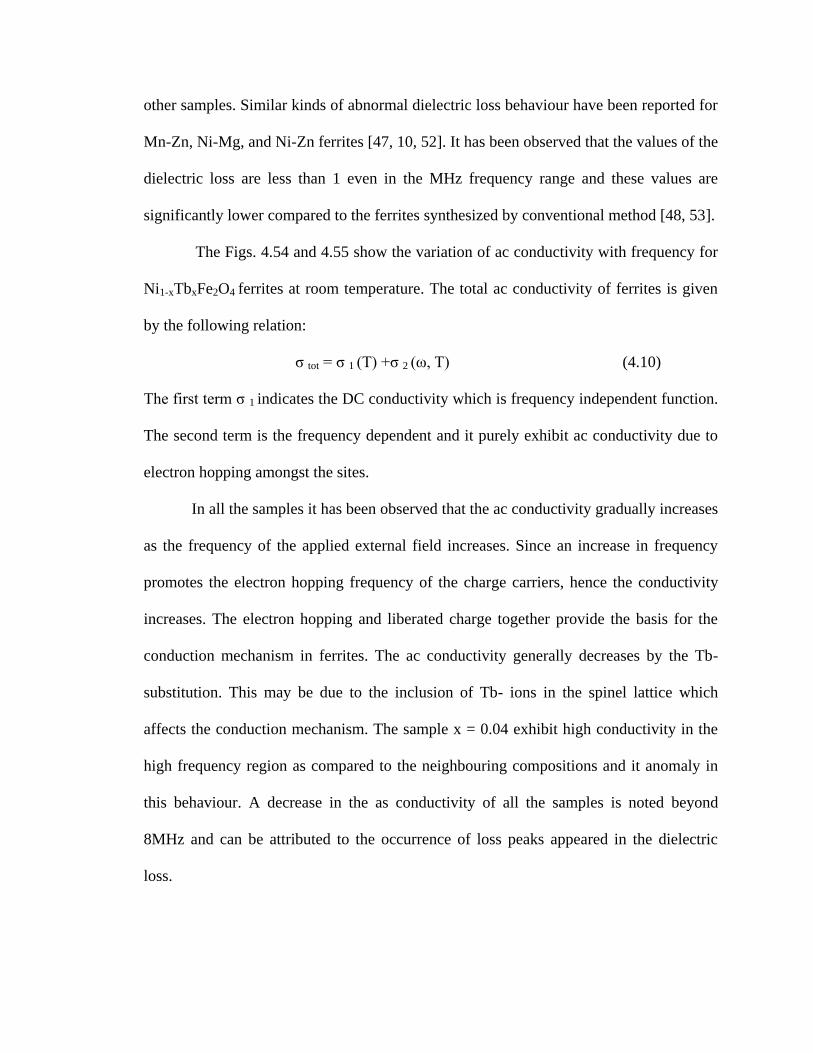
4.54 The variation of ac conductivity with frequency for Ni1-xTbxFe2O4
(x = 0.0- 0.10) Ferrites 154
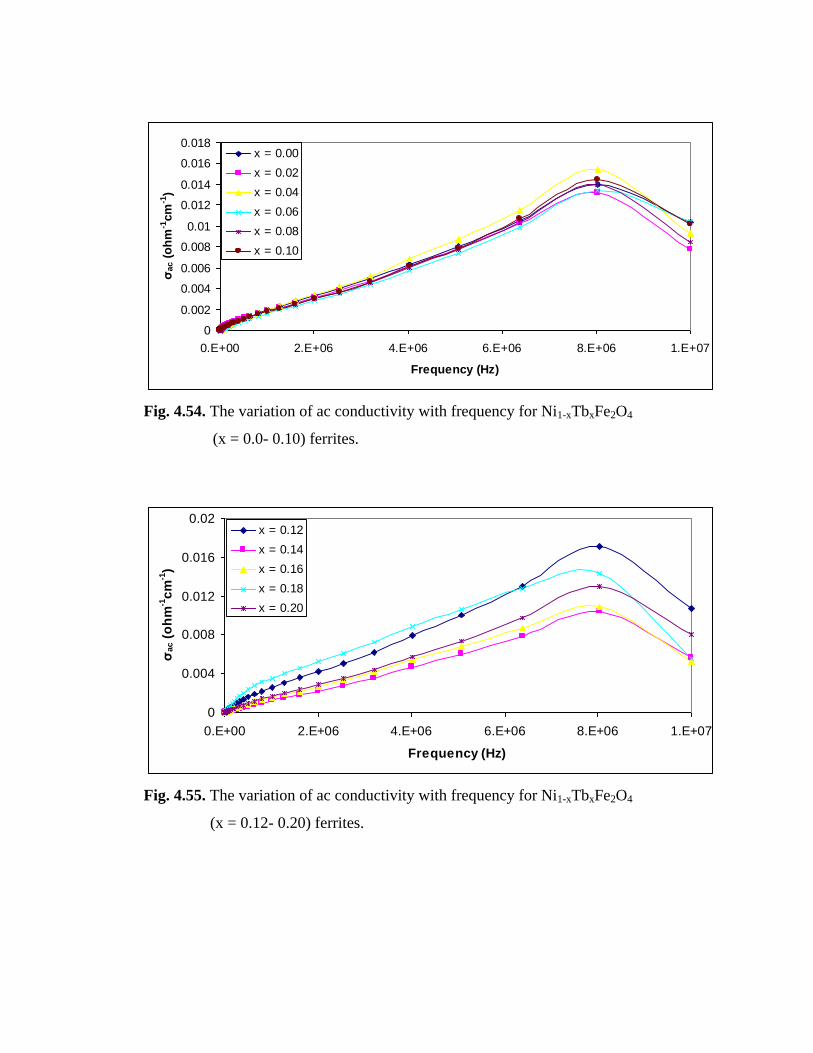
4.55 The variation of ac conductivity with frequency for Ni1-xTbxFe2O4
(x = 0.12- 0.20) ferrites 154
Page 17
4.56 X-ray diffraction patterns for Mg1-xTbxFe2O4 ferrites
(x = 0.0, 0.02, 0.04, 0.06, 0.08) 156
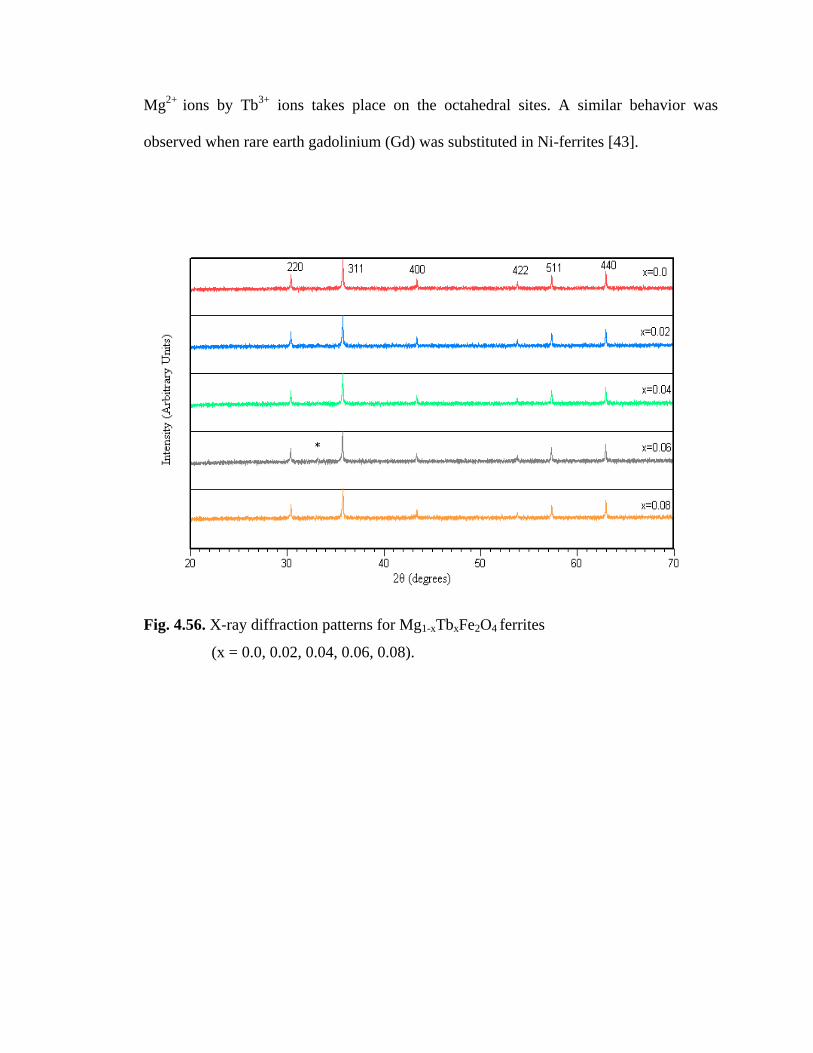
4.57 X-ray diffraction patterns for Mg1-xTbxFe2O4 ferrites
(x = 0.10, 0.12, 0.14, 0.16, 0.18, 0.20) 158
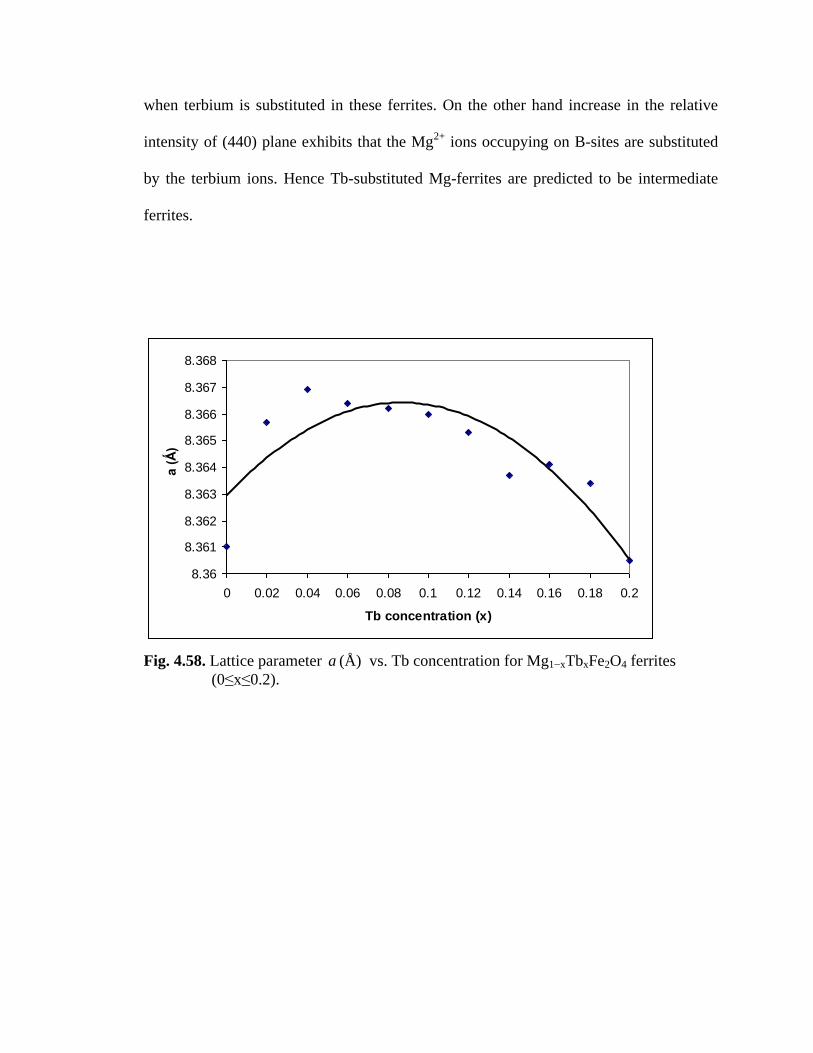
4.58 Lattice parameter a (Å) Vs. Tb concentration for Mg1−xTbxFe2O4
Ferrites (0≤x≤0.2) 159
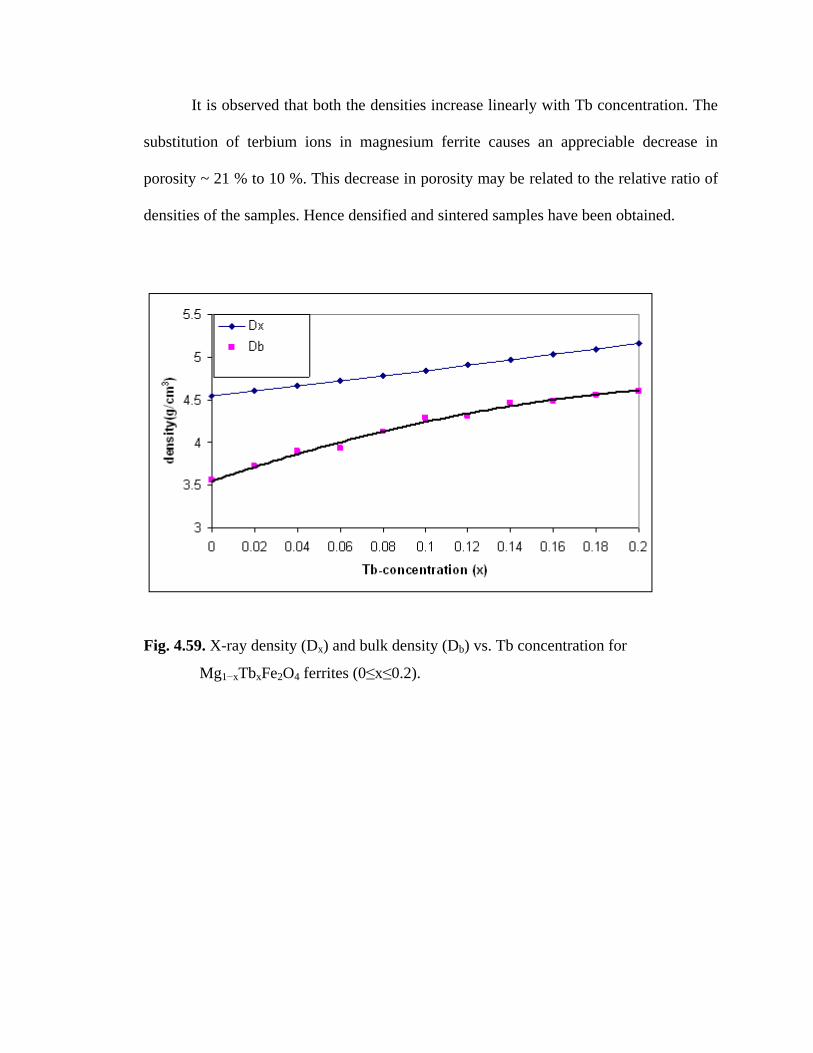
4.59 X-ray density (Dx) and bulk density (Db) Vs. Tb concentration for
Mg1−xTbxFe2O4 ferrites (0≤x≤0.2) 163
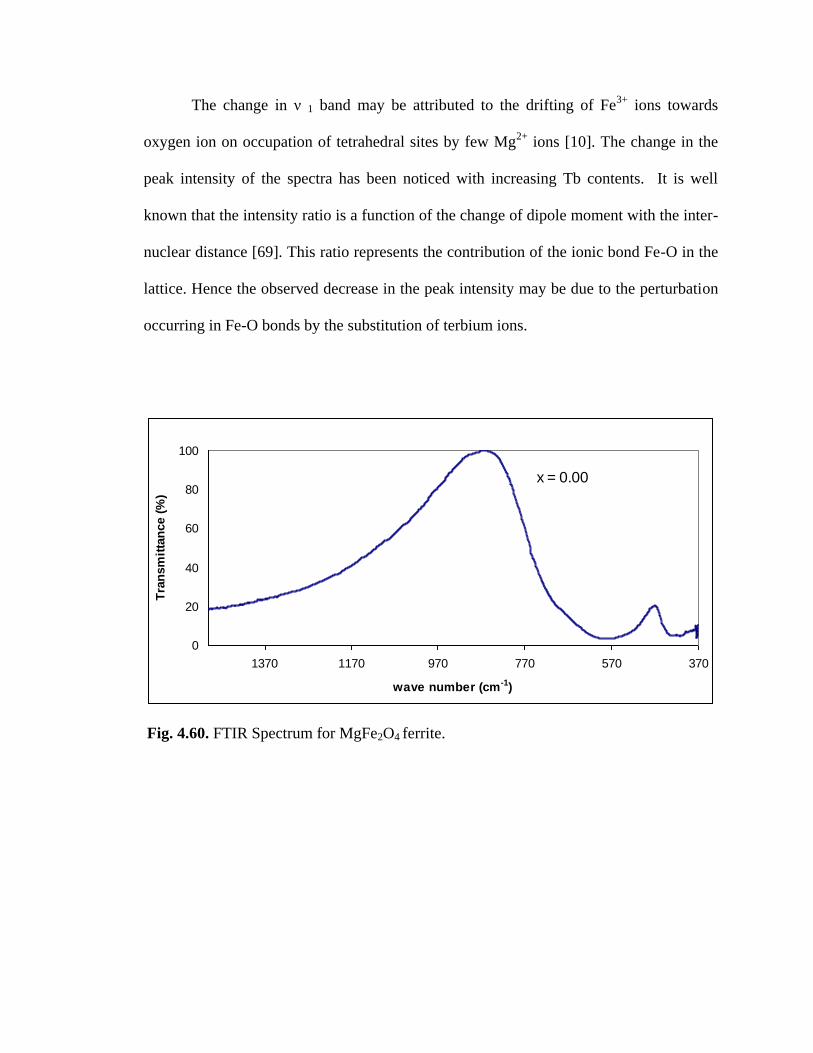
4.60 FTIR Spectrum for MgFe2O4 ferrite 165
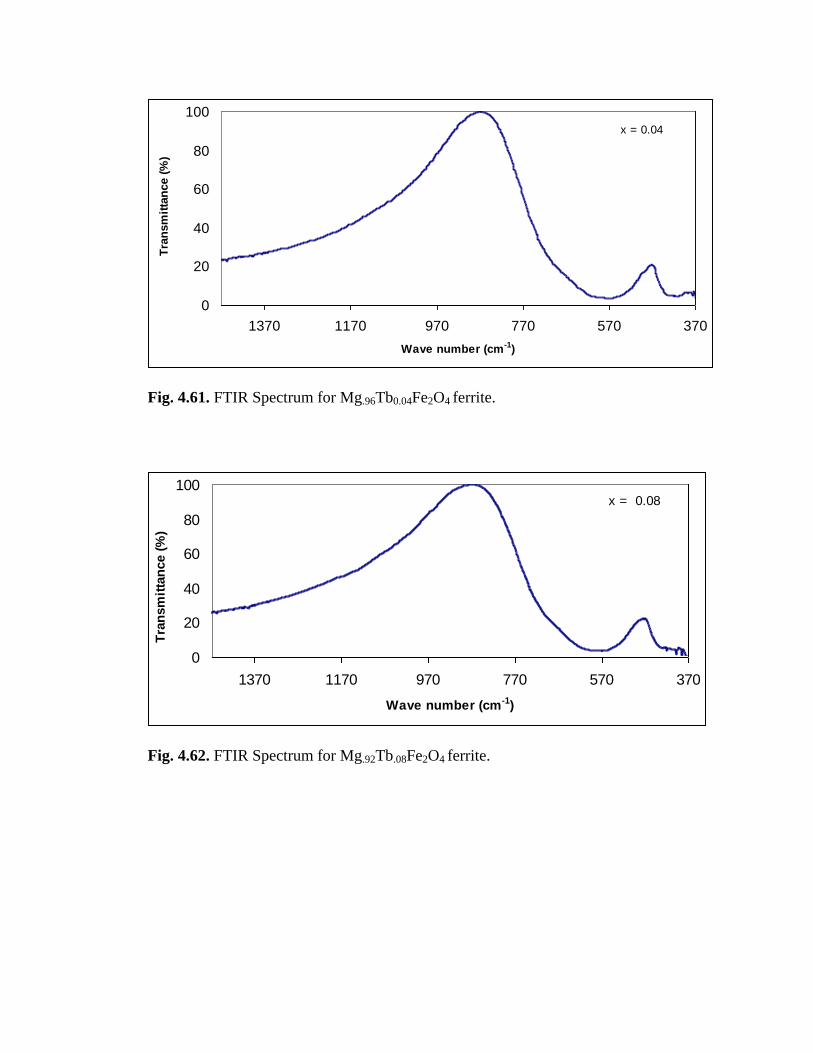
4.61 FTIR Spectrum for Mg.96Tb0.04Fe2O4 ferrite 166
4.62 FTIR Spectrum for Mg.92Tb.08Fe2O4 ferrite 166
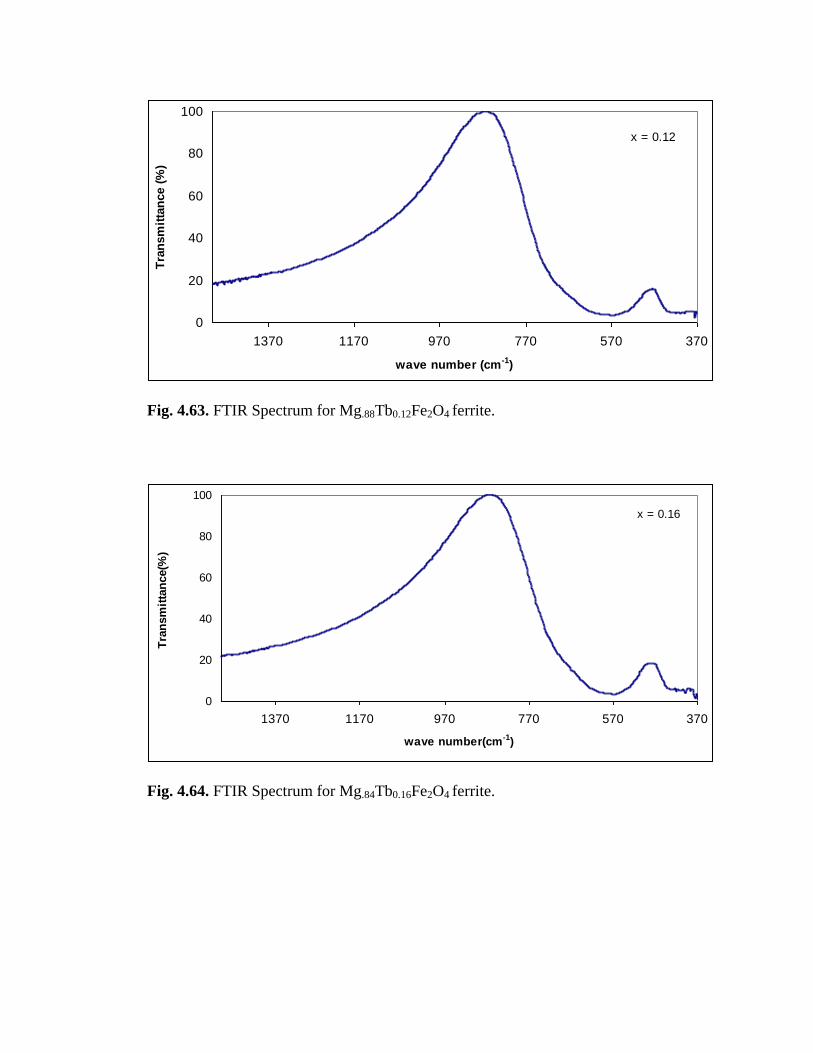
4.63 FTIR Spectrum for Mg.88Tb0.12Fe2O4 ferrite 167
4.64 FTIR Spectrum for Mg.84Tb0.16Fe2O4 ferrite 167
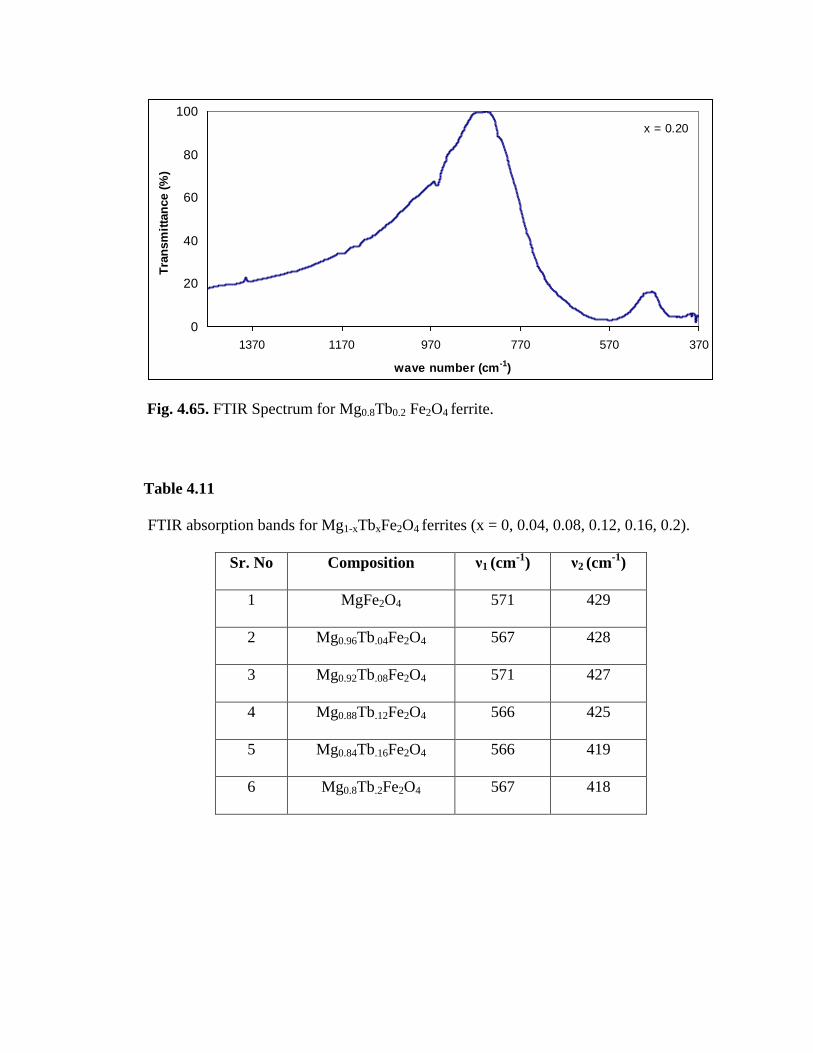
4.65 FTIR Spectrum for Mg0.8Tb0.2 Fe2O4 ferrite 168
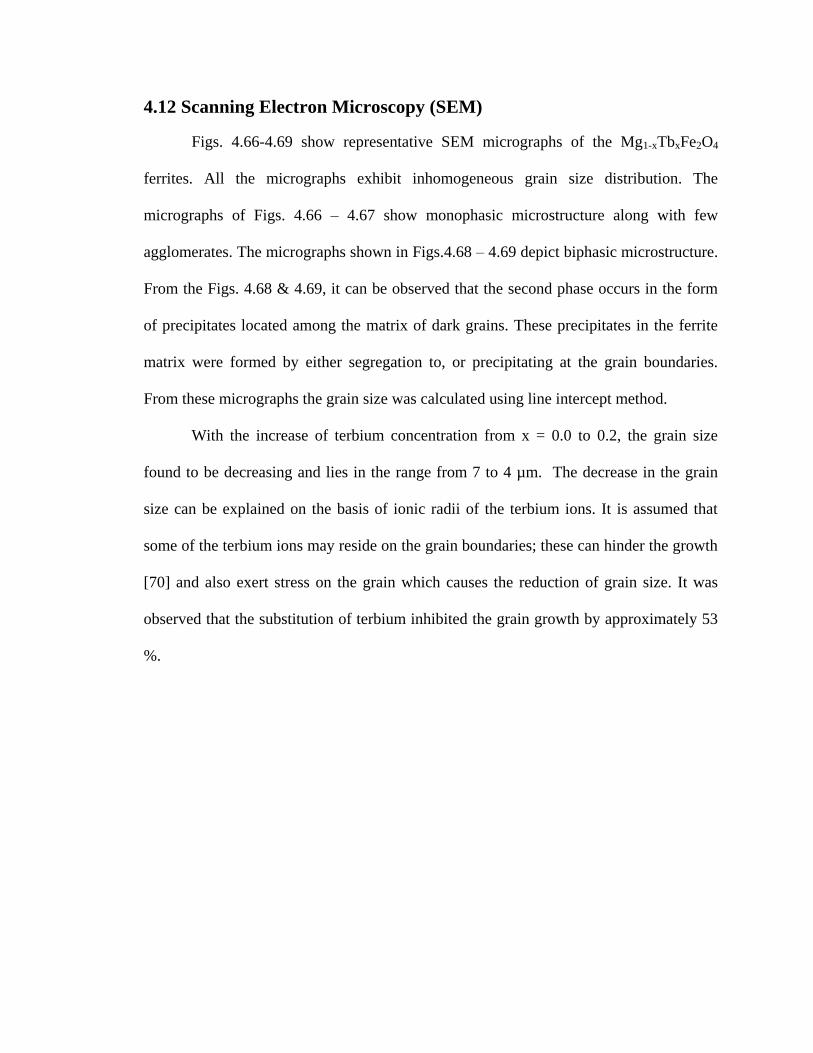
4.66 SEM micrograph of Mg 1-x Tb x Fe2O4, (x = 0.00) ferrite 170
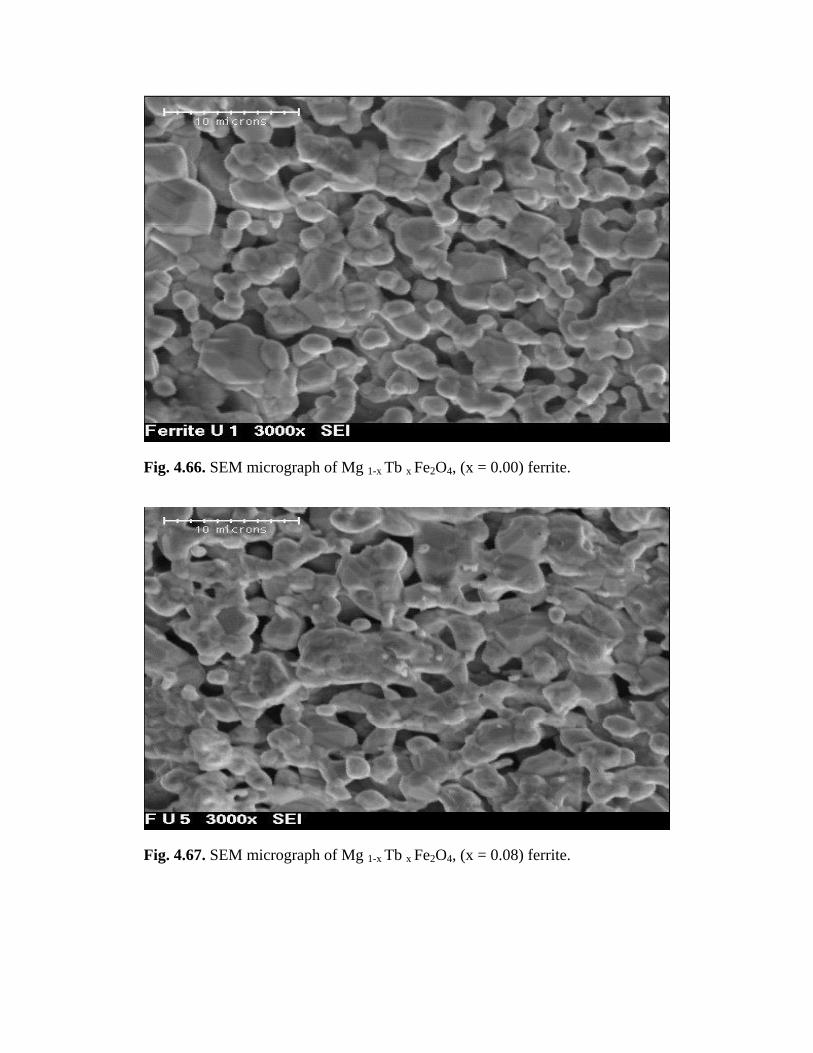
4.67 SEM micrograph of Mg 1-x Tb x Fe2O4, (x = 0.08) ferrite 170
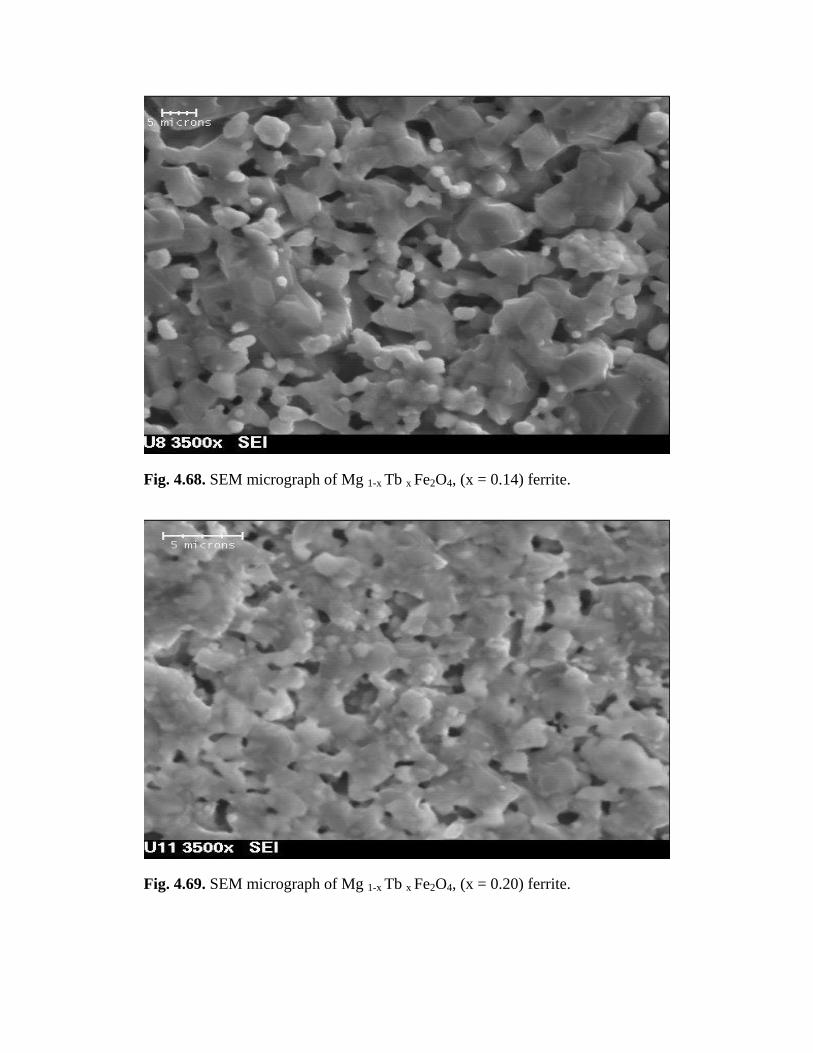
4.68 SEM micrograph of Mg 1-x Tb x Fe2O4, (x = 0.14) ferrite 171
4.69 SEM micrograph of Mg 1-x Tb x Fe2O4, (x = 0.20) ferrite 171
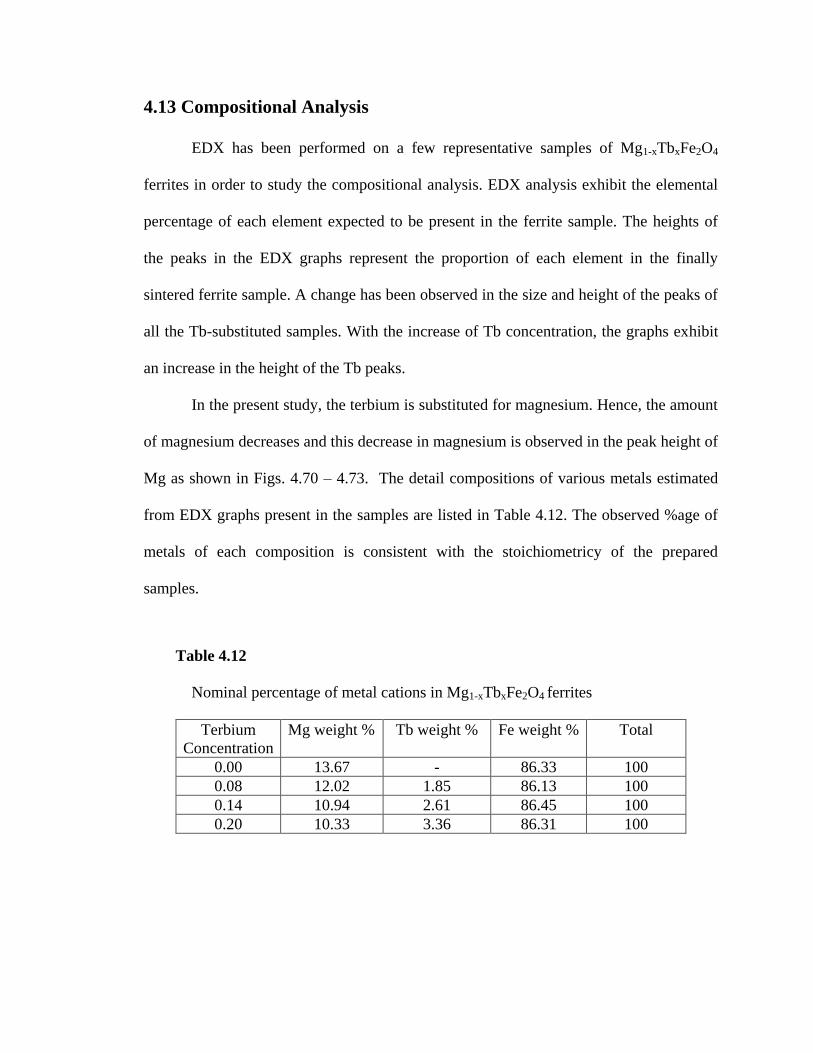
4.70 EDX of the MgFe2O4 ferrite 173
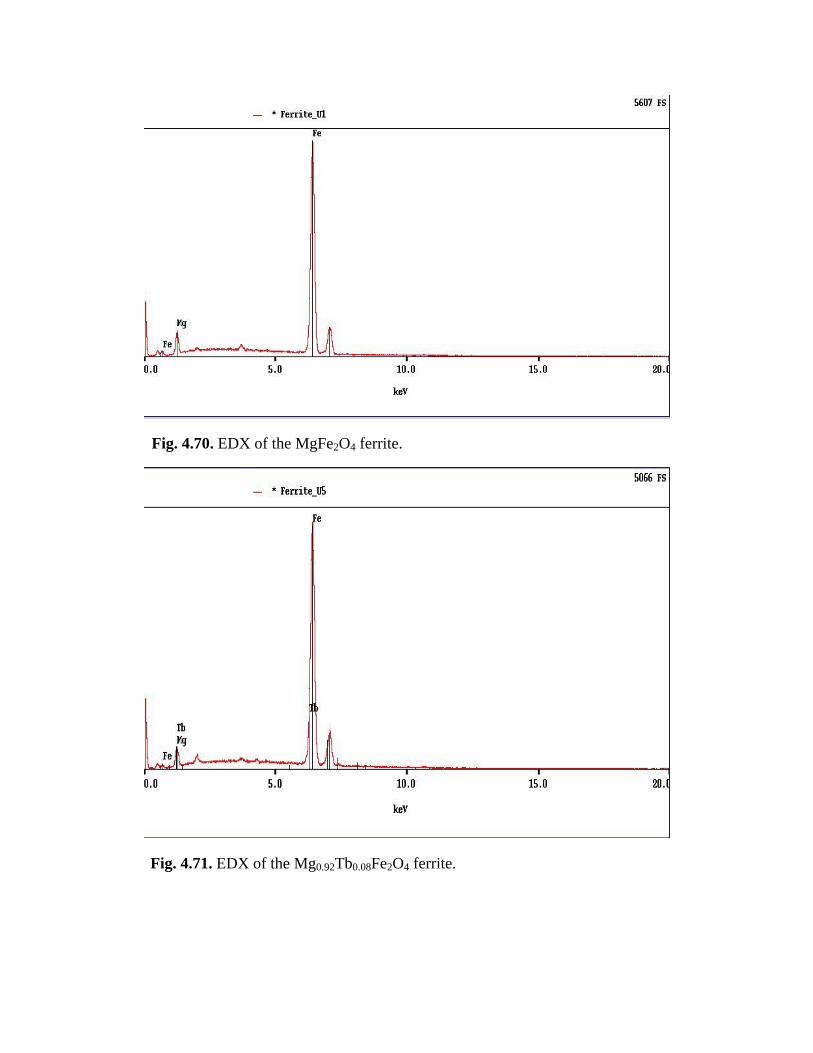
4.71 EDX of the Mg0.92Tb0.08Fe2O4 ferrite 173
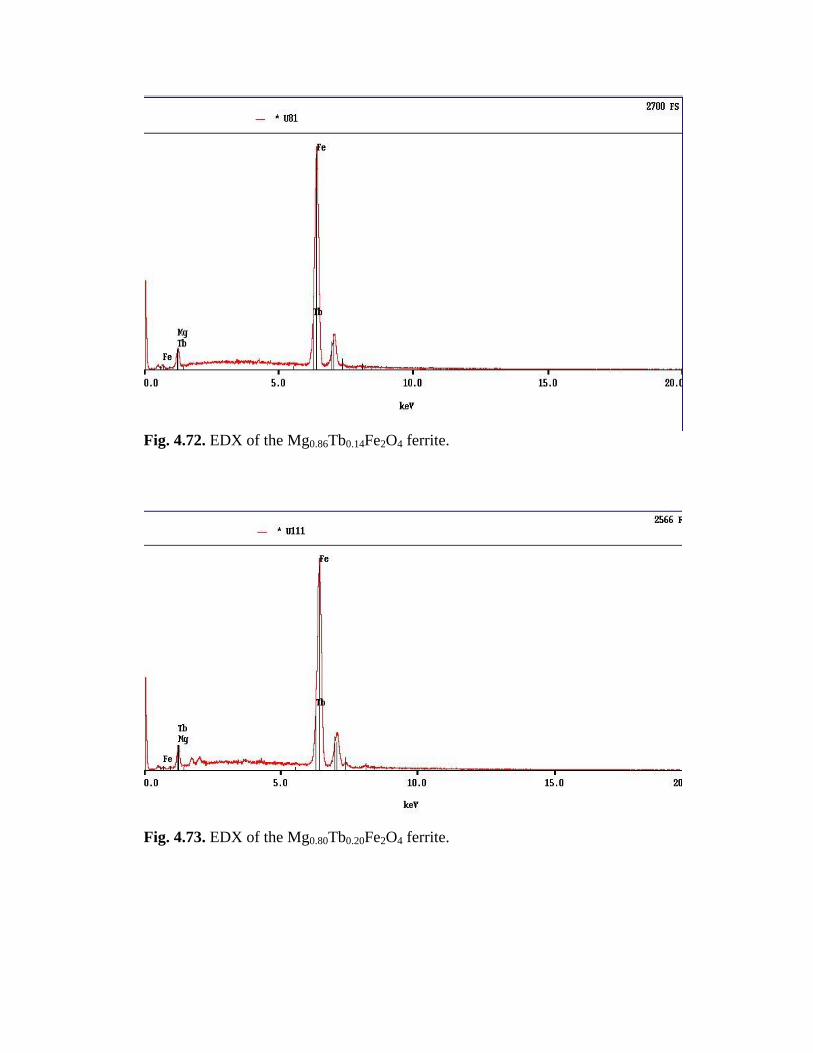
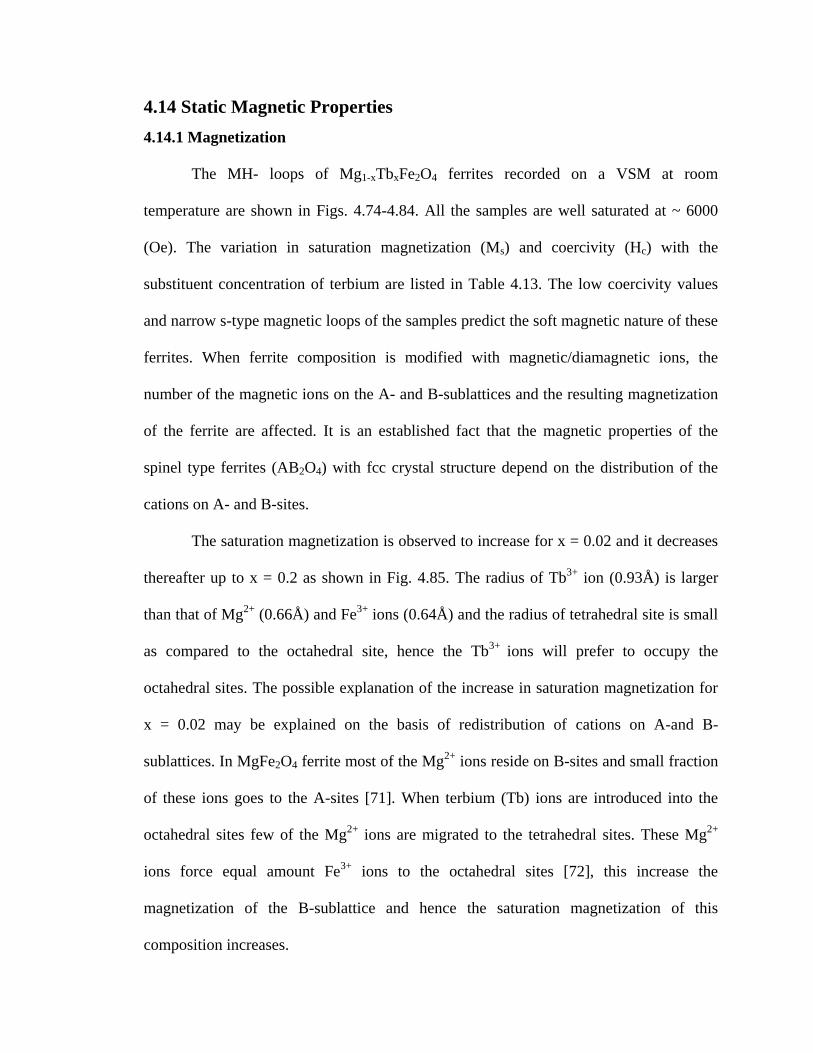
4.72 EDX of the Mg0.86Tb0.14Fe2O4 ferrite 174
4.73 EDX of the Mg0.80Tb0.20Fe2O4 ferrite 174
Page 18
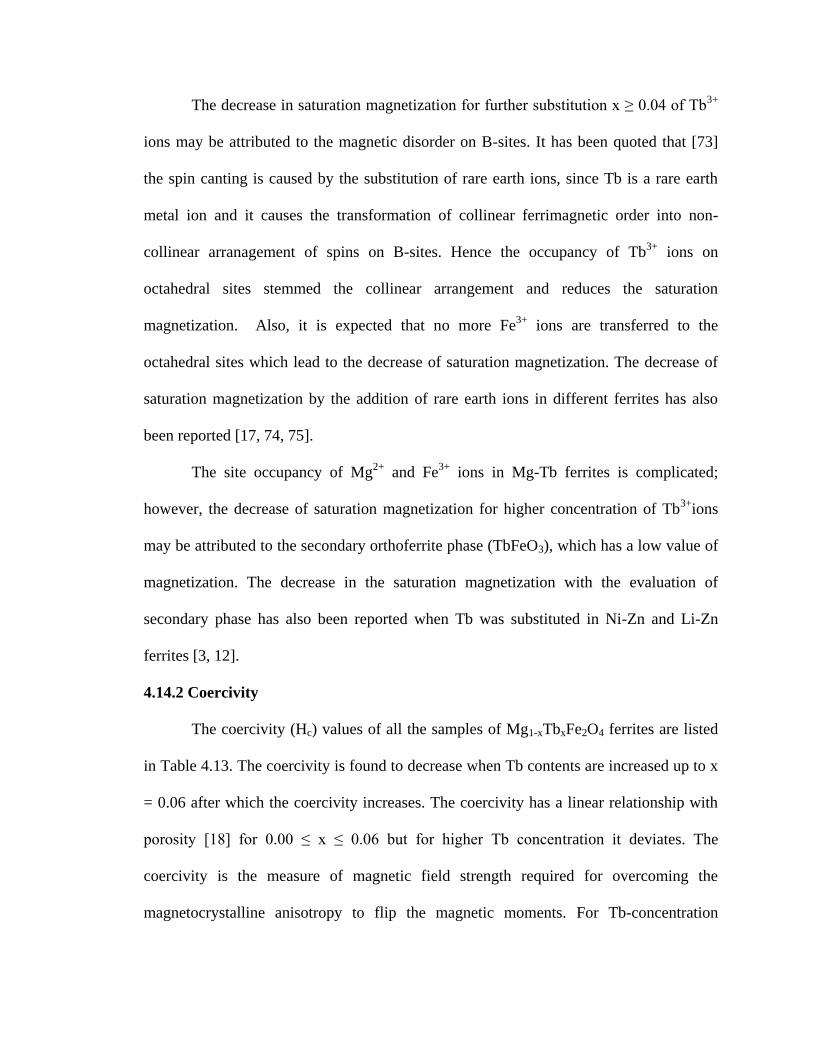
4.74 The MH-Loop for MgFe2O4 ferrite 178
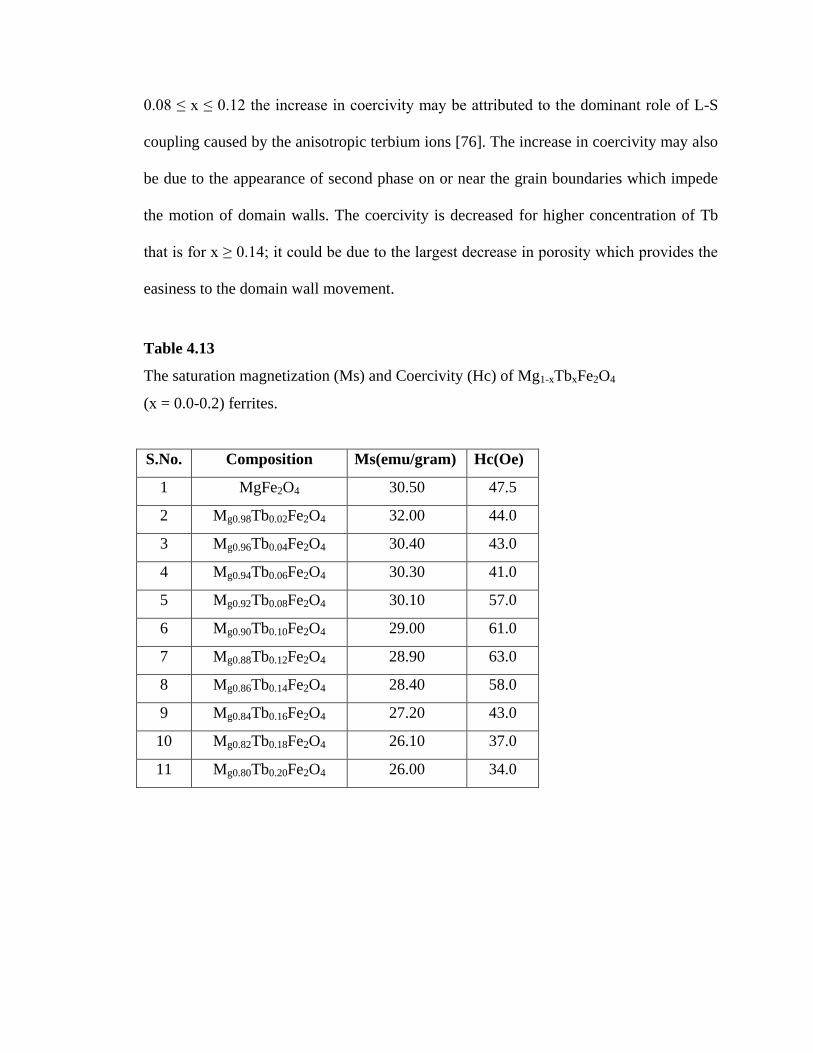
4.75 The MH-Loop for Mg0.98Tb0.02Fe2O4 ferrite 178
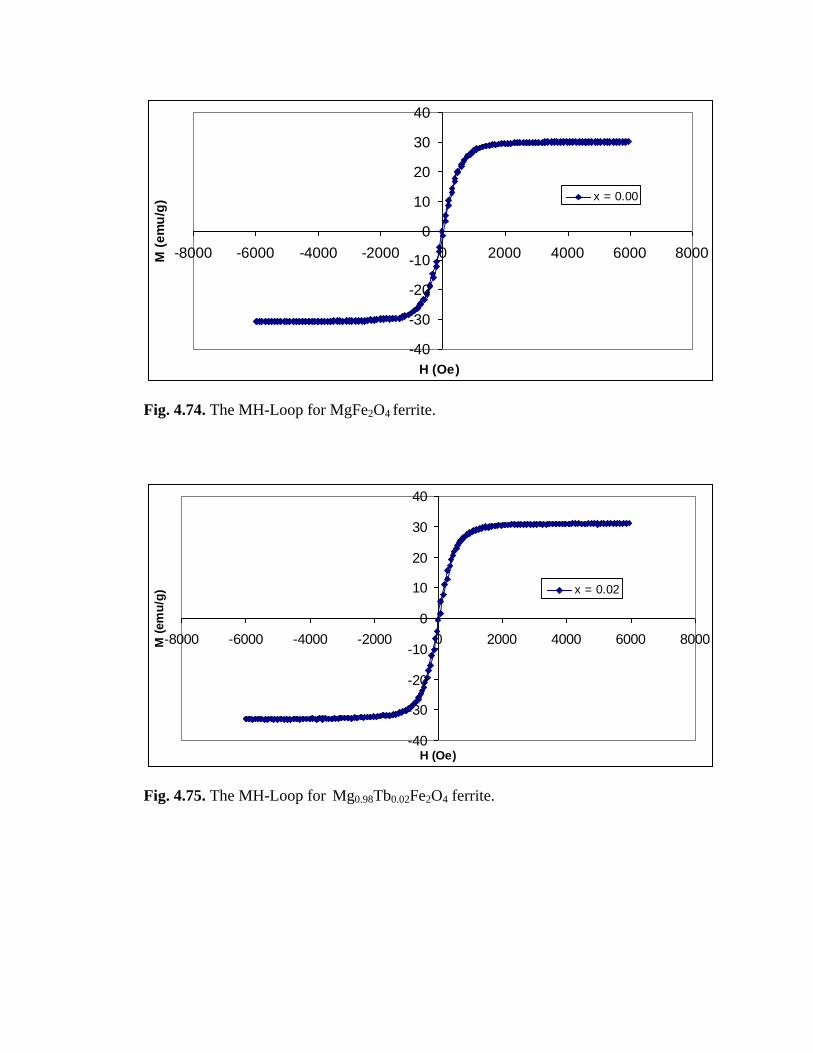
4.76 The MH-Loop for Mg0.96Tb0.04Fe2O4 ferrite 179
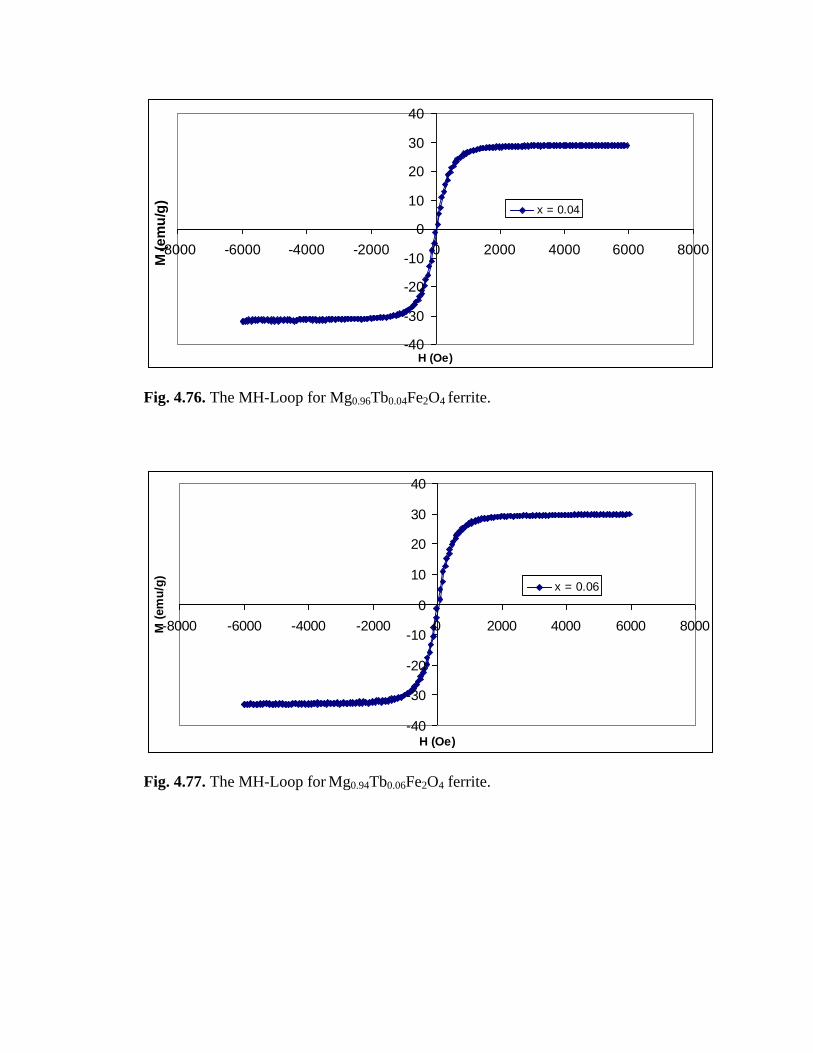
4.77 The MH-Loop for Mg0.94Tb0.06Fe2O4 ferrite 179
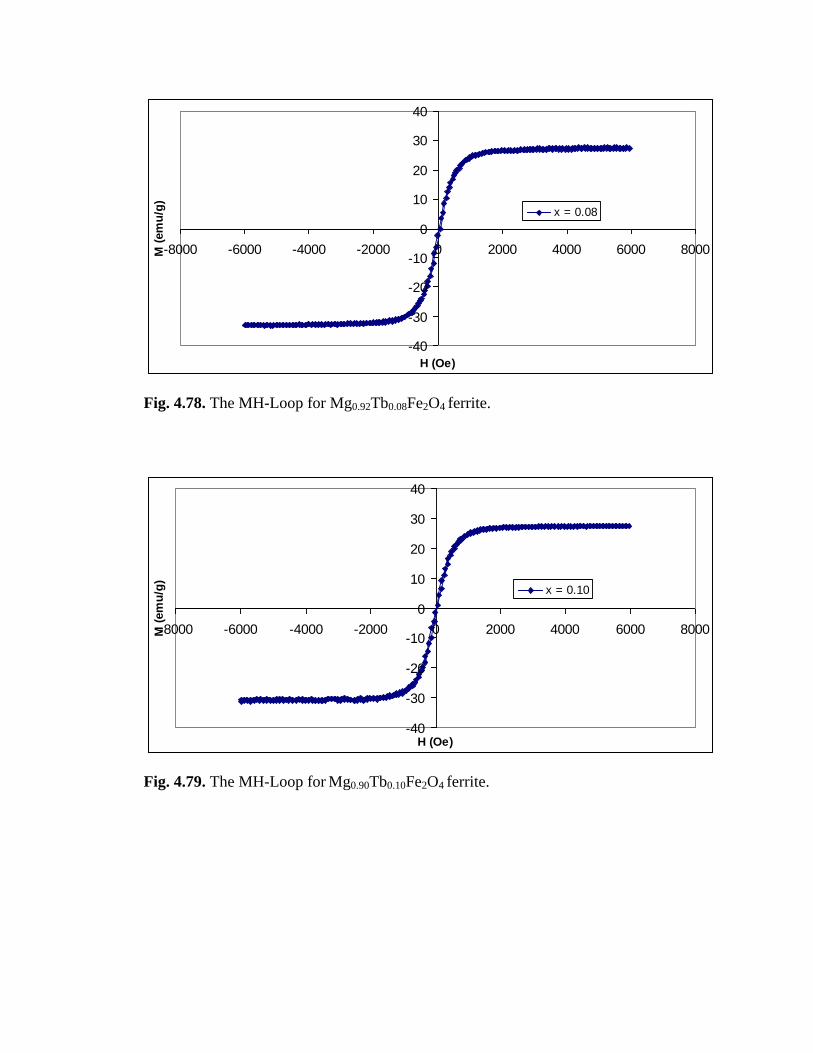
4.78 The MH-Loop for Mg0.92Tb0.08Fe2O4 ferrite 180
4.79 The MH-Loop for Mg0.90Tb0.10Fe2O4 ferrite 180
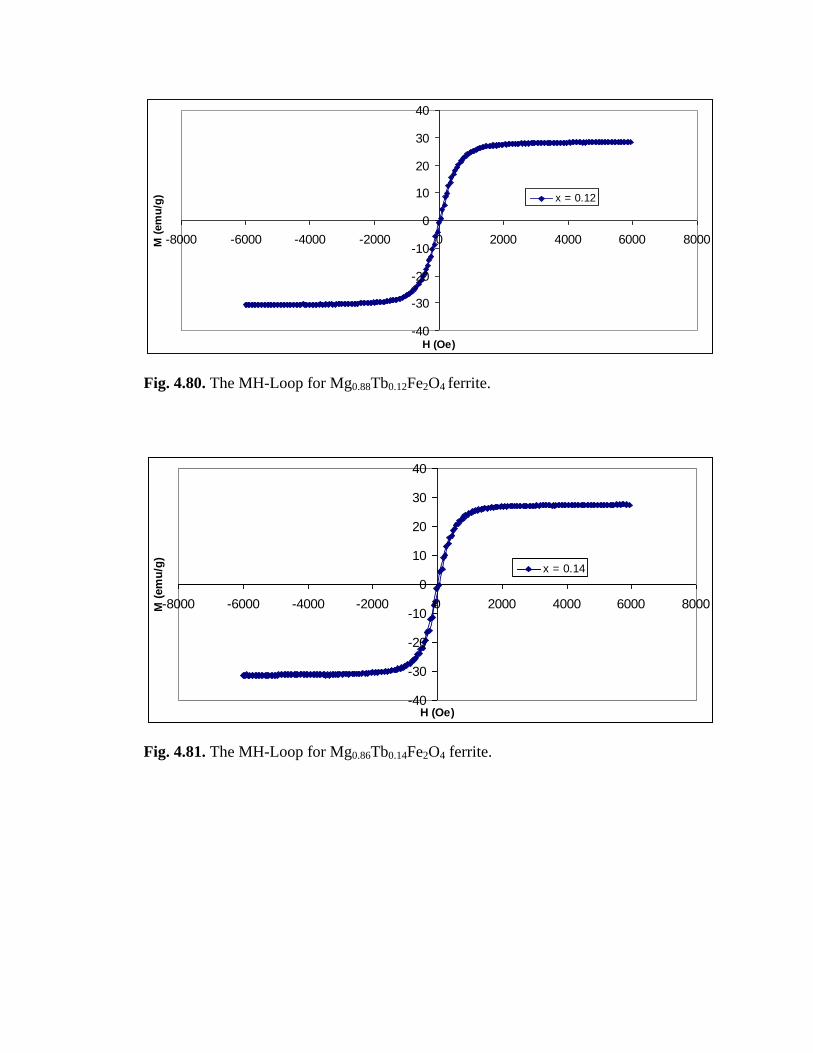
4.80 The MH-Loop for Mg0.88Tb0.12Fe2O4 ferrite 181
4.81 The MH-Loop for Mg0.86Tb0.14Fe2O4 ferrite 181
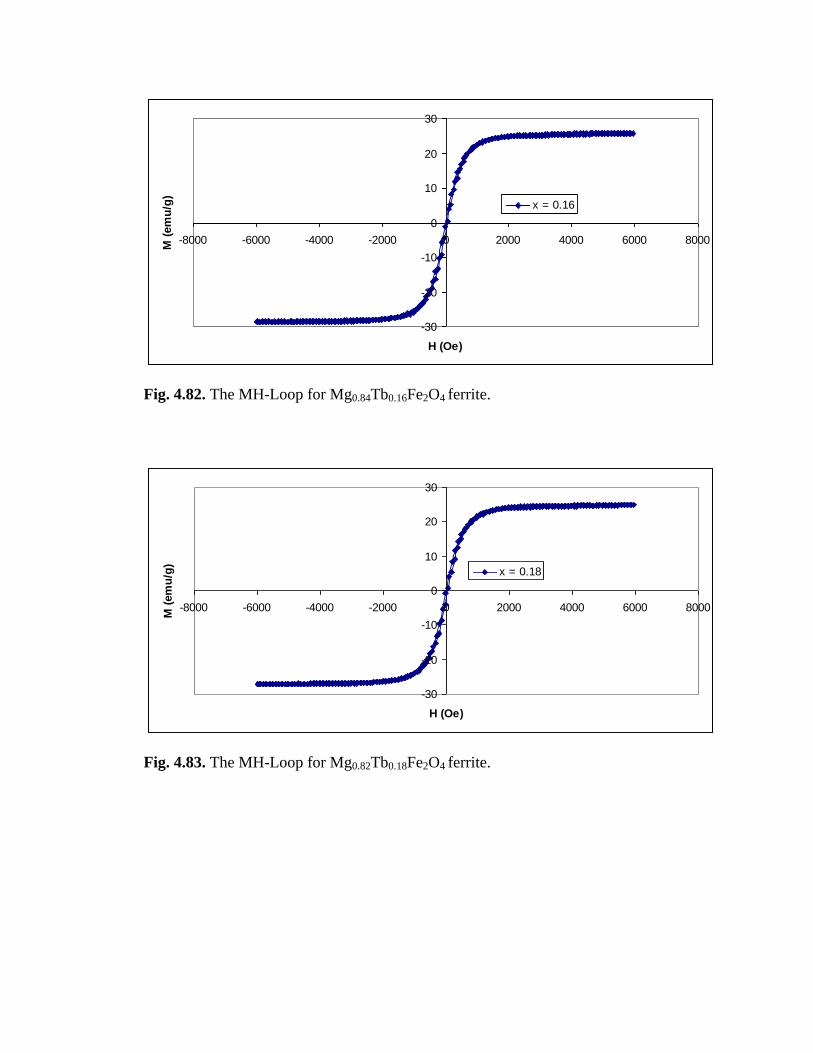
4.82 The MH-Loop for Mg0.84Tb0.16Fe2O4 ferrite 182
4.83 The MH-Loop for Mg0.82Tb0.18Fe2O4 ferrite 182
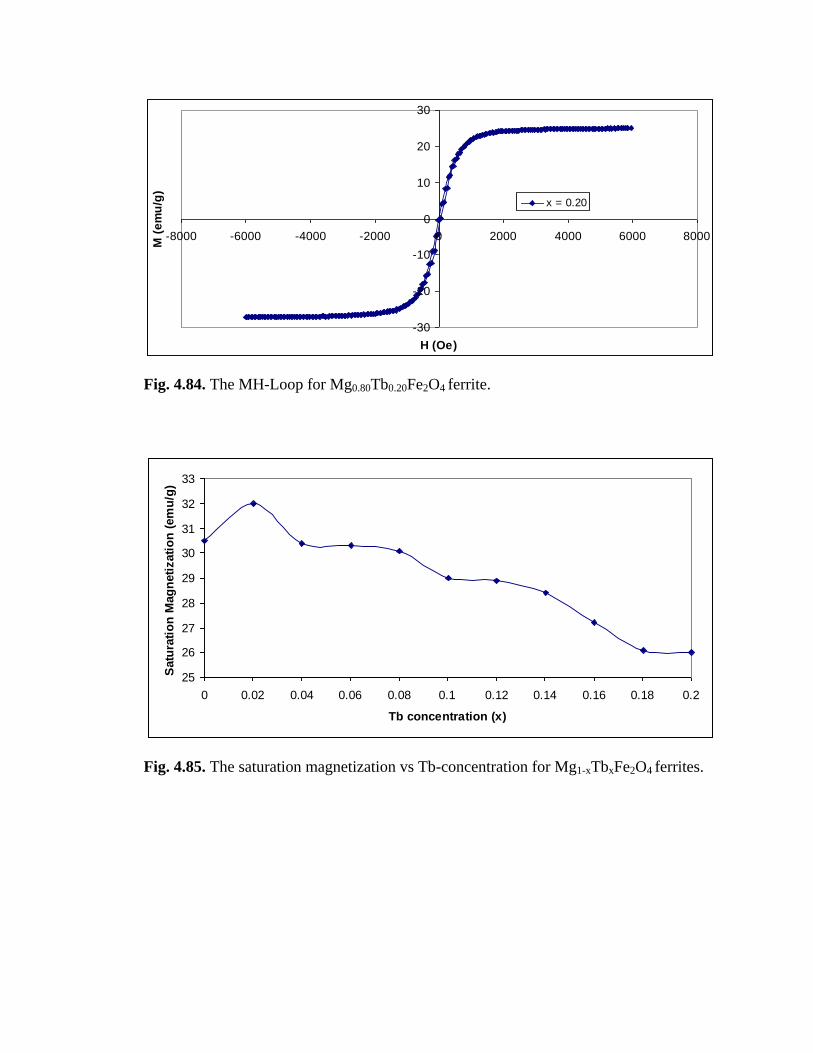
4.84 The MH-Loop for Mg0.80Tb0.20Fe2O4 ferrite 183
4.85 The saturation magnetization vs Tb-concentration for
Mg1-xTbxFe2O4 ferrites 183
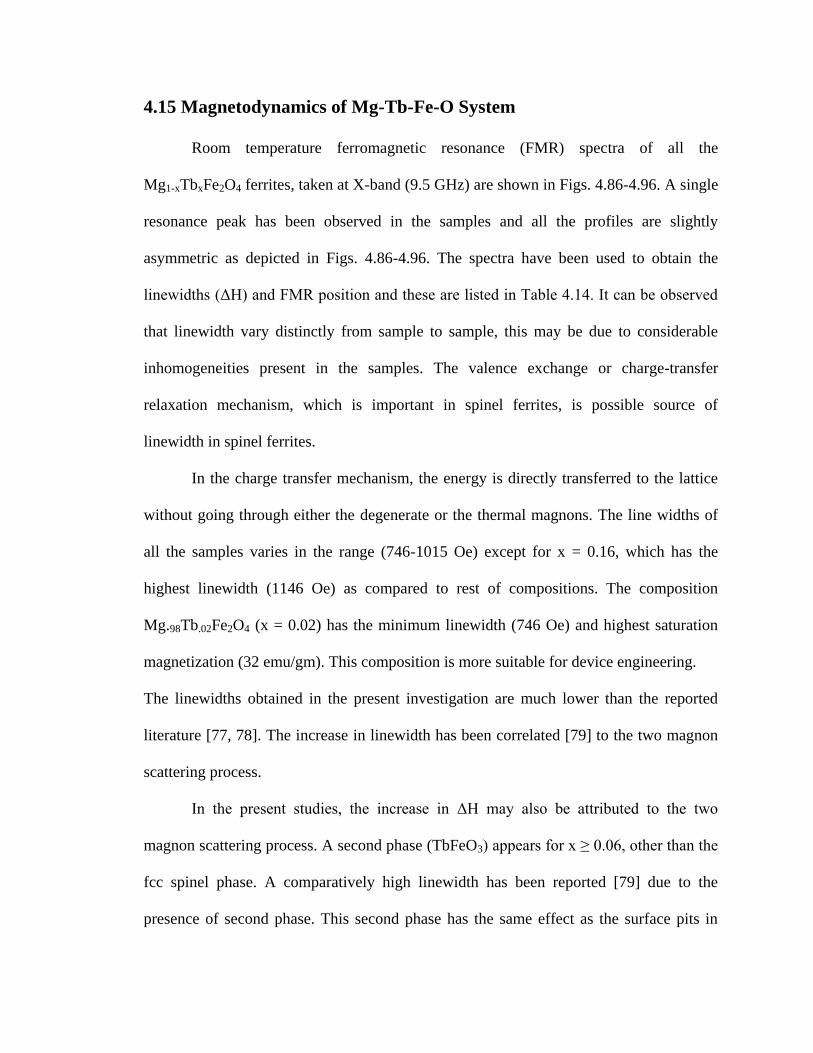
4.86 FMR profile of MgFe2O4 ferrite 185
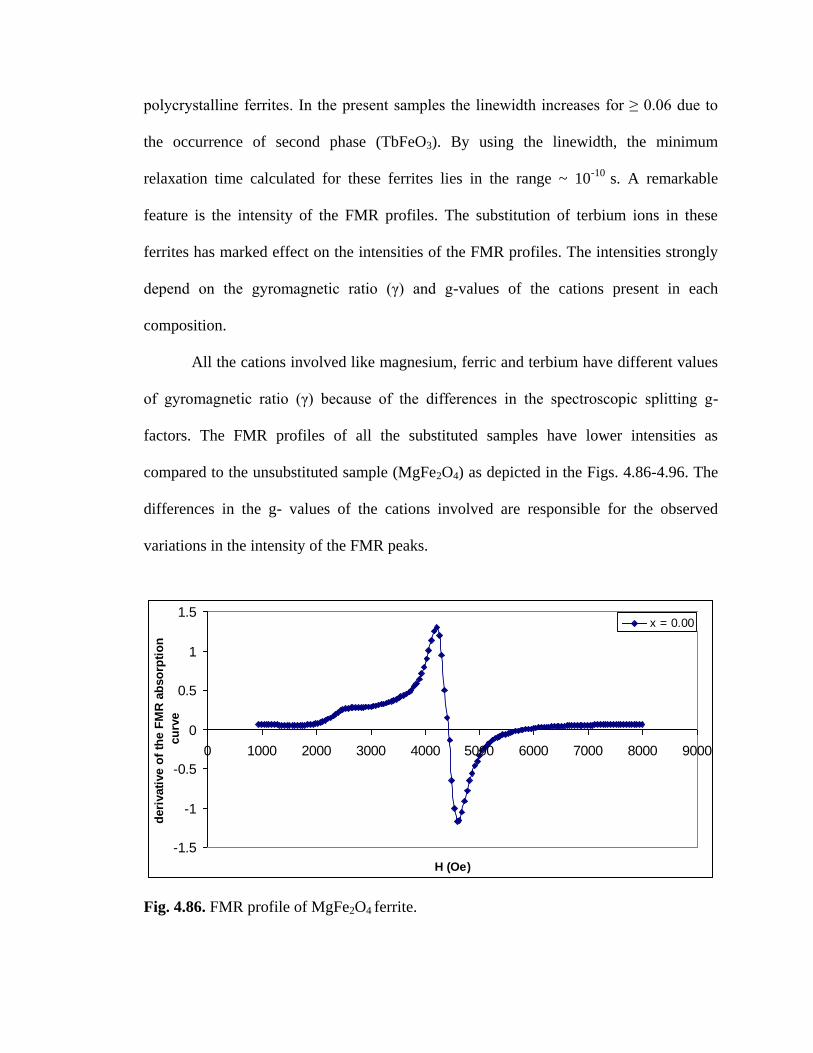
4.87 FMR profile of Mg0.98Tb0.02Fe2O4 ferrite 186
4.88 FMR profile of Mg0.96Tb0.04Fe2O4 ferrite 186
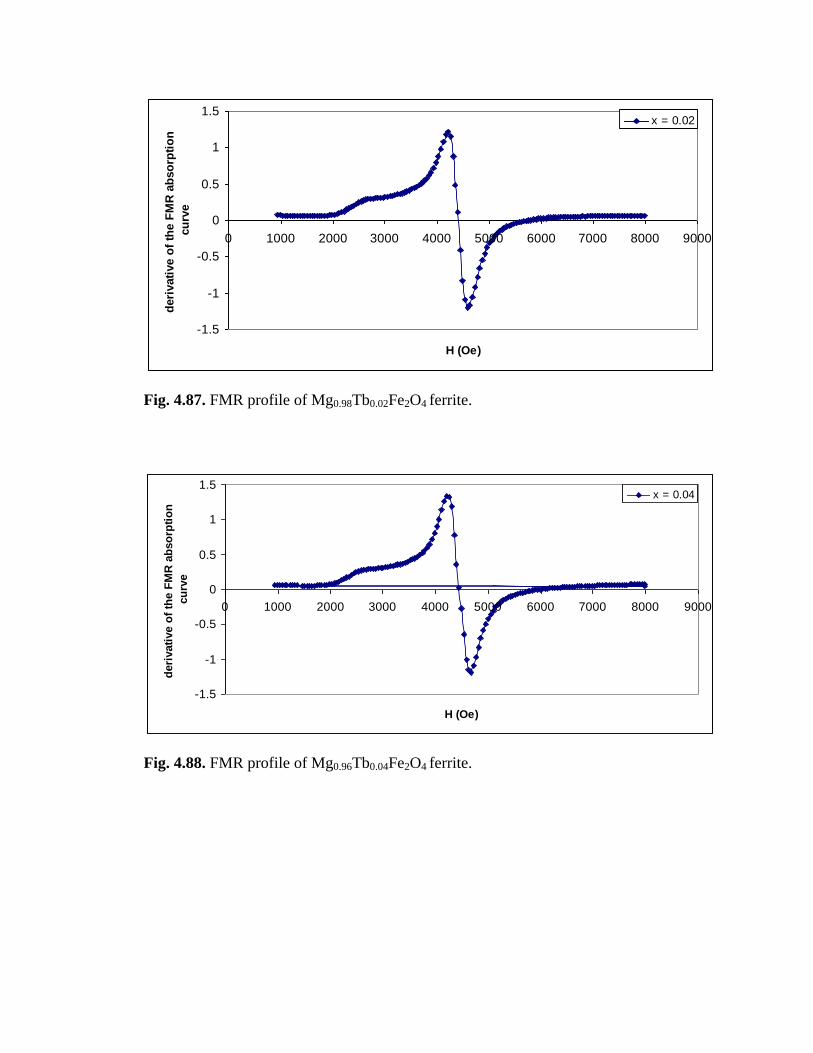
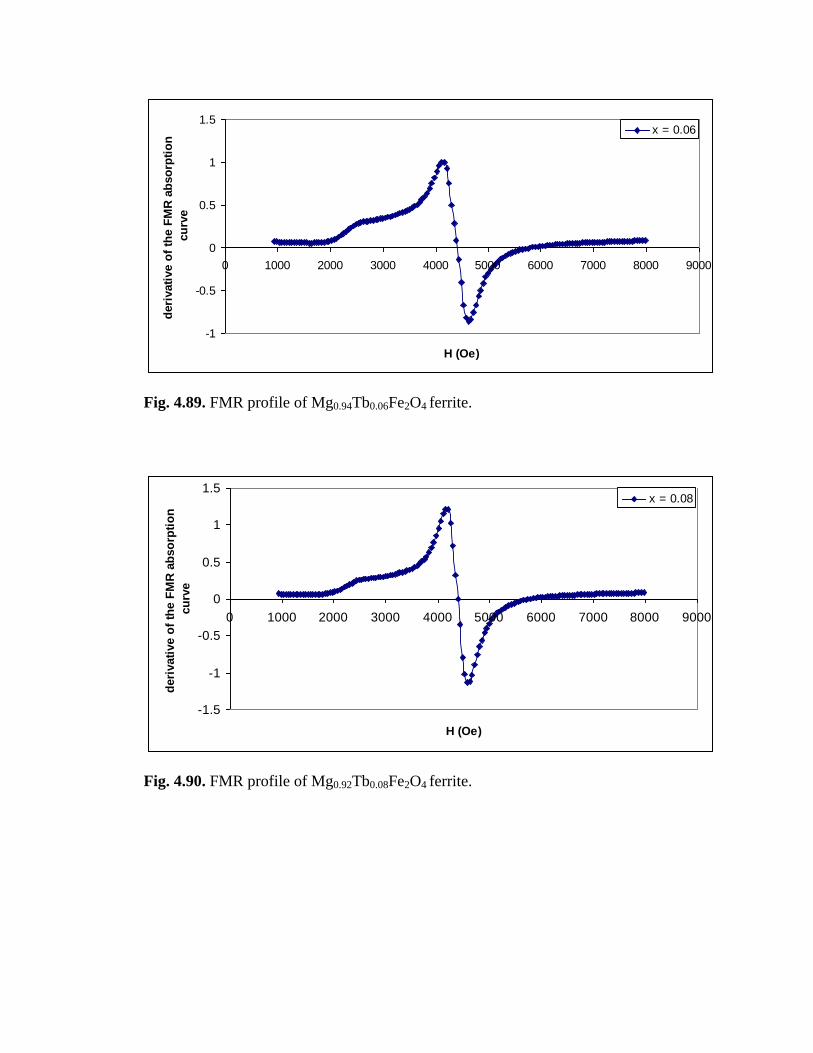
4.89 FMR profile of Mg0.94Tb0.06Fe2O4 ferrite 187
4.90 FMR profile of Mg0.92Tb0.08Fe2O4 ferrite 187
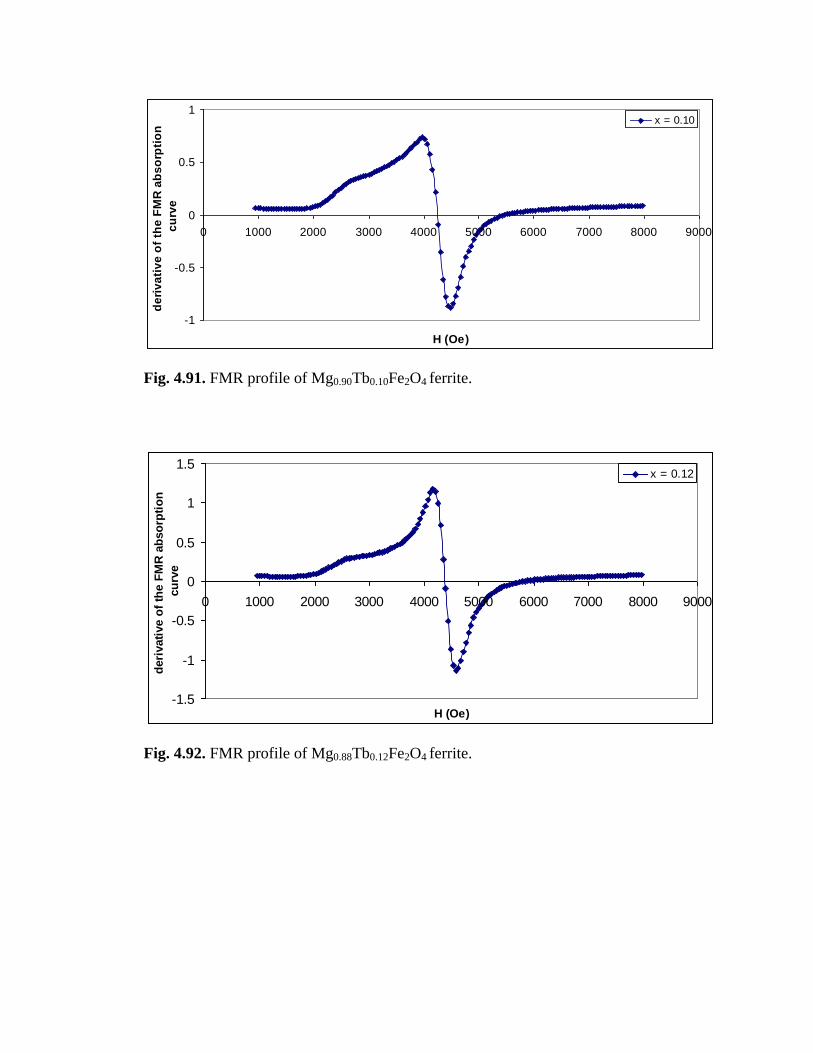
4.91 FMR profile of Mg0.90Tb0.10Fe2O4 ferrite 188
4.92 FMR profile of Mg0.88Tb0.12Fe2O4 ferrite 188
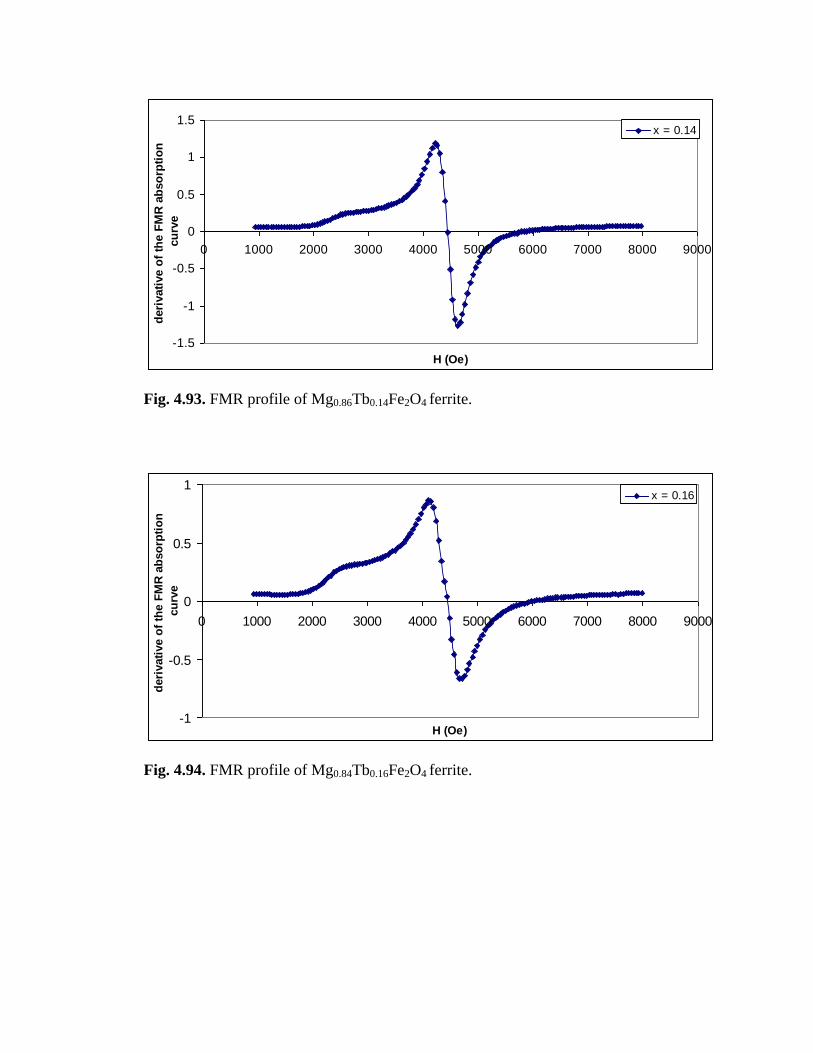
4.93 FMR profile of Mg0.86Tb0.14Fe2O4 ferrite 189
4.94 FMR profile of Mg0.84Tb0.16Fe2O4 ferrite 189
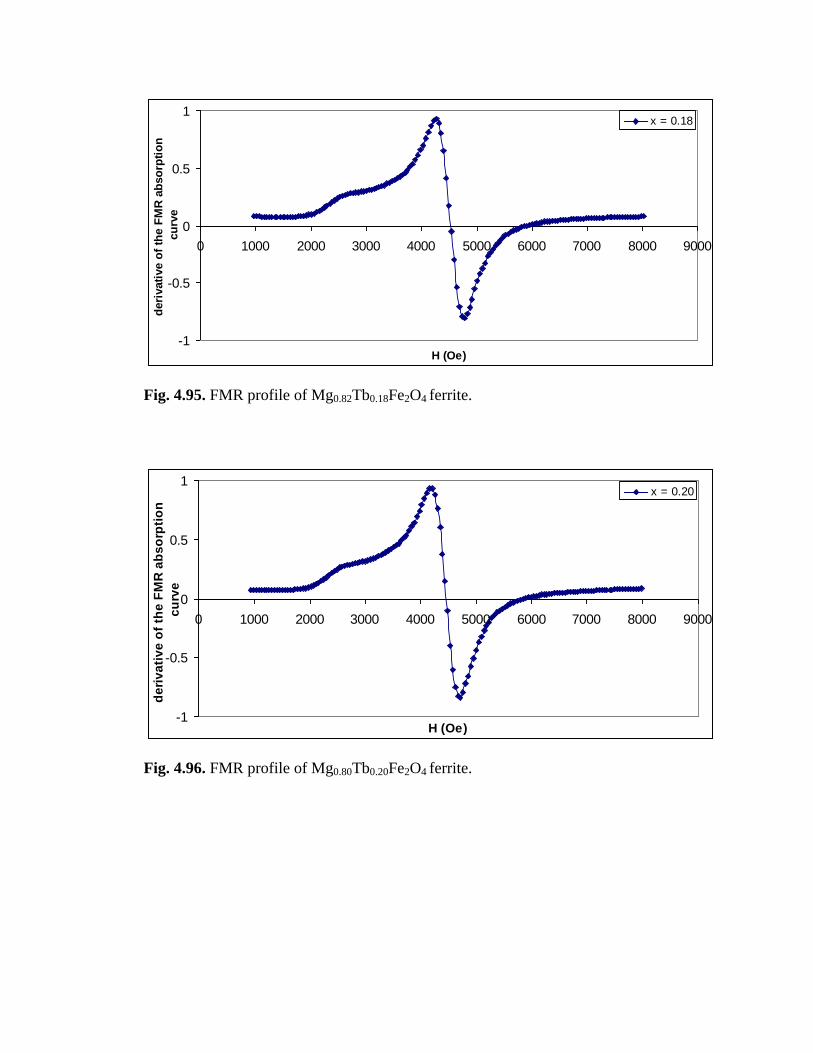
4.95 FMR profile of Mg0.82Tb0.18Fe2O4 ferrite 190
Page 19
4.96 FMR profile of Mg0.80Tb0.20Fe2O4 ferrite 190
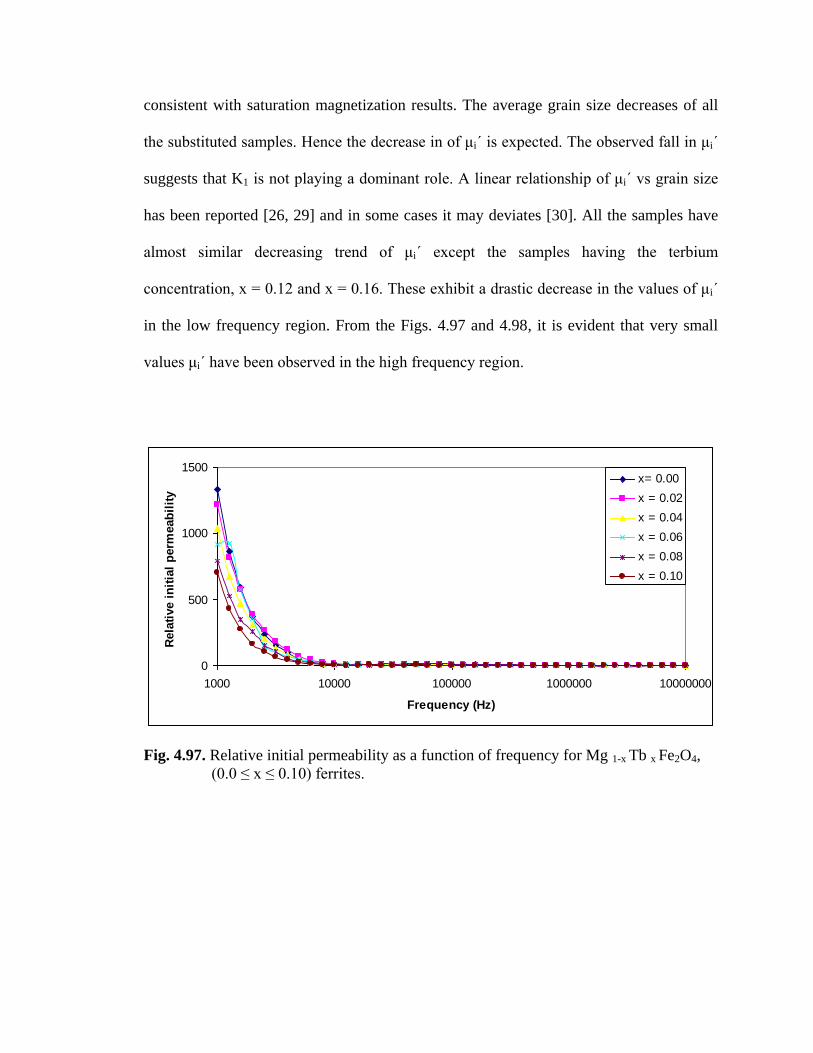
4.97 Relative initial permeability as a function of frequency for
Mg 1-x Tb x Fe2O4, (0.0 ≤ x ≤ 0.10) ferrites 193
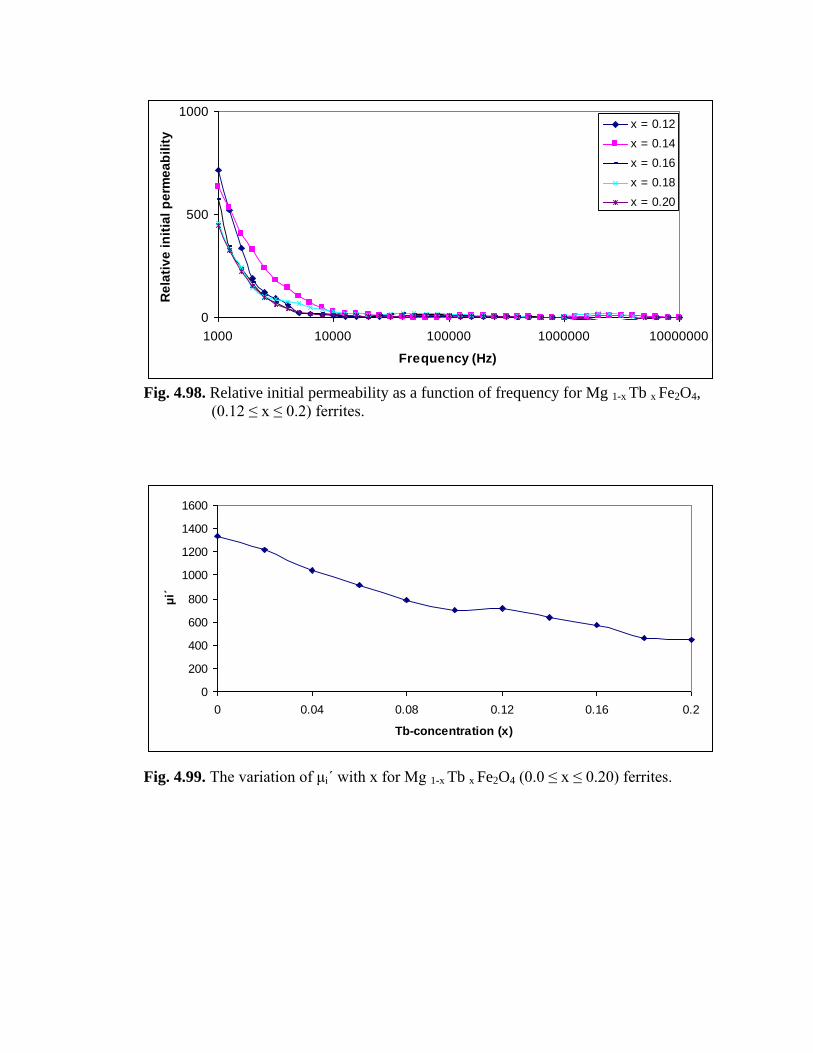
4.98 Relative initial permeability as a function of frequency for
Mg 1-x Tb x Fe2O4, (0.12 ≤ x ≤ 0.2) ferrites 194
4.99 The variation of μi΄ with x for Mg 1-x Tb x Fe2O4 (0.0 ≤ x ≤ 0.20) ferrites 194
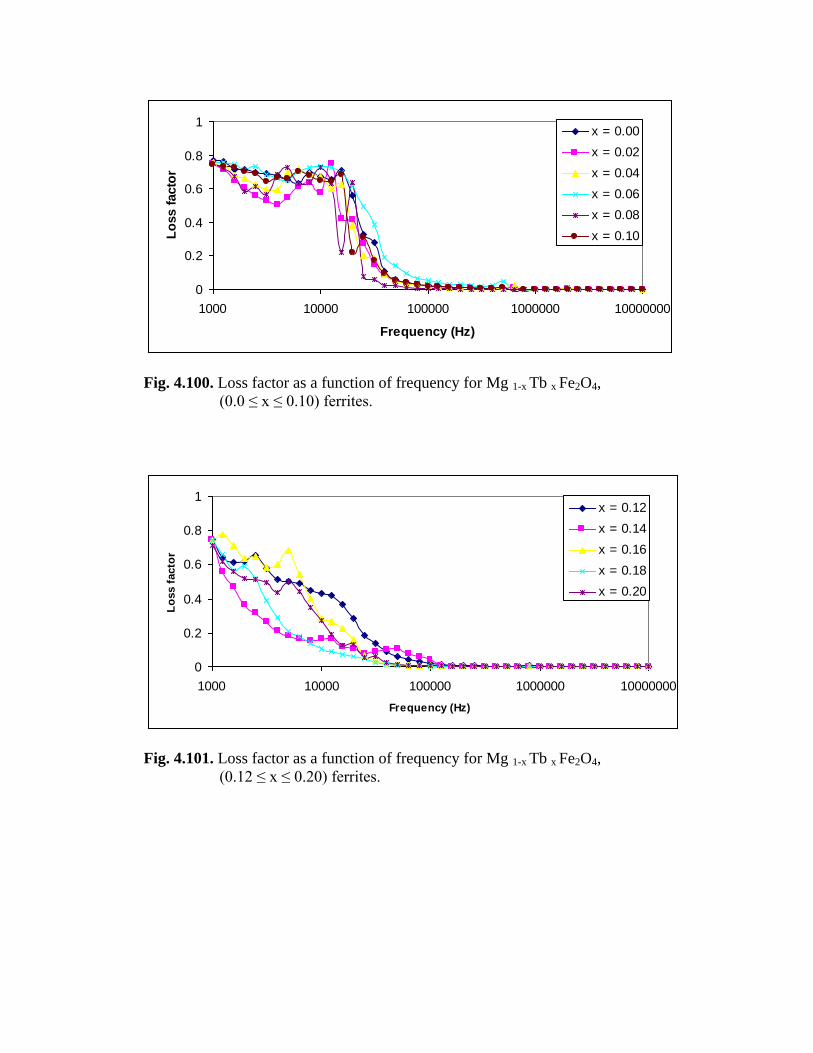
4.100 Loss factor as a function of frequency for Mg 1-x Tb x Fe2O4,
(0.0 ≤ x ≤ 0.10) ferrites 196
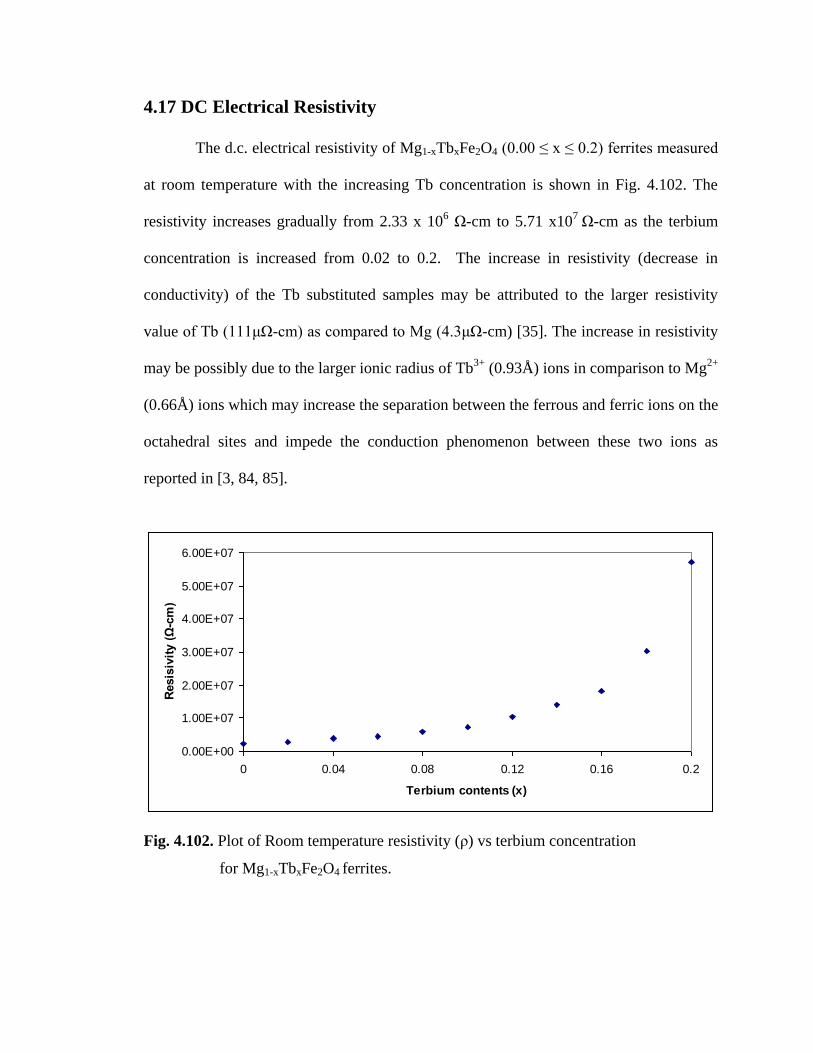
4.101 Loss factor as a function of frequency for Mg 1-x Tb x Fe2O4,
(0.12 ≤ x ≤ 0.20) ferrites 196
4.102 Plot of Room temperature resistivity (ρ) Vs terbium concentration
for Mg1-xTbxFe2O4 ferrites 197
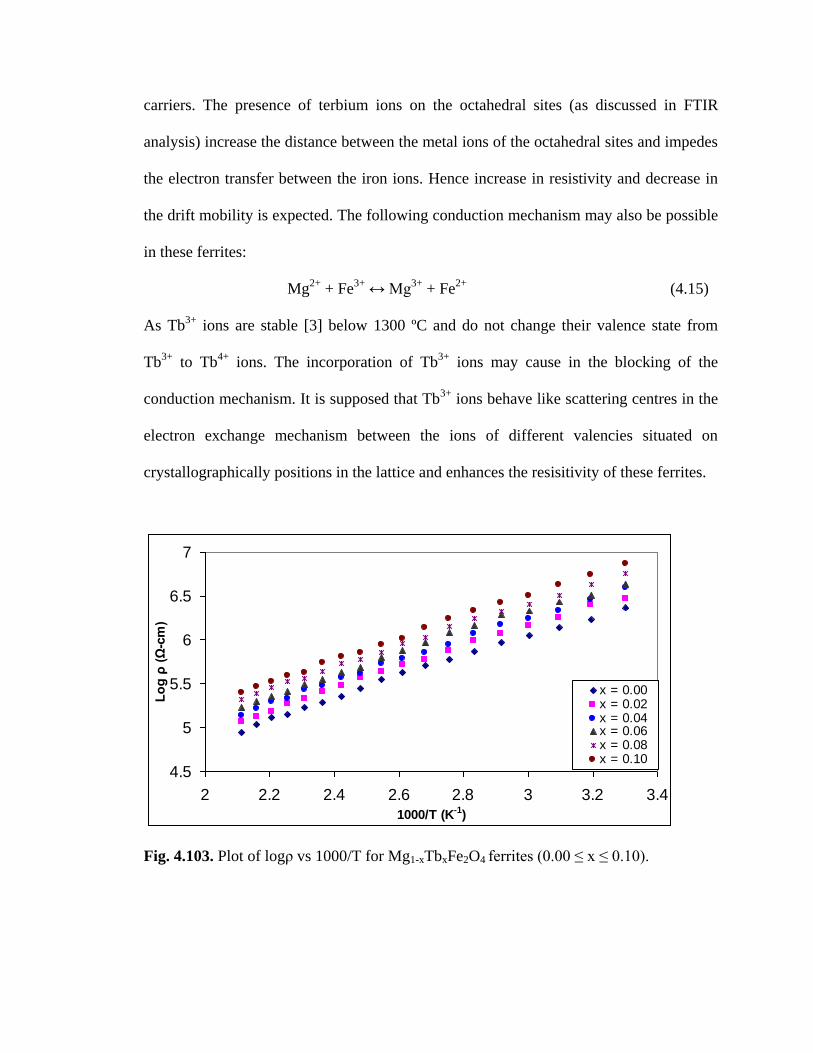
4.103 Plot of logρ Vs 1000/T for Mg1-xTbxFe2O4 ferrites (0.00 ≤ x ≤ 0.10) 200
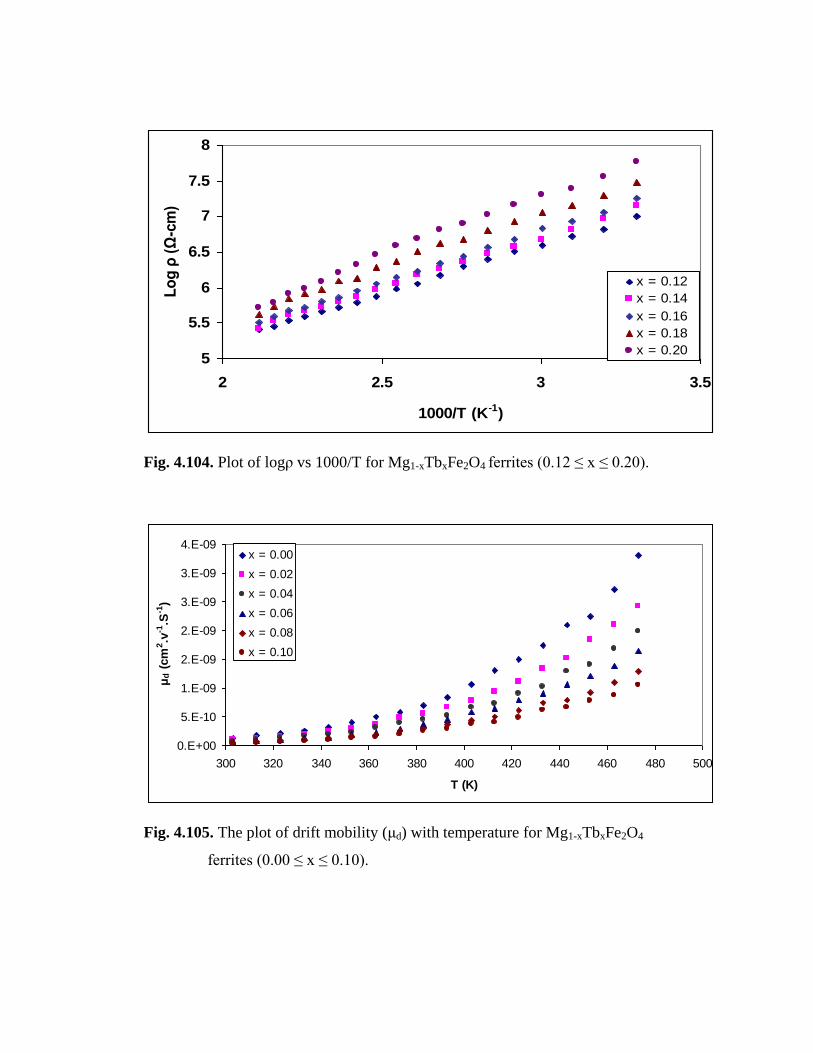
4.104 Plot of logρ Vs 1000/T for Mg1-xTbxFe2O4 ferrites (0.12 ≤ x ≤ 0.20) 201
4.105 The plot of drift mobility (μd) with temperature for Mg1-xTbxFe2O4
ferrites (0.00 ≤ x ≤ 0.10) 201
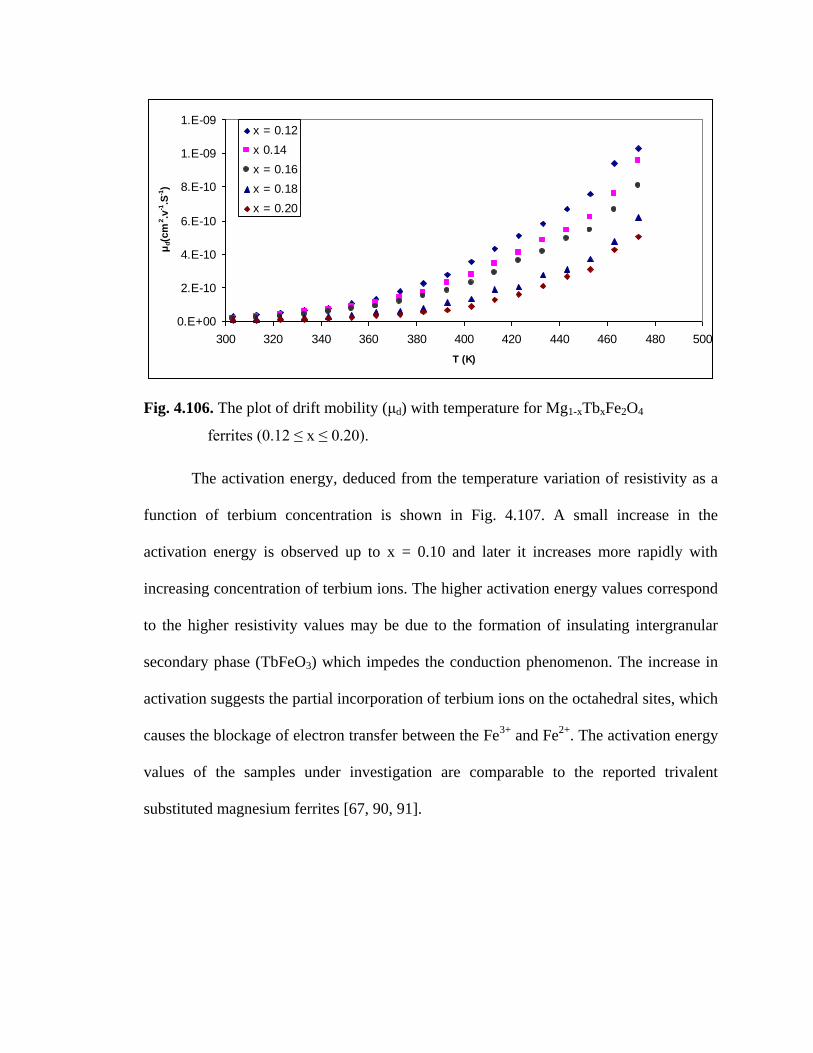
4.106 The plot of drift mobility (μd) with temperature for Mg1-xTbxFe2O4
ferrites (0.12 ≤ x ≤ 0.20) 202
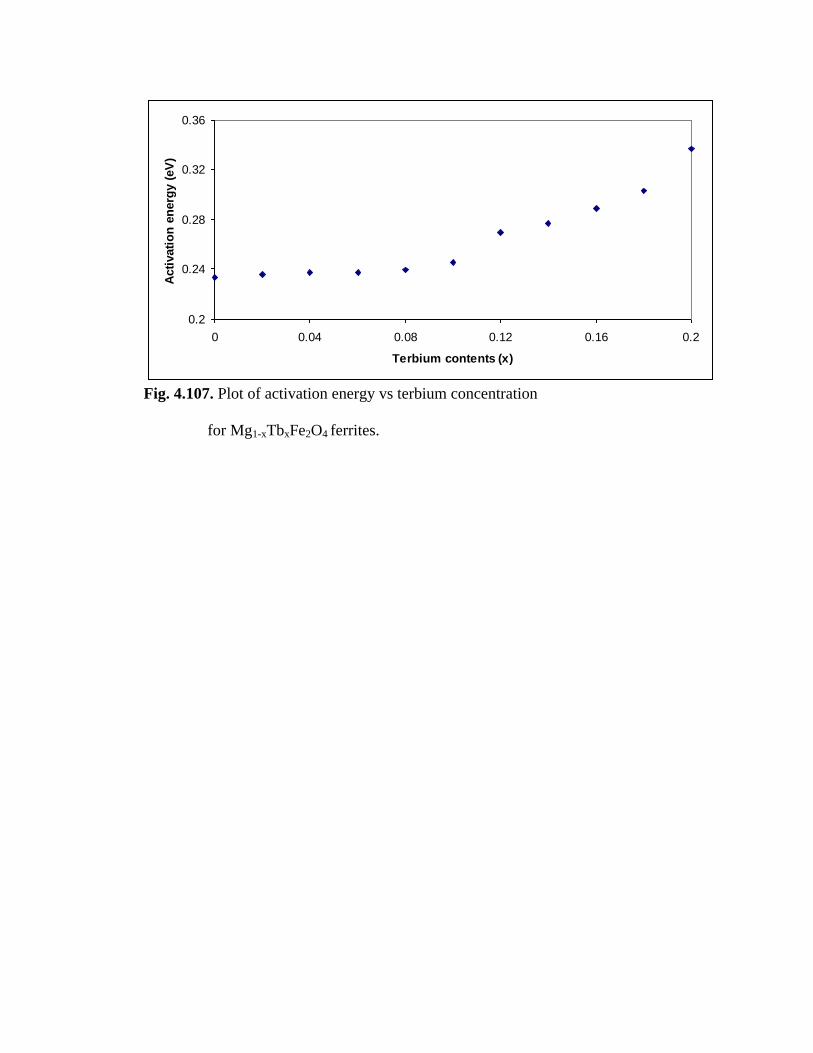
4.107 Plot of activation energy Vs terbium concentration for
Mg1-xTbxFe2O4 ferrites 203
4.108 Dielectric constant (ε') Vs frequency of Mg1-xTbxFe2O4
(x = 0.0- 0.10) ferrites 205
4.109 Dielectric constant (ε') Vs frequency of Mg1-xTbxFe2O4
(x = 0.12- 0.20) ferrites 205
Page 20
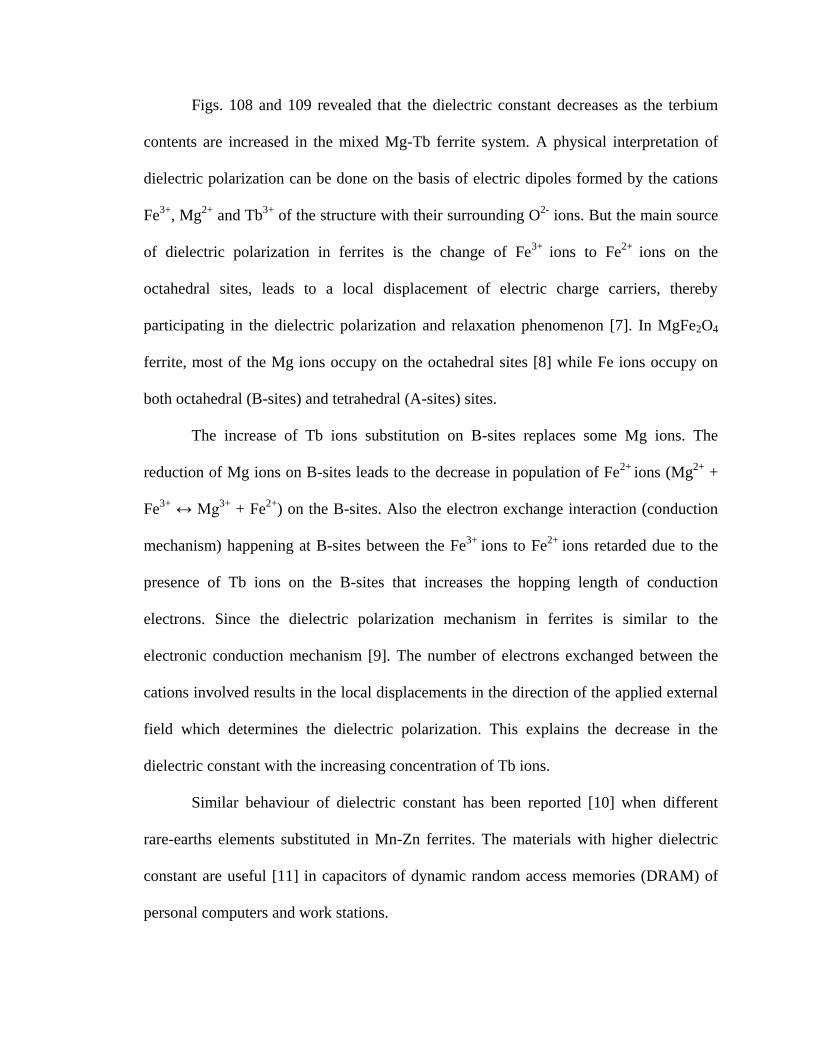
4.110 Dielectric loss (tanδ) Vs frequency of Mg1-xTbxFe2O4
(x = 0.0- 0.10) ferrites 207
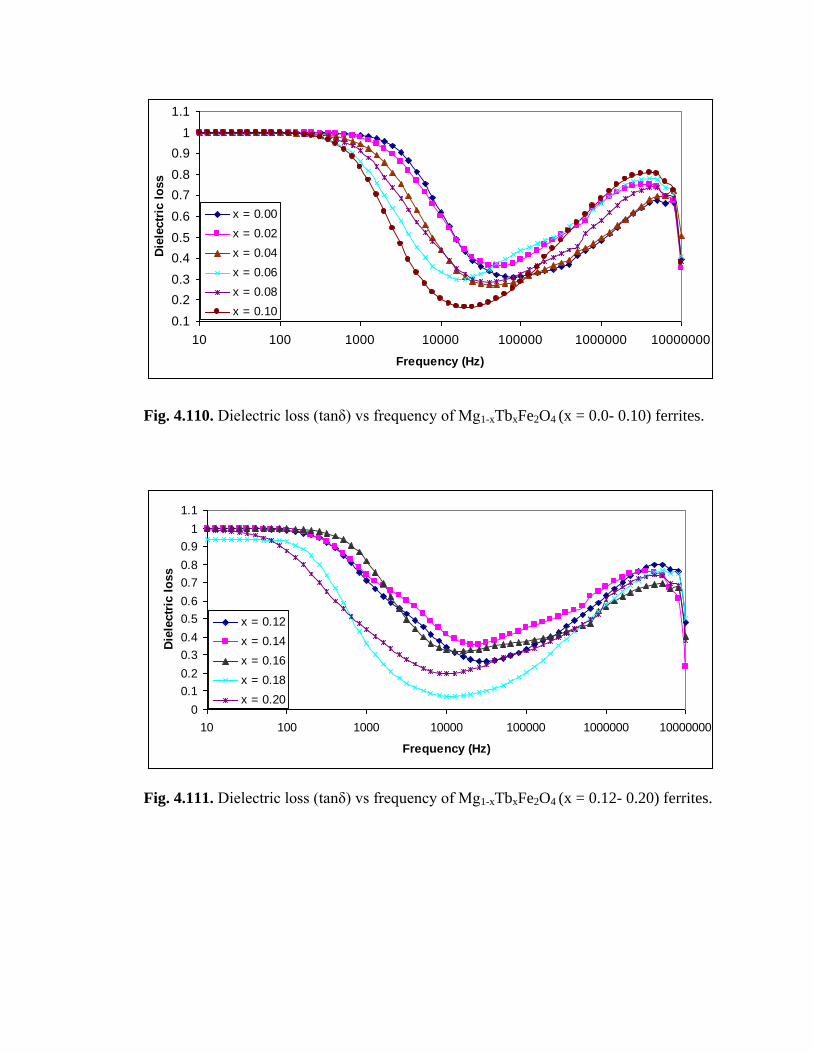
4.111 Dielectric loss (tanδ) Vs frequency of Mg1-xTbxFe2O4
(x = 0.12- 0.20) ferrites 207
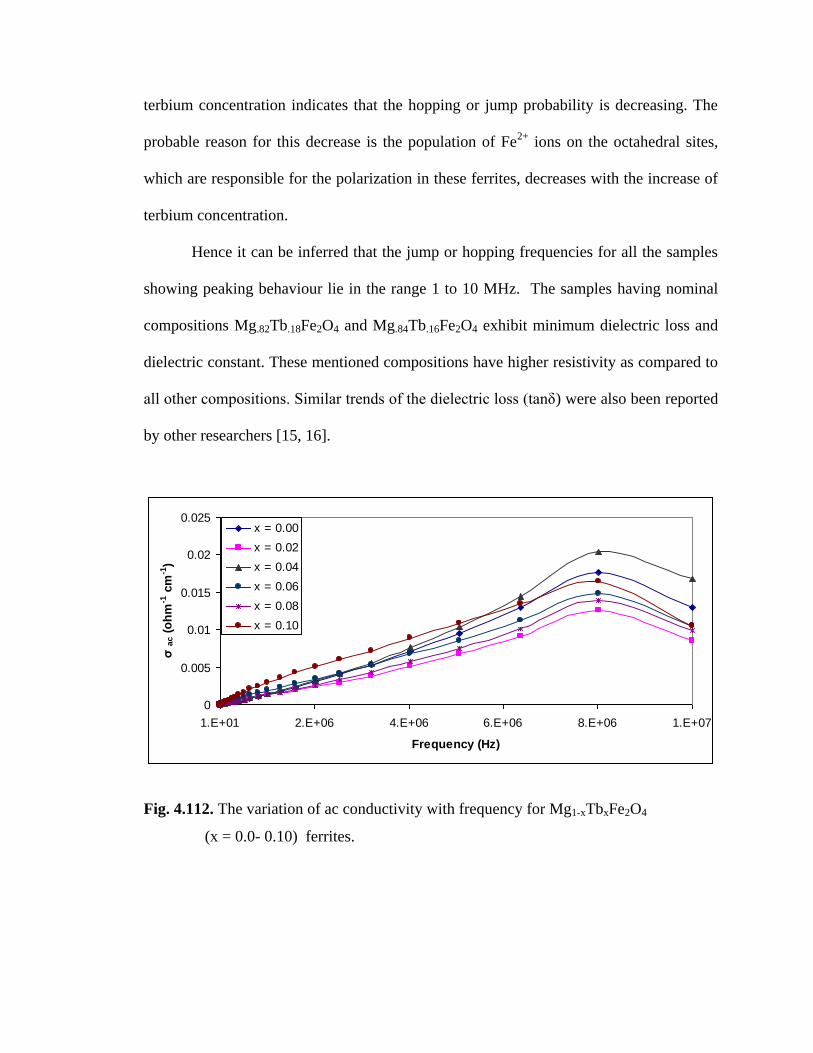
4.112 The variation of ac conductivity with frequency for Mg1-xTbxFe2O4
(x = 0.0- 0.10) ferrites 209
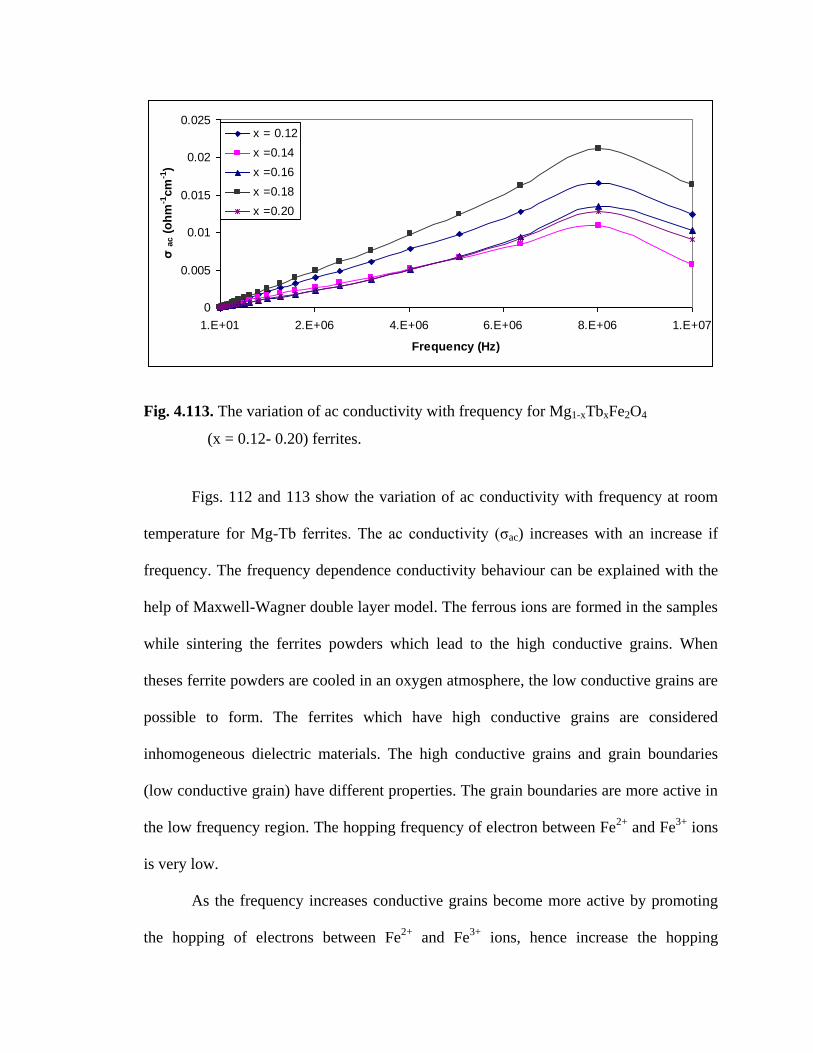
4.113 The variation of ac conductivity with frequency for Mg1-xTbxFe2O4
(x = 0.12- 0.20) ferrites 210
Page 21
List of Tables
Table No Page No
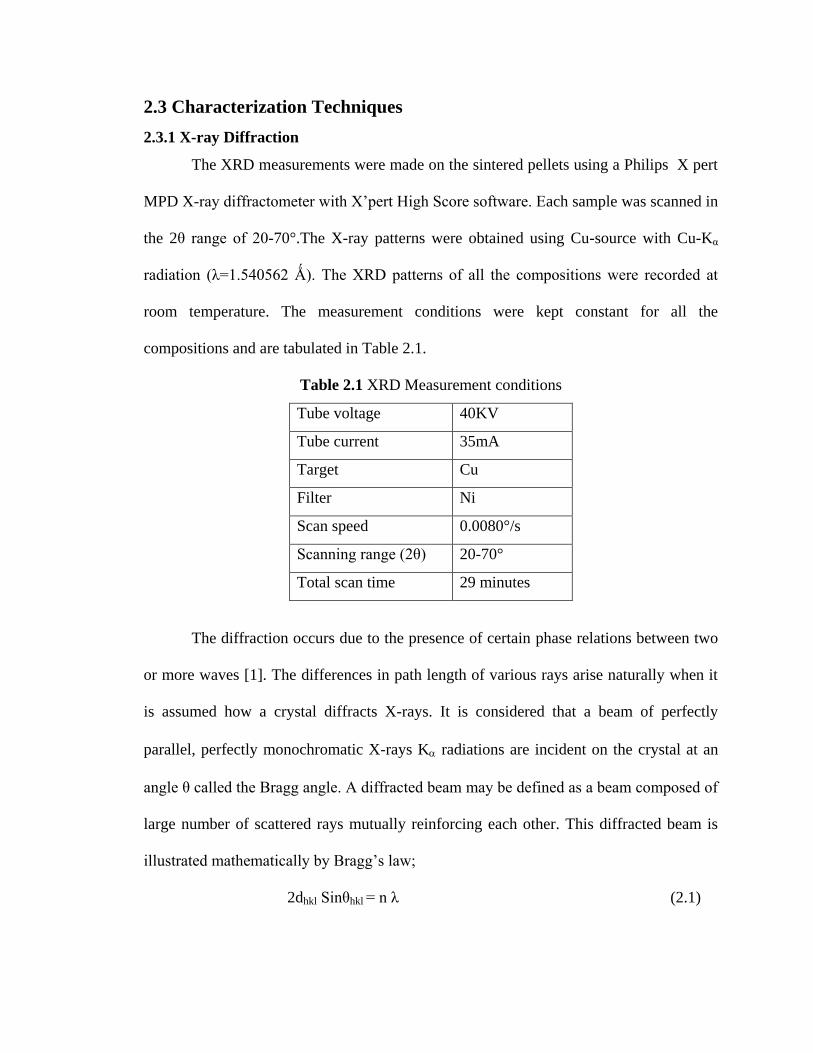
2.1 XRD Measurement conditions 56
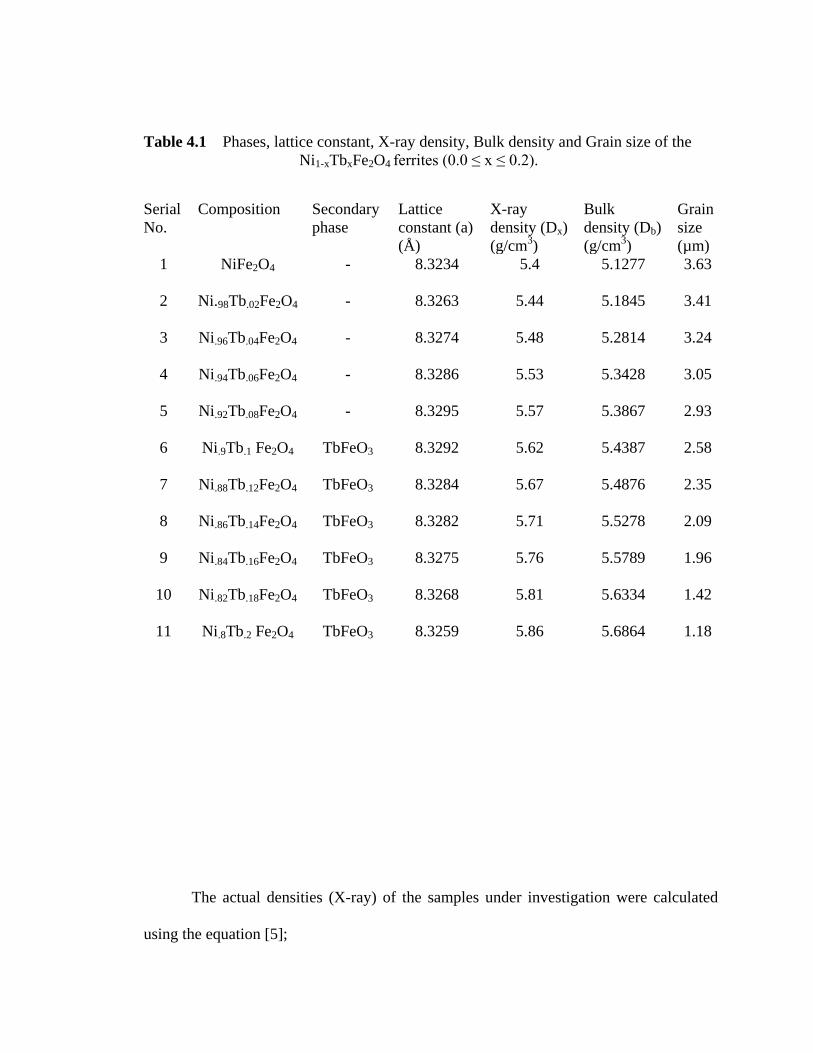
4.1 Phases, lattice constant, X-ray density, Bulk density and
Grain size of the Ni1-xTbxFe2O4 ferrites (0.0 ≤ x ≤ 0.2) 106
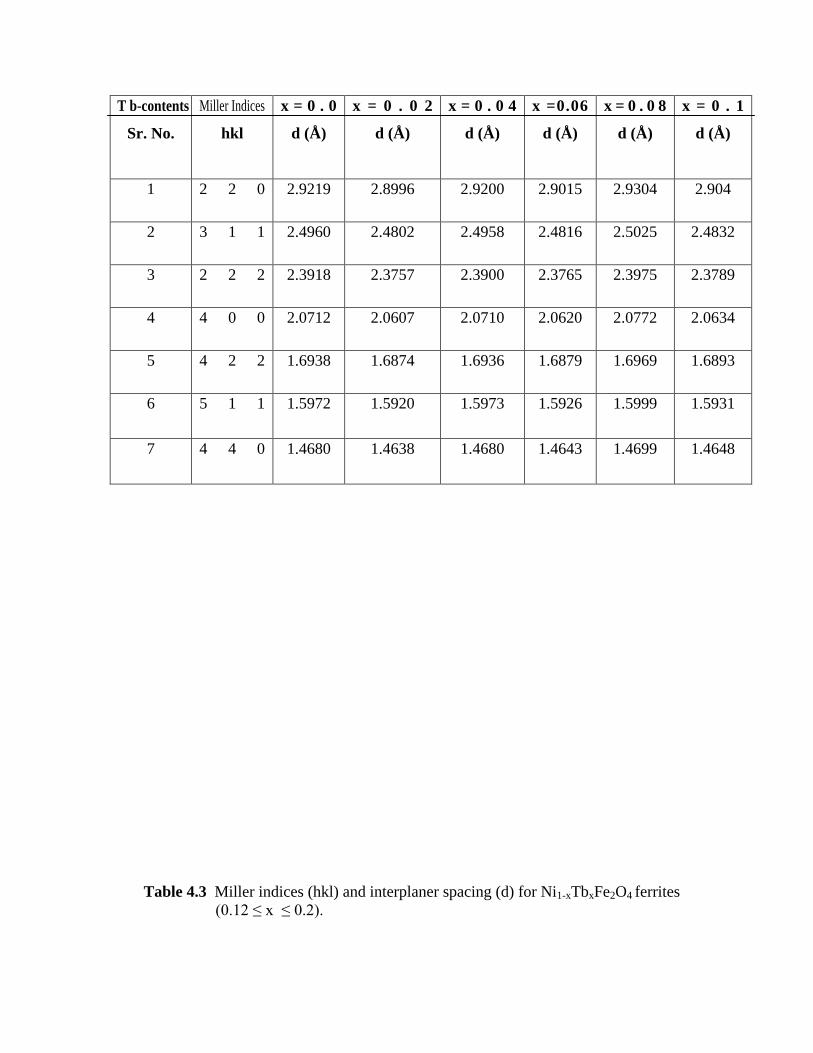
4.2 Miller indices (hkl) and interplaner spacing (d) for
Ni1-xTbxFe2O4 ferrites (0.0 ≤ x ≤ 0.1) 108
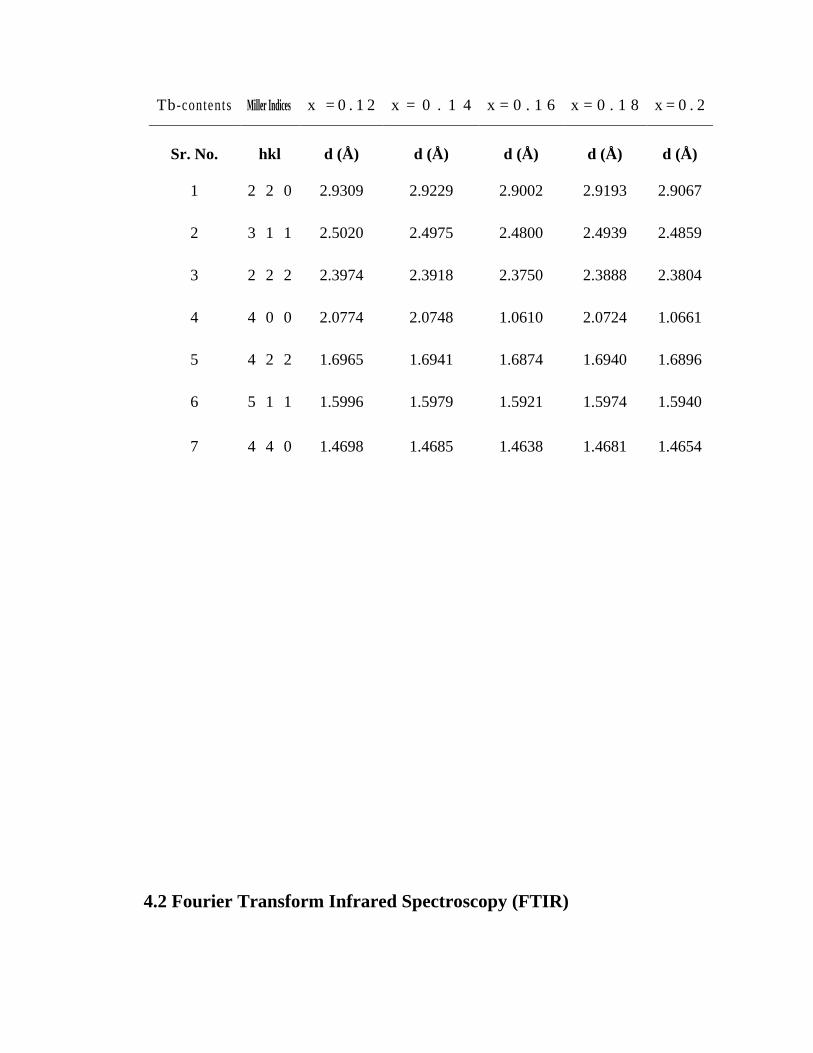
4.3 Miller indices (hkl) and interplaner spacing (d)
for Ni1-xTbxFe2O4 ferrites (0.12 ≤ x ≤ 0.2) 109
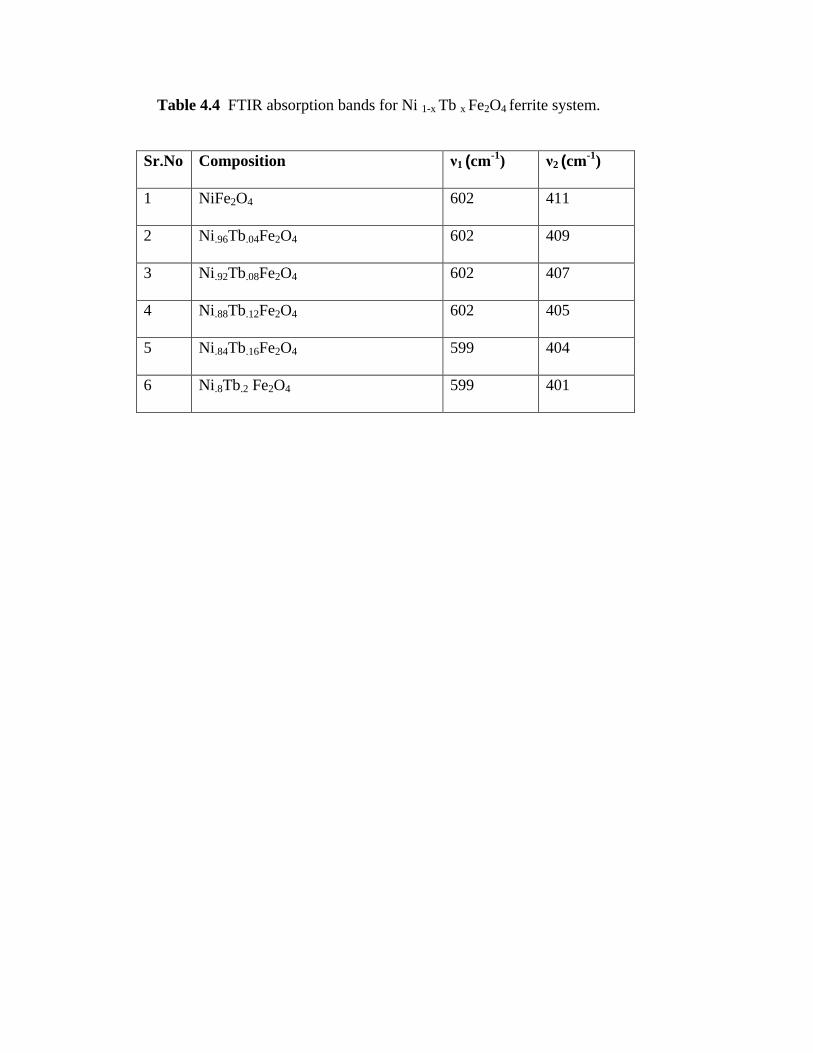
4.4 FTIR absorption bands for Ni 1-x Tb x Fe2O4 ferrite system 114
4.5 Nominal percentage of metal cations in Ni1-xTbxFe2O4 ferrites 118
4.6 The saturation magnetization (Ms) and Coercivity (Hc) of
Ni1-xTbxFe2O4 (x = 0.0-0.2) ferrites 123
4.7 FMR parameters of Ni1-xTbxFe2O4 ferrites measured
at X-band (9.5 GHz) 136
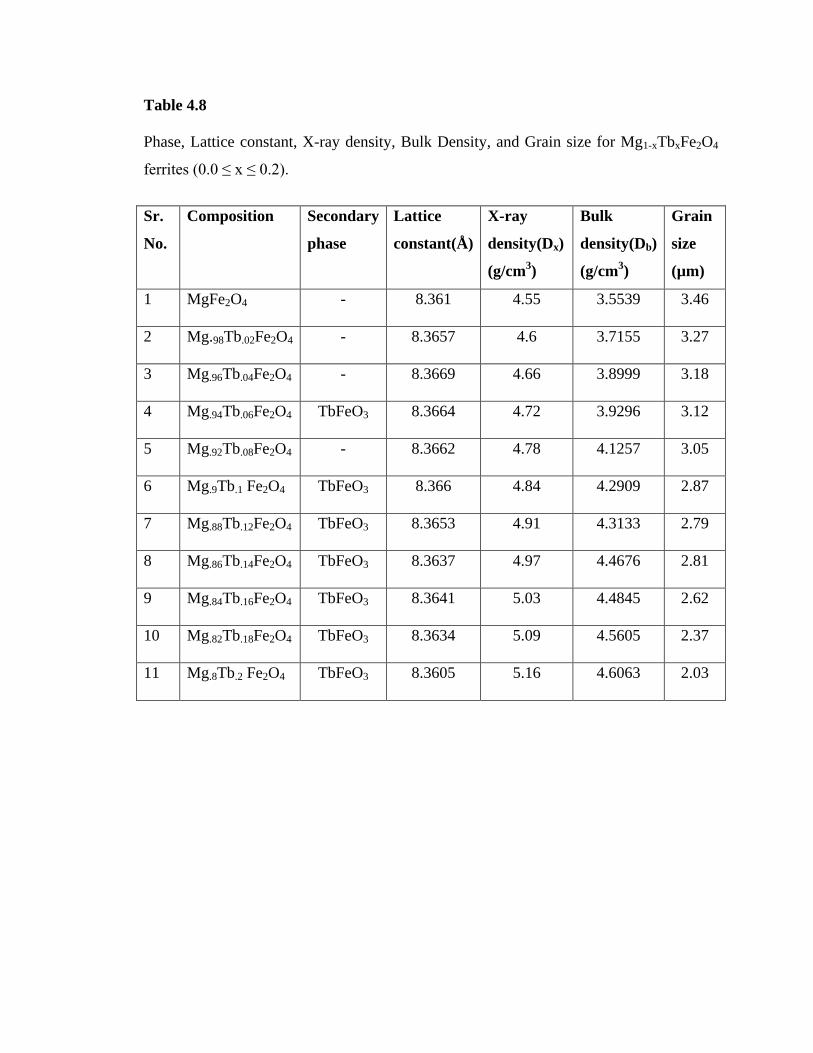
4.8 Phase, Lattice constant, X-ray density, Bulk Density, and
Grain size for Mg1-xTbxFe2O4 ferrites (0.0 ≤ x ≤ 0.2) 160
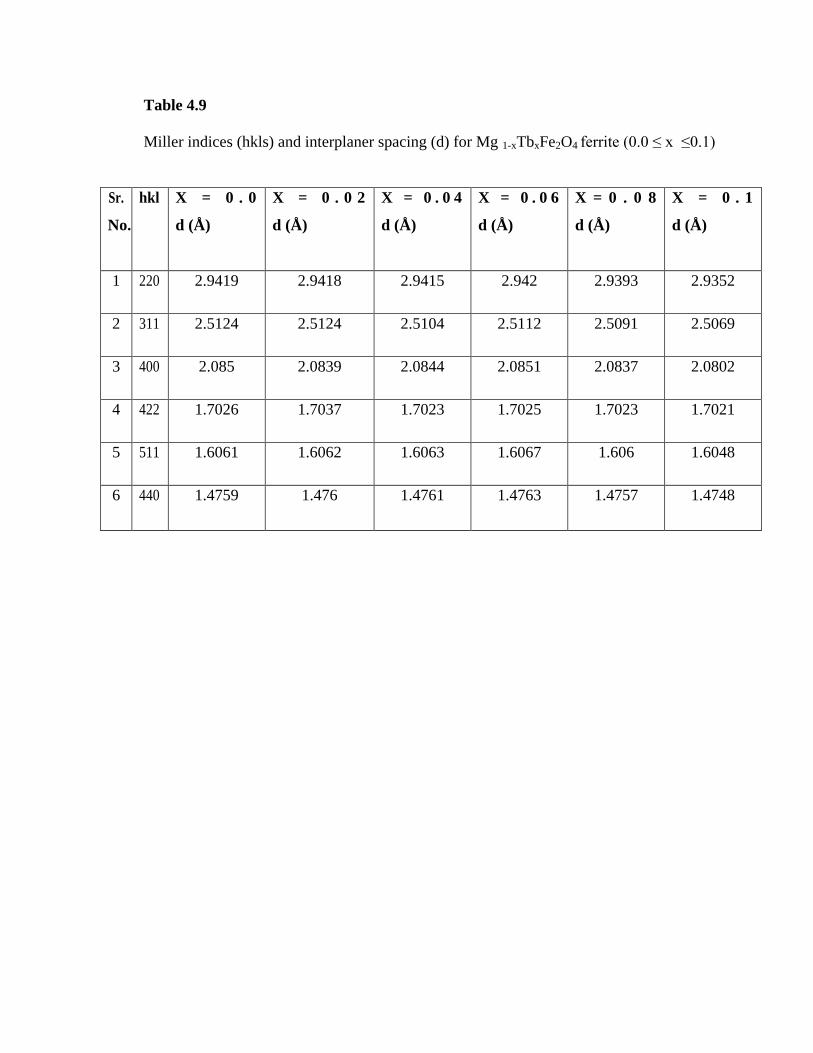
4.9 Miller indices (hkls) and interplaner spacing (d) for
Mg 1-xTbxFe2O4 ferrite (0.0 ≤ x ≤ 0.1) 161
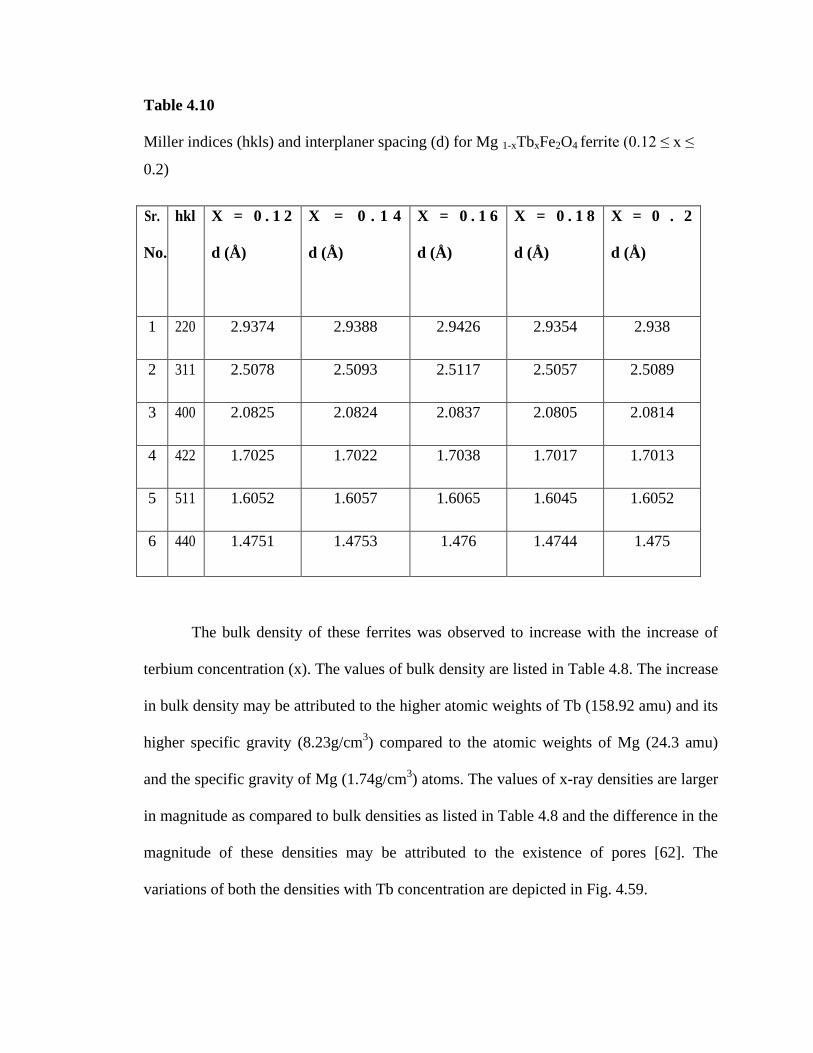
4.10 Miller indices (hkls) and interplaner spacing (d) for
Mg 1-xTbxFe2O4 ferrite (0.12 ≤ x ≤ 0.2) 162
4.11 FTIR absorption bands for Mg1-xTbxFe2O4 ferrites 168
4.12 Nominal percentage of metal cations in Mg1-xTbxFe2O4 ferrites 172
4.13 The saturation magnetization (Ms) and Coercivity (Hc) of
Mg1-xTbxFe2O4 (x = 0.0-0.2) ferrites 177
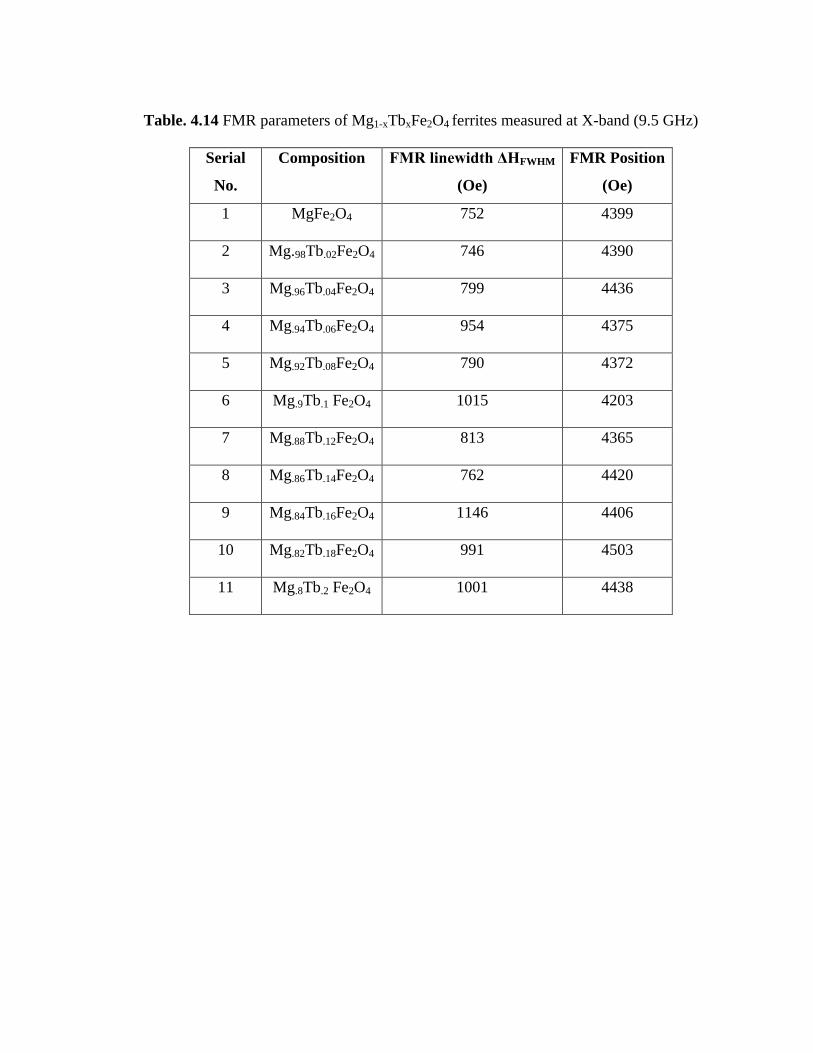
4.14 FMR parameters of Mg1-xTbxFe2O4 ferrites measured at
X-band (9.5 GHz) 191
Page 22
1 INTRODUCTION
1.1 Soft Ferrites
Soft ferrites have been under intense investigations for decades due to their useful
electromagnetic characteristics and number of applications. Ferrites are best materials as
they are less expensive, stable and have wide range technological applications, such as
radio wave circuits, high quality filters and operating devices. Soft ferrites are an integral
part of the modern industrial society. They are considered as an important class of
magnetic materials, which have many applications including use as humidity sensors, gas
sensors, green anode materials, stealth aircraft technology, T. V. image interference of
high rise buildings, microwave dark room and protection [1-3]. Ferrites become attractive
materials owing to their use as magnetic semi-conductors (ferrimagnetic) and electric
insulators [4]. Ferrites with high electrical resistivity and good magnetic properties are
used as core material for power transformers in electronics heads, antenna rods, loading
coils, microwave devices and telecommunication applications [5].
Soft magnetic materials are suitable for high frequency applications with low
magnetic coercivity, high electrical resistivity and low eddy current loss and are also key
materials for compact switched mode power supplies [6, 7]. Ferrites are also used as
electrode materials for high temperature applications because of their high
thermodynamic stability, electrical conductivity, electrocatalytic activity and resistance to
corrosion [8].
Page 23
1.2 Literature Review
Ferrites have been studied since long in order to enhance the magnetic and
electrical properties. Ferrites are technologically important materials owing to their
structure, which can accommodate a variety of cations at different sites enabling a wide
variation in electrical and magnetic properties. In the recent years, the ferrites have been
demonstrated to be good materials for gas sensing applications and are suitable materials
for high frequency applications [2-4, 6]. The electrical properties can be enhanced either
by controlling the sintering temperature or by the addition of different types and amounts
of metal ion substitution.
Forestier prepared ferrites in1928. Japanese also studied magnetic oxides
materials between 1932 and 1935. Snoek started research on ferrites in 1936 and in the
period of about ten years, he laid the foundations of physics and technology of ferrites.
These materials are stable, relatively inexpensive and easily manufactured. The annual
production of ferrites is several tons in Europe and rest of the world. Up to now eight
international conferences on ferrites has been conducted in Japan. Beyond 1950
researchers made microwave devices. New applications in the field of microwave
engineering are expanding. The properties of these materials can be enhanced by the
substitution of various metal ions in these ferrites. Nowadays rare earth substituted spinel
ferrites are reported to be promising candidates for applications in high density magnetic
recording and enhanced memory storage. Rare earth ions having 4f unpaired electrons
can originate magnetic anisotropy due to their orbital shape. The substitution of rare earth
ions can improve their electrical and magnetic properties.
Page 24
The magnetic structures of ZnxNi1-xFe2O4 (where x = 0, 0.25, 0.50 and 0.75)
ferrites were studied by neutron diffraction [9]. The analysis suggested the cation
distribution like (Znx2+
Fe1-x3+
) [Ni1-x2+
Fe1+x3+
] O4. All the samples under investigation
showed a noncollinear, Yafet-Kittel (Y-K) type of magnetic ordering. The YK-angles
were observed to increase with an increase in the zinc concentration. The angles
calculated in this way were consistent with three sub-lattice molecular field analysis of
the paramagnetic susceptibility data of Neel and Brochet. Mg1+xGexFe2-2xO4 (x = 0, 0.1,
0.2, 0.3, 0.4) ferrites prepared by ceramic method and their magnetic properties were
reported [10]. The results revealed that the lattice constant decreases with the
concentration of germanium and was attributed to the ionic radii of the cations. It was
observed that the Ge4+
ions prefer tetrahedral sites and this caused the redistribution of
Fe3+
and Mg2+
ions on both A- and B-sites.
The influence of Al3+
ions on the magnetic properties of Mg1Mn0.1Fe1.9-xAlxO4
ferrites prepared by ceramic method has been reported [11]. It was observed that the Al3+
ions preferred B-sites and its substitution resulted in the decrease of magnetization and
remanance. The structural and magnetic properties of CuLa2xFe2-2xO4 (x = 0. 0.2, 0.4, 0.6,
and 0.8) ferrites were investigated [12]. It was noticed that the samples exhibited spinel
phase up to x = 0.4 and for x > 0.4 pervoskite phase was identified. The magnetization
and magnetic moment revealed decreasing trend with the increase of La content. The
variation in magnetization was discussed on the basis of AB-interaction and migration of
Cu2+
and Fe2+
ions from B to A-sites. The results indicated that La ions occupied B-sites
only. The Y-K angles measured for NiFe2O4, Zn0.2Ni0.8Fe2O4, Ni0.8Cu0.2Fe2O4 and
Page 25
Zn0.2Ni0.6Cu0.2Fe2O4 compositions revealed [13] Neel type of spin arrangement on
sublattices and all other compositions showed non-collinear type of spin arrangement.
Rare earth substituted Ni0.7Zn0.3Fe1.92R0.08O4 ferrites (where R is Yb, Er, Tb, Gd,
Dy, Sm and Ce) prepared by ceramic method, were reported [14]. It was observed that
the substitution of these ions had marked effect on the electrical and magnetic properties.
It was also noticed that Er-substituted samples show minimum Curie temperature (Tc).
This decrease in Tc was attributed to the influence of R-R and R-Fe interactions. On the
other hand highest specific magnetization was observed for Er and Gd substituted
samples and it was supposed that Er and Gd ions get ferromagnetically ordered while
others antiferromagnetically. Electrical transport properties of Cd0.5Ni0.5+xTixFe2-2xO4
ferrites have been investigated. The resistivity was observed to increase with Ti-contents
and this increase in resistivity was attributed to Ti-substitution in the spinel lattice with
large ionic radius. The activation energies in the para- and ferro-regions were calculated.
It was observed that the activation energies were larger in ferro-region than para-region.
Electrical conduction mechanism was explained on the basis of Verway-de-Boer
mechanism [15].
The effect of TiO2, GeO2 and R2O3 (R = Yb, Er, Dy, Tb, Gd, Sm, Ce) on the
properties of Ni0.7Zn0.3Fe2O4 ferrites was studied [16]. It was noticed that when
germanium was absent specific saturation magnetization (σs) exhibited smaller values
and by introducing germanium instead of titanium σs attains its highest values for
(GeO2)0.03(TiO2)0.01. It was observed that the substitution of R2O3 increase the dc
resistivity except for Ce2O3 and it was attributed to the formation of insulator
intergranular layers. The rare earth ions with large ionic radius and with stable valence of
Page 26
3+ were found to be the best substituents for the improvement in the magnetic and
electrical properties. The Gd2O3 were preferred substituent in these ferrites.
The structural and electrical properties of CdxCu1-xFe2-yGdyO4 (x = 0.0, 0.2, 0.4,
0.6, 0.8 and 1; y = 0.0 and 0.1) ferrites synthesized by standard ceramic technique, were
investigated [17]. The X-ray study revealed that for x ≥ 0.2 the samples were cubic
spinels, while for x = 0 the samples were tetragonal. It was noticed that the variation of
the lattice constant with cadmium concentration obeyed the Vegard’s law. The infrared
absorption spectra indicated that Gd ions were occupied on octahedral sites.
The electrical and magnetic properties of Ni0.7Zn0.3Fe1.98R0.02O4 (R = Yb, Er, Dy,
Tb, Gd, Sm, Ce) ferrites prepared by ceramic method were reported [18]. The results
show that the substitution of rare-earth ions improved the temperature dependent initial
permeability and it does not depend on porosity. The electrical resistivity was found to
increase by the substitution of rare earth ions and it was attributed to the structural
heterogeneity generated by insulating intergranular layers. The highest magnetization
about 100-103 emu/g for Er and Gd substituted samples was observed while the lowest
magnetization for Cesium (Ce) substituted was indicated at 77 K.
Nickel ferrites were prepared by ball milling and their structural, electrical and
magnetic properties were studied [19]. It was noticed that NiFe2O4 spinel phase was
completed after 35 hrs of milling and the resistivity decreased by four orders of
magnitude with the increase of milling time. It was observed that the magnetization
increased as a function of milling time.
The electrical and magnetic properties of Cr3+
substituted Ni-Sn ferrites
synthesized by ceramic method were investigated [20]. The increase in dc resistivity was
Page 27
observed when Cr-was substituted and it was explained on the basis of Verwey hopping
mechanism. The dielectric and magnetic loss tangent were decreased for Cr substitution.
It was noted that the saturation magnetization and the Curie temperature were decreased
with increased substitution of Cr and were explained on the basis of three sublattice
magnetizations and exchange interactions. The decrease in initial permeability was
attributed to the decrease in saturation magnetization.
The magnetization behaviour of Cr substituted Zn-Cu ferrites have been discussed
[21]. The observed higher values of Hc at low temperatures indicated the single domain
behaviour. The values of saturation magnetization and hysteresis loops at high magnetic
fields showed that the compounds were highly anisotropic ferrimagnets.
The properties of Ni-Zn ferrite powders prepared by chemical coprecipitation
were reported [22]. The results showed that the precipitate dried at 80 °C revealed cubic
structure and saturation magnetization Ms = 44 emu/g. When these precipitates were
calcined at 1200°C, the magnetization was observed to increase up to 67 emu/g. The
temperature dependence of magnetization indicated the Curie temperature Tc = 480°C.
Magnetic properties of Ni0.5Zn0.5BixFe2.0-xO4 (0 ≤ x ≤ 0.2) ferrites were investigated [23].
It was noticed that saturation magnetization decreases as the bismuth (Bi) concentration
increases. The decrease in saturation magnetization was explained on the basis of two
sublattices in the spinel structure, with Bi5+
ions replacing some of Fe2+
ions.
The ferromagnetic resonance (FMR) in polycrystalline MgFe2O4 ferrite spheres
have been analyzed by investigating the size of the sample [24]. The results indicated that
the values of signal intensity (SI), resonance field (Hres) and line width (ΔH) turned out to
increase with the increase of sample volume. Schlomann’s theories for Hres and ΔH
Page 28
respectively, are satisfactory to explain the values of Hres (0) and ΔH (0) which do not
embody the shift of parameters due to the sample size. The volume dependence of SI
means the complete penetration of the rf field into the sample, and that of ΔH implies that
it may be closely related to the number of scattering sources like pores. It was concluded
that the effect of sample size on FMR should be considered when analyzing the physical
meaning of FMR parameters.
Rare earth substituted Ni-Zn ferrites (R= Yb, Er, Dy, Tb, Gd, Sm, and Se)
prepared by solid state reaction method have been reported [25]. The compositional
effect of these rare earth ions on lattice constant, bulk density, electrical resistivity,
activation energy, carrier concentration, mobility and vickers hardness was investigated.
It was concluded from XRD analysis that the substitutions of all rare-earth ions favour
the formation of a secondary phase. The electrical resistivity and bulk density were
observed to increase by rare earth ions substitution. The temperature dependent resistivity
measurements indicate two regions of different activation energies. These ferrites were
found to have high activation energies which were attributed to the carrier mobility at
higher temperatures.
The physical and initial permeability measurements on Cu-Mg-Zn ferrites
prepared by coprecipitation technique were reported [26]. It was noticed that as the
concentration of magnesium was increased the density increased while the lattice
parameter decreased and these were attributed to ionic sizes of Mg2+
and Cu2+
ions. The
Curie temperature was almost constant for all the compositions. The observed change in
the values of initial permeability was attributed to variations of magnetization (Ms) and
average particle diameter (D).
Page 29
The properties of Mn-substituted Ni-Cu-Zn ferrites prepared by ceramic method
were investigated [27]. It was observed that the substitution of Mn for Fe revealed an
increase in initial permeability and bulk density of these ferrites. The results also showed
that the substituted samples have larger grain size. The resistivity was found to decrease
from 1010
to 107 Ω-cm with Mn content and was attributed to electron hopping
mechanism from Fe2+
to Fe3+
ions. The coercivity varies inversely to grain size.
The magnetic properties of the Mg1+xMnxFe2–2xO4 (0.1≤ x ≤ 0.9) spinels prepared
by double sintering ceramic method were investigated [28]. The cation distribution
revealed that Mn4+
ions occupy only octahedral sites replacing Fe3+
ions and Mg2+
ions
were substituted for Fe3+
ions on tetrahedral sites. The observed Mossbauer data
indicated the short range ordering in these samples. It was proposed that with increasing
Mn-concentration the frustration and disorder were increased in the system.
Electrical measurements were carried out on the compositions Co0.2Zn0.73Fe2O4,
Co0.30Zn0.60Fe2O4, Co0.37Zn0.51Fe2O4 and Co0.5Zn0.34Fe2O4 [29]. It was found that
resistivity initially decreases then increases as concentration of Co increases. It was
suggested that the decrease in resistivity was due to the shifting of Fe2+
ions to tetrahedral
sites and increase may be due to the unavailability of ferrous ions on octahedral sites. A
change of slope was observed in the Arhenius plots indicating the presence of two
regions of activation energy. The smallest value of activation energy for
Co0.30Zn0.60Fe2O4 was observed which was attributed to the creation of small number of
oxygen vacancies as Co was substituted into the spinel lattice.
The temperature dependent electrical and dielectric properties of Si-substituted
CoFe2O4 ferrites were studied [30]. The decrease in DC resistivity with increasing Si
Page 30
concentration was observed and it was attributed to the hindrance in the Verwey
mechanism. It was observed that for various Si-concentrations in CoFe2O4 resistivity (ρAC
and ρDC) decreases with increasing temperature, whereas dielectric constant (ε/ and ε
// )
increases with increasing temperature suggesting that the dielectric constant is roughly
inversely proportional to both ac & dc resistivities.
A few properties of Li-Cd ferrites prepared by ceramic technique were studied
[31]. The single phase structure was confirmed by X-ray diffraction analysis. The lattice
parameter was observed to increase linearly with Cd concentration and was attributed to
ionic volume differences of the component cations involved. It was noticed that the
magnetic moment (nB) was found to increase with Cd content up to x = 0.3, and thereafter
it decreased. The increase in magnetization was explained on the basis of Neel’s two
sublattice model whereas decrease in magnetization was attributed to the presence of a
triangular type of spin arrangement on the B-site suggested by Yafet and Kittel.
The magnetic properties of the ferrites with compositions Co0.5Zn0.34Fe2O4,
Co0.37Zn0.51Fe2O4, Co0.3Zn0.6Fe2O4, Co0.2Zn0.74Fe2O4 were investigated [32]. The results
revealed that the coercivity and porosity exhibit almost similar behaviour, where as the
remanence was observed to decrease with increasing Zn content. The saturation
magnetisation and magnetic moments showed decreasing behaviour with increasing Zn-
content and was attributed to the strengthing of B-B interaction followed by the
weakening of A-B interaction. The Y-K angles increase with increasing Zn-concentration
and were explained on the basis of triangular-type spin arrangement on B sites.
The magnetization behaviour of Cu1-xZnxFe2O4 (x = 0, 0.25, 0.50, 0.75, 1) ferrites
measured by AC magnetic susceptibility using a mutual inductance technique was
Page 31
reported [33]. It was noticed that with the increase of Zn-content from 0.0 to 0.75, the
Curie temperature and the saturation magnetization were found to increase and thereafter
decreasing trend was observed. This effect was partially related to the low magnetic
moments of Zn2+
ions. The Y-K angles increased gradually with increasing zinc content.
It was concluded that the values of Y-K angles indicated that mixed zinc ferrites exhibit
non-collinear type of ordering while CuFe2O4 showed Neel’s type of ordering.
Electrical properties of Mg-Zn ferrites prepared by solid state reaction method
have been reported [34]. The sintered density of these ferrites was found to increase from
2.01 to 4.3 g/cm3 with the substitution of Cu ions. The results indicated that the sintered
ferrites having electrical resistivity greater than 108 Ω-cm was obtained at relatively low
sintering temperature ~1050°C for x = 0.3.
Physical and electrical properties of gadolinium substituted NiFe2O4 ferrites
prepared by ceramic method have been reported [35]. The single phase spinel structure
was confirmed by x-ray diffraction. The effect of compositional variation on lattice
parameter, bulk density, theoretical density and porosity was reported. The room
temperature dc resistivity was discussed on the basis of Gd-substitution for Fe3+
ions on
octahedral sites (B-sites).
The superparamagnetic MgFe2O4 spinel ferrite nanoparticles with the particle size
from 6 to 18 nm were investigated [36]. It was observed that the blocking temperature
and coercivity unambiguously correlated with particle size. Such correlation was
consistent with the Stoner-Wohlfarh theory on single domain particles. The
superparamagnetic properties of these nanoparticles with relatively large size clearly
Page 32
suggest great potentials of developing superparamagnetic nanoparticles from spinel
ferrites.
The physical properties of Al3+
substituted MgFe2O4 ferrites have been reported
[37]. X-ray diffraction analysis indicated the single-phase spinel structure. It was noticed
that the lattice constant decreases gradually obeying the Vegard’s law. The decrease in
lattice constant was attributed to the ionic radii of Al3+
and Fe3+
ions. It was observed that
the ionic radius of octahedral site decreases with the increase in Al3+
concentration and it
was attributed to the replacement of larger Fe3+
and Mg2+
ions by smaller Al3+
on B-sites.
The bulk density was observed to decrease and this was due to the difference in atomic
weight and density of Al3+
(27, 2.79 gm-3
) and Fe3+
(55.8, 7.87 gm-3
).
The formation of magnesium ferrite powders as a function of milling time and at
different sintering temperatures was investigated [38]. The powders after different
milling times were examined by X-ray diffractometry and optical microscopy. After a
milling the powder for 23 h, magnesium ferrite was formed. The milled and unmilled
powders were sintered for 2 h at temperatures of 800, 1000 and 1300°C. The unmilled
powder showed partial formation of magnesium ferrite sintered at 1300°C while
complete formation of magnesium ferrite was obtained for milled powder sintered at
1300°C.
The effect of substitution of rare earth ions (R= Yb, Er, Dy, Tb, Gd and Sm) on
the electrical and magnetic properties of Li-Zn ferrites synthesized by solid state reaction
was investigated [39]. It was noticed that the Li-Zn substituted ferrites may favour the
formation of second phase due to larger ionic radii and inhibited the grain growth and
hence increased the resistivity of these ferrites. Also the substitution of these rare earth
Page 33
ions tend to flatten the initial permeability curves, shift the Curie point to lower
temperature and lowered the porosity from 8 % to 5 %.
The temperature dependent electrical transport properties of CoxZn1-xFe2O4
ferrites were studied [40]. It was found on the basis of the results of Seebeck coefficient
that these ferrites may be classified as n-type and p-type semiconductors. The electrical
conductivity of all the ferrites was observed to increase with increasing temperature
indicating semiconductor behaviour of these ferrites. It was noted that activation energy
in the ferromagnetic region was less than the paramagnetic region. The temperature
dependent mobility and electrical conductivity along with conduction mechanism in these
ferrites were discussed.
The electrical properties of Li-Mg ferrites synthesized by double sintering method
were studied [41]. The decrease in the ac resistivity was observed with increase in
frequency, which indicates that the samples exhibited normal ferrimagnetic behavior. The
inverse trends of compositional variation of resistivity and dielectric constant were
observed. The sample with x = 0.3 showed the lowest resistivity and the highest dielectric
constant. The dielectric loss tangent showed maxima at 3 kHz for x = 0.2. The variations
in all the parameters were explained on the basis of Fe2+
and Fe3+
ion concentrations and
electronic hopping frequency between these ions.
Electrical resistivity of Mg1.5-xZnxMn0.5Fe2O4 (where x = 0.0, 0.1, 0.2, 0.3, 0.4,
0.5, 0.6) ferrites prepared by double sintering ceramic method are reported [42]. X-ray
diffraction analysis confirmed the single-phase spinel structure. The lattice constant was
observed to decrease up to x = 0.3 and thereafter it was increased for further substitution.
The dc resistivity was decreased up to x = 0.2 and it increased there after. The observed
Page 34
decrease in resistivity was attributed to the production of Fe2+
ions due to volatilization of
Zn at elevated firing temperature. The temperature dependent resistivity plots followed
Arrhenius relation.
Dielectric measurements on the ferrites with chemical composition NixZn1-xFe2O4
synthesized by double sintering ceramic technique are reported [43]. The dielectric
properties such as dielectric constant, dielectric loss tangent and complex dielectric
constant were investigated. It was noticed that the dielectric constant was inversely
proportional to the square root of the resistivity.
ZnxMg1-x-yZryFe2-2yO4 with x = 0.1, 0.2, 0.3, 0.4 0.5 and y = 0.01, 0.03, 0.05, 0.07
ferrites were synthesized by standard ceramic method and their structural properties were
studied [44]. It was reported that the X-ray diffraction analysis reveal single-phase spinel
structure and the observed increase in lattice constant with the increase of Zn and Zr-
concentrations obeyed the Vegard’s law. In the IR analysis the splitting of ν 2 band was
attributed to the presence of Zr4+
ions on the octahedral sites. It was concluded that the
addition of Zn lowered the Curie temperature and weakened the A-B interactions.
The magnetic properties of ZnxMg1-x+yZryFe2-2yO4 (x = 0.1, 0.2, 0.3, 0.4, 0.5 and
y = 0.01, 0.03, 0.05, 0.07) ferrites synthesized by ceramic method were investigated [45].
It was reported that magnetic moment and saturation magnetization of these ferrites obey
the Neel’s two sublattice model for x ≤ 0.3 and for x > 0.3 the Y-K model hold good. The
substitution of Zn caused to increase the Y-K angles above x =0.3 in these ferrites. The ac
susceptibility results revealed the presence of multidomain (MD) particles in these
ferrites. The single-phase structure was verified by the sudden drop of susceptibility
curves near the Curie temperature.
Page 35
The spinel ferrites ZnxFe2O4 (where x = 0.3, 0.5, 0.7, and 0.9) prepared by double
sintering method and their temperature dependent electrical conductivity and
thermoelectric power was investigated [46]. The plots of temperature dependent electrical
conductivity were observed to increase with the increase of temperature and showed
transition near Curie temperature. It was noted that the activation energy in ferrimagnetic
region was less than that in the paramagnetic region.
The magnetic properties of Cu0.5Zn0.5Fe2-xRxO4 (R = La, Nd, Sm, Gd and Dy)
where x = 0.0 and 0.1 ferrites synthesized by ceramic method were reported [47]. The X-
ray diffraction analysis revealed single-phase spinel structure. The lattice parameter and
Curie temperature of these samples were found almost independent of the type of rare
earth ion substituted. The substitution of Dy ions revealed highest density and lowest
porosity as compare to other rare earth substituted ferrites. The relative permeability was
increased up to 60 % as compared to the unsubstituted samples.
The infrared spectra of LixMg0.4Zn0.6-2xFe2xO4 ferrites prepared by ceramic
method were investigated in the wave number range 200–800 cm-1
[48]. The X-ray
diffraction analysis confirmed the single-phase spinel structure. The spectra of these
ferrites showed two fundamental absorption bands ν1 and ν2 in the range 600–400 cm-1
,
corresponding tetrahedral and octahedral complexes, respectively. These bands were
found to shift gradually towards the lower frequency side with the increase of Zn content,
which was attributed to the increase in the lattice parameter and bond lengths (RA and
RB).
Structural and electrical properties of Nd3+
substituted Zn-Mg ferrites synthesized
by ceramic method were investigated [49]. Single-phase spinel structure was predicted by
Page 36
XRD analysis and the lattice constant was increased linearly obeying Vagard’s law with
Zn- concentration. The lattice constant was observed to decrease slightly with the
substitution of Nd3+
for Fe3+
ions. This decrease in lattice constant was attributed to the
occupancy of Nd3+
ions on octahedral sites. It was proposed that Zn ions prefer A-sites
while Nd ions occupied B-sites. It was observed that Nd substituted samples have high
resistivity as compared to unsubstituted samples.
The electrical properties of Co substituted Li-Sb ferrites synthesized by double
sintering ceramic technique was reported [50]. XRD results revealed that the samples
were single-phase. The increase in lattice constant was noticed and it was attributed to
larger ionic radius of Co2+
as compare to other constituents. The decrease in temperature
dependent resistivity was reported and it was explained on the basis of cation distribution
and the presence of cobalt ions in the two valence states at the octahedral site. The
dielectric behaviour of all the samples were studied in the frequency range 100 Hz to 1
MHz and the possible mechanisms involved were discussed. The saturation
magnetization was explained on the basis of Neel’s model and the cation distribution.
It was noticed that the addition of Sb2O3, Na2O3, CaO and ZrO2 have marked
effect on the properties of Ni0.255Zn0.745Fe2O4 ferrites which have Curie point around 0°C
[51]. The results showed that Na2O3 and Sb2O3 addition increased the Curie temperature
while CaO addition lowered the Curie temperature. The change in Curie temperature was
attributed to the slight modification of the A-B exchange interaction strength. The Initial
permeability and electrical resistivity were improved by all these additives but CaO was
found to be the best one.
Page 37
The magnetic properties of Ni0.65Zn0.35Cu0.2Fe1.8O4 particles synthesized by sol–
gel method were reported [52]. All the peaks of X-ray diffraction patterns were consistent
with the standard Ni-Zn ferrites. The magnetic behavior of these ferrite powders fired at
and above 623 K yielded a decrease of the coercivity and an increase of the saturation
magnetization was observed. The maximum coercivity and the saturation magnetization
of these ferrite powders were observed as Hc = 96 Oe and Ms = 68 emu/g respectively.
A systematic line broadening effect in the Mossbauer spectra was observed and was
explained on the basis of temperature dependence of the magnetic hyperfine fields at
various iron sites.
The dielectric properties of Li0.5-x/2CoxFe2.5-x/2O4 (where x = 0.1, 0.2, 0.3, 0.4, 0.5,
0.6, 0.7) ferrites have been reported [53]. It was noticed that the compositional variations
of DC resistivity and dielectric constant with concentration (x) shows inverse trend with
each other. The temperature dependent dielectric constant was observed to increase
slowly from 0 to 450 in the beginning and sharply after 200°C. The DC resistivity and
dielectric constant decreases with the increase in frequency for all the samples. The
variation of tanδ with frequency showed cusps for all the samples except for x = 0.5. All
these variations were explained on the basis of Koop’s theory and concentration of Fe2+
and Fe3+
ions.
The structural and infrared studies of MgCrxFe2-xO4 ferrites (where x = 0, 0.1, 0.3,
0.5, 0.7, 0.9 and 0.1) prepared by double sintering method were investigated [54]. The
lattice parameter, X-ray density and distance between magnetic ions in both octahedral
and tetrahedral sites were observed to decrease with increase in Cr- concentration. The
infrared spectra obtained in the range 200 to 800 cm-1
showed two absorption bands. The
Page 38
force constants were obtained from the infrared absorption data and were discussed with
reference to the internuclear distances.
LixCu0.4Zn0.6-2xFe2+x (where x = 0.0, 0.05, 0.1, 0.15, 0.2, 0.25 and 0.3) ferrites
were studied [55]. It was noticed that the X-ray analysis revealed the single phase spinel
structure and the lattice parameter found to increase linearly with Zn content, which was
attributed to ionic size differences of the cations involved. The bond lengths RA and RB
were found to increase with increase in Zn concentration and were attributed to the
increase in lattice parameter. The magnetic moment found to increase with increase in
zinc content up to x =0.3 and thereafter decreased. The decrease in magnetic moment was
attributed to the triangular type of spin arrangement on B-sites suggested by Yafet and
Kittel.
The effect of small substitution of iron with rare-earth ions on the properties of
Ni0.50Zn0.51Fe1.96R0.040O4 (R = Pr, Nd, Eu, Ho, Tm, Lu) ferrites was investigated [56]. The
results revealed that depending on the type of precursor used, narrow particle size
distributions and a very homogeneous distribution of the rare-earth cations in the mixed
metal oxide were achieved. The sintering process indicated that all rare earth additions
form various secondary phases. The observed differences in the electrical and magnetic
properties of the doped samples were interpreted on the basis of phase composition and
microstructure.
The magnetic interactions in Zn-substituted CuFe2O4 ferrites were studied [57]. It
was noticed that the dominant interaction in all ferrite samples is A–B interaction which
is due to the negative values of paramagnetic Curie temperature θ (K) and the distribution
of cations among A and B sites showing that the magnetic ordering is antiferromagnetic.
Page 39
The Curie temperature (Tc) was observed to rise up to x = 0.75 which may be due to
increase in exchange interaction and magnetic moments. For x > 0.75 , Tc decreased due
to cation distribution on A and B-sites resulting in the weakening of A–B interaction due
to the presence of triangular spin arrangement of the Y–K type on B-sublattice.
ZnxMg1−xFe2−yNdyO4 (x = 0.00, 0.20, 0.40, 0.60, 0.80 and 1.00; y = 0.00, 0.05 and
0.10) ferrites prepared by ceramic method were studied [58]. It was noticed that the
magnetization show increase in saturation magnetization with Zn2+
concentration up to x
= 0.40 and decreases thereafter, suggesting the existence of the canted spin structure. The
saturation magnetization was observed to decrease by the substitution of small amount of
Nd3+
ions. For the compositions, x ≥ 0.80 exhibited paramagnetic behaviour at and above
room temperature. The frequency dependence of the initial permeability spectrum was
observed to show dispersion in permeability against frequency. The dispersion frequency
was found to be lower for high permeability compositions than those of lower
permeability. The substitution of Nd3+
resulted into reduction in the initial permeability.
The effect of In3+
, Al3+
and Cr3+
ions on the electrical and magnetic properties of Mg–Mn
ferrites has been investigated [59].
The results revealed that the substitution of In3+
ions in place of Fe3+
ions
increases the lattice parameter, due to the larger size of the substituted ions, whereas
lattice parameter was observed to decrease by the substitution of Al3+
and Cr3+
ions in
place of the Fe3+
ions, owing to the smaller sizes of these substituted ions. The
improvement in the d.c. resistivity has been observed at the expense of deterioration in
the magnetic properties of Al3+
and Cr3+
substituted Mg–Mn ferrites. The saturation
magnetization and initial permeability were found to increase with the increase of In3+
Page 40
ions and was attributed to the incorporation of indium ions into the A sublattice. A
marked increase in the value of initial permeability was found for the composition
Mg0.9Mn0.1In0.5Fe1.5O4.
The magnetic and dielectric properties of Mg1+xTixFe2-2xO4 (0.1 ≤ x ≤ 0.9) ferrites
were studied [60]. The analysis of X-ray diffraction showed that the unit cell parameter
increases with Ti concentration and ascribed to the predicted variation of the cation
distribution. It was noted that the variation of the dielectric properties depends mainly on
the valence exchange between the different metal ions in the same site or in different
sites. The parameters such as dielectric constant, dielectric loss and molar magnetic
susceptibility showed a decrease in magnitude with increasing Ti and Mg concentration.
It was found that the composition with x = 0.7 exhibit no significant behavior in the
dielectric constant and shows a typical paramagnetic behaviour without a spinel structure
as in the X-ray diffraction pattern which is compatible with the Monte-Carlo simulation
of Scholl and Binder.
The spectral and transport phenomena in NiGdxFe2-2xO4 (x = 0, 0.1, 0.3, 0.5 and
0.7) ferrites were studied [61]. The X-ray analysis exhibited that the sample have spinel
phase structure for x ≤ 0.1 and thereafter the samples have second phase besides the
spinel phase. The bands observed at 579 cm-1
(ν1) and 397cm-1
(ν2) in FTIR profile were
assigned to tetrahedral and octahedral group complexes, respectively. The results
indicated that the presence of the bands at 307 cm-1
and 455 cm-1
was the evidence of the
entry of Gd3+
ions instead of Fe3+
ions at B-site and these bands appeared due to (Gd3+
-
O2-
) stretching vibration. The second intergranual insulating phase increases the
resistivity of the samples. The activation energy of conductivity and that for mobility
Page 41
showed a good agreement which is an evidence for the presence of hopping conduction in
the ferrimagnetic region.
Electrical transport properties of erbium substituted Ni–Zn ferrites of various
compositions have been investigated [62]. The plots of log (ρ) versus 103 /T indicated
linear behaviour. The results indicated that the activation energy in the ferrimagnetic
region was less than that in the paramagnetic region. It was observed that the resistivity
for gadolinium substituted ferrites was higher than the erbium substituted ferrites. The
higher resistivity was attributed to the increase in the lattice strain because of the higher
ionic radius of the gadolinium compared to that of erbium. Amongst all the samples
studied, the specimen Ni0.7Zn0.3Er0.2Fe1.8O4 exhibited the lowest value of charge carrier
mobility.
The rare earth (Dy, Ho and Er) substituted Co0.2Zn0.8Fe2-xRExO4 ferrites (x = 0.05,
0.1) were studied thoroughly [63]. It was observed that in these ferrites frustration and
exchange couplings between 3d and 4f electrons spin play a major role in magnetic
ordering. It was suggested that the substitution of Dy, Ho and Er in Co0.2Zn0.8Fe2-xRExO4
ferrites is possible up to x = 0.05 beyond which an impurity phase of ortho ferrite
appears. It was observerd that due to strong dilution on A-sites & B-sites moments form
finite clusters of Fe3+
ions with free moment 5 μB. The small finite clusters were freezed
at low temperature due to frustration and short range antiferromagnetic interaction,
showing spin glass like phase.
The ferrite samples with chemical composition Cu0.7 (Zn0.3-xMgx) Al0.3Fe1.7O4
(x=0.05, 0.1, 0.15 and 0.2) prepared by ceramic technique at 1000°C, were found to have
cubic spinel structure [64]. The lattice parameter was observed to decrease with
Page 42
increasing Mg content and may be attributed to the small ionic radius of Mg relative to
that of Zn. It was observed that the increase of Mg content forced the structure of these
compounds to be a normal spinel. This is evident from parameters obtained during the
refinement of the structures. The bond length of the tetrahedral site was observed to
increase and the bond length of the octahedral site was decreased which was due to
relative fraction of magnesium to zinc occupied in the tetrahedral sites.
The changes in crystal structure of magnesium (MgFe2O) ferrite caused by
mechanically treated high-energy milling were investigated [65]. Mechanical treatment of
MgFe2O4 exhibited the formation of the nanoscale structure with the crystallite size of
about 10 nm. It was noticed that the metastable nanostructural state of the milled
MgFe2O4 was characterized by a reduced concentration of iron cations on (A) sites. The
range of the thermal stability of the mechanically induced defects in the structure of
milled MgFe2O4 was extended up to 600 K. Beyond this, a gradual recrystallisation of the
nanoscale MgFe2O4 powders were taken place and the mechanically induced cation
distribution was relaxed toward its equilibrium configuration.
A detailed investigations on CdxCu1-xFe2-yGdyO4 (X=0.00, 0.20, 0.40, 0.60, 0.80
and 1.00; y=0.00, 0.10 and 0.30) ferrites prepared by ceramic method were carried out
[66]. It was observed that X-ray diffraction indicate the formation of single phase cubic
spinel ferrite for the compositions with x ≥ 0.20 and tetragonal structure for the
compositions x = 0.00; and for all values of Gd3+
(y = 0.00, 0.10 and 0.30) concentration.
The saturation magnetization and magnetic moments were found to increase with
cadmium concentration up to x = 0.40 ; and for all values of Gd3+
content, obeying Neel’s
two sublattice model and for x > 0.4, the saturation magnetization decreased. This
Page 43
decrease in Ms was due to occupancy of Gd3+
ions on octahedral sites, resulting into
dilution in the magnetization of B sublattices. It was observed that Curie temperature (Tc)
for all compositions decreases with the substitution of Cd2+
. The decrease in Tc was
attributed to the occupancy of cadmium on tetrahedral (A)-sites causing dilution in the
inter site magnetic interaction.
The preparation and characterization of LixMg0.4Zn0.6-2xFe2+xO4 (where x = 0,
0.05, 0.10, 0.15, 0.2, 0.25 and 0.3) ferrites have been reported [67]. X-ray diffraction
analysis indicated the single phase formation of these ferrites. It was noticed that the
lattice constant increases linearly obeying Vegard’s law. The observed increase in bond
lengths and site radii was attributed to the increase of lattice constant. FTIR spectra
revealed the absence of double band near 600 cm-1
which indicate the non-availability of
Fe2+
ions in these ferrites. The Curie temperature was found to decrease with Zn content.
Rare earth substituted (R = La, Nd, Sm, Gd and Dy) Mn–Zn ferrites have been
investigated [68]. The single spinel phase formation of these ferrites was exhibited by the
X-ray diffraction analysis. The substitution of rare earth ions in Mn-Zn revealed that the
porosity increases while the grain size is observed to decrease. Also the substitution of
these ions resulted in decrease of the initial permeability and Curie temperature. The
electrical resistivity was found to increase for all substituted samples, except for R = Sm.
The increase in resistivity was due to the presence of these ions inside the grains which
hinder the motion of electrons between Fe2+
and Fe3+
.
The magnetic properties of Mn-substituted MgCuZn ferrites were reported [69]. It
was noted that all the samples were sintered at low temperature (930 °C). The
substitution of Mn was reported to increases initial permeability and decreases the grain
Page 44
size. The increase in the initial permeability of MgCuZn ferrites was attributed to the
decrease of magnetostriction constant. It was found that all the samples have fine grains
and the grain size was less than 2 μm.
The ferrites with nominal compositions Mg1+xTixRyFe2-2x-yO4 (where 0 ≤ x ≤ 0.9;
0 ≤ y ≤0.5; R = La, Nd and Gd) were fabricated for IR spectroscopic analysis [70]. The
presence of Fe3+
ions on both tetrahedral and octahedral sites was indicated by the
formation of absorption bands at ≈ 585 and ≈ 442 cm-1
. The existence of vibrational
bands at ~ 363 cm-1
revealed the presence of Fe2+
and Mg2+
ions on B-sites and enhances
the predominance of Verwey mechanism. It was observed that the rare earth type causes
a small shift in the vibrational bands. This shift was attributed to the variation of ionic
radii, which gives rise to the change in lattice constant.
Mg0.9Mn0.1InxFe2-xO4 and Mg0.9Mn0.1CryFe2-yO4 ferrites have been investigated
for magnetic properties [71]. It was observed from the results that the saturation
magnetization (Ms) values initially increase with the addition of In3+
ions and show a
rapid decrease at higher concentrations while in the case of Cr-samples saturation
magnetization decreases. The Curie temperature was observed to decrease with
increasing concentrations of both indium and chromium. The observed variations in
Curie temperature and Ms values were attributed to the exchange interactions. It was
found that In3+
ions play more significant role as compared to Cr3+
ions, in enhancing the
initial permeability. The results indicated that the magnetic loss factor values lie in the
range of 0.15–0.75 within the frequency range of 10 kHz–10 MHz.
The effect of Zn substitution on magnetic properties of Cu1-xZnxFe2O4 (where x =
0.0, 0.25, 0.50, 0.75, 1.00) ferrites have been reported [72]. The microstructure analysis
Page 45
revealed that both porosity (P) and coercivity (Hc) were observed to decrease with the
substitution of Zn. The coercivity was inversely proportional to grain size while the Curie
temperature (Tc) was found to increase from 538 to 560 K. The decrease in Hc with grain
size was correlated fairly well with Neels’ two sublattice model.
The ferrite system MgxAl2x Li0.5(1-x)Fe2.5(1-x)O4 (x = 0.0, 0.1, 0.2, 0.3, 0.4 and 0.5)
have been investigated by means of X-ray diffraction, magnetization and a.c.
susceptibility measurements [73]. It was found that the cation distribution determined
through X-ray data is consistent with the magnetization and susceptibility measurements.
The results revealed that Li 1+
and Al3+
have strong preference for octahedral site as
compared to Mg2+
. The collinear type of magnetic ordering in the system was observed
and the variation of magnetization was explained on the basis of Neel’s collinear model.
The variation of the complex permeability with frequency of Ni1-xZnxFe2O4 (x = 0.5, 0.6
and 0.7) ferrites has been measured over a wide range of frequency ~ 1.8 GHz [74]. The
results exhibited that the substitution of Zn content improves permeability but moves the
onset of resonance to lower frequencies. The effect of the substitution of small amounts
of Ruthenium, Yttrium and rare-earth cations into the Ni0.5Zn0.5MxFe2-xO4 ferrite (x = 0.5,
0.6 and 0.7) has been also investigated. The samples substituted with Ru and Gd
improves microwave behavior compared to non-substituted samples.
The electrical and structural properties of Mg1+xTixRyFe2-2x-yO4 (x = 0.5, y = 0,
0.025 and R = Nd, Gd and La) have been reported [75]. It was observed that the samples
were crystallized in the spinel phase. The experimental results showed that the rare earth
ions initiate new sites called dodecahedral (C-sites) and increase the valence exchange
between the different metal ions existing in the different sites. This behavior was
Page 46
observed at certain concentrations of the rare earth ions. The low rare earth concentration
and high sintering times (100h) leads to an inflection in the electrical properties. The
Verwey conduction mechanism and hopping were used to interpret the conductivity of
the samples. The activation energies were lower in low temperature range as compared to
high temperature range due to the presence of more than one conduction mechanism.
The ferrites system Mg1-xZnxFe2O4 (where x = 0, 0.1, 0.2, 0.3, 0.4, 0.5 and 0.6)
have been reported [76]. The lattice parameter was observed to increase with increasing
the zinc concentration and it was attributed to the ionic radii of the cations. The
magnetization results indicated that for x ≤ 0.3, the ratio Br/Bs (squareness ratio)
increased by 66% and Hc increased by 14 %. But for x ≥ 0.3 Br/Bs decreased by 27 %
and Hc decreased by 43 %. The behaviour of μi with temperature exhibited that the
samples for x ≤ 0.3 shows multi domain and thereafter the samples were found as single
domain.
The dielectric properties of Cu0.5Zn0.5Fe2–xRxO4 (R = La, Nd, Sm and Gd; x = 0
and 0.1) ferrites were reported [77]. The results revealed that ε′ and tan δ decrease with
increasing the frequency while σac is observed to increase. Also ε′, σac and tan δ were
found to increase with temperature. No relaxation was detected in tan δ(f) in the
investigated frequency range, while tan δ(T) showed two maxima. The composition
dependence of the dielectric parameters was discussed and the results were explained
using Koops’s model.
Electrical transport properties were investigated on Ni1-xCdxFe2O4 (x = 0.2, 0.4,
0.6 and 0.8) ferrites [78]. The results indicated that the electrical conductivity varies from
3.96x10⁻⁸
to 1x10⁻⁴
Ω-1
cm-1
and were observed to decrease with increase in the cadmium
Page 47
concentration. It was noticed that the composition Ni0.2Cd0.8Fe2O4 exhibited the highest
value of electrical resistivity (ρ = 2.53 x 10⁷ Ω cm). The Seebeck coefficient was found to
be negative for all the ferrites, indicating that these ferrites behave as n-type
semiconductors. These results suggested explanation for the conduction mechanism in
these ferrites.
The cation distribution in the ferrites having general formula Ni1+xPbxFe2-2xO4
(where x = 0.0, 0.1, 0.2, 0.3, 0.4 and 0.5) prepared by ceramic method were reported [79].
The single phase formation of the samples was observed by X-ray analysis. The linear
increase of lattice parameter with composition (x) was observed and was attributed to
ionic size difference of cations involved. X-ray intensity ratio calculations revealed that
Pb4+
occupies both A and B sites, which replace Fe3+
ions and added Ni2+
ions for B-sites
iron ions. The IR bands exhibited shift towards the lower frequency side with the addition
of Pb4+
for x = 0.0–0.2, which can be attributed to increase in lattice parameter.
The dielectric properties of mixed Ni-Zn-Er ferrites have been investigated in the
frequency range 1-13 MHz using impedance analyzer [80]. It was observed that the
dielectric constant, dielectric loss tangent and complex dielectric constant of these ferrites
increases by increasing the Er content. It was noticed that the composition
Ni0.7Zn0.3Er1.0Fe1.0O4 has the maximum divalent ion concentration. The dielectric
constant was observed to decrease continuously with increasing frequency. The
maximum dielectric dispersion was observed for the composition Ni0.7Zn0.3Er1.0Fe1.0O4
and it was attributed to the available ferrous ions on the octahedral sites. The values of
dielectric transition temperature Td and Curie temperature Tc indicated that the change in
dielectric constant with temperature may be due to magnetic transition.
Page 48
The magnetic properties of CoMxFe2-xO4 (where M = Gd, Pr and x = 0, 0.1, 0.2)
were studied using vibrating sample magnetometer [81]. Thermogravimetric (TG)
indicated the formation of spinel ferrite at 220 °C and single phase nature was confirmed
by the XRD analysis. It was observed that the saturation magnetization of these ferrites
decreases with the reduction of size. It was attributed to the presence of
superparamagnetic fractions in the materials and spin canting at the surface of nano-
particles. The inclusion of rare-earth atoms inhibited the grain growth of the material.
The coercivity was observed to improve and was attributed to the contribution from the
single ion anisotropy of the rare earth ions present in the crystal lattice.
The properties of calcium substituted magnesium ferrite system were studied by
means of X-ray diffraction, magnetization, ac susceptibility and dc resistivity
measurements [82]. The XRD patterns revealed a single fcc spinel phase structure for x =
0.2. The XRD intensity analysis confirms the substitution limit and the percentage
formation of fcc phase. It was observed that about 23% of Ca2+
can be substituted for
Mg2+
for the composition x =0.25 and for x ≥0.25 an orthorhombic phase other than fcc
phase was observed. The additional orthorhombic phase appears to grow in intensity with
increase in Ca-concentration (x). The Neel’s two sub-lattice model was used to explain
the variation of Bohr magneton number. The Neel temperature determined through ac
susceptibility and dc resistivity measurements agree with those calculated using cation
distribution. The values of dc electrical resistivity were found to vary with the Ca-
content.
NiFe2O4 ferrites were synthesized by the solgel process [83]. The formation of
phase and the microstructure of these ferrites were studied by means of DTA/TG, XRD
Page 49
and SEM techniques. It was noticed that the gel after combustion was transformed into
nanocrystalline ferrite powders. The combustion process is an oxidation-reduction
process. The results revealed that Fe/Ni = 2 ratio and calcination at 1000 °C, single phase
NiFe2O4 ferrites were formed. SEM micrograph indicated the particle size less than 100
nm. The dielectric measurements were carried out for the ferrite compositions Co1-
xZnxLayFe2-yO4 0.1 ≤ x ≤ 1.0, y = 0.25 fabricated by ceramic method [84].
The dielectric constant ε' and dielectric loss factor ε" of these ferrites were
measured at different frequencies (100 kHz to 5 MHz) and at different temperatures
(300–850 K). It was observed that Maxwell Wagner polarization was dominant in the
dielectric process in the high temperature region. The electrical conductivity
measurement showed that there were more than one conduction mechanisms participating
in conductivity. It was suggested that the hopping mechanism played main role in the
conduction process. The increase in conductivity was attributed to the thermally activated
mobility and not to thermal creation of additional mobile charge carriers. The
replacement of Fe3+
by La ions on octahedral sites and the presence of Co2+
as well as
Zn2+
ions on the tetrahedral sites played a significant role in the electrical and magnetic
properties of these ferrites. The values of the activation energy obtained in this study
indicate the semi-conducting behavior of the investigated samples.
Microwave-assisted flash combustion technique was used to synthesize
Ni0.8Zn0.2Fe2O4 ferrites [85]. The pressed samples were sintered at various sintering
temperatures such as 1150, 1250 and 1350 °C. The physical properties of these ferrites
such as bulk density and porosity were studied. The dielectric properties such as
dielectric constant, dielectric loss factor and tanδ were also measured. All these results of
Page 50
the samples were compared with the properties of ferrites prepared by conventionally
heated flash combustion technique in normal heating.
The samples of Ni-Zn ferrites were fabricated by solid state reaction method [86].
In these ferrites the influence of Zn concentration on the magnetic properties was
investigated in a wide frequency range (1M–1.8 GHz). The results indicated that with the
increase of Zn concentration, the initial permeability and the relative loss factor were
found to increase while the cut-off frequency decreased. The influence of rare earth ions
(RE=Y, Eu or Gd) on the properties of these ferrites was also investigated. The
measurements showed that the partial substitution of rare earth ions with Fe3+
ions
increase the electrical resistivity and relative loss factor, whereas the Curie temperature
was slightly reduced. It was concluded that Y and Eu substitution tend to decrease the
initial permeability while Gd has no effect on it.
The effect of co-substitution of non magnetic ions, Mg+2
and Ti+4
in the nickel
ferrites fabricated by ceramic method was reported [87]. The XRD analysis confirmed
the single-phase formation of the materials. The effective modifications in the exchange
interactions were observed from structural, magnetic and Mössbauer studies. The
substitution of these ions (Mg2+
and Ti4+
) at Fe site resulted in the reduction of the
saturation magnetization, Neel temperature (TN) and initial permeability (μi). The
variations in different properties were discussed on the basis of the site occupancy of the
metal ions in the crystal structure. The reduction in magnetic moment on substitution was
also evident by the 57
Fe Mossbauer studies. At higher substitution level (x ≥ 0.4) the
relaxation was also observed from Mössbauer studies. The doublet with the two sextet
was observed in the Mossbauer spectra. This doublet was found to increase with the
Page 51
increase of substituents and was explained on the basis of domain wall oscillation and
displacement model.
Standard ceramic technique was used to fabricate the following two series of
copper ferrites, Cu1+xGexFe2−2xO4 and Cu1+xTixFe2−2xO4 with x = 0, 0.1, 0.2, 0.3 and 0.4
[88]. The analysis of X-ray diffraction patterns indicated that the samples were formed in
a single spinel phase except the sample with x = 0.4 for both series. The Curie
temperature (TC) was observed to decrease from 714 to 542K for the first series while for
the second series it decreased from 714 to 570K. The ferrite composition CuFe2O4
showed lowest value of magnetization in both series. The observed decrease in
magnetization and Curie temperature was attributed to the decrease in A–B interaction
according to Neel’s molecular field theory. The cation distribution for both series was
also proposed. It was noticed that the relative permeability show two regions for first
series and three regions for the second series.
The microwave-assisted hydrothermal reactions were carried out in a microwave
accelerated reaction system to synthesize nanosized magnesium ferrite, MgFe2O4 under
mild conditions [89]. The results of X-ray diffraction and transmission electron
microscopy revealed the average particle size of the ferrite obtained was ~ 3 nm with a
narrow size distribution. The blocking temperature ~ 38 K was measured through
magnetic measurements. It was observed that the MgFe2O4 ferrite particles show typical
magnetic hysteresis behavior below the blocking temperature and it exhibit
superparamagnetic behavior above this temperature.
The X-ray diffraction, magnetization and AC susceptibility measurements were
carried out to study the structural and magnetic properties of ZnxMg1.5-xMn0.5FeO4 with x
Page 52
= 0.0–0.6 ferrites fabricated by ceramic method [90]. The cation distribution was deduced
from the X-ray diffraction intensity analysis and the linear variation of lattice constant
with Zn concentration was explained using the proposed cation distribution. The
magnetization behaviour was explained by using three sublattice model based on the
uniform and localized spin canting approach with Zn-concentration. The AC
susceptibility measurements revealed that Neel temperature decreased with the increase
of Zn-concentration.
Aluminum substituted cobalt ferrites were prepared by ceramic method and their
AC conductivity and dielectric properties as a function of frequency and temperature
were investigated [91]. The quantum mechanical tunneling and small polaron tunneling
models were used to explain AC conductivity. The dielectric dispersion was found to be
discussed with the help of Koops model and hopping conduction mechanism. The
dielectric relaxation peaks were observed in dielectric loss tangent tan δ curves which
were due to the coincidence of the hopping frequency of the charge carriers with that of
the external fields. The increase in the dielectric parameters with the increase of
temperature was attributed to the increase of hopping frequency, while the decrease with
increasing Al ion concentration was due to the iron deficient available for the conduction
process at the octahedral sites.
Magnesium-nickel ferrites were fabricated by the solid state route at high
temperature [92]. The single-phase formation of these ferrites was confirmed by the X-
ray diffraction (XRD) analysis. It was noticed that the plot of lattice parameter versus
composition of these ferrites indicated an abrupt deviation of lattice parameter from
linearity near MgFeO4. The deviation was attributed to the distribution of Mg2+
in the
Page 53
octahedral and tetrahedral sites of the oxygen lattice. In XPS spectra, a broadening of the
Mg1s peak in Ni rich Mg–Ni ferrites from that observed in pure MgFe2O4, was explained
by due to the distribution of Mg ion in tetrahedral and octahedral sites. A depth
distribution of Mg in Ni0.5Mg0.5Fe2O4 ferrites showed an enrichment of Mg on surface.
Structural and physical properties of MnxZn1−xFe2O4, ferrites with x = 0.66, 0.77, 0.88,
0.99 synthesized by conventional double-sintering method, in which 0.5 wt.% of Si was
added as an impurity [93].
The formation of the ferrite structure and chemical phase analysis was carried out
by X-ray powder diffraction (XRD) method. The results indicated that lattice constant
found to increase proportional to the Mn concentration. The mass density of the ferrites
was observed to increase while X-ray density depend on the lattice constant and
molecular weight of the samples and it showed decreasing behaviour with increasing Mn
content (x). It was noticed that the porosity, calculated using both densities, also show a
decreasing behaviour with increase in manganese content.
The ferrites, Mg1+xMnxFe2−2xO4 where x = 0.0, 0.1, 0.2, 0.3, 0.4, 0.5, 0.6, 0.7, 0.8
and 0.9 fabricated by ceramic technique and were investigated by means of X-ray
diffraction, a.c. susceptibility and dielectric constant measurements [94]. The single-
phase formation of these ferrites was confirmed by the analysis of XRD patterns. It was
observed that lattice parameter found to increase up to x = 0.3 and for further substitution
it decreased. The cation distribution was studied by X-ray analysis and magnetization
measurements. A collinear ferrimagnetic structure was observed for x ≤ 0.3 and for x >
0.3 non-collinear structure was suggested by magnetization results. The Curie
temperature (TC) deduced from a.c. susceptibility measurements found to decrease with
Page 54
the increase of concentration. The dielectric constant ε' and loss tangent (tan δ) show
strong frequency dependence.
Standard ceramic technique was used to fabricate NixZn1−xFe2O4 ferrites, for x =
0.66, 0.77, 0.88 and 0.99, with the addition of few wt % of Si in order to improve the
resistivity of these ferrites [95]. The dc electrical resistivity was measured and then used
to calculate activation energy and drift mobility of these ferrites. The results indicated
that the resistivity was enhanced by the addition of Ni content. The temperature
dependent dc resistivity was also measured and found to decrease with increase of
temperature from 30 to 180 °C. The mobility showed increasing behaviour with
temperature and it decreased with the increase of resistivity. It was noticed that the
samples having higher values of resistivity also have higher values of activation energies
and vice versa.
Magnesium–manganese ferrites, Mg0.9Mn0.1InxFe2−xO4 and Mg0.9Mn0.1CryFe2−yO4
were prepared by the conventional ceramic process [96]. The effects of In3+
and Cr3+
ions
on the dc resistivity, dielectric constant and dielectric loss factor were investigated. The
resistivity was observed to increase with the addition of In3+
and Cr3+
ions in these
ferrites. The Verwey’s hopping mechanism was used to explain the variations in
resistivity. The activation energy, deduced from the temperature variation of resistivity,
was found to increase with increasing concentrations of In3+
and Cr3+
ions. The room
temperature dielectric constant at 100 kHz decrease with successive addition of these
ions. The variations in dielectric constant were explained on the basis of space charge
polarization. The dielectric loss tangent (tan δ) values measured at 100 kHz and 13MHz
were found to be very low for the samples with a higher concentration. The low values of
Page 55
the loss factor at a high frequency indicated that the investigated samples may have great
potential for use in microwave devices.
Zinc substituted Li–Mg ferrites having the general formula
LixMg0.4Zn0.6−2xFe2+xO4 where x = 0, 0.05, 0.1, 0.15, 0.2, 0.25 and 0.3 were prepared by
double sintering ceramic method [97]. The thermoelectric power and electrical resistivity
measurements were carried out of these ferrites. The variation of log ρ with reciprocal of
temperature showed a discontinuity at Curie temperature. It was observed that the
activation energy in the ferrimagnetic region was lower than that in paramagnetic region.
The conduction mechanism was explained on the basis of hopping of electrons. The plots
of resistivity with composition indicated that resistivity initially decrease with Zn content
up to 0.3 and thereafter it increased for further increase in Zn content. The Curie
temperature found to decrease linearly with addition of Zn concentration. The variation
of Seebeck coefficient with temperature indicated that all the samples show n-type
conductivity.
The structural and electrical properties of Sn4+
substituted NiFe2O4 with general
formula Ni1−xSnxFe2O4 (x = 0.0, 0.2, 0.4, 0.6, and 0.8) fabricated by the combustion
synthetic method were studied [98]. The samples were sintered at 1000 ◦C. The analysis
of XRD patterns revealed that synthesized compounds were nanocrystalline size with
cubic structure. An intermediate NiSnO3 phase was also identified from this study during
substitution. The Fourier transform infrared (FT-IR) spectra showed the characteristic
features of the synthesized ferrite compounds. The stretching and bending vibrational
modes of the Ni2+
, Sn4+
, and Fe3+
were observed from FT-IR, which lead to the inference
of NiFe2O4 and substituted compound as an inverse spinel. It was observed that the band
Page 56
gap values computed from both UV and electrical measurements indicated that the
synthesized materials were semiconductors. The dc electrical conductivity of the
compounds found to increase with increasing measuring temperature. A maximum dc
electrical conductivity of 6.0Scm−1
was obtained at a measuring temperature of 1000 ◦C
in the composition of x = 0.8, for which the activation energy found to be minimum.
The magnetic and microstructure studies of copper substituted Ni-Zn ferrites were
investigated [99]. The XRD patterns of powder samples showed the cubic spinel phase up
to x = 0.25 and a second phase of composition CuO above x > 0.25. The crystallite sizes
of as-dried samples when calcined at high temperatures changed from ~ 10 to 50nm at
1000 °C. The substitution of Cu2+
ions influenced the magnetic parameters due to
modification by cation distribution.
CuFe2O4 ferrites were prepared by the thermal decomposition of the acetate
precursors [100]. These ferrites were isothermally reduced in H2 flow at 400-600 °C. The
isothermal reduction profiles obtained in this study show that a topochemical mode of
reduction was done by which the reduction process proceeds. The nano-wire metallic
phase of iron (106nm) and copper (56nm), produced from the complete reduction of
CuFe2O4, were subjected to the direct reoxidation in CO2 flow at 400-600 °C. The
reoxidation process was found to be controlled by both the reduction and reoxidation
temperatures. It was observed that CO2 decompose to carbon nano-tubes during the
reoxidation of the freshly reduced CuFe2O4. The prepared samples were investigated by
X-ray diffraction, Scanning electron microscopy and transmission electron microscopy. It
was also noticed that at the initial stages the reaction was controlled by the interfacial
Page 57
chemical reaction mechanism with some contribution to the gaseous diffusion
mechanism.
Copper ferrites of the nominal composition CuxFe3-xO4+δ where x = 0.2, 0.4, 0.6,
0.8, and 1 were prepared by standard ceramic technique [101]. The substitutional effect
of Cu ions on AC electrical conductivity and dielectric properties at different frequencies
(50Hz-5MHz) were studied. The conductivity results were discussed in terms of the
electron hopping model. The Koop’s theory and Rezlescu model were used to explain the
dispersion of dielectric constant. The dielectric loss tangent, tanδ plots exhibited
dielectric relaxation peaks which were attributed to the coincidence of the hopping
frequency of the charge carriers with that of the external fields. The frequency exponent
factor was estimated and found to vary between 0.4 for x = 1 and 0.83 for x = 0.2.
The polycrystalline ferrites with general formula CdxMg1-xFe2-yCryO4 (x = 0, 0.2,
0.4, 0.6, 0.8, 1.0; y = 0, 0.05 and 0.10) were prepared by ceramic method and their
permeability and magnetization measurements were carried out [102]. The XRD analysis
confirmed the fcc spinel structure. The saturation magnetization revealed that the Neel’s
two-sublattice model exists up to x = 0.4 for y = 0, 0.05 and 0.1 and a three-sublattice
model found predominant for x > 0.4 and y = 0, 0.05 and 0.10. The saturation
magnetization and magnetic moment were found to decrease with the increase in Cr3+
contents, which was attributed to the dilution of B–B site interaction. The variation of
initial permeability with temperature exhibited the long-range ferromagnetic ordering in
the compounds with x = 0.4. It was noticed that sample with x ≤ 0.4 and y = 0, 0.05 and
0.10 showed peaking behavior near Curie temperature, which was due to the decrease of
anisotropy constant K1 to zero. The low-frequency dispersion of initial permeability
Page 58
suggested domain wall displacement. The Curie temperature was observed to decrease
sharply with the increase of Cd2+
ions. Also, the addition of Cr3+
ions resulted in the
decrease initial permeability.
The magnetic properties of the chromium substituted Li–Sb ferrite prepared by
the double sintering ceramic technique were studied [103]. The microstructure of the
samples showed that the grain size was larger and more uniform for pure Li–Sb ferrites.
The results revealed that the initial permeability was observed to decrease with the
increase of chromium concentration. The variation of permeability indicated that for all
samples resonance peak at a frequency above 15 MHz was observed and it was attributed
to domain wall oscillations. The hysteresis loop parameters were observed to decrease
with higher level of substitution. Hysteresis loops of the samples indicated that
squareness ratio found to decrease with the increase of chromium content.
The effects of rare-earth ions (La, Nd, Gd) synthesized by the emulsion method
on the magnetic properties of Ni–Mn ferrite were investigated [104]. X-ray diffraction
analysis ensured the presence of cubic structure of spinel ferrite for all samples. The
values of saturation magnetization and coercivity of the samples were reported to
increase with decreasing temperature and were explained by low temperature spin-wave
theory. It was noticed that the un-doped sample has the maximum value of saturation
magnetization (Ms), while the La3+
doped sample has the maximum value of coercivity
(Hc) at 2K. The values of Ms and Hc were observed to decrease with increasing of
testing temperatures for all samples. Mossbauer spectra tested at 273K revealed that the
samples were almost superparamagnetic and single domain particles. The magnetic
Page 59
measurements exhibited that rare-earth ions can influence significantly the low
temperature magnetic properties of soft magnetic materials.
The structural and magnetization measurements of Mg0.7Zn0.3SmxFe2-xO4 ferrites
prepared by the solid-state reaction method were carried out [105]. The analysis of XRD
patterns indicated the single spinel phase with Sm3+
contents in the range 0.00 ≤ x ≤ 0.03.
The lattice parameter was found to increase at x = 0.01 and then decreases up to x = 0.03,
this may indicate distortion in the spinel lattice due to the relatively large ionic radius of
Sm3+
. The decrease in saturation magnetization was observed with the increase in x up to
0.04 and was attributed to the replacement of the Fe3+
ions by the Sm3+
ions in the
octahedral sites.
The effect of Al substitution on the structural and magnetic properties of NiFe2O4
ferrites prepared by standard ceramic method was investigated [106]. The single phase
spinel structure was confirmed from X-ray powder data analysis. The lattice parameter
was observed to decrease and it was attributed to the ionic radii of the cations involved.
The magnetic moment found to decrease which may be due to the reduction of Fe3+
ions.
The band position of the samples under investigation was studied using IR spectra. The
results indicated that net magnetization decreased and domain state changed from single
domain to multi-domain.
Ferrite nanoparticles, Ni0.65 Zn0.375 Inx Ti0.025 Fe1.95-xO4 of the size about 6 nm
were prepared by using high-energy ball mill [107]. To study the structural and magnetic
properties of the samples, XRD, VSM and FMR techniques were used. The XRD patterns
exhibited cubic spinel structure and the average particle size was estimated to be around 6
nm. The FMR spectra showed slight asymmetry and the deduced parameters such as
Page 60
resonance field, line width and relaxation time for all the samples were found in
accordance with magnetic data obtained from hysteresis loops. The magnetic
characteristics of indium-doped samples were compared with those for bulk samples. It
was suggested that ball milling of ferrites could be a method to produce nanoparticle
powders.
The AC electrical conductivity and initial magnetic permeability were
investigated for some rare-earth substituted spinel ferrites prepared by double sintering
process [108]. The ferrites like Li0.5-0.5xCoxFe2.4-0.5xR0.1O4 where x = 0.0; 0.5, and 1; R =
Y, Yb, Eu, Ho and Gd were prepared by ceramic technique. The results of AC electrical
conductivity showed dispersion with frequency at low temperatures. The dispersion was
found to obey the universal power law. The frequency exponent of the power law
decreased with both Co ion content and temperature. This ensured the classical barrier
hopping mechanism to be predominant one in these samples. The temperature dependent
initial magnetic permeability exhibited multi domain structure only for x = 0.0; and
single domain for all other samples.
The spinel ferrites, MgxNi1-xSm0.02Fe1.98O4 (x = 0.1, 0.3, 0.5, 0.7 and 0.9)
prepared by the solid-state reaction method were characterized by X-ray diffraction and
magnetization measurements [109]. The single spinel phase ensured by the analysis of
XRD patterns. The lattice parameter was observed to increase and the X-ray density
decrease as the Ni2+
ions were replaced by the Mg2+
ions on the octahedral sites. The
coercivity measurements indicated a decrease of internal strains for enhanced Mg2+
content (x > 0.5) in the samples.
Page 61
The samples, CuCr2O4 and NiCr2O4 were synthesized by the precursor method
[110]. These samples were crystallized at room temperature in a tetragonal distorted
spinel structure. The distortion was attributed to the Jahn–Teller ions Cu2+
and Ni2+
which flatten or elongate their surrounding oxygen tetrahedron. It was noticed that
CuCr2O4 and NiCr2O4 form a complete solid solution series Cu1-xNixCr2O4 where for
0.825 < x < 0.875 members with orthorhombic symmetry were found. On cooling, all
samples showed a temperature dependent crystallographic phase transition from cubic to
tetragonal symmetry between 865K (CuCr2O4) and 310K (NiCr2O4). Also, it was
remarkable that the phase Cu0.15Ni0.85Cr2O4 undergo a second crystallographic transition
to orthorhombic symmetry, at T = 300 K. At low temperatures all compounds showed
anti-ferromagnetic ordering. The Neel’s temperature was found to decrease and the
magnetization increased with increasing Ni content. This was due to the fact that Ni2+
has
two unpaired electrons whereas Cu2+
has only one. The observed two-step mechanism
may have its origin in different ordering temperature of the ion’s sub lattices.
The X-ray diffraction, magnetic and Mossbauer spectral studies were carried out
to study the cation distribution of chromium substituted nickel ferrites synthesized by
aerosol route [111]. The cation distribution revealed that the chromium atom occupy
octahedral site up to x = 0.8, and then also enter into tetrahedral site. The saturation
magnetization was observed to decrease linearly with the increase of chromium
concentration due to the diamagnetic nature of the Cr3+
ions. Initially the coercivity
increase slowly with the increase of chromium concentration but when x > 0.8 very large
increase was observed. It was attributed to the specific cation distribution of Cr3+
which
result an unquenched orbital angular momentum and a large anisotropy. The Mossbauer
Page 62
spectra of the samples exhibited a broad doublet resolved into two doublets
corresponding to the surface and internal region atoms. The samples annealed at 1200 °C
show broad sextets, which were fitted with different sextets, indicating different local
environment of both tetrahedral and octahedral coordinated iron cations.
The ferrites with general formula Mn0.5Zn0.5RyFe2O4; where R = Dy, Gd, Sm, Ce,
and La were prepared by standard ceramic technique and sintered at 1200 °C with a
heating rate 4 °C/min [112]. The structural and dielectric properties like, dielectric
constant, AC conductivity, and seebeck coefficient were measured. X-ray diffractograms
confirmed that all samples have the spinel structure with the appearance of small peaks of
secondary phases. The decrease in porosity was observed after Sm-doped samples due to
the presence of the secondary phases, which limit the grain growth. The results showed
that the addition of rare earth ions to the system act as a sintering catalyst that help in the
development of the solid solution at lower temperatures. The seebeck measurements
indicated that manganese–zinc ferrites doped with the rare earth ions classified as P-type
semiconductors. The increase in the electrical resistivity was found by the addition of
small quantity of Dy3+
ions substitutions and it was attributed to the structural
heterogeneity generated by the insulating intergranular layers.
Zinc substituted nickel ferrites were fabricated by solid state reaction technique
and were sintered at various temperatures [113]. The electrical and magnetic properties of
these ferrites Ni1-xZnxFe2O4 (x = 0.2, 0.4) were investigated. The bulk density of the
Ni0.8Zn0.2Fe2O4 ferrites samples was found to increase as temperature increase from 1200
to 1300 °C and above 1300 °C the bulk density was decreased. The temperature
dependent electrical resistivity results revealed that the samples were semiconductor in
Page 63
nature. The Curie temperature, resistivity and the activation energy decrease with the
addition of Zn content, while the magnetization, initial permeability, and the relative
quality factor (Q) increased. The permeability dropped off at fr because of the occurrence
of ferrimagnetic resonance. This factor limit the frequency at which a magnetic material
can be useful. A Hopkinson peak was obtained near Tc in the real part of the initial
permeability vs. temperature curves. The ferrite with higher permeability had relatively
lower resonance frequency. It was found that the choice of the basic composition
represented a compromise, since both resonance frequency and permeability were related
to crystalline anisotropy.
The ferrites of the general formula, Mg1+xTixRyFe2-2x-yO4; R = Ce and Er, y =
0.025 and 0 ≤ x ≤ 0.5), were synthesized by standard double sintering ceramic technique
at 1200 °C using heating rate of 4 °C/min [114]. The analysis of X-ray diffraction
patterns exhibited the single phase spinel cubic structure for all samples and also the peak
intensity was found to depend upon the magnetic ions present in the lattice. It was
observed that he values of dielectric constant for x = 0.1 was found much higher than
those of x = 0.5 (order of 103 times) and it was attributed to the effect of Ti and rare earth
addition. The activation energy was increased as the Ti concentration increased. The
variation of electrical resistivity in the ferromagnetic region was attributed to the ionic
radii of the substituted ions. The addition of Ti4+
ions resulted in the decrease of
magnetization. The Seebeck voltage coefficient was carried out for all samples to identify
the type of charge carriers. The magnetic susceptibility was measured by the Faraday’s
method. The effect of rare-earth (RE) ions was explained by the partial diffusion in the
spinel lattice.
Page 64
The NiZn and NiCuZn ferrites were fabricated by the conventional ceramic
processing [115]. The magnetic and physical properties of these ferrites were
investigated. The results revealed that the lowest power loss could be obtained with the
equimolar composition for both NiZn and NiCuZn ferrites, which could be due to the
lowest porosity. A slight decrease or excess of Fe2O3 content had no remarkable effect on
saturation magnetic flux density (Bs). A slight excess of Fe2O3 was effective to improve
the initial permeability, which could be attributed to the decrease of the
magnetocrystalline anisotropy. The initial permeability and power loss of these ferrites
had different development trends with the increase of sintering temperature, which could
be explained by the different variation trend of the grain size and porosity. The power
losses of the NiCuZn ferrite samples were lower than that of the NiZn ferrites at any
sintering temperature. It was noticed that the NiCuZn ferrites had a better performance
than the NiZn ferrites in power field use.
The solid state reaction technique was used to prepare Zn substituted nickel
ferrites [116]. The AC conductivity and magnetic properties of these ferrites were
reported. The spinel structure of the samples was ensured by X-ray powder diffraction
analysis. The AC conductivity, lattice parameters sintered density and grain size were
increased where as the X-ray density and porosity were decreased with the increase of
zinc concentration. It was noticed that all the samples follow the Maxwell-Wagner
polarization. The saturation magnetization varied from 196.459 emu/g to 0.330 emu/g
while the coercivity decreased from 72 to 11.730 Oe with the increase in zinc
concentration. This was attributed to the non-magnetic behavior of zinc. The value of
Page 65
Yafet–Kittel angles increased from zero to 89.975° with the increase in Zn concentration
this was due to the canted behavior of ions in octahedral site.
The co-precipitation technique was used to synthesize CoZn ferrite [117]
composites having the general formula (1−x)Co0.5Zn0.5Fe2O4 + xSiO2 with x = 0.0–0.8. It
was deduced from the X-ray diffraction analysis that the samples were bi-phasic in
nature. The resistivity was increased from 105 to 10
9 (Ωcm) for x = 0.0–0.8. This increase
in resistivity was attributed to the presence of pores and the segregation of Si at grain
boundaries. The temperature dependent resistivity plots indicated the semi conducting
behavior of the samples. Arrhenius plots exhibited change of slope at particular
temperature (except for x = 0.8) that may be attributed to their Curie temperature. It was
observed that the activation energies were small in Para-region as compared to Ferri-
region and this indicate hopping conduction mechanism in these samples. The
thermopower results revealed that the samples were degenerate type semiconductors. The
values of activation energies calculated from logμd vs. 1000/T were slightly lower than
the values of activation energies obtained from Arrhenius plots. This suggested polaron
hopping conduction phenomenon in these samples.
The composite ferrites with chemical formula (1-x)[Mn0.5Zn0.5Fe2O4].x[SiO2] (x =
0.0, 0.20, 0.30, 0.40, 0.50) were fabricated by the co-precipitation technique [118]. The
prepared samples were finnally sintered at 1150 °C followed by air quenching. The
phases precipitated out were identified from X-ray diffraction analysis in the samples.
AC magnetic susceptibility was measured using the low field mutual inductance
technique over the temperature range 298 K to 550 K at a frequency of 250 Hz. The
magnetic parameters like Lande splitting factor, g, Curie constant, C, effective magnetic
Page 66
moment, Peff, Curie temperature, Tc, exchange integral, J/kB, and characteristic
temperature, θ(K) were calculated. The susceptibility measurements indicated that the
samples follow Curie Weiss behaviour above the Curie temperature. Below the Curie
temperature, all the samples exhibited the ferrimagnetic behaviour. The results revealed
that the magnetic properties were enhanced by the addition of Si in the lattice.
Spinel ferrite of the nominal composition Ni0.64Zn0.36Fe2O4 was prepared by the
solid state reaction technique [119]. The influence of vanadium oxide on the magnetic
and micro structural properties of this ferrite was investigated. The ferrite was doped with
V2O5, ranging from 0 to 3.2wt.% in steps of 0.4wt.%. The results indicated that with the
increase of this oxide up to a certain percentage (1.6wt.%), the permeability, relative
density and grain size initially increases and then decreases. The dc resistivity of the
samples was observed to increase with the increase of V2O5. The saturation
magnetization and Curie temperature indicated peak values at 1.2wt.% and 0.8wt.% of
V2O5 respectively.
The nanocrystalline samarium substituted cobalt ferrite powders were synthesized
by the citrate precursor method [120]. The effects of substitution of Sm3+
ions and
thermally treated temperature (400-600 °C) on the structure and the magnetic properties
of CoFe2O4 nanocrystalline powders were investigated. The results revealed that the
crystallite size of the produced powders decreased by increasing the Sm content and
increased with increasing the calcination temperature from 400 to 1000 °C. The analysis
of X-ray diffraction patterns exhibited the single phase spinel structure of CoFe2O4 ferrite
powders with out Sm3+
addition at different thermally treated temperatures. It was
noticed that with the increase of Sm3+
ions mole ratio to 0.2–0.4 led to the formation of
Page 67
SmFeO3 and Sm2CoO4 phases with cobalt ferrite phase. The average crystallite sizes of
the samples were sensitive to the synthetic conditions and they were within the average
range of 8 - 86 nm. The saturation magnetization and coercive field were found strongly
dependent on the calcination temperature and structure of the formed powders. The
saturation magnetization was decreased by increasing the Sm content and increased by
increasing the calcination temperatures from 400 to 800 ◦C. The maximum saturation
magnetization was attained (62.86emu/g) for CoFe2O4 ferrite produced at 800 ◦C.
1.3 Aims and Objectives
The substitution of Tb in NiFe2O4 and MgFe2O4 ferrites has not been reported
extensively in the literature to the best of my knowledge. In the light of lack of
investigations of Tb Substituted Nickel and Magnesium ferrites, the present study aims at
structural, electrical, dielectric and static & dynamic magnetic properties of
Ni1-xTbxFe2O4 and Mg1-xTbxFe2O4 ferrites. The main objectives of the present work are;
To prepare ferrites with good crystal structure and high density.
To improve electrical and dielectric properties.
To control the magnetic properties for their use in switching and microwave
devices.
To reduce the FMR linewidth of these ferrites.
Page 68
References
1. Mansour Al-Haj, J. Magn. Magn Mater. 299 (2006) 435-439.
2. N. Iftimie, E. Rezlescu, P. D. Popa, N. Rezlescu, J.Optoelectron. Adv. Mater. 7 (2005)
911-914.
3. S. B. Cho, D. H. Kang, J. H. Oh, J. Mater. Sc. 32 (1996) 4719-4722.
4. A. R. Shitre, V. B. Kawade, G. K. Bichili, K. M. Jadhav, Mater. Lett. 56 (2002) 188-
193.
5. A. C. F. M. Costa, E. Tortella, M. R. Morelli, R. H. G. A. Kiminami, J. Magn. Magn
Mater. 256 (2003) 174-182.
6. Ge-Liang Sun, Jian-Bao Li, Jing-Jing Sun, Xiao-Zhan yang, J. Magn. Magn Mater.
281 (2004) 173-177.
7. M. A. Ahmad, E. Ateia, S. I. El-dek, Mater. Lett. 57 (2003) 4256-4266.
8. L. John Berchmans, R. Kalai Selvan, P. N. Selva Kumar, C. O. Augustin, J. Magn.
Magn Mater. 279 (2004) 103-110.
9. N. S. Satya Murthy, M. G. Natera, S. I. Youssef, R. J. Begum, C. M. Srivastava, Phys.
Rev. 181 (1969) 969-977.
10. D R Sagar, Chandra Prakash and Pran Kishan, Solid State Commun. 68 (1988) 193-
195.
11. N. Sparvieri and Cattarin, Mater. Chem. Phys. 25 (1990) 167-75.
12. S.A.Patil, S.M.Otari, V. C. Mahajan, M.G. Patil, A. B. Patil, M. K. Soudagar, B. L.
Patil and S. R. Sawant, Solid State Commun. 78 (1991) 39-42.
13. G. K. Joshi, A. Y. Khot and S. R. Sawant, Solid State Commun. 65 (1991) 1593-
1595.
14. N. Rezlescu and E. Rezlescu, Solid State Commun. 88, 2, (1993) 139-141.
15. M. G. Patil, V. C. Mahajan, S. D. Lotke, B. V. Bhise and S. A. Patil, Solid State
Commun. 91, 8, (1994) 667-670.
16. N. Rezlescu, E. Rezlescu, C. Pasnicu, M. L. Craus, J. Magn. Magn. Mater. 136
(1994) 319-326.
17. C.B. Kolekar, P.N. Kamble, A.S. Vaingankar, J. Magn. Magn. Mater. 138 (1994)
211-215.
Page 69
18. N. Rezlescu, E. Rezlescu, C. Pasnicu and M. L. Craus, J. Phys. Condens Matter, 6
(1994) 5707-5716.
19. C. Jovalekic, M. Zdujic, A. Radakovic, M. Mitric, Mater. Lett, 24 (1995) 365-
368.
20. V. K. Babbar and J. S. Chandel, J. Appl. Phys. 78 (1995) 2585-2589
21. V. M. Nanoti, C. S. Prakash, D. K. Kulkarni, Mater. Lett. 24 (1995) 167-169.
22. P.S. Anil Kumar, J. J. Shrotri, S.D. Kulkarni, C. E. Deshpande, S. K. Date, Mater.
Lett. 27 (1996) 293-296.
23. M. Pal, P. Brahma, D. Chakravorty, J. Magn. Magn. Mater. 152 (1996) 370-374.
24. Kee Tae Han, Phys. Stat. Sol. (a), 155 (1996) 215-222.
25. E. Rezlescu, N. Rezlescu, P. D. Popa, L. Rezlescu, and C. Pasnicu, Phys. Stat. Sol.
(a), 162 (1997) 673-678.
26. D.N. Bhosale, N.D. Choudhari, S.R. Sawant, P.P. Bakare, J. Magn. Magn. Mater. 173
(1997) 51-58.
27. J. H. Nam, W. G. Hur, and J. H. Oh, J. Appl. Phys. 81 (1997) 4794-4796.
28. N.N. Jani, Bimal S. Trivedi, H.H. Joshi and R.G. Kulkarni, Hyperfine Interact. 110
(1997) 227–237.
29. Misbah-ul-Islam, M. Ashraf Chaudhry, T. Abbas, M. Umar, Mater. Chem. Phys. 48
(1997) 227-229.
30. S. S. Shinde, K. M. Jadhav, Mater. Lett. 37 (1998) 63-67.
31. S. S. Bellad, R. B. Pujar, B. K. Chougule, Mater. Chem. Phys. 52 (1998) 166-169.
32. Misbah Ul Islam, Mazhar Uddin Rana, Tahir Abbas, Mater. Chem. Phys. 57 (1998)
190-193.
33. Mazhar U. Rana, Misbah Ul-Islam, Ishtiaq Ahmad, Tahir Abbas, J. Magn. Magn.
Mater. 187 (1998) 242-246.
34. N. Rezlescu, E. Rezlescu, P.D. Popa, M.L. Craus, L. Rezlescu, J. Magn. Magn.
Mater. 182 (1998) 199-206.
35. M. Z. Said, Mater. Lett. 34 (1998) 305-307.
36. Qi Chen and Z. John Zhang, J. Appl. Phys. 73 (1998) 3156-3158.
37. Kunal B. Modi, H. H. Joshi, J. Mater. Sci. Lett. 17 (1998) 741-743.
38. S. F. Moustafa, M. B. Morsi, Mater. Lett. 34 (1998) 241-247.
Page 70
39. N. Rezlescu, E. Rezlescu, P.D. Popa, L. Rezlescu, J. Alloys Compd. 275– 277 (1998)
657–659.
40. A.V. Ramana Reddy, G. Ranga Mohan, B.S. Boyanov, D. Ravinder, Mater. Lett. 39
(1999) 153–165.
41. S. S. Bellad, S. C. Watawe, and B.K Chougule, Mater. Res. Bull. 34 (1999) 1099-
1106.
42. K. P. Thummer, H. H. Joshi, R. G. Kulkarni, J. Mater. Sci. Lett. 18 (1999) 1529 –
1532.
43. G. Ranga Mohan, D. Ravinder, A.V. Ramana Reddy, B.S. Boyanov, Mater. Lett. 40
(1999) 39–45.
44. R. B. Pujar, S. S. Bellad, B. K. Chougule, J. Mater. Sci. Lett. 18 (1999) 1083 –
1086.
45. R.B. Pujar, S.S. Bellad, S.C. Watawe, B.K. Chougule, Mater. Chem. Phys. 57 (1999)
264-267.
46. D. Ravinder, A.V. Ramana Reddy, Mater. Lett. 38 (1999) 265–269.
47. A. A. Sattar, A. H. Wafik, K. M. El-Shokrofy and M. M. El-Tabby, Phys. Stat. Sol.
(a), 171 (1999) 563-569.
48. M. Shaikh, S.A. Jadhav, S.C. Watawe, B.K. Chougule, Mater. Lett. 44 (2000)
192–196.
49. B. P. Ladgaonkar, P. N. Vasambekar, A. S. Vaingankar, J. Mater. Sci. Lett. 19
(2000) 1375 – 1377.
50. Laishram Radhapiyari, Sumitra Phanjoubam, H. N. K. Sarma, Chandra Prakash,
Mater. Lett. 44 (2000) 65–69.
51. N. Rezlescu, L. Rezlescu, P.D. Popa, E. Rezlescu. J. Magn. Magn. Mater. 215-216
(2000) 194-196.
52. Woo Chul Kim, Seung Iel Park, Sam Jin Kim, Seung Wha Lee and Chul Sung Kim,
J. Appl. Phys. 87 (2000) 6241-6243.
53. S. C. Watawe, B. D. Sarwade, S. S. Bellad, B.D. Sutar, B. K. Chougule, J. Magn.
Magn. Mater. 214 (2000) 55-60.
54. V. B. Kawade, G. K. Bichile, K. M. Jadhav, Mater. Lett. 42 (2000) 33–37.
55. S. A. Jadhav, Mater. Chem. Phys. 65 (2000) 120–123.
Page 71
56. Rainer Hochschild and Hartmut Fuess, J. Mater. Chem., 10 (2000) 539-542
57. Mazhar U. Rana, Misbah-ul Islam, Tahir Abbas, Mater. Chem. Phys. 65 (2000) 345-
349.
58. B.P. Ladgaonkar, P. P. Bakare, S.R. Sainkar, A. S. Vaingankar, Mater. Chem. Phys.
69 (2001) 19–24.
59. M. Singh, S. P. Sud, Mater. Sci. Eng. B, 83 (2001) 180–184.
60. M. A. Ahmed, G. Abd-Ellatif, M. Rashad, J. Magn. Magn. Mater. 232 (2001) 194–
204.
61. O. M. Hemeda, M. Z. Said, M. M. Barakat, J. Magn. Magn. Mater. 224 (2001) 132–
142.
62. K. Vijaya Kumar, D. Ravinder, Int. J. Inorg. Mater. 3 (2001) 661–666.
63. R. N. Bhowmik, R. Ranganathan, J. Alloys Compd. 326 (2001) 128–131.
64. I. S. Ahmed Farag, M. A. Ahmed, S. M. Hammad, A. M. Moustafa, Cryst. Res.
Technol. 36 (2001) 85-92.
65. V. Sepelak, D. Schultze, F. Krumeich, U. Steinike, K.D. Becker, Solid State Ionics,
141–142 (2001) 677–682.
66. C.B. Kolekar, A.Y. Lipare, B.P. Ladgaonkar, P.N. Vasambekar, A. S. Vaingankar, J.
Magn. Magn. Mater. 247 (2002) 142–146.
67. A. M. Shaikh, S. c. Watawe, S. A. Jadhav, B. K. Chougule, Mater. Res. Bull. 37
(2002) 2547-2555.
68. A. A. Sattar, A. M. Samy, R. S. El-Ezza, and A. E. Eatah, Phys. Stat. Sol. (a), 193
(2002) 86–93.
69. Xiwei Qi, Ji Zhou, Zhenxing Yue, Zhilun Gui, Longtu Li, Magn. Magn. Mater. 251
(2002) 316–322.
70. M. A. Ahmed, E. Ateia, S. I. El-Dek, Vibrational spectroscopy, 30 (2002) 69-75.
71. Lakshman, K.H. Rao, R.G. Mendiratta, J. Magn. Magn. Mater. 250 (2002) 92–97.
72. Mazhar U. Rana, Tahir Abbas, J. Magn. Magn. Mater. 246 (2002) 110-114.
73. G. J. Baldha, K. G. Saija, K. B. Modi, H. H. Joshi, R. G. Kulkarni, Mater. Lett. 53
(2002) 233– 237.
74. S. E. Jacobo, W. G. Fano, A. C. Razzitte, Physica B, 320 (2002) 261–263.
75. M. A. Ahmed, E. Ateia, S. I. El-Dek, Mater. Lett. 57 (2003) 4256–4266.
Page 72
76. S. A. Mazen, S. F. Mansour, and H. M. Zaki, Cryst. Res. Technol. 38 (2003) 471 –
478.
77. A. A. Sattar and Samy A. Rahman, Phys. Stat. Sol. (a), 200 (2003) 415–422.
78. D. Ravinder, S. Srinivasa Rao, P. Shalini, Mater. Lett. 57 (2003) 4040–4042.
79. B.K. Labde, Madan C. Sable, N.R. Shamkuwar, Mater. Lett. 57 (2003) 1651– 1655.
80. K. Vijaya Kumar, A. Chandra Shekhar Reddy, D. Ravinder, J. Magn. Magn. Mater.
263, (2003) 121-126.
81. R. N. Panda, J. C. Shih, T. S. Chin, J. Magn. Magn. Mater. 257, (2003) 79-76.
82. S.D. Chhaya, M.P. Pandya, M.C. Chhantbar, K.B. Modi, G.J. Baldha, H.H. Joshi,
J. Alloys Compd 377 (2004) 155–161.
83. J. Azadmanjiri and S. A. Seyyed Ebrahimi, Phys. Stat. Sol. (c) 1, 12 (2004) 3414–
3417.
84. M.A. Ahmed, N. Okasha, M. Gabal, Mater. Chem. Phys. 83 (2004) 107– 113.
85. R.V. Mangalaraja, S. Ananthakumar, P. Manohar, F.D. Gnanam, M. Awano,
Mater. Lett. 58 (2004) 1593– 1596.
86. Ge-Liang Sun, Jian-Bao Li, Jing-Jing Sun, Xiao-Zhan Yang, J. Magn. Magn Mater.
281 (2004) 173–177.
87. Anjana Dogra, Ravi Kumar, N. Kumar, P. Sen, M. Singh, Mater. Sci. Eng. B 110
(2004) 243–250.
88. H.M. Zaki, S.F. Mansour, Mater. Chem. Phys. 88 (2004) 326–332.
89. Seema Verma, P.A. Joy, Y.B. Khollam, H.S. Potdar, S.B. Deshpande, Mater. Lett. 58
(2004) 1092– 1095.
90. K.P. Thummer, M.C. Chhantbar, K.B. Modi, G.J. Baldha, H.H. Joshi, J. Mag. Magn.
Mater. 280 (2004) 23–30.
91. A.M. Abo El Ata, S.M. Attia, T.M. Meaz, Solid State Sci. 6 (2004) 61–69.
92. V.K. Mittal, Santanu Bera, R. Nithya, M.P. Srinivasan , S. Velmurugan, S.V.
Narasimhan, J. Nucl. Mater 335 (2004) 302–310.
93. Uzma Ghazanfar, S.A. Siddiqi, G. Abbas, Mater. Sci. Eng. B 118 (2005) 84–86.
94. A. A. Pandit, A. R. Shitre, D. R. Shengule, K. M. Jadhav, J. Mater. Sci.40 (2005)
423– 428.
95. Uzma Ghazanfar, S.A. Siddiqi, G. Abbas, Mater. Sci. Eng. B 118 (2005) 132–134.
Page 73
96. A Lakshman, P. S. V. Subba Rao, B Parvatheeswara Rao and K H Rao, J. Phys. D:
Appl. Phys. 38 (2005) 673–678.
97. A.M. Shaikh, C.M. Kanamadi, B.K. Chougule, Mater. Chem. Phys. 93 (2005) 548–
551.
98. S. Balaji, R. Kalai Selvan, L. John Berchmans, S. Angappan, K. Subramanian, C.O.
Augustin, Mater. Sci. Eng. B 119 (2005) 119–124.
99. I. Z. Rahman and T. T. Ahmad, J. Magn. Magn. Mater. 290-291 (2005) 1576.
100. M. H. Khedr and A. A. Farghali, Appl. catalysis B: Environmental 61 (2005) 219.
101. H. M. Zaki, Physica B, 363 (2005) 232.
102. S.A. Masti, A.K. Sharma, P.N. Vasambekar, A.S. Vaingankar, J. Mag. Magn. Mater.
305 (2006) 436–439.
103. Radhapiyari Laishram, Chandra Prakash, J. Magn. Magn. Mater. 305 (2006) 35–39.
104. Lijun Zhao, Hua Yang, Lianxiang Yu, Yuming Cui, Xuepping Zhao, Shouhua Feng,
J. Magn. Magn. Mater. 305 (2006) 91–94.
105. Mansour Al-Haj, J. Mag. Mag. Mater. 299 (2006) 435–439.
106. A.G. Bhosale, B.K. Chougule, Mater. Chem. Phys. 97 (2006) 273–276.
107. B. Parvatheeswara Rao, Ovidiu Caltun, Ioan Dumitru, Leonard Spinu, J. Magn.
Magn. Mater. 304 (2006) e752–e754.
108. A.M. Abo El Ata, M.K. El Nimr, S.M. Attia, D. El Kony, A.H. Al-Hammadi, J.
Magn. Magn. Mater. 297 (2006) 33–43.
109. Mansour Al-Haj, Phys. Stat. Sol. (a) No. 2, 203 (2006) 343–348.
110. M. Tovar, R. Torabi, C. Welker, F. Fleischer, Physica B 385–386 (2006) 196–198.
111. Sonal Singhal, Kailash Chandra, J. Solid State Chem. 180 (2007) 296 – 300.
112. E. Ateia, M.A. Ahmed, A.K. El-Aziz, J. Magn. Magn. Mater. 311 (2007) 545–554.
113. A.K.M. Akther Hossaina, S.T. Mahmud, M. Seki, T. Kawai, H. Tabata, J. Magn.
Magn. Mater. 312 (2007) 210–219.
114. M.M. El Sayed, Ceram. Int. 33 (2007) 413–418.
115. Hua Su, Huaiwu Zhang, Xiaoli Tang, Yulan Jing, Yingli Liu, J. Magn. Magn. Mater.
310 (2007) 17–21.
116. Muhammad Ajmal, Asghari Maqsood, Mater. Lett. 62 (2008) 2077–2080.
Page 74
117. M.U. Islam, Faiza Aena, Shahida B. Niazi, M. Azhar Khan, M. Ishaque, T. Abbas,
M.U. Rana, Mater. Chem. Phys. 109 (2008) 482–487.
118. M. U. Islam, M. Azhar Khan, Zulfiqar Ali, Shahida B. Niazi, M. Ishaque and T.
Abbas, Int. J. Modern Phys. B 15, 21 (2007) 2669-2677.
119. O. Mirzaee, M.A. Golozar, A. Shafyei, Mater. Charact. 59 (2008) 638 – 641.
120. M.M. Rashad, R.M. Mohamed, H. El-Shall, J. Mater. Proc. Technol.198 (2008)
139–146.
Page 75
2 EXPERIMENTAL DETAILS
2.1 Composition of Ferrites
Two series of spinel ferrites of various compositions were prepared by ceramic
technique. The constituents for the ferrites were carefully selected keeping in view of
their valances (for charge balancing) and ionic radii. The effect of terbium substitution in
NiFe2O4 and MgFe2O4 spinel ferrites was studied. The following compositions were
prepared;
Ni1-xTbxFe2O4 for x = 0.00, 0.02, 0.04, 0.06, 0.08, 0.10, 0.12, 0.14, 0.16, 0.18, 0.20.
Mg1-xTbxFe2O4 for x = 0.00, 0.02, 0.04, 0.06, 0.08, 0.10, 0.12, 0.14, 0.16, 0.18, 0.20.
2.2 Preparation Technique
The ferrites of various compositions mentioned in section 2.1 were prepared by
ceramic technique. The starting materials were analytical reagent grade powders of NiO,
MgO, Tb4O7, and Fe2O3 (99.99 % pure), supplied by Aldrich. The weight percentage of
each oxide was calculated according to the stoichiometry. Samples were prepared by
standard ceramic technique. The oxides were weighed according to the required
stoichiometric calculations and were intimately mixed together. The mixture of the
oxides of each sample was ground for 3 h, using an agate mortar and pestle to a fine
powder. Before and after grinding, the mortar and pestle were rinsed with acetone to
avoid any contamination. The ground powder was then cold pressed into pellets using a
hydraulic pressing machine (Paul-Otto-Weber). The pressure of 30kN/mm2
was applied
for 1 to 1.5 minutes on each pellet. The pellets were initially sintered at 1000 °C for 48
Page 76
hours in air atmosphere using box furnace. Then final sintering of the samples was
performed for six hours at 1230 °C in order to produce a homogeneous product. Finally
the samples were air quenched in order to obtain homogeneous distribution of cations on
the sublattices. Both sides of the pellets were cleaned with SiC paper of micron grade,
after quenching.
The toroid shape samples were prepared for both series for permeability
measurements. The powder mixtures were mixed with 5 wt % solution of polyvinyl
alcohol (PVA) as a binder. A die with outer diameter 22mm and inner diameter 10mm
and thickness of 5 mm was used to make toroid samples. The flow chart shows the steps
involved in the preparation of samples.
Powder
Firing
Mixing
Grinding
Pressing
Shaped powder
form
Dense
polycrystalline
product
Page 77
2.3 Characterization Techniques
2.3.1 X-ray Diffraction
The XRD measurements were made on the sintered pellets using a Philips X pert
MPD X-ray diffractometer with X’pert High Score software. Each sample was scanned in
the 2θ range of 20-70°.The X-ray patterns were obtained using Cu-source with Cu-Kα
radiation (λ=1.540562 Ǻ). The XRD patterns of all the compositions were recorded at
room temperature. The measurement conditions were kept constant for all the
compositions and are tabulated in Table 2.1.
Table 2.1 XRD Measurement conditions
Tube voltage 40KV
Tube current 35mA
Target Cu
Filter Ni
Scan speed 0.0080°/s
Scanning range (2θ) 20-70°
Total scan time 29 minutes
The diffraction occurs due to the presence of certain phase relations between two
or more waves [1]. The differences in path length of various rays arise naturally when it
is assumed how a crystal diffracts X-rays. It is considered that a beam of perfectly
parallel, perfectly monochromatic X-rays K radiations are incident on the crystal at an
angle θ called the Bragg angle. A diffracted beam may be defined as a beam composed of
large number of scattered rays mutually reinforcing each other. This diffracted beam is
illustrated mathematically by Bragg’s law;
2dhkl Sinθhkl = n λ (2.1)
Page 78
where d is the interplanar spacing of the (hkl) planes and n is called the order of
diffraction.
For phase identification of crystalline materials the d spacing of various peaks is
obtained and matched them with those of some standard reference cards from ICDD
“International Centre for Diffraction Data” or JCPDS “ Joint Committee on Powder
Diffraction Standard”. The average crystallite size of the crystalline materials can be
estimated from the analysis of XRD patterns using Scherrer’s formula [1]:
BB
Kt
cos (2.2)
where t is the average size of the crystallites, B is the Braggs angle for the actual peak
and K is a constant (=0.94). This relationship has been confirmed by number of
researchers. The width B is measured at an intensity equal to half the maximum intensity
(B is an angular width and not a linear width measured in radians) as shown in Fig. 2.1
Fig. 2.1. The line broadening of XRD pattern due to crystallite size [1].
2
1Imax
Imax
Inte
nsi
ty
2θ2 2 θ B 2 θ1
B
Page 79
The Scherrer’s equation mentioned above is only valid for stress free materials.
The average value of lattice constant ‘ a ’ for all compositions can be calculated using the
Nelson-Riley function [2];
22
2
1 Cos
Sin
CosF (2.3)
where is the Bragg angle. The more precise value of lattice parameter can be obtained
from the extrapolation of the line to F ( ) = 0 or = 90°.
The actual density (X-ray density) was calculated from the values of lattice
parameter using the following relation [3];
3
8
Na
MDx (2.4)
where 8 represent the number of molecules in a unit cell of the spinel lattice, M is the
molecular weight of the sample, ‘ a ’is the lattice constant and N is Avogadro’s number.
2.3.2 Fourier Transform Infrared Spectroscopy (FTIR)
In spinel ferrites, the ceramic network has a certain number of characteristic
vibrations determined by the structure. These vibrations involve modifications of the
electric dipole moment that cause the absorption of electromagnetic radiations in the
range of 10000-100 cm-1
, the domain of the IR spectroscopy. Fourier transform infrared
spectroscopy or FTIR technique provide useful information about the nature and structure
of ferrites. Infrared spectroscopy deals with the interaction of infrared radiation with
matter. A fourier transform is a mathematical operation used to translate a complex curve
into its component curves. In a fourier transform infrared instrument, the complex curve
is an interferogram, or the sum of the constructive and destructive interferences generated
by overlapping light waves, and the component curves are the infrared spectrum.
Page 80
2.3.2.1 Principle of FTIR
FTIR relies on the fact that the most molecules of sample absorb light in the
infrared region of the electromagnetic spectrum. These absorption peaks corresponds
specifically to the bonds present in the molecule. The sample is irradiated by a broad
spectrum of infrared light and the level of absorbance at a particular frequency is plotted
after fourier transforming the data. The resulting spectrum is characteristic of the bonds
present in the sample.
2.3.2.2 Sample Preparation for FTIR
Ferrites materials are IR active just like other ceramic materials. The present
ferrite materials were diluted with the help of potassium bromide (KBr) powder in order
to not saturate the signal. KBr is a compound known to be IR transparent. One percent of
sample mixed with KBr allow a good final resolution of the IR spectrum. The finally
sintered pellets were grounded carefully in an agate mortar and pestle. Then the powder
was kept in an oven at 105 °C for 72 hrs. The powder was dried in order to avoid water
interferences [4]. The mixed powder was then pressed in a cylindrical die to obtain discs
of approximately 1 mm thickness. These discs were again kept in an oven at 105 °C for
24 hrs to avoid moisture. Then these discs were used to study the FTIR spectra. The FTIR
spectra were measured using a Perkin Elmer FTIR spectrum-2000 spectrometer at room
temperature over the wave number range 370-1500 cm-1
.
2.3.3 Dielectric Constant Measurements
An impedance/gain-phase analyzer (Solatran analytical) along with a specifically
tuned cell was used to study dielectric properties for NiTbFe2O4 & MgTbFe2O4 ferrites.
The real and imaginary parts of the dielectric constant (ε' and ε'') were measured in the
Page 81
frequency range from 10 Hz to 10 MHz. The dielectric constant for the samples was
calculated by using the formula [5];
A
Cd
0 (2.5)
where C is the capacitance in F, d is the thickness of pellet in meters, A is the cross
sectional area of the flat surface of the pellet and 0 is the permittivity of free space. The
dielectric constant at angular frequency ω is related to the capacitance C and
conductance G as follows [5];
i* (2.6)
* is the complex dielectric constant, is the real part of dielectric constant, and is
the imaginary part of the dielectric constant; where
A
dC
4 (2.7)
A
dG4 (2.8)
where d is the thickness of the sample, A is the cross sectional area of the electrode, and
f 2 (2.9)
where f is the frequency of the applied field.
The ac electrical conductivity of all the samples was calculated using the relation
[6];
σ ac = 2πftanδέε0 (2.10)
where tanδ is the dissipation factor.
2.3.4. Electrical Resistivity Measurements
The dc resistivity of the samples under investigation was measured by two probe
method. A sample holder used for the measurements is shown in Fig. 2.2. In this method
Page 82
a sample holder with pressure contacts was used. The contacts were made up of copper
having effective area = 0.125 cm2. A dc power supply and sensitive electrometer model
610-C Keithley were connected in series with sample holder. By varying the voltage one
can measure the corresponding current on the electrometer. The circuit diagram is shown
in Fig.2.3. By plotting the I V-curve the resistance was calculated by using the following
relation [7];
t
RA (2.11)
where R is Resistance of the sample (Slope of I V-curve), A is effective area of the
electrode and t is thickness of the sample.
The effective area of the circular electrodes was calculated by using the relation
[7];
2rA (2.12)
where r is radius of the electrode.
Fig 2.2. Two probe sample holder used in electrical measurements
Page 83
Fig 2.3. The circuit diagram of electrical resistivity measurement apparatus.
2.3.5 Bulk Density Measurements
The bulk density Db (g/cm3) of the sintered ferrites was measured using a
Sartorius density determination kit based on Archimedean principle using toluene as a
liquid. The sample has been immersed in liquid (toluene) and is exposed to the force of
buoyancy. The value of this force is the same as that of the weight of the liquid displaced
by the volume of the sample. With a hydrostatic balance that enables sample to be
weighed in air as well as in liquid. Therefore, it is possible to determine the density of
solid if the density of the liquid causing the buoyancy is known.
The bulk density of all sintered samples was determined by using the following
equation [8];
ta
ta
bWW
WD
. (2.13)
where, Db= bulk density
aW = weight of the sample in air
tW = weight of sample in toluene
t = density of toluene at the measurement temperature
Page 84
The percentage of porosity (P) for all the compositions is calculated using the
following relation [8] ;
1001
x
b
D
DP (2.14)
where Dx is the X-ray density.
2.3.6 Scanning Electron Microscopy
The microstructure of the samples was observed using a scanning electron
microscope (SEM) model JEOL JSM-840. The average grain size was estimated from
SEM micrographs using the line intercept method.
2.3.7 Vibrating Sample Magnetometer
The M-H loops were plotted on the samples at room temperature. The computer
controlled vibrating sample magnetometer (VSM) LakeShore model 7300 was used in
which the sample was vibrated vertically between the pickup coils in a constant magnetic
field. The vibrating sample magnetometer was calibrated with Ni-standard having
magnetization of 3.475 emu at 5000 G. The field was swept in the range 60-10000 Oe.
2.3.8 The Ferromagnetic Resonance
The ferromagnetic resonance (FMR) measurements were performed on spherical
shaped samples using a standard FMR spectrometer at X-band (9.5GHz) and TE102
reflection cavity. The measurements were made under identical conditions on all the
samples. In FMR measurements, the sample was always saturated due to static magnetic field
required for resonance at microwave frequency. Field swept linewidth was measured by sweeping the field
from 60 Oe to 10 kOe.
Page 85
Fig. 2.4. Ferromagnetic Resonance (FMR) Apparatus (Courtesy of Colorado State
University, USA).
For FMR the samples were converted into sphere form of dia ≈ 2mm. FMR
profiles of the samples were taken by scanning the field and the frequency was kept
constant at 9.5 GHz. The standard FMR spectrometer is shown in Fig.2.4. The
microwaves of frequency 9.5 GHz were produced from water cooled klystron tube. The
microwave was then allowed to fall on the sample placed at the centre of TE102 X-band
reflection cavity. The reflected microwave is detected by the crystal detector. The
reflected signal is fed into the lock-in amplifier. The lock-in is connected to the
modulation coils. The FMR profile is recorded on the computer using LabView software.
The scan field of the magnets is independently controlled by the LabView coupled with
Gausmeter.
Page 86
2.3.9 Relative Initial Permeability Measurements
Solatron 1260 impedance analyzer (Solatron analytical) was used to measure the
high frequency impedance. The ferrite samples fabricated in the form of toroid has been
used which are wound with Cu wire to serve as inductor coil. The two ends of the wire
are connected to the analyzer. The two-probe method has been employed to measure the
high frequency impedance. The impedance analyzer is connected to a computer with
GPIB interface. The whole operation of the analyzer is controlled by Solatron materials
research and test, version 1.2 software. This analyzer has the capability to save the
measured data as real, imaginary and magnitude of impedance in ohms.
References
[1] B. D. Cullity, Elements of X-ray Diffraction 2nd
ed.: Addison-Wesley
Publishing Company, Inc. 1978.
[2] Briggs D. and C. J. Riviere, Practical Surface Analysis Vol.1: Auger and X-ray
photoelectron spectroscopy 2nd
ed.: John Wiley & Sons, Chichester, 1990.
[3] J. Smit, H. P. J. Wijn, Ferrites, John Wiley, New York, 1959, 233.
[4] William Kemp, Organic spectroscopy 3rd
ed.; Mac Millan press Ltd. 1991.
[5] E. C. Snelling, Soft Ferrites; Properties and applications, Butterworth, London, 1990.
[6] A. M. M. Farea, Shalendra Kumar, Khalid Mujasam Batoo, Ali Yousef, Chan Gyu
Lee, Alimuddin, J. Alloys Comp. 469 (2009) 451-457.
[7] Muhammad Javed Iqbal, Mah Rukh Siddiquah, J Magn. Magn. Mater. 320 (2008)
845-850.
[8] Noboru Ichinose, Introduction to Fine Ceramics, Ohmsha Ltd., Japan, 1987.
Page 87
3
THEORETICAL BACKGROUND
3.1 Soft Magnetic Materials
Soft magnets or soft ferrites are those which can be easily magnetized and
demagnetized. The distinguish characteristic of these materials is that they have high
magnetic permeability which make them suitable for use in many electromagnetic
devices. Soft magnetic materials are used in a variety of high-frequency applications.
Examples are flux guidance in permanent magnet and other systems, transformer cores,
microwave applications, and recording heads. A feature of soft magnetic materials is their
low coercivity, which are often several orders of magnitude smaller than those of hard-
and semi-hard materials. Another figure of merit is the initial permeability, which
exceeds 1000 in soft magnets. High-frequency applications require small hysteresis
losses, so that the small coercivities are often more important than a high permeability [1,
2].
3.2 Structure of Ferrites
Soft ferrites have cubic spinel structure. The spinel structure is derived from the
mineral spinel, (MgAl2O4) whose structure was elucidated by Bragg [3] and it crystallizes
in the cubic system. Magnetic spinels have the general formula MOFe2O3 or MFe2O4
where M is one of the divalent metal ions of the transition metal elements such as Mn,
Fe, Co, Ni, Cu and Cd. A combination of these ions is also possible. Trivalent ions
in MFe2O4 can also be replaced partly or completely. All the ferrites contain iron oxide as
Page 88
the major component. In addition other metal ions like Ni2+
, Co2+
and Mn2+
can be used
to provide the unpaired electron spins. Other divalent ions such as Mg2+
or Zn2+
or
monovalent Li are not paramagnetic but are used in order to disturb the concentration of
Fe3+
ions on the crystal lattice sites to provide or increase the magnetic moment.
The smallest cell of the spinel lattice consists of eight formula units (8
×MFe2O4). The 32 relatively large oxygen ions form a face centered cubic (fcc) lattice in
which two kinds of interstitial sites occur, namely, 64 tetrahedral sites, surrounded by 4
oxygen ions (A-sites) and 32 octahedral sites which are surrounded by 6 oxygen ions (B-
sites). In the cubic spinel discussed above 8 out of 64 tetrahedral sites and 16 out of 32
octahedral sites are occupied by metal ions to maintain the charge balance. In order to
describe the crystal structure more clearly, the unit cell is divided into eight octants with
edge 2
1a (a is the edge of unit cell) as shown in Fig. 3.1. The oxygen ions (anions) are
arranged in the same way in all the octants. Each octant contains four oxygen ions on the
body diagonals and they form the corners of a tetrahedron shown in Fig.3.2. Each octant
contains four tetrahedral metal ions. These metal ions are also arranged in the same
fashion as oxygen ions, from the other ends of the body diagonal. The octahedral metal
ions form four interpenetrating fcc lattices, with edge a, which are displaced with respect
to each other over a distance 24
1a in the direction of the face diagonals of the cube [4].
Page 89
Fig. 3.1. The spinel structure.
If the tetrahedral sites are occupied by eight divalent metal ions and octahedral
sites are occupied sixteen trivalent metal ions then this kind of structure is called normal
spinel. e.g. ZnFe2O4. If the octahedral sites are occupied by eight divalent and eight
trivalent metal ions, this type of structure is called inverse spinel. Most of the
commercially available ferrites have inverse spinel structure.
Fig. 3.2. The tetrahedral cations (dark circles), octahedral cations
(small circles) and O atoms (large circles)
Page 90
The oxygen atoms in the spinel structure are not generally located at the exact
positions of the fcc sublattice. Their detailed positions are determined by u parameter
(distance between oxygen ion and a face of a cube). It reflects the adjustment of the
structure to accommodate the differences in the radius ratio of the cations in the
tetrahedral and octahedral sites. The u parameter has a value of 0.375 for an ideal close-
packed arrangement of oxygen atoms. The ideal situation is almost never realized; hence
the value of u parameter of the majority of known spinels is in the range 0.375-0.385.
The u value increases because the anions in tetrahedral sites are forced to move in [111]
direction to give space to the A cations, which are always larger than the ideal space
allowed by the close packed oxygen [5].
3.3 Electrical Properties
3.3.1 Electrical Resistivity
The ferrites have resistivity in the range 10-2
-1011
ohm-cm depending upon their
chemical composition. It was observed that the resistivity was caused by the
simultaneous presence of ferrous and ferric ions on octahedral sites [6]. A lot of research
work has been carried out [7-9] on improving the electrical resistivity of ferrites. A small
amount of foreign ions, about 1 % can be incorporated in an oxide and if these ions have
different valency to those already present (e.g. titinum ions in Fe2O3), then these ions
may force some ions into different valency sites. In order to have high resistivity, the
number of ferrous ions in stoichiometric ferrites should be less. The temperature
dependent resistivity of ferrites obeys the following relation [10];
kTEaexp0 (3.1)
Page 91
where ρ is the resistivity, k is Boltzman constant and Ea is the activation energy which
can be illustrated as the energy needed to release an electron from the ion for a jump to
the neighboring ion. The value of activation energy lies between 0.1 and 0.5 eV. It has
been noticed that the high activation energy usually goes hand in hand with the high
resistivity of ferrite at room temperature.
3.3.2 Conduction Mechanisms
Ferrites are key materials and exhibit interesting properties owing to which these
are useful in electronic devices. Ferrites which are ferrimagnetic semiconductor led to the
synthesis of new ferrites to achieve optimum resistivity. The substitution of different
cations like manganese or cobalt can also alter the resistivity of ferrites. To produce low
loss ferrites, an extensive research work has been done to study mechanism of electrical
transport properties and the influence of various substitutions on these properties. The
conduction mechanism in ferrites is entirely different from the semiconductors. In
semiconductors charge carriers occupy states in wide energy band. In ferrites charge
carriers are localized at the magnetic atoms. The conductivity is affected by the
temperature dependent mobility while carrier concentration remains unchanged by the
variation of temperature. The cations are surrounded by the close-packed oxygen anions
and the first order approximation can be regarded as an isolated from each other.
There will be a small overlap of the anions charge clouds or orbital. The electrons
related to a particular ion will usually remain isolated and hence localized electron model
is more applicable in ferrites rather than collective electron model (band model). The
conduction in ferrite is due to the exchange of 3d electrons, localized at the metal ions,
from Fe3+
to Fe2+
[11]. Suppose all the Fe2+
ions reside on B-sites to take part in hopping
Page 92
transport, the number of charge carriers found to be 1022
/cm3. The mobility is low as the
conductivity is low even the number of charge carriers (n) is large. Some of the models
are depicted which explain the conduction mechanism in ferrites.
3.3.3 Hopping Model of Electrons
This model was suggested by Jonker [9]. In ferrites the charge carriers are not free
to move through the crystal lattice but these jump from ion to ion. These materials have
the capability of changing the valency of considerable fraction of metal ions specially
iron ions. In an equilibrium lattice, there is little overlap between the wave functions of
ions on adjacent octahedral sites, ensuing that the electrons/holes are not free to move
through the crystal but are mixed at the metal ions. The occurrence of lattice vibrations
causes the ions to come close together rarely for transfer and it happens with high degree
of probability. Hence the conduction is induced only by the lattice vibrations and the
carrier mobility shows temperature dependence as characterized by activation energy. In
the process of jumping the mobilities of electrons and holes are given by the following
relations
kT
kTqed )/exp( 11
2
1
(3.2)
kT
kTqed )/exp( 22
2
2
(3.3)
where the subscripts 1 and 2 represent the parameter for electrons and holes, d indicate
the jumping length, γ1 and γ2 lattice frequencies active in the jumping process, q1 and q2
activation energies involved in the lattice deformation.
Page 93
The activation energy does not belong to the energy picture of electrons but to the
crystal lattice around the site of electrons. The expression for the total conductivity in this
case where we have two types of charge carriers is given by
2211 enen (3.4)
The temperature dependent conductivity occurs only due to mobility and not only
due to the number of charge carriers in the sample. The following are the outcomes of
this model. The low value of mobility less than the limiting value (0.1cm2
Vs) taken as
the minimum [12] for band conduction. The independence of seebeck coefficient on
temperature is due to the fact that in this model the number of charge carriers is fixed.
Thermally activated process with activation energy Ea called the hoping activation
energy. The occurrence of n-p transition with changes in the Fe2+
of oxygen concentration
in the system.
3.3.4 Small Polaron Model
A small polaron is a defect created when an electronic carrier is trapped at a given
site as the result of the displacement of adjacent atoms or ions. The whole defect (carrier
and distortion) then migrates by an activated hopping mechanism. The formation of small
polaron can also take place in those materials whose conduction electrons belong to
incomplete inner (d or f) shells which due to small electron overlap, tends to form
extremely narrow bands. The migrations of small polaron [13] require the hopping of
both electron and the polarized atomic configuration from one site to the nearest one. For
an fcc lattice the drift mobility is given by
kTeac /2)1( (3.5)
Page 94
where c is the fraction of sites which contain an electron (c = n/N), n is number of
electrons, N is the number of available sites/unit volume, e is the electronic charge and a
is the lattice parameter. The symbol г indicates the jump rate of polaron from one site to
the neighboring site. This model explains the low value of mobility, temperature
independent Seebeck coefficient and thermally activated hopping. The hopping electrons
become localized by virtue of its interaction with phonons. In this way the small polaron
is formed and the electrical conduction is due to hopping motion of small polarons.
3.4 Frequency Dependence of Dielectric Constant in Ferrites
It has been known that the ferrites have high dielectric constant and that this
strongly depends on frequency. The loss factor tan δ is generally very high at low
frequency falling by several orders of magnitude as the frequency rises. Koops [8] found
that the dielectric constant of Ni-Zn ferrite Ni0.4Zn0.6Fe2O4 followed much the same
course with changing frequency as the electrical resistance i.e. it fell with rising
frequency down to a very small value. A comparison of the curves with the plotted
measured points shows that there is excellent agreement with the hypothesis. Koops was
able to show that the same dispersion law held for very differently annealed ferrites with
greater or less FeO content.
Fairweather and Frost investigated [14] the temperature dependence of the
dielectric constants of magnesium ferrites and Mg-Al ferrites. They found that the
dielectric constant rose with temperature at low and high frequencies. The maximum of
the tan δ curve shifted toward higher frequencies with rising temperature. The Cu-Zn
ferrites, Mn-Zn ferrites, Cu-Cd ferrites and Ni-Zn ferrites have a maximum dielectric
constant, ε, of 104-10
5. The high dielectric constants of the ferrites at room temperature
Page 95
and at low frequencies, as discussed above, suggests that they would make excellent
dielectrics for capacitors.
3.5 Magnetic Properties
The magnetization of magnetic materials in general depends on the magnetic field
acting on it. For many materials magnetization, M is proportional to magnetic field, H
and we may write
M = χ H (3.6)
where χ is the magnetic susceptibility which is the property of the material. As both M
and H have same dimensions, χ is dimensionless. The magnetic materials on the basis of
magnetic susceptibility can be classified into subgroups.
3.5.1 Diamagnetic Materials
These materials have negative susceptibilities of the order of 10-6
and for practical
purposes are independent of temperature [15]. They have no intrinsic magnetic moments.
A perfect diamagnetic is a magnetic insulator in the sense that it bars the passage of
magnetic flux, just as an electrical insulator bars the passage of electric charge. Most of
the organic compounds, inert gases, many metals like Hg, Bi and non-metallic elements
like Boron and Sulfur are the examples of diamagnetic substances.
3.5.2 Paramagnetic Materials
These materials have positive susceptibilities lying between 10-3
to 10-6
. Most of
the gases, many salts in the iron group, the alkali metals, and also ferromagnetic and
ferrimagnetic materials at temperatures above the Curie temperatures are the examples of
paramagnetic substances. These substances possess intrinsic magnetic moments. When a
Page 96
field is applied, it tends to align them but thermal agitation promotes randomization.
These contain atoms with permanent magnetic dipole moments. A subdivision of
paramagnetism is the phenomenon called the super paramagnetism. Super paramagnetism
is met in ferromagnetic and ferrimagnetic materials which are very finely divided as,
when they appear as colloids or precipitates in non-magnetisable matrices. Disappearance
of hysteresis and the collapse of the magnetizing curves of an anisotropic substance,
when plotted against H/T, are typical effects, among others, of super paramagnetism.
3.5.3 Ferromagnetic Materials
In these materials, all atomic spins are aligned more or less parallel. In these
materials susceptibility depends on the field strength. The relation between magnetization
and the field strength is not single valued (characterized by hysteresis). In these materials
below the Curie temperature there exist elementary regions of magnetization, known as
the Weiss domains. The metals iron, cobalt and nickel, many of their alloys, some rare
earths erbium, dysprosium and several of their alloys are ferromagnetic substances.
3.5.4 Antiferromagnetic Materials
These materials, like the ferromagnetic materials, are particular subgroup of
paramagnetic substances. These have susceptibilities of the order of 10-3
but they increase
with heating, up to critical temperature, and then fall off again. The temperature at which
the phenomenon of antiferromagnetism disappears is called Neel temperature.
Manganese monoxide (MnO), iron oxide (FeO), nickel oxide (NiO), iron chloride (FeCl2)
and manganese selenide (MnSe) are the examples of antiferromagnetic substances.
3.5.5 Ferrimagnetic Materials
Page 97
In these materials, the moments on the two sites are not equal. Thus complete
cancellation did not occur and a net moment resulted which was the difference in the
moments on the two sites. The compounds of the general formula MFe2O4 where M
represents a divalent metal ion and mixed oxides of iron with other elements are
examples of ferrimagnets. These oxides usually have spinel type crystal lattice.
(a) (b) (c)
Fig. 3.3. Magnetic structure of materials (a) ferromagnetic (b) antiferromagnetic
(c) ferrimagnetic
3.6 Magnetization in Ferrites
The ferrites [16] are ionic compounds and their magnetic properties are due to the
magnetic ions they contain. Practically only the magnetism of ferromagnetic and
ferrimagnetic substances is of functionally important. The magnetism of magnetic oxide
materials, ferrimagnetism, is a crystal phenomenon. It occurs for crystal of spinel
structure. The lattice of this structure comprises sublattices A and B. The two sublattices
are magnetically antiparallel and show markedly different magnetic moments. Each
sublattice could be treated as possessing its own magnetization, and the resulting ferrite
would be the superposition of the two magnetizations.
The spontaneous magnetization in spinel ferrites can be estimated on the basis of
their composition, cation distribution and the relative strength of the possible interactions.
Since cation-cation distances are generally large, hence direct interaction is negligible.
Page 98
The strongest interaction is expected to occur between octahedral and tetrahedral cations.
The next interaction is between octahedral and octahedral cations. The octahedral and
tetrahedral interaction is dominant interaction usually in inverse spinel and it leads to a
saturation magnetization at 0 K which depends only on the magnetic moment of the
divalent cation. Antiparallel order cancels Fe3+
moments in octahedral and tetrahedral
sites and the divalent cation moment on octahedral sites accounts for the net
magnetization. The temperature dependent magnetization in ferrimagnetic materials is the
difference in sublattice magnetizations. Since each sublattice has its own temperature
dependence, hence a wide variety of magnetization curves can be obtained in these
materials.
3.7 Neel’s Theory of Ferrimagnetism
L. Neel [17] suggested that a ferrimagnetic crystal could be divided into two
sublattices, namely A-sublattice (tetrahedral-sites) and B-sublattice (octahedral-sites) in a
spinel structure. He assumed the existence in the material of one magnetic ion only,
whose fraction λ appeared on A-site and fraction μ on B-site here λ + μ = 1 (note that λ =
μ = ½). The remaining lattice sites were assumed to house only ions of zero magnetic
moment. Consider a simple ferrite of the form MFe2O4 which satisfies Neel’s
assumptions, the magnetic ions are trivalent ferric Fe3+
, M is non-magnetic and the
formula might be written Fe2λ M (1-2λ) [Fe (2-2λ) M 2λ] O4. Where the bracketed ions are
those on the octahedral sites. There are several interactions between magnetic ions to be
considered and these may be termed as A-A, B-B, A-B and B-A interactions. Where A-A
refers to the interaction on A-site.
Page 99
In the Neel’s theory it is assumed that the A-B and B-A interactions are identical
and predominate over A-A and B-B interactions, and are such as to favour the alignment
of the magnetic moment of each A-ion more or less antiparallel with the moment of each
B-ion. From the Weiss molecular field theory Neel described the interaction with in the
material. The magnetic field acting upon an atom or ion may be written as
H = H0 +Hm (3.7)
where H0 is the external applied field and Hm is the molecular field which arises due to
interactions with other atoms or ions within material. When the molecular field concept is
applied to ferrimagnetic material we have
H A = H AA + H AB (3.8)
H B = H BB + H BA (3.9)
Here the molecular field H A acting on an ion A-site is represented as the sum of the
molecular field HAA due to neighbouring A-ions, and HAB due to its neighbouring on B-
sites. A similar definition holds for the molecular field HB acting on B-ion. The molecular
field components may be written as γAA
HA = γAAMA HAB = γABMB HBB = γBBMB HBA = γBAMA
where γ’s are the molecular field coefficients and MA and MB are the magnetizations of A
and B sublattices respectively. It may be shown that
γAB = γBA but γAA ≠ γBB
unless the two sublattices are identical. Neel showed that γAB < 0, favouring antiparallel
arrangements of MA and MB gives rise to ferrimagnetism.
In the presence of an applied field H0, the total magnetic fields acting on each sublattices
may be written
Page 100
Ha = H0 +Ha = H0 + γAA MA + γABMB (3.10)
Hb = H0 +Hb = H0 + γBB MB + γABMA (3.11)
3.8 Saturation Moments
The saturation magnetization of ferrite can be calculated at 0 °K by knowing the
moment of each ion, the distribution of ions on A and B sites and the interaction between
the two sites is negative [18]. In Ni ferrite, all Ni2+
ions reside on B-sites and Fe3+
ions are
randomly distributed on both A and B-sites. The moments of Fe3+
ions cancel and the net
moment is that of the Ni2+
ion, which is 2μB. Thus it can be generalized that the saturation
magnetization of any inverse ferrite is simply the moment of the divalent ion. The Zn
ferrite has normal structure. The Zn2+
ions are of zero moments occupies A sites. Hence
there can be no AB interaction. The negative BB interaction then occurs, Fe3+
ions on B
sites tend to have antiparallel moments and there is no net moment.
Magnesium ferrite is a well known mixed ferrite. If its structure were completely
inverse, its net moment would be zero, because the moment of Mg2+
ion is zero. It was
noted earlier that 0.1 of the Mg2+
ions are on A-sites and these displaces an equal number
of Fe3+
ions to B-sites. Hence Mg ferrite giving an expected net moment of 1.0 μB. This is
very close to the experimental value of 1.1 μB. In mixed ferrites containing zinc, it is
remarkable that the addition of nonmagnetic zinc increases the saturation magnetization.
Suppose a mixed ferrite containing 10 molecular percent Zn ferrite in Ni ferrite. The Zn2+
ions are of zero moments go to A sites in pure Zn ferrite and Fe3+
ions of Zn ferrite have
parallel moments in B-sites because of the strong AB interaction. The expected net
moment increases from 2.0 μB, for pure Ni ferrite to 2.8 μB for the mixed ferrite. If this
increase of 0.8 μB per 10 molecular percent of Zn ferrite continued with further additions,
Page 101
we would expect pure Zn ferrite to have moment of 10 μB. This does not happens because
the A moments will soon become too weak to affect the B moments and the net moment
begin to decrease. The discrepancies between the theoretical and experimental moments
may be ascribed to the following;
Orbital moments may not be completely quenched
The structure may not be completely inverse.
The degree of inversion can sometimes be changed by heat treatment. Hence the
saturation becomes a temperature sensitive property.
3.9 The Magnetic Interactions
In ferrimagnets, the metal ions occupy the two crystallographic sites, namely A-
sites and B-sites. Three kinds of magnetic interactions between the metal ions are
possible through O2-
ions. These are A-A interactions, B-B interactions and A-B
interactions. It has been experimentally noted that the energies of these interactions are
negative and thus induce an antiparallel orientation. The magnitude of interaction energy
between the magnetic ions depends upon the distances from these ions to the oxygen ion
through which the interaction occurs and the angle between these two magnetic ions.
An angle of 180° will give rise to the greatest exchange energy and the energy
decreases very rapidly with increasing distance. The various possible configurations of
the ions pairs in spinel ferrites with favourable distances and angles for an effective
magnetic interaction [19] are shown in Figure 3.4. On the basis of the values of the
distance and the angle φ, it may be concluded that of the three possible interactions, the
A-B interaction has the greatest magnitude. From the Figure 3.4 it is evident that the two
configurations for the A-B interaction have small distances and the values of the angle φ
Page 102
are fairly high. In the B-B interaction the first configuration will be effective since in the
second configuration the distance is too large for effective interaction.
Fig. 3.4. Magnetic interactions (Adapted from Gorter [19])
The A-A interaction is the weakest as the distance is large and the angle φ is ~
80°. Thus with only A-B interaction predominating, the spins of the A and B-site ions, in
ferrimagnets will be oppositely magnetized sublattices, with a resultant magnetic moment
equal to the difference between those of A and B site ions.
3.10 Domains in Ferrites
The magnetic materials are subdidvided into domains. Domains contain 1012
to
1015
atoms and their dimensions [20] are of the order of microns. In general, the magnetic
orientations are distributed at random, depending upon the microstructure of its crystals.
In each domain the magnetic moments of the atoms are mutually parallel. With in each
domain, the magnetization is uniform and is equal to saturation magnetization. But
different domains are magnetized in different directions. Domains are formed basically to
reduce the magnetostatic energy which is the magnetic potential energy contained in the
Φ = 125° 9¹ 154° 24¹ 90° 125° 2¹ 79° 38¹
Page 103
field lines, connecting north and south poles outside of the material. In Figure3.5 the
arrows indicate the direction of the magnetization and consequently the direction of spin
alignment in the domain. We can substantially reduce the length of the flux path through
the unfavorable air space by splitting that domain into two or more smaller domains.
This splitting process continues to lower the energy of the system until the point
that more energy is required to form the domain boundary than is decreased by the
magnetostatic energy change. When a large domain is split into n domains, the energy of
the new structure is about l/nth of the single domain structure. In Fig. 3.5, the moments in
adjacent domains are oriented at an angle of 180° to each other. Other configurations may
occur which lead to lowering of the energy of the system. The triangular domains are
called closure domains. In this configuration, the magnetic flux path never leaves the
boundary of the material. Therefore, the magnetostatic energy is reduced. This type of
structure may also be found at the outer surfaces of a material. The size and shape of a
domain may be determined by the minimization of several types of energies.
Fig. 3.5. Magnetization in Domains. (a) single domain, (b) closure domains, (c)
closure domains.
3.11 Magnetostatic Energy
Page 104
The magnetostatic energy is the work needed to put magnetic poles in special
geometric configurations. It is also the energy of demagnetization. It can be calculated for
simple geometric shapes. Neel (1944) and Kittel (1946) have calculated the magnetostatic
energy of flat strips of thickness, d, magnetized to intensity, M, alternately across the
thickness of the planes. The equation is;
Ep= 0.85 dM2 (3.12)
The general formula for the calculations of other shapes is
Ep= constant x dM2 (3.13)
Therefore the magnetostatic energy is decreased as the width of the domain
decreases. This mathematically confirms the assumption that splitting of domains into
smaller widths decreases the energy from the magnetostatic view.
3.12 Magnetocrystalline Anisotropy Energy
In most magnetic materials, the domain magnetization tends to align itself along
one of the main crystal directions. This direction is called the easy direction of
magnetization. Sometimes it is an edge of the cube and at other times, it may be a body
diagonal. The difference in energy of a state where the magnetization is aligned along an
easy direction and one where it is aligned along a hard direction is called the
magnetocrystalline anisotropy energy. This magnetocrystalline anisotropy energy is also
that needed to rotate the moment from the easy direction to another direction. The energy
of the domain can be lowered by this amount by having the spins or moments align
themselves along these directions of easy magnetization. Magnetocrystalline anisotropy
is due to the fact that there is not complete quenching of the orbital angular momentum.
Page 105
3.13 Magnetostrictive Energy
When a magnetic material is magnetized, a small change in the dimensions
occurs. The relative change is on the order of several parts per million and is called
magnetostriction. The converse is also true. That is, when a magnetic material is stressed,
the direction of magnetization will be aligned parallel to the direction of stress in some
materials and at right angles to it in others. The energy of magnetostriction depends on
the amount of stress and on a constant characteristic of the material called the
magnetostriction constant
E = 3/2λσ (3.14)
where λ is magnetostriction constant and σ is applied stress.
If the magnetostriction is positive, the magnetization is increased by tension and
also the material expands when the magnetization is increased. On the other hand, if the
magnetostriction is negative, the magnetization is decreased by tension and the material
contracts when it is magnetized. Stresses can be introduced in ferrites which can affect
the directions of the moments.
3.14 Domain Wall Energy
Bloch (1932) was the first to present the idea of magnetic domains, with domain
wall boundaries separating them. In the domain structure of bulk materials, the domain
wall is the region where the magnetization direction in one domain is gradually changed
to the direction of the neighboring domain. If δ is the thickness of the domain wall which
is proportional to the number of atomic layers through which the magnetization is to
change from the initial direction to the final direction, the exchange energy stored in the
transition layer due to the spin interaction is;
Page 106
Ee= kTc/a (3.15)
where kTc is thermal energy at the Curie point and ‘a’ is the distance between atoms.
Therefore the exchange energy is reduced by an increase in the width of the wall or with
the number of atomic layers in that wall. However, in the presence of an anisotropy
energy or preferred direction, rotation of the magnetization from an easy direction
increases the energy so the wall energy due to the anisotropy is;
Ek= kλ (3.16)
In this case, the energy is increased as the domain width or number of atomic layers is
increased. The two effects oppose each other and the minimum energy of the wall per
unit area of wall occurs according to the following equation;
Ew = 2(KaTc/a)1/2
(3.17)
where Ka is the Anisotropy constant
If magnetostriction is a consideration, the equation is modified to;
Ew= 2(kaTc/a)1/2
(Ka+3 λsσ/2)1/2
(3.18)
where λs is magnetostriction constant. Typical values of domain wall energies are on the
order of 1-2 ergs/cm2.
3.15 Hysteresis Loop
In soft magnetic materials, we want a high induction for a low field. In this case,
H is very small compared to 4πM and B is essentially equal to 4πM. If we start with a
demagnetized specimen and increase the magnetic field, the induction increases as shown
in Figure 3.6. At high fields, the induction flattens out at a value called the saturation
induction, Bs. If, after the material is saturated, the field is reduced to zero and then
reversed in the opposite direction, the original magnetization curve is not reproduced but
Page 107
a loop commonly called a hysteresis loop is obtained. Figure 3.6 shows such a hysteresis
loop with the initial magnetization curve included. The arrows show the direction of
travel. We notice that there is a lag in the induction with respect to the field. This lag is
called hysteresis. As a result, the induction at a given field strength has two values and
cannot be specified without a knowledge of the previous magnetic history of the sample.
The area included in the hysteresis loop is a measure of the magnetic losses incurred in
the cyclic magnetization process. The hysteresis losses can also be correlated with the
irreversible domain dynamics. The value of the induction after saturation when the field
is reduced to zero is called the remanent induction or remanence, (Br). The values of the
reverse field needed after saturation to reduce the induction to zero is called the coercive
force or coercivity, (Hc). Most polycrystalline sintered samples of ferrites with spinel
structure have a relatively low coercive force.
Fig. 3.6. Typical hysteresis loop along with initial magnetization curve
3.16 Permeability
Page 108
Ψ
Ψ
π2 - Ψ
dl
In ferromagnetics and ferrimagnetics we are concerned with the total flux density,
B, and it is more convenient to define a very important parameter, ‘μ’ the magnetic
permeability which is the ratio of induction, B to magnetizing field, H. However, this
parameter can be measured under different sets of conditions. For example, if the
magnetizing field is very low, approaching zero, the ratio will be called the initial
permeability μ0. It is defined as follows;
μ0 = limit (B/H) (3.19)
B 0
This parameter will be important in telecommunications applications where very
low drive levels are involved. On the other hand, when the magnetizing field is sufficient
to bring the B level up to the point of inflection, the highest permeability occurs. This can
be seen by visualizing the permeability as the slope of the line from the origin to the end
point of the excursion. Since the magnetization curve flattens out after the point, the μ
will decrease. It is important to know the position of the maximum permeability and the
course of μ versus B.
The permeability was calculated by using the following derivation.
The Biot and Savart law could be used [21] to define the magnetic flux density B
due to a circular coil carrying a current I. In Fig. 3.7, ‘a’ is the radius of the circular coil.
Let us calculate the magnetic flux density at the point P at a distance z 0 from point ‘O’ on
the axis of the coil.
r
Page 109
Fig. 3.7. A circular coil carrying current I [22].
The element dl of the current carrying loop at the top of the coil points
perpendicularly out of the page. The point P and the current element ‘Idl’ of the coil are
separated by a distance ‘r’. The magnetic field produced by the element dl is dB, which is
normal to dl and ‘r’. This will act in the direction shown in the figure. On integrating
round the coil, the sum of the components of dB, normal to the axis, is zero. The
magnitude of the component parallel to the axis is given by [22]:
cos
4 2
0
r
IdldB (3.20)
where ψ is the angle between the axis and magnetic field dB.
Integrating equation 3.20, the magnetic flux density is given by:
r
a
r
Ia
r
Idl
r
IB
2
0
2
0
2
0
22
4
coscos
4
(3.21)
23
22
2
0
2 za
IaB
(3.22)
a Z0
d P I
Page 110
The above derivation could be used to calculate the field on the axis of a solenoid having
N number of turns. In Fig. 3.8, the point P the axis of the solenoid is at a distance z0 from
O.
Fig. 3.8. A solenoid carrying current I
If the turns are equally spaced and closely wound, we may consider the current is
flowing uniformly round the cylinder. That is, if we consider the length to be divided into
elements dz, as shown at a distance z from O, the current in this section of the coil
is dzIl
N,
23
22
0
2
0
2
1
azz
dza
l
NIdB
(3.23)
Integrating the equation 3.23, the magnetic flux density is given by:
Page 111
1
0
22
0
2
0
1
02
327
0
2
2
1
2
1
azz
dza
l
NI
azz
dza
l
NIB O
22
0
0
22
0
00
2
1
azl
zl
az
z
l
NI
coscos2
1 0 l
NI (3.24)
For infinite solenoid α = β = 0
Hence the equation 3.24, can be simplified as
l
NIB 0 (3.25)
The total flux produced by the coil is given by
BA (3.26)
where A denote the cross-sectional area of the solenoid.
When ac current will flow through the coil, the magnetic flux through the coil will
change as a function of time and an electromotive force, e will be produced. According to
Faradays law, Lenz’s law induced emf, e is directly proportional to the rate of change of
flux dt
d,
dt
dNe
(3.27)
where N is the number of turns in the winding which senses.
The negative sign indicates that the emf induced opposes the changes in flux.
Since, the magnetic flux is proportional to the current one can write:
dt
dIL
dt
d
(3.28)
Page 112
where L is the self inductance. For an inductor the inductance can further be defined as:
IL
(3.29)
where, is the total linkage of the one turn inductor and ‘I’ is the current through the
inductor. An inductor having N-turn, the inductance can be defined as:
l
AN
I
BAN
I
NL
2
0 (3.30)
Any magnetic material as a core inside the solenoid having magnetic permeability,
will change the self inductance. Mathematically,
l
ANL r
2
0 (3.31)
Or, l
ANL a
2 (3.32)
Or, AN
Ll2
(3.33)
where, L is the self-inductance of the solenoid with magnetic core, r is the relative
magnetic permeability and = 0 r is the magnetic permeability in the presence of a dc
magnetic excitation.
In a coil with varying magnetic field, the magnetic permeability is measured as
the ratio of the mean induction across the specimen cross-section to the applied field. For
ac excitation, the magnetic field strength (H) and induction (B) are two sinusoidally
varying functions of the same frequency but not of the same phase in the presence of
losses. It is well known that the magnetic permeability is the result of macroscopic
atomic currents, which produce magnetic moments within the ferromagnetic materials.
As an ac current flows through the core material, a circular magnetic field is produced
Page 113
around it. This induces the atomic magnetic dipole moments with in the core. The
induced magnetic moment is proportional to the external applied field. In the absence of
an external applied field these magnetic moments are randomly oriented. An applied field
tends to orient these moments along the field direction. Each magnetic dipole moment
makes an average angle with the field direction. An equivalent solenoid current
surrounding the specimen can replace this magnetic effect of the material. This current is
called the amperian surface current.
Now, during ac excitation, the net magnetic moment of the material rotates
according to the magnitude and the polarity of the induced field. The average angle of the
dipole moment direction with the field direction changes in each cycle, which changes
the magnetic induction. Finally, the magnetic induction becomes periodic due to the
periodic magnetic field strength. In this situation the observed magnetic permeability
can no longer be expressed by only real quantities. Magnetic permeability then can be
referred to as “Apparent Permeability, a ” This quantity consists of a real and an
imaginary part. The part of magnetic induction that is in phase with the applied field can
be attributed to the real part whereas, the out of phase part can be considered as the
imaginary part. Mathematically, the apparent permeability can be expressed as a complex
number:
aaa j (3.34)
where is real part of apparent permeability and imaginary part of apparent
permeability.
The real part of the permeability is a measure of how much energy is stored in a
material. The imaginary part of the permeability is a measure of how much energy is lost
Page 114
in materials. So, the apparent permeability is the net change in energy, i.e. the difference
between the real and imaginary parts of the permeability [23].
Fig. 3.9. Equivalent circuit of a toroid.
For the toroidal specimen used in this work, wound with at least 25 equally
spaced turns (Fig. 3.9), the equivalent series circuit representing the magnetic core of the
coil is a self-inductance Lm in series with an intrinsic resistance Rm related to the complex
apparent permeability.
The permeability is a complex quantity expressing the loss of energy which
occurs as the magnetization alternates, so that the impedance of the winding is not purely
reactive but has also resistive component [24]. The total impedance of this series circuit
could be expressed as:
LjLjRZ mm (3.35)
Or, LjRLj m (3.36)
Or, mm LjjRLj 22 (3.37)
Page 115
Or, mm LjRL (3.38)
Or,
m
m
RjLL (3.39)
Comparing equation 3.25 and 3.33 the apparent permeability could be related to the
impedance as follows:
AN
lRjL m
ma 2
(3.40)
Or, AN
lRj
AN
lL mm
a 22 (3.41)
From equation 3.39 the real and imaginary part of relative permeability can be expressed
as follows:
AN
lLm
a 2 (3.42)
real part of relative permeability,
0
a
r
(3.43)
AN
lRm
a 2 (3.44)
complex part of relative permeability
0
a
r
(3.45)
the imaginary part of the complex permeability, henceforth, is referred to as permeability
loss . Some times it can be divided by and formed as loss factor tanδ.
Loss Factor, r
rtan
(3.46)
Page 116
3.17 Ferromagnetic Resonance
At very high frequencies, domains walls [16] are unable to follow the field and
the only remaining magnetization mechanism is spin rotation within domains. This
mechanism eventually also shows a dispersion, which always takes the form of a
resonance. Spins are subjected to the anisotropy field which represent spin-lattice
coupling and when an external field is applied, the spins experience a torque. The
response of spins is not instantaneous and spins precess around the field direction for a
certain time (the relaxation time τ) before adopting the new orientation. The frequency of
this precession is given by the Larmour frequency:
ωL = γμ0HT (3.47)
where HT is the total field acting on the spin,
HT = HK +H + Hd + …., (3.48)
where HK, H, and Hd are the anisotropy and the external and demagnetization fields,
respectively. If an ac field of angular frequency ωL is applied to the sample, a resonant
absorption (ferromagnetic resonance) occurs.
Ferromagnetic resonance experiments are usually performed by saturating the
sample with a strong dc field and applying a small perpendicular ac field at a constant
frequency. The dc field is then slowly varied to achieve resonance conditions. This is the
best arrangement for resonance experiments, because all the spins are oriented in a given
direction in the saturated sample and the ac field exerts a torque on their perpendicular
Page 117
component. Experimentally, it is easier to use an ac field of high, constant frequency and
slowly vary a strong dc field to achieve resonance conditions. Resonance is plotted as
power absorption as a function of dc field, for a given constant frequency as shown in
Fig.3.10.
Fig. 3.10. Ferromagnetic resonance, ΔH is the resonance line width
The line width of resonance peaks (width measured at half the height of resonance
peak), ΔH, depends on variety of factors. Anisotropy field effects can be expressed in
terms of a damping constant leading to a contribution to ΔH. If the dc field is not strong
enough to saturate the sample, the total field in each domain is different and ΔH
increases. In polycrystalline samples, this effect is more dominant, because interactions
between grains result in larger variations in the total field. The surface roughness can also
produce significant contributions to ΔH.
ΔH
Applied magnetic field (H)
Ab
sorp
tion
Page 118
3.18.1 Ferromagnetic relaxation
The power absorbed by the sample is limited due to microwave losses. This
process is called ferromagnetic relaxation. The magnetization time evolution equation
including losses can be written as;
dampingeff TtrHtrMdt
trMd ),(),(||
),(
(3.49)
It may be difficult to explicitly include all the causes of damping in eq. 3.49 as a
sum of various loss terms. However, they can be explained with the help of following
phenomenological models. Using these models some experimental parameters can be
determined which could be meant for the losses.
3.18.2 Gilbert Damping Model
This model of ferromagnetic relaxation has been presented by Gilbert [25]. If
there are driving force and damping in the physical system, the damping force will
interact with driving force. In this model the damping force is proportional to the rate of
change of the magnetization which is macroscopic dynamical variable in the magnetic
system. This is similar to mechanical damping in a viscous medium, which depends upon
velocity. This is taken into account by a damping field that reduces the actual magnetic
field to a field
dt
trMd
MtrH
S
G
eff
),(
||),(
or
dt
trMdtrM
MtrHtrM
dt
trMd
S
G
eff
),(),(),(),(||
),(
(3.50)
Page 119
G is the Gilbert damping parameter, which is a material-dependent constant.
This model describes the intrinsic damping that is mainly caused due to magnon-electron
scattering, but also due to eddy currents and magnon-phonon scattering.
3.18.3 Landau-Lifshitz Model
Landau and Lifshitz presented another model of ferromagnetic relaxation.
According to this model the loss term in eq. 3.49 is proportional to the component of the
magnetic field that is perpendicular to the magnetization [25].
),(),(),(||),(),(||),( 2
trHtrMtrMM
trHtrMdt
trMdeff
S
LL
eff
(3.51)
LL2 is usually a very small number, hence it can be ignored.
3.18.4 Other Ferromagnetic Damping Models
Bloembergen and Wang [26] presented a model of ferromagnetic relaxation.
According to this model relaxation of the transverse components of the magnetization are
independent from the one of the longitudinal component. These elaxations are
characterized by the relaxation times T1 and T2 respectively. According to this model the
magnetization is described by the Bloch equations. That is why it is called the Bloch-
Bloembergen model.
2
)(
)(
)( ),(),(),(||
),(
T
trMtrHtrM
dt
trdM yx
yxeff
yx
(3.52)
1
),(),(||),(
T
MMtrHtrM
dt
trdM SZ
ZeffZ
(3.53)
The length of the magnetization vector ),( trM
is not conserved in this model.
Page 120
If the condition
),().,(
),().,(),(
1
2
trHtrM
trHtrMtrHM
T
T
eff
effeffS
(3.54)
is fulfilled, the length of the magnetization vector will stay constant (Silva, Constrained
Codrington, Olds and Torrey model [27]).
),().,(
),(),(),(1),(),(||
),(
2 trHtrM
trHtrMtrM
TtrHtrM
dt
trMd
eff
eff
eff
(3.55)
Which is equivalent to the landau-Lifshitz model with a field dependent .
References
[1] R. A. McCurrie, "Ferromagnetic Materials Structure and Properties", Academic
Press, London, 1994.
[2] J. E. Evetts (Ed.), "Concise Encyclopedia of Magnetic and Superconducting
Materials", Pergamon Press, Oxford 1992.
[3] W. H. Bragg, Nature, 95 (1915) 561-561.
[4] J. Smit , H. P. J. Wijn, “Ferrites”, John Wiley, New York, 1959.
[5] R. J. Hill, J. R. Craig and G. V. Gibbs, Physical Chemistry of Minerals, 4, (1979)
317-339.
[6] E. J. W. Verwey and J. H. de Boer, Rec. Trav. Chim. Pays Bass, 55 (1936) 531-
540.
[7] L. G. Van Uitert, J. Chem. Phys. 23 (1955) 1883-1887.
[8] C. G. Koops, Phys. Rev. 83 (1951) 121-124.
[9] G. H. Jonker, J. Phys. Chem. Solids, 9 (1959) 165-175.
[10] J. Smit , H. P. J. Wijn, Ferrites, John Wiley, New York, 1959.
[11] A. J. Bosmann and C. C. Creve, Phys. Rev. 144 (1966) 763-770.
[12] J. H. Van Santen and G. H. Jonker, Physica, 19 (1953) 120-130.
[13] C. A. Bates and P. Steggels, J. Phys. C 8 (1975) 2283-2299.
Page 121
[14] A. Fairweather and E. J. Frost, Proc. IEE (IIa) 100 (1953) 15-22.
[15] Dr-Ing. Carl Heck, “Magnetic Materials and their Applications,” Butterworth &
Co. Ltd. 1974.
[16] Raul Valenzuela, “Magnetic Ceramics”, Cambridge university press, New York,
1994.
[17] K. J. Standley, “Oxide Magnetic Materials”, 2nd
edition, Clarendon Press,
Oxford 1972.
[18] B. D. Cullity, “Introduction to Magnetic Materials”, Addison-Wesley Publishing
Company, Notre Dame, 1972.
[19] E. W. Gorter, Philips Res. Report 9 (1954) 295, 321, 403..
[20] Alex Goldman, Modern Ferrite Technology”, Van Nostrand Reinhold, New
York, 1990.
[21] M. Kamruzzaman, Study of Magneto-Impedance Effect in Cobalt and Iron based
Metallic Glass Ribbons, Ph. D. Thesis, 2003. Department of Physics, University
of Limerick, Limerick, Ireland.
[22] B. B. Laud, “Electromagnetics”, Wiley Eastern, 1983.
[23] A. Berkowitz, and E. Kneller, Magnetism and Metallurgy. Vol. 1: Academic
Press, New York. 230.
[24] E. C. Snelling and A. D. Giles, “Ferrites for Inductors and Transformers”, John
Willey & Sons, 1983.
[25] T. L. Gilbert, IEEE Trans. Magn. 40 (2004) 3443-3449.
[26] N. Bloembergen and S. Wang, Phys. Rev. 93 (1953) 72-83.
[27] S. Kalarickal, Ferromagnetic Relaxation in (1) Metallic Thin Films and (2) Bulk
Ferrites and Composite Materials for Information Storage Device and
Microwave Applications, Ph. D. Thesis, 2006. Department of Physics, Colorado
State University, Fort Collins, U. S. A.
Page 122
4 RESULTS AND DISCUSSION
Ni1-xTbxFe2O4 Series
4.1 Structural Analysis
Figs. 4.1 and 4.2 show the X-ray diffraction patterns of the Ni1-xTbxFe2O4 ferrites
(x = 0 ≤ x ≤ 0.08 and 0.1 ≤ x ≤ 0.2 respectively). Table 4.1 shows the phases precipitated
out, lattice constant, X-ray density, bulk density and grain size of the Ni1-xTbxFe2O4
ferrites. For 0 ≤ x ≤ 0.08, all the samples are monophase cubic spinel structure while for
0.1 ≤ x ≤ 0.2 the samples are biphasic. A small reflection peak of a second phase that is
identified as an orthorhombic phase appeared at 2θ = 33.42˚ for 0.1 ≤ x ≤ 0.2. This
reflection peak can be identified as the (3 2 2) reflection of TbFeO3 phase (ICDD# 88-
0144). Strong diffraction peaks corresponding to the planes 220, 311, 222, 400, 422, 511
and 440 were observed. The d-spacings and the hkl values are given in Tables 4.2 and 4.3
respectively. The average value of lattice constant ‘ a ’ for all compositions was
calculated using the Nelson-Riley function [1];
22 cos
sin
cos
2
1F (4.1)
where θ is the Bragg angle. The precise value of lattice parameter was obtained from the
extrapolation of the line to F (θ) = 0 or θ = 90°. The concentration dependence of lattice
constant ‘ a ’ was determined from XRD data for x = 0.0-0.2 as given Table 4.1.
Page 123
Fig.4.1.X-ray diffraction patterns for Ni1-xTbxFe2O4 ferrites (x = 0.0, 0.02, 0.04, 0.06,
0.08).
2θ (degrees)
Inte
nsi
ty (
Arb
itra
ry U
nit
s)
Page 124
Fig. 4.2. X-ray diffraction patterns for Ni1-xTbxFe2O4 ferrites (x = 0.10, 0.12, 0.14,
0.16, 0.18, 0.20)
2θ (degrees)
Inte
nsi
ty (
Arb
itra
ry U
nit
s)
Page 125
The lattice constant gradually increases up to x = 0.08 and it decreases for higher
terbium concentration. A slight increase in the lattice parameter with the increase of Tb-
concentration (x) can be explained on the basis of relative ionic radii of Tb3+
and Ni2+
ions. Since the Tb3+
ion has a larger ionic radius (0.93Å) than that of the Ni2+
(0.69Å) ion,
a partial replacement of the Ni2+
by Tb3+
causes an expansion of the spinel lattice, thereby
increasing the lattice constant. Ni2+
ions prefer B-sites [2] and it is expected that most of
the replacement of Ni+2
ions may occur on the octahedral sites. A possible explanation for
decrease in ‘ a ’ for 0.1 ≤ x ≤ 0.2 is that some Ni atoms may also change their site
preferences to tetrahedral sites because of the influence of terbium.
The decrease in ‘ a ’ may also suggest the existence of a solubility limit for
terbium ions at x = 0.08 to 0.1. Once the solubility limit is reached, the terbium ions no
longer dissolve in the spinel lattice and diffuse to the grain boundaries combining with Fe
to form TbFeO3 and forming an ultra thin layer around grains [3]. A non-linear behavior
of ‘ a ’ with Tb-concentration in other rare earth substituted ferrite systems has also been
reported by other researchers [4]. A notable feature in the X-ray patterns is the intensity
of the diffraction peaks which is weaker for the terbium substituted ferrites than for the
nickel ferrite without terbium. This may also indicates the more diffuse distribution of the
different cations on the A- and B- sites within the spinel structure which increases with
the concentration of terbium ions. The average grain size was measured by Scherrer’s
formula [1]. These values of grain size are comparable with the values calculated from
XRD as shown in Table 4.1.
Page 126
Table 4.1 Phases, lattice constant, X-ray density, Bulk density and Grain size of the
Ni1-xTbxFe2O4 ferrites (0.0 ≤ x ≤ 0.2).
Serial
No.
Composition Secondary
phase
Lattice
constant (a)
(Å)
X-ray
density (Dx)
(g/cm3)
Bulk
density (Db)
(g/cm3)
Grain
size
(µm)
1 NiFe2O4 - 8.3234 5.4 5.1277 3.63
2 Ni.98Tb.02Fe2O4 - 8.3263 5.44 5.1845 3.41
3 Ni.96Tb.04Fe2O4 - 8.3274 5.48 5.2814 3.24
4 Ni.94Tb.06Fe2O4 - 8.3286 5.53 5.3428 3.05
5 Ni.92Tb.08Fe2O4 - 8.3295 5.57 5.3867 2.93
6 Ni.9Tb.1 Fe2O4 TbFeO3 8.3292 5.62 5.4387 2.58
7 Ni.88Tb.12Fe2O4 TbFeO3 8.3284 5.67 5.4876 2.35
8 Ni.86Tb.14Fe2O4 TbFeO3 8.3282 5.71 5.5278 2.09
9 Ni.84Tb.16Fe2O4 TbFeO3 8.3275 5.76 5.5789 1.96
10 Ni.82Tb.18Fe2O4 TbFeO3 8.3268 5.81 5.6334 1.42
11 Ni.8Tb.2 Fe2O4 TbFeO3 8.3259 5.86 5.6864 1.18
The actual densities (X-ray) of the samples under investigation were calculated
using the equation [5];
Page 127
3
8
Na
MDx (4.2)
where M is the molecular weight of the sample, ‘ a ’ is the lattice constant and N is
Avogadro’s number. X-ray density increases linearly as a function of terbium content as
it mainly depends upon the molecular weight of the compositions.
The bulk density increases from 5.13 g/cm3 to 5.69 g/cm
3 with the increase of
terbium concentration from x = 0 to x = 0.2 while the X-ray density also increases from
5.4 g/cm3 to 5.86 g/cm
3 as terbium is incorporated into NiFe2O4 ferrite with the highest
density value obtained for a terbium concentration at x = 0.2. This is due to the atomic
weight of Tb (158 amu) which is higher than that of Ni (28 amu) [6]. The bulk density
increases almost linearly as a function of terbium concentration. Thus, a decrease in
porosity can be expected with increase of terbium concentration (x). This is consistent
with previous work reported for Tb-substitution in Li-Zn ferrites [7].
Table 4.2 Miller indices (hkl) and interplaner spacing (d) for Ni1-xTbxFe2O4 ferrites
(0.0 ≤ x ≤ 0.1).
Page 128
T b-contents
Sr. No.
Miller Indices
hkl
x = 0 . 0
d (Å)
x = 0 . 0 2
d (Å)
x = 0 . 0 4
d (Å)
x =0.06
d (Å)
x = 0 . 0 8
d (Å)
x = 0 . 1
d (Å)
1 2 2 0 2.9219 2.8996 2.9200 2.9015 2.9304 2.904
2 3 1 1 2.4960 2.4802 2.4958 2.4816 2.5025 2.4832
3 2 2 2 2.3918 2.3757 2.3900 2.3765 2.3975 2.3789
4 4 0 0 2.0712 2.0607 2.0710 2.0620 2.0772 2.0634
5 4 2 2 1.6938 1.6874 1.6936 1.6879 1.6969 1.6893
6 5 1 1 1.5972 1.5920 1.5973 1.5926 1.5999 1.5931
7 4 4 0 1.4680 1.4638 1.4680 1.4643 1.4699 1.4648
Table 4.3 Miller indices (hkl) and interplaner spacing (d) for Ni1-xTbxFe2O4 ferrites
(0.12 ≤ x ≤ 0.2).
Page 129
Tb-contents Miller Indices x = 0 . 1 2 x = 0 . 1 4 x = 0 . 1 6 x = 0 . 1 8 x = 0 . 2
Sr. No.
hkl
d (Å)
d (Å)
d (Å)
d (Å)
d (Å)
1 2 2 0 2.9309 2.9229 2.9002 2.9193 2.9067
2 3 1 1 2.5020 2.4975 2.4800 2.4939 2.4859
3 2 2 2 2.3974 2.3918 2.3750 2.3888 2.3804
4 4 0 0 2.0774 2.0748 1.0610 2.0724 1.0661
5 4 2 2 1.6965 1.6941 1.6874 1.6940 1.6896
6 5 1 1 1.5996 1.5979 1.5921 1.5974 1.5940
7 4 4 0 1.4698 1.4685 1.4638 1.4681 1.4654
4.2 Fourier Transform Infrared Spectroscopy (FTIR)
Page 130
Figs. 4.3-4.8 show the FTIR spectra for Ni1-xTbxFe2O4 (x = 0.0- 0.2) ferrites
indicating the two absorption peaks in the wave number range 370-1500 cm-1
. The
position of bands obtained from FTIR spectra for Ni1-xTbxFe2O4 ferrites is given in Table
4.4. It has been reported [8] that the occurrence of ν1 (≈ 600 cm-1
) and ν2 (≈ 400 cm-1
)
bands are attributed to the intrinsic vibrations of tetrahedral and octahedral groups
respectively. These bands are mainly dependent on Fe-O distances and the nature of the
cations involved. In this study the band frequency ν2 slightly decreases with increasing
Tb concentration while ν1 remains almost constant. This decrease in ν2 may be attributed
to the terbium substitution for nickel on octahedral sites.
The absorption bands obtained in this study are found to be in the range reported
for nickel ferrites [9-10] but there is also a more diffuse region between them when
terbium is present compared with pure nickel ferrite (NiFe2O4). This diffuse region may
be attributed to the anomalous distributions of Iron and Nickel cations on the tetrahedral
and octahedral sites. A broadening of the spectral bands is observed for higher
concentrations of terbium. This broadening is due to the statistical distribution of Fe3+
on
A- and B-sites. The broadening of the spectral bands is a well known feature of inverse
spinel ferrites.
Page 131
x = 0.00
0
20
40
60
80
100
37057077097011701370
Wave number(cm-1)
Tra
nsm
itta
nce (
%)
Fig. 4.3. FTIR Spectrum for NiFe2O4 ferrite.
x = 0.04
0
20
40
60
80
100
37057077097011701370
Wave number (cm-1)
Tra
nsm
itta
nce (
%)
Fig. 4.4. FTIR Spectrum for Ni.96Tb0.04Fe2O4 ferrite.
Page 132
x = 0.08
0
20
40
60
80
100
37057077097011701370
Wave number (cm-1)
Tra
nsm
itta
nce (
%)
Fig. 4.5. FTIR Spectrum for Ni.92Tb.08Fe2O4 ferrite.
x = 0.12
0
20
40
60
80
100
37057077097011701370
Wave number (cm-1)
Tra
nsm
itta
nce (
%)
Fig. 4.6. FTIR Spectrum for Ni.88Tb0.12Fe2O4 ferrite.
Page 133
x = 0.16
0
20
40
60
80
100
37057077097011701370
Wave number (cm-1)
Tra
nsm
itta
nce (
%)
Fig. 4.7. FTIR Spectrum for Ni.84Tb0.16Fe2O4 ferrite.
x = 0.20
0
20
40
60
80
100
37057077097011701370
Wave number (cm-1)
Tra
nsm
itta
nce (
%)
Fig. 4.8. FTIR Spectrum for Ni0.8Tb0.2 Fe2O4 ferrite.
Page 134
Table 4.4 FTIR absorption bands for Ni 1-x Tb x Fe2O4 ferrite system.
Sr.No Composition ν1 (cm-1
) ν2 (cm-1
)
1 NiFe2O4 602 411
2 Ni.96Tb.04Fe2O4 602 409
3 Ni.92Tb.08Fe2O4 602 407
4 Ni.88Tb.12Fe2O4 602 405
5 Ni.84Tb.16Fe2O4 599 404
6 Ni.8Tb.2 Fe2O4 599 401
Page 135
4.3 Scanning Electron Microscopy (SEM)
A few representative electron microscope images of the Ni1-xTbxFe2O4 ferrites
were taken as shown in Figs. 4.9-4.12. The investigated micrographs show the
inhomogeneous grain size distribution. The micrograph images revealed that the samples
are well packed and are almost crack free. Few agglomerates in the compositions x =
0.00, x = 0.08 and x = 0.2 were found which could not be individually resolved by SEM
technique. The agglomerates may form during the course of sintering due to chemical
reaction and can retain their identity under quite aggressive forces.
These agglomerates are formed by the particles which are bonded together by
surface forces. The agglomerates are held together by relatively weak bonds of magnetic
or van der walls force [11]. The average grain size was measured from SEM micrographs
by the line-intercept method. It can be observed that the grain size decreases with
increasing terbium content. The grain size measured from SEM was in the range from 5
to 2 μm. This may be due to the substitution of terbium that impedes the grain growth
[12].
Page 136
Fig. 4.9. SEM micrographs of Ni 1-x Tb x Fe2O4 (x = 0.00) ferrite.
Fig. 4.10. SEM micrographs of Ni 1-x Tb x Fe2O4 (x = 0.08) ferrite.
Page 137
Fig. 4.11. SEM micrographs of Ni 1-x Tb x Fe2O4 (x = 0.14) ferrite.
Fig. 4.12. SEM micrographs of Ni 1-x Tb x Fe2O4 (x = 0.20) ferrite.
Page 138
4.4 Compositional Analysis
The compositional analysis of few representative samples of Ni1-xTbxFe2O4
system has been performed by EDX (Energy Dispersive X-ray). EDX analysis shows the
elemental percentage of each element which is expected to be present in the finally
sintered samples. The peaks in the EDX analysis represent the proportion of each element
in the compound. The change in the size of the peaks of nickel and terbium can be
observed from the graphs. As the concentration of terbium is increased, the graphs show
an increase in the height of the peak of terbium as expected. As the terbium is substituted
for nickel in this study, the amount of nickel decreases and this decrease in nickel is
observed in the peak height of Ni as shown in Figs. 4.13 to 4.16. The detail of
composition of various metals in the samples is listed in Table 4.5. The observed % age
of metals is consistent with the stoichiometricy of the prepared samples by ceramic
method.
Table 4.5
Nominal percentage of metal cations in Ni1-xTbxFe2O4 ferrites
Terbium
Concentration
Ni weight % Tb weight % Fe weight % Total
0.00 30.69 - 69.31 100
0.08 30.5 1.37 68.13 100
0.14 28.17 1.88 69.95 100
0.20 27.66 2.43 69.91 100
Page 139
Fig. 4.13. EDX of the NiFe2O4 ferrite.
Fig. 4.14. EDX of the Ni0.92Tb0.08Fe2O4 ferrite.
Page 140
Fig. 4.15. EDX of the Ni0.86Tb0.14Fe2O4 ferrite.
Fig. 4.16. EDX of the Ni0.80Tb0.20Fe2O4 ferrite.
Page 141
4.5 Static Magnetic Properties
4.5.1 Magnetization
The MH- loop of each sample was taken on a vibrating sample magnetometer
(VSM). The MH loops of Ni1-xTbxFe2O4 ferrites scanned up to 8000 (Oe) were recorded
at room temperature for all the samples as shown in Figs. 4.17-4.27. All the samples were
reasonably saturated at ~ 6000 (Oe). The narrow magnetic hysteresis loops of the samples
indicate that the samples are magnetically soft, with low coercivity. The shape and the
width of the hysteresis loops depend on factors such as chemical composition of the
material, porosity and crystallite size etc. The variation in saturation magnetization (Ms)
and coercivity (Hc) values with the substituent concentration of terbium are listed in
Table 4.6. The decrease in saturation magnetization has been observed with the
substitution of terbium (Tb). This decrease may be attributed to the weakening of AB-
interactions.
Since there are three types of exchange interactions [13] between the unpaired
electrons of two ions lying in A- and B- sites. The A-B interaction heavily predominates
over A-A and B-B interactions. The A-B interaction is negative that is it aligns all the
magnetic spins at A-sites in one direction and those at B-sites in the opposite direction.
The net magnetic moment of the whole lattice is therefore the difference between the
moments of the B and A sublattices. i.e M= |MB-MA|, where MA and MB are the
magnetic moments of the A and B sites respectively. It is an established fact that NiFe2O4
ferrite adopts the inverse spinel structure. In nickel ferrite, most of the Ni2+
ions occupy
octahedral sites (B-sites) and the Fe3+
ions are distributed on both octahedral and
tetrahedral sites (A-sites) [14-15].
Page 142
The magnetic moment of each composition depends on the magnetic moments of
the constituent ions involved. The magnetic moments of Fe3+
and Ni2+
are 5 μB and 2 μB
while terbium is paramagnetic. The substitution of Tb with Ni ions takes place on
octahedral sites due to larger ionic radius and the possibility of occupying tetrahedral
sites is very rare as concluded in our previous work [16]. Hence, it is expected that the
number of magnetic moments on the octahedral sites will decrease. Thus the magnetic
moment of B-sublattice decreases and consequently the magnetization also decreases.
Hence, net magnetization of the samples decreases. In the present samples the decrease of
magnetization with Tb contents are consistent with results reported in references [3, 12,
17]. The dependence of saturation magnetization Ms on the terbium concentration is
depicted in Fig. 4.28. A slight increase in saturation magnetization for x = 0.02 may be
due to the migration of few Fe3+
ions on the B-sites from A-sites.
4.5.2 Coercivity
The observed values of coercivity (Hc) for all the samples of Ni1-xTbxFe2O4
ferrites are listed in Table 4.6. Due to small values of coercivity these materials can be
used in the switching devices. The coercivity is observed to decrease as the concentration
of terbium (Tb) increases up to x = 0.14 after which the coercivity increases. The
coercivity varies linearly with porosity [18] for 0.00 ≤ x ≤ 0.14 but for higher Tb
concentration it deviates. The porosity affects the magnetization process because pores
work as the generator of the demagnetizing field. All the samples have low coercivity as
compared to the unsubstituted sample. This shows that all the samples maintain their soft
ferrite nature with the terbium substitution. For higher concentration x ≥ 0.16 the
Page 143
coercivity increases due to the unquenched orbital angular momentum of Tb3+
and
microstrains in the materials [19]. Since the grain size of the samples under investigation
decreases and hence the density of grain boundaries increases. At the grain boundaries,
the domain wall pinning takes place that also enhances the coercivity.
Table 4.6 The saturation magnetization (Ms) and Coercivity (Hc) of Ni1-xTbxFe2O4
(x = 0.0-0.2) ferrites.
S.No. Composition Ms(emu/gram) Hc(Oe)
1 NiFe2O4 34.05 40.00
2 Ni0.98Tb0.02Fe2O4 34.16 35.00
3 Ni0.96Tb0.04Fe2O4 32.70 30.00
4 Ni0.94Tb0.06Fe2O4 30.82 29.50
5 Ni0.92Tb0.08Fe2O4 30.72 29.00
6 Ni0.90Tb0.10Fe2O4 30.20 27.50
7 Ni0.88Tb0.12Fe2O4 30.76 24.00
8 Ni0.86Tb0.14Fe2O4 29.80 23.50
9 Ni0.84Tb0.16Fe2O4 32.88 25.00
10 Ni0.82Tb0.18Fe2O4 30.28 28.00
11 Ni0.80Tb0.20Fe2O4 27.26 35.00
Page 144
-40
-30
-20
-10
0
10
20
30
40
-8000 -6000 -4000 -2000 0 2000 4000 6000 8000
H (Oe)
M (
em
u/g
)
x = 0.0
Fig. 4.17. The MH-Loop for NiFe2O4 ferrite.
-40
-30
-20
-10
0
10
20
30
40
-8000 -6000 -4000 -2000 0 2000 4000 6000 8000
H (Oe)
M (
em
u/g
)
x = 0.02
Fig. 4.18. The MH-Loop for Ni.98Tb.02Fe2O4 ferrite.
Page 145
-40
-30
-20
-10
0
10
20
30
40
-8000 -6000 -4000 -2000 0 2000 4000 6000 8000
H (Oe)
M (
em
u/g
)
x = 0.04
Fig. 4.19. The MH-Loop for Ni.96Tb.04Fe2O4 ferrite.
-40
-30
-20
-10
0
10
20
30
40
-8000 -6000 -4000 -2000 0 2000 4000 6000 8000
H (Oe)
M (
em
u/g
)
x = 0.06
Fig. 4.20. The MH-Loop for Ni.94Tb.06Fe2O4 ferrite.
Page 146
-40
-30
-20
-10
0
10
20
30
40
-8000 -6000 -4000 -2000 0 2000 4000 6000 8000
H (Oe)
M (
em
u/g
)
x = 0.08
Fig. 4.21. The MH-Loop for Ni.92Tb.08Fe2O4 ferrite.
-40
-30
-20
-10
0
10
20
30
-8000 -6000 -4000 -2000 0 2000 4000 6000 8000
H (Oe)
M (
em
u/g
) x = 0.10
Fig. 4.22. The MH-Loop for Ni.9Tb.1 Fe2O4 ferrite.
Page 147
-40
-30
-20
-10
0
10
20
30
40
-8000 -6000 -4000 -2000 0 2000 4000 6000 8000
H (Oe)
M (
em
u/g
)
x = 0.12
Fig. 4.23. The MH-Loop for Ni.88Tb.12Fe2O4 ferrite.
-40
-30
-20
-10
0
10
20
30
40
-8000 -6000 -4000 -2000 0 2000 4000 6000 8000
H (Oe)
M (
em
u/g
)
x = 0.14
Fig. 4.24. The MH-Loop for Ni.86Tb.14Fe2O4 ferrite.
Page 148
-40
-30
-20
-10
0
10
20
30
40
-8000 -6000 -4000 -2000 0 2000 4000 6000 8000
H (Oe)
M (
em
u/g
)
x = 0.16
Fig. 4.25. The MH-Loop for Ni.84Tb.16Fe2O4 ferrite.
-40
-30
-20
-10
0
10
20
30
40
-8000 -6000 -4000 -2000 0 2000 4000 6000 8000
H (Oe)
M (
em
u/g
)
x = 0.18
Fig. 4.26. The MH-Loop for Ni.82Tb.18Fe2O4 ferrite.
Page 149
-40
-30
-20
-10
0
10
20
30
-8000 -6000 -4000 -2000 0 2000 4000 6000 8000
H (Oe)
M (
em
u/g
)
x = 0.20
Fig. 4.27. The MH-Loop for Ni.8Tb.2 Fe2O4 ferrite.
25
26
27
28
29
30
31
32
33
34
35
0 0.04 0.08 0.12 0.16 0.2
Tb Concentration (x)
Ms (
em
u/g
m)
Fig. 4.28. The variation of saturation magnetization with the concentration of terbium
of the Ni1-xTbxFe2O4 (x = 0.0-0.2) ferrites.
Page 150
4.6 Magnetodynamics of Ni-Tb-Fe-O System
Ferromagnetic resonance (FMR) profiles of all the Ni1-xTbxFe2O4 ferrites taken at
X-band (9.5 GHz) are shown in Figs. 4.29-4.39. All the samples under investigation
showed single resonance peak and all the profiles are more or less slightly asymmetric as
shown in Figs. 4.29-4.39. The FMR linewidths and FMR position obtained from the
spectra are listed in Table 4.7. The line broadening observed in the FMR profiles may be
due to the decrease in magnetization, defects, inhomogenities and reduction of number of
Ni2+
ions in the samples. The asymmetry may be attributed to the contribution of non-
uniform resonance modes apart from the main mode (uniform mode k = 0) of resonance
[20, 21]. As the samples are saturated in the resonance field hence, the moments of the
magnetic ions within each particle are assumed to be linearly oriented in main mode. The
values of linewidths (751-2841 Oe) obtained for these ferrites fall in the usual range for
polycrystalline materials as compared to monocrystals. The largest linewidth observed
for the composition Ni0.8Tb0.2 Fe2O4 may be attributed to the increased number of
inhomogenities in this composition.
The minimum relaxation time calculated from linewidth for these ferrites is ~10-10
s. The variation in FMR intensities of the profiles depends on the gyromagnetic ratio (γ)
and g-values of the different cations. The gyromagnetic ratio (γ) has different values for
nickel, ferric and terbium ions because of the differences in the spectroscopic splitting g-
factors. The g- values for Ni2+
lie in the range 2.15 to 2.35 and for Fe3+
g = 2. The g-
value for terbium ions is ~1.95 [22]. The above mentioned differences in the g- values of
the cations involved are responsible for the observed variations in the intensity of the
FMR peaks. As terbium is substituted for nickel and nickel resides on the octahedral sites
Page 151
and g-values for Ni and Fe have in fact the effective value for ferrimagnets that obey the
Tsuya-Wangsness [23] formula.
-0.8
-0.6
-0.4
-0.2
0
0.2
0.4
0.6
0 2000 4000 6000 8000
H (Oe)
de
riva
tive
of
the
FM
R a
bso
rptio
n
curv
e
x = 0.00
Fig. 4.29. FMR profile of NiFe2O4 ferrite.
-1
-0.8
-0.6
-0.4
-0.2
0
0.2
0.4
0.6
0.8
0 1000 2000 3000 4000 5000 6000 7000 8000
H (Oe)
derivativ
e o
f th
e F
MR
absorp
tion
curv
e
x = 0.02
Fig. 4.30. FMR profile of Ni.98Tb.02Fe2O4 ferrite.
Page 152
-0.8
-0.6
-0.4
-0.2
0
0.2
0.4
0.6
0 2000 4000 6000 8000 10000
H (Oe)
derivative o
f th
e F
MR
absorp
tion
curv
e
x = 0.04
Fig. 4.31. FMR profile of Ni.96Tb.04Fe2O4 ferrite.
-0.6
-0.5
-0.4
-0.3
-0.2
-0.1
0
0.1
0.2
0.3
0.4
0 2000 4000 6000 8000
H (Oe)
deri
vati
ve o
f th
e F
MR
ab
so
rpti
on
cu
rve
x = 0.06
Fig. 4.32. FMR profile of Ni.94Tb.06Fe2O4 ferrite.
Page 153
-1.5
-1
-0.5
0
0.5
1
1.5
0 1000 2000 3000 4000 5000 6000 7000 8000
H (Oe)
deri
vati
ve o
f th
e F
MR
ab
so
rpti
on
cu
rve
X = 0.08
Fig. 4.33. FMR profile of Ni.92Tb.08Fe2O4 ferrite.
-0.6
-0.5
-0.4
-0.3
-0.2
-0.1
0
0.1
0.2
0.3
0.4
0 1000 2000 3000 4000 5000 6000 7000 8000
H (Oe)
deri
vati
v o
f th
e F
MR
ab
so
rpti
on
cu
rve
x = 0.10
Fig. 4.34. FMR profile of Ni.9Tb.1 Fe2O4 ferrite.
Page 154
-0.6
-0.5
-0.4
-0.3
-0.2
-0.1
0
0.1
0.2
0.3
0.4
0.5
0 2000 4000 6000 8000
H (Oe)
deri
vati
ve o
f th
e F
MR
ab
so
rpti
on
cu
rve
X = 0.12
Fig. 4.35. FMR profile of Ni.88Tb.12Fe2O4 ferrite.
-0.6
-0.5
-0.4
-0.3
-0.2
-0.1
0
0.1
0.2
0.3
0.4
0 1000 2000 3000 4000 5000 6000 7000 8000
H (Oe)
deri
vati
ve o
f th
e F
MR
ab
so
rpti
on
cu
rve
X = 0.14
Fig. 4.36. FMR profile of Ni.86Tb.14Fe2O4 ferrite.
Page 155
-0.2
-0.15
-0.1
-0.05
0
0.05
0.1
0.15
0 1000 2000 3000 4000 5000 6000 7000 8000
H (Oe)
deri
vati
ve o
f th
e F
MR
ab
so
rpti
on
cu
rve
X = 0.16
Fig. 4.37. FMR profile of Ni.84Tb.16Fe2O4 ferrite.
-0.5
-0.4
-0.3
-0.2
-0.1
0
0.1
0.2
0.3
0 1000 2000 3000 4000 5000 6000 7000 8000
H (Oe)
deri
vati
ve o
f th
e F
MR
ab
so
rpti
on
cu
rve
X = 0.18
Fig. 4.38. FMR profile of Ni.82Tb.18Fe2O4 ferrite.
Page 156
-0.2
-0.15
-0.1
-0.05
0
0.05
0.1
0.15
0.2
0.25
0 2000 4000 6000 8000 10000
H (Oe)
deri
vati
ve o
f th
e F
MR
ab
so
rpti
on
cu
rve X = 0.20
Fig. 4.39. FMR profile of Ni.8Tb.2 Fe2O4 ferrite.
Table. 4.7 FMR parameters of Ni1-xTbxFe2O4 ferrites measured at X-band (9.5 GHz)
Serial
No.
Composition FMR linewidth ΔHFWHM
(Oe)
FMR Position
(Oe)
1 NiFe2O4 1180 4491
2 Ni.98Tb.02Fe2O4 827 4497
3 Ni.96Tb.04Fe2O4 898 4324
4 Ni.94Tb.06Fe2O4 593 4556
5 Ni.92Tb.08Fe2O4 818 4979
6 Ni.9Tb.1 Fe2O4 751 4416
7 Ni.88Tb.12Fe2O4 925 4337
8 Ni.86Tb.14Fe2O4 992 4385
9 Ni.84Tb.16Fe2O4 949 4352
10 Ni.82Tb.18Fe2O4 1145 4381
11 Ni.8Tb.2 Fe2O4 2841 4559
Page 157
4.7 Relative Initial Permeability
The relative initial permeability, μi΄, of Ni 1-x Tb x Fe2O4, ferrites has been
measured in the frequency range 1 KHz to 10 MHz and is depicted in Figs. 4.40 and 4.41
respectively. From the figures, it is observed that with the increase of terbium contents
relative initial permeability (μi΄) decreases with increase in frequency. It is known that
[24] the magnetization process of polycrystalline ferrites can be investigated as
superposition of domain wall motion and spin rotation. It was reported that [25] the
permeability was found to be almost proportional to the grain size when grain size lies in
the range 1-10 μm and the domain walls are assumed to be dominant. The permeability in
this range can be interpreted by the displacement of domain walls [26-27]. The domain
wall-motion is affected by both the composition and microstructures [24].
Normally, the walls remain pinned at the grain boundary and deviate when
subject to the small magnetic field [28]. The domain walls will gradually disappear if the
grain size is close to critical value i.e 0.2 μm. It is noticed that if grain size is less than 0.2
μm then spin rotation is dominant. A linear relationship between the grain size and
frequency dependent μi΄ has been observed in references [26, 29] and deviations from the
linearity have also been reported [30]. The Globus model [31] can be used to explain
magnetization process in the present study.
1
2 / KDM Si (4.3)
Ms is the saturation magnetization, D is the average grain size and K1 is anisotropy
constant. The relative initial permeability has linear relation to 2
SM and D while K1 is not
playing a significant role.
Page 158
The saturation magnetization values are decreased with the substitution of terbium
ions. A remarkable decrease in the magnitude of relative initial permeability is observed
with the increasing concentration of terbium at low frequencies and it drops to a very low
value in high frequency region. The observed variations in the relative initial
permeability can also be explained by the following considerations. In the ferromagnetic
materials it depends on factors like reversible displacement of domain wall, bulging of
domain-walls. All the samples show a similar decreasing trend of μ΄ except for x = 0.20
in the present investigations. It shows a very small peak in MHz region and this may be
attributed to the abnormal behaviour of domain wall displacements [32]. The
substitutions of terbium ions decrease the value of Ms due to weakening of the A-B
interaction, hence the μ΄ is a complex phenomenon of magnetization, anisotropy constant
and microstructure.
0
500
1000
1500
2000
1000 10000 100000 1000000 10000000
Frequency (Hz)
Rel.
in
itia
l p
erm
eab
ilit
y,
μ΄i
x = 0.00
x = 0.02
x = 0.04
x = 0.06
x = 0.08
x = 0.10
Fig. 4.40. Relative initial permeability as a function of frequency for Ni 1-x Tb x Fe2O4,
(0.0 ≤ x ≤ 0.10) ferrites.
Page 159
0
500
1000
1500
2000
1000 10000 100000 1000000 10000000
Frequency (Hz)
Rel.
in
itia
l p
erm
eab
ilit
y,
μ΄i
x = o.12
x = 0.14
x = 0.16
x =0.18
x = 0.20
Fig. 4.41. Relative initial permeability as a function of frequency for Ni 1-x Tb x Fe2O4,
(0.12 ≤ x ≤ 0.2) ferrites.
4.7.1 Frequency Dependent Loss Factor
The magnetic loss factor measured at room temperature for the given frequency
range for Ni 1-x Tb x Fe2O4, (0.0 ≤ x ≤ 0.2) ferrites is shown in Figs. 4.42-4.43. The loss
factors are found initially to decrease with increase in frequency for all the compositions.
The magnetic loss factor indicates a peak around 6000 Hz and it shifts towards the high
frequency region as the concentration of terbium is increased for 0.00≤ x ≤0.10. A
maximum loss peak is observed in the un-substituted sample as shown in Fig. 4.42.
Minimum values of the loss factor are attained in the range 50 KHz-10MHz. The samples
for the concentration of terbium x = 0.14- 0.18 exhibit two peaks in the loss factor. The
composition Ni 0.88 Tb 0.12 Fe2O4 shows no rise in the loss factor and it decreases gradually
to a minimum value. The values of magnetic loss factor are known to depend on different
parameters such as stoichiometry, Fe2+
contents, sintering temperature and composition
[33]. Main contribution to the magnetic losses in ferri magnetic materials is due to
Page 160
hysteresis losses, which is associated with irreversible wall displacement and spin
rotations. However, the hysteresis losses are less important in the high frequency range
because the domain wall displacement is mainly damped and the hysteresis losses will be
due to spin rotation [34].
0
0.5
1
1.5
2
2.5
3
3.5
4
4.5
5
1000 10000 100000 1000000
Frequency (Hz)
Lo
ss f
acto
r
x = 0.00
x = 0.02
x = 0.04
x = 0.06
x = 0.08
x = 0.10
Fig. 4.42. Loss factor as a function of frequency for Ni 1-x Tb x Fe2O4,
(0.0 ≤ x ≤ 0.10) ferrites.
Page 161
0
2
4
6
8
10
12
14
16
1000 10000 100000 1000000
Frequency (Hz)
Lo
ss f
acto
r
x = 0.12
x = 0.14
x = 0.16
x = 0.18
x = 0.20
Fig. 4.43. Loss factor as a function of frequency for Ni 1-x Tb x Fe2O4,
(0.12 ≤ x ≤ 0.20) ferrites.
4.8 DC Electrical Resistivity
Room temperature dc resistivity of Ni1-xTbxFe2O4 ferrites was measured by two
probe method. The variation of room temperature dc resistivity for the present samples as
a function of terbium (Tb) concentration is shown in Fig. 4.44. It has been noticed that
the resistivity increases linearly from 1.7 x 10⁵
Ω-cm to 3.9 x10⁵
Ω-cm as the
concentration of terbium (Tb) increases from 0.0 to 0.2 in steps of 0.02. This increase in
resistivity may be due to the fact that terbium has greater value of resistivity (111μΩ-cm)
as compared to that of Ni (7μΩ-cm) [35]. The increase in resistivity can be attributed to
the larger ionic radius of Tb3+
(0.93Å) as compared to the Ni2+
(0.69Å) which could
causes strain in the spinel lattice and impede the conduction process in the these ferrites.
Previous reported results also show an increase in resistivity Vs Tb concentration in Li-
Zn and NiZn ferrites [36, 37]. The increase in resistivity may also be related to 4f-3d
coupling between transition metal nickel and rare earth terbium ions.
Page 162
0.E+00
1.E+05
2.E+05
3.E+05
4.E+05
5.E+05
0 0.04 0.08 0.12 0.16 0.2
Tb concentration (x)
Resis
tivit
y (
Ω-c
m)
Fig. 4.44. Plot of lo Room temperature resistivity (ρ) vs terbium concentration
for Ni1-xTbxFe2O4 ferrites.
4.8.1 Temperature Dependent Electrical Resistivity
Temperature dependent electrical resistivity measurements were also carried out
as a function of temperature in the temperature range 30-200ºC. The temperature
dependence of dc electrical resistivity of the Ni1-xTbxFe2O4 system is shown in Figs.4.45-
4.46. It is observed that as the temperature increases the resistivity decreases following
the Arrhenius equation [22];
ρ = ρ0 exp (Ea/kBT) (4.4)
where ρ0 is a constant, Ea is the activation energy and kB is Boltzmann’s constant and T is
the absolute temperature. The resistivity decreases as temperature increases that indicates
the semiconducting behavior of these samples. Such kind of behaviour of resistivity has
Page 163
4
4.4
4.8
5.2
2 2.2 2.4 2.6 2.8 3 3.2 3.4
1000/T (K-1)
Lo
g ρ
, (Ω
cm
)
x = 0.00
x = 0.02
x = 0.04
x = 0.06
x = 0.08
x = 0.10
Fig. 4.45. Plot of logρ vs 1000/T for Ni1-xTbxFe2O4 (x = 0.0-0.1) ferrites.
4
4.4
4.8
5.2
5.6
6
2 2.5 3 3.5
1000/T (K-1)
Lo
g ρ
, (Ω
cm
)
x = 0.12
x = 0.14
x = 0.16
x = 0.18
x = 0.20
Fig. 4.46. Plot of logρ vs 1000/T for Ni1-xTbxFe2O4 (x = 0.12-0.20) ferrites.
Page 164
been reported by many researchers [38-39]. The drift mobility is calculated from the
electrical resistivity data by using the following equation [40-41];
ned
1 (4.5)
where e is the charge of electron, ρ is the electrical resistivity and n is the concentration
of charge carriers and can be calculated from the following relation;
M
CNn bFeA (4.6)
where NA is the Avogadro’s number, CFe is the number of iron atoms in the chemical
formula of the samples, ρb the bulk density and M is the molar mass of the samples.
The variation of drift mobility with temperature is shown in Figs.4.47-4.48. As
the temperature increases the drift mobility is observed to increase. It is due to the reason
that the charge carriers start hopping amongst the sites with the increase of temperature.
The drift mobility at room temperature decreases from 1.4 x 10⁻⁹
to 5.97 x 10⁻¹⁰
cm2V
-1S
-1
by increasing the terbium concentration from 0.00 to 0.2 in steps of 0.02. The conduction
mechanism can be proposed as the ions of the same parent atom but in different valence
states are to be found in crystallographically similar positions in the lattice. Thus the
extra electron on a ferrous ion requires little energy to move on similarly situated
adjacent ferric ion. Hence the valence states of the two ions are interchanged. Under the
influence of an electric field, these extra electrons can be considered to constitute the
current from one iron ion to the next. The conduction mechanism [9] in nickel ferrites is
due to both n-and p-type charge carriers. The n-type charge carriers are due to electron
hopping of iron ions and p-type carriers are due to hole hopping between the nickel ions
at the octahedral sites.
Page 165
0.E+00
1.E-09
2.E-09
3.E-09
4.E-09
5.E-09
6.E-09
7.E-09
8.E-09
9.E-09
1.E-08
300 320 340 360 380 400 420 440 460 480 500
T (K)
μd (
cm
2.v
-1.S
-1)
x = 0.00
x = 0.02
x = 0.04
x = 0.06
x = 0.08
x = 0.10
Fig. 4.47. The plot of drift mobility (μd) with temperature for Ni1-xTbxFe2O4
(x = 0.0-0.1) ferrites.
0.E+00
2.E-09
4.E-09
6.E-09
8.E-09
1.E-08
1.E-08
300 320 340 360 380 400 420 440 460 480 500
T (K)
μd(c
m2.v
-1.S
-1)
x = 0.12
x = 0.14
x = 0.16
x = 0.18
x = 0.20
Fig. 4.48. The plot of drift mobility (μd) with temperature for Ni1-xTbxFe2O4
(x = 0.12-0.20) ferrites.
Page 166
Hence the following conduction mechanism in these ferrites can be possible,
Fe2+
↔ Fe3+
+ e-
(4.7)
Ni3+
+ e- ↔ Ni
2+ (4.8)
Combining these two relations;
Fe3+
+ Ni2+
↔ Fe
2+ + Ni
3+ (4.9)
When terbium is substituted for Ni ions it is expected to occupy on the octahedral sites
because nickel ferrite is an inverse spinel [42] in which nickel ions occupy on the
octahedral sites. The number of Ni2+
and Ni3+
ions on the octahedral sites will decrease.
The resistivity of the samples depends on the hopping probability of both type of charge
carriers. Hence the incorporation of terbium ions at the cost of nickel ions causes the
increase in resistivity. The presence of terbium ions on the octahedral sites and on the
grain boundaries (second phase) obstructs the degree of easy conduction between the
nickel and iron ions on the octahedral sites, thereby increasing the resistivity of the
samples under investigation. The increase in resistivity has been reported [43] when
gadolinium was substituted in nickel ferrites.
Page 167
0.1
0.14
0.18
0.22
0 0.04 0.08 0.12 0.16 0.2Tb concentration (x)
Acti
vati
on
en
erg
y
(eV
)
Fig. 4.49. Plot of activation energy vs terbium concentration
for Ni1-xTbxFe2O4 ferrites.
The activation energy of the samples under investigation has been derived from
the slope of temperature dependent resisitivity plots. It has been noticed that the
activation energy varies with the terbium concentration in a similar manner to that of the
room temperature resistivity vs Tb concentration (x). It shows that the samples which
have high resistivity have high activation energy and vice versa. The activation enegy
values for the present system ranges from 0.14 to 0.20 eV and are in accordance with
Verwey hopping conduction mechanism. The dependence of activation energy for
various Tb concentrations is shown in Fig. 4.49.
Page 168
4.9 Dielectric Properties
The dielectric properties of ferrites are dependent upon several factors, including
chemical composition, the method of preparation and grain size. This may be explained
by the fact that electronic exchange between Fe2+
and Fe3+
ions cannot follow the
frequency of externally applied alternating field beyond a critical frequency. The
frequency and composition dependent dielectric constant, ε', for Ni-Tb ferrites was
measured in the frequency range from10 Hz to 10MHz. The variation of dielectric
constant (ε') with frequency at room temperature for all the samples under investigation
has been shown in Figs.4.50 & 4.51. The figures revealed that the dielectric constant
decreases continuously with increase in frequency for all the samples and at a very high
frequency; the dielectric constant is almost frequency independent. This indicates that the
dispersion is due to Maxwell– Wagner type interfacial polarization which is in good
agreement with Koop’s phenomenological theory. According to these models, the
dielectric structure consists of two layers. The first layer, which is composed of ferrite
grains, is well conducting material and it is separated by a thin layer of poorly conducting
material called grain boundaries [44-46].
The frequency independent phenomenon occurs for the reason that electric
dipoles are unable to follow the fast variation of the alternating applied electric field at
very high frequencies. Also the polarization of ferrites in the high frequency region
occurs owing to electric and ionic polarization and both of these exhibit a frequency
independent behaviour [47].
Page 169
0.E+00
5.E+03
1.E+04
2.E+04
2.E+04
3.E+04
3.E+04
4.E+04
4.E+04
5.E+04
5.E+04
00010 00100 01000 10000 100000 1000000 10000000
Frequency (Hz)
Die
lectr
ic c
on
sta
nt
(ε')
x = 0.0
x = 0.02
x = 0.04
x = 0.06
x = 0.08
x = 0.10
Fig. 4.50. Dielectric constant (ε') vs frequency of Ni1-xTbxFe2O4 (x = 0.0- 0.10) at room
temperature.
0.00E+00
5.00E+03
1.00E+04
1.50E+04
2.00E+04
2.50E+04
10 100 1000 10000 100000 1000000 10000000
Frequency (Hz)
Die
lectr
ic c
on
sta
nt
(ε')
x = 0.12
x = 0.14
x = 0.16
x = 0.18
x = 0.20
Fig. 4.51. Dielectric constant (ε') vs frequency of Ni1-xTbxFe2O4 (x = 0.12- 0.20) at room
temperature.
Page 170
It has been found that the dielectric constant decreases with the substitution of
terbium. The decrease in the values of dielectric constant with composition may be
attributed to the decrease in internal viscosity of the system which provides more degrees
of freedom to the dipoles of the system contributing polarization. Thus disordering
increase in the system and hence the dielectric constant decrease. The hoping of electrons
from Fe3+
to Fe2+
ions and hole hopping between Ni 3+
and Ni2+
ions at B-sites are
responsible for the polarization. The hopping between A- sites is rare as there are only
Fe3+
ions present on A-sites and Fe2+
ions which are formed in the course of processing
occupy only B-sites [48, 49]. As a result of the substitution of terbium for the Ni ions, the
Ni as well as Fe ions on B-sites may decrease (Fe3+
+ Ni2+
↔ Fe
2+ + Ni
3+). Therefore the
dielectric polarization in the externally applied field decreases while in the opposite
direction increases. This explains the reason of the decrease of the dielectric constant for
the terbium substitution.
It has been noticed that there is no dispersion in the dielectric constant (ε') of all
the samples in the studied range. All samples show high dielectric constant of the order of
103-10
4 at very low frequencies. The higher values of dielectric constant in the lower
frequency region are explained on the basis of space charge polarization. This type of
polarization is attributed to the heterogeneity of the samples and to the fact that
ferroelectric regions are surrounded by non-ferroelectric regions similar to the case of
relaxor ferroelectric materials [50].
Figs. 4.52 & 4.53 show the variation of dielectric loss (tanδ) with frequency at
room temperature for Ni1-xTbxFe2O4 (x = 0.0- 0.20 in steps of 0.02) ferrites. The relations
of tanδ with frequency in the MHz range show a relaxation spectrum with a loss peak. It
Page 171
has been reported [51] that the occurrence of loss peak in the tanδ versus frequency curve
may be attributed to the strong correlation between the hopping conduction mechanism
and dielectric behavior of ferrites (i.e the cation-cation correlation at the octahedral site).
The appearance of loss peak in tanδ is known as abnormal dielectric loss behaviour and it
has been observed for all the samples which could be related to the resonance effect.
0.2
0.3
0.4
0.5
0.6
0.7
0.8
0.9
1
1.1
10 100 1000 10000 100000 1000000 10000000
Frequency (Hz)
Die
lectr
ic l
oss (
tan
δ)
x = 0.0
x =0.02
x = 0.04
x = 0.06
x = 0.08
x =0.10
Fig. 4.52. Dielectric loss (tanδ) vs frequency of Ni1-xTbxFe2O4 (x = 0.0- 0.10) at room
temperature.
Page 172
0.1
0.2
0.3
0.4
0.5
0.6
0.7
0.8
0.9
1
1.1
10 100 1000 10000 100000 1000000 10000000
Frequency (Hz)
Die
lectr
ic l
oss (
tan
δ)
x =0.12
x = 0.14
x = 0.16
x = 0.18
x = 0.20
Fig. 4.53. Dielectric loss (tanδ) vs frequency of Ni1-xTbxFe2O4 (x = 0.12- 0.20) at room
temperature.
The dielectric loss in ferrites is the result of lag of polarization ions with respect
to the applied alternating electric field. This abnormal behaviour may also be attributed to
the presence of both types of charge carriers [47]. In Ni ferrites the conduction
mechanism is p-type due to the hole exchange between Ni3+
and Ni2+
. The electrons
initiated from the hopping process between Fe2+
↔ Fe3+
+ e‾ capture some of Ni3+
ions
and it results in the formation of Ni2+
ions. With the substitution of terbium (Tb), in place
of Ni, the loss peaks become broader. It is worth noticing that the dielectric loss increases
with the increase of Tb contents up to x = 0.10 and for further substitution of Tb, the
dielectric loss has been observed to decrease. The increase in the dielectric loss could be
attributed to the cluster formation and this act as the trapping centers for different depths.
The composition x = 0.14 exhibit the minimum value of loss peak of all the samples
under investigation. The sample x = 0.2 exhibit a most broad peak as compared to all
Page 173
other samples. Similar kinds of abnormal dielectric loss behaviour have been reported for
Mn-Zn, Ni-Mg, and Ni-Zn ferrites [47, 10, 52]. It has been observed that the values of the
dielectric loss are less than 1 even in the MHz frequency range and these values are
significantly lower compared to the ferrites synthesized by conventional method [48, 53].
The Figs. 4.54 and 4.55 show the variation of ac conductivity with frequency for
Ni1-xTbxFe2O4 ferrites at room temperature. The total ac conductivity of ferrites is given
by the following relation:
σ tot = σ 1 (T) +σ 2 (ω, T) (4.10)
The first term σ 1 indicates the DC conductivity which is frequency independent function.
The second term is the frequency dependent and it purely exhibit ac conductivity due to
electron hopping amongst the sites.
In all the samples it has been observed that the ac conductivity gradually increases
as the frequency of the applied external field increases. Since an increase in frequency
promotes the electron hopping frequency of the charge carriers, hence the conductivity
increases. The electron hopping and liberated charge together provide the basis for the
conduction mechanism in ferrites. The ac conductivity generally decreases by the Tb-
substitution. This may be due to the inclusion of Tb- ions in the spinel lattice which
affects the conduction mechanism. The sample x = 0.04 exhibit high conductivity in the
high frequency region as compared to the neighbouring compositions and it anomaly in
this behaviour. A decrease in the as conductivity of all the samples is noted beyond
8MHz and can be attributed to the occurrence of loss peaks appeared in the dielectric
loss.
Page 174
0
0.002
0.004
0.006
0.008
0.01
0.012
0.014
0.016
0.018
0.E+00 2.E+06 4.E+06 6.E+06 8.E+06 1.E+07
Frequency (Hz)
σac (
oh
m-1
cm
-1)
x = 0.00
x = 0.02
x = 0.04
x = 0.06
x = 0.08
x = 0.10
Fig. 4.54. The variation of ac conductivity with frequency for Ni1-xTbxFe2O4
(x = 0.0- 0.10) ferrites.
0
0.004
0.008
0.012
0.016
0.02
0.E+00 2.E+06 4.E+06 6.E+06 8.E+06 1.E+07
Frequency (Hz)
σac (
oh
m-1
cm
-1)
x = 0.12
x = 0.14
x = 0.16
x = 0.18
x = 0.20
Fig. 4.55. The variation of ac conductivity with frequency for Ni1-xTbxFe2O4
(x = 0.12- 0.20) ferrites.
Page 175
Mg1-xTbxFe2O4 Series
4.10 Structural Analysis
X-ray diffractograms of Mg 1-xTbxFe2O4 (0.0 ≤ x ≤ 0.2) ferrites sintered at 1230
oC
are shown in Figs. 4.56 and 4.57 respectively. The diffraction patterns were indexed on
the basis of fcc lattice and the phases precipitated out are listed in Table 4.8. Analysis of
XRD patterns revealed that all the samples with 0≤ x ≤ 0.04 have a single phase cubic
spinel structure. A small peak of second phase appeared at 2θ = 33.24° for x = 0.06 and
becomes more conspicuous for x > 0.06 as indicated in Figs. 4.56 and 457. The second
phase was not detected at x = 0.08 due to weak intensity of X-rays at the particular angle.
This peak was identified as the (1 1 2) reflection of the TbFeO3 (ortho ferrite) phase
(ICDD PDF # 47-0068). The formation of second phase has also been reported when rare
earth metal cations are substituted in Mn-Zn and bismuth ferrites [54, 55].
The diffraction peaks of spinel structure corresponding to the planes (220), (311),
(400), (422), (511 / 333) and (440) were observed. All the mentioned peaks of the fcc
lattice in the patterns matched well with the characteristic reflections of Mg-ferrite
reported earlier [56, 57]. The d-spacing and the hkls values are listed in Tables 4.9 and
4.10. The variation of lattice constants ‘ a ’ with Tb-concentration (x) for 0.0 ≤ x ≤ 0.2 are
listed in Table 4.8. The lattice constant increases up to x = 0.04 and then decreases. The
small increase in the lattice parameter with the increase of terbium contents (x) can be
explained on the basis of the differences of the ionic radii of Tb3+
and Mg2+
ions.
Since Tb3+
ion has larger ionic radius (0.93Å) as compared to Mg2+
(0.66Å), the
partial replacement of Mg2+
by Tb3+
leads to the expansion of the spinel lattice; thereby
increasing the lattice constant. It is therefore suggested that most of the replacement of
Page 176
Mg2+
ions by Tb3+
ions takes place on the octahedral sites. A similar behavior was
observed when rare earth gadolinium (Gd) was substituted in Ni-ferrites [43].
Fig. 4.56. X-ray diffraction patterns for Mg1-xTbxFe2O4 ferrites
(x = 0.0, 0.02, 0.04, 0.06, 0.08).
Page 177
A slight decrease in the lattice constant ‘ a ’ for x > 0.04 may be attributed to the
migration of Mg2+
ions to tetrahedral sites due to the presence of terbium ions on the
octahedral sites. This decrease also suggest the solubility limit for the terbium ions at x =
0.04. When the solubility limit is achieved no further terbium is dissolved in the spinel
lattice and terbium ions accumulate to the grain boundaries combining with Fe to produce
TbFeO3 and form thin insulating layer around the grains. The appearance of secondary
phase on the grain boundaries may suppress the grain growth by limiting the grain
boundary mobility [36].
A non- linear behaviour (positive curvature) of ‘ a ’ Vs Tb contents has been
observed as shown Fig. 58. Similar non-linear change of lattice constant ‘ a ’ with
concentration in spinel ferrites have been reported [58, 4, 59] by many researchers. It is
expected that the Tb3+
ions may reside on B-sites as Tb3+
ions have larger ionic radius
(0.93Å) as compare to that of Fe3+
(0.64Å) ions. The probability that terbium ions occupy
the tetrahedral sites (A- sites) may be very remote. This is due to the fact that the
tetrahedral sites are too small to be occupied by the large terbium ions. The internal
stresses may also occur on B-sites where terbium ions occupy these sites due to their
larger ionic radii. This result is in agreement with those already reported results by other
researchers [60].
Page 178
Fig. 4.57. X-ray diffraction patterns for Mg1-xTbxFe2O4 ferrites
(x = 0.10, 0.12, 0.14, 0.16, 0.18, 0.20)
It has been reported that the site preference of Mg2+
ions in Mg-ferrite can be
inferred from the intensities of the (220) and (440) planes [10]. A remarkable feature in
the x-ray patterns of the samples under investigation are the relative intensities of the
(220) and (440) planes. The relative intensities of these two planes are observed to
increase with the increasing concentration of terbium compared to unsubstituted sample
(MgFe2O4). Since MgFe2O4 ferrite is reported to be partially inverse [61] in which most
of the Mg2+
ions occupy on B-sites i.e it is a mixed ferrite. The relative intensity of (220)
plane increases and it indicates that a fraction of Mg2+
ions migrate towards the A-sites
Page 179
when terbium is substituted in these ferrites. On the other hand increase in the relative
intensity of (440) plane exhibits that the Mg2+
ions occupying on B-sites are substituted
by the terbium ions. Hence Tb-substituted Mg-ferrites are predicted to be intermediate
ferrites.
8.36
8.361
8.362
8.363
8.364
8.365
8.366
8.367
8.368
0 0.02 0.04 0.06 0.08 0.1 0.12 0.14 0.16 0.18 0.2
Tb concentration (x)
a
(Ǻ
)
Fig. 4.58. Lattice parameter a (Å) vs. Tb concentration for Mg1−xTbxFe2O4 ferrites
(0≤x≤0.2).
Page 180
Table 4.8
Phase, Lattice constant, X-ray density, Bulk Density, and Grain size for Mg1-xTbxFe2O4
ferrites (0.0 ≤ x ≤ 0.2).
Sr.
No.
Composition Secondary
phase
Lattice
constant(Å)
X-ray
density(Dx)
(g/cm3)
Bulk
density(Db)
(g/cm3)
Grain
size
(µm)
1 MgFe2O4 - 8.361 4.55 3.5539 3.46
2 Mg.98Tb.02Fe2O4 - 8.3657 4.6 3.7155 3.27
3 Mg.96Tb.04Fe2O4 - 8.3669 4.66 3.8999 3.18
4 Mg.94Tb.06Fe2O4 TbFeO3 8.3664 4.72 3.9296 3.12
5 Mg.92Tb.08Fe2O4 - 8.3662 4.78 4.1257 3.05
6 Mg.9Tb.1 Fe2O4 TbFeO3 8.366 4.84 4.2909 2.87
7 Mg.88Tb.12Fe2O4 TbFeO3 8.3653 4.91 4.3133 2.79
8 Mg.86Tb.14Fe2O4 TbFeO3 8.3637 4.97 4.4676 2.81
9 Mg.84Tb.16Fe2O4 TbFeO3 8.3641 5.03 4.4845 2.62
10 Mg.82Tb.18Fe2O4 TbFeO3 8.3634 5.09 4.5605 2.37
11 Mg.8Tb.2 Fe2O4 TbFeO3 8.3605 5.16 4.6063 2.03
Page 181
Table 4.9
Miller indices (hkls) and interplaner spacing (d) for Mg 1-xTbxFe2O4 ferrite (0.0 ≤ x ≤0.1)
Sr.
No.
hkl X = 0 . 0
d (Å)
X = 0 . 0 2
d (Å)
X = 0 . 0 4
d (Å)
X = 0 . 0 6
d (Å)
X = 0 . 0 8
d (Å)
X = 0 . 1
d (Å)
1 220 2.9419 2.9418 2.9415 2.942 2.9393 2.9352
2 311 2.5124 2.5124 2.5104 2.5112 2.5091 2.5069
3 400 2.085 2.0839 2.0844 2.0851 2.0837 2.0802
4 422 1.7026 1.7037 1.7023 1.7025 1.7023 1.7021
5 511 1.6061 1.6062 1.6063 1.6067 1.606 1.6048
6 440 1.4759 1.476 1.4761 1.4763 1.4757 1.4748
Page 182
Table 4.10
Miller indices (hkls) and interplaner spacing (d) for Mg 1-xTbxFe2O4 ferrite (0.12 ≤ x ≤
0.2)
Sr.
No.
hkl X = 0 . 1 2
d (Å)
X = 0 . 1 4
d (Å)
X = 0 . 1 6
d (Å)
X = 0 . 1 8
d (Å)
X = 0 . 2
d (Å)
1 220 2.9374 2.9388 2.9426 2.9354 2.938
2 311 2.5078 2.5093 2.5117 2.5057 2.5089
3 400 2.0825 2.0824 2.0837 2.0805 2.0814
4 422 1.7025 1.7022 1.7038 1.7017 1.7013
5 511 1.6052 1.6057 1.6065 1.6045 1.6052
6 440 1.4751 1.4753 1.476 1.4744 1.475
The bulk density of these ferrites was observed to increase with the increase of
terbium concentration (x). The values of bulk density are listed in Table 4.8. The increase
in bulk density may be attributed to the higher atomic weights of Tb (158.92 amu) and its
higher specific gravity (8.23g/cm3) compared to the atomic weights of Mg (24.3 amu)
and the specific gravity of Mg (1.74g/cm3) atoms. The values of x-ray densities are larger
in magnitude as compared to bulk densities as listed in Table 4.8 and the difference in the
magnitude of these densities may be attributed to the existence of pores [62]. The
variations of both the densities with Tb concentration are depicted in Fig. 4.59.
Page 183
It is observed that both the densities increase linearly with Tb concentration. The
substitution of terbium ions in magnesium ferrite causes an appreciable decrease in
porosity ~ 21 % to 10 %. This decrease in porosity may be related to the relative ratio of
densities of the samples. Hence densified and sintered samples have been obtained.
Fig. 4.59. X-ray density (Dx) and bulk density (Db) vs. Tb concentration for
Mg1−xTbxFe2O4 ferrites (0≤x≤0.2).
Page 184
4.11 Fourier Transform Infrared Spectroscopy (FTIR)
Figures 4.60-4.65 show the room temperature FTIR spectra for Mg1-xTbxFe2O4
ferrites. It can be seen from the figures that FTIR spectra of the terbium (Tb) substituted
magnesium (Mg) ferrites are found to exhibit two absorption bands in the wave number
range 370-1500 cm-1
.The high frequency band ν 1 around around 600 cm-1
and the low
frequency band ν 2 around 400 cm-1
have been observed. These bands are the
characteristic features of the spinel ferrites as reported earlier [63-65]. It has been
reported that the occurrence of ν 1 and ν 2 bands are attributed to the intrinsic vibrations of
the tetrahedral and octahedral group complexes [65] respectively. In the present study,
the tetrahedral (ν 1) and octahedral (ν 2) bands occur in the range 571-567 cm-1
and 429-
418 cm-1
respectively. The difference in the band position is expected because of the
difference in Fe3+
-O2-
distance for the octahedral and tetrahedral compounds.
The band positions for the investigated Mg1-xTbxFe2O4 ferrites are given in Table
4.11. The range of absorption bands obtained in the present study is consistent with the
reported literature [66, 67]. It is noticed from the spectra that ν 2 band is shifted towards
lower frequencies with an increasing Tb concentration. It is reported that [61] in Mg-
ferrite most of the Mg2+
ions are located on the B-sites and small fraction on A-sites.
Thus the replacement of Mg2+
with Tb3+
ions (having larger ionic radius and higher
atomic weight than Mg2+
and Fe3+
) at octahedral sites in the ferrite lattice affects the Fe3+
-
O2-
stretching vibrations. This could be the reason for the observed decrease in ν 2 band
positions. The octahedral band ν2 seems to be continuously widened with Tb-
concentration this may be due to the statistical distribution of the Fe3+
ions on A- and B-
sites [68].
Page 185
The change in ν 1 band may be attributed to the drifting of Fe3+
ions towards
oxygen ion on occupation of tetrahedral sites by few Mg2+
ions [10]. The change in the
peak intensity of the spectra has been noticed with increasing Tb contents. It is well
known that the intensity ratio is a function of the change of dipole moment with the inter-
nuclear distance [69]. This ratio represents the contribution of the ionic bond Fe-O in the
lattice. Hence the observed decrease in the peak intensity may be due to the perturbation
occurring in Fe-O bonds by the substitution of terbium ions.
0
20
40
60
80
100
37057077097011701370
wave number (cm-1)
Tra
nsm
itta
nce (
%)
x = 0.00
Fig. 4.60. FTIR Spectrum for MgFe2O4 ferrite.
Page 186
x = 0.04
0
20
40
60
80
100
37057077097011701370
Wave number (cm-1)
Tra
nsm
itta
nce (
%)
Fig. 4.61. FTIR Spectrum for Mg.96Tb0.04Fe2O4 ferrite.
x = 0.08
0
20
40
60
80
100
37057077097011701370
Wave number (cm-1)
Tra
nsm
itta
nce (
%)
Fig. 4.62. FTIR Spectrum for Mg.92Tb.08Fe2O4 ferrite.
Page 187
x = 0.12
0
20
40
60
80
100
37057077097011701370
wave number (cm-1)
Tra
nsm
itta
nce (
%)
Fig. 4.63. FTIR Spectrum for Mg.88Tb0.12Fe2O4 ferrite.
0
20
40
60
80
100
37057077097011701370
wave number(cm-1)
Tra
nsm
itta
nce(%
)
x = 0.16
Fig. 4.64. FTIR Spectrum for Mg.84Tb0.16Fe2O4 ferrite.
Page 188
x = 0.20
0
20
40
60
80
100
37057077097011701370
wave number (cm-1)
Tra
nsm
itta
nce (
%)
Fig. 4.65. FTIR Spectrum for Mg0.8Tb0.2 Fe2O4 ferrite.
Table 4.11
FTIR absorption bands for Mg1-xTbxFe2O4 ferrites (x = 0, 0.04, 0.08, 0.12, 0.16, 0.2).
Sr. No Composition ν1 (cm-1
) ν2 (cm-1
)
1 MgFe2O4 571 429
2 Mg0.96Tb.04Fe2O4 567 428
3 Mg0.92Tb.08Fe2O4 571 427
4 Mg0.88Tb.12Fe2O4 566 425
5 Mg0.84Tb.16Fe2O4 566 419
6 Mg0.8Tb.2Fe2O4 567 418
Page 189
4.12 Scanning Electron Microscopy (SEM)
Figs. 4.66-4.69 show representative SEM micrographs of the Mg1-xTbxFe2O4
ferrites. All the micrographs exhibit inhomogeneous grain size distribution. The
micrographs of Figs. 4.66 – 4.67 show monophasic microstructure along with few
agglomerates. The micrographs shown in Figs.4.68 – 4.69 depict biphasic microstructure.
From the Figs. 4.68 & 4.69, it can be observed that the second phase occurs in the form
of precipitates located among the matrix of dark grains. These precipitates in the ferrite
matrix were formed by either segregation to, or precipitating at the grain boundaries.
From these micrographs the grain size was calculated using line intercept method.
With the increase of terbium concentration from x = 0.0 to 0.2, the grain size
found to be decreasing and lies in the range from 7 to 4 µm. The decrease in the grain
size can be explained on the basis of ionic radii of the terbium ions. It is assumed that
some of the terbium ions may reside on the grain boundaries; these can hinder the growth
[70] and also exert stress on the grain which causes the reduction of grain size. It was
observed that the substitution of terbium inhibited the grain growth by approximately 53
%.
Page 190
Fig. 4.66. SEM micrograph of Mg 1-x Tb x Fe2O4, (x = 0.00) ferrite.
Fig. 4.67. SEM micrograph of Mg 1-x Tb x Fe2O4, (x = 0.08) ferrite.
Page 191
Fig. 4.68. SEM micrograph of Mg 1-x Tb x Fe2O4, (x = 0.14) ferrite.
Fig. 4.69. SEM micrograph of Mg 1-x Tb x Fe2O4, (x = 0.20) ferrite.
Page 192
4.13 Compositional Analysis
EDX has been performed on a few representative samples of Mg1-xTbxFe2O4
ferrites in order to study the compositional analysis. EDX analysis exhibit the elemental
percentage of each element expected to be present in the ferrite sample. The heights of
the peaks in the EDX graphs represent the proportion of each element in the finally
sintered ferrite sample. A change has been observed in the size and height of the peaks of
all the Tb-substituted samples. With the increase of Tb concentration, the graphs exhibit
an increase in the height of the Tb peaks.
In the present study, the terbium is substituted for magnesium. Hence, the amount
of magnesium decreases and this decrease in magnesium is observed in the peak height of
Mg as shown in Figs. 4.70 – 4.73. The detail compositions of various metals estimated
from EDX graphs present in the samples are listed in Table 4.12. The observed %age of
metals of each composition is consistent with the stoichiometricy of the prepared
samples.
Table 4.12
Nominal percentage of metal cations in Mg1-xTbxFe2O4 ferrites
Terbium
Concentration
Mg weight % Tb weight % Fe weight % Total
0.00 13.67 - 86.33 100
0.08 12.02 1.85 86.13 100
0.14 10.94 2.61 86.45 100
0.20 10.33 3.36 86.31 100
Page 193
Fig. 4.70. EDX of the MgFe2O4 ferrite.
Fig. 4.71. EDX of the Mg0.92Tb0.08Fe2O4 ferrite.
Page 194
Fig. 4.72. EDX of the Mg0.86Tb0.14Fe2O4 ferrite.
Fig. 4.73. EDX of the Mg0.80Tb0.20Fe2O4 ferrite.
Page 195
4.14 Static Magnetic Properties
4.14.1 Magnetization
The MH- loops of Mg1-xTbxFe2O4 ferrites recorded on a VSM at room
temperature are shown in Figs. 4.74-4.84. All the samples are well saturated at ~ 6000
(Oe). The variation in saturation magnetization (Ms) and coercivity (Hc) with the
substituent concentration of terbium are listed in Table 4.13. The low coercivity values
and narrow s-type magnetic loops of the samples predict the soft magnetic nature of these
ferrites. When ferrite composition is modified with magnetic/diamagnetic ions, the
number of the magnetic ions on the A- and B-sublattices and the resulting magnetization
of the ferrite are affected. It is an established fact that the magnetic properties of the
spinel type ferrites (AB2O4) with fcc crystal structure depend on the distribution of the
cations on A- and B-sites.
The saturation magnetization is observed to increase for x = 0.02 and it decreases
thereafter up to x = 0.2 as shown in Fig. 4.85. The radius of Tb3+
ion (0.93Å) is larger
than that of Mg2+
(0.66Å) and Fe3+
ions (0.64Å) and the radius of tetrahedral site is small
as compared to the octahedral site, hence the Tb3+
ions will prefer to occupy the
octahedral sites. The possible explanation of the increase in saturation magnetization for
x = 0.02 may be explained on the basis of redistribution of cations on A-and B-
sublattices. In MgFe2O4 ferrite most of the Mg2+
ions reside on B-sites and small fraction
of these ions goes to the A-sites [71]. When terbium (Tb) ions are introduced into the
octahedral sites few of the Mg2+
ions are migrated to the tetrahedral sites. These Mg2+
ions force equal amount Fe3+
ions to the octahedral sites [72], this increase the
magnetization of the B-sublattice and hence the saturation magnetization of this
composition increases.
Page 196
The decrease in saturation magnetization for further substitution x ≥ 0.04 of Tb3+
ions may be attributed to the magnetic disorder on B-sites. It has been quoted that [73]
the spin canting is caused by the substitution of rare earth ions, since Tb is a rare earth
metal ion and it causes the transformation of collinear ferrimagnetic order into non-
collinear arranagement of spins on B-sites. Hence the occupancy of Tb3+
ions on
octahedral sites stemmed the collinear arrangement and reduces the saturation
magnetization. Also, it is expected that no more Fe3+
ions are transferred to the
octahedral sites which lead to the decrease of saturation magnetization. The decrease of
saturation magnetization by the addition of rare earth ions in different ferrites has also
been reported [17, 74, 75].
The site occupancy of Mg2+
and Fe3+
ions in Mg-Tb ferrites is complicated;
however, the decrease of saturation magnetization for higher concentration of Tb3+
ions
may be attributed to the secondary orthoferrite phase (TbFeO3), which has a low value of
magnetization. The decrease in the saturation magnetization with the evaluation of
secondary phase has also been reported when Tb was substituted in Ni-Zn and Li-Zn
ferrites [3, 12].
4.14.2 Coercivity
The coercivity (Hc) values of all the samples of Mg1-xTbxFe2O4 ferrites are listed
in Table 4.13. The coercivity is found to decrease when Tb contents are increased up to x
= 0.06 after which the coercivity increases. The coercivity has a linear relationship with
porosity [18] for 0.00 ≤ x ≤ 0.06 but for higher Tb concentration it deviates. The
coercivity is the measure of magnetic field strength required for overcoming the
magnetocrystalline anisotropy to flip the magnetic moments. For Tb-concentration
Page 197
0.08 ≤ x ≤ 0.12 the increase in coercivity may be attributed to the dominant role of L-S
coupling caused by the anisotropic terbium ions [76]. The increase in coercivity may also
be due to the appearance of second phase on or near the grain boundaries which impede
the motion of domain walls. The coercivity is decreased for higher concentration of Tb
that is for x ≥ 0.14; it could be due to the largest decrease in porosity which provides the
easiness to the domain wall movement.
Table 4.13
The saturation magnetization (Ms) and Coercivity (Hc) of Mg1-xTbxFe2O4
(x = 0.0-0.2) ferrites.
S.No. Composition Ms(emu/gram) Hc(Oe)
1 MgFe2O4 30.50 47.5
2 Mg0.98Tb0.02Fe2O4 32.00 44.0
3 Mg0.96Tb0.04Fe2O4 30.40 43.0
4 Mg0.94Tb0.06Fe2O4 30.30 41.0
5 Mg0.92Tb0.08Fe2O4 30.10 57.0
6 Mg0.90Tb0.10Fe2O4 29.00 61.0
7 Mg0.88Tb0.12Fe2O4 28.90 63.0
8 Mg0.86Tb0.14Fe2O4 28.40 58.0
9 Mg0.84Tb0.16Fe2O4 27.20 43.0
10 Mg0.82Tb0.18Fe2O4 26.10 37.0
11 Mg0.80Tb0.20Fe2O4 26.00 34.0
Page 198
-40
-30
-20
-10
0
10
20
30
40
-8000 -6000 -4000 -2000 0 2000 4000 6000 8000
H (Oe)
M (
em
u/g
) x = 0.00
Fig. 4.74. The MH-Loop for MgFe2O4 ferrite.
-40
-30
-20
-10
0
10
20
30
40
-8000 -6000 -4000 -2000 0 2000 4000 6000 8000
H (Oe)
M (
em
u/g
) x = 0.02
Fig. 4.75. The MH-Loop for Mg0.98Tb0.02Fe2O4 ferrite.
Page 199
-40
-30
-20
-10
0
10
20
30
40
-8000 -6000 -4000 -2000 0 2000 4000 6000 8000
H (Oe)
M (
em
u/g
)
x = 0.04
Fig. 4.76. The MH-Loop for Mg0.96Tb0.04Fe2O4 ferrite.
-40
-30
-20
-10
0
10
20
30
40
-8000 -6000 -4000 -2000 0 2000 4000 6000 8000
H (Oe)
M (
em
u/g
)
x = 0.06
Fig. 4.77. The MH-Loop for Mg0.94Tb0.06Fe2O4 ferrite.
Page 200
-40
-30
-20
-10
0
10
20
30
40
-8000 -6000 -4000 -2000 0 2000 4000 6000 8000
H (Oe)
M (
em
u/g
)
x = 0.08
Fig. 4.78. The MH-Loop for Mg0.92Tb0.08Fe2O4 ferrite.
-40
-30
-20
-10
0
10
20
30
40
-8000 -6000 -4000 -2000 0 2000 4000 6000 8000
H (Oe)
M (
em
u/g
)
x = 0.10
Fig. 4.79. The MH-Loop for Mg0.90Tb0.10Fe2O4 ferrite.
Page 201
-40
-30
-20
-10
0
10
20
30
40
-8000 -6000 -4000 -2000 0 2000 4000 6000 8000
H (Oe)
M (
em
u/g
) x = 0.12
Fig. 4.80. The MH-Loop for Mg0.88Tb0.12Fe2O4 ferrite.
-40
-30
-20
-10
0
10
20
30
40
-8000 -6000 -4000 -2000 0 2000 4000 6000 8000
H (Oe)
M (
em
u/g
)
x = 0.14
Fig. 4.81. The MH-Loop for Mg0.86Tb0.14Fe2O4 ferrite.
Page 202
-30
-20
-10
0
10
20
30
-8000 -6000 -4000 -2000 0 2000 4000 6000 8000
H (Oe)
M (
em
u/g
)
x = 0.16
Fig. 4.82. The MH-Loop for Mg0.84Tb0.16Fe2O4 ferrite.
-30
-20
-10
0
10
20
30
-8000 -6000 -4000 -2000 0 2000 4000 6000 8000
H (Oe)
M (
em
u/g
)
x = 0.18
Fig. 4.83. The MH-Loop for Mg0.82Tb0.18Fe2O4 ferrite.
Page 203
-30
-20
-10
0
10
20
30
-8000 -6000 -4000 -2000 0 2000 4000 6000 8000
H (Oe)
M (
em
u/g
)
x = 0.20
Fig. 4.84. The MH-Loop for Mg0.80Tb0.20Fe2O4 ferrite.
25
26
27
28
29
30
31
32
33
0 0.02 0.04 0.06 0.08 0.1 0.12 0.14 0.16 0.18 0.2
Tb concentration (x)
Satu
rati
on
Mag
neti
zati
on
(em
u/g
)
Fig. 4.85. The saturation magnetization vs Tb-concentration for Mg1-xTbxFe2O4 ferrites.
Page 204
4.15 Magnetodynamics of Mg-Tb-Fe-O System
Room temperature ferromagnetic resonance (FMR) spectra of all the
Mg1-xTbxFe2O4 ferrites, taken at X-band (9.5 GHz) are shown in Figs. 4.86-4.96. A single
resonance peak has been observed in the samples and all the profiles are slightly
asymmetric as depicted in Figs. 4.86-4.96. The spectra have been used to obtain the
linewidths (ΔH) and FMR position and these are listed in Table 4.14. It can be observed
that linewidth vary distinctly from sample to sample, this may be due to considerable
inhomogeneities present in the samples. The valence exchange or charge-transfer
relaxation mechanism, which is important in spinel ferrites, is possible source of
linewidth in spinel ferrites.
In the charge transfer mechanism, the energy is directly transferred to the lattice
without going through either the degenerate or the thermal magnons. The line widths of
all the samples varies in the range (746-1015 Oe) except for x = 0.16, which has the
highest linewidth (1146 Oe) as compared to rest of compositions. The composition
Mg.98Tb.02Fe2O4 (x = 0.02) has the minimum linewidth (746 Oe) and highest saturation
magnetization (32 emu/gm). This composition is more suitable for device engineering.
The linewidths obtained in the present investigation are much lower than the reported
literature [77, 78]. The increase in linewidth has been correlated [79] to the two magnon
scattering process.
In the present studies, the increase in ΔH may also be attributed to the two
magnon scattering process. A second phase (TbFeO3) appears for x ≥ 0.06, other than the
fcc spinel phase. A comparatively high linewidth has been reported [79] due to the
presence of second phase. This second phase has the same effect as the surface pits in
Page 205
polycrystalline ferrites. In the present samples the linewidth increases for ≥ 0.06 due to
the occurrence of second phase (TbFeO3). By using the linewidth, the minimum
relaxation time calculated for these ferrites lies in the range ~ 10-10
s. A remarkable
feature is the intensity of the FMR profiles. The substitution of terbium ions in these
ferrites has marked effect on the intensities of the FMR profiles. The intensities strongly
depend on the gyromagnetic ratio (γ) and g-values of the cations present in each
composition.
All the cations involved like magnesium, ferric and terbium have different values
of gyromagnetic ratio (γ) because of the differences in the spectroscopic splitting g-
factors. The FMR profiles of all the substituted samples have lower intensities as
compared to the unsubstituted sample (MgFe2O4) as depicted in the Figs. 4.86-4.96. The
differences in the g- values of the cations involved are responsible for the observed
variations in the intensity of the FMR peaks.
-1.5
-1
-0.5
0
0.5
1
1.5
0 1000 2000 3000 4000 5000 6000 7000 8000 9000
H (Oe)
deri
vati
ve o
f th
e F
MR
ab
so
rpti
on
cu
rve
x = 0.00
Fig. 4.86. FMR profile of MgFe2O4 ferrite.
Page 206
-1.5
-1
-0.5
0
0.5
1
1.5
0 1000 2000 3000 4000 5000 6000 7000 8000 9000
H (Oe)
deri
vati
ve o
f th
e F
MR
ab
so
rpti
on
cu
rve
x = 0.02
Fig. 4.87. FMR profile of Mg0.98Tb0.02Fe2O4 ferrite.
-1.5
-1
-0.5
0
0.5
1
1.5
0 1000 2000 3000 4000 5000 6000 7000 8000 9000
H (Oe)
deri
vati
ve o
f th
e F
MR
ab
so
rpti
on
cu
rve
x = 0.04
Fig. 4.88. FMR profile of Mg0.96Tb0.04Fe2O4 ferrite.
Page 207
-1
-0.5
0
0.5
1
1.5
0 1000 2000 3000 4000 5000 6000 7000 8000 9000
H (Oe)
deri
vati
ve o
f th
e F
MR
ab
so
rpti
on
cu
rve
x = 0.06
Fig. 4.89. FMR profile of Mg0.94Tb0.06Fe2O4 ferrite.
-1.5
-1
-0.5
0
0.5
1
1.5
0 1000 2000 3000 4000 5000 6000 7000 8000 9000
H (Oe)
deri
vati
ve o
f th
e F
MR
ab
so
rpti
on
cu
rve
x = 0.08
Fig. 4.90. FMR profile of Mg0.92Tb0.08Fe2O4 ferrite.
Page 208
-1
-0.5
0
0.5
1
0 1000 2000 3000 4000 5000 6000 7000 8000 9000
H (Oe)
de
riv
ati
ve
of
the
FM
R a
bs
orp
tio
n
cu
rve
x = 0.10
Fig. 4.91. FMR profile of Mg0.90Tb0.10Fe2O4 ferrite.
-1.5
-1
-0.5
0
0.5
1
1.5
0 1000 2000 3000 4000 5000 6000 7000 8000 9000
H (Oe)
deri
vati
ve o
f th
e F
MR
ab
so
rpti
on
cu
rve
x = 0.12
Fig. 4.92. FMR profile of Mg0.88Tb0.12Fe2O4 ferrite.
Page 209
-1.5
-1
-0.5
0
0.5
1
1.5
0 1000 2000 3000 4000 5000 6000 7000 8000 9000
H (Oe)
deri
vati
ve o
f th
e F
MR
ab
so
rpti
on
cu
rve
x = 0.14
Fig. 4.93. FMR profile of Mg0.86Tb0.14Fe2O4 ferrite.
-1
-0.5
0
0.5
1
0 1000 2000 3000 4000 5000 6000 7000 8000 9000
H (Oe)
deri
vati
ve o
f th
e F
MR
ab
so
rpti
on
cu
rve
x = 0.16
Fig. 4.94. FMR profile of Mg0.84Tb0.16Fe2O4 ferrite.
Page 210
-1
-0.5
0
0.5
1
0 1000 2000 3000 4000 5000 6000 7000 8000 9000
H (Oe)
deri
vati
ve o
f th
e F
MR
ab
so
rpti
on
cu
rve
x = 0.18
Fig. 4.95. FMR profile of Mg0.82Tb0.18Fe2O4 ferrite.
-1
-0.5
0
0.5
1
0 1000 2000 3000 4000 5000 6000 7000 8000 9000
H (Oe)
de
riv
ati
ve
of
the
FM
R a
bs
orp
tio
n
cu
rve
x = 0.20
Fig. 4.96. FMR profile of Mg0.80Tb0.20Fe2O4 ferrite.
Page 211
Table. 4.14 FMR parameters of Mg1-xTbxFe2O4 ferrites measured at X-band (9.5 GHz)
Serial
No.
Composition FMR linewidth ΔHFWHM
(Oe)
FMR Position
(Oe)
1 MgFe2O4 752 4399
2 Mg.98Tb.02Fe2O4 746 4390
3 Mg.96Tb.04Fe2O4 799 4436
4 Mg.94Tb.06Fe2O4 954 4375
5 Mg.92Tb.08Fe2O4 790 4372
6 Mg.9Tb.1 Fe2O4 1015 4203
7 Mg.88Tb.12Fe2O4 813 4365
8 Mg.86Tb.14Fe2O4 762 4420
9 Mg.84Tb.16Fe2O4 1146 4406
10 Mg.82Tb.18Fe2O4 991 4503
11 Mg.8Tb.2 Fe2O4 1001 4438
Page 212
4.16 Relative Initial Permeability
The relative initial permeability, μi΄, of Mg1-xTbx Fe2O4 (0.00 ≤ x ≤ 0.2), ferrites is
measured in the frequency range from 1 KHz to 10 MHz and the plots of μi΄ vs
frequency are shown in Figs. 4.97 and 4.98 respectively. The Figs. indicate that the
relative initial permeability is observed to decrease generally with the increasing
concentration of terbium ions. It is well known that [80] the magnetization process is
considered as the superposition of domain wall motion and spin rotation. The domain
wall-motions are affected by both the composition and microstructures. The
microstructure mechanism of μi΄ of ferrites is mainly attributed to the motion of domain
walls and magnetic domains [24].
It has been found [81] that in the low frequency region, the major contribution to
the μi΄ is due to the movement of domain walls and this has also been observed in the
present samples as shown in Figs. 4.97 and 4.98. In the high frequency region (MHz)
spin rotations are assumed to be dominant over the domain wall displacements [82]. Our
observations are also in well agreement with the Globus model. The high μi΄ is observed
for the samples and it decreases with the increasing Tb-concentration as shown in Fig.
4.99. The decrease in μi΄ with the increasing concentration of terbium can be explained
on the basis of following relation [28]
1
2
K
DM m
Si (4.11)
where Dm is the average grain diameter, K1 is the magneto-crystalline anisotropy constant
and Ms is the saturation magnetization.
Since the saturation magnetization of the samples under investigation decreases
with the increasing concentration of terbium ions, so a reasonable decrease in μi΄ is
Page 213
consistent with saturation magnetization results. The average grain size decreases of all
the substituted samples. Hence the decrease in of μi΄ is expected. The observed fall in μi΄
suggests that K1 is not playing a dominant role. A linear relationship of μi΄ vs grain size
has been reported [26, 29] and in some cases it may deviates [30]. All the samples have
almost similar decreasing trend of μi΄ except the samples having the terbium
concentration, x = 0.12 and x = 0.16. These exhibit a drastic decrease in the values of μi΄
in the low frequency region. From the Figs. 4.97 and 4.98, it is evident that very small
values μi΄ have been observed in the high frequency region.
0
500
1000
1500
1000 10000 100000 1000000 10000000
Frequency (Hz)
Rela
tive i
nit
ial
perm
eab
ilit
y
x= 0.00
x = 0.02
x = 0.04
x = 0.06
x = 0.08
x = 0.10
Fig. 4.97. Relative initial permeability as a function of frequency for Mg 1-x Tb x Fe2O4,
(0.0 ≤ x ≤ 0.10) ferrites.
Page 214
0
500
1000
1000 10000 100000 1000000 10000000
Frequency (Hz)
Re
lati
ve
in
itia
l p
erm
ea
bil
ity
x = 0.12
x = 0.14
x = 0.16
x = 0.18
x = 0.20
Fig. 4.98. Relative initial permeability as a function of frequency for Mg 1-x Tb x Fe2O4,
(0.12 ≤ x ≤ 0.2) ferrites.
0
200
400
600
800
1000
1200
1400
1600
0 0.04 0.08 0.12 0.16 0.2
Tb-concentration (x)
μi΄
Fig. 4.99. The variation of μi΄ with x for Mg 1-x Tb x Fe2O4 (0.0 ≤ x ≤ 0.20) ferrites.
Page 215
4.16.1 Frequency Dependent Loss Factor
The loss factor was measured at room temperature for the investigated samples in
the given frequency range for Mg 1-x Tb x Fe2O4, (0.0≤ x ≤ 0.2) ferrites and is shown in
Figs. 4.100-4.101 respectively. The loss factors of all the samples decreased with the
increase in frequency. The samples 0.00 ≤ x ≤ 0.10 indicate very small peaks in the low
frequency region and beyond10 KHz a drastic decrease in the loss factors of these
samples has been found. The sample x = 0.08 exhibit three loss peaks in the low
frequency region and its value drops more rapidly as compared to neighboring
compositions. The sample for the terbium concentration x = 0.06 also exhibit a small loss
peak in the high frequency region. The Fig. 4.101 indicates that the magnetic loss factor
of the samples having terbium concentrations 0.12 ≤ x ≤ 0.20, decrease more rapidly as
compared to the compositions mentioned in Fig. 4.100.
All the Tb substituted samples exhibit low values of loss factor as compared to the
unsubstituted sample in the low frequency region. In the high frequency range the loss
factor becomes frequency independent and indicates very small values. The minimum
loss factor has been observed for the compositions Mg 0.86 Tb 0.14 Fe2O4 and Mg 0.82 Tb
0.18Fe2O4 as compared to all other compositions. The previously reported results indicate
that [83] the partial substitution of rare earth ions (Eu, Ru and Gd) in Ni-Zn ferrites
significantly lowers the relative loss factor over a wide frequency range. All the samples
of terbium substituted Mg ferrites show small values of the loss factor over a large
frequency range. For ferrites to be useful as inductor and transformer materials, the
magnetic losses should be as low as possible over a wide frequency range. These
materials are suitable in this regard.
Page 216
0
0.2
0.4
0.6
0.8
1
1000 10000 100000 1000000 10000000
Frequency (Hz)
Lo
ss f
acto
r
x = 0.00
x = 0.02
x = 0.04
x = 0.06
x = 0.08
x = 0.10
Fig. 4.100. Loss factor as a function of frequency for Mg 1-x Tb x Fe2O4,
(0.0 ≤ x ≤ 0.10) ferrites.
0
0.2
0.4
0.6
0.8
1
1000 10000 100000 1000000 10000000
Frequency (Hz)
Lo
ss f
acto
r
x = 0.12
x = 0.14
x = 0.16
x = 0.18
x = 0.20
Fig. 4.101. Loss factor as a function of frequency for Mg 1-x Tb x Fe2O4,
(0.12 ≤ x ≤ 0.20) ferrites.
Page 217
4.17 DC Electrical Resistivity
The d.c. electrical resistivity of Mg1-xTbxFe2O4 (0.00 ≤ x ≤ 0.2) ferrites measured
at room temperature with the increasing Tb concentration is shown in Fig. 4.102. The
resistivity increases gradually from 2.33 x 10⁶ Ω-cm to 5.71 x10
7 Ω-cm as the terbium
concentration is increased from 0.02 to 0.2. The increase in resistivity (decrease in
conductivity) of the Tb substituted samples may be attributed to the larger resistivity
value of Tb (111μΩ-cm) as compared to Mg (4.3μΩ-cm) [35]. The increase in resistivity
may be possibly due to the larger ionic radius of Tb3+
(0.93Å) ions in comparison to Mg2+
(0.66Å) ions which may increase the separation between the ferrous and ferric ions on the
octahedral sites and impede the conduction phenomenon between these two ions as
reported in [3, 84, 85].
0.00E+00
1.00E+07
2.00E+07
3.00E+07
4.00E+07
5.00E+07
6.00E+07
0 0.04 0.08 0.12 0.16 0.2
Terbium contents (x)
Resis
ivit
y (
Ω-c
m)
Fig. 4.102. Plot of Room temperature resistivity (ρ) vs terbium concentration
for Mg1-xTbxFe2O4 ferrites.
Page 218
4.17.1 Temperature Dependent Electrical Resistivity
Temperature dependent electrical resistivity has been measured in the temperature
range 30- 200 ºC and is depicted in Figs. 4.103 and 4.104 respectively. The temperature
dependent resistivity data indicates a linear relationship suggesting that it obeys the well
known Arrhenius relation [39, 86]:
ρ = ρ0 exp (Ea/kBT) (4.12)
where ρ is the resistivity, ρ0 is constant, Ea is the energy of activation and kB is the
Boltzmann’s constant and T is the absolute temperature.
The temperature dependent resistivity plots are used to calculate activation energy
of hopping [87]. All these plots show that the resistivity decreases as the temperature
increases, hence it can be inferred that all the samples exhibit semi-conducting behaviour.
Since all the samples show temperature dependence in the entire temperature range,
therefore they may be called as degenerate type semiconductors. The band theory which
explains the conduction mechanism in semiconductors is not suited for ferrites [88].
Hence conduction mechanism in ferrites can be explained on the basis of hopping
mechanism. The drift mobility of all the compositions of Mg1-xTbxFe2O4 ferrites have
been calculated from the following relation [5, 62]:
ned
1 (4.13)
where ‘e’ is the charge on electron, ρ is the resistivity and ‘n’ is the concentration of
charge carriers calculated from the following equation:
M
PNn aa (4.14)
where Na is the Avogadro’s number, ρa is the bulk density of the sample, P is the number
Page 219
of iron atoms in the chemical formula of the sample and M is the molecular weight of the
sample.
The graphs of drift mobility vs temperature are shown in Figs.4.105-4.106. It can
be seen that the drift mobility increases with increasing temperature. It is assumed that
the increase in drift mobility represents enhanced mobility of the charge carriers due to
thermal activation. It may be due to the fact that as the temperature increases, the charge
carriers start hopping from one site to another, hence the conduction process increases.
Also the Figs. 4.105 and 4.106 revealed that the samples having high resistivity have low
value of drift mobility. The drift mobility drops from 1.26 x 10⁻¹⁰
to 4.49 x 10⁻¹²
cm2V
-1S
-1
as the terbium concentration is increased from 0.00 to 0.2.
The Verwey’s hopping model [89] can be employed to explain the conduction
mechanism in these ferrite systems. According to this model the conduction mechanism
in ferrites is mainly attributed to the transfer of electrons between the ions of the same
element occurring in more than one valence state, and these have random distribution on
crystallographically equivalent lattice sites. The ferrites form closed packed oxygen
lattices with the cations over the tetrahedral (A) and octahedral (B) sites. The separation
between two metal ions residing on the octahedral (B) sites is smaller than the separation
between a metal ion on the octahedral (B) sites and ion on the tetrahedral (A) sites. Hence
the probability of electron hopping between octahedral (B) and tetrahedral (A) sites is
very small as compared to the ions occurring on the octahedral (B) sites only.
The electron hopping among the ions of the tetrahedral sites is not possible as
there are only Fe3+
ions. The Fe2+
ions occupy only on octahedral sites. The hopping
probability depends on the distance between the metal ions and the mobility of the charge
Page 220
carriers. The presence of terbium ions on the octahedral sites (as discussed in FTIR
analysis) increase the distance between the metal ions of the octahedral sites and impedes
the electron transfer between the iron ions. Hence increase in resistivity and decrease in
the drift mobility is expected. The following conduction mechanism may also be possible
in these ferrites:
Mg2+
+ Fe3+
↔ Mg3+
+ Fe2+
(4.15)
As Tb3+
ions are stable [3] below 1300 ºC and do not change their valence state from
Tb3+
to Tb4+
ions. The incorporation of Tb3+
ions may cause in the blocking of the
conduction mechanism. It is supposed that Tb3+
ions behave like scattering centres in the
electron exchange mechanism between the ions of different valencies situated on
crystallographically positions in the lattice and enhances the resisitivity of these ferrites.
4.5
5
5.5
6
6.5
7
2 2.2 2.4 2.6 2.8 3 3.2 3.4
1000/T (K-1)
Lo
g ρ
(Ω
-cm
)
x = 0.00x = 0.02x = 0.04x = 0.06x = 0.08x = 0.10
Fig. 4.103. Plot of logρ vs 1000/T for Mg1-xTbxFe2O4 ferrites (0.00 ≤ x ≤ 0.10).
Page 221
5
5.5
6
6.5
7
7.5
8
2 2.5 3 3.5
1000/T (K-1)
Lo
g ρ
(Ω
-cm
)
x = 0.12
x = 0.14
x = 0.16
x = 0.18
x = 0.20
Fig. 4.104. Plot of logρ vs 1000/T for Mg1-xTbxFe2O4 ferrites (0.12 ≤ x ≤ 0.20).
0.E+00
5.E-10
1.E-09
2.E-09
2.E-09
3.E-09
3.E-09
4.E-09
300 320 340 360 380 400 420 440 460 480 500
T (K)
μd (
cm
2.v
-1.S
-1)
x = 0.00
x = 0.02
x = 0.04
x = 0.06
x = 0.08
x = 0.10
Fig. 4.105. The plot of drift mobility (μd) with temperature for Mg1-xTbxFe2O4
ferrites (0.00 ≤ x ≤ 0.10).
Page 222
0.E+00
2.E-10
4.E-10
6.E-10
8.E-10
1.E-09
1.E-09
300 320 340 360 380 400 420 440 460 480 500
T (K)
μd(c
m2.v
-1.S
-1)
x = 0.12
x 0.14
x = 0.16
x = 0.18
x = 0.20
Fig. 4.106. The plot of drift mobility (μd) with temperature for Mg1-xTbxFe2O4
ferrites (0.12 ≤ x ≤ 0.20).
The activation energy, deduced from the temperature variation of resistivity as a
function of terbium concentration is shown in Fig. 4.107. A small increase in the
activation energy is observed up to x = 0.10 and later it increases more rapidly with
increasing concentration of terbium ions. The higher activation energy values correspond
to the higher resistivity values may be due to the formation of insulating intergranular
secondary phase (TbFeO3) which impedes the conduction phenomenon. The increase in
activation suggests the partial incorporation of terbium ions on the octahedral sites, which
causes the blockage of electron transfer between the Fe3+
and Fe2+
. The activation energy
values of the samples under investigation are comparable to the reported trivalent
substituted magnesium ferrites [67, 90, 91].
Page 223
0.2
0.24
0.28
0.32
0.36
0 0.04 0.08 0.12 0.16 0.2
Terbium contents (x)
Acti
vati
on
en
erg
y (
eV
)
Fig. 4.107. Plot of activation energy vs terbium concentration
for Mg1-xTbxFe2O4 ferrites.
Page 224
4.18 Dielectric Properties
Figs. 4.108 and 4.109 show the variation of dielectric constant (ε') with frequency
from 10 Hz to 10MHz of Mg1-xTbxFe2O4 ferrites at room temperature. It can be observed
that the dielectric constant decreases with an increase in frequency. This decrease of
dielectric constant is due to the reason that the ions contributing in the polarizability
exhibit lagging behind the applied field beyond a certain frequency, which is normal
ferrimagnetic behaviour. [1]. The electron exchange between Fe2+
and Fe3+
in n-type
semi-conducting Mg-Tb ferrites can not follow the changes in the applied ac field.
Therefore the values of dielectric constant decrease with an increase in frequency. All the
samples have high values of dielectric constant in the order of 103-10
4 at low frequencies.
This may be due to oxygen vacancies, voids, grain boundary defects, etc [2]. These high
values of dielectric constant at lower frequencies may be due to the Maxwell-Wagner
interfacial polarization [2-3] for inhomogeneous dielectric structure which is in
agreement with Koops phenomenological theory [4].
The inhomogeneous dielectric structure was composed of two layers. The first
layer consists of well conducting large ferrite grains and the second thin layer comprises
poorly conducting grain boundaries. The ferrite grains having high conductivity and low
dielectric constant are more effective in the high frequency region while the resistive
grain boundaries are more effective in the low frequency region [5]. The samples with
terbium (Tb) contents x = 0.18 and x = 0.20 have low values of dielectric constant as
compared to all other compositions in the low frequency region. This can be attributed to
the space charge polarization [6] or interfacial polarization which is the result of
inhomogeneous dielectric structure.
Page 225
0.E+00
1.E+04
2.E+04
3.E+04
4.E+04
5.E+04
6.E+04
7.E+04
8.E+04
10 100 1000 10000 100000 1000000 10000000
Frequency (Hz)
Die
lectr
ic c
on
sta
nt
x = 0.00
x = 0.02
x = 0.04
x = 0.06
x = 0.08
x = 0.10
Fig. 4.108. Dielectric constant (ε') vs frequency of Mg1-xTbxFe2O4 (x = 0.0- 0.10) ferrites.
0.E+00
2.E+03
4.E+03
6.E+03
8.E+03
1.E+04
1.E+04
1.E+04
2.E+04
2.E+04
10 100 1000 10000 100000 1000000 10000000
Frequency (Hz)
Die
lectr
ic c
on
sta
nt
x = 0.12
x = 0.14
x = 0.16
x = 0.18
x = 0.20
Fig. 4.109. Dielectric constant (ε') vs frequency of Mg1-xTbxFe2O4 (x = 0.12- 0.20)
ferrites.
Page 226
Figs. 108 and 109 revealed that the dielectric constant decreases as the terbium
contents are increased in the mixed Mg-Tb ferrite system. A physical interpretation of
dielectric polarization can be done on the basis of electric dipoles formed by the cations
Fe3+
, Mg2+
and Tb3+
of the structure with their surrounding O2-
ions. But the main source
of dielectric polarization in ferrites is the change of Fe3+
ions to Fe2+
ions on the
octahedral sites, leads to a local displacement of electric charge carriers, thereby
participating in the dielectric polarization and relaxation phenomenon [7]. In MgFe2O4
ferrite, most of the Mg ions occupy on the octahedral sites [8] while Fe ions occupy on
both octahedral (B-sites) and tetrahedral (A-sites) sites.
The increase of Tb ions substitution on B-sites replaces some Mg ions. The
reduction of Mg ions on B-sites leads to the decrease in population of Fe2+
ions (Mg2+
+
Fe3+
↔ Mg3+
+ Fe2+
) on the B-sites. Also the electron exchange interaction (conduction
mechanism) happening at B-sites between the Fe3+
ions to Fe2+
ions retarded due to the
presence of Tb ions on the B-sites that increases the hopping length of conduction
electrons. Since the dielectric polarization mechanism in ferrites is similar to the
electronic conduction mechanism [9]. The number of electrons exchanged between the
cations involved results in the local displacements in the direction of the applied external
field which determines the dielectric polarization. This explains the decrease in the
dielectric constant with the increasing concentration of Tb ions.
Similar behaviour of dielectric constant has been reported [10] when different
rare-earths elements substituted in Mn-Zn ferrites. The materials with higher dielectric
constant are useful [11] in capacitors of dynamic random access memories (DRAM) of
personal computers and work stations.
Page 227
0.1
0.2
0.3
0.4
0.5
0.6
0.7
0.8
0.9
1
1.1
10 100 1000 10000 100000 1000000 10000000
Frequency (Hz)
Die
lectr
ic l
oss
x = 0.00
x = 0.02
x = 0.04
x = 0.06
x = 0.08
x = 0.10
Fig. 4.110. Dielectric loss (tanδ) vs frequency of Mg1-xTbxFe2O4 (x = 0.0- 0.10) ferrites.
0
0.1
0.2
0.3
0.4
0.5
0.6
0.7
0.8
0.9
1
1.1
10 100 1000 10000 100000 1000000 10000000
Frequency (Hz)
Die
lectr
ic l
oss
x = 0.12
x = 0.14
x = 0.16
x = 0.18
x = 0.20
Fig. 4.111. Dielectric loss (tanδ) vs frequency of Mg1-xTbxFe2O4 (x = 0.12- 0.20) ferrites.
Page 228
The materials of the present study may have potential application in this regard.
The variation of dielectric loss (tanδ) with frequency at room temperature for Mg1-
xTbxFe2O4 (x = 0.0- 0.20) ferrites is shown in Figs. 4.110 and 4.111. The figures 4.110
and 4.111 revealed that the values of dielectric loss more or less decreases with
substitution of terbium ions in magnesium ferrites. It can be seen that the dielectric loss
first decreases as the frequency increases and then increases rapidly beyond 100 KHz.
Qualitatively the formation of dielectric loss peaks may be owing to the following
reasons.
A strong correlation has been reported [12] between the conduction mechanism
and dielectric behaviour. The conduction phenomenon in ferrites is considered due to the
hopping of electrons between divalent and trivalent iron ions present over the octahedral
sites. The dielectric loss peak is observed when the jump frequency of the local charge
carriers (f = 1/τrelaxation) is approximately equal to the frequency of external applied
field [5, 13, 14]. The sharp peak can be observed when both the frequencies exactly
matched with each other.
Eddy current losses are inversely proportional to the resistivity of the ferrite
material. Hence the high resistivity is the key aspect for the ferrite material in order to
reduce the eddy current losses. It is seen that the minima occurred in the dielectric loss
for all the samples shifts towards the lower frequency region. The loss peak increase as
the terbium concentration is increased from 0.00 to 0.10 as shown in Fig. 4.110. The
dielectric loss peak is decreased as the terbium concentration is varied from 0.12 to 0.20
as indicated in Fig. 4.111. The irregular behaviour of the loss peak may be related to the
jump or hopping probability of the material. A decrease in the loss peak with increasing
Page 229
terbium concentration indicates that the hopping or jump probability is decreasing. The
probable reason for this decrease is the population of Fe2+
ions on the octahedral sites,
which are responsible for the polarization in these ferrites, decreases with the increase of
terbium concentration.
Hence it can be inferred that the jump or hopping frequencies for all the samples
showing peaking behaviour lie in the range 1 to 10 MHz. The samples having nominal
compositions Mg.82Tb.18Fe2O4 and Mg.84Tb.16Fe2O4 exhibit minimum dielectric loss and
dielectric constant. These mentioned compositions have higher resistivity as compared to
all other compositions. Similar trends of the dielectric loss (tanδ) were also been reported
by other researchers [15, 16].
0
0.005
0.01
0.015
0.02
0.025
1.E+01 2.E+06 4.E+06 6.E+06 8.E+06 1.E+07
Frequency (Hz)
σ a
c (
oh
m-1
cm
-1)
x = 0.00
x = 0.02
x = 0.04
x = 0.06
x = 0.08
x = 0.10
Fig. 4.112. The variation of ac conductivity with frequency for Mg1-xTbxFe2O4
(x = 0.0- 0.10) ferrites.
Page 230
0
0.005
0.01
0.015
0.02
0.025
1.E+01 2.E+06 4.E+06 6.E+06 8.E+06 1.E+07
Frequency (Hz)
σ a
c (
oh
m-1
cm
-1)
x = 0.12
x =0.14
x =0.16
x =0.18
x =0.20
Fig. 4.113. The variation of ac conductivity with frequency for Mg1-xTbxFe2O4
(x = 0.12- 0.20) ferrites.
Figs. 112 and 113 show the variation of ac conductivity with frequency at room
temperature for Mg-Tb ferrites. The ac conductivity (σac) increases with an increase if
frequency. The frequency dependence conductivity behaviour can be explained with the
help of Maxwell-Wagner double layer model. The ferrous ions are formed in the samples
while sintering the ferrites powders which lead to the high conductive grains. When
theses ferrite powders are cooled in an oxygen atmosphere, the low conductive grains are
possible to form. The ferrites which have high conductive grains are considered
inhomogeneous dielectric materials. The high conductive grains and grain boundaries
(low conductive grain) have different properties. The grain boundaries are more active in
the low frequency region. The hopping frequency of electron between Fe2+
and Fe3+
ions
is very low.
As the frequency increases conductive grains become more active by promoting
the hopping of electrons between Fe2+
and Fe3+
ions, hence increase the hopping
Page 231
frequency. Thus ac conductivity increases as the frequency increases. The ac conductivity
decreases generally as the Tb-contents are increased in the samples as shown in Figs.
4.112 & 4.113. This decrease in σac can be explained on the basis that Tb-ions occupy on
the octahedral sites in these Mg-Tb ferrites. The Tb-ions are expected to lockup with Fe2+
ions and it reduces the hopping between the iron ions Fe2+
↔ Fe3+
. This decrease the
probability of hopping of charge carriers and the conductivity decreases.
The ac conductivity is observed to decrease in all Tb-substituted samples except x
= 0.18, which is anomaly in these plots. Also the sample Mg.96Tb.04Fe2O4 exhibit has high
conductivity values in high frequency region (MHz) as compared to the neighbouring
compositions. The decrease in conductivity beyond 8MHz is attributed to the occurance
of loss peak in tanδ. A decrease in ac conductivity has been reported [10] when different
rare-earths were substituted in Mn-Zn ferrites.
Page 232
Conclusions
In the present work two series of Tb-substituted spinel ferrites namely Ni1−xTbxFe2O4
(x = 0, 0.02, 0.04, 0.06, 0.08, 0.10, 0.12, 0.14, 0.16, 0.18, 0.20) and Mg 1-x Tb x Fe2O4
(x = 0, 0.02, 0.04, 0.06, 0.08, 0.10, 0.12, 0.14, 0.16, 0.18, 0.20) were prepared by solid
state reaction technique.
The XRD analysis of Ni1−xTbxFe2O4 and Mg 1-x Tb x Fe2O4 ferrites revealed that
all samples are cubic spinel ferrites.
The substitution of terbium for x > 0.08 in nickel ferrites leads to the formation of
a secondary phase (TbFeO3) where as in Mg 1-x Tb x Fe2O4 ferrites the second
phase appeared at x = 0.06 as shown in the XRD patterns.
The appearance of secondary phase suggests the solubility limit in both series.
A non-linear behavior of lattice constant is found in both series and this is
attributed to the difference of ionic radii of Ni, Mg and Tb cations.
The bulk density of Ni1−xTbxFe2O4 and Mg 1-x Tb x Fe2O4 increases from 5.13 to
5.69 g/cm3 and from 3.55 to 4.6 g/cm
3 while X-ray density lies in the range ~ 5.4 -
5.86 g/cm3 and 4.55 – 5.16 g/cm
3 as the concentration of terbium is increased
from 0 to 0.2.
An appreciable decrease in porosity has been observed in both series caused by
the incorporation of terbium ions.
The FTIR analysis of both series indicate two absorption peaks thereby
confirming the spinel structure of these ferrites.
These absorption peaks revealed that terbium substitution for nickel and
magnesium ions occur at octahedral sites.
An inhomogeneous grain size distribution has been observed by the
microstructural analysis (SEM) and grain size is found to decrease by the
incorporation of terbium ions in Ni1−xTbxFe2O4 and Mg1-xTbxFe2O4 ferrites.
The micrographs also exhibit a few agglomerates and existence of secondary
phase.
The EDX analysis indicates the elemental percentage of the elements present in
each composition.
Page 233
In Ni1−xTbxFe2O4 ferrites, the saturation magnetization is decreased from 34 to 27
emu/gram with the substitution of terbium.
The substitution of terbium in these ferrites leads to the dilution of B-sublattice
magnetization by the replacement of nickel magnetic ions by Tb in Ni1−xTbxFe2O4
ferrites and hence decreases the net magnetization.
The coercivity of Ni1−xTbxFe2O4 ferrites is decreased from 40 to 23.5 Oe as the
concentration of terbium is varied from 0 to 0.14 while for higher concentration (x
> 0.14), the coercivity increases.
In Mg 1-x Tb x Fe2O4 series the saturation magnetization lies in the range 30 - 26
emu/gram.
The substitution of terbium for magnesium in Mg 1-x Tb x Fe2O4 ferrites also takes
place at the octahedral sites and the redistribution of the cations involved results
in the decrease of the net magnetization.
The coercivity of Mg 1-x Tb x Fe2O4 ferrites decreases linearly with porosity up to
x = 0.06 and thereafter the coercivity deviates from linearity. The coercivity lies
in the range 47 to 34 Oe.
The FMR spectra of both the series showed single and slightly asymmetric
resonance peaks.
The linewidth (ΔH) observed have lower values (593 Oe for Ni.94Tb.06Fe2O4) as
compared to the reported linewidth of spinel ferrites and showed better correlation
with magnetization.
The large values of linewidth (ΔH) are attributed to the sample’s inhomogeneities.
A remarkable decrease in the initial permeability with increasing terbium
concentration in both series has been observed.
The magnetic loss factor of Ni1−xTbxFe2O4 ferrite indicates a very small value of
= 3.44 x 10 -7
at x = 0.2.
The magnetic loss factors of Mg 1-x Tb x Fe2O4 ferrites are also very low and for x
= 0.2 its value is ~ 1.02 x 10⁻⁶
.
The resistivity of Ni1−xTbxFe2O4 ferrites increased from 1.7 x 10⁵ to 3.9 x 10
5 Ω-
cm while the resistivity of Mg 1-x Tb x Fe2O4 ferrites increases from 2.33 x 10⁶ to
5.71 x 10⁷ Ω-cm with the increasing concentration of terbium.
Page 234
The temperature dependent resistivity revealed that all the investigated
compositions show semiconducting behaviour.
The increase in drift mobility of the charge carriers of both series at higher
temperature is owing to thermal activation.
The activation energy increases with an increase in Tb-concentration in a similar
manner as that of resistivity.
The dielectric constant and dielectric loss decreases in both series by the terbium
incorporation.
Ni1−xTbxFe2O4 ferrites exhibited an abnormal dielectric loss.
The dielectric loss of Ni1−xTbxFe2O4 ferrites remains in the range 0.98-0.21 while
for Mg 1-x Tb x Fe2O4 ferrites it lies in the range 0.99-0.37 in the frequency range
from 10 Hz to 10 MHz.
Page 235
References
[1] B. D. Cullity. Elements of X-ray Diffraction. Addison-Wesley; 1959.
[2] Sagar E. Shirsath, B. G. Toksha, K. M. Jadhav,Mater. Chem. Phys. 117 (2009)
163-168.
[3] N. Rezlescu, E. Rezlescu, C. Pasnicu, M. L. Craus. J. Phys. Condens . Matter 6
(1994) 5707- 5716.
[4] A. A. Pandit, A. R. Shitre, D. R. Shengule, K. M. Jaghav . J. Mater. Sci. 40 (2005)
423-428.
[5] M. U. Islam, I. Ahmed, T. Abbas, Proceeding of the sixth International Symposium
on Advanced Materials (1999) 155-158.
[6] D. R. Lide, CRC Hand Book of Chemistry and Physics, 76th
ed.,CRC press,
London,1995.
[7] N. Rezlescu, E. Rezlescu, P. D. Popa, L. Rezlescu. J. Alloys Comp. 275- 277
(1998) 657-659.
[8] O. M. Hemeda, M. Z. Said, M. M. Barakat, J. Magn. Magn. Mater. 224 (2001)132-
142.
[9] L. John Berchmans, R. Kalai Selvan, P.N. Selva Kumar, C.O. Augustin, Mater. Lett.
58 (2004) 1928 – 933.
[10] L. John Berchmans, R. Kalai Selvan, P.N. Selva Kumar, C.O. Augustin, J. Magn.
Magn. Mater. 279 (2004) 103-110.
[11] William E. Lee, W. Mark Rainforth, Ceramic Microstructures: Property control by
processing. Kluwer Academic Publishers, 1994.
[12] E. Rezlescu, N. Rezlescu, C. Pasnicu, M. L. Craus, P. D. Popa, Cryst. Res. Technol.
31 (1996) 343-352.
[13] I. Neel, Ann. Phys. 3 (1948) 137-198.
[14] C. N. Chinnasamy, A. Nareyanasamy, N. Ponpandian, K. Chattopadhyay, K.
Shinoda, B. Jeyadevan, K. Tohji, K. Nakatauka, T. Furubayashi, I. Nakatani, Phys.
Rev. B 63 (2001) 184108-1 - 184108-6
[15] H. Perron. T. Mellier, C. Domain, J Roques, E. Simoni, R Drot and H Catalette, J.
Phys. Condens. Matter, 19 (2007) 346219-1 – 346219-10.
Page 236
[16] M. Azhar Khan, M.U. Islam, M. Ishaque, I.Z. Rahman, A. Genson, S. Hampshire,
Mater. Charact. 60 (2009) 73-78.
[17] N. Rezlescu and E. Rezlescu, Solid State Commun. 88 (1993) 139-141.
[18] A. Goldman, Modern Ferrite Technology, Van Nostrand Reinhold , New York,
1990.
[19] D. Jiles, Introduction to Magnetism and Magnetic Materials, Chapman & Hall,
London, 1991.
[20] B. Parvatheeswara Rao, O. F. Caltun, J. Optoelectron. Adv. Mater. 8, (3) (2006)
991- 994.
[21] B. Parvatheeswara Rao, A. Mahesh Kumar, K. H. Rao, Y. L .N. Murthy, O. F.
Caltun, I. Dumitru, L. Spinu, J. Optoelectron. Adv. Mater. 8 (5) (2006) 1703-1705.
[22] K. J. Standley, Oxide Magnetic Materials, Oxford: Claredon Press, 1962.
[23] R. F. Soohoo and A. H. Morrish, J. Appl. Phys. 50 (1979) 1639-1641.
[24] T. Nakamura, J. Appl. Phys., 88 (2000) 348-353.
[25] A. M. Sankpal, S. V. Kakatkar, N. D. Chaudhari, R. S. Patil, S. R.Sawant, J. Mater.
Sci. Mater. Sci. in Electronics 9 (1998) 173-179.
[26] J. Smit, H. P. J. Wijn, Ferrites, Philips Technical Library, Eindhoven,
Netherlands 1959.
[27] A. Globus. M Guyot, IEEE Trans. Magn., 6(1970) 614-617.
[28] A. Globus, M Guyot, Phys. Stat. Sol. (b), 52 (1972) 427-431.
[29] A. Globus, Paul Duplex and Marcel Guyot, IEEE Trans. Magn. MAG-7 (1971) 617-
622.
[30] Su-il Pyun, Jong-Tae Baek, Am. Ceram. Soc. Bull. 64 (1985) 602-605.
[31] A. Globus, P Duplex, Phys. Stat. Sol. 31 (1969) 875-881
[32] G. T. Rado, R. W. Wright, W. H. Emerson, Phys. Rev. 80 (1950) 273-280
[33] A. Verma, T. C. Goel, R. G. Mendiratta, P. Kishan, J. Magn. Magn. Mater. 208
(2000) 13-19.
[34] S. Chikazumi, Physics of Magnetism, Wiley, New York, 1964.
[35] C. Kittel, An introduction to Solid State Physics, 5th
Ed., Wiley, New York, London,
1976, P.170.
Page 237
[36] N. Rezlescu, E. Rezlescu, P. D. Popa, L. Rezlescu, J. Alloys Compd. 275- 277
(1998) 657-659.
[37] N. Rezlescu, E. Rezlescu, Solid State Commun. 88, 2, (1993) 139-141.
[38] Misbah ul-islam, Tahir Abbas, M. Ashraf Chaudhry, Mater. Lett. 53 (2002)
30-34.
[39] M.U. Islam, Faiza Aen, Shahida B. Niazi, M. Azhar Khan, M. Ishaque,
T. Abbas, M.U. Rana, Mater. Chem. Phys. 109 (2008) 482-487.
[40] D. S Birajdar, D. R. Mane, S. S. More, V. B. Kawade, K. M. Jadhav, J. Mater. Lett.
59 (2005) 2981-2985
[41] M. K. Shobanaa, S. Sankara, V. Rajendranb, Mater. Chem. Phys. 113 (2009) 10-13.
[42] A. K. M. Akhtar Hossain, S. T. Mahmud, M. Seki, T. Kawai, H. Tabata, J. Magn.
Magn. Mater. 312 (2007) 210-219.
[43] M. Z. Said, Mater. Lett. 34 (1998) 305-307.
[44] J.C. Maxwell, Electricity and Magnetism, Oxford University Press,
Landon, 1973.
[45] K.W. Wagner, Ann. Phys. 40 (1913) 817-825.
[46] C.G. Koop, Phys. Rev. 83 (1951) 121-127.
[47] N. Sivakumar, A. Narayanasamy, B. Jeyadevan, R. Justin Joseyphus, J. Phys. D:
Appl. Phys. 41 (2008) 245001-1 – 245001-5
[48] A. M. Abdeen, J. Magn. Magn. Mater. 192 (1999) 121-129.
[49] A. M. M. Farea, Shalendra Kumar, Khalid Mujasam Batoo, Ali Yousef, Chan Gyu
Lee, Alimuddin, J. Alloys Compd. 469 (2009) 451-457.
[50] D.C. Agarwal, Asian J. Phys. 6 (1997) 108-115.
[51] M. F. Fayek, M. K. Elnimr, F. Sayed Ahmed, S. S. Ata-Allah, M. Kaiser, Solid State
Commun. 115 (2000) 109-113.
[52] R. V. Mangalaraja, S. Ananthakumar, P. Manohar, F. D. Gnanam, J. Magn. Magn.
Mater. 253 (2002) 56-64.
[53] B. Parvatheeswara Rao, K. H. Rao, J. Mater. Sci. 32 (1997) 6049-6054.
[54] M. A. Ahmed, N. Okasha, M. M. El-Sayed, Ceram. Int. 33 (2007)
49-58.
[55] K. S. Nalwa, A. Garg, A. Upadhyaya, Mater. Lett. 62 (2008) 878-881
Page 238
[56] S. D. Chhaya, M. P. Pandya, M. C. Chhantbar, K. B. Modi, G. J. Baldha, H. H.
Joshi, J. Alloys Comp. 377 (2004) 155-161.
[57] Mansour Al-Haj, J. Magn. Magn. Mater. 299 (2006) 435-439.
[58] N. Okasha, Mater. Chem. Phys. 84 (2004) 63-70.
[59] N. Rezlescu, C. Doroftei, E. Rezlescu, P. D. Popa, Sensors and Actuators B 115
(2006) 589-595.
[60] C. B. Kolekar, P. N. Kamble, A. S. Vaingankar, J. Magn. Magn. Mater. 138
(1994) 211-215.
[61] P. P. Hankare, V. T. Vader, N. M. Patil, S. D. Jadhav, U. B. Sankpal, M. R. Kadam,
B. K. Chougule, N. S. Gajbhiye, Mater. Chem. Phys. 113 (2009) 233-238.
[62] M. U. Islam, M. A. Chaudhry, T. Abbas, M. Umar, Mater. Chem. Phys. 48 (1997)
227-229.
[63] B. K. Labde, Madan C. Sable, N. R. Shamkuwar, Mater. Lett. 57 (2003) 1651-1655.
[64] Qiang-Min Wei, Jian-Biao Li, Yong-Jun Chen, J. Mater. Sci. 36 (2001) 5115-5118.
[65] A. M. Shaikh, S. A. Jadhav, S. C. Watawe, B. K. Chougule, Mater. Lett. 44
(2000) 192-196.
[66] M. A. Ahmed, E. Ateia, S. I. El-Dek Vibrational Spectroscopy 30 (2002) 69-75.
[67] M. A. Ahmed, E. Ateia, F. M. Saleem, Physica B 381 (2006) 144-155.
[68] S. C. Watawe, B. D. Sutar, B. D. Sarwade, B. K. Chougule, Int. J. Inorg. Mater. 3
(2001) 819-823.
[69] S. A. Mazen, M. H. Abdallah, B. A. Sabrah, H. A. M. Hashem, Phys. Stat. Sol. (a)
134 (1992) 263-271.
[70] A. A. Sattar, A. M. Samy, R. S. El-Ezza and A. E. Eatah, Phys. Stat. Sol. (a) 193
(2002) 86-93.
[71] N. N. Jani, Bismal S. Trivedi, H. H. Joshi, R. G. Kulkarni, Hyperfine Interact.
110 (1997) 227-237.
[72] Mansour Al-Haj, Phys. Stat. Sol. (a) (2) 203 (2006) 343-348.
[73] Yaping Wang, Feng Xu, Liangchao Li, Hui Liu, Haizheng Qiu, Jiang Jing, Mater.
Chem. Phys. 112 (2008) 769-773.
[74] Ana Cristina, F. M. Costa, Marcio R. Morelli, Ruth H. G. A. Kiminami, J. Mater.
Sci. 39 (2004) 1773-1778.
Page 239
[75] L. Gama, A. P. Diniz, A. C. F. M. Costa, S. M. Rezende, A. Azevedo, D. R.
Cornejo, Physica B 384 (2006) 97-99.
[76] L. Ben Tahar, M. Artus, S. Ammar, L. S. Smiri, F. Herbst, M.-J. Vaulay,
V. Richard, J.-M. Greneche, F. Villain, F. Fievet, J. Magn. Magn.
Mater. 320 (2008) 3242-3250.
[77] B. Parvatheeswara Rao, K. H. Rao, P. S. V. Subba Rao, A. Mahesh Kumar, Y. L. N.
Murthy, K. Asokan, V. V. Siva Kumar, Ravi Kumar, N. S. Gajbhiye, O. F. Caltun,
Nucl. Instr. Meth. Phys. Res. B 244 (2006) 27-30.
[78] B. Parvatheeswara Rao, Ovidiu caltun, Ioan Dumitru, Leonard Spinu, J. Magn.
Magn. Mater. 304 (2006) e752-e754.
[79] Marshal Sparks, “Ferromagnetic relaxation theory” McGraw-Hill, New york 1964
P10.
[80] M. Yan, J. Hu, W. Luo, W.Y. Zhang, J. Magn. Magn. Mater. 303 (2006) 249–255.
[81] S. A. Ghodake, U. R. Ghodake, S. R. Sawant, S. S. Suryavanshi, P. P. Bakare, J.
Magn. Magn. Mater. 305 (2006) 110-119.
[82] VivekVerma, S. P. Gairola, Vibhav Pandey, J. S. Tawale, Hua Su, R. K. Kotanala, J.
Magn. Magn. Mater. 321 (2009) 3808-3812.
[83] S. E. Jacobo, W. G. Fano, A. C. Razzitte, Physica B 320 (2002) 261-263.
[84] N. Rezlescu, E. Rezlescu, C. Pasnicu and M. L. Craus, J. Magn. Magn. Mater. 136
(1994) 319-326.
[85] E. Rezlescu, N. Rezlescu, P. D. Popa, L. Rezlescu, C. Pasnicu, Phys. Stat. Sol. (a)
162 (1997) 673-678.
[86] M.U. Islam, T. Abbas, Shahid B. Niazi, Zubair Ahmad, Sadia Sabeen M.Ashraf
Chaudhry, Solid. State Commun.130 (2004) 353-356.
[87] M. Ishaque, M.U.Islam, M. Azhar Khan, I. Z. Rahman, A.Genson, S.Hampshire,
Physica B 405 (2010) 1532–1540.
[88] A. G Bhosale, B. K. Chougule, Mater. Lett. 60 (2006) 3912-3915
[89] E. J. W. Verwey and J. H. De Boer, Rec. Trans. Chim. des pays-Bas. 55 (1936)
531-540.
[90] Y. Purushotham, M. B. Reddy, Pran Kishan, D. R. Sagar, and P. Venugopal Reddy,
Mater. Lett. 17 (1993) 341-345.
Page 240
[91] M. Kaiser, and S. S. Ata Allah, Phys. Stat. Sol. (b) 15, 242 (2005) 3138-3148.
[92] R. G. Kharabe, R. S. Devan, C. M. Kanamadi, B. K. Chougule, Smart Mater. Struct.
15 (2006) N36.
[93] B. Kunar, G. P. Srivastava, J. Appl. Phys. 75 (10) (1994) 6115-6117.
[94] F. M. Pontes, E. R. Leite, E. Longo, J. A. Varela, E. B. Araujo and J. A. Eiras,
Appl. Phys. Lett. 76 (2000) 2433-2435.
[95] W. Jing, Z. Hong, B. Shuxin, C. Ke, Changrui, J. Magn. Magn. Mater, 312 (2007)
310-313.
[96] Kh. Roumaih, J. Alloys Comp. 465 (2008) 291-295.
[97] Muhammad Javed Iqbal, Zahoor Ahmad, J. Power Sources 179 (2008) 763-769.
[98] J. Azadmanjiri, Mater. Chem. Phys. 109 (2008) 109-112.
[99] M. B. Reddy, P. V. Reddy, J. Appl. Phys. (U.K.) 24 (1991) 975-981.
[100] M. K. Fayek, S. S. Ata –Allah, H. A. Zayed, M. Kaiser, S. M. Ismail, J. Alloys
Comp. 469 (2009) 9-14.
[101] S. S. Bellad, B. K. Chougule, Mater. Chem. Phys. 66 (2000) 58-63.
[102] S. C. Watawe, B. D. Sarwade, S. S. Bellad, B. D. Sutar, B. K. Chougule, J. Magn.
Magn. Mater, 214 (2000) 55-60.
Page 241
Appendix A
Conversion Factors
Principal unit systems in Magnetism[*]
Quantity Symbol SI
(Summerfield)
SI
(Kennelly)
CGS-EMU
(Gaussian)
Field H A.m-1
A.m-1
Oe (Oersted)
Induction B Tesla Tesla G (Gauss)
Magnetization M A.m-1
- emu. cm-3
Intensity of
Magnetization
I - Tesla -
Flux Φ weber Weber maxwell
Moment M A.m-1
Weber meter emu
Pole strength p A.m weber emu. cm-1
Field equation B = μ0 (H+M) B = μ0 H + I B = H + 4πM
Conversion Factors.
1 Oe = (1000 / 4 π). A. m-1
= 79.58 A. m-1
1 G = 10-4
Tesla
1 emu. cm-3
= 1000 A. m-1
[* ] D. Jiles, Introduction to Magnetism and Magnetic Materials, Chapman and Hall,
London, 1996, 11-12.
Page 242
Appendix B
Abbreviations, Symbols and Physical Constants
Ms Saturation magnetization
B Magnetic induction
μ Permeability
μi′ Relative initial permeability
Hc Coercivity
λ Wave length of X-ray
tanδ Loss factor
u Oxygen parameter
rA Tetrahedral ionic radius
rB Octahedral ionic radius
a Lattice constant
A-sites Tetrahedral sites
B-sites Octahedral sites
H Magnetic field
T Temperature
Tc Curie temperature
K1 Magnetocrystalline anisotropy constant
Dx X-ray density
Db Bulk density
M Molecular weight
N Avogadro’s number
P Percentage of porosity
f frequency
hkl Miller indices
ρt Density of toluene at the measurement temperature
Page 243
Wa Weight of the sample in air
Wt Weight of the sample in toluene
FMR Ferromagnetic resonance
∆H Linewidth
ρ Resistivity
έ Dielectric constant d Thickness of the pellet in meters
C Capacitance
FTIR Fourier Transform infrared Spectroscopy
N No. of turns of wound wire
n 0rder of reflection
Lm Self-inductance
Rm Intrinsic resistance
Z Impedance
VSM Vibrating Sample Magnetometer
SEM Scanning Electron Microscopy
EDX Energy Dispersive X-ray Spectroscopy
XRD X-ray Diffraction
d Interplaner spacing
Ea Activation energy
Page 244
List of Publications Published
1- M. Azhar Khan, M. U. Islam , M. Ishaque, I.Z. Rahman, Ceram. Int. 37 (2011)
2519- 2526.
2- M. Ishaque, M. U. Islam, M. Azhar Khan, I. Z. Rahman, A. Genson, S.
Hampshire, Physica B, 405 (2010) 1532-1540.
3- M. Azhar Khan, M. U. Islam, M. Ishaque, I. Z. Rahman, A. Genson, S.
Hampshire, Mater. Charact. 60 (2009) 73-78.
4- M.U. Islam, Faiza Aein, Shahida B. Niazi, M.Azhar Khan, M.Ishaque, T,Abbas
and M.U. Rana, Mater. Chem. Phys. 109 (2008) 482-487.
5- M.U.Islam, M.Azhar Khan, Zulfiqar Ali, Shahida B.Niazi, M. Ishaque and T.
Abbas, Int. J. Modern Phys. B Vol.21 No.15, (2007) 2669-2677.
Submitted
1-M. Azhar Khan, M. U. Islam, M. Ishaque, Magnetic, Electrical and Dielectric
properties of Terbium-substituted Nickel Ferrites.
2- Muhammad Azhar Khan, M. U. Islam, M. Ishaque, I.Z. Rahman, Magnetic and
Dielectric behavior of Terbium substituted Mg1-xTbxFe2O4 Ferrites.