158
PREPARED BY THE OFFICE OF INSTITUTIONAL RESEARCH AND PLANNING FACTBOOK 2020-21 PointPark.edu

PREPARED BY THE OFFICE OF INSTITUTIONAL RESEARCH AND PLANNING
FACTBOOK 2020-21
PointPark.edu

Table of Contents
TABLE OF CONTENTS Introduction ................................................................................................................... i
Foreword from the Office of Institutional Research and Planning ............................. i Academic Structure & University Organization ......................................................... ii Organizational Chart – Executive Office .................................................................. iii Academic Reporting Structure ................................................................................. iv
General Information ..................................................................................................... 1
History of the University ........................................................................................... 1 University Profile ...................................................................................................... 2 Point Park University Diversity Statement ................................................................ 5 Mission of Point Park University ............................................................................... 5 Vision of Point Park University ................................................................................. 5 Values of Point Park University ................................................................................ 6 Strategic Initiatives ................................................................................................... 7 Regional and Professional Accreditations and Approval.......................................... 8 Facts and Figures Summary, Fall 2020 .............................................................. 9-10 Campus Map .......................................................................................................... 10
Admissions and Financial Aid .................................................................................. 11
Admissions Summary and Trends ......................................................................... 12 New Enrollees by Demographic Characteristics, Fall 2020 ................................... 14 New Enrollees by Academic Division, Fall 2020 .................................................... 15 Full-time Undergraduate Transfers, Fall 2020 ....................................................... 16 Student Financial Aid ............................................................................................. 17
Enrollment .................................................................................................................. 19
Trends of Fall Headcount and FTE by Division ...................................................... 20 Enrollment Trends, Fall 2016 to Fall 2020, by: ................................................. 21-31
Student Type ................................................................................................ 21 Course Load and Division ............................................................................ 22
Gender and Division ..................................................................................... 23 Race/Ethnicity and Division .......................................................................... 24
Minority Status and Division ......................................................................... 26 Age and Division .......................................................................................... 27 Average Age by Student Type ..................................................................... 28
Residency and Division ................................................................................ 29 Undergraduate Students in Residence Halls ............................................... 30
Classification ................................................................................................ 31 Enrollment by School/Department and Degrees/Certificates ................................. 32 Enrollment by School/Department and Division, Fall 2020 .................................... 33 Enrollment Trends by Type, School/Dept, Major and Course Load ....................... 35 Enrollment Trends by Sch/Dept/Type/Major, New/Returning, Course Load .......... 48 Student Enrollment by School/Dept/Major & Demographics, Fall 2020 ................. 84 Enrollment of Residents/Commuters by School/Division, Fall 2020 ...................... 91 Enrollment Trends of International Students by Country of Origin ......................... 92 Enrollment Map with a focus on Southwestern PA Counties, Fall 2020 ................ 93

Table of Contents
Enrollment (continued) Enrollment Trends of Counties by School/Department .......................................... 94 Enrollment Map of Counties, Net Changes, SW-PA Focus ................................... 98 Enrollment Trends of W-PA Counties vs Other Counties & States ........................ 99 Enrollment, City of Pittsburgh vs Other Locations, Fall 2020 ............................... 100 Retention and Graduation Rates ............................................................................ 101 Overall Fall to Fall Retention Rates by Student Type: .................................. 102-103 First-time, Full-time Freshmen ............................................................ 102-103 New Regular Part-time Undergraduates ............................................. 102-103 New Full-time Undergraduate Transfers ............................................. 102-103 New Graduate Students ...................................................................... 102-103 New Online Undergraduates ............................................................... 102-103 New Online Graduates ........................................................................ 102-103 First-year Retention Rates by School/Dept, Fall 2015 to Fall 2019: ............. 104-109 First-time, Full-time Freshmen ................................................................... 104 New Regular Part-time Undergraduates .................................................... 105 New Full-time Undergraduate Transfers .................................................... 106 New Graduate Students ............................................................................. 107 New Online Undergraduates ...................................................................... 108 New Online Graduates ............................................................................... 109 Four-year and Six-year Graduation Rates by School/Dept .................................. 110 Retention Rate of Freshmen by Housing Status .................................................. 111 Retention Rate of On-ground Graduate Students by Course Load...................... 111 Retention Rate by Minority Status ........................................................................ 111 Retention Rate by Race ....................................................................................... 112 Retention Rate by Gender ................................................................................... 112 Retention Rate by Age ......................................................................................... 112 Academic Programs and Degrees Conferred ........................................................ 113 Trends in Degrees Conferred ............................................................................... 114 Degrees and Certificates Conferred by Academic School/Department ............... 115 Degrees and Certificates Awarded by Gender and Race/Ethnicity ...................... 116 Trends in Degrees Conferred by School/Dept/Major and Degree........................ 119 Degrees Offered ................................................................................................... 131 Total University Degree Programs Offered .......................................................... 135 Faculty and Staff ...................................................................................................... 136 Summary of Full-time Faculty and Staff ............................................................... 137 Gender Distribution of Full-time University Personnel.......................................... 138 Race/Ethnicity Distribution of Full-time University Personnel ............................... 139 Full-time Faculty by School/Department, Gender and Race/Ethnicity ................. 140 Full-time Faculty Salary by Rank ......................................................................... 140 Tenure Status of Full-time Faculty by School/Department ................................... 141 Full-time Faculty by Rank and Years of Service .................................................. 142 Endowment ............................................................................................................... 143 Endowment Values over Five Years .................................................................... 143

Introduction
Introduction
2020-21 Point Park University Factbook * i
INTRODUCTION Foreword from the Office of Institutional Research and Planning Recognizing that information is a key institutional resource, the Office of Institutional Research and Planning is responsible for providing the university management with information that supports institutional planning, university assessment, policy formation and decision making; for coordinating responses to inquiries for university-related information and serving as a comprehensive source for information about the institution. To that end, the purpose of this factbook is to provide accurate and timely information about significant aspects of the university and its operations. The 2020-21 Factbook is the sixteenth annual comprehensive report of data and information collected at Point Park University. It includes the most current information available for an academic or fiscal year, as well as pertinent historical information. Most of the information contained in the factbook is extracted from administrative reports produced on an annual basis by various university offices. The expert assistance and cooperation received from individuals in offices supplying factbook data is sincerely appreciated. We hope that you find this factbook both informative and useful. Any questions, comments, or concerns regarding this document may be directed to the Office of Institutional Research and Planning. Thank you for your interest in Point Park University and the information contained in this report. An electronic version of the factbook can be accessed at: http://www.pointpark.edu/About/AdminDepts/InstitutionalResearch/FactBook
Introduction
2020-21 Point Park University Factbook * ii
Academic Structure In recent years, there have been several changes to the structure of the academic organization. Most recently in 2020, non-degree professional development students taking education courses are being reported in a new department: Miscellaneous (within the School of Education). Prior to Fall 2020, these students were reported under Miscellaneous (within the School of Arts & Sciences). In Fall 2018, the School of Education was created, formerly a department within the School of Arts & Sciences. In 2017, the department of Humanities and Human Sciences (within the School of Arts & Sciences) split to become the department of Psychology, and the department of Humanities and Social Sciences. Also in 2017, the School of Business was reorganized into three departments: the department of Accounting, Economics and Finance, and Information Technology, the department of Business Management, and the department of Sports, Arts, and Entertainment Management. In 2015, the department of Literary Arts was created (formerly part of the department of Humanities and Human Sciences within the School of Arts & Sciences). In 2009, the School of Communication was created, formerly the Department of Journalism within the School of Arts & Sciences. In 2006, the department of Protective Services (now called the department of Criminal Justice and Intelligence Studies) was created from the former School of Adult and Professional Studies. Wherever possible in this factbook, data from prior years have been updated to reflect the current structure. When not possible, a notation is included. University Organization Point Park University is organized into two operational divisions: The Office of Academic Affairs and the Office of Finance and Operations. Each division is led by a senior vice president, who reports to the president, Dr. Paul Hennigan. Other senior leadership positions include the Vice President of External Affairs, Vice President of Enrollment, Vice President of Student Affairs, Vice President of Human Resources, Equity & Inclusion, Associate Vice President of Institutional Research and Strategic Planning, Assistant Vice President of Academic Affairs, and Associate Provost for Academic Excellence and Innovation. The Office of Academic Affairs includes all academic programs, faculty and academic support staff, as well as the Office of the Registrar, the Office of Institutional Research and Strategic Planning, the Library, the Division of Online Learning, the Pittsburgh Playhouse, and Alumni Engagement & Giving. This division is led by Dr. John Pearson, Senior Vice President of Academic and Student Affairs and Provost. The Office of Finance and Operations includes the Office of Human Resources; the Office of Business Services; the Office of Finance; Information Technology Services; the Office of Enrollment, which includes Full-time Admissions, Graduate Admissions, International Student Services and Enrollment, Enrollment Marketing, and Financial Aid; Public Safety; and Operations, which includes facilities, environmental health and safety, transportation and conference/events. This division is led by Bridget Mancosh, Senior Vice President for Finance and Operations.

Introduction
2020-21 Point Park University Factbook * iii
Point Park University Executive Office
Last modified 12/3/2020
Board of Trustees
Paul Hennigan, Ed.D.
President
John Pearson, Ph.D.
Provost and Sr. Vice President, Academic Affairs
Keith Paylo
Vice President for Student Affairs & Dean of Students
Chris Choncek
Associate Vice President for Institutional Research &
Planning
Nelson Chipman
Assistant Vice President for Academic Affairs
Bridget Mancosh
Sr. Vice President for Finance and Operations
Trudy Williams
Vice President for Enrollment
Lisa Stefanko
Vice President for HR, Equity & Inclusion
Jonas Prida
Associate Provost, Academic Excellence & Innovation
Mariann Geyer
Vice President for External Affairs
Melissa Lingsch
Administrative Assistant
Brenda Pearson
Executive Assistant, Finance & Operations & President's Office

Introduction
2020-21 Point Park University Factbook * iv
Point Park University Academic Reporting Structure
Last modified 2/23/2021
Academic Reporting Structure
School of Arts & Sciences
Dept. of Criminal Justice & Intelligence
StudiesMichael Botta,
Chair
Dept. of Humanities & Social Sciences
Channa Newman, Chair
Dept. of Literary Arts & Social Justice
Sarah Perrier, Chair
Dept. of Natural Sciences & Engineering Technology
Gregg Johnson, Chair
Dept. of PsychologyMatthew Allen,
Chair
Dept. of Community Engagement
Heather Starr Fiedler, Chair
School of Business
Steve Tanzilli, Dean
Dept. of Accounting, Applied Computer
Science, and Economics & Finance
Margie Gilfillan, Chair
Dept. of Business Management
Patrick Mulvihill, Chair
Dept. of Sports, Arts, & Entertainment Management
Robert Derda, Chair
Conservatory of Performing Arts
Steven Breese, Dean
Dept. of Dance
Garfield Lemonius, Chair
Dept. of Cinema Arts
Open Position, Chair
Dept. of Theatre
April Daras, Chair
School of Communication
Raymond "Bernie" Ankney,
Dean
Dept. of Communication
Thom Baggerman, Chair
School of Education
Darlene Marnich, Dean

General Information
General Information
2020-21 Point Park University Factbook * 1
GENERAL INFORMATION History of the University Throughout its history, Point Park University has taken pride in its urban roots and contributions to the vitality of downtown Pittsburgh. The University began as the Business Training College (BTC), which was founded in 1933 by Dr. Dorothy and L. Herbert Finkelhor as a proprietary school that prepared students for careers in the business world. BTC was located in downtown Pittsburgh. In 1960, the state of Pennsylvania chartered BTC as Point Park Junior College, a tax-exempt institution of higher education. The College was re-chartered as Point Park College in 1966 and began awarding bachelor’s degrees. Its first graduate program (journalism and communications) was established in 1981. Point Park was granted university status by the Pennsylvania Department of Education in October 2003. Point Park University acquired The Pittsburgh Playhouse (now Point Park University’s Pittsburgh Playhouse) in 1968. Its main campus remains in downtown Pittsburgh and includes more than 17 properties and affiliated locations, including academic, administrative and residence halls. To meet its growing needs, the University has acquired various downtown properties during the past several years. As one of the largest property owners in downtown Pittsburgh, Point Park’s footprint extends down the Wood Street corridor from the Monongahela River to Forbes Avenue. Approximately 3,600 students are enrolled at the University. The University’s presidents and their years of service: Dr. Dorothy C. Finkelhor 1960-1967 Arthur Blum 1967-1973 Dr. John V. Hopkins 1973-1986 Dr. J. Matthew Simon 1986-1995 Dr. James Oliver Hunter 1995-1997 Dr. Katherine Usher Henderson 1997-2006
Dr. Paul Hennigan 2006-

General Information
2020-21 Point Park University Factbook * 2
University Profile Located in Downtown Pittsburgh, Point Park University has a strong liberal arts tradition, and is classified as Master's Colleges & Universities: Larger Programs. Point Park enrolls approximately 3,600 full and part-time students in more than 100 undergraduate and graduate programs offered through its five schools. Its students represent 49 states/territories and 32 countries. Point Park offers bachelor’s and associate’s degrees in a number of majors, including accounting, acting, animation, applied computer science, behavioral sciences, biological sciences, broadcast production and media management, business administration, business management, cinema arts, cinema production, civil engineering technology, creative writing, criminal justice, dance (with concentrations in ballet, modern and jazz), economics and finance, early childhood education (assoc. only), education (preK-4), education (4th-8th grade), electrical engineering, electrical engineering technology, English, forensic science, funeral service, global cultural studies, graphic and interactive design, history, human resource management, instructional studies, intelligence and national security, interdisciplinary studies, journalism, legal studies, liberal studies, marketing and sales, mechanical engineering, mechanical engineering technology, multimedia, musical theatre, organizational leadership, photography, political science, psychology, public administration, public relations and advertising, screenwriting, secondary education (biological sciences, citizenship, English, mathematics, social studies), social justice studies, social media management, sports, arts and entertainment management, theatre arts, theatre production (stage management, design, technical design/management). The University also awards twenty-two master’s degrees and three doctorate degrees: the master of arts degree includes the following majors: adult learning and training, community psychology, communication technology, curriculum and instruction, educational administration, environmental journalism, intelligence and global security, media communication (documentary, journalism), organizational leadership, public relations and advertising, special education certification preK-12; the master of education degree includes: athletic coaching and administration, education with certification preK-4, secondary education certification grades 7-12, special education certification preK-12; the master of fine arts in writing for the screen and stage; the master of business administration; the master of science degree includes: criminal justice administration, engineering management, environmental studies, healthcare administration and management, information systems and business analytics; the doctor of education in leadership and administration; the doctor of philosophy in community engagement; and the doctor of psychology in clinical psychology. In addition, certificates are offered in intelligence and national security, public administration, reading specialist, school principal K-12, social media, and superintendent’s letter of eligibility.
Learning is an interactive process at Point Park where the average class size is between 15-20 students. Point Park University Online offers more than 20 online degree programs in a flexible format. University facilities include engineering technology, science and computer labs; a television studio; photo and cinema labs; dance studios; and a radio station. Performing arts majors gain practical experience at Point Park University’s Pittsburgh Playhouse.

General Information
2020-21 Point Park University Factbook * 3
Academic Village In recent years, the University launched the Academic Village at Point Park University, a multi-block living and learning hub that is transforming the University campus and the Downtown neighborhood it inhabits. It is redefining the student experience, campus life and Point Park’s connection to the community. As part of the Academic Village:
• Students, city residents and businesspeople are interacting in the Village Park, completed in 2011.
• 40,000 theatergoers attend performances at the Pittsburgh Playhouse, now located in the heart of Downtown Pittsburgh.
• Environmentally friendly building techniques are creating sustainable additions to a revitalized Downtown district and campus.
• The energy and vitality of the 24/7 Academic Village pulses across Downtown neighborhoods and unites Market Square and the Cultural District.
Central Campus Development Project Point Park’s vision is to be one of the most dynamic private, urban universities in America. The vision begins with facilities that give students, faculty, and staff the environment they need to excel. In 2011, Point Park completed the Village Park. Located at Wood Street and Boulevard of the Allies, the 12,000-square-foot park features a canopy of trees, colorful plantings, a stunning glass stair tower, a dramatic water feature and a colonnade structure as well as a lively restaurant featuring indoor and outdoor dining areas. In addition, the University completed Wood Street streetscape enhancements that include new sidewalks, pedestrian-friendly traffic signals and street resurfacing, in the fall of 2012. In 2016, the University opened the Center for Media Innovation, a state-of-the-art incubator and collaborative space featuring TV and radio/podcast studios, a photo studio, a multimedia newsroom, and a transformational presentation and gallery space. Point Park University’s Pittsburgh Playhouse In 1968, Point Park breathed new life into the Pittsburgh Playhouse by converting it into the University’s performing arts center. Now, Point Park has reinvigorated the Pittsburgh arts scene once again with the new Pittsburgh Playhouse on Forbes Avenue in Downtown Pittsburgh. This premier performance and teaching venue provides world-class professional spaces for both unconventional and classical presentations developed by the faculty, students and visiting artists of the Conservatory of Performing Arts. Students benefit from a truly professional theater experience provided by three new performance spaces. An adjacent 10,000-square-foot production area, costume and prop shops, and chorus and dressing rooms allow backstage and production students to study and learn in a real-world environment. George Rowland White Performance Center Point Park University is an institution that utilizes green principles as it renovates. The George Rowland White Performance Center, which opened in August 2007, was awarded Leadership in Energy and Environmental Design or LEED Gold, one of the highest levels of certification in the U.S. Green Building Council’s building performance program. The building is the first of its kind to receive LEED-NC Gold for new construction, according to USGBC statistics.

General Information
2020-21 Point Park University Factbook * 4
The George Rowland White Performance Center is a 44,000-square-foot space featuring cushioned, non-slip floor, glare-free lighting and the latest audio and visual equipment. It contains the Performance Studio, Hilda Willis Tap Studio, and three Dance Studios. Residence Halls The University’s residence halls include Conestoga, Lawrence, Pioneer and Thayer, as well as the Boulevard Apartments. Point Park University is recognized as a leader in the economic development of downtown Pittsburgh. Its students, faculty and staff contribute more than $73 million annually to the regional economy. The University’s residence halls comprise the largest residential complex in downtown Pittsburgh. Athletics Point Park University, which fields sixteen varsity sports teams, is a member of the National Association of Intercollegiate Athletics (NAIA). The teams include men’s and women’s golf, men’s and women’s soccer, men’s and women’s cross country, men’s and women’s indoor and outdoor track and field, men’s and women’s basketball, women’s volleyball, competitive cheer and dance, esports, softball and baseball, all of which compete in the River States Conference (RSC). Point Park’s teams are known as the Pioneers.
General Information
2020-21 Point Park University Factbook * 5
Point Park University Diversity Statement As an institution of higher education, Point Park University recognizes its responsibility to create and maintain an environment that affirms the diversity of people and ideas. Point Park University embraces, supports and actively pursues a policy of inclusiveness that recognizes, values and reflects the diversity of the community we serve and the world in which we live. To thrive as an academic institution, we believe we must foster a learning and working environment that encourages multiple perspectives and the open exchange of ideas in an unbiased and non-prejudicial way. Our commitment to diversity will make Point Park a welcoming place providing students, faculty, and staff with many opportunities to learn from each other. To this end we strive to attract students, develop curriculum, diversify our faculty and staff, and offer support services. We are consciously guided by our quest to achieve broad inclusiveness and afford equal opportunity to all without regard to gender, race, ethnicity, national origin, religion, age, socioeconomic background, sexual orientation or physical ability. Point Park University will vigorously pursue its diversity goals. As an institution, we are committed to accountability in our progress in making Point Park University a more diverse and inclusive community. Mission Statement Point Park University provides innovative undergraduate and graduate education in a dynamic urban setting. Dedicated to academic excellence and community engagement, we prepare students of diverse backgrounds with the knowledge, skill, and experience to lead meaningful lives as informed citizens and successful professionals. Vision Statement To be one of the most dynamic, private urban universities in America with an intense focus on student success through distinctive, innovative, and experiential learning.

General Information
2020-21 Point Park University Factbook * 6
Values Promoting academic excellence Point Park University inspires students to become life-long learners through its strong liberal arts core and diversity of majors. We are dedicated to continuously improving our programs and providing resources for our faculty and staff to remain leaders in their fields. Our highly qualified faculty, consisting of scholars with terminal degrees and practicing professionals, are central to maintaining academic excellence. Focusing on student needs Point Park University provides students with a career-focused education in a personalized, urban university environment. Our programs meet the needs of undergraduate students, graduate students, and working professionals. We are committed to providing the support services, facilities, and technology that ensure a quality student experience. Fostering a community of mutual respect and diversity Point Park University believes that a culture of mutual respect and diversity creates the optimal environment for learning. We encourage a culture of creativity and intellectual inquiry where ideas are openly discussed and debated. Point Park affords equal opportunity to all without regard to gender, race, ethnicity, national origin, religion, age, socioeconomic background, sexual orientation, or physical ability. Encouraging innovation Point Park University develops and adapts its innovative programs to ensure alignment with current business, industry, and government needs. We support new ideas and urge our students, faculty, and staff to become pioneers in their fields. Ensuring integrity and ethics in our actions Point Park University expects students, faculty, staff, and administrators to demonstrate the highest level of social responsibility, academic integrity, and professional ethics. Our values guide our decisions. Responding to our stakeholders Point Park University engages its internal and external stakeholders in key decision-making processes. We value opinions of our students, alumni, faculty, staff, and board members, and we recognize the mutual benefits of seeking partnerships with our business, government, nonprofit, and educational leaders in charting Point Park’s future. Facilitating civic engagement Point Park University embraces its unique role in the revitalization of downtown Pittsburgh and encourages students, faculty, and staff to become active community members. We promote involvement in service learning opportunities, professional associations, and internships.

General Information
2020-21 Point Park University Factbook * 7
Strategic Initiatives Academic Excellence • Elevate the academic profile of the University • Expand high quality online and hybrid programs to provide a Point Park education to
populations underserved by the University's on-ground program • Create opportunities for innovative, integrated learning • Elevate the regional and national profile of faculty • Promote Inclusive Excellence as a cultural and academic value • Implement and practice the tenets of shared governance across University operations Quality Student Experience • Connect every student with at least one meaningful experiential learning opportunity
each year • Develop a sense of community and pride throughout the University • Promote the connection between the liberal arts foundation and preparation for careers
now and throughout the lives of Point Park students • Foster a culture of respect, civility, and inclusivity in the Point Park community for all
students, staff, faculty, alumni, and administrators • Assure the highest quality of life on campus Managed Resources • Develop and implement an ongoing strategic enrollment plan that ties directly to a
financial plan that clearly demonstrates the operational vitality of the University and generates enough resources to reinvest in the University according to the Strategic Plan
• Leverage the University's brand to promote being on the cutting edge of innovation in communications, media, technology, business, and the arts, inside & outside of the classroom
• Adopt models of resource development and constituent engagement that align and support the University's strategic initiatives
• Grow the Board Designated Reserve Fund by 35 percent • Implement integrated strategies and systems designed to increase workplace
productivity by developing improved processes for attracting, developing, retaining, and utilizing people with the required skills and aptitude to meet the University's current and future needs
• Build the technological infrastructure to enhance our instructional and administrative needs
• Improve utilization of facilities and space • Develop a strategic planning assessment strategy to align resources with the plan • Optimize the efficient use of University resources across all levels of operations Community Engagement • Create opportunities for field studies to complement doctoral-level coursework • Leverage partnerships with the Allegheny Conference on Community Development,
government agencies to create relevant and impactful dissertation thesis project opportunities
• Utilize our facilities and programs to engage campus communities to advance our mission
• Emphasize the University's mission and focus on community engagement by attaining the "elective" Carnegie Classification for Community Engagement
• Establish influential and impactful constituent outreach and engagement • Strategic engagement with our alumni

General Information
2020-21 Point Park University Factbook * 8
Regional and Professional Accreditation and Approval Point Park University is an independent, four-year, coeducational university accredited by the Middle States Commission on Higher Education, 3624 Market Street, Philadelphia, PA 19104, 267-284-5000. Point Park University is also approved by the Pennsylvania Department of Education, 333 Market Street, Harrisburg, PA 17126, 717-783-6788. In the School of Business, programs leading to a Master of Business Administration degree, to a Master of Science in Healthcare Administration and Management degree, to a Bachelor of Science Post Baccalaureate degree in Accounting, Business Management and Human Resource Management, to a Bachelor of Science degree in Accounting, Applied Computer Science, Business Management, Economics and Finance, Human Resource Management, and Sports, Arts and Entertainment Management are accredited by the International Assembly of Collegiate Business Education (IACBE), 11374 Strang Line Road, Lenexa, KS, 66215, 913-631-3009. The programs in the School of Education leading to the Bachelor of Arts and the Bachelor of Science in Elementary, and Secondary Education, as well as the programs leading to the Master of Arts in Curriculum and Instruction, Educational Administration, and Special Education, and the Master of Education in Secondary Education and in Special Education are approved by the Pennsylvania Department of Education, 333 Market Street, Harrisburg, PA 17126, 717-783-6788. The Doctorate of Education in Leadership and Administration is an approved program by the Pennsylvania Department of Education. Point Park University’s Department of Education is able to recommend candidates for the Pennsylvania State Certificate for School Principal (K-12) or Superintendent Letter of Eligibility to those students who meet all the state’s requirements. In the School of Arts & Sciences, the Bachelor of Science programs in Civil Engineering Technology, Electrical Engineering Technology and Mechanical Engineering Technology are accredited by the Engineering Technology Accreditation Commission of ABET. The Bachelor of Science programs in Electrical Engineering and Mechanical Engineering are accredited by the Engineering Accreditation Commission of ABET (www.abet.org), 415 North Charles Street, Baltimore, MD 21201, 410-347-7700. Programs in the Conservatory leading to the Bachelor of Arts and Bachelor of Fine Arts in Dance are accredited by the National Association of Schools of Dance, 11250 Roger Bacon Drive, Suite 21, Reston, VA 20190, 703-437-0700.

General Information
2020-21 Point Park University Factbook * 9
Facts and Figures Summary, Fall 2020 Academic Divisions (and headcount) School of Arts and Sciences 791 Dept of Crim Justice&IntelStd 217 Dept of Humanities&Social Sci 90 Dept of Literary Arts 41 Dept of Nat Sci & Engr Tech 214 Dept of Psychology 175 Misc A&S (other programs) 54 School of Business 898 Dept of Acct,Econ-Fin,InfoTech 144 Dept of Business Management 533 Dept of Sports,Arts,Enter Mgt 221 School of Communication 364 Conservatory of Performing Arts 849 Dept of Cinema Arts 251 Dept of Dance 311 Dept of Theatre 287 Community Engagement 40 Education 649 Education 629 Misc Educ (professional devel.) 49 Degree Programs Offered Undergraduate 73 Graduate 25 Certificate 6 Total 104 Total Annual Budget (FY2020-21) $84.5 million Tuition and Fees (2020-21) Non-conservatory Undergraduate ($913/cr.hr.) $34,200/year Conservatory Undergraduate ($1,177/cr.hr.) $43,120/year Graduate $881/cr.hr. Graduate & Cert. Educ $530/cr.hr. Doctoral $925/cr.hr. Doctoral-Psy.D. $953/cr.hr. Online Undergraduate $499/cr.hr. Online Graduate $710/cr.hr. Online Graduate-Educ $530/cr.hr. Room and Board Room (average per year) $5,520 Board (14 meal plan) $6,240 Financial Aid Profile (Final 2019-20) Students Receiving Aid 89% Average Grants (for freshmen) $22,770 Average Loans (for freshmen) $4,712 Average Work-study $2,216 Range of awards $3,000 to $19,000 Total Student Aid $101,152,682
Fall 2020 Admissions First-time, Full-time Freshman 519 Full-time Transfers/Readmits 152 Part-time Undergraduate 21 Online Undergraduate 105 Online Graduate 202 New Graduate 130 Total New 1,129 Students Fall 2020 Enrollment Regular Undergraduate 2,425 Online Undergraduate 366 Online Graduate 455 Graduate 316 Professional Development-GR 29 Total Enrollment 3,591 Course Load Full-time Undergrad Enrollment 2,410 Part-time Undergrad Enrollment 381 Full-time Graduate Enrollment 170 Part-time Graduate Enrollment 630 Enrollment, Race/Ethnicity & Gender American Indian/Alaska Native 6 Asian 47 Black or African American 481 Hispanic of any race 195 Native Hawaiian/Pacific Islander 4 Non-resident Alien 100 White 2,588 Two or more races 141 Unknown 29 Female 2,228 Male 1,363 Domicile In-state Enrollment 2,657 Out-of-state Enrollment 934 Residential Population All Students Living On Campus 795 Student to Faculty Ratio 12 to 1 Fresh. To Soph. Retention Rate 73% 6-Year Graduation Rate 55%

General Information
2020-21 Point Park University Factbook * 10
Facts & Figures Summary, Fall 2020 (cont.) Faculty and Staff Full-time Instructional Faculty 144 Part-time Instructional Faculty 323 Full-time Staff 263 Part-time Staff 125 Graduate Assistants 32 Student Employees (Work Study, Apprentice, Honors) 242 Total Faculty and Staff 1,129
Total Veterans Enrolled (Fall 2020) 82 Total Alumni (w/degrees conferred) 31,131 Campus Properties & Affiliated Locations 17

Admissions and Financial Aid

Admissions and Financial Aid
2020-21 Point Park University Factbook * 11
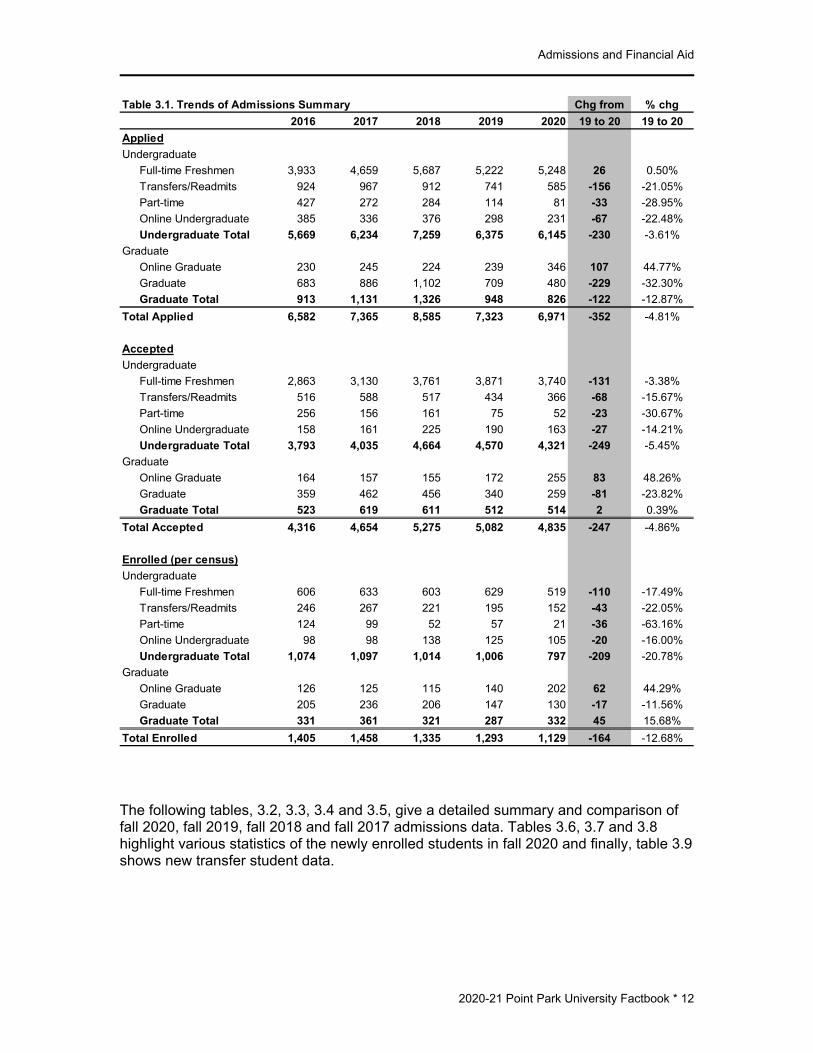
ADMISSIONS Overall, applications for admissions to Point Park University decreased from fall 2019 to fall 2020 (-4.81%). At the undergraduate level, fall 2020 applications decreased by 230 or -3.61% (from 6,375 to 6,145) over the prior year. The online graduate applications show an increase of +44.77% (table 3.1). Point Park University has about a 71% acceptance rate for full-time freshmen (table 3.2). The fall 2020 acceptance rate for graduate programs is 62% (table 3.2). Of all the 1,129 newly enrolled students, 63% (708) are female and 14% (157) are Black or African-American (table 3.6). The average age for full-time freshmen is 18 (table 3.7). The average age for full-time transfers/readmits, new part-time undergraduates and graduate students is 23, 31 and 32 respectively, while the average age for online undergraduates is 37 and the average age for online graduates is 34 (table 3.7). Of all the new students, 73% (821) come from Pennsylvania (table 3.7). The Conservatory of Performing Arts enrolls the majority of the new undergraduates at 28%; the School of Arts & Sciences enrolls 26%; the School of Business enrolls 22%; while the School of Communication and the School of Education each enrolls 12% of the new undergraduates (table 3.8). Of the new graduate students, the School of Education enrolls 57%; the School of Business enrolls 18%; the School of Arts & Sciences enrolls 14%; the School of Communication enrolls 6%; the Conservatory of Performing Arts enrolls 3%; and Community Engagement enrolls 2% of the new graduate students (table 3.8). More detailed information of fall 2020 admissions data can be found on the following pages.
Admissions and Financial Aid
2020-21 Point Park University Factbook * 12
The following tables, 3.2, 3.3, 3.4 and 3.5, give a detailed summary and comparison of fall 2020, fall 2019, fall 2018 and fall 2017 admissions data. Tables 3.6, 3.7 and 3.8 highlight various statistics of the newly enrolled students in fall 2020 and finally, table 3.9 shows new transfer student data.
Table 3.1. Trends of Admissions Summary Chg from % chg2016 2017 2018 2019 2020 19 to 20 19 to 20
AppliedUndergraduate
Full-time Freshmen 3,933 4,659 5,687 5,222 5,248 26 0.50%Transfers/Readmits 924 967 912 741 585 -156 -21.05%Part-time 427 272 284 114 81 -33 -28.95%Online Undergraduate 385 336 376 298 231 -67 -22.48%Undergraduate Total 5,669 6,234 7,259 6,375 6,145 -230 -3.61%
GraduateOnline Graduate 230 245 224 239 346 107 44.77%Graduate 683 886 1,102 709 480 -229 -32.30%Graduate Total 913 1,131 1,326 948 826 -122 -12.87%
Total Applied 6,582 7,365 8,585 7,323 6,971 -352 -4.81%
AcceptedUndergraduate
Full-time Freshmen 2,863 3,130 3,761 3,871 3,740 -131 -3.38%Transfers/Readmits 516 588 517 434 366 -68 -15.67%Part-time 256 156 161 75 52 -23 -30.67%Online Undergraduate 158 161 225 190 163 -27 -14.21%Undergraduate Total 3,793 4,035 4,664 4,570 4,321 -249 -5.45%
GraduateOnline Graduate 164 157 155 172 255 83 48.26%Graduate 359 462 456 340 259 -81 -23.82%Graduate Total 523 619 611 512 514 2 0.39%
Total Accepted 4,316 4,654 5,275 5,082 4,835 -247 -4.86%
Enrolled (per census)Undergraduate
Full-time Freshmen 606 633 603 629 519 -110 -17.49%Transfers/Readmits 246 267 221 195 152 -43 -22.05%Part-time 124 99 52 57 21 -36 -63.16%Online Undergraduate 98 98 138 125 105 -20 -16.00%Undergraduate Total 1,074 1,097 1,014 1,006 797 -209 -20.78%
GraduateOnline Graduate 126 125 115 140 202 62 44.29%Graduate 205 236 206 147 130 -17 -11.56%Graduate Total 331 361 321 287 332 45 15.68%
Total Enrolled 1,405 1,458 1,335 1,293 1,129 -164 -12.68%

Admissions and Financial Aid
2020-21 Point Park University Factbook * 13
Table 3.2. Trends of Admissions Summary, Fall 2020Applied Accepted Enrolled (per census)Number Number % of Applied Number % of Accepted
Full-time Freshmen 5,248 3,740 71% 519 14%Transfers/Readmits 585 366 63% 152 42%Part-time 81 52 64% 21 40%Online Undergraduate 231 163 71% 105 64%Undergraduate Total 6,145 4,321 70% 797 18%Online Graduate 346 255 74% 202 79%Graduate 480 259 54% 130 50%Graduate Total 826 514 62% 332 65%University Total 6,971 4,835 69% 1,129 23%
Table 3.3. Trends of Admissions Summary, Fall 2019Applied Accepted Enrolled (per census)Number Number % of Applied Number % of Accepted
Full-time Freshmen 5,222 3,871 74% 629 16%Transfers/Readmits 741 434 59% 195 45%Part-time 114 75 66% 57 76%Online Undergraduate 298 190 64% 125 66%Undergraduate Total 6,375 4,570 72% 1,006 22%Online Graduate 239 172 72% 140 81%Graduate 709 340 48% 147 43%Graduate Total 948 512 54% 287 56%University Total 7,323 5,082 69% 1,293 25%
Table 3.4. Trends of Admissions Summary, Fall 2018Applied Accepted Enrolled (per census)Number Number % of Applied Number % of Accepted
Full-time Freshmen 5,687 3,761 66% 603 16%Transfers/Readmits 912 517 57% 221 43%Part-time 284 161 57% 52 32%Online Undergraduate 376 225 60% 138 61%Undergraduate Total 7,259 4,664 64% 1,014 22%Online Graduate 224 155 69% 115 74%Graduate 1,102 456 41% 206 45%Graduate Total 1,326 611 46% 321 53%University Total 8,585 5,275 61% 1,335 25%
Table 3.5. Trends of Admissions Summary, Fall 2017Applied Accepted Enrolled (per census)Number Number % of Applied Number % of Accepted
Full-time Freshmen 4,659 3,130 67% 633 20%Transfers/Readmits 967 588 61% 267 45%Part-time 272 156 57% 99 63%Online Undergraduate 336 161 48% 98 61%Undergraduate Total 6,234 4,035 65% 1,097 27%Online Graduate 245 157 64% 125 80%Graduate 886 462 52% 236 51%Graduate Total 1,131 619 55% 361 58%University Total 7,365 4,654 63% 1,458 31%

Admissions and Financial Aid
2020-21 Point Park University Factbook * 14
Table 3.6. New Enrollees by Gender and Ethnicity, Fall 2020
Am.Indian/ Black or Hispanic Nat Hawaiian Non-res.Two or more Un-
Total Female Male Alaska Nat. Asian Afri.Am. any race /Pacific Isl. Alien White races knownUndergraduateFull-time Freshmen 519 341 178 2 13 76 36 1 13 342 30 6Transfers/Readmits 152 75 77 2 4 18 12 0 7 100 4 5Part-time 21 9 12 0 0 5 1 0 0 14 0 1Online Undergraduate 105 68 37 0 1 16 4 0 0 80 3 1Online Graduate 202 140 62 0 2 30 2 1 0 159 4 4Graduate 130 75 55 0 0 12 7 0 8 94 3 6University Total 1,129 708 421 4 20 157 62 2 28 789 44 23
Gender Ethnicity
Table 3.7 New Enrollees by Age and Residency, Fall 2020
Non- Mean Residence In-Total Traditional Traditional Unknown Age Halls Commuter State
UndergraduateFull-time Freshmen 519 516 3 0 18 410 109 298Transfers/Readmits 152 120 32 0 23 28 124 114Part-time 21 4 17 0 31 0 21 18Online Undergraduate 105 16 89 0 37 0 105 98Online Graduate 202 34 167 1 34 1 201 190Graduate 130 43 86 1 32 2 128 103University Total 1,129 733 394 2 25 441 688 821
Traditional (18-24 years old)Non-Traditional (25 years or older)
Age Residency

Admissions and Financial Aid
2020-21 Point Park University Factbook * 15
Table 3.8. New Enrollees by Academic Division, Fall 2020Communication CommEng
Total CJIS HUMA LIT NSET PSY UND AEI MGT SAEM COMM CINE DANC THEA CEN EDUC EDMSUndergraduateFull-time Freshmen 519 32 10 1 38 28 29 17 45 35 66 40 77 81 0 20 0Transfers/Readmits 152 12 4 1 16 11 2 12 19 17 27 10 4 12 0 5 0Part-time 21 3 2 0 4 3 4 0 2 0 0 0 1 1 0 1 0Online Undergrad 105 6 0 0 0 0 0 5 25 0 3 0 0 0 0 66 0Undergrad Total 797 53 16 2 58 42 35 34 91 52 96 50 82 94 0 92 0
12.0%
GraduateOnline Graduate 202 7 0 0 0 0 2 0 35 0 5 0 0 0 0 153 0Graduate 130 9 0 0 8 20 0 0 23 0 15 10 0 0 8 13 24Graduate Total 332 16 0 0 8 20 2 0 58 0 20 10 0 0 8 166 24
6.0% 2.4%
University Total 1,129 69 16 2 66 62 37 34 149 52 116 60 82 94 8 258 24
Fall 2020 Total% of Total (Dept) 100.0% 6.1% 1.4% 0.2% 5.8% 5.5% 3.3% 3.0% 13.2% 4.6% 10.3% 5.3% 7.3% 8.3% 0.7% 22.9% 2.1%% of Total (School) 100.0% 10.3% 0.7%
List of Academic Division Abbreviations:CJIS: Criminal Justice & Intelligence Studies (within the School of Arts & Sciences)HUMA: Humanities & Social Sciences (within the School of Arts & Sciences)LIT: Literary Arts (within the School of Arts & Sciences)NSET: Natural Sciences & Engineering Technology (within the School of Arts & Sciences)PSY: Psychology (within the School of Arts & Sciences)UND: Undecided or Non-Degree (within the School of Arts & Sciences)AEI: Accounting, Economics & Finance, and Information Technology (within the School of Business)MGT: Business Management (within the School of Business)SAEM: Sports, Arts, and Entertainment Management (within the School of Business)COMM: School of CommunicationCINE: Cinema Arts (within the Conservatory of Performing Arts)DANC: Dance (within the Conservatory of Performing Arts)THEA: Theatre (within the Conservatory of Performing Arts)CEN: Community EngagementEDUC: Dept. of Education (within the School of Education)EDMS: Miscellaneous or Non-Degree (within the School of Education)
Education
11.5%
57.2%
25.0%
% of GR Total (School) 13.9% 17.5% 3.0%
22.3% 20.8% 20.9%
Arts & Sciences Business Conserv. of Perf. Arts
% of UG Total (School) 25.8% 22.2% 28.4%

Admissions and Financial Aid
2020-21 Point Park University Factbook * 16
Table 3.9 New Full-time Undergraduate Transfers, Fall 2020Four-Year Institutions Number of Transfers
Edinboro University 3Clarion University of PA 2Duquesne University 2Penn State University 2West Virginia Univ 2
Total Four-Year Institutions (with two or more registrants) 11
Two-Year InstitutionsComm. Coll of Allegheny County (C.C.A.C.) - Main Campus 24CCAC North Campus 15CCAC South Campus 8Butler Co. Community College 5CCAC Boyce Campus 4Eastern Gateway Community College 2Moorpark College 2Pittsburgh Institute of Mortuary Science 2
Total Two-Year Institutions (with two or more registrants) 62

Admissions and Financial Aid
2020-21 Point Park University Factbook * 17
STUDENT FINANCIAL AID Table 3.10 shows undergraduates receiving financial aid changes only slightly (between 93% and 96%) over the last several fall semesters while graduates receiving financial aid has decreased from 80% to 70% from fall 2017 to fall 2019. The total amount of financial aid received by Point Park University’s students in academic year 2019-2020 represents a -1.95% decrease over academic year 2018-2019, from $103,159,537 to $101,152,683. And, the average award total increased +11.16% from $25,081 to $27,881 (table 3.11).
Table 3.10. Percent of Students Receiving Financial Aid (reporting Fall numbers only)
Fall 2015 Fall 2016 Fall 2017 Fall 2018 Fall 2019
Undergraduate 94% 93% 96% 94% 95%
Graduate 81% 80% 80% 74% 70%

Admissions and Financial Aid
2020-21 Point Park University Factbook * 18
Table 3.11. Student Financial Aid By Award Type (reporting Final Academic Year numbers)
2015-2016 2016-2017 2017-2018 2018-2019 2019-2020Student Aid Grand Total $91,406,816 $95,484,839 $102,909,281 $103,159,537 $101,152,683Number of Students 3489 3654 4305 4113 3628Average Award $26,198.57 $26,131.59 $23,904.59 $25,081.34 $27,881.11
Federal Aid TotalPell Grant
Total Aid Awarded $4,883,755 $5,034,061 $5,930,411 $6,158,295 $5,787,552Number of Awards 1277 1282 1397 1394 1267Average Awards $3,824.40 $3,926.72 $4,245.10 $4,417.72 $4,567.92
Federal Perkins Loan 3
Total Aid Awarded $204,345 $174,250 $173,750 $0 $0Number of Awards 288 193 192 0 0Average Awards $709.53 $902.85 $904.95 $0.00 $0.00
Supplemental Grants (FSEOG)Total Aid Awarded $301,625 $251,424 $350,750 $303,375 $286,627Number of Awards 342 286 379 337 325Average Awards $881.94 $879.10 $925.46 $900.22 $881.93
Federal Work-StudyTotal Aid Awarded $448,119 $373,000 $381,623 $390,688 $435,649Number of Awards 597 275 262 282 291Average Awards $750.62 $1,356.36 $1,456.58 $1,385.42 $1,497.08
Federal Stafford/Direct Subsidized Loan 1
Total Aid Awarded $9,029,812 $8,827,035 $9,011,631 $9,124,107 $8,710,654Number of Awards 2201 2153 2234 2208 2020Average Awards $4,102.60 $4,099.88 $4,033.85 $4,132.29 $4,312.20
Parent LoanTotal Aid Awarded $7,693,554 $7,426,663 $8,209,500 $8,181,141 $8,612,250Number of Awards 526 528 572 573 534Average Awards $14,626.53 $14,065.65 $14,352.27 $14,277.73 $16,127.81
Federal Graduate PLUS LoanTotal Aid Awarded $61,012 $132,875 $145,296 $165,284 $403,183Number of Awards 16 14 13 16 24Average Awards $3,813.25 $9,491.07 $11,176.62 $10,330.25 $16,799.29
Federal Stafford/Direct Unsubsidized LoansTotal Aid Awarded $18,577,419 $20,155,278 $20,785,772 $19,053,626 $16,958,042Number of Awards 3038 3022 3199 2977 2750Average Awards $6,115.02 $6,669.52 $6,497.58 $6,400.28 $6,166.56
Other Aid TotalInstitutional Scholarships
Total Aid Awarded $36,354,822 $39,140,223 $43,474,281 $45,373,220 $45,328,671Other Grants & Scholarships 2
Total Aid Awarded $7,250,031 $7,196,155 $7,132,381 $6,629,397 $5,816,681Other Loan Programs
Total Aid Awarded $5,666,648 $5,841,590 $6,523,448 $7,215,639 $8,360,874Other Work Programs
Total Aid Awarded $935,674 $932,285 $790,438 $564,765 $452,500
2 Beginning with the 2014-2015 academic year, certain veteran's benefits are no longer reported by financial aid3 Beginning with the 2018-2019 academic year, the Federal Perkins loan was not funded by the government
1 Beginning with the 2012-2013 academic year, graduate students were no longer eligible for the Federal Subsidized Loan.

Enrollment

Enrollment
2020-21 Point Park University Factbook * 19
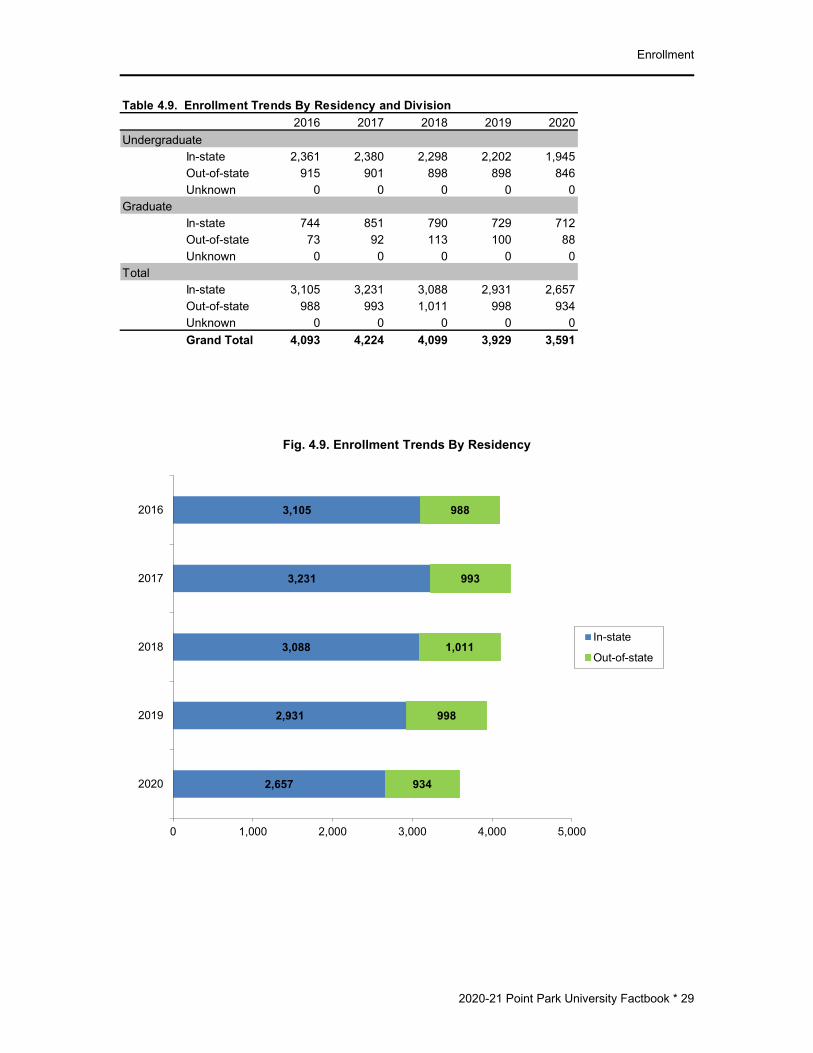
ENROLLMENT Enrollment decreased over last year by -9% (from 3,929 to 3,591) (table 4.1). Of the 3,591 students enrolled, 78% (2,791 headcount) are undergraduate students and 22% (800 headcount) are graduate students (table 4.1). Some other highlights include the fact that approximately 86% of undergraduate students are full-time, while only 21% of graduate students are full-time (table 4.3). The majority (74%) of Point Park’s students come from Pennsylvania, (table 4.9). Also, the number of undergraduate students living on campus in student housing decreased by -32%. There are now 791 undergraduate students living on campus as compared to 1,043 last year (table 4.10). This represents 28% of the entire undergraduate student body. Further, 79% of all full-time freshmen are living in campus housing. Point Park remains an ethnically diverse university and its international student population represents 31 different countries (table 4.18). Overall, 58 percent (2,086 headcount) of our students are from Southwestern PA counties (fig. 4.15). Within each school, 70% of Business, 69% of Communication, 62% of Education, 65% of Arts & Sciences, 30% of the Conservatory of Performing Arts, and 83% of Community Engagement are from southwest PA (table 4.19). Southwest PA enrollment has decreased -28% compared to fall 2011 (table 4.20). This section includes a glance at fall 2020 enrollment data, as well as a detailed account of student enrollment trends over the past five years by various demographic features. For clarification purposes, some enrollment definitions are listed below.
Enrollment Definitions: Student enrollment in higher education is described in terms of both headcount and FTE (Full-time Equivalence). Student headcount is the count of individual students whose administrative records indicate that they were registered in a credit-bearing course as of the university’s enrollment census date for each semester. The Fall 2020 enrollment census date was September 18, 2020.
Student FTE is calculated using two different methods: Method 1: Undergraduate FTE = FT headcount + (PT Credit Hours/15)
Graduate FTE = FT headcount + (PT Credit Hours/10) Method 2: Undergraduate and Graduate FTE = FT headcount + (1/3 PT headcount)
Full-time Status - An individual student is classified as full-time if he or she maintains at least 12 undergraduate credits or 9 graduate credits.

Enrollment
2020-21 Point Park University Factbook * 20
Table 4.1. Trends of Fall Headcount And FTE by Division
2016 2017 2018 2019 2020 2016 2017 2018 2019 2020 2016 2017 2018 2019 2020Undergraduate 3,276 3,281 3,196 3,100 2,791 2,929 2,966 2,930 2,814 2,560 2,899 2,932 2,898 2,784 2,537Graduate 817 943 903 829 800 549 644 614 526 505 427 502 483 412 380Total 4,093 4,224 4,099 3,929 3,591 3,478 3,610 3,544 3,340 3,065 3,326 3,434 3,381 3,196 2,917
* Fall headcount and FTE are based on census data.GR = FT Headcount + PT CrHrs/10 GR = FT + (1/3 PT)
Fall Headcount* Full-time Equivalancy (FTE)* (using CrHrs) Full-time Equivalancy (FTE)* (using FT+1/3PT)
UG = FT Headcount + PT CrHrs/15 UG = FT + (1/3 PT)
4,0934,224
4,0993,929
3,5913,4783,610 3,544
3,3403,065
3,326 3,434 3,3813,196
2,917
0
500
1,000
1,500
2,000
2,500
3,000
3,500
4,000
4,500
2016 2017 2018 2019 2020
Fig. 4.1. Student Enrollment Trends 2016 through 2020
Fall Headcount*
Fall FTE* (CrHrs)
Fall FTE* (FT+1/3PT)
Enrollment
2020-21 Point Park University Factbook * 21
Enrollment Trends
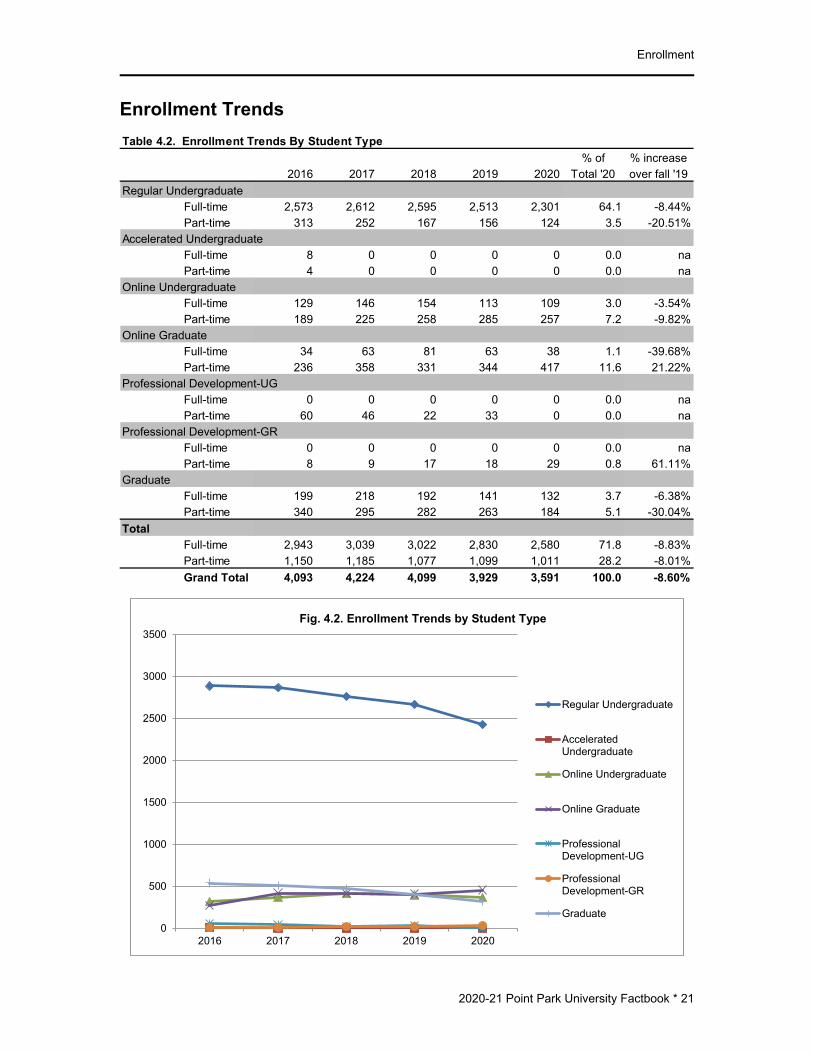
Table 4.2. Enrollment Trends By Student Type% of % increase
2016 2017 2018 2019 2020 Total '20 over fall '19Regular Undergraduate
Full-time 2,573 2,612 2,595 2,513 2,301 64.1 -8.44%Part-time 313 252 167 156 124 3.5 -20.51%
Accelerated UndergraduateFull-time 8 0 0 0 0 0.0 naPart-time 4 0 0 0 0 0.0 na
Online UndergraduateFull-time 129 146 154 113 109 3.0 -3.54%Part-time 189 225 258 285 257 7.2 -9.82%
Online GraduateFull-time 34 63 81 63 38 1.1 -39.68%Part-time 236 358 331 344 417 11.6 21.22%
Professional Development-UGFull-time 0 0 0 0 0 0.0 naPart-time 60 46 22 33 0 0.0 na
Professional Development-GRFull-time 0 0 0 0 0 0.0 naPart-time 8 9 17 18 29 0.8 61.11%
GraduateFull-time 199 218 192 141 132 3.7 -6.38%Part-time 340 295 282 263 184 5.1 -30.04%
TotalFull-time 2,943 3,039 3,022 2,830 2,580 71.8 -8.83%Part-time 1,150 1,185 1,077 1,099 1,011 28.2 -8.01%Grand Total 4,093 4,224 4,099 3,929 3,591 100.0 -8.60%
0
500
1000
1500
2000
2500
3000
3500
2016 2017 2018 2019 2020
Fig. 4.2. Enrollment Trends by Student Type
Regular Undergraduate
AcceleratedUndergraduate
Online Undergraduate
Online Graduate
ProfessionalDevelopment-UG
ProfessionalDevelopment-GR
Graduate

Enrollment
2020-21 Point Park University Factbook * 22
Table 4.3. Enrollment Trends By Course Load and Division2016 2017 2018 2019 2020
UndergraduateFull-time 2,710 2,758 2,749 2,626 2,410Part-time 566 523 447 474 381
GraduateFull-time 233 281 273 204 170Part-time 584 662 630 625 630
TotalFull-time 2,943 3,039 3,022 2,830 2,580Part-time 1,150 1,185 1,077 1,099 1,011Grand Total 4,093 4,224 4,099 3,929 3,591
2710 2758 27492626
2410
233 281 273204 170
566 523 447 474 381
584 662 630 625 630
0
500
1000
1500
2000
2500
3000
2016 2017 2018 2019 2020 2016 2017 2018 2019 2020
Undergraduate Graduate
Fig. 4.3. Enrollment Trends by Course Load and Division
Full-time
Part-time

Enrollment
2020-21 Point Park University Factbook * 23
Table 4.4. Enrollment Trends By Gender and Division2016 2017 2018 2019 2020
UndergraduateFemale 1,905 1,935 1,913 1,903 1,714Male 1,371 1,346 1,283 1,197 1,077
GraduateFemale 523 586 530 492 514Male 294 357 373 337 286
TotalFemale 2,428 2,521 2,443 2,395 2,228Male 1,665 1,703 1,656 1,534 1,363Grand Total 4,093 4,224 4,099 3,929 3,591
24282521 2443 2395
2228
1665 1703 16561534
1363
0
500
1000
1500
2000
2500
3000
2016 2017 2018 2019 2020
Fig. 4.4. Enrollment Trends by Gender (all students)
Female
Male

Enrollment
2020-21 Point Park University Factbook * 24
Table 4.5. Enrollment Trends By New Race/Ethnicity and Division2016 2017 2018 2019 2020
UndergraduateAmerican Indian/Alaska Native 12 8 7 5 6Asian 49 54 50 41 43Black or African American 465 478 437 430 366Hispanic of any race 84 68 188 189 172Native Hawaiian/Other Pacific Islander 8 9 2 2 3Non-resident Alien 156 130 112 102 77White 2,343 2,345 2,278 2,183 1,984Two or more races 139 162 112 132 123Unknown 20 27 10 16 17
GraduateAmerican Indian/Alaska Native 3 2 5 2 0Asian 6 8 10 9 4Black or African American 159 163 133 124 115Hispanic of any race 5 7 21 19 23Native Hawaiian/Other Pacific Islander 1 1 0 0 1Non-resident Alien 25 34 55 41 23White 580 694 655 608 604Two or more races 17 13 13 18 18Unknown 21 21 11 8 12
TotalAmerican Indian/Alaska Native 15 10 12 7 6Asian 55 62 60 50 47Black or African American 624 641 570 554 481Hispanic of any race 89 75 209 208 195Native Hawaiian/Other Pacific Islander 9 10 2 2 4Non-resident Alien 181 164 167 143 100White 2,923 3,039 2,933 2,791 2,588Two or more races 156 175 125 150 141Unknown 41 48 21 24 29
Grand Total: 4,093 4,224 4,099 3,929 3,591

Enrollment
2020-21 Point Park University Factbook * 25
0% 1%
14%
3%0%
3%
76%
2% 2%0% 2%
13%
6%
0%3%
71%
4%
1%0%
10%
20%
30%
40%
50%
60%
70%
80%
Am.In
dian
/Ala
ska
Nat
ive
Asia
n
Blac
k or
Afri
can
Amer
ican
His
pani
c of
any
race
Nat
.Haw
aiia
n/Pa
cific
Isl.
Non
-resi
dent
Alie
n
Whi
te
Two
or m
ore
race
s
Unk
now
n
Fig. 4.5. Fall 2020 Enrollment By New Race/Ethnicity
Graduate
Undergraduate

Enrollment
2020-21 Point Park University Factbook * 26
Table 4.6. Enrollment Trends By Minority Status and Division2016 2017 2018 2019 2020
UndergraduateMinority 757 779 796 799 713White 2,343 2,345 2,278 2,183 1,984Non-Res. Alien 156 130 112 102 77Unknown 20 27 10 16 17
GraduateMinority 191 194 182 172 161White 580 694 655 608 604Non-Res. Alien 25 34 55 41 23Unknown 21 21 11 8 12
TotalMinority 948 973 978 971 874White 2,923 3,039 2,933 2,791 2,588Non-Res. Alien 181 164 167 143 100Unknown 41 48 21 24 29Grand Total 4,093 4,224 4,099 3,929 3,591
23.2%24.3%
0.0%
5.0%
10.0%
15.0%
20.0%
25.0%
30.0%
Fall 2016 Fall 2020
Fig. 4.6. Enrollment by Minority Status For ALL Students, Comparing Fall 2016 to Fall 2020
Enrollment
2020-21 Point Park University Factbook * 27
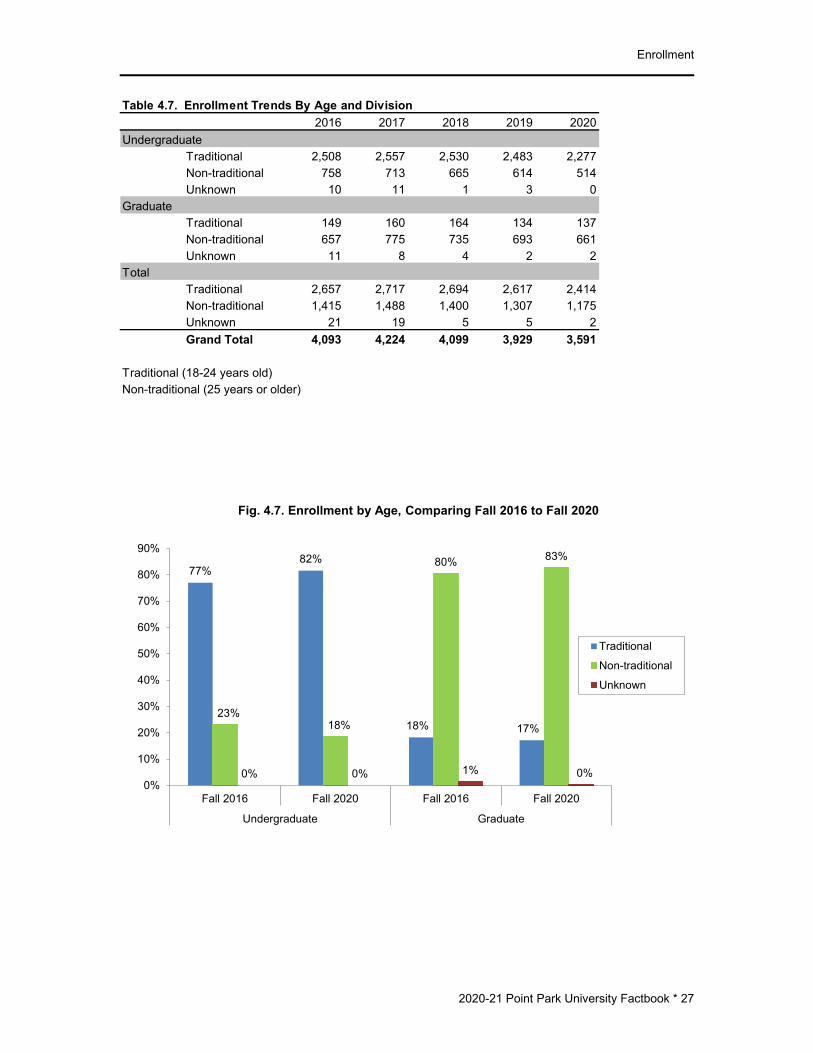
Table 4.7. Enrollment Trends By Age and Division2016 2017 2018 2019 2020
UndergraduateTraditional 2,508 2,557 2,530 2,483 2,277Non-traditional 758 713 665 614 514Unknown 10 11 1 3 0
GraduateTraditional 149 160 164 134 137Non-traditional 657 775 735 693 661Unknown 11 8 4 2 2
TotalTraditional 2,657 2,717 2,694 2,617 2,414Non-traditional 1,415 1,488 1,400 1,307 1,175Unknown 21 19 5 5 2Grand Total 4,093 4,224 4,099 3,929 3,591
Traditional (18-24 years old)Non-traditional (25 years or older)
77%82%
18% 17%23%
18%
80% 83%
0% 0% 1% 0%0%
10%
20%
30%
40%
50%
60%
70%
80%
90%
Fall 2016 Fall 2020 Fall 2016 Fall 2020
Undergraduate Graduate
Fig. 4.7. Enrollment by Age, Comparing Fall 2016 to Fall 2020
Traditional
Non-traditional
Unknown

Enrollment
2020-21 Point Park University Factbook * 28
Table 4.8. Average Age by Student Type2016 2017 2018 2019 2020
Regular Undergraduate 22 22 21 21 21Accelerated Undergraduate 31Online Undergraduate 33 33 33 34 34Professional Development-UG 33 33 33 36 Undergraduate Avg Age 23 23 23 23 23Online Graduate 32 33 33 34 34Professional Development-GR 36 35 37 35 36Graduate 33 34 34 34 34 Graduate Avg Age 33 33 33 34 34
Overall Average Age 25 25 25 25 25
23
33
23
34
0
5
10
15
20
25
30
35
40
Undergraduate Graduate
Fig. 4.8. Average Age, Comparing Fall 2016 and Fall 2020
20162020
Enrollment
2020-21 Point Park University Factbook * 29
Table 4.9. Enrollment Trends By Residency and Division2016 2017 2018 2019 2020
UndergraduateIn-state 2,361 2,380 2,298 2,202 1,945Out-of-state 915 901 898 898 846Unknown 0 0 0 0 0
GraduateIn-state 744 851 790 729 712Out-of-state 73 92 113 100 88Unknown 0 0 0 0 0
TotalIn-state 3,105 3,231 3,088 2,931 2,657Out-of-state 988 993 1,011 998 934Unknown 0 0 0 0 0Grand Total 4,093 4,224 4,099 3,929 3,591
2,657
2,931
3,088
3,231
3,105
934
998
1,011
993
988
0 1,000 2,000 3,000 4,000 5,000
2020
2019
2018
2017
2016
Fig. 4.9. Enrollment Trends By Residency
In-state
Out-of-state

Enrollment
2020-21 Point Park University Factbook * 30
Table 4.10. Number of Undergraduate Students in Residence Halls2016 2017 2018 2019 2020
Full-time Freshmen 476 478 487 490 410All Undergraduates 1,037 1,049 1,037 1,043 791
476
1,037
478
1,049
487
1,037
490
1,043
410
791
0
200
400
600
800
1000
1200
Freshmen All Undergraduates
Fig. 4.10. Undergraduate Students in Residence Halls
Fall 2016Fall 2017Fall 2018Fall 2019Fall 2020

Enrollment
2020-21 Point Park University Factbook * 31
* Classification is calculated by adding Current-Hours-Enrolled to Career-Hours-Earned
Table 4.11. Enrollment by Classification
Classification Level 2016 2017 2018 2019 2020 % of Total '20Freshmen 795 788 760 799 636 17.7Sophomore 735 776 728 685 612 17.0Junior 651 711 698 705 639 17.8Senior 1,095 1,006 1,010 911 904 25.2Graduate 817 943 903 829 800 22.3
Division TotalsUndergraduate 3,276 3,281 3,196 3,100 2,791 77.7Graduate 817 943 903 829 800 22.3
Grand Total 4,093 4,224 4,099 3,929 3,591 100.0
795
735
651
1,09
5
817
788
776
711
1,00
6
943
760
728
698
1,01
0
903
799
685
705
911
829
636
612
639
904
800
0
200
400
600
800
1,000
1,200
Freshmen Sophomore Junior Senior Graduate
Fig 4.11. Enrollment Trends by Classification (all students)
Fall 2016 Fall 2017 Fall 2018 Fall 2019 Fall 2020

Enrollment
2020-21 Point Park University Factbook * 32
Table 4.12. Fall 2020 Enrollment by Academic School/Department and Degrees/CertificatesCertificates Associates Bachelors Masters Doctorates Non-Degree Total
School of Arts & Sciences 0 0 700 57 28 6 791 Criminal Justice & Intel Std 0 0 192 25 0 0 217 Humanities & Social Sci 0 0 90 0 0 0 90 Literary Arts 0 0 41 0 0 0 41 Nat Sciences & Engr Tech 0 0 203 11 0 0 214 Psychology 0 0 126 21 28 0 175 Miscellaneous (A&S) 0 0 48 0 0 6 54
School of Business 0 0 694 204 0 0 898 Acct, Econ&Fin, InfoTech 0 0 144 0 0 0 144 Business Management 0 0 329 204 0 0 533 Sports, Arts & Enter Mgt 0 0 221 0 0 0 221
School of Communication 0 0 322 42 0 0 364
Conservatory of Perf. Arts 0 0 830 19 0 0 849 Cinema Arts 0 0 232 19 0 0 251 Dance 0 0 311 0 0 0 311 Theatre 0 0 287 0 0 0 287
Community Engagement 0 0 0 0 40 0 40
School of Education 121 0 120 222 157 29 649Education 121 0 120 222 157 0 620Miscellaneous (Education) 0 0 0 0 0 29 29
Grand Total 121 0 2,666 544 225 35 3,591
217
90
41
214175
54
144
533
221
364
251
311287
40
620
29
0
100
200
300
400
500
600
700
Fig 4.12. Enrollment by Academic Departments, Fall 2020
Enrollment
2020-21 Point Park University Factbook * 33
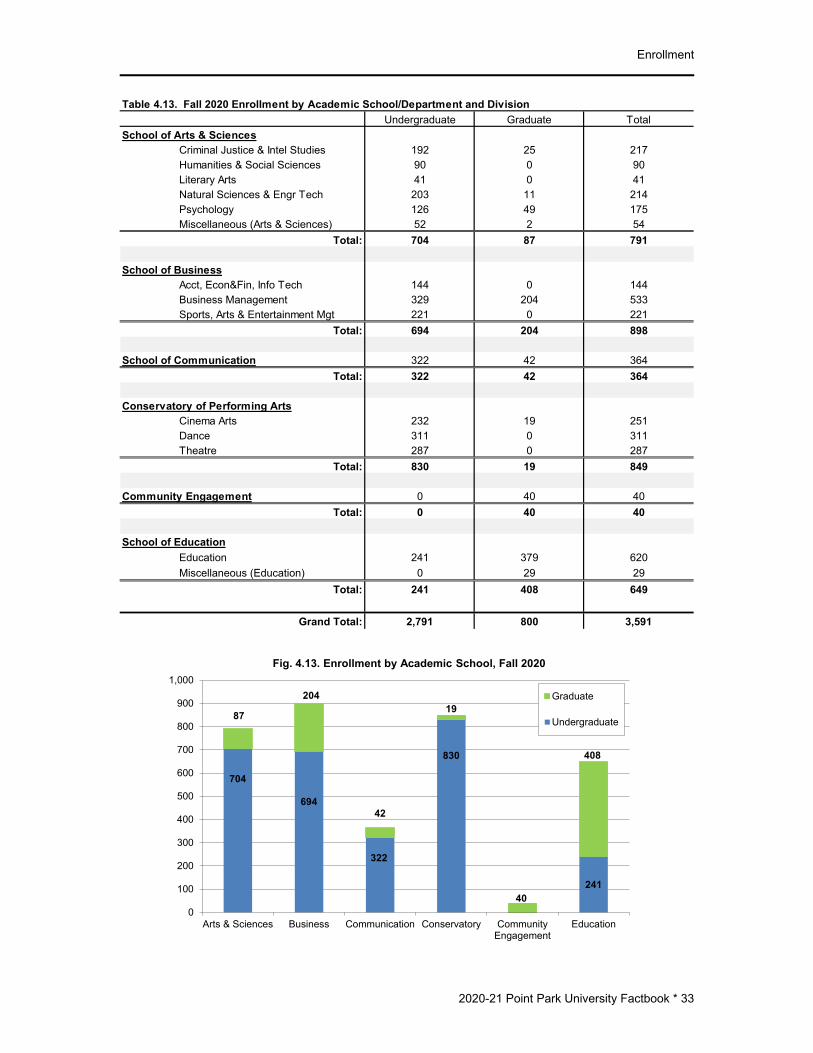
Table 4.13. Fall 2020 Enrollment by Academic School/Department and DivisionUndergraduate Graduate Total
School of Arts & SciencesCriminal Justice & Intel Studies 192 25 217Humanities & Social Sciences 90 0 90Literary Arts 41 0 41Natural Sciences & Engr Tech 203 11 214Psychology 126 49 175Miscellaneous (Arts & Sciences) 52 2 54
Total: 704 87 791
School of BusinessAcct, Econ&Fin, Info Tech 144 0 144Business Management 329 204 533Sports, Arts & Entertainment Mgt 221 0 221
Total: 694 204 898
School of Communication 322 42 364Total: 322 42 364
Conservatory of Performing ArtsCinema Arts 232 19 251Dance 311 0 311Theatre 287 0 287
Total: 830 19 849
Community Engagement 0 40 40Total: 0 40 40
School of EducationEducation 241 379 620Miscellaneous (Education) 0 29 29
Total: 241 408 649
Grand Total: 2,791 800 3,591
704
694
322
830
241
87
204
42
19
40
408
0
100
200
300
400
500
600
700
800
900
1,000
Arts & Sciences Business Communication Conservatory CommunityEngagement
Education
Fig. 4.13. Enrollment by Academic School, Fall 2020
Graduate
Undergraduate

Enrollment
2015-16 Point Park University Factbook * 34
192
9041
203
12652
144
329
221
322
232
311287
241
25 11 49
2
204
42
19
40
379
29
0
100
200
300
400
500
600
700
Crim
inal
Jus
tice
& In
tel S
tudi
es
Hum
aniti
es &
Soc
ial S
cien
ces
Lite
rary
Arts
Nat
Sci
ence
s &
Engr
Tec
h
Psyc
holo
gy
Mis
cella
neou
s (A
&S)
Acct
, Eco
n&Fi
n, In
fo T
ech
Busi
ness
Man
agem
ent
Spor
ts, A
rts &
Ent
er M
gt
Com
mun
icat
ion
Cin
ema
Arts
Dan
ce
Thea
tre
Com
mun
ity E
ngag
emen
t
Educ
atio
n
Mis
cella
neou
s (E
duc.
)
Arts & Sciences Business Comm. Conservatory Comm.Eng.
Education
Fig. 4.14. Enrollment by Academic Department, Fall 2020
Graduate Undergraduate
Enrollment
2020-21 Point Park University Factbook * 35
Student-TypeFA16 FA17 FA18 FA19 FA20 Var. FA16 FA17 FA18 FA19 FA20 Var. FA16 FA17 FA18 FA19 FA20 Var.
Regular Undergraduate
School of Arts & Sciences
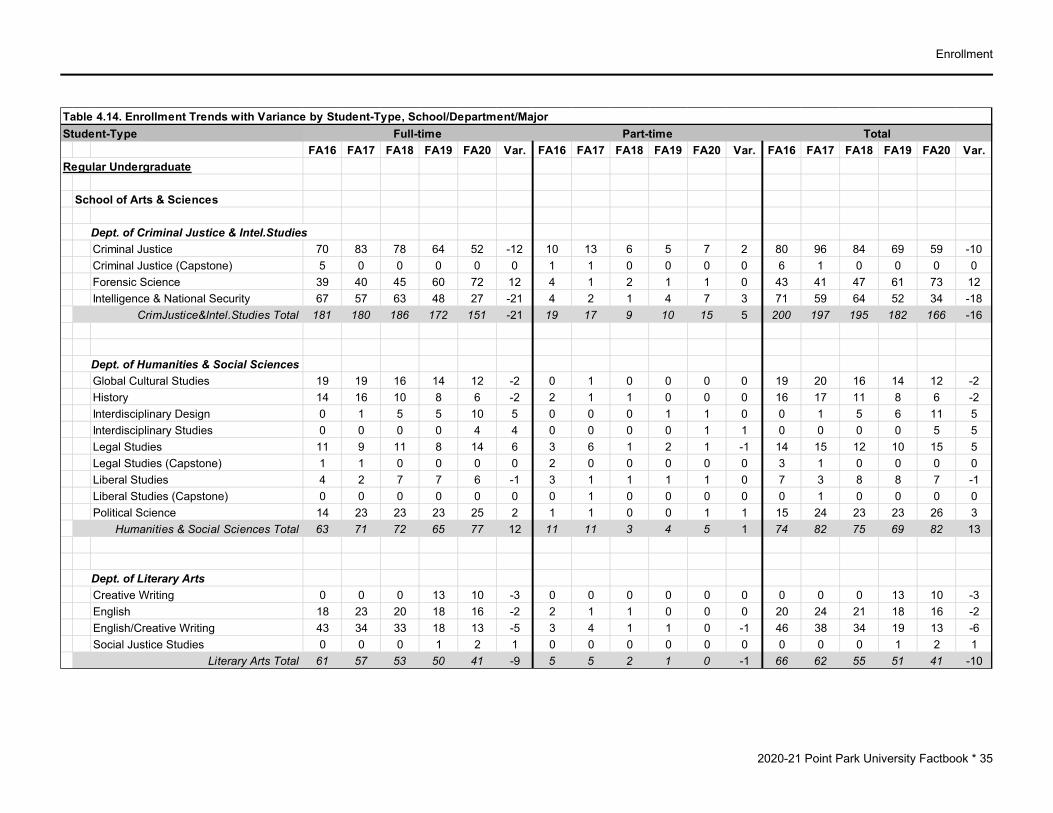
Dept. of Criminal Justice & Intel.StudiesCriminal Justice 70 83 78 64 52 -12 10 13 6 5 7 2 80 96 84 69 59 -10Criminal Justice (Capstone) 5 0 0 0 0 0 1 1 0 0 0 0 6 1 0 0 0 0Forensic Science 39 40 45 60 72 12 4 1 2 1 1 0 43 41 47 61 73 12Intelligence & National Security 67 57 63 48 27 -21 4 2 1 4 7 3 71 59 64 52 34 -18
CrimJustice&Intel.Studies Total 181 180 186 172 151 -21 19 17 9 10 15 5 200 197 195 182 166 -16
Dept. of Humanities & Social SciencesGlobal Cultural Studies 19 19 16 14 12 -2 0 1 0 0 0 0 19 20 16 14 12 -2History 14 16 10 8 6 -2 2 1 1 0 0 0 16 17 11 8 6 -2Interdisciplinary Design 0 1 5 5 10 5 0 0 0 1 1 0 0 1 5 6 11 5Interdisciplinary Studies 0 0 0 0 4 4 0 0 0 0 1 1 0 0 0 0 5 5Legal Studies 11 9 11 8 14 6 3 6 1 2 1 -1 14 15 12 10 15 5Legal Studies (Capstone) 1 1 0 0 0 0 2 0 0 0 0 0 3 1 0 0 0 0Liberal Studies 4 2 7 7 6 -1 3 1 1 1 1 0 7 3 8 8 7 -1Liberal Studies (Capstone) 0 0 0 0 0 0 0 1 0 0 0 0 0 1 0 0 0 0Political Science 14 23 23 23 25 2 1 1 0 0 1 1 15 24 23 23 26 3
Humanities & Social Sciences Total 63 71 72 65 77 12 11 11 3 4 5 1 74 82 75 69 82 13
Dept. of Literary ArtsCreative Writing 0 0 0 13 10 -3 0 0 0 0 0 0 0 0 0 13 10 -3English 18 23 20 18 16 -2 2 1 1 0 0 0 20 24 21 18 16 -2English/Creative Writing 43 34 33 18 13 -5 3 4 1 1 0 -1 46 38 34 19 13 -6Social Justice Studies 0 0 0 1 2 1 0 0 0 0 0 0 0 0 0 1 2 1
Literary Arts Total 61 57 53 50 41 -9 5 5 2 1 0 -1 66 62 55 51 41 -10
Full-time Part-time TotalTable 4.14. Enrollment Trends with Variance by Student-Type, School/Department/Major

Enrollment
2020-21 Point Park University Factbook * 36
Table 4.14. (Continued)Student-Type
FA16 FA17 FA18 FA19 FA20 Var. FA16 FA17 FA18 FA19 FA20 Var. FA16 FA17 FA18 FA19 FA20 Var.Regular Undergraduate (cont.)
School of Arts & Sciences (cont.)
Dept. of Natural Sciences & Engineering TechBiological Sciences 31 29 42 44 45 1 2 3 2 1 2 1 33 32 44 45 47 2Biotechnology 2 1 0 0 0 0 2 1 0 0 0 0 4 2 0 0 0 0Biotechnology (Capstone) 0 0 0 0 0 0 1 1 0 0 0 0 1 1 0 0 0 0Civil Eng Technology 42 41 33 34 28 -6 21 14 17 11 8 -3 63 55 50 45 36 -9Electrical Engineering 6 9 12 18 17 -1 8 15 14 15 8 -7 14 24 26 33 25 -8Electrical Engineering - Undeclared 0 4 7 6 5 -1 0 6 6 4 4 0 0 10 13 10 9 -1Electrical Eng Technology 50 35 21 6 2 -4 41 17 10 4 1 -3 91 52 31 10 3 -7Electrical Eng Technology (BS/MS) 0 0 1 0 0 0 0 0 0 0 0 0 0 0 1 0 0 0Funeral Services 10 16 21 22 12 -10 1 0 0 0 0 0 11 16 21 22 12 -10Funeral Services (Capstone) 10 6 3 0 2 2 1 1 1 1 1 0 11 7 4 1 3 2Funeral Services (Capstone)-Undeclrd 7 7 6 6 3 -3 0 0 0 0 1 1 7 7 6 6 4 -2Health Services 2 1 0 0 0 0 1 1 0 0 0 0 3 2 0 0 0 0Health Services - Undeclared 1 0 0 0 0 0 3 2 1 1 0 -1 4 2 1 1 0 -1Mechanical Engineering 0 9 14 22 23 1 0 5 7 8 15 7 0 14 21 30 38 8Mechanical Engineering - Undeclared 0 7 5 8 8 0 0 2 4 7 3 -4 0 9 9 15 11 -4Mechanical Eng Technology 65 39 23 9 1 -8 25 19 11 11 4 -7 90 58 34 20 5 -15Premedical & Preprofessional Studies 26 23 10 5 3 -2 1 2 0 0 0 0 27 25 10 5 3 -2Specialized Funeral Services 0 0 0 0 7 7 0 0 0 0 0 0 0 0 0 0 7 7
Natural Sciences & Engr Tech Total 252 227 198 180 156 -24 107 89 73 63 47 -16 359 316 271 243 203 -40
Dept. of PsychologyBehavioral Sciences 12 13 15 20 16 -4 9 10 3 3 4 1 21 23 18 23 20 -3Psychology 87 109 112 114 100 -14 13 9 9 5 6 1 100 118 121 119 106 -13Psychology (BA/MA) 0 0 6 1 0 -1 0 0 0 0 0 0 0 0 6 1 0 -1
Psychology Total 99 122 133 135 116 -19 22 19 12 8 10 2 121 141 145 143 126 -17
Full-time Part-time Total

Enrollment
2020-21 Point Park University Factbook * 37
Table 4.14. (Continued)Student-Type Full-time Part-time Total
FA16 FA17 FA18 FA19 FA20 Var. FA16 FA17 FA18 FA19 FA20 Var. FA16 FA17 FA18 FA19 FA20 Var.Regular Undergraduate (cont.)
School of Arts & Sciences (cont.)
MiscellaneousNonDegree Program 0 0 0 0 0 0 8 4 4 5 4 -1 8 4 4 5 4 -1Undecided 60 72 68 56 48 -8 2 0 0 1 0 -1 62 72 68 57 48 -9
Miscellaneous Total 60 72 68 56 48 -8 10 4 4 6 4 -2 70 76 72 62 52 -10School of Arts & Sciences Total 716 729 710 658 589 -69 174 145 103 92 81 -11 890 874 813 750 670 -80

Enrollment
2020-21 Point Park University Factbook * 38
Table 4.14. (Continued)Student-Type Full-time Part-time Total
FA16 FA17 FA18 FA19 FA20 Var. FA16 FA17 FA18 FA19 FA20 Var. FA16 FA17 FA18 FA19 FA20 Var.Regular Undergraduate (cont.)
School of Business
Dept. of Acct, Econ-Finance, Info TechAccounting 49 40 42 42 39 -3 15 14 4 4 3 -1 64 54 46 46 42 -4Applied Computer Science 0 0 0 0 10 10 0 0 0 0 0 0 0 0 0 0 10 10Economics and Finance 16 20 18 15 17 2 2 2 1 2 2 0 18 22 19 17 19 2Information Technology 23 35 34 37 23 -14 4 6 7 3 1 -2 27 41 41 40 24 -16
Acct, Econ-Fin, Info Tech Total 88 95 94 94 89 -5 21 22 12 9 6 -3 109 117 106 103 95 -8
Dept. of Business ManagementBusiness Administration 0 0 0 0 1 1 0 0 0 0 0 0 0 0 0 0 1 1Business Mgmt 127 137 134 139 130 -9 32 20 11 13 6 -7 159 157 145 152 136 -16Human Resources Mgmt 18 21 14 13 22 9 8 4 3 5 4 -1 26 25 17 18 26 8Human Resources Mgmt (Capstone) 8 3 1 0 0 0 7 2 0 0 0 0 15 5 1 0 0 0Management Services 0 0 0 0 0 0 3 3 1 0 0 0 3 3 1 0 0 0Marketing and Sales 0 0 0 8 29 21 0 0 0 0 0 0 0 0 0 8 29 21Organizational Leadership 1 1 1 1 0 -1 0 0 1 0 0 0 1 1 2 1 0 -1Public Administration 0 0 0 0 0 0 1 1 1 1 0 -1 1 1 1 1 0 -1
Business Management Total 154 162 150 161 182 21 51 30 17 19 10 -9 205 192 167 180 192 12
Dept. of Sports, Arts & Entertain MgtSports, Arts and Entertainment Mgt 284 278 273 263 215 -48 5 10 7 4 6 2 289 288 280 267 221 -46
Sports, Arts & Entertain Mgt Total 284 278 273 263 215 -48 5 10 7 4 6 2 289 288 280 267 221 -46School of Business Total 526 535 517 518 486 -32 77 62 36 32 22 -10 603 597 553 550 508 -42

Enrollment
2020-21 Point Park University Factbook * 39
Student-TypeFA16 FA17 FA18 FA19 FA20 Var. FA16 FA17 FA18 FA19 FA20 Var. FA16 FA17 FA18 FA19 FA20 Var.
Regular Undergraduate (cont.)
School of Communication
Advertising and Public Relations 0 0 0 0 0 0 2 0 0 0 0 0 2 0 0 0 0 0Broadcast Production & Programming 4 1 0 0 0 0 1 0 0 0 0 0 5 1 0 0 0 0Broadcast Production & Media Mgt 36 45 43 45 44 -1 2 5 2 1 1 0 38 50 45 46 45 -1Broadcasting 0 0 0 0 0 0 0 1 0 0 0 0 0 1 0 0 0 0Broadcasting Reporting 57 44 51 28 9 -19 3 1 1 1 0 -1 60 45 52 29 9 -20Environmental Journalism 0 1 1 0 0 0 0 0 0 0 0 0 0 1 1 0 0 0Graphic and Interactive Design 0 0 0 20 37 17 0 0 0 0 0 0 0 0 0 20 37 17Journalism 50 45 45 54 56 2 4 0 1 1 0 -1 54 45 46 55 56 1Jour and Mass Communication 0 0 0 0 0 0 1 0 0 0 0 0 1 0 0 0 0 0Mass Communication 28 24 23 12 3 -9 3 2 0 0 1 1 31 26 23 12 4 -8Multimedia 56 77 72 67 68 1 2 4 3 2 3 1 58 81 75 69 71 2Photography (BFA) 52 35 50 42 32 -10 5 0 2 4 1 -3 57 35 52 46 33 -13Photojournalism 24 27 20 11 5 -6 2 3 0 0 0 0 26 30 20 11 5 -6Public Relations and Advertising 84 76 73 60 42 -18 1 3 1 1 0 -1 85 79 74 61 42 -19
School of Communication Total 391 375 378 339 296 -43 26 19 10 10 6 -4 417 394 388 349 302 -47
Table 4.14. (Continued)Full-time Part-time Total

Enrollment
2020-21 Point Park University Factbook * 40
Student-TypeFA16 FA17 FA18 FA19 FA20 Var. FA16 FA17 FA18 FA19 FA20 Var. FA16 FA17 FA18 FA19 FA20 Var.
Regular Undergraduate (cont.)
Conservatory of Performing Arts
Dept. of Cinema ArtsAnimation 0 0 0 0 6 6 0 0 0 0 0 0 0 0 0 0 6 6Animation and Visual Effects 41 60 59 57 47 -10 2 2 0 4 1 -3 43 62 59 61 48 -13Cinema Arts 0 0 0 0 8 8 0 0 0 0 0 0 0 0 0 0 8 8Cinema & Media Studies 0 0 19 30 30 0 0 0 0 0 2 2 0 0 19 30 32 2Cinema Production 188 183 162 141 111 -30 2 3 0 2 0 -2 190 186 162 143 111 -32Screenwriting 43 32 26 22 19 -3 0 1 0 3 1 -2 43 33 26 25 20 -5Writing for the Screen & Media 0 1 13 11 7 -4 0 0 0 0 0 0 0 1 13 11 7 -4
Cinema Arts Total 272 276 279 261 228 -33 4 6 0 9 4 -5 276 282 279 270 232 -38
Dept. of DanceDance 99 86 66 38 11 -27 2 2 0 1 1 0 101 88 66 39 12 -27Dance Pedagogy 1 1 0 0 0 0 0 0 0 0 0 0 1 1 0 0 0 0Dance (BFA) 170 190 134 101 53 -48 0 1 0 0 1 1 170 191 134 101 54 -47Dance: Ballet (BFA) 0 0 28 43 51 8 0 0 0 0 2 2 0 0 28 43 53 10Dance: Jazz (BFA) 0 0 39 74 94 20 0 0 0 0 0 0 0 0 39 74 94 20Dance: Modern (BFA) 0 0 24 59 93 34 0 0 0 0 0 0 0 0 24 59 93 34Dance: Ballet (BA) 0 0 0 0 2 2 0 0 0 0 0 0 0 0 0 0 2 2Dance: Modern (BA) 0 0 0 0 3 3 0 0 0 0 0 0 0 0 0 0 3 3
Dance Total 270 277 291 315 307 -8 2 3 0 1 4 3 272 280 291 316 311 -5
Table 4.14. (Continued)Full-time Part-time Total

Enrollment
2020-21 Point Park University Factbook * 41
Student-TypeFA16 FA17 FA18 FA19 FA20 Var. FA16 FA17 FA18 FA19 FA20 Var. FA16 FA17 FA18 FA19 FA20 Var.
Regular Undergraduate (cont.)
Conservatory of Performing Arts (cont.)
Dept. of TheatreActing 32 43 52 55 58 3 1 0 0 0 1 1 33 43 52 55 59 4Musical Theatre 66 91 104 92 91 -1 0 0 1 0 1 1 66 91 105 92 92 0Theatre Arts 47 16 0 0 0 0 1 2 2 0 0 0 48 18 2 0 0 0Theatre Arts (BFA) 45 19 2 33 24 -9 1 0 0 0 0 0 46 19 2 33 24 -9Theatre Arts: Directing 0 0 0 0 3 3 0 0 0 0 0 0 0 0 0 0 3 3Theatre Arts: Performance&Practices 58 69 87 57 31 -26 1 1 0 1 1 0 59 70 87 58 32 -26Theatre Arts: Self-Directed 0 0 0 0 20 20 0 0 0 0 0 0 0 0 0 0 20 20Theatre Production: Design 20 25 16 20 16 -4 0 1 0 0 0 0 20 26 16 20 16 -4Theatre Production: Stage Mgt 31 31 26 28 26 -2 0 0 0 0 0 0 31 31 26 28 26 -2Theatre Production: Tech Desgn&Mgt 8 11 14 15 15 0 0 0 0 0 0 0 8 11 14 15 15 0
Theatre Total 307 305 301 300 284 -16 4 4 3 1 3 2 311 309 304 301 287 -14Conservatory of Performing Arts Total 849 858 871 876 819 -57 10 13 3 11 11 0 859 871 874 887 830 -57
Table 4.14. (Continued)Full-time Part-time Total

Enrollment
2020-21 Point Park University Factbook * 42
Student-TypeFA16 FA17 FA18 FA19 FA20 Var. FA16 FA17 FA18 FA19 FA20 Var. FA16 FA17 FA18 FA19 FA20 Var.
Regular Undergraduate (cont.)
School of Education
Citizenship/Secondary Ed 2 1 0 0 0 0 0 0 0 0 0 0 2 1 0 0 0 0Early Childhood Education 0 2 2 2 0 -2 1 1 1 1 0 -1 1 3 3 3 0 -3Education/Undeclared 61 68 74 81 69 -12 12 2 7 6 2 -4 73 70 81 87 71 -16English/Secondary Ed 3 6 3 2 3 1 0 0 0 0 0 0 3 6 3 2 3 1English/Sec Ed/Spec Ed 7th-12th 0 2 3 3 3 0 0 0 0 0 0 0 0 2 3 3 3 0Instructional Studies 5 8 4 3 1 -2 5 7 2 3 2 -1 10 15 6 6 3 -3Mathematics/Secondary Ed 0 0 1 2 1 -1 0 0 0 0 0 0 0 0 1 2 1 -1Mathematics-Sec Ed/Spec Ed 7th-12th 1 1 1 0 0 0 0 0 0 0 0 0 1 1 1 0 0 0PA Cert English 4th-8th 0 0 1 0 0 0 0 0 0 0 0 0 0 0 1 0 0 0PA Cert English 4th-8th Spec Educ 0 0 0 1 1 0 0 0 0 0 0 0 0 0 0 1 1 0PA Cert Math 4th-8th 0 0 1 0 1 1 0 0 0 0 0 0 0 0 1 0 1 1PA Cert Math 4th-8th Spec Educ 0 0 1 0 0 0 0 0 0 0 0 0 0 0 1 0 0 0PA Cert PreK-4th 4 5 6 11 12 1 2 2 4 1 0 -1 6 7 10 12 12 0PA Cert PreK-4th Spec Educ 13 16 16 11 13 2 1 1 0 0 0 0 14 17 16 11 13 2PA Cert Science 4th-8th 0 1 1 0 0 0 0 0 0 0 0 0 0 1 1 0 0 0PA Cert Science 4th-8th Spec Educ 0 0 1 1 1 0 0 0 0 0 0 0 0 0 1 1 1 0PA Cert Social Studies 4th-8th 0 0 0 0 2 2 0 0 0 0 0 0 0 0 0 0 2 2PA Cert Social Studies 4-8 Spec Educ 0 0 1 1 1 0 0 0 0 0 0 0 0 0 1 1 1 0Social Studies/Secondary Ed 1 3 1 3 2 -1 1 0 1 0 0 0 2 3 2 3 2 -1Social Studies-Sec Ed/Spec Ed 7th-12th 1 2 2 1 1 0 0 0 0 0 0 0 1 2 2 1 1 0School Principal K-12 0 0 0 0 0 0 4 0 0 0 0 0 4 0 0 0 0 0
School of Education Total 91 115 119 122 111 -11 26 13 15 11 4 -7 117 128 134 133 115 -18
Regular Undergraduate Total 2573 2612 2595 2513 2301 -212 313 252 167 156 124 -32 2886 2864 2762 2669 2425 -244
Table 4.14. (Continued)Full-time Part-time Total

Enrollment
2020-21 Point Park University Factbook * 43
Student-TypeFA16 FA17 FA18 FA19 FA20 Var. FA16 FA17 FA18 FA19 FA20 Var. FA16 FA17 FA18 FA19 FA20 Var.
Online - Undergraduate
Accounting - Online 18 21 13 8 8 0 7 13 16 20 13 -7 25 34 29 28 21 -7Accounting-PB - Online 2 7 3 1 0 -1 2 5 4 4 0 -4 4 12 7 5 0 -5Applied Computer Science - Online 0 0 0 0 2 2 0 0 0 0 3 3 0 0 0 0 5 5Business - Online 3 2 0 0 0 0 2 3 0 0 0 0 5 5 0 0 0 0Business Administration - Online 0 0 0 0 0 0 0 0 0 0 1 1 0 0 0 0 1 1Business (Capstone) Online 8 0 0 0 0 0 9 3 1 0 0 0 17 3 1 0 0 0Business Management - Online 29 34 44 33 30 -3 27 39 47 35 29 -6 56 73 91 68 59 -9Criminal Justice - Online 14 26 33 20 13 -7 16 18 15 17 13 -4 30 44 48 37 26 -11Criminal Justice (Capstone) Online 4 0 0 0 0 0 1 0 0 0 0 0 5 0 0 0 0 0Human Resource Mgmt - Online 0 0 3 4 10 6 0 0 6 15 16 1 0 0 9 19 26 7Information Technology - Online 12 14 16 10 9 -1 5 10 12 21 14 -7 17 24 28 31 23 -8Instructional Studies - Online 0 0 0 0 3 3 0 0 0 0 2 2 0 0 0 0 5 5Interdisciplinary Design - Online 0 2 4 4 2 -2 0 2 2 7 5 -2 0 4 6 11 7 -4Interdisciplinary Studies - Online 0 0 0 0 0 0 0 0 0 0 1 1 0 0 0 0 1 1Marketing and Sales - Online 0 0 0 2 6 4 0 0 0 3 3 0 0 0 0 5 9 4Mass Communication - Online 0 4 3 1 0 -1 0 1 2 1 0 -1 0 5 5 2 0 -2Non-Degree Program - Online 0 0 0 0 0 0 1 1 0 0 0 0 1 1 0 0 0 0Organizational Leadership - Online 14 15 11 8 9 1 13 16 17 20 14 -6 27 31 28 28 23 -5Organizational Leadership(Cap)-Online 5 1 0 0 0 0 9 5 1 1 0 -1 14 6 1 1 0 -1Public Administration (Cert.) Online 0 0 0 0 0 0 1 0 0 0 0 0 1 0 0 0 0 0Public Administration - Online 14 12 13 11 4 -7 13 25 22 15 15 0 27 37 35 26 19 -7Public Admin (Capstone) Online 5 0 0 0 0 0 5 1 0 0 0 0 10 1 0 0 0 0Public Relations & Advertising-Online 1 8 11 11 12 1 4 6 14 11 7 -4 5 14 25 22 19 -3Reading Specialist - Online 0 0 0 0 0 0 0 0 0 0 5 5 0 0 0 0 5 5School Principal K-12 - Online 0 0 0 0 0 0 74 77 84 91 88 -3 74 77 84 91 88 -3Social Media Management - Online 0 0 0 0 1 1 0 0 0 0 0 0 0 0 0 0 1 1Superintendents Letter Eligibility-Onln 0 0 0 0 0 0 0 0 15 24 28 4 0 0 15 24 28 4
Online Undergraduate Total 129 146 154 113 109 -4 189 225 258 285 257 -28 318 371 412 398 366 -32
Table 4.14. (Continued)Full-time Part-time Total
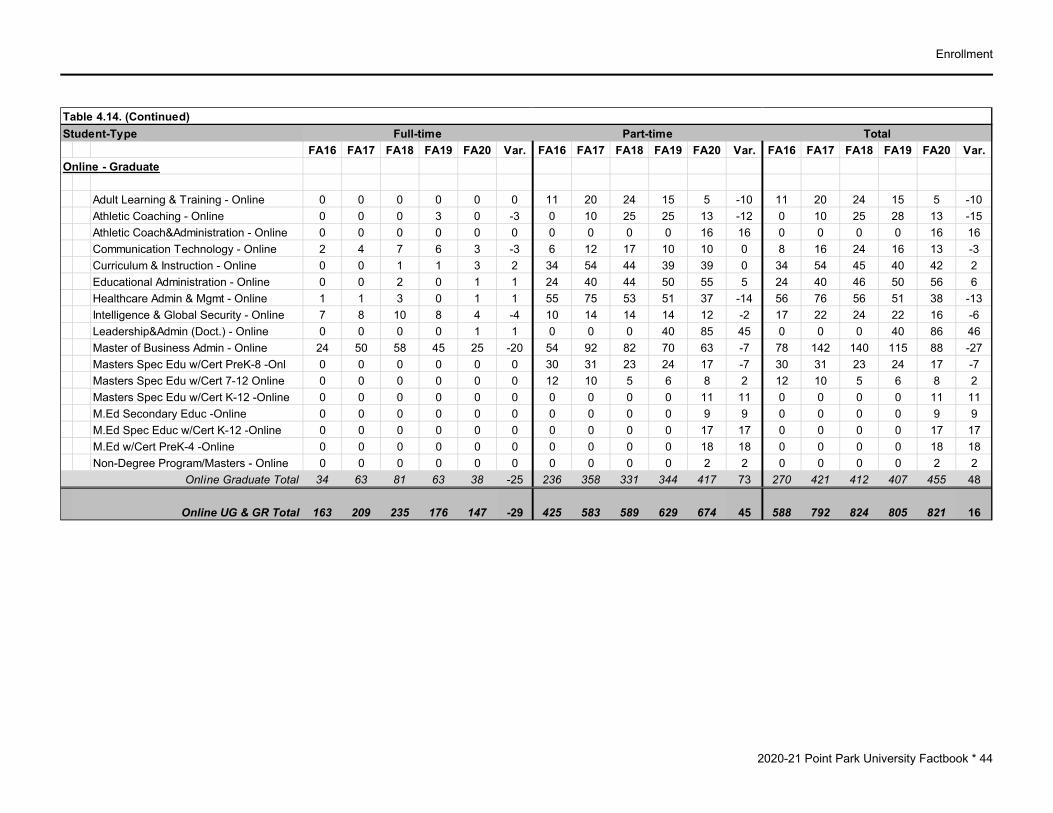
Enrollment
2020-21 Point Park University Factbook * 44
Student-TypeFA16 FA17 FA18 FA19 FA20 Var. FA16 FA17 FA18 FA19 FA20 Var. FA16 FA17 FA18 FA19 FA20 Var.
Online - Graduate
Adult Learning & Training - Online 0 0 0 0 0 0 11 20 24 15 5 -10 11 20 24 15 5 -10Athletic Coaching - Online 0 0 0 3 0 -3 0 10 25 25 13 -12 0 10 25 28 13 -15Athletic Coach&Administration - Online 0 0 0 0 0 0 0 0 0 0 16 16 0 0 0 0 16 16Communication Technology - Online 2 4 7 6 3 -3 6 12 17 10 10 0 8 16 24 16 13 -3Curriculum & Instruction - Online 0 0 1 1 3 2 34 54 44 39 39 0 34 54 45 40 42 2Educational Administration - Online 0 0 2 0 1 1 24 40 44 50 55 5 24 40 46 50 56 6Healthcare Admin & Mgmt - Online 1 1 3 0 1 1 55 75 53 51 37 -14 56 76 56 51 38 -13Intelligence & Global Security - Online 7 8 10 8 4 -4 10 14 14 14 12 -2 17 22 24 22 16 -6Leadership&Admin (Doct.) - Online 0 0 0 0 1 1 0 0 0 40 85 45 0 0 0 40 86 46Master of Business Admin - Online 24 50 58 45 25 -20 54 92 82 70 63 -7 78 142 140 115 88 -27Masters Spec Edu w/Cert PreK-8 -Onl 0 0 0 0 0 0 30 31 23 24 17 -7 30 31 23 24 17 -7Masters Spec Edu w/Cert 7-12 Online 0 0 0 0 0 0 12 10 5 6 8 2 12 10 5 6 8 2Masters Spec Edu w/Cert K-12 -Online 0 0 0 0 0 0 0 0 0 0 11 11 0 0 0 0 11 11M.Ed Secondary Educ -Online 0 0 0 0 0 0 0 0 0 0 9 9 0 0 0 0 9 9M.Ed Spec Educ w/Cert K-12 -Online 0 0 0 0 0 0 0 0 0 0 17 17 0 0 0 0 17 17M.Ed w/Cert PreK-4 -Online 0 0 0 0 0 0 0 0 0 0 18 18 0 0 0 0 18 18Non-Degree Program/Masters - Online 0 0 0 0 0 0 0 0 0 0 2 2 0 0 0 0 2 2
Online Graduate Total 34 63 81 63 38 -25 236 358 331 344 417 73 270 421 412 407 455 48
Online UG & GR Total 163 209 235 176 147 -29 425 583 589 629 674 45 588 792 824 805 821 16
Table 4.14. (Continued)Full-time Part-time Total

Enrollment
2020-21 Point Park University Factbook * 45
Student-TypeFA16 FA17 FA18 FA19 FA20 Var. FA16 FA17 FA18 FA19 FA20 Var. FA16 FA17 FA18 FA19 FA20 Var.
UG Professional Development
Professional Development-UG 0 0 0 0 0 0 60 46 22 33 0 -33 60 46 22 33 0 -33
UG Professional Development Total 0 0 0 0 0 0 60 46 22 33 0 -33 60 46 22 33 0 -33
GR Professional Development
Professional Development-GR 0 0 0 0 0 0 8 9 17 18 16 -2 8 9 17 18 16 -2Professional Dev-GR: PreK-Grade 4 0 0 0 0 0 0 0 0 0 0 4 4 0 0 0 0 4 4Professional Dev-GR: Secondary Educ 0 0 0 0 0 0 0 0 0 0 9 9 0 0 0 0 9 9
GR Professional Development Total 0 0 0 0 0 0 8 9 17 18 29 11 8 9 17 18 29 11
Accelerated Undergraduate
Accel Criminal Justice 4 0 0 0 0 0 4 0 0 0 0 0 8 0 0 0 0 0Business-Accelerated 4 0 0 0 0 0 0 0 0 0 0 0 4 0 0 0 0 0
Accelerated Undergraduate Total 8 0 0 0 0 0 4 0 0 0 0 0 12 0 0 0 0 0
Table 4.14. (Continued)Full-time Part-time Total
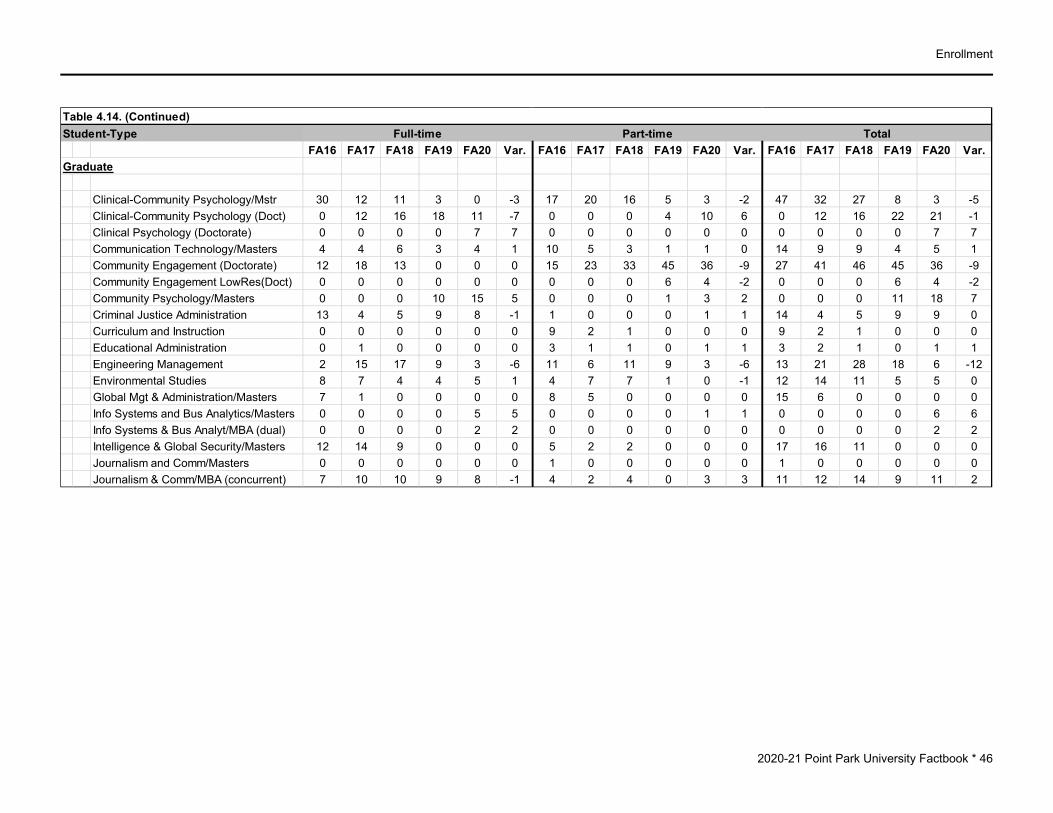
Enrollment
2020-21 Point Park University Factbook * 46
Student-TypeFA16 FA17 FA18 FA19 FA20 Var. FA16 FA17 FA18 FA19 FA20 Var. FA16 FA17 FA18 FA19 FA20 Var.
Graduate
Clinical-Community Psychology/Mstr 30 12 11 3 0 -3 17 20 16 5 3 -2 47 32 27 8 3 -5Clinical-Community Psychology (Doct) 0 12 16 18 11 -7 0 0 0 4 10 6 0 12 16 22 21 -1Clinical Psychology (Doctorate) 0 0 0 0 7 7 0 0 0 0 0 0 0 0 0 0 7 7Communication Technology/Masters 4 4 6 3 4 1 10 5 3 1 1 0 14 9 9 4 5 1Community Engagement (Doctorate) 12 18 13 0 0 0 15 23 33 45 36 -9 27 41 46 45 36 -9Community Engagement LowRes(Doct) 0 0 0 0 0 0 0 0 0 6 4 -2 0 0 0 6 4 -2Community Psychology/Masters 0 0 0 10 15 5 0 0 0 1 3 2 0 0 0 11 18 7Criminal Justice Administration 13 4 5 9 8 -1 1 0 0 0 1 1 14 4 5 9 9 0Curriculum and Instruction 0 0 0 0 0 0 9 2 1 0 0 0 9 2 1 0 0 0Educational Administration 0 1 0 0 0 0 3 1 1 0 1 1 3 2 1 0 1 1Engineering Management 2 15 17 9 3 -6 11 6 11 9 3 -6 13 21 28 18 6 -12Environmental Studies 8 7 4 4 5 1 4 7 7 1 0 -1 12 14 11 5 5 0Global Mgt & Administration/Masters 7 1 0 0 0 0 8 5 0 0 0 0 15 6 0 0 0 0Info Systems and Bus Analytics/Masters 0 0 0 0 5 5 0 0 0 0 1 1 0 0 0 0 6 6Info Systems & Bus Analyt/MBA (dual) 0 0 0 0 2 2 0 0 0 0 0 0 0 0 0 0 2 2Intelligence & Global Security/Masters 12 14 9 0 0 0 5 2 2 0 0 0 17 16 11 0 0 0Journalism and Comm/Masters 0 0 0 0 0 0 1 0 0 0 0 0 1 0 0 0 0 0Journalism & Comm/MBA (concurrent) 7 10 10 9 8 -1 4 2 4 0 3 3 11 12 14 9 11 2
Table 4.14. (Continued)Full-time Part-time Total

Enrollment
2020-21 Point Park University Factbook * 47
Student-TypeFA16 FA17 FA18 FA19 FA20 Var. FA16 FA17 FA18 FA19 FA20 Var. FA16 FA17 FA18 FA19 FA20 Var.
Graduate (cont.)
Leadership/Masters 8 4 1 0 0 0 8 5 0 0 0 0 16 9 1 0 0 0Leadership & Admin (Doctorate) 1 2 0 2 0 -2 85 101 101 95 71 -24 86 103 101 97 71 -26Master of Business Administration 49 56 49 40 31 -9 127 93 89 81 39 -42 176 149 138 121 70 -51Masters of Educ/Sec Educ Cert 7-12th 10 8 9 3 5 2 12 7 6 9 4 -5 22 15 15 12 9 -3Masters of Spec Educ w/Cert 7th-12th 0 0 0 0 0 0 1 0 0 0 0 0 1 0 0 0 0 0Masters of Spec Educ w/Cert PreK-8th 0 0 0 0 0 0 2 0 0 0 0 0 2 0 0 0 0 0Media Comm (Documentary Specializ.) 0 3 2 1 2 1 0 0 2 2 1 -1 0 3 4 3 3 0Media Comm (Journalism Specializ.) 10 14 6 2 2 0 1 2 3 1 2 1 11 16 9 3 4 1Media Comm (PR & Adver Specializ.) 7 5 4 3 2 -1 6 2 0 2 1 -1 13 7 4 5 3 -2Non-Degree Program/Masters 0 0 0 0 0 0 3 9 1 0 0 0 3 9 1 0 0 0Organizational Leadership 1 0 0 0 0 0 1 1 0 0 0 0 2 1 0 0 0 0Public Relations and Advertising/Masters 0 0 0 0 3 3 0 0 0 0 0 0 0 0 0 0 3 3Teaching and Leadership 0 0 0 0 0 0 2 0 0 0 0 0 2 0 0 0 0 0Writing for the Screen & Stage/MFA 18 28 30 25 19 -6 4 2 2 1 0 -1 22 30 32 26 19 -7
Graduate Total 199 218 192 141 132 -9 340 295 282 263 184 -79 539 513 474 404 316 -88
University Grand Total 2943 3039 3022 2830 2580 -250 1150 1185 1077 1099 1011 -88 4093 4224 4099 3929 3591 -338
Table 4.14. (Continued)Full-time Part-time Total
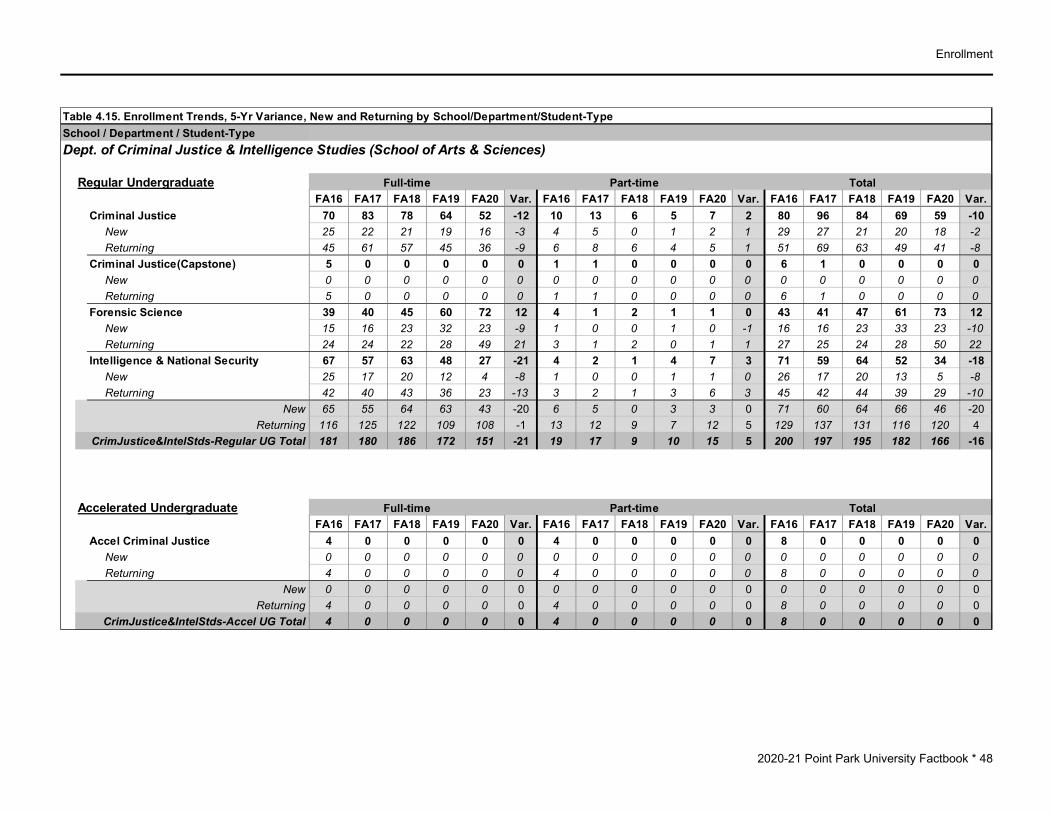
Enrollment
2020-21 Point Park University Factbook * 48
Table 4.15. Enrollment Trends, 5-Yr Variance, New and Returning by School/Department/Student-TypeSchool / Department / Student-TypeDept. of Criminal Justice & Intelligence Studies (School of Arts & Sciences)
Regular UndergraduateFA16 FA17 FA18 FA19 FA20 Var. FA16 FA17 FA18 FA19 FA20 Var. FA16 FA17 FA18 FA19 FA20 Var.
Criminal Justice 70 83 78 64 52 -12 10 13 6 5 7 2 80 96 84 69 59 -10 New 25 22 21 19 16 -3 4 5 0 1 2 1 29 27 21 20 18 -2 Returning 45 61 57 45 36 -9 6 8 6 4 5 1 51 69 63 49 41 -8Criminal Justice(Capstone) 5 0 0 0 0 0 1 1 0 0 0 0 6 1 0 0 0 0 New 0 0 0 0 0 0 0 0 0 0 0 0 0 0 0 0 0 0 Returning 5 0 0 0 0 0 1 1 0 0 0 0 6 1 0 0 0 0Forensic Science 39 40 45 60 72 12 4 1 2 1 1 0 43 41 47 61 73 12 New 15 16 23 32 23 -9 1 0 0 1 0 -1 16 16 23 33 23 -10 Returning 24 24 22 28 49 21 3 1 2 0 1 1 27 25 24 28 50 22Intelligence & National Security 67 57 63 48 27 -21 4 2 1 4 7 3 71 59 64 52 34 -18 New 25 17 20 12 4 -8 1 0 0 1 1 0 26 17 20 13 5 -8 Returning 42 40 43 36 23 -13 3 2 1 3 6 3 45 42 44 39 29 -10
New 65 55 64 63 43 -20 6 5 0 3 3 0 71 60 64 66 46 -20Returning 116 125 122 109 108 -1 13 12 9 7 12 5 129 137 131 116 120 4
CrimJustice&IntelStds-Regular UG Total 181 180 186 172 151 -21 19 17 9 10 15 5 200 197 195 182 166 -16
Accelerated UndergraduateFA16 FA17 FA18 FA19 FA20 Var. FA16 FA17 FA18 FA19 FA20 Var. FA16 FA17 FA18 FA19 FA20 Var.
Accel Criminal Justice 4 0 0 0 0 0 4 0 0 0 0 0 8 0 0 0 0 0 New 0 0 0 0 0 0 0 0 0 0 0 0 0 0 0 0 0 0 Returning 4 0 0 0 0 0 4 0 0 0 0 0 8 0 0 0 0 0
New 0 0 0 0 0 0 0 0 0 0 0 0 0 0 0 0 0 0Returning 4 0 0 0 0 0 4 0 0 0 0 0 8 0 0 0 0 0
CrimJustice&IntelStds-Accel UG Total 4 0 0 0 0 0 4 0 0 0 0 0 8 0 0 0 0 0
Full-time Part-time Total
Full-time Part-time Total

Enrollment
2020-21 Point Park University Factbook * 49
Table 4.15. (Continued)School / Department / Student-TypeDept. of Criminal Justice & Intelligence Studies (School of Arts & Sciences) (cont.)
Online UndergraduateFA16 FA17 FA18 FA19 FA20 Var. FA16 FA17 FA18 FA19 FA20 Var. FA16 FA17 FA18 FA19 FA20 Var.
Criminal Justice - Online 14 26 33 20 13 -7 16 18 15 17 13 -4 30 44 48 37 26 -11 New 5 5 9 3 3 0 9 3 2 4 4 0 14 8 11 7 7 0 Returning 9 21 24 17 10 -7 7 15 13 13 9 -4 16 36 37 30 19 -11Criminal Justice (Capstone) - Online 4 0 0 0 0 0 1 0 0 0 0 0 5 0 0 0 0 0 New 0 0 0 0 0 0 0 0 0 0 0 0 0 0 0 0 0 0 Returning 4 0 0 0 0 0 1 0 0 0 0 0 5 0 0 0 0 0
New 5 5 9 3 3 0 9 3 2 4 4 0 14 8 11 7 7 0Returning 13 21 24 17 10 -7 8 15 13 13 9 -4 21 36 37 30 19 -11
CrimJustice&IntelStds-Online UG Total 18 26 33 20 13 -7 17 18 15 17 13 -4 35 44 48 37 26 -11
Online GraduateFA16 FA17 FA18 FA19 FA20 Var. FA16 FA17 FA18 FA19 FA20 Var. FA16 FA17 FA18 FA19 FA20 Var.
Intelligence & Global Security - Online 7 8 10 8 4 -4 10 14 14 14 12 -2 17 22 24 22 16 -6 New 3 4 5 4 1 -3 5 4 4 5 6 1 8 8 9 9 7 -2 Returning 4 4 5 4 3 -1 5 10 10 9 6 -3 9 14 15 13 9 -4
New 3 4 5 4 1 -3 5 4 4 5 6 1 8 8 9 9 7 -2Returning 4 4 5 4 3 -1 5 10 10 9 6 -3 9 14 15 13 9 -4
CrimJustice&IntelStds-Online GR Total 7 8 10 8 4 -4 10 14 14 14 12 -2 17 22 24 22 16 -6
Full-time Part-time Total
Full-time Part-time Total

Enrollment
2020-21 Point Park University Factbook * 50
Table 4.15. (Continued)School / Department / Student-TypeDept. of Criminal Justice & Intelligence Studies (School of Arts & Sciences) (cont.)
GraduateFA16 FA17 FA18 FA19 FA20 Var. FA16 FA17 FA18 FA19 FA20 Var. FA16 FA17 FA18 FA19 FA20 Var.
Criminal Justice Administration 13 4 5 9 8 -1 1 0 0 0 1 1 14 4 5 9 9 0 New 10 4 5 9 8 -1 1 0 0 0 1 1 11 4 5 9 9 0 Returning 3 0 0 0 0 0 0 0 0 0 0 0 3 0 0 0 0 0Intelligence & Global Security/Masters 12 14 9 0 0 0 5 2 2 0 0 0 17 16 11 0 0 0 New 9 11 7 0 0 0 3 2 0 0 0 0 12 13 7 0 0 0 Returning 3 3 2 0 0 0 2 0 2 0 0 0 5 3 4 0 0 0
New 19 15 12 9 8 -1 4 2 0 0 1 1 23 17 12 9 9 0Returning 6 3 2 0 0 0 2 0 2 0 0 0 8 3 4 0 0 0
CrimJustice&IntelStds-Graduate Total 25 18 14 9 8 -1 6 2 2 0 1 1 31 20 16 9 9 0
FA16 FA17 FA18 FA19 FA20 Var. FA16 FA17 FA18 FA19 FA20 Var. FA16 FA17 FA18 FA19 FA20 Var.New 92 79 90 79 55 -24 24 14 6 12 14 2 116 93 96 91 69 -22
Returning 143 153 153 130 121 -9 32 37 34 29 27 -2 175 190 187 159 148 -11Criminal Justice & Intel Stds - TOTAL 235 232 243 209 176 -33 56 51 40 41 41 0 291 283 283 250 217 -33
Full-time Part-time Total
Full-time Part-time Total

Enrollment
2020-21 Point Park University Factbook * 51
Table 4.15. (Continued)School / Department / Student-TypeDept. of Humanities & Social Sciences (School of Arts & Sciences)
Regular UndergraduateFA16 FA17 FA18 FA19 FA20 Var. FA16 FA17 FA18 FA19 FA20 Var. FA16 FA17 FA18 FA19 FA20 Var.
Global Cultural Studies 19 19 16 14 12 -2 0 1 0 0 0 0 19 20 16 14 12 -2 New 5 8 5 3 2 -1 0 0 0 0 0 0 5 8 5 3 2 -1 Returning 14 11 11 11 10 -1 0 1 0 0 0 0 14 12 11 11 10 -1History 14 16 10 8 6 -2 2 1 1 0 0 0 16 17 11 8 6 -2 New 5 6 2 1 0 -1 1 1 0 0 0 0 6 7 2 1 0 -1 Returning 9 10 8 7 6 -1 1 0 1 0 0 0 10 10 9 7 6 -1Interdisciplinary Design 0 1 5 5 10 5 0 0 0 1 1 0 0 1 5 6 11 5 New 0 1 0 1 0 -1 0 0 0 0 0 0 0 1 0 1 0 -1 Returning 0 0 5 4 10 6 0 0 0 1 1 0 0 0 5 5 11 6Interdisciplinary Studies 0 0 0 0 4 4 0 0 0 0 1 1 0 0 0 0 5 5 New 0 0 0 0 2 2 0 0 0 0 1 1 0 0 0 0 3 3 Returning 0 0 0 0 2 2 0 0 0 0 0 0 0 0 0 0 2 2Legal Studies 11 9 11 8 14 6 3 6 1 2 1 -1 14 15 12 10 15 5 New 6 4 3 2 4 2 1 1 0 0 0 0 7 5 3 2 4 2 Returning 5 5 8 6 10 4 2 5 1 2 1 -1 7 10 9 8 11 3Legal Studies (Capstone) 1 1 0 0 0 0 2 0 0 0 0 0 3 1 0 0 0 0 New 0 0 0 0 0 0 0 0 0 0 0 0 0 0 0 0 0 0 Returning 1 1 0 0 0 0 2 0 0 0 0 0 3 1 0 0 0 0Liberal Studies 4 2 7 7 6 -1 3 1 1 1 1 0 7 3 8 8 7 -1 New 1 2 5 2 2 0 0 0 1 1 1 0 1 2 6 3 3 0 Returning 3 0 2 5 4 -1 3 1 0 0 0 0 6 1 2 5 4 -1Liberal Studies (Capstone) 0 0 0 0 0 0 0 1 0 0 0 0 0 1 0 0 0 0 New 0 0 0 0 0 0 0 0 0 0 0 0 0 0 0 0 0 0 Returning 0 0 0 0 0 0 0 1 0 0 0 0 0 1 0 0 0 0Political Science 14 23 23 23 25 2 1 1 0 0 1 1 15 24 23 23 26 3 New 3 15 9 6 4 -2 0 0 0 0 0 0 3 15 9 6 4 -2 Returning 11 8 14 17 21 4 1 1 0 0 1 1 12 9 14 17 22 5
New 20 36 24 15 14 -1 2 2 1 1 2 1 22 38 25 16 16 0Returning 43 35 48 50 63 13 9 9 2 3 3 0 52 44 50 53 66 13
Humanities&Social Sci-Regular UG Total 63 71 72 65 77 12 11 11 3 4 5 1 74 82 75 69 82 13
Full-time Part-time Total

Enrollment
2020-21 Point Park University Factbook * 52
Table 4.15. (Continued)School / Department / Student-TypeDept. of Humanities & Social Sciences (School of Arts & Sciences) (cont.)
Online UndergraduateFA16 FA17 FA18 FA19 FA20 Var. FA16 FA17 FA18 FA19 FA20 Var. FA16 FA17 FA18 FA19 FA20 Var.
Interdisciplinary Design - Online 0 2 4 4 2 -2 0 2 2 7 5 -2 0 4 6 11 7 -4 New 0 1 2 0 0 0 0 1 0 0 0 0 0 2 2 0 0 0 Returning 0 1 2 4 2 -2 0 1 2 7 5 -2 0 2 4 11 7 -4Interdisciplinary Studies - Online 0 0 0 0 0 0 0 0 0 0 1 1 0 0 0 0 1 1 New 0 0 0 0 0 0 0 0 0 0 0 0 0 0 0 0 0 0 Returning 0 0 0 0 0 0 0 0 0 0 1 1 0 0 0 0 1 1
New 0 1 2 0 0 0 0 1 0 0 0 0 0 2 2 0 0 0Returning 0 1 2 4 2 -2 0 1 2 7 6 -1 0 2 4 11 8 -3
Humanities&Social Sci-Online UG Total 0 2 4 4 2 -2 0 2 2 7 6 -1 0 4 6 11 8 -3
FA16 FA17 FA18 FA19 FA20 Var. FA16 FA17 FA18 FA19 FA20 Var. FA16 FA17 FA18 FA19 FA20 Var.New 20 37 26 15 14 -1 2 3 1 1 2 1 22 40 27 16 16 0
Returning 43 36 50 54 65 11 9 10 4 10 9 -1 52 46 54 64 74 10Humanities&Social Sciences - TOTAL 63 73 76 69 79 10 11 13 5 11 11 0 74 86 81 80 90 10
Full-time Part-time Total
Full-time Part-time Total
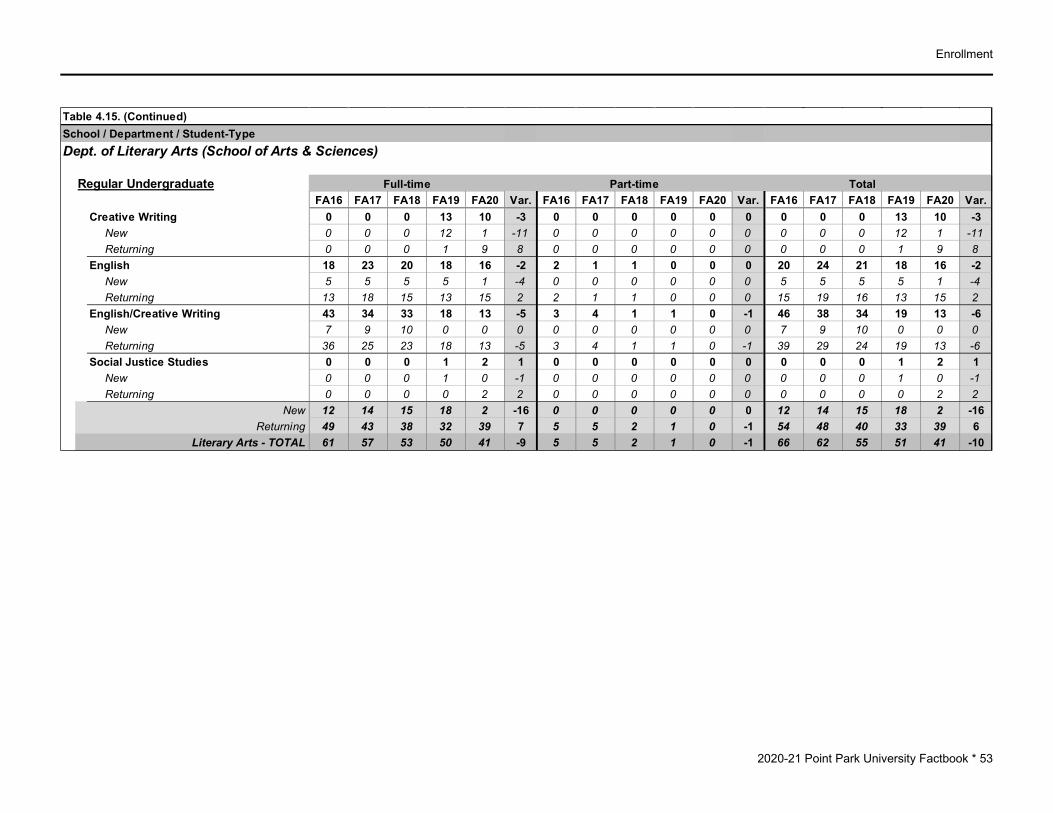
Enrollment
2020-21 Point Park University Factbook * 53
Table 4.15. (Continued)School / Department / Student-TypeDept. of Literary Arts (School of Arts & Sciences)
Regular UndergraduateFA16 FA17 FA18 FA19 FA20 Var. FA16 FA17 FA18 FA19 FA20 Var. FA16 FA17 FA18 FA19 FA20 Var.
Creative Writing 0 0 0 13 10 -3 0 0 0 0 0 0 0 0 0 13 10 -3 New 0 0 0 12 1 -11 0 0 0 0 0 0 0 0 0 12 1 -11 Returning 0 0 0 1 9 8 0 0 0 0 0 0 0 0 0 1 9 8English 18 23 20 18 16 -2 2 1 1 0 0 0 20 24 21 18 16 -2 New 5 5 5 5 1 -4 0 0 0 0 0 0 5 5 5 5 1 -4 Returning 13 18 15 13 15 2 2 1 1 0 0 0 15 19 16 13 15 2English/Creative Writing 43 34 33 18 13 -5 3 4 1 1 0 -1 46 38 34 19 13 -6 New 7 9 10 0 0 0 0 0 0 0 0 0 7 9 10 0 0 0 Returning 36 25 23 18 13 -5 3 4 1 1 0 -1 39 29 24 19 13 -6Social Justice Studies 0 0 0 1 2 1 0 0 0 0 0 0 0 0 0 1 2 1 New 0 0 0 1 0 -1 0 0 0 0 0 0 0 0 0 1 0 -1 Returning 0 0 0 0 2 2 0 0 0 0 0 0 0 0 0 0 2 2
New 12 14 15 18 2 -16 0 0 0 0 0 0 12 14 15 18 2 -16Returning 49 43 38 32 39 7 5 5 2 1 0 -1 54 48 40 33 39 6
Literary Arts - TOTAL 61 57 53 50 41 -9 5 5 2 1 0 -1 66 62 55 51 41 -10
Full-time Part-time Total

Enrollment
2020-21 Point Park University Factbook * 54
Table 4.15. (Continued)School / Department / Student-TypeDept. of Natural Sciences & Engineering Technology (School of Arts & Sciences)
Regular UndergraduateFA16 FA17 FA18 FA19 FA20 Var. FA16 FA17 FA18 FA19 FA20 Var. FA16 FA17 FA18 FA19 FA20 Var.
Biological Sciences 31 29 42 44 45 1 2 3 2 1 2 1 33 32 44 45 47 2 New 10 13 20 17 22 5 0 1 0 0 0 0 10 14 20 17 22 5 Returning 21 16 22 27 23 -4 2 2 2 1 2 1 23 18 24 28 25 -3Biotechnology 2 1 0 0 0 0 2 1 0 0 0 0 4 2 0 0 0 0 New 0 0 0 0 0 0 0 0 0 0 0 0 0 0 0 0 0 0 Returning 2 1 0 0 0 0 2 1 0 0 0 0 4 2 0 0 0 0Biotechnology (Capstone) 0 0 0 0 0 0 1 1 0 0 0 0 1 1 0 0 0 0 New 0 0 0 0 0 0 1 0 0 0 0 0 1 0 0 0 0 0 Returning 0 0 0 0 0 0 0 1 0 0 0 0 0 1 0 0 0 0Civil Eng Technology 42 41 33 34 28 -6 21 14 17 11 8 -3 63 55 50 45 36 -9 New 12 15 7 8 3 -5 2 1 2 0 0 0 14 16 9 8 3 -5 Returning 30 26 26 26 25 -1 19 13 15 11 8 -3 49 39 41 37 33 -4Electrical Engineering 6 9 12 18 17 -1 8 15 14 15 8 -7 14 24 26 33 25 -8 New 5 5 3 7 4 -3 2 3 0 1 0 -1 7 8 3 8 4 -4 Returning 1 4 9 11 13 2 6 12 14 14 8 -6 7 16 23 25 21 -4Electrical Engineering - Undeclared 0 4 7 6 5 -1 0 6 6 4 4 0 0 10 13 10 9 -1 New 0 3 2 2 2 0 0 4 1 1 2 1 0 7 3 3 4 1 Returning 0 1 5 4 3 -1 0 2 5 3 2 -1 0 3 10 7 5 -2Electrical Eng Technology 50 35 21 6 2 -4 41 17 10 4 1 -3 91 52 31 10 3 -7 New 18 1 0 0 0 0 4 1 0 0 1 1 22 2 0 0 1 1 Returning 32 34 21 6 2 -4 37 16 10 4 0 -4 69 50 31 10 2 -8Electrical Eng Technology (BS/MS) 0 0 1 0 0 0 0 0 0 0 0 0 0 0 1 0 0 0 New 0 0 0 0 0 0 0 0 0 0 0 0 0 0 0 0 0 0 Returning 0 0 1 0 0 0 0 0 0 0 0 0 0 0 1 0 0 0Funeral Services 10 16 21 22 12 -10 1 0 0 0 0 0 11 16 21 22 12 -10 New 7 12 10 13 0 -13 0 0 0 0 0 0 7 12 10 13 0 -13 Returning 3 4 11 9 12 3 1 0 0 0 0 0 4 4 11 9 12 3
Full-time Part-time Total

Enrollment
2020-21 Point Park University Factbook * 55
Table 4.15. (Continued)School / Department / Student-TypeDept. of Natural Sciences & Engineering Technology (School of Arts & Sciences) (cont.)
Regular Undergraduate (cont.)FA16 FA17 FA18 FA19 FA20 Var. FA16 FA17 FA18 FA19 FA20 Var. FA16 FA17 FA18 FA19 FA20 Var.
Funeral Services (Capstone) 10 6 3 0 2 2 1 1 1 1 1 0 11 7 4 1 3 2 New 5 1 1 0 2 2 1 0 0 0 0 0 6 1 1 0 2 2 Returning 5 5 2 0 0 0 0 1 1 1 1 0 5 6 3 1 1 0Funeral Services (Capstone)-Undecl. 7 7 6 6 3 -3 0 0 0 0 1 1 7 7 6 6 4 -2 New 4 7 5 6 0 -6 0 0 0 0 1 1 4 7 5 6 1 -5 Returning 3 0 1 0 3 3 0 0 0 0 0 0 3 0 1 0 3 3Health Services 2 1 0 0 0 0 1 1 0 0 0 0 3 2 0 0 0 0 New 0 0 0 0 0 0 0 0 0 0 0 0 0 0 0 0 0 0 Returning 2 1 0 0 0 0 1 1 0 0 0 0 3 2 0 0 0 0Health Services - Undeclared 1 0 0 0 0 0 3 2 1 1 0 -1 4 2 1 1 0 -1 New 0 0 0 0 0 0 0 0 0 0 0 0 0 0 0 0 0 0 Returning 1 0 0 0 0 0 3 2 1 1 0 -1 4 2 1 1 0 -1Mechanical Engineering 0 9 14 22 23 1 0 5 7 8 15 7 0 14 21 30 38 8 New 0 2 3 8 9 1 0 2 1 1 0 -1 0 4 4 9 9 0 Returning 0 7 11 14 14 0 0 3 6 7 15 8 0 10 17 21 29 8Mechanical Engineering - Undeclared 0 7 5 8 8 0 0 2 4 7 3 -4 0 9 9 15 11 -4 New 0 5 1 6 5 -1 0 1 1 2 0 -2 0 6 2 8 5 -3 Returning 0 2 4 2 3 1 0 1 3 5 3 -2 0 3 7 7 6 -1Mechanical Eng Technology 65 39 23 9 1 -8 25 19 11 11 4 -7 90 58 34 20 5 -15 New 15 2 0 0 0 0 3 0 0 0 0 0 18 2 0 0 0 0 Returning 50 37 23 9 1 -8 22 19 11 11 4 -7 72 56 34 20 5 -15Premedical & PreProfessional Studies 26 23 10 5 3 -2 1 2 0 0 0 0 27 25 10 5 3 -2 New 8 11 0 0 0 0 0 0 0 0 0 0 8 11 0 0 0 0 Returning 18 12 10 5 3 -2 1 2 0 0 0 0 19 14 10 5 3 -2Specialized Funeral Services 0 0 0 0 7 7 0 0 0 0 0 0 0 0 0 0 7 7 New 0 0 0 0 7 7 0 0 0 0 0 0 0 0 0 0 7 7 Returning 0 0 0 0 0 0 0 0 0 0 0 0 0 0 0 0 0 0
New 84 77 52 67 54 -13 13 13 5 5 4 -1 97 90 57 72 58 -14Returning 168 150 146 113 102 -11 94 76 68 58 43 -15 262 226 214 171 145 -26
Nat Sci & Engr Tech-Regular UG Total 252 227 198 180 156 -24 107 89 73 63 47 -16 359 316 271 243 203 -40
Full-time Part-time Total

Enrollment
2020-21 Point Park University Factbook * 56
Table 4.15. (Continued)School / Department / Student-TypeDept. of Natural Sciences & Engineering Technology (School of Arts & Sciences) (cont.)
GraduateFA16 FA17 FA18 FA19 FA20 Var. FA16 FA17 FA18 FA19 FA20 Var. FA16 FA17 FA18 FA19 FA20 Var.
Engineering Management 2 15 17 9 3 -6 11 6 11 9 3 -6 13 21 28 18 6 -12 New 2 11 8 5 1 -4 3 3 1 0 2 2 5 14 9 5 3 -2 Returning 0 4 9 4 2 -2 8 3 10 9 1 -8 8 7 19 13 3 -10Environmental Studies 8 7 4 4 5 1 4 7 7 1 0 -1 12 14 11 5 5 0 New 4 7 4 4 5 1 1 7 0 0 0 0 5 14 4 4 5 1 Returning 4 0 0 0 0 0 3 0 7 1 0 -1 7 0 7 1 0 -1
New 6 18 12 9 6 -3 4 10 1 0 2 2 10 28 13 9 8 -1Returning 4 4 9 4 2 -2 11 3 17 10 1 -9 15 7 26 14 3 -11
Nat Sci & Engr Tech-Graduate Total 10 22 21 13 8 -5 15 13 18 10 3 -7 25 35 39 23 11 -12
FA16 FA17 FA18 FA19 FA20 Var. FA16 FA17 FA18 FA19 FA20 Var. FA16 FA17 FA18 FA19 FA20 Var.New 90 95 64 76 60 -16 17 23 6 5 6 1 107 118 70 81 66 -15
Returning 172 154 155 117 104 -13 105 79 85 68 44 -24 277 233 240 185 148 -37Natural Sciences & Engr Tech - TOTAL 262 249 219 193 164 -29 122 102 91 73 50 -23 384 351 310 266 214 -52
Full-time Part-time Total
Full-time Part-time Total
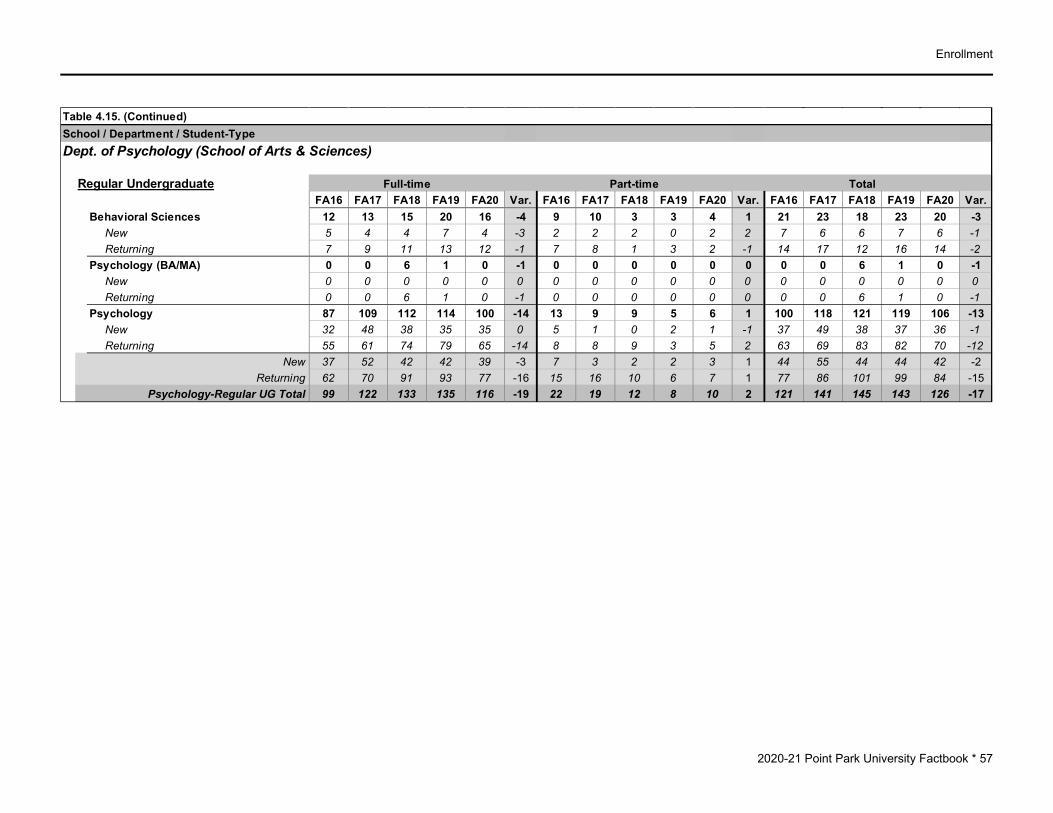
Enrollment
2020-21 Point Park University Factbook * 57
Table 4.15. (Continued)School / Department / Student-TypeDept. of Psychology (School of Arts & Sciences)
Regular UndergraduateFA16 FA17 FA18 FA19 FA20 Var. FA16 FA17 FA18 FA19 FA20 Var. FA16 FA17 FA18 FA19 FA20 Var.
Behavioral Sciences 12 13 15 20 16 -4 9 10 3 3 4 1 21 23 18 23 20 -3 New 5 4 4 7 4 -3 2 2 2 0 2 2 7 6 6 7 6 -1 Returning 7 9 11 13 12 -1 7 8 1 3 2 -1 14 17 12 16 14 -2Psychology (BA/MA) 0 0 6 1 0 -1 0 0 0 0 0 0 0 0 6 1 0 -1 New 0 0 0 0 0 0 0 0 0 0 0 0 0 0 0 0 0 0 Returning 0 0 6 1 0 -1 0 0 0 0 0 0 0 0 6 1 0 -1Psychology 87 109 112 114 100 -14 13 9 9 5 6 1 100 118 121 119 106 -13 New 32 48 38 35 35 0 5 1 0 2 1 -1 37 49 38 37 36 -1 Returning 55 61 74 79 65 -14 8 8 9 3 5 2 63 69 83 82 70 -12
New 37 52 42 42 39 -3 7 3 2 2 3 1 44 55 44 44 42 -2Returning 62 70 91 93 77 -16 15 16 10 6 7 1 77 86 101 99 84 -15
Psychology-Regular UG Total 99 122 133 135 116 -19 22 19 12 8 10 2 121 141 145 143 126 -17
Full-time Part-time Total

Enrollment
2020-21 Point Park University Factbook * 58
Table 4.15. (Continued)School / Department / Student-TypeDept. of Psychology (School of Arts & Sciences) (cont.)
GraduateFA16 FA17 FA18 FA19 FA20 Var. FA16 FA17 FA18 FA19 FA20 Var. FA16 FA17 FA18 FA19 FA20 Var.
Clinical-Community Psychology/Masters 30 12 11 3 0 -3 17 20 16 5 3 -2 47 32 27 8 3 -5 New 8 6 6 0 0 0 2 4 3 0 0 0 10 10 9 0 0 0 Returning 22 6 5 3 0 -3 15 16 13 5 3 -2 37 22 18 8 3 -5Clinical-Community Psychology (Doct.) 0 12 16 18 11 -7 0 0 0 4 10 6 0 12 16 22 21 -1 New 0 12 7 8 0 -8 0 0 0 0 0 0 0 12 7 8 0 -8 Returning 0 0 9 10 11 1 0 0 0 4 10 6 0 0 9 14 21 7Clinical Psychology (Doctorate) 0 0 0 0 7 7 0 0 0 0 0 0 0 0 0 0 7 7 New 0 0 0 0 7 7 0 0 0 0 0 0 0 0 0 0 7 7 Returning 0 0 0 0 0 0 0 0 0 0 0 0 0 0 0 0 0 0Community Psychology/Masters 0 0 0 10 15 5 0 0 0 1 3 2 0 0 0 11 18 7 New 0 0 0 10 13 3 0 0 0 1 0 -1 0 0 0 11 13 2 Returning 0 0 0 0 2 2 0 0 0 0 3 3 0 0 0 0 5 5
New 8 18 13 18 20 2 2 4 3 1 0 -1 10 22 16 19 20 1Returning 22 6 14 13 13 0 15 16 13 9 16 7 37 22 27 22 29 7
Psychology-Graduate Total 30 24 27 31 33 2 17 20 16 10 16 6 47 44 43 41 49 8
FA16 FA17 FA18 FA19 FA20 Var. FA16 FA17 FA18 FA19 FA20 Var. FA16 FA17 FA18 FA19 FA20 Var.New 45 70 55 60 59 -1 9 7 5 3 3 0 54 77 60 63 62 -1
Returning 84 76 105 106 90 -16 30 32 23 15 23 8 114 108 128 121 113 -8Psychology - TOTAL 129 146 160 166 149 -17 39 39 28 18 26 8 168 185 188 184 175 -9
Full-time Part-time Total
Full-time Part-time Total
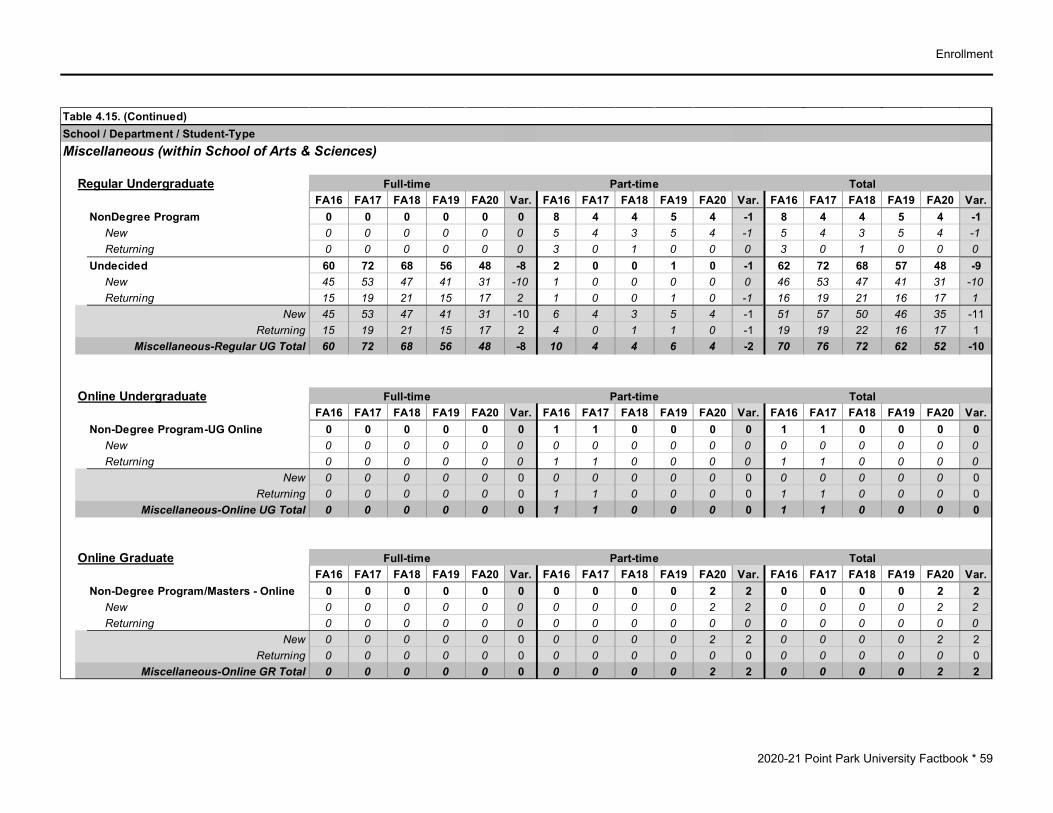
Enrollment
2020-21 Point Park University Factbook * 59
Table 4.15. (Continued)School / Department / Student-TypeMiscellaneous (within School of Arts & Sciences)
Regular UndergraduateFA16 FA17 FA18 FA19 FA20 Var. FA16 FA17 FA18 FA19 FA20 Var. FA16 FA17 FA18 FA19 FA20 Var.
NonDegree Program 0 0 0 0 0 0 8 4 4 5 4 -1 8 4 4 5 4 -1 New 0 0 0 0 0 0 5 4 3 5 4 -1 5 4 3 5 4 -1 Returning 0 0 0 0 0 0 3 0 1 0 0 0 3 0 1 0 0 0Undecided 60 72 68 56 48 -8 2 0 0 1 0 -1 62 72 68 57 48 -9 New 45 53 47 41 31 -10 1 0 0 0 0 0 46 53 47 41 31 -10 Returning 15 19 21 15 17 2 1 0 0 1 0 -1 16 19 21 16 17 1
New 45 53 47 41 31 -10 6 4 3 5 4 -1 51 57 50 46 35 -11Returning 15 19 21 15 17 2 4 0 1 1 0 -1 19 19 22 16 17 1
Miscellaneous-Regular UG Total 60 72 68 56 48 -8 10 4 4 6 4 -2 70 76 72 62 52 -10
Online UndergraduateFA16 FA17 FA18 FA19 FA20 Var. FA16 FA17 FA18 FA19 FA20 Var. FA16 FA17 FA18 FA19 FA20 Var.
Non-Degree Program-UG Online 0 0 0 0 0 0 1 1 0 0 0 0 1 1 0 0 0 0 New 0 0 0 0 0 0 0 0 0 0 0 0 0 0 0 0 0 0 Returning 0 0 0 0 0 0 1 1 0 0 0 0 1 1 0 0 0 0
New 0 0 0 0 0 0 0 0 0 0 0 0 0 0 0 0 0 0Returning 0 0 0 0 0 0 1 1 0 0 0 0 1 1 0 0 0 0
Miscellaneous-Online UG Total 0 0 0 0 0 0 1 1 0 0 0 0 1 1 0 0 0 0
Online GraduateFA16 FA17 FA18 FA19 FA20 Var. FA16 FA17 FA18 FA19 FA20 Var. FA16 FA17 FA18 FA19 FA20 Var.
Non-Degree Program/Masters - Online 0 0 0 0 0 0 0 0 0 0 2 2 0 0 0 0 2 2 New 0 0 0 0 0 0 0 0 0 0 2 2 0 0 0 0 2 2 Returning 0 0 0 0 0 0 0 0 0 0 0 0 0 0 0 0 0 0
New 0 0 0 0 0 0 0 0 0 0 2 2 0 0 0 0 2 2Returning 0 0 0 0 0 0 0 0 0 0 0 0 0 0 0 0 0 0
Miscellaneous-Online GR Total 0 0 0 0 0 0 0 0 0 0 2 2 0 0 0 0 2 2
Full-time Part-time Total
Full-time Part-time Total
Full-time Part-time Total

Enrollment
2020-21 Point Park University Factbook * 60
Table 4.15. (Continued)School / Department / Student-TypeMiscellaneous (within School of Arts & Sciences) (cont'd)
GraduateFA16 FA17 FA18 FA19 FA20 Var. FA16 FA17 FA18 FA19 FA20 Var. FA16 FA17 FA18 FA19 FA20 Var.
Non-Degree Program/Masters 0 0 0 0 0 0 3 9 1 0 0 0 3 9 1 0 0 0 New 0 0 0 0 0 0 2 8 1 0 0 0 2 8 1 0 0 0 Returning 0 0 0 0 0 0 1 1 0 0 0 0 1 1 0 0 0 0
New 0 0 0 0 0 0 2 8 1 0 0 0 2 8 1 0 0 0Returning 0 0 0 0 0 0 1 1 0 0 0 0 1 1 0 0 0 0
Miscellaneous-Graduate Total 0 0 0 0 0 0 3 9 1 0 0 0 3 9 1 0 0 0
FA16 FA17 FA18 FA19 FA20 Var. FA16 FA17 FA18 FA19 FA20 Var. FA16 FA17 FA18 FA19 FA20 Var.New 45 53 47 41 31 -10 8 12 4 5 6 1 53 65 51 46 37 -9
Returning 15 19 21 15 17 2 6 2 1 1 0 -1 21 21 22 16 17 1Miscellaneous A&S - TOTAL 60 72 68 56 48 -8 14 14 5 6 6 0 74 86 73 62 54 -8
Beginning in Fall 2020, UG Professional Development and GR Professional Development are reported under Miscellaneous (within School of Education).
FA16 FA17 FA18 FA19 FA20 Var. FA16 FA17 FA18 FA19 FA20 Var. FA16 FA17 FA18 FA19 FA20 Var.New 304 348 297 289 221 -68 60 59 22 26 31 5 364 407 319 315 252 -63
Returning 506 481 522 454 436 -18 187 165 149 124 103 -21 693 646 671 578 539 -39SCHOOL OF ARTS & SCIENCES - TOTAL 810 829 819 743 657 -86 247 224 171 150 134 -16 1057 1053 990 893 791 -102
Full-time Part-time Total
Full-time Part-time Total
Full-time Part-time Total

Enrollment
2020-21 Point Park University Factbook * 61
Table 4.15. (Continued)School / Department / Student-TypeDept. of Accounting, Econ-Finance & Info Tech (School of Business)
Regular UndergraduateFA16 FA17 FA18 FA19 FA20 Var. FA16 FA17 FA18 FA19 FA20 Var. FA16 FA17 FA18 FA19 FA20 Var.
Accounting 49 40 42 42 39 -3 15 14 4 4 3 -1 64 54 46 46 42 -4 New 13 11 10 10 14 4 3 1 1 1 0 -1 16 12 11 11 14 3 Returning 36 29 32 32 25 -7 12 13 3 3 3 0 48 42 35 35 28 -7Applied Computer Science 0 0 0 0 10 10 0 0 0 0 0 0 0 0 0 0 10 10 New 0 0 0 0 8 8 0 0 0 0 0 0 0 0 0 0 8 8 Returning 0 0 0 0 2 2 0 0 0 0 0 0 0 0 0 0 2 2Economics and Finance 16 20 18 15 17 2 2 2 1 2 2 0 18 22 19 17 19 2 New 3 6 4 4 7 3 1 0 1 0 0 0 4 6 5 4 7 3 Returning 13 14 14 11 10 -1 1 2 0 2 2 0 14 16 14 13 12 -1Information Technology 23 35 34 37 23 -14 4 6 7 3 1 -2 27 41 41 40 24 -16 New 7 12 9 14 0 -14 1 3 2 1 0 -1 8 15 11 15 0 -15 Returning 16 23 25 23 23 0 3 3 5 2 1 -1 19 26 30 25 24 -1
New 23 29 23 28 29 1 5 4 4 2 0 -2 28 33 27 30 29 -1Returning 65 66 71 66 60 -6 16 18 8 7 6 -1 81 84 79 73 66 -7
Acct, Econ-Fin, Info Tech-Regular UG Total 88 95 94 94 89 -5 21 22 12 9 6 -3 109 117 106 103 95 -8
Full-time Part-time Total

Enrollment
2020-21 Point Park University Factbook * 62
Table 4.15. (Continued)School / Department / Student-TypeDept. of Accounting, Econ-Finance & Info Tech (School of Business) (cont.)
Online UndergraduateFA16 FA17 FA18 FA19 FA20 Var. FA16 FA17 FA18 FA19 FA20 Var. FA16 FA17 FA18 FA19 FA20 Var.
Accounting - Online 18 21 13 8 8 0 7 13 16 20 13 -7 25 34 29 28 21 -7 New 5 4 1 0 2 2 4 2 5 3 0 -3 9 6 6 3 2 -1 Returning 13 17 12 8 6 -2 3 11 11 17 13 -4 16 28 23 25 19 -6Accounting-PB - Online 2 7 3 1 0 -1 2 5 4 4 0 -4 4 12 7 5 0 -5 New 1 2 1 0 0 0 0 3 1 1 0 -1 1 5 2 1 0 -1 Returning 1 5 2 1 0 -1 2 2 3 3 0 -3 3 7 5 4 0 -4Applied Computer Science - Online 0 0 0 0 2 2 0 0 0 0 3 3 0 0 0 0 5 5 New 0 0 0 0 0 0 0 0 0 0 3 3 0 0 0 0 3 3 Returning 0 0 0 0 2 2 0 0 0 0 0 0 0 0 0 0 2 2Information Technology - Online 12 14 16 10 9 -1 5 10 12 21 14 -7 17 24 28 31 23 -8 New 5 3 3 1 0 -1 1 4 2 4 0 -4 6 7 5 5 0 -5 Returning 7 11 13 9 9 0 4 6 10 17 14 -3 11 17 23 26 23 -3
New 11 9 5 1 2 1 5 9 8 8 3 -5 16 18 13 9 5 -4Returning 21 33 27 18 17 -1 9 19 24 37 27 -10 30 52 51 55 44 -11
Acct, Econ-Fin, Info Tech-Online UG Total 32 42 32 19 19 0 14 28 32 45 30 -15 46 70 64 64 49 -15
FA16 FA17 FA18 FA19 FA20 Var. FA16 FA17 FA18 FA19 FA20 Var. FA16 FA17 FA18 FA19 FA20 Var.New 34 38 28 29 31 2 10 13 12 10 3 -7 44 51 40 39 34 -5
Returning 86 99 98 84 77 -7 25 37 32 44 33 -11 111 136 130 128 110 -18Acct, Econ-Fin, Info Tech - TOTAL 120 137 126 113 108 -5 35 50 44 54 36 -18 155 187 170 167 144 -23
Full-time Part-time Total
Full-time Part-time Total

Enrollment
2020-21 Point Park University Factbook * 63
Table 4.15. (Continued)School / Department / Student-TypeDept. of Business Management (School of Business)
Regular UndergraduateFA16 FA17 FA18 FA19 FA20 Var. FA16 FA17 FA18 FA19 FA20 Var. FA16 FA17 FA18 FA19 FA20 Var.
Business Administration 0 0 0 0 1 1 0 0 0 0 0 0 0 0 0 0 1 1 New 0 0 0 0 1 1 0 0 0 0 0 0 0 0 0 0 1 1 Returning 0 0 0 0 0 0 0 0 0 0 0 0 0 0 0 0 0 0Business Mgmt 127 137 134 139 130 -9 32 20 11 13 6 -7 159 157 145 152 136 -16 New 47 53 35 44 41 -3 7 3 3 3 1 -2 54 56 38 47 42 -5 Returning 80 84 99 95 89 -6 25 17 8 10 5 -5 105 101 107 105 94 -11Human Resources Mgmt 18 21 14 13 22 9 8 4 3 5 4 -1 26 25 17 18 26 8 New 7 7 0 4 4 0 4 3 1 1 1 0 11 10 1 5 5 0 Returning 11 14 14 9 18 9 4 1 2 4 3 -1 15 15 16 13 21 8Human Resources Mgmt (Capstone) 8 3 1 0 0 0 7 2 0 0 0 0 15 5 1 0 0 0 New 0 0 0 0 0 0 0 0 0 0 0 0 0 0 0 0 0 0 Returning 8 3 1 0 0 0 7 2 0 0 0 0 15 5 1 0 0 0Management Services 0 0 0 0 0 0 3 3 1 0 0 0 3 3 1 0 0 0 New 0 0 0 0 0 0 1 0 0 0 0 0 1 0 0 0 0 0 Returning 0 0 0 0 0 0 2 3 1 0 0 0 2 3 1 0 0 0Marketing and Sales 0 0 0 8 29 21 0 0 0 0 0 0 0 0 0 8 29 21 New 0 0 0 7 17 10 0 0 0 0 0 0 0 0 0 7 17 10 Returning 0 0 0 1 12 11 0 0 0 0 0 0 0 0 0 1 12 11Organizational Leadership 1 1 1 1 0 -1 0 0 1 0 0 0 1 1 2 1 0 -1 New 0 1 1 1 0 -1 0 0 0 0 0 0 0 1 1 1 0 -1 Returning 1 0 0 0 0 0 0 0 1 0 0 0 1 0 1 0 0 0Public Administration 0 0 0 0 0 0 1 1 1 1 0 -1 1 1 1 1 0 -1 New 0 0 0 0 0 0 0 0 0 0 0 0 0 0 0 0 0 0 Returning 0 0 0 0 0 0 1 1 1 1 0 -1 1 1 1 1 0 -1
New 54 61 36 56 63 7 12 6 4 4 2 -2 66 67 40 60 65 5Returning 100 101 114 105 119 14 39 24 13 15 8 -7 139 125 127 120 127 7
Business Management-Regular UG Total 154 162 150 161 182 21 51 30 17 19 10 -9 205 192 167 180 192 12
Full-time Part-time Total

Enrollment
2020-21 Point Park University Factbook * 64
Table 4.15. (Continued)School / Department / Student-TypeDept. of Business Management (School of Business) (cont.)
Accelerated UndergraduateFA16 FA17 FA18 FA19 FA20 Var. FA16 FA17 FA18 FA19 FA20 Var. FA16 FA17 FA18 FA19 FA20 Var.
Business-Accelerated 4 0 0 0 0 0 0 0 0 0 0 0 4 0 0 0 0 0 New 0 0 0 0 0 0 0 0 0 0 0 0 0 0 0 0 0 0 Returning 4 0 0 0 0 0 0 0 0 0 0 0 4 0 0 0 0 0
New 0 0 0 0 0 0 0 0 0 0 0 0 0 0 0 0 0 0Returning 4 0 0 0 0 0 0 0 0 0 0 0 4 0 0 0 0 0
Business Management-Accel UG Total 4 0 0 0 0 0 0 0 0 0 0 0 4 0 0 0 0 0
Online UndergraduateFA16 FA17 FA18 FA19 FA20 Var. FA16 FA17 FA18 FA19 FA20 Var. FA16 FA17 FA18 FA19 FA20 Var.
Business - Online 3 2 0 0 0 0 2 3 1 0 0 0 5 5 1 0 0 0 New 0 0 0 0 0 0 0 0 0 0 0 0 0 0 0 0 0 0 Returning 3 2 0 0 0 0 2 3 1 0 0 0 5 5 1 0 0 0Business Administration - Online 0 0 0 0 0 0 0 0 0 0 1 1 0 0 0 0 1 1 New 0 0 0 0 0 0 0 0 0 0 0 0 0 0 0 0 0 0 Returning 0 0 0 0 0 0 0 0 0 0 1 1 0 0 0 0 1 1Business (Capstone) Online 8 0 0 0 0 0 9 3 0 0 0 0 17 3 0 0 0 0 New 0 0 0 0 0 0 0 0 0 0 0 0 0 0 0 0 0 0 Returning 8 0 0 0 0 0 9 3 0 0 0 0 17 3 0 0 0 0Business Management - Online 29 34 44 33 30 -3 27 39 47 35 29 -6 56 73 91 68 59 -9 New 12 5 15 6 4 -2 8 11 16 13 4 -9 20 16 31 19 8 -11 Returning 17 29 29 27 26 -1 19 28 31 22 25 3 36 57 60 49 51 2Human Resources Mgmt - Online 0 0 3 4 10 6 0 0 6 15 16 1 0 0 9 19 26 7 New 0 0 1 0 2 2 0 0 5 2 4 2 0 0 6 2 6 4 Returning 0 0 2 4 8 4 0 0 1 13 12 -1 0 0 3 17 20 3Marketing and Sales - Online 0 0 0 2 6 4 0 0 0 3 3 0 0 0 0 5 9 4 New 0 0 0 2 1 -1 0 0 0 3 0 -3 0 0 0 5 1 -4 Returning 0 0 0 0 5 5 0 0 0 0 3 3 0 0 0 0 8 8
Full-time Part-time Total
Full-time Part-time Total

Enrollment
2020-21 Point Park University Factbook * 65
Table 4.15. (Continued)School / Department / Student-TypeDept. of Business Management (School of Business) (cont.)
Online Undergraduate (cont'd)FA16 FA17 FA18 FA19 FA20 Var. FA16 FA17 FA18 FA19 FA20 Var. FA16 FA17 FA18 FA19 FA20 Var.
Organizational Leadership - Online 14 15 11 8 9 1 13 16 17 20 14 -6 27 31 28 28 23 -5 New 3 4 2 0 3 3 8 2 2 4 5 1 11 6 4 4 8 4 Returning 11 11 9 8 6 -2 5 14 15 16 9 -7 16 25 24 24 15 -9Organizational Leadership (Cap.) Online 5 1 0 0 0 0 9 5 1 1 0 -1 14 6 1 1 0 -1 New 0 0 0 0 0 0 0 0 0 0 0 0 0 0 0 0 0 0 Returning 5 1 0 0 0 0 9 5 1 1 0 -1 14 6 1 1 0 -1Public Administration (Cert.) Online 0 0 0 0 0 0 1 0 0 0 0 0 1 0 0 0 0 0 New 0 0 0 0 0 0 0 0 0 0 0 0 0 0 0 0 0 0 Returning 0 0 0 0 0 0 1 0 0 0 0 0 1 0 0 0 0 0Public Administration - Online 14 12 13 11 4 -7 13 25 22 15 15 0 27 37 35 26 19 -7 New 3 4 1 0 1 1 4 5 5 3 2 -1 7 9 6 3 3 0 Returning 11 8 12 11 3 -8 9 20 17 12 13 1 20 28 29 23 16 -7Public Administration (Capstone) Online 5 0 0 0 0 0 5 1 0 0 0 0 10 1 0 0 0 0 New 0 0 0 0 0 0 0 0 0 0 0 0 0 0 0 0 0 0 Returning 5 0 0 0 0 0 5 1 0 0 0 0 10 1 0 0 0 0
New 18 13 19 8 11 3 20 18 28 25 15 -10 38 31 47 33 26 -7Returning 60 51 52 50 48 -2 59 74 66 64 63 -1 119 125 118 114 111 -3
Business Management-Online UG Total 78 64 71 58 59 1 79 92 94 89 78 -11 157 156 165 147 137 -10
Online GraduateFA16 FA17 FA18 FA19 FA20 Var. FA16 FA17 FA18 FA19 FA20 Var. FA16 FA17 FA18 FA19 FA20 Var.
Healthcare Admin & Mgmt - Online 1 1 3 0 1 1 55 75 53 51 37 -14 56 76 56 51 38 -13 New 0 0 0 0 0 0 22 14 12 14 13 -1 22 14 12 14 13 -1 Returning 1 1 3 0 1 1 33 61 41 37 24 -13 34 62 44 37 25 -12Master of Business Admin - Online 24 50 58 45 25 -20 54 92 82 70 63 -7 78 142 140 115 88 -27 New 7 19 22 8 9 1 30 17 8 15 13 -2 37 36 30 23 22 -1 Returning 17 31 36 37 16 -21 24 75 74 55 50 -5 41 106 110 92 66 -26
New 7 19 22 8 9 1 52 31 20 29 26 -3 59 50 42 37 35 -2Returning 18 32 39 37 17 -20 57 136 115 92 74 -18 75 168 154 129 91 -38
Business Management-Online GR Total 25 51 61 45 26 -19 109 167 135 121 100 -21 134 218 196 166 126 -40
Full-time Part-time Total
Full-time Part-time Total
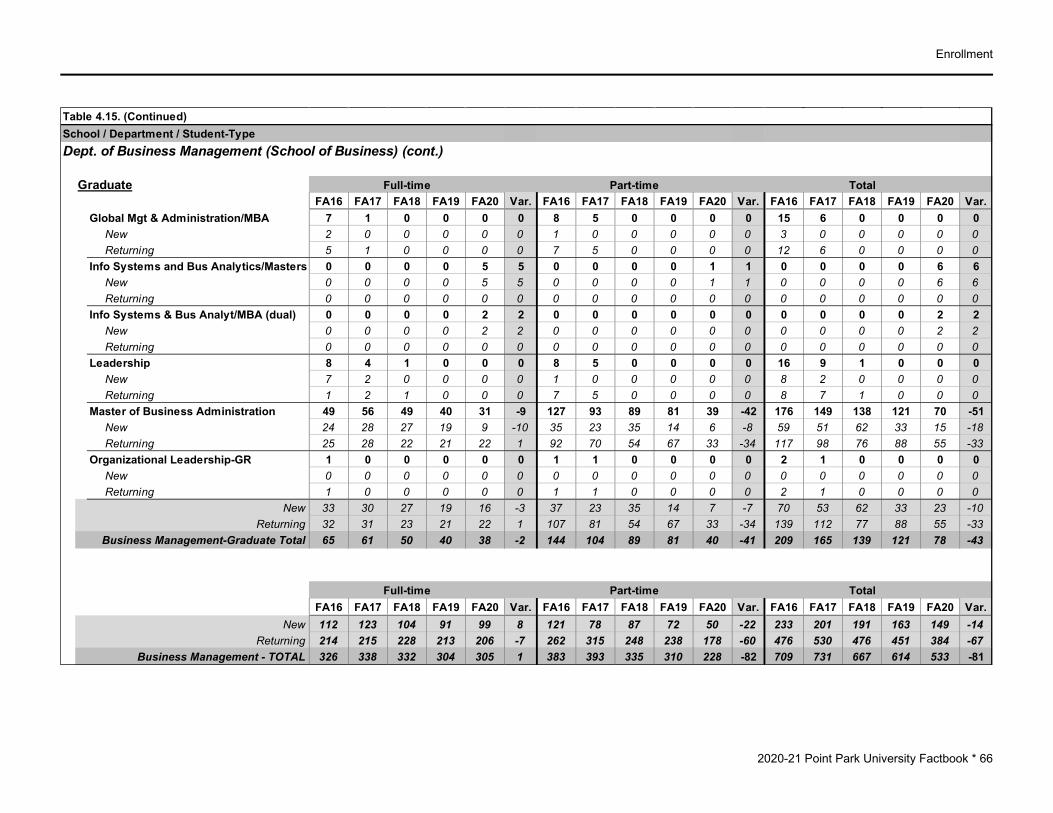
Enrollment
2020-21 Point Park University Factbook * 66
Table 4.15. (Continued)School / Department / Student-TypeDept. of Business Management (School of Business) (cont.)
GraduateFA16 FA17 FA18 FA19 FA20 Var. FA16 FA17 FA18 FA19 FA20 Var. FA16 FA17 FA18 FA19 FA20 Var.
Global Mgt & Administration/MBA 7 1 0 0 0 0 8 5 0 0 0 0 15 6 0 0 0 0 New 2 0 0 0 0 0 1 0 0 0 0 0 3 0 0 0 0 0 Returning 5 1 0 0 0 0 7 5 0 0 0 0 12 6 0 0 0 0Info Systems and Bus Analytics/Masters 0 0 0 0 5 5 0 0 0 0 1 1 0 0 0 0 6 6 New 0 0 0 0 5 5 0 0 0 0 1 1 0 0 0 0 6 6 Returning 0 0 0 0 0 0 0 0 0 0 0 0 0 0 0 0 0 0Info Systems & Bus Analyt/MBA (dual) 0 0 0 0 2 2 0 0 0 0 0 0 0 0 0 0 2 2 New 0 0 0 0 2 2 0 0 0 0 0 0 0 0 0 0 2 2 Returning 0 0 0 0 0 0 0 0 0 0 0 0 0 0 0 0 0 0Leadership 8 4 1 0 0 0 8 5 0 0 0 0 16 9 1 0 0 0 New 7 2 0 0 0 0 1 0 0 0 0 0 8 2 0 0 0 0 Returning 1 2 1 0 0 0 7 5 0 0 0 0 8 7 1 0 0 0Master of Business Administration 49 56 49 40 31 -9 127 93 89 81 39 -42 176 149 138 121 70 -51 New 24 28 27 19 9 -10 35 23 35 14 6 -8 59 51 62 33 15 -18 Returning 25 28 22 21 22 1 92 70 54 67 33 -34 117 98 76 88 55 -33Organizational Leadership-GR 1 0 0 0 0 0 1 1 0 0 0 0 2 1 0 0 0 0 New 0 0 0 0 0 0 0 0 0 0 0 0 0 0 0 0 0 0 Returning 1 0 0 0 0 0 1 1 0 0 0 0 2 1 0 0 0 0
New 33 30 27 19 16 -3 37 23 35 14 7 -7 70 53 62 33 23 -10Returning 32 31 23 21 22 1 107 81 54 67 33 -34 139 112 77 88 55 -33
Business Management-Graduate Total 65 61 50 40 38 -2 144 104 89 81 40 -41 209 165 139 121 78 -43
FA16 FA17 FA18 FA19 FA20 Var. FA16 FA17 FA18 FA19 FA20 Var. FA16 FA17 FA18 FA19 FA20 Var.New 112 123 104 91 99 8 121 78 87 72 50 -22 233 201 191 163 149 -14
Returning 214 215 228 213 206 -7 262 315 248 238 178 -60 476 530 476 451 384 -67Business Management - TOTAL 326 338 332 304 305 1 383 393 335 310 228 -82 709 731 667 614 533 -81
Full-time Part-time Total
Full-time Part-time Total

Enrollment
2020-21 Point Park University Factbook * 67
Table 4.15. (Continued)School / Department / Student-TypeDept. of Sports, Arts and Entertainment Mgmt (School of Business)
Regular UndergraduateFA16 FA17 FA18 FA19 FA20 Var. FA16 FA17 FA18 FA19 FA20 Var. FA16 FA17 FA18 FA19 FA20 Var.
Sports, Arts and Entertainment Mgt 284 278 273 263 215 -48 5 10 7 4 6 2 289 288 280 267 221 -46 New 83 80 62 76 52 -24 1 4 2 0 0 0 84 84 64 76 52 -24 Returning 201 198 211 187 163 -24 4 6 5 4 6 2 205 204 216 191 169 -22
New 83 80 62 76 52 -24 1 4 2 0 0 0 84 84 64 76 52 -24Returning 201 198 211 187 163 -24 4 6 5 4 6 2 205 204 216 191 169 -22
Sports, Arts and Entertain Mgt - TOTAL 284 278 273 263 215 -48 5 10 7 4 6 2 289 288 280 267 221 -46
FA16 FA17 FA18 FA19 FA20 Var. FA16 FA17 FA18 FA19 FA20 Var. FA16 FA17 FA18 FA19 FA20 Var.New 229 241 194 196 182 -14 132 95 101 82 53 -29 361 336 295 278 235 -43
Returning 501 512 537 484 446 -38 291 358 285 286 217 -69 792 870 822 770 663 -107SCHOOL OF BUSINESS - TOTAL 730 753 731 680 628 -52 423 453 386 368 270 -98 1153 1206 1117 1048 898 -150
Full-time Part-time Total
Full-time Part-time Total
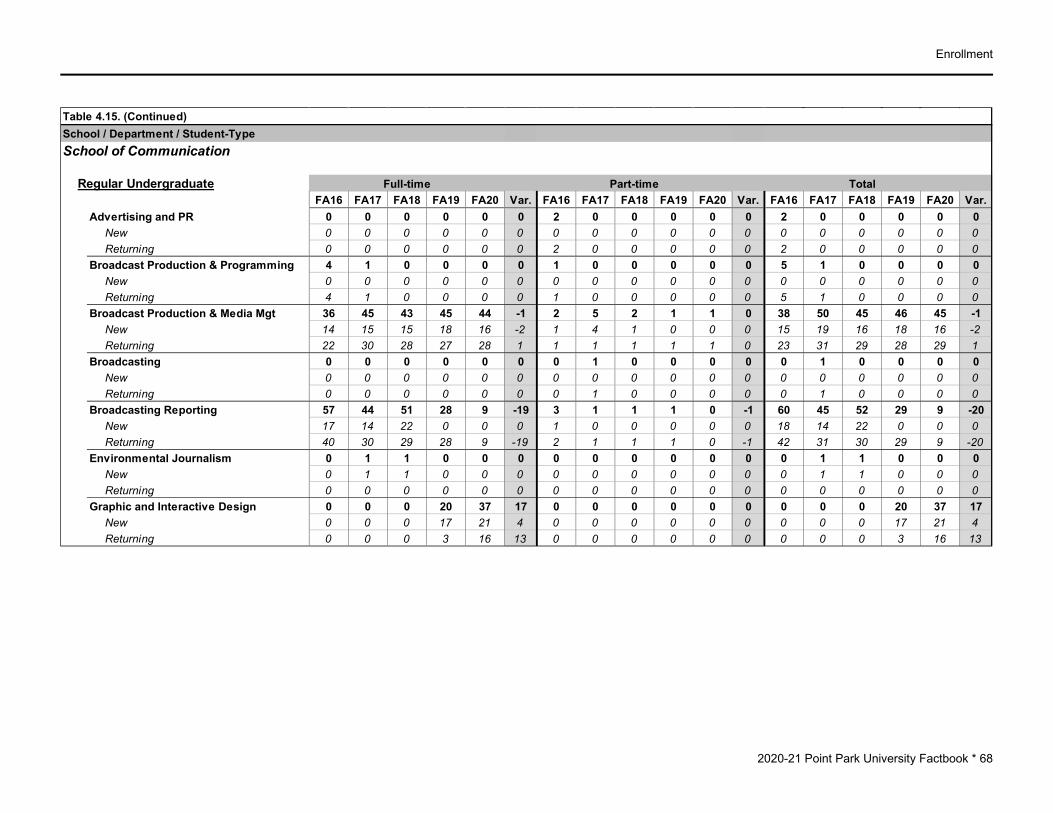
Enrollment
2020-21 Point Park University Factbook * 68
Table 4.15. (Continued)School / Department / Student-TypeSchool of Communication
Regular UndergraduateFA16 FA17 FA18 FA19 FA20 Var. FA16 FA17 FA18 FA19 FA20 Var. FA16 FA17 FA18 FA19 FA20 Var.
Advertising and PR 0 0 0 0 0 0 2 0 0 0 0 0 2 0 0 0 0 0 New 0 0 0 0 0 0 0 0 0 0 0 0 0 0 0 0 0 0 Returning 0 0 0 0 0 0 2 0 0 0 0 0 2 0 0 0 0 0Broadcast Production & Programming 4 1 0 0 0 0 1 0 0 0 0 0 5 1 0 0 0 0 New 0 0 0 0 0 0 0 0 0 0 0 0 0 0 0 0 0 0 Returning 4 1 0 0 0 0 1 0 0 0 0 0 5 1 0 0 0 0Broadcast Production & Media Mgt 36 45 43 45 44 -1 2 5 2 1 1 0 38 50 45 46 45 -1 New 14 15 15 18 16 -2 1 4 1 0 0 0 15 19 16 18 16 -2 Returning 22 30 28 27 28 1 1 1 1 1 1 0 23 31 29 28 29 1Broadcasting 0 0 0 0 0 0 0 1 0 0 0 0 0 1 0 0 0 0 New 0 0 0 0 0 0 0 0 0 0 0 0 0 0 0 0 0 0 Returning 0 0 0 0 0 0 0 1 0 0 0 0 0 1 0 0 0 0Broadcasting Reporting 57 44 51 28 9 -19 3 1 1 1 0 -1 60 45 52 29 9 -20 New 17 14 22 0 0 0 1 0 0 0 0 0 18 14 22 0 0 0 Returning 40 30 29 28 9 -19 2 1 1 1 0 -1 42 31 30 29 9 -20Environmental Journalism 0 1 1 0 0 0 0 0 0 0 0 0 0 1 1 0 0 0 New 0 1 1 0 0 0 0 0 0 0 0 0 0 1 1 0 0 0 Returning 0 0 0 0 0 0 0 0 0 0 0 0 0 0 0 0 0 0Graphic and Interactive Design 0 0 0 20 37 17 0 0 0 0 0 0 0 0 0 20 37 17 New 0 0 0 17 21 4 0 0 0 0 0 0 0 0 0 17 21 4 Returning 0 0 0 3 16 13 0 0 0 0 0 0 0 0 0 3 16 13
Full-time Part-time Total
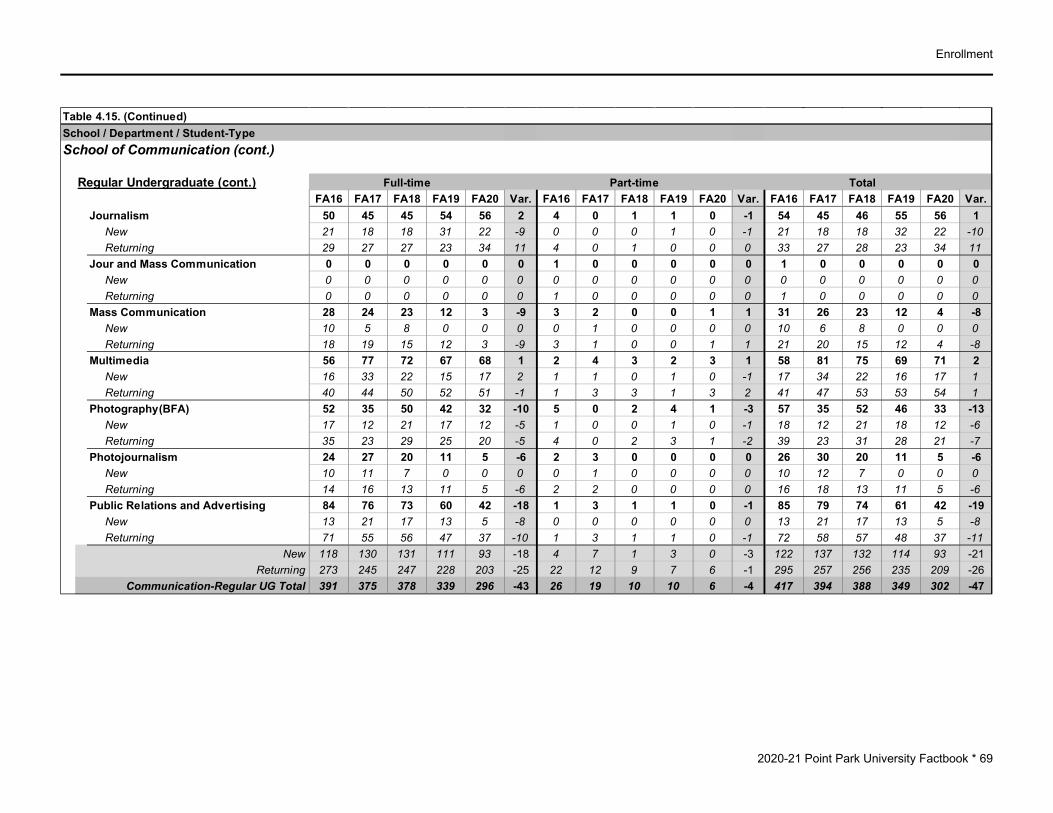
Enrollment
2020-21 Point Park University Factbook * 69
Table 4.15. (Continued)School / Department / Student-TypeSchool of Communication (cont.)
Regular Undergraduate (cont.)FA16 FA17 FA18 FA19 FA20 Var. FA16 FA17 FA18 FA19 FA20 Var. FA16 FA17 FA18 FA19 FA20 Var.
Journalism 50 45 45 54 56 2 4 0 1 1 0 -1 54 45 46 55 56 1 New 21 18 18 31 22 -9 0 0 0 1 0 -1 21 18 18 32 22 -10 Returning 29 27 27 23 34 11 4 0 1 0 0 0 33 27 28 23 34 11Jour and Mass Communication 0 0 0 0 0 0 1 0 0 0 0 0 1 0 0 0 0 0 New 0 0 0 0 0 0 0 0 0 0 0 0 0 0 0 0 0 0 Returning 0 0 0 0 0 0 1 0 0 0 0 0 1 0 0 0 0 0Mass Communication 28 24 23 12 3 -9 3 2 0 0 1 1 31 26 23 12 4 -8 New 10 5 8 0 0 0 0 1 0 0 0 0 10 6 8 0 0 0 Returning 18 19 15 12 3 -9 3 1 0 0 1 1 21 20 15 12 4 -8Multimedia 56 77 72 67 68 1 2 4 3 2 3 1 58 81 75 69 71 2 New 16 33 22 15 17 2 1 1 0 1 0 -1 17 34 22 16 17 1 Returning 40 44 50 52 51 -1 1 3 3 1 3 2 41 47 53 53 54 1Photography(BFA) 52 35 50 42 32 -10 5 0 2 4 1 -3 57 35 52 46 33 -13 New 17 12 21 17 12 -5 1 0 0 1 0 -1 18 12 21 18 12 -6 Returning 35 23 29 25 20 -5 4 0 2 3 1 -2 39 23 31 28 21 -7Photojournalism 24 27 20 11 5 -6 2 3 0 0 0 0 26 30 20 11 5 -6 New 10 11 7 0 0 0 0 1 0 0 0 0 10 12 7 0 0 0 Returning 14 16 13 11 5 -6 2 2 0 0 0 0 16 18 13 11 5 -6Public Relations and Advertising 84 76 73 60 42 -18 1 3 1 1 0 -1 85 79 74 61 42 -19 New 13 21 17 13 5 -8 0 0 0 0 0 0 13 21 17 13 5 -8 Returning 71 55 56 47 37 -10 1 3 1 1 0 -1 72 58 57 48 37 -11
New 118 130 131 111 93 -18 4 7 1 3 0 -3 122 137 132 114 93 -21Returning 273 245 247 228 203 -25 22 12 9 7 6 -1 295 257 256 235 209 -26
Communication-Regular UG Total 391 375 378 339 296 -43 26 19 10 10 6 -4 417 394 388 349 302 -47
Full-time Part-time Total

Enrollment
2020-21 Point Park University Factbook * 70
Table 4.15. (Continued)School / Department / Student-TypeSchool of Communication (cont.)
Online UndergraduateFA16 FA17 FA18 FA19 FA20 Var. FA16 FA17 FA18 FA19 FA20 Var. FA16 FA17 FA18 FA19 FA20 Var.
Mass Communication - Online 0 4 3 1 0 -1 0 1 2 1 0 -1 0 5 5 2 0 -2 New 0 2 0 0 0 0 0 0 0 0 0 0 0 2 0 0 0 0 Returning 0 2 3 1 0 -1 0 1 2 1 0 -1 0 3 5 2 0 -2Public Relations & Advertising - Online 1 8 11 11 12 1 4 6 14 11 7 -4 5 14 25 22 19 -3 New 1 3 1 2 0 -2 2 0 6 0 2 2 3 3 7 2 2 0 Returning 0 5 10 9 12 3 2 6 8 11 5 -6 2 11 18 20 17 -3Social Media Management - Online 0 0 0 0 1 1 0 0 0 0 0 0 0 0 0 0 1 1 New 0 0 0 0 1 1 0 0 0 0 0 0 0 0 0 0 1 1 Returning 0 0 0 0 0 0 0 0 0 0 0 0 0 0 0 0 0 0
New 1 5 1 2 1 -1 2 0 6 0 2 2 3 5 7 2 3 1Returning 0 7 13 10 12 2 2 7 10 12 5 -7 2 14 23 22 17 -5
Communication-Online UG Total 1 12 14 12 13 1 4 7 16 12 7 -5 5 19 30 24 20 -4
Online GraduateFA16 FA17 FA18 FA19 FA20 Var. FA16 FA17 FA18 FA19 FA20 Var. FA16 FA17 FA18 FA19 FA20 Var.
Communication Technology/MA-Online 2 4 7 6 3 -3 6 12 17 10 10 0 8 16 24 16 13 -3 New 2 1 3 3 0 -3 5 5 4 3 5 2 7 6 7 6 5 -1 Returning 0 3 4 3 3 0 1 7 13 7 5 -2 1 10 17 10 8 -2
New 2 1 3 3 0 -3 5 5 4 3 5 2 7 6 7 6 5 -1Returning 0 3 4 3 3 0 1 7 13 7 5 -2 1 10 17 10 8 -2
Communication-Online GR Total 2 4 7 6 3 -3 6 12 17 10 10 0 8 16 24 16 13 -3
Full-time Part-time Total
Full-time Part-time Total
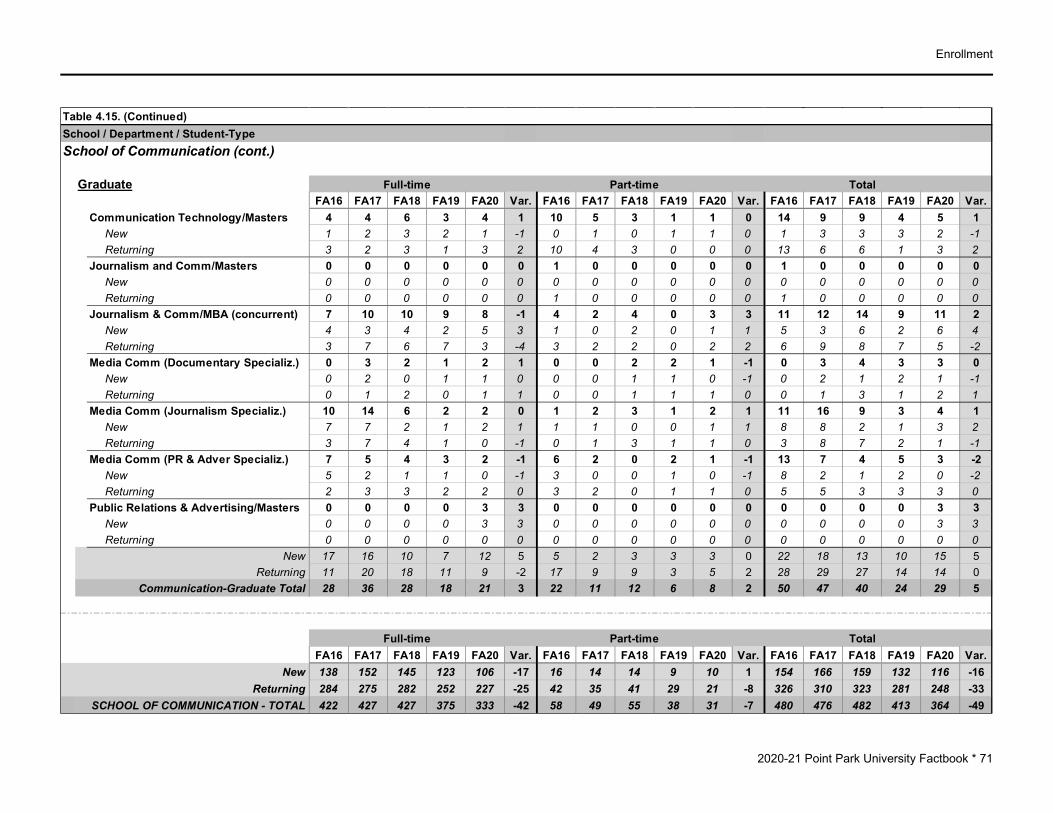
Enrollment
2020-21 Point Park University Factbook * 71
Table 4.15. (Continued)School / Department / Student-TypeSchool of Communication (cont.)
GraduateFA16 FA17 FA18 FA19 FA20 Var. FA16 FA17 FA18 FA19 FA20 Var. FA16 FA17 FA18 FA19 FA20 Var.
Communication Technology/Masters 4 4 6 3 4 1 10 5 3 1 1 0 14 9 9 4 5 1 New 1 2 3 2 1 -1 0 1 0 1 1 0 1 3 3 3 2 -1 Returning 3 2 3 1 3 2 10 4 3 0 0 0 13 6 6 1 3 2Journalism and Comm/Masters 0 0 0 0 0 0 1 0 0 0 0 0 1 0 0 0 0 0 New 0 0 0 0 0 0 0 0 0 0 0 0 0 0 0 0 0 0 Returning 0 0 0 0 0 0 1 0 0 0 0 0 1 0 0 0 0 0Journalism & Comm/MBA (concurrent) 7 10 10 9 8 -1 4 2 4 0 3 3 11 12 14 9 11 2 New 4 3 4 2 5 3 1 0 2 0 1 1 5 3 6 2 6 4 Returning 3 7 6 7 3 -4 3 2 2 0 2 2 6 9 8 7 5 -2Media Comm (Documentary Specializ.) 0 3 2 1 2 1 0 0 2 2 1 -1 0 3 4 3 3 0 New 0 2 0 1 1 0 0 0 1 1 0 -1 0 2 1 2 1 -1 Returning 0 1 2 0 1 1 0 0 1 1 1 0 0 1 3 1 2 1Media Comm (Journalism Specializ.) 10 14 6 2 2 0 1 2 3 1 2 1 11 16 9 3 4 1 New 7 7 2 1 2 1 1 1 0 0 1 1 8 8 2 1 3 2 Returning 3 7 4 1 0 -1 0 1 3 1 1 0 3 8 7 2 1 -1Media Comm (PR & Adver Specializ.) 7 5 4 3 2 -1 6 2 0 2 1 -1 13 7 4 5 3 -2 New 5 2 1 1 0 -1 3 0 0 1 0 -1 8 2 1 2 0 -2 Returning 2 3 3 2 2 0 3 2 0 1 1 0 5 5 3 3 3 0Public Relations & Advertising/Masters 0 0 0 0 3 3 0 0 0 0 0 0 0 0 0 0 3 3 New 0 0 0 0 3 3 0 0 0 0 0 0 0 0 0 0 3 3 Returning 0 0 0 0 0 0 0 0 0 0 0 0 0 0 0 0 0 0
New 17 16 10 7 12 5 5 2 3 3 3 0 22 18 13 10 15 5Returning 11 20 18 11 9 -2 17 9 9 3 5 2 28 29 27 14 14 0
Communication-Graduate Total 28 36 28 18 21 3 22 11 12 6 8 2 50 47 40 24 29 5
FA16 FA17 FA18 FA19 FA20 Var. FA16 FA17 FA18 FA19 FA20 Var. FA16 FA17 FA18 FA19 FA20 Var.New 138 152 145 123 106 -17 16 14 14 9 10 1 154 166 159 132 116 -16
Returning 284 275 282 252 227 -25 42 35 41 29 21 -8 326 310 323 281 248 -33SCHOOL OF COMMUNICATION - TOTAL 422 427 427 375 333 -42 58 49 55 38 31 -7 480 476 482 413 364 -49
Full-time Part-time Total
Full-time Part-time Total
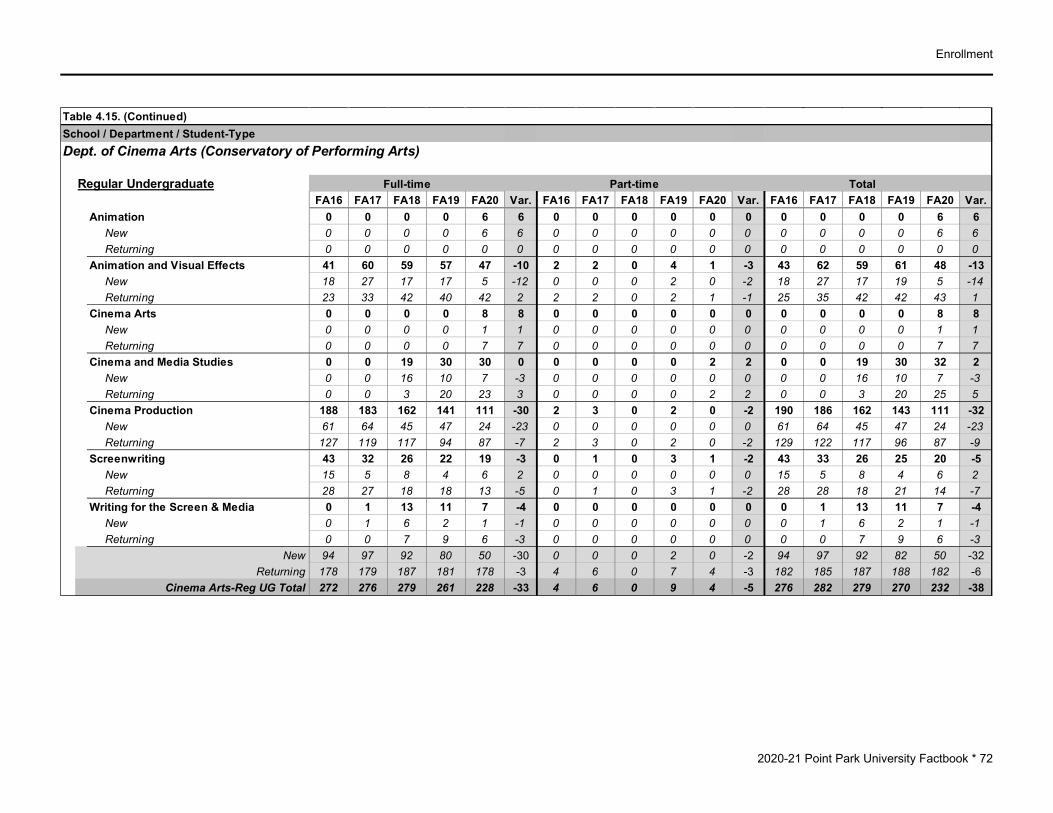
Enrollment
2020-21 Point Park University Factbook * 72
Table 4.15. (Continued)School / Department / Student-TypeDept. of Cinema Arts (Conservatory of Performing Arts)
Regular UndergraduateFA16 FA17 FA18 FA19 FA20 Var. FA16 FA17 FA18 FA19 FA20 Var. FA16 FA17 FA18 FA19 FA20 Var.
Animation 0 0 0 0 6 6 0 0 0 0 0 0 0 0 0 0 6 6 New 0 0 0 0 6 6 0 0 0 0 0 0 0 0 0 0 6 6 Returning 0 0 0 0 0 0 0 0 0 0 0 0 0 0 0 0 0 0Animation and Visual Effects 41 60 59 57 47 -10 2 2 0 4 1 -3 43 62 59 61 48 -13 New 18 27 17 17 5 -12 0 0 0 2 0 -2 18 27 17 19 5 -14 Returning 23 33 42 40 42 2 2 2 0 2 1 -1 25 35 42 42 43 1Cinema Arts 0 0 0 0 8 8 0 0 0 0 0 0 0 0 0 0 8 8 New 0 0 0 0 1 1 0 0 0 0 0 0 0 0 0 0 1 1 Returning 0 0 0 0 7 7 0 0 0 0 0 0 0 0 0 0 7 7Cinema and Media Studies 0 0 19 30 30 0 0 0 0 0 2 2 0 0 19 30 32 2 New 0 0 16 10 7 -3 0 0 0 0 0 0 0 0 16 10 7 -3 Returning 0 0 3 20 23 3 0 0 0 0 2 2 0 0 3 20 25 5Cinema Production 188 183 162 141 111 -30 2 3 0 2 0 -2 190 186 162 143 111 -32 New 61 64 45 47 24 -23 0 0 0 0 0 0 61 64 45 47 24 -23 Returning 127 119 117 94 87 -7 2 3 0 2 0 -2 129 122 117 96 87 -9Screenwriting 43 32 26 22 19 -3 0 1 0 3 1 -2 43 33 26 25 20 -5 New 15 5 8 4 6 2 0 0 0 0 0 0 15 5 8 4 6 2 Returning 28 27 18 18 13 -5 0 1 0 3 1 -2 28 28 18 21 14 -7Writing for the Screen & Media 0 1 13 11 7 -4 0 0 0 0 0 0 0 1 13 11 7 -4 New 0 1 6 2 1 -1 0 0 0 0 0 0 0 1 6 2 1 -1 Returning 0 0 7 9 6 -3 0 0 0 0 0 0 0 0 7 9 6 -3
New 94 97 92 80 50 -30 0 0 0 2 0 -2 94 97 92 82 50 -32Returning 178 179 187 181 178 -3 4 6 0 7 4 -3 182 185 187 188 182 -6
Cinema Arts-Reg UG Total 272 276 279 261 228 -33 4 6 0 9 4 -5 276 282 279 270 232 -38
Full-time Part-time Total

Enrollment
2020-21 Point Park University Factbook * 73
Table 4.15. (Continued)School / Department / Student-TypeDept. of Cinema Arts (Conservatory of Performing Arts) (cont.)
GraduateFA16 FA17 FA18 FA19 FA20 Var. FA16 FA17 FA18 FA19 FA20 Var. FA16 FA17 FA18 FA19 FA20 Var.
Writing for the Screen & Stage/MFA 18 28 30 25 19 -6 4 2 2 1 0 -1 22 30 32 26 19 -7 New 11 17 17 11 10 -1 2 1 0 0 0 0 13 18 17 11 10 -1 Returning 7 11 13 14 9 -5 2 1 2 1 0 -1 9 12 15 15 9 -6
New 11 17 17 11 10 -1 2 1 0 0 0 0 13 18 17 11 10 -1Returning 7 11 13 14 9 -5 2 1 2 1 0 -1 9 12 15 15 9 -6
Cinema Arts-Graduate Total 18 28 30 25 19 -6 4 2 2 1 0 -1 22 30 32 26 19 -7
FA16 FA17 FA18 FA19 FA20 Var. FA16 FA17 FA18 FA19 FA20 Var. FA16 FA17 FA18 FA19 FA20 Var.New 105 114 109 91 60 -31 2 1 0 2 0 -2 107 115 109 93 60 -33
Returning 185 190 200 195 187 -8 6 7 2 8 4 -4 191 197 202 203 191 -12Cinema Arts - TOTAL 290 304 309 286 247 -39 8 8 2 10 4 -6 298 312 311 296 251 -45
Full-time Part-time Total
Full-time Part-time Total

Enrollment
2020-21 Point Park University Factbook * 74
Table 4.15. (Continued)School / Department / Student-TypeDept. of Dance (Conservatory of Performing Arts)
Regular UndergraduateFA16 FA17 FA18 FA19 FA20 Var. FA16 FA17 FA18 FA19 FA20 Var. FA16 FA17 FA18 FA19 FA20 Var.
Dance 99 86 66 38 11 -27 2 2 0 1 1 0 101 88 66 39 12 -27 New 41 24 7 10 0 -10 0 1 0 0 0 0 41 25 7 10 0 -10 Returning 58 62 59 28 11 -17 2 1 0 1 1 0 60 63 59 29 12 -17Dance Pedagogy 1 1 0 0 0 0 0 0 0 0 0 0 1 1 0 0 0 0 New 0 0 0 0 0 0 0 0 0 0 0 0 0 0 0 0 0 0 Returning 1 1 0 0 0 0 0 0 0 0 0 0 1 1 0 0 0 0Dance (BFA) 170 190 134 101 53 -48 0 1 0 0 1 1 170 191 134 101 54 -47 New 57 61 0 2 0 -2 0 0 0 0 0 0 57 61 0 2 0 -2 Returning 113 129 134 99 53 -46 0 1 0 0 1 1 113 130 134 99 54 -45Dance: Ballet (BFA) 0 0 28 43 51 8 0 0 0 0 2 2 0 0 28 43 53 10 New 0 0 28 22 18 -4 0 0 0 0 1 1 0 0 28 22 19 -3 Returning 0 0 0 21 33 12 0 0 0 0 1 1 0 0 0 21 34 13Dance: Jazz (BFA) 0 0 39 74 94 20 0 0 0 0 0 0 0 0 39 74 94 20 New 0 0 38 41 26 -15 0 0 0 0 0 0 0 0 38 41 26 -15 Returning 0 0 1 33 68 35 0 0 0 0 0 0 0 0 1 33 68 35Dance: Modern (BFA) 0 0 24 59 93 34 0 0 0 0 0 0 0 0 24 59 93 34 New 0 0 24 27 33 6 0 0 0 0 0 0 0 0 24 27 33 6 Returning 0 0 0 32 60 28 0 0 0 0 0 0 0 0 0 32 60 28Dance: Ballet (BA) 0 0 0 0 2 2 0 0 0 0 0 0 0 0 0 0 2 2 New 0 0 0 0 2 2 0 0 0 0 0 0 0 0 0 0 2 2 Returning 0 0 0 0 0 0 0 0 0 0 0 0 0 0 0 0 0 0Dance: Modern (BA) 0 0 0 0 3 3 0 0 0 0 0 0 0 0 0 0 3 3 New 0 0 0 0 2 2 0 0 0 0 0 0 0 0 0 0 2 2 Returning 0 0 0 0 1 1 0 0 0 0 0 0 0 0 0 0 1 1
New 98 85 97 102 81 -21 0 1 0 0 1 1 98 86 97 102 82 -20Returning 172 192 194 213 226 13 2 2 0 1 3 2 174 194 194 214 229 15
Dance - TOTAL 270 277 291 315 307 -8 2 3 0 1 4 3 272 280 291 316 311 -5
Full-time Part-time Total

Enrollment
2020-21 Point Park University Factbook * 75
Table 4.15. (Continued)School / Department / Student-TypeDept. of Theatre (Conservatory of Performing Arts)
Regular UndergraduateFA16 FA17 FA18 FA19 FA20 Var. FA16 FA17 FA18 FA19 FA20 Var. FA16 FA17 FA18 FA19 FA20 Var.
Acting 32 43 52 55 58 3 1 0 0 0 1 1 33 43 52 55 59 4 New 14 14 20 15 23 8 0 0 0 0 0 0 14 14 20 15 23 8 Returning 18 29 32 40 35 -5 1 0 0 0 1 1 19 29 32 40 36 -4Musical Theatre 66 91 104 92 91 -1 0 0 1 0 1 1 66 91 105 92 92 0 New 26 29 28 26 27 1 0 0 0 0 0 0 26 29 28 26 27 1 Returning 40 62 76 66 64 -2 0 0 1 0 1 1 40 62 77 66 65 -1Theatre Arts 47 16 0 0 0 0 1 2 2 0 0 0 48 18 2 0 0 0 New 0 0 0 0 0 0 0 0 2 0 0 0 0 0 2 0 0 0 Returning 47 16 0 0 0 0 1 2 0 0 0 0 48 18 0 0 0 0Theatre Arts (BFA) 45 19 2 33 24 -9 1 0 0 0 0 0 46 19 2 33 24 -9 New 0 0 0 21 0 -21 0 0 0 0 0 0 0 0 0 21 0 -21 Returning 45 19 2 12 24 12 1 0 0 0 0 0 46 19 2 12 24 12Theatre Arts: Directing 0 0 0 0 3 3 0 0 0 0 0 0 0 0 0 0 3 3 New 0 0 0 0 3 3 0 0 0 0 0 0 0 0 0 0 3 3 Returning 0 0 0 0 0 0 0 0 0 0 0 0 0 0 0 0 0 0Theatre Arts: Performance&Practices 58 69 87 57 31 -26 1 1 0 1 1 0 59 70 87 58 32 -26 New 28 21 33 3 0 -3 1 1 0 0 1 1 29 22 33 3 1 -2 Returning 30 48 54 54 31 -23 0 0 0 1 0 -1 30 48 54 55 31 -24Theatre Arts: Self-Directed 0 0 0 0 20 20 0 0 0 0 0 0 0 0 0 0 20 20 New 0 0 0 0 20 20 0 0 0 0 0 0 0 0 0 0 20 20 Returning 0 0 0 0 0 0 0 0 0 0 0 0 0 0 0 0 0 0
Full-time Part-time Total
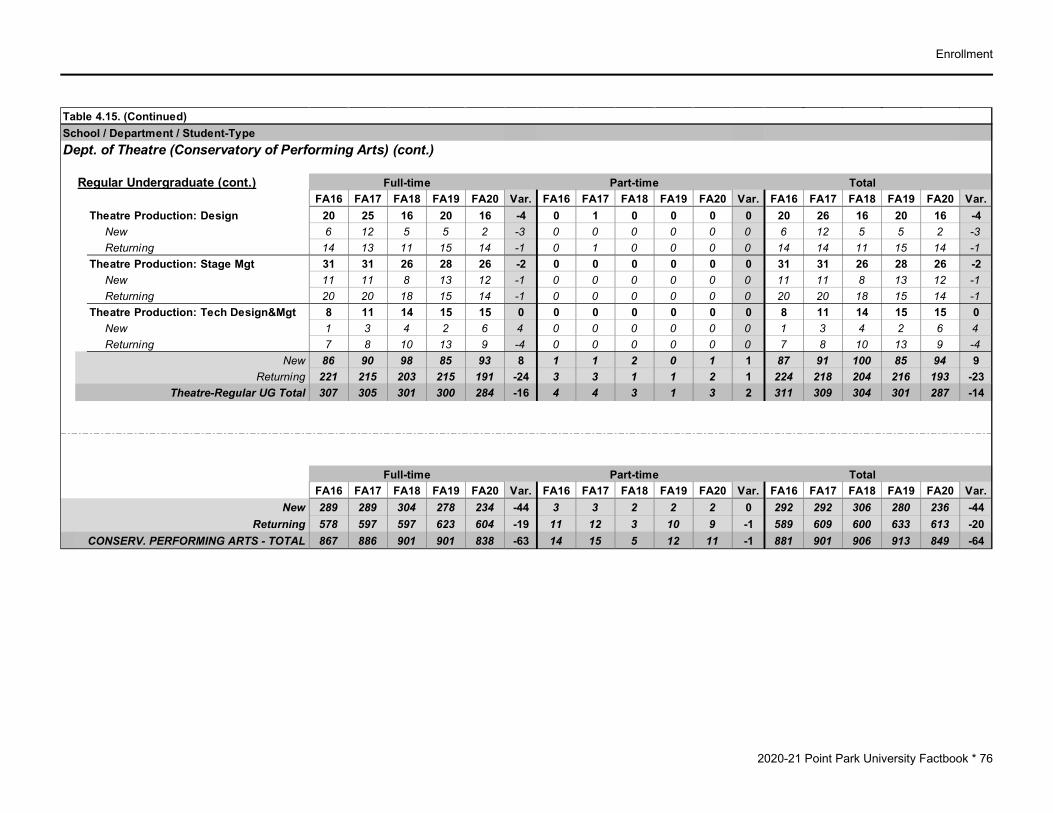
Enrollment
2020-21 Point Park University Factbook * 76
Table 4.15. (Continued)School / Department / Student-TypeDept. of Theatre (Conservatory of Performing Arts) (cont.)
Regular Undergraduate (cont.)FA16 FA17 FA18 FA19 FA20 Var. FA16 FA17 FA18 FA19 FA20 Var. FA16 FA17 FA18 FA19 FA20 Var.
Theatre Production: Design 20 25 16 20 16 -4 0 1 0 0 0 0 20 26 16 20 16 -4 New 6 12 5 5 2 -3 0 0 0 0 0 0 6 12 5 5 2 -3 Returning 14 13 11 15 14 -1 0 1 0 0 0 0 14 14 11 15 14 -1Theatre Production: Stage Mgt 31 31 26 28 26 -2 0 0 0 0 0 0 31 31 26 28 26 -2 New 11 11 8 13 12 -1 0 0 0 0 0 0 11 11 8 13 12 -1 Returning 20 20 18 15 14 -1 0 0 0 0 0 0 20 20 18 15 14 -1Theatre Production: Tech Design&Mgt 8 11 14 15 15 0 0 0 0 0 0 0 8 11 14 15 15 0 New 1 3 4 2 6 4 0 0 0 0 0 0 1 3 4 2 6 4 Returning 7 8 10 13 9 -4 0 0 0 0 0 0 7 8 10 13 9 -4
New 86 90 98 85 93 8 1 1 2 0 1 1 87 91 100 85 94 9Returning 221 215 203 215 191 -24 3 3 1 1 2 1 224 218 204 216 193 -23
Theatre-Regular UG Total 307 305 301 300 284 -16 4 4 3 1 3 2 311 309 304 301 287 -14
FA16 FA17 FA18 FA19 FA20 Var. FA16 FA17 FA18 FA19 FA20 Var. FA16 FA17 FA18 FA19 FA20 Var.New 289 289 304 278 234 -44 3 3 2 2 2 0 292 292 306 280 236 -44
Returning 578 597 597 623 604 -19 11 12 3 10 9 -1 589 609 600 633 613 -20CONSERV. PERFORMING ARTS - TOTAL 867 886 901 901 838 -63 14 15 5 12 11 -1 881 901 906 913 849 -64
Full-time Part-time Total
Full-time Part-time Total

Enrollment
2020-21 Point Park University Factbook * 77
Table 4.15. (Continued)School / Department / Student-TypeSchool of Education
Regular UndergraduateFA16 FA17 FA18 FA19 FA20 Var. FA16 FA17 FA18 FA19 FA20 Var. FA16 FA17 FA18 FA19 FA20 Var.
Citizenship/Secondary Ed 2 1 0 0 0 0 0 0 0 0 0 0 2 1 0 0 0 0 New 0 0 0 0 0 0 0 0 0 0 0 0 0 0 0 0 0 0 Returning 2 1 0 0 0 0 0 0 0 0 0 0 2 1 0 0 0 0Early Childhood Education 0 2 2 2 0 -2 1 1 1 1 0 -1 1 3 3 3 0 -3 New 0 1 0 1 0 -1 0 0 0 0 0 0 0 1 0 1 0 -1 Returning 0 1 2 1 0 -1 1 1 1 1 0 -1 1 2 3 2 0 -2Education/Undeclared 61 68 74 81 69 -12 12 2 7 6 2 -4 73 70 81 87 71 -16 New 25 33 31 35 24 -11 3 0 6 2 0 -2 28 33 37 37 24 -13 Returning 36 35 43 46 45 -1 9 2 1 4 2 -2 45 37 44 50 47 -3English/Secondary Ed 3 6 3 2 3 1 0 0 0 0 0 0 3 6 3 2 3 1 New 1 1 0 0 1 1 0 0 0 0 0 0 1 1 0 0 1 1 Returning 2 5 3 2 2 0 0 0 0 0 0 0 2 5 3 2 2 0English/Sec Ed/Spec Ed 7th-12th 0 2 3 3 3 0 0 0 0 0 0 0 0 2 3 3 3 0 New 0 0 1 0 0 0 0 0 0 0 0 0 0 0 1 0 0 0 Returning 0 2 2 3 3 0 0 0 0 0 0 0 0 2 2 3 3 0Instructional Studies 5 8 4 3 1 -2 5 7 2 3 2 -1 10 15 6 6 3 -3 New 2 1 0 0 0 0 0 2 0 2 1 -1 2 3 0 2 1 -1 Returning 3 7 4 3 1 -2 5 5 2 1 1 0 8 12 6 4 2 -2Mathematics/Secondary Ed 0 0 1 2 1 -1 0 0 0 0 0 0 0 0 1 2 1 -1 New 0 0 0 0 0 0 0 0 0 0 0 0 0 0 0 0 0 0 Returning 0 0 1 2 1 -1 0 0 0 0 0 0 0 0 1 2 1 -1Mathematics-Sec Ed/Spec Ed 7th-12th 1 1 1 0 0 0 0 0 0 0 0 0 1 1 1 0 0 0 New 0 0 0 0 0 0 0 0 0 0 0 0 0 0 0 0 0 0 Returning 1 1 1 0 0 0 0 0 0 0 0 0 1 1 1 0 0 0PA Cert English 4th-8th 0 0 1 0 0 0 0 0 0 0 0 0 0 0 1 0 0 0 New 0 0 0 0 0 0 0 0 0 0 0 0 0 0 0 0 0 0 Returning 0 0 1 0 0 0 0 0 0 0 0 0 0 0 1 0 0 0PA Cert English 4th-8th Spec Educ 0 0 0 0 1 1 0 0 0 0 0 0 0 0 0 0 1 1 New 0 0 0 0 0 0 0 0 0 0 0 0 0 0 0 0 0 0 Returning 0 0 0 0 1 1 0 0 0 0 0 0 0 0 0 0 1 1PA Cert Math 4th-8th 0 0 1 0 1 1 0 0 0 0 0 0 0 0 1 0 1 1 New 0 0 0 0 0 0 0 0 0 0 0 0 0 0 0 0 0 0 Returning 0 0 1 0 1 1 0 0 0 0 0 0 0 0 1 0 1 1
Full-time Part-time Total

Enrollment
2020-21 Point Park University Factbook * 78
Table 4.15. (Continued)School / Department / Student-TypeSchool of Education (cont.)
Regular Undergraduate (cont.)FA16 FA17 FA18 FA19 FA20 Var. FA16 FA17 FA18 FA19 FA20 Var. FA16 FA17 FA18 FA19 FA20 Var.
PA Cert Math 4th-8th Spec Educ 0 0 1 1 0 -1 0 0 0 0 0 0 0 0 1 1 0 -1 New 0 0 0 0 0 0 0 0 0 0 0 0 0 0 0 0 0 0 Returning 0 0 1 1 0 -1 0 0 0 0 0 0 0 0 1 1 0 -1PA Cert PreK-4th 4 5 6 11 12 1 2 2 4 1 0 -1 6 7 10 12 12 0 New 0 0 0 0 0 0 0 1 0 0 0 0 0 1 0 0 0 0 Returning 4 5 6 11 12 1 2 1 4 1 0 -1 6 6 10 12 12 0PA Cert PreK-4th Spec Educ 13 16 16 11 13 2 1 1 0 0 0 0 14 17 16 11 13 2 New 1 1 0 0 0 0 0 0 0 0 0 0 1 1 0 0 0 0 Returning 12 15 16 11 13 2 1 1 0 0 0 0 13 16 16 11 13 2PA Cert Science 4th-8th 0 1 1 0 0 0 0 0 0 0 0 0 0 1 1 0 0 0 New 0 0 0 0 0 0 0 0 0 0 0 0 0 0 0 0 0 0 Returning 0 1 1 0 0 0 0 0 0 0 0 0 0 1 1 0 0 0PA Cert Science 4th-8th Spec Educ 0 0 1 1 1 0 0 0 0 0 0 0 0 0 1 1 1 0 New 0 0 0 0 0 0 0 0 0 0 0 0 0 0 0 0 0 0 Returning 0 0 1 1 1 0 0 0 0 0 0 0 0 0 1 1 1 0PA Cert Social Studies 4th-8th 0 0 0 0 2 2 0 0 0 0 0 0 0 0 0 0 2 2 New 0 0 0 0 0 0 0 0 0 0 0 0 0 0 0 0 0 0 Returning 0 0 0 0 2 2 0 0 0 0 0 0 0 0 0 0 2 2PA Cert Social Studies 4th-8th Spec Edu 0 0 1 1 1 0 0 0 0 0 0 0 0 0 1 1 1 0 New 0 0 0 0 0 0 0 0 0 0 0 0 0 0 0 0 0 0 Returning 0 0 1 1 1 0 0 0 0 0 0 0 0 0 1 1 1 0School Principal K-12 0 0 0 0 0 0 4 0 0 0 0 0 4 0 0 0 0 0 New 0 0 0 0 0 0 3 0 0 0 0 0 3 0 0 0 0 0 Returning 0 0 0 0 0 0 1 0 0 0 0 0 1 0 0 0 0 0Social Studies-Sec Ed/Spec Educ 7-12 1 2 2 1 1 0 0 0 0 0 0 0 1 2 2 1 1 0 New 0 0 0 0 0 0 0 0 0 0 0 0 0 0 0 0 0 0 Returning 1 2 2 1 1 0 0 0 0 0 0 0 1 2 2 1 1 0Social Studies/Secondary Educ 1 3 1 3 2 -1 1 0 1 0 0 0 2 3 2 3 2 -1 New 1 1 1 0 0 0 1 0 0 0 0 0 2 1 1 0 0 0 Returning 0 2 0 3 2 -1 0 0 1 0 0 0 0 2 1 3 2 -1
New 30 38 33 36 25 -11 7 3 6 4 1 -3 37 41 39 40 26 -14Returning 61 77 86 86 86 0 19 10 9 7 3 -4 80 87 95 93 89 -4
Education-Regular UG Total 91 115 119 122 111 -11 26 13 15 11 4 -7 117 128 134 133 115 -18
Full-time Part-time Total
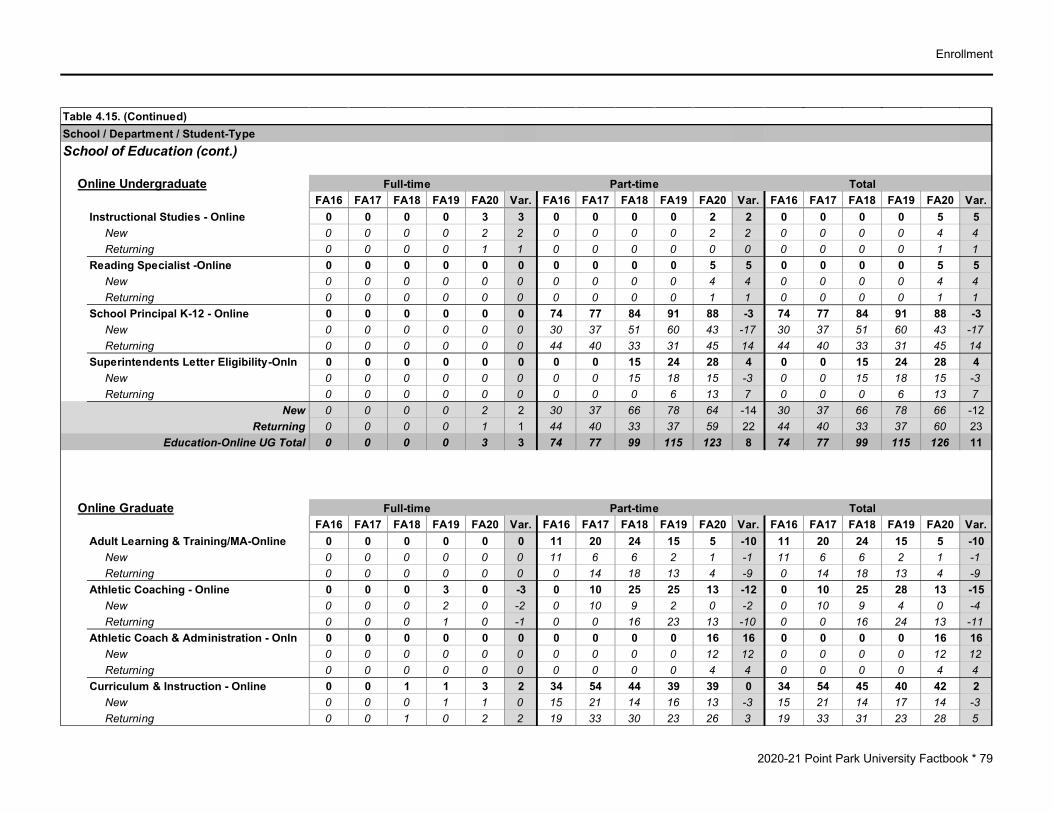
Enrollment
2020-21 Point Park University Factbook * 79
Table 4.15. (Continued)School / Department / Student-TypeSchool of Education (cont.)
Online UndergraduateFA16 FA17 FA18 FA19 FA20 Var. FA16 FA17 FA18 FA19 FA20 Var. FA16 FA17 FA18 FA19 FA20 Var.
Instructional Studies - Online 0 0 0 0 3 3 0 0 0 0 2 2 0 0 0 0 5 5 New 0 0 0 0 2 2 0 0 0 0 2 2 0 0 0 0 4 4 Returning 0 0 0 0 1 1 0 0 0 0 0 0 0 0 0 0 1 1Reading Specialist -Online 0 0 0 0 0 0 0 0 0 0 5 5 0 0 0 0 5 5 New 0 0 0 0 0 0 0 0 0 0 4 4 0 0 0 0 4 4 Returning 0 0 0 0 0 0 0 0 0 0 1 1 0 0 0 0 1 1School Principal K-12 - Online 0 0 0 0 0 0 74 77 84 91 88 -3 74 77 84 91 88 -3 New 0 0 0 0 0 0 30 37 51 60 43 -17 30 37 51 60 43 -17 Returning 0 0 0 0 0 0 44 40 33 31 45 14 44 40 33 31 45 14Superintendents Letter Eligibility-Onln 0 0 0 0 0 0 0 0 15 24 28 4 0 0 15 24 28 4 New 0 0 0 0 0 0 0 0 15 18 15 -3 0 0 15 18 15 -3 Returning 0 0 0 0 0 0 0 0 0 6 13 7 0 0 0 6 13 7
New 0 0 0 0 2 2 30 37 66 78 64 -14 30 37 66 78 66 -12Returning 0 0 0 0 1 1 44 40 33 37 59 22 44 40 33 37 60 23
Education-Online UG Total 0 0 0 0 3 3 74 77 99 115 123 8 74 77 99 115 126 11
Online GraduateFA16 FA17 FA18 FA19 FA20 Var. FA16 FA17 FA18 FA19 FA20 Var. FA16 FA17 FA18 FA19 FA20 Var.
Adult Learning & Training/MA-Online 0 0 0 0 0 0 11 20 24 15 5 -10 11 20 24 15 5 -10 New 0 0 0 0 0 0 11 6 6 2 1 -1 11 6 6 2 1 -1 Returning 0 0 0 0 0 0 0 14 18 13 4 -9 0 14 18 13 4 -9Athletic Coaching - Online 0 0 0 3 0 -3 0 10 25 25 13 -12 0 10 25 28 13 -15 New 0 0 0 2 0 -2 0 10 9 2 0 -2 0 10 9 4 0 -4 Returning 0 0 0 1 0 -1 0 0 16 23 13 -10 0 0 16 24 13 -11Athletic Coach & Administration - Onln 0 0 0 0 0 0 0 0 0 0 16 16 0 0 0 0 16 16 New 0 0 0 0 0 0 0 0 0 0 12 12 0 0 0 0 12 12 Returning 0 0 0 0 0 0 0 0 0 0 4 4 0 0 0 0 4 4Curriculum & Instruction - Online 0 0 1 1 3 2 34 54 44 39 39 0 34 54 45 40 42 2 New 0 0 0 1 1 0 15 21 14 16 13 -3 15 21 14 17 14 -3 Returning 0 0 1 0 2 2 19 33 30 23 26 3 19 33 31 23 28 5
Full-time Part-time Total
Full-time Part-time Total

Enrollment
2020-21 Point Park University Factbook * 80
Table 4.15. (Continued)School / Department / Student-TypeSchool of Education (cont.)
Online Graduate (cont.)FA16 FA17 FA18 FA19 FA20 Var. FA16 FA17 FA18 FA19 FA20 Var. FA16 FA17 FA18 FA19 FA20 Var.
Educational Administration - Online 0 0 2 0 1 1 24 40 44 50 55 5 24 40 46 50 56 6 New 0 0 1 0 0 0 8 17 17 17 18 1 8 17 18 17 18 1 Returning 0 0 1 0 1 1 16 23 27 33 37 4 16 23 28 33 38 5Leadership & Admin (Doct) - Online 0 0 0 0 1 1 0 0 0 40 85 45 0 0 0 40 86 46 New 0 0 0 0 1 1 0 0 0 40 52 12 0 0 0 40 53 13 Returning 0 0 0 0 0 0 0 0 0 0 33 33 0 0 0 0 33 33Masters Spec Educ w/Cert PreK-8 Onln 0 0 0 0 0 0 30 31 23 24 17 -7 30 31 23 24 17 -7 New 0 0 0 0 0 0 10 6 7 7 0 -7 10 6 7 7 0 -7 Returning 0 0 0 0 0 0 20 25 16 17 17 0 20 25 16 17 17 0Masters Spec Educ w/Cert 7-12 - Onln 0 0 0 0 0 0 12 10 5 6 8 2 12 10 5 6 8 2 New 0 0 0 0 0 0 8 1 3 1 0 -1 8 1 3 1 0 -1 Returning 0 0 0 0 0 0 4 9 2 5 8 3 4 9 2 5 8 3Masters Spec Educ w/Cert K-12 - Onln 0 0 0 0 0 0 0 0 0 0 11 11 0 0 0 0 11 11 New 0 0 0 0 0 0 0 0 0 0 11 11 0 0 0 0 11 11 Returning 0 0 0 0 0 0 0 0 0 0 0 0 0 0 0 0 0 0M.Ed Secondary Educ -Online 0 0 0 0 0 0 0 0 0 0 9 9 0 0 0 0 9 9 New 0 0 0 0 0 0 0 0 0 0 9 9 0 0 0 0 9 9 Returning 0 0 0 0 0 0 0 0 0 0 0 0 0 0 0 0 0 0M.Ed Spec Educ w/Cert K-12 -Online 0 0 0 0 0 0 0 0 0 0 17 17 0 0 0 0 17 17 New 0 0 0 0 0 0 0 0 0 0 17 17 0 0 0 0 17 17 Returning 0 0 0 0 0 0 0 0 0 0 0 0 0 0 0 0 0 0M.Ed w/Cert PreK-4 -Online 0 0 0 0 0 0 0 0 0 0 18 18 0 0 0 0 18 18 New 0 0 0 0 0 0 0 0 0 0 18 18 0 0 0 0 18 18 Returning 0 0 0 0 0 0 0 0 0 0 0 0 0 0 0 0 0 0
New 0 0 1 3 2 -1 52 61 56 85 151 66 52 61 57 88 153 65Returning 0 0 2 1 3 2 59 104 109 114 142 28 59 104 111 115 145 30
Education-Online GR Total 0 0 3 4 5 1 111 165 165 199 293 94 111 165 168 203 298 95
Full-time Part-time Total

Enrollment
2020-21 Point Park University Factbook * 81
Table 4.15. (Continued)School / Department / Student-TypeSchool of Education (cont.)
GraduateFA16 FA17 FA18 FA19 FA20 Var. FA16 FA17 FA18 FA19 FA20 Var. FA16 FA17 FA18 FA19 FA20 Var.
Curriculum and Instruction 0 0 0 0 0 0 9 2 1 0 0 0 9 2 1 0 0 0 New 0 0 0 0 0 0 0 0 0 0 0 0 0 0 0 0 0 0 Returning 0 0 0 0 0 0 9 2 1 0 0 0 9 2 1 0 0 0Educational Administration 0 1 0 0 0 0 3 1 1 0 1 1 3 2 1 0 1 1 New 0 1 0 0 0 0 0 0 0 0 0 0 0 1 0 0 0 0 Returning 0 0 0 0 0 0 3 1 1 0 1 1 3 1 1 0 1 1Leadership & Administration (Doctorate) 1 2 0 2 0 -2 85 101 101 95 71 -24 86 103 101 97 71 -26 New 1 0 0 0 0 0 30 38 39 24 13 -11 31 38 39 24 13 -11 Returning 0 2 0 2 0 -2 55 63 62 71 58 -13 55 65 62 73 58 -15Masters of Educ/Sec Educ Cert 7th-12th 10 8 9 3 5 2 12 7 6 9 4 -5 22 15 15 12 9 -3 New 3 5 2 0 0 0 3 1 3 1 0 -1 6 6 5 1 0 -1 Returning 7 3 7 3 5 2 9 6 3 8 4 -4 16 9 10 11 9 -2Masters of Spec Educ w/Cert 7th-12th 0 0 0 0 0 0 1 0 0 0 0 0 1 0 0 0 0 0 New 0 0 0 0 0 0 0 0 0 0 0 0 0 0 0 0 0 0 Returning 0 0 0 0 0 0 1 0 0 0 0 0 1 0 0 0 0 0Masters of Spec Educ w/Cert PreK-8th 0 0 0 0 0 0 2 0 0 0 0 0 2 0 0 0 0 0 New 0 0 0 0 0 0 0 0 0 0 0 0 0 0 0 0 0 0 Returning 0 0 0 0 0 0 2 0 0 0 0 0 2 0 0 0 0 0Teaching and Leadership 0 0 0 0 0 0 2 0 0 0 0 0 2 0 0 0 0 0 New 0 0 0 0 0 0 0 0 0 0 0 0 0 0 0 0 0 0 Returning 0 0 0 0 0 0 2 0 0 0 0 0 2 0 0 0 0 0
New 4 6 2 0 0 0 33 39 42 25 13 -12 37 45 44 25 13 -12Returning 7 5 7 5 5 0 81 72 67 79 63 -16 88 77 74 84 68 -16
Education-Graduate Total 11 11 9 5 5 0 114 111 109 104 76 -28 125 122 118 109 81 -28
FA16 FA17 FA18 FA19 FA20 Var. FA16 FA17 FA18 FA19 FA20 Var. FA16 FA17 FA18 FA19 FA20 Var.New 34 44 36 39 29 -10 122 140 170 192 229 37 156 184 206 231 258 27
Returning 68 82 95 92 95 3 203 226 218 237 267 30 271 308 313 329 362 33Education Dept. - TOTAL 102 126 131 131 124 -7 325 366 388 429 496 67 427 492 519 560 620 60
Full-time Part-time Total
Full-time Part-time Total
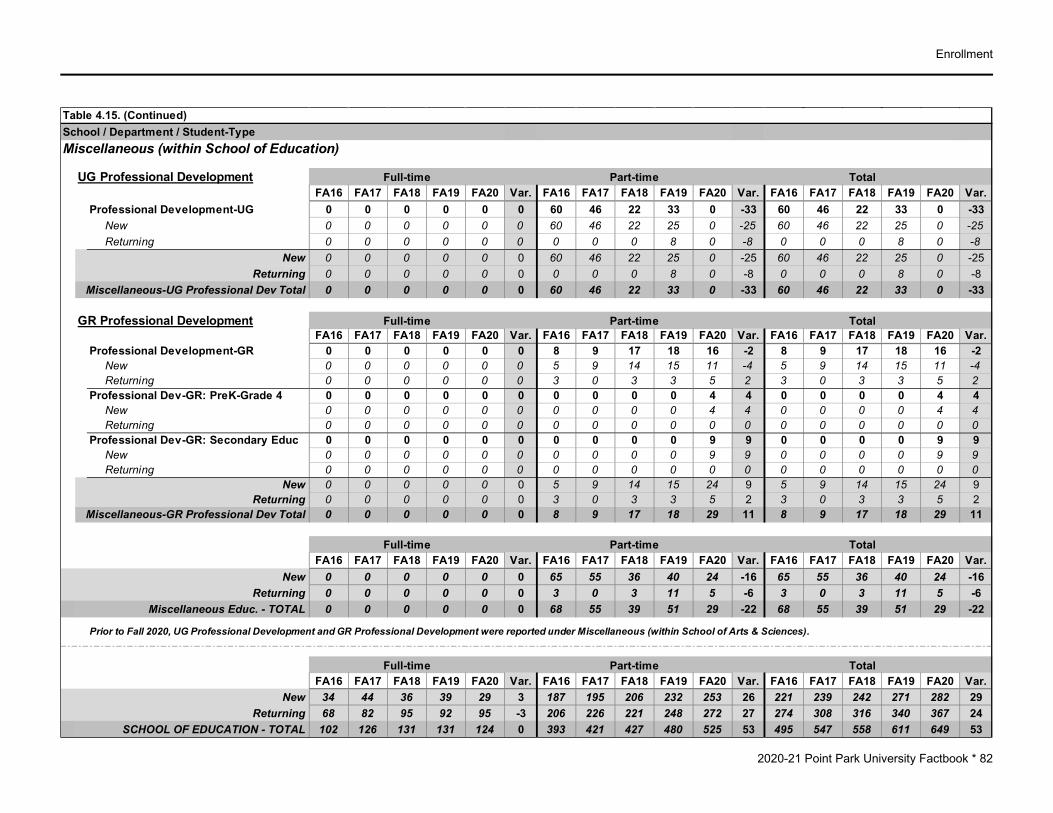
Enrollment
2020-21 Point Park University Factbook * 82
Table 4.15. (Continued)School / Department / Student-TypeMiscellaneous (within School of Education)
UG Professional DevelopmentFA16 FA17 FA18 FA19 FA20 Var. FA16 FA17 FA18 FA19 FA20 Var. FA16 FA17 FA18 FA19 FA20 Var.
Professional Development-UG 0 0 0 0 0 0 60 46 22 33 0 -33 60 46 22 33 0 -33 New 0 0 0 0 0 0 60 46 22 25 0 -25 60 46 22 25 0 -25 Returning 0 0 0 0 0 0 0 0 0 8 0 -8 0 0 0 8 0 -8
New 0 0 0 0 0 0 60 46 22 25 0 -25 60 46 22 25 0 -25Returning 0 0 0 0 0 0 0 0 0 8 0 -8 0 0 0 8 0 -8
Miscellaneous-UG Professional Dev Total 0 0 0 0 0 0 60 46 22 33 0 -33 60 46 22 33 0 -33
GR Professional DevelopmentFA16 FA17 FA18 FA19 FA20 Var. FA16 FA17 FA18 FA19 FA20 Var. FA16 FA17 FA18 FA19 FA20 Var.
Professional Development-GR 0 0 0 0 0 0 8 9 17 18 16 -2 8 9 17 18 16 -2 New 0 0 0 0 0 0 5 9 14 15 11 -4 5 9 14 15 11 -4 Returning 0 0 0 0 0 0 3 0 3 3 5 2 3 0 3 3 5 2Professional Dev-GR: PreK-Grade 4 0 0 0 0 0 0 0 0 0 0 4 4 0 0 0 0 4 4 New 0 0 0 0 0 0 0 0 0 0 4 4 0 0 0 0 4 4 Returning 0 0 0 0 0 0 0 0 0 0 0 0 0 0 0 0 0 0Professional Dev-GR: Secondary Educ 0 0 0 0 0 0 0 0 0 0 9 9 0 0 0 0 9 9 New 0 0 0 0 0 0 0 0 0 0 9 9 0 0 0 0 9 9 Returning 0 0 0 0 0 0 0 0 0 0 0 0 0 0 0 0 0 0
New 0 0 0 0 0 0 5 9 14 15 24 9 5 9 14 15 24 9Returning 0 0 0 0 0 0 3 0 3 3 5 2 3 0 3 3 5 2
Miscellaneous-GR Professional Dev Total 0 0 0 0 0 0 8 9 17 18 29 11 8 9 17 18 29 11
FA16 FA17 FA18 FA19 FA20 Var. FA16 FA17 FA18 FA19 FA20 Var. FA16 FA17 FA18 FA19 FA20 Var.New 0 0 0 0 0 0 65 55 36 40 24 -16 65 55 36 40 24 -16
Returning 0 0 0 0 0 0 3 0 3 11 5 -6 3 0 3 11 5 -6Miscellaneous Educ. - TOTAL 0 0 0 0 0 0 68 55 39 51 29 -22 68 55 39 51 29 -22
Prior to Fall 2020, UG Professional Development and GR Professional Development were reported under Miscellaneous (within School of Arts & Sciences).
FA16 FA17 FA18 FA19 FA20 Var. FA16 FA17 FA18 FA19 FA20 Var. FA16 FA17 FA18 FA19 FA20 Var.New 34 44 36 39 29 3 187 195 206 232 253 26 221 239 242 271 282 29
Returning 68 82 95 92 95 -3 206 226 221 248 272 27 274 308 316 340 367 24SCHOOL OF EDUCATION - TOTAL 102 126 131 131 124 0 393 421 427 480 525 53 495 547 558 611 649 53
Full-time Part-time Total
Full-time Part-time Total
Full-time Part-time Total
Full-time Part-time Total

Enrollment
2020-21 Point Park University Factbook * 83
Table 4.15. (Continued)School / Department / Student-TypeDept. of Community Engagement
GraduateFA16 FA17 FA18 FA19 FA20 Var. FA16 FA17 FA18 FA19 FA20 Var. FA16 FA17 FA18 FA19 FA20 Var.
Community Engagement (Doctorate) 12 18 13 0 0 0 15 23 33 45 36 -9 27 41 46 45 36 -9 New 12 18 13 0 0 0 1 0 1 11 8 -3 13 18 14 11 8 -3 Returning 0 0 0 0 0 0 14 23 32 34 28 -6 14 23 32 34 28 -6Community Engagement LowRes(Doct) 0 0 0 0 0 0 0 0 0 6 4 -2 0 0 0 6 4 -2 New 0 0 0 0 0 0 0 0 0 6 0 -6 0 0 0 6 0 -6 Returning 0 0 0 0 0 0 0 0 0 0 4 4 0 0 0 0 4 4
New 12 18 13 0 0 0 1 0 1 17 8 -9 13 18 14 17 8 -9Returning 0 0 0 0 0 0 14 23 32 34 32 -2 14 23 32 34 32 -2
COMMUNITY ENGAGEMENT - TOTAL 12 18 13 0 0 0 15 23 33 51 40 -11 27 41 46 51 40 -11
UNIVERSITY GRAND TOTALS:
FA16 FA17 FA18 FA19 FA20 Var. FA16 FA17 FA18 FA19 FA20 Var. FA16 FA17 FA18 FA19 FA20 Var.New 1006 1092 989 925 772 -153 399 366 346 368 357 -11 1405 1458 1335 1293 1129 -164
Returning 1937 1947 2033 1905 1808 -97 751 819 731 731 654 -77 2688 2766 2764 2636 2462 -174Grand Total 2943 3039 3022 2830 2580 -250 1150 1185 1077 1099 1011 -88 4093 4224 4099 3929 3591 -338
Full-time Part-time Total
Full-time Part-time Total

Enrollment
2020-21 Point Park University Factbook * 84
Am.Indian/ Black or Hispanic NatHawaiian Non-res Two or more Un- Total Male Female Alaska Nat. Asian Afri.Am. of any race /Pacific Isl. Alien White races knownSchool of Arts & Sciences
Dept. of Criminal Justice & Intel. StudiesCriminal Justice 59 23 36 1 12 1 1 39 3 2Criminal Justice - Online 26 7 19 9 2 15Criminal Justice Administration/MS 9 2 7 2 6 1Forensic Science 73 13 60 1 1 8 4 56 3Intelligence&Global Security/MA-Online 16 10 6 1 4 10 1Intelligence and National Security 34 20 14 3 4 26 1
Dept. of Humanities & Social SciencesGlobal Cultural Studies 12 4 8 1 1 9 1History 6 4 2 1 4 1Interdisciplinary Design 11 5 6 5 6Interdisciplinary Design - Online 7 2 5 1 5 1Interdisciplinary Studies 5 3 2 2 3Interdisciplinary Studies - Online 1 1 1Legal Studies 15 4 11 3 1 10 1Liberal Studies 7 4 3 2 2 2 1Political Science 26 9 17 1 7 1 16 1
Dept. of Literary ArtsCreative Writing 10 2 8 1 5 3 1English 16 2 14 1 2 12 1English/Creative Writing 13 5 8 2 1 10Social Justice Studies 2 2 2
Table 4.16. Student Enrollment by School/Department/Major and Demographics, Fall 2020Gender Race/Ethnicity

Enrollment
2020-21 Point Park University Factbook * 85
Am.Indian/ Black or Hispanic NatHawaiian Non-res Two or more Un- Total Male Female Alaska Nat. Asian Afri.Am. of any race /Pacific Isl. Alien White races knownSchool of Arts & Sciences (cont.)
Dept. of Natural Sciences & Engr TechBiological Sciences 47 15 32 1 9 3 3 27 3 1Civil Engineering Technology 36 29 7 1 3 1 11 19 1Electrical Engineering 25 23 2 4 20 1Electrical Engineering - Undeclared 9 6 3 2 1 6Electrical Engineering Technology 3 3 1 2Engineering Management/MS 6 6 4 2Environmental Studies/MS 5 4 1 5Funeral Service 12 2 10 8 4Funeral Service (Capstone) 1 1 1Funeral Service (Capstone) - Undeclared 4 1 3 1 3Funeral Serv: Health & Science (Capstone) 2 1 1 2Mechanical Engineering 38 31 7 1 4 7 26Mechanical Engineering - Undeclared 11 10 1 2 1 8Mechanical Engineering Technology 5 4 1 1 2 2Premedical and Preprofessional Studies 3 3 1 2Specialized Funeral Serv: Business Admin 1 1 1Specialized Funeral Serv: Health & Sci 6 1 5 1 5
Dept. of PsychologyBehavioral Sciences 20 20 5 2 13Clinical Psychology (Doctorate) 7 2 5 1 6Clinical-Community Psy - Terminal/Master 3 3 2 1Clinical-Community Psychology (Doctorate) 21 5 16 3 2 16Community Psychology/Masters 18 6 12 1 14 2 1Psychology 106 14 92 2 17 5 2 77 3
Miscellaneous (Arts & Sciences)Non-Degree Program 4 3 1 3 1Non-Degree Program/Masters - Online 2 0 2 2Undecided 48 22 26 6 6 31 4 1
Table 4.16. (Continued)Gender Race/Ethnicity

Enrollment
2020-21 Point Park University Factbook * 86
Am.Indian/ Black or Hispanic NatHawaiian Non-res Two or more Un- Total Male Female Alaska Nat. Asian Afri.Am. of any race /Pacific Isl. Alien White races knownSchool of Business
Dept. of Acct, Econ&Fin, Info TechAccounting 42 24 18 1 6 3 1 29 1 1Accounting - Online 21 10 11 1 2 17 1Applied Computer Science 10 10 2 8Applied Computer Science - Online 5 4 1 1 4Economics and Finance 19 14 5 4 1 2 11 1Information Technology 24 21 3 2 3 2 17Information Technology - Online 23 17 6 1 2 20
Dept. of Business ManagementBusiness Administration 1 1 1Business Administration - Online 1 1 1Business Management 136 79 57 2 1 33 6 18 67 8 1Business Management - Online 59 20 39 1 13 41 2 2Healthcare Administration/MS - Online 38 9 29 1 5 1 29 2Human Resources Management 26 10 16 1 1 1 1 17 5Human Resources Management - Online 26 3 23 8 17 1Info Systems & Bus Analytics/MS 6 1 5 1 3 2Info Systems & Bus Analyt/MBA (dual) 2 2 2Marketing and Sales 29 15 14 4 5 1 17 2Marketing and Sales - Online 9 2 7 9Master of Business Admin 70 37 33 1 4 1 12 49 2 1Master of Business Admin - Online 88 34 54 8 3 1 1 73 2Organizational Leadership/BA - Online 23 7 16 7 1 14 1Public Administration - Online 19 14 5 3 16
Dept. of Sports, Arts&Entertainment MgtSports, Arts and Entertainment Mgmt 221 100 121 2 21 12 5 169 10 2
Table 4.16. (Continued)Gender Race/Ethnicity
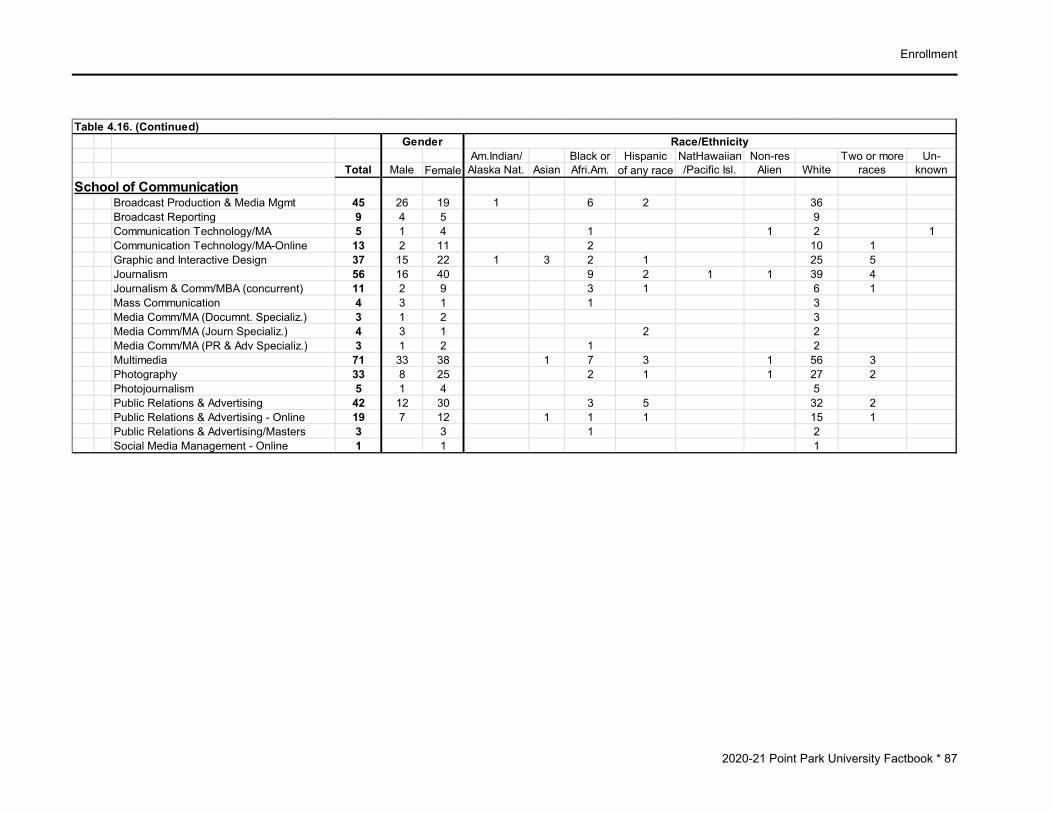
Enrollment
2020-21 Point Park University Factbook * 87
Am.Indian/ Black or Hispanic NatHawaiian Non-res Two or more Un- Total Male Female Alaska Nat. Asian Afri.Am. of any race /Pacific Isl. Alien White races knownSchool of Communication
Broadcast Production & Media Mgmt 45 26 19 1 6 2 36Broadcast Reporting 9 4 5 9Communication Technology/MA 5 1 4 1 1 2 1Communication Technology/MA-Online 13 2 11 2 10 1Graphic and Interactive Design 37 15 22 1 3 2 1 25 5Journalism 56 16 40 9 2 1 1 39 4Journalism & Comm/MBA (concurrent) 11 2 9 3 1 6 1Mass Communication 4 3 1 1 3Media Comm/MA (Documnt. Specializ.) 3 1 2 3Media Comm/MA (Journ Specializ.) 4 3 1 2 2Media Comm/MA (PR & Adv Specializ.) 3 1 2 1 2Multimedia 71 33 38 1 7 3 1 56 3Photography 33 8 25 2 1 1 27 2Photojournalism 5 1 4 5Public Relations & Advertising 42 12 30 3 5 32 2Public Relations & Advertising - Online 19 7 12 1 1 1 15 1Public Relations & Advertising/Masters 3 3 1 2Social Media Management - Online 1 1 1
Gender Race/EthnicityTable 4.16. (Continued)

Enrollment
2020-21 Point Park University Factbook * 88
Am.Indian/ Black or Hispanic NatHawaiian Non-res Two or more Un- Total Male Female Alaska Nat. Asian Afri.Am. of any race /Pacific Isl. Alien White races knownConservatory of Performing Arts
Dept. of Cinema ArtsAnimation 6 6 5 1Animation & Visual Effects 48 18 30 1 4 3 38 2Cinema and Media Studies 32 23 9 4 2 25 1Cinema Arts 8 5 3 2 5 1Cinema Production 111 62 49 3 11 6 88 3Screenwriting 20 12 8 3 16 1Writing for the Screen & Media 19 11 8 7Writing for the Screen & Stage/MFA 7 3 4 1 16 1 1
Dept. of DanceDance 12 1 11 2 4 5 1Dance (BFA) 54 7 47 1 8 5 2 36 2Dance: Ballet (BA) 2 2 2Dance: Ballet (BFA) 53 5 48 3 5 6 1 34 3 1Dance: Jazz (BFA) 94 7 87 1 2 4 10 73 4Dance: Modern (BA) 3 1 2 3Dance: Modern (BFA) 93 12 81 2 15 9 2 61 4
Dept. of TheatreActing 59 28 31 1 10 9 1 35 3Musical Theatre 92 49 43 2 15 12 3 54 6Theatre Arts (BFA) 24 8 16 1 3 1 19Theatre Arts: Directing 3 2 1 2 1Theatre Arts: Performance & Practices 32 12 20 6 6 1 19Theatre Arts: Self-Directed 20 1 19 2 2 16Theatre Production: Design 16 5 11 14 2Theatre Production: Stage Mgt 26 2 24 1 23 2Theatre Production: Tech Design & Mgt 15 8 7 1 14
Community EngagementDept. of Community Engagement
Community Engagement/Doctorate 36 10 26 11 2 22 1Community Engagement Low Res/Doct. 4 4 2 2
Gender Race/EthnicityTable 4.16. (Continued)

Enrollment
2020-21 Point Park University Factbook * 89
Am.Indian/ Black or Hispanic NatHawaiian Non-res Two or more Un- Total Male Female Alaska Nat. Asian Afri.Am. of any race /Pacific Isl. Alien White races knownSchool of Education
Dept. of EducationAdult Learning & Training/MA - Online 5 5 5Athletic Coaching/MED - Online 13 9 4 3 1 9Athletic Coaching & Admin/MED - Online 16 9 7 1 12 3Curriculum and Instruction/MA - Online 42 6 36 7 1 34Educational Administration/MA 1 1 1Educational Administration/MA - Online 56 20 36 9 47English Sec Ed - Undeclared 3 1 2 1 1 1English Sec Ed/Spec Educ 7-12 - Und 2 2 1 1English/Sec Ed/Spec Educ 7-12 3 3 3English/Secondary Education 3 3 1 2Instructional Studies 3 3 2 1Instructional Studies - Online 5 1 4 1 2 2Leadership & Administration/Doctorate 71 33 38 18 1 49 3Leadership & Administration/Doct-Onln 86 31 55 12 3 68 1 2M.Ed Secondary Edu Cert 7-12 9 2 7 1 8M.Ed Secondary Edu Cert 7-12 - Online 9 5 4 9M.Ed Special Edu PA Cert PreK-12 -Onln 17 7 10 1 5 11M.A. Special Edu PA Cert PreK-12 -Onln 11 11 11M.Ed w/ Cert Pre K-4 - Online 18 1 17 4 14Masters-Spec Edu w/Cert PreK-8-Online 17 1 16 2 15Masters-Spec Edu w/Cert 7-12 - Online 8 8 1 7
Table 4.16. (Continued)Gender Race/Ethnicity

Enrollment
2020-21 Point Park University Factbook * 90
Am.Indian/ Black or Hispanic NatHawaiian Non-res Two or more Un- Total Male Female Alaska Nat. Asian Afri.Am. of any race /Pacific Isl. Alien White races knownSchool of Education (cont.)
Dept. of Education (cont.)Math/Sec Ed - Undeclared 4 1 3 4Math/Sec Ed/Spec Educ 7-12 - Undecl 1 1 1Mathematics/Secondary Educ 1 1 1PA Cert English 4-8 - Undeclared 3 3 3PA Cert English 4th-8th Spec Educ 1 1 1PA Cert Math 4-8 - Undeclared 1 1 1PA Cert Math 4-8 Spec Educ - Undecl 1 1 1PA Cert Math 4th-8th 1 1 1PA Cert PreK-4 Spec Educ - Undeclared 25 2 23 2 1 22PA Cert PreK-4th 12 12 3 1 8PA Cert PreK-4th - Undeclared 23 5 18 2 16 5PA Cert PreK-4th Spec Educ 13 13 1 12PA Cert Science 4-8 Spec Educ - Undecl 1 1 1PA Cert Science 4th-8th Spec Educ 1 1 1PA Cert Social Studies 4th-8th 2 2 2PA Cert Social Studies 4th-8th Spec Educ 1 1 1Reading Specialist - Online 5 5 5School Principal K-12 - Online 88 21 67 2 11 1 1 72 1Social Studies/Sec Ed/Spec Ed 7th-12th 1 1 1Social Studies/SecEd/SpecEd 7-12 -Und 3 3 3Social Studies/Sec Ed - Undeclared 4 3 1 4Social Studies/Secondary Educ 2 2 2Superintendent's Letter Eligibility - Online 28 17 11 1 3 1 23
Miscellaneous (Education)Professional Development - GR 16 8 8 2 2 12Professional Development: PreK-4 4 4 1 3Professional Development: Second. Educ. 9 4 5 1 6 2
Table 4.16. (Continued)Gender Race/Ethnicity

Enrollment
2020-21 Point Park University Factbook * 91
Table 4.17. Fall 2020 Enrollment of Residents and Commuters by Academic School and Division
Arts & Sciences Business Communication Conservatory Community Engagement Education
Residents 207 137 95 318 0 34 791
Commuters 497 557 227 512 0 207 2,000
Undergraduate Total: 704 694 322 830 0 241 2,791
Residents 2 2 0 0 0 0 4
Commuters 85 202 42 19 40 408 796
Graduate Total: 87 204 42 19 40 408 800
209 139 95 318 0 34 795
582 759 269 531 40 615 2,796
Grand Total: 791 898 364 849 40 649 3,591
Total UG & GR Commuters:
Academic School
Total
Undergraduate
Graduate
Total UG & GR Residents:

Enrollment
2020-21 Point Park University Factbook * 92
By Country of Origin2016 2017 2018 2019 2020 2016 2017 2018 2019 2020
Argentina 1 1 Jordan 2 2 2 3Australia 4 3 2 2 1 Kazakhstan 1Bangladesh 2 1 1 Kenya 1Belize 1 Korea 2 1 2 1 1Bermuda 1 2 3 3 Malaysia 1Bolivia 1 1 1 Mali 2 1 1 1Botswana 1 1 Mexico 1 3 1Brazil 1 3 3 2 2 Morocco 1Bulgaria 1 Nepal 1 2 4 6 3Canada 10 5 4 5 7 Netherlands 1 4 6 5China 5 1 4 4 6 Nigeria 2 6 12 6 3Colombia 1 1 1 Pakistan 1 3 2Congo 1 Philippines 1 1Costa Rica 1 Poland 1 1 1Côte D'Ivoire 1 Portugal 1Dominican Republic 1 2 2 7 4 Romania 1Ecuador 1 2 1 Russian Federation 1 1Eritrea 1 Saudi Arabia 103 84 71 42 18Ethiopia 1 Spain 2 1 2 3 4Finland 1 1 2 1 Sweden 1 1France 2 1 2 Switzerland 1 1 1Gabon 1 Taiwan, Prov. of China 1Germany 1 1 1 2 1 Thailand 2Ghana 1 1 1 Turkey 1Honduras 1 Uganda 1 1 1India 1 10 26 24 18 United Kingdom 8 7 2 1 2Ireland 1 1 1 1 Uzbekistan 8Italy 2 2 2 2 Venezuela 7 3 5 6 4Jamaica 2 3 1 Vietnam 2 2 1 1Japan 1 1 1 1 Zimbabwe 1
TOTAL 181 164 167 143 99
Table 4.18. Enrollment Trends of International Students, Table 4.18. (Continued)
Continued…

Enrollment
2020-21 Point Park University Factbook * 93
Fig. 4.15. FALL 2020 Enrollment - with a focus on Southwestern Pennsylvania Counties
Counties TotalSouthwestern PA:
Allegheny 1,482Armstrong 23
Beaver 73Butler 132
Fayette 49Greene 6Indiana 13
Lawrence 42Washington 98
Westmoreland 168
Subtotal SW PA: 2,086
Other Western PA 239
All Western PA: 2,325
Other PA counties 361Other States&Countries 905
Total Enrolled: 3,591
42 132
73 23
1,48213
168
98
496
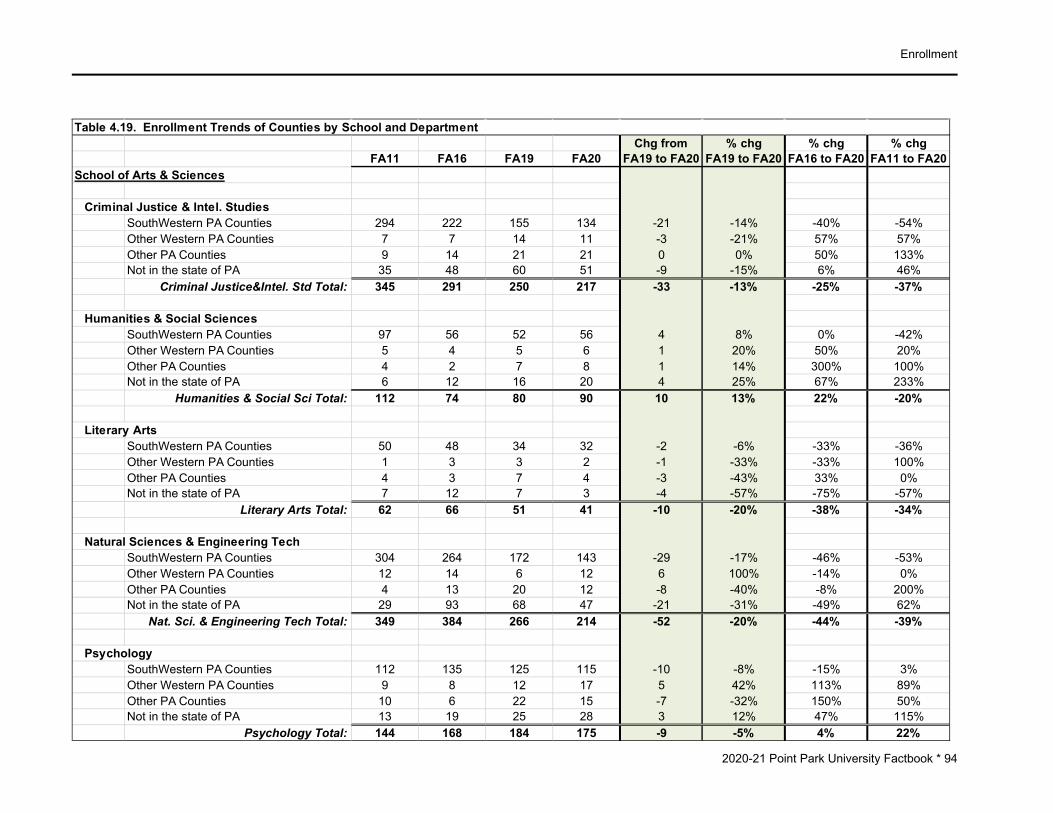
Enrollment
2020-21 Point Park University Factbook * 94
Chg from % chg % chg % chgFA11 FA16 FA19 FA20 FA19 to FA20 FA19 to FA20 FA16 to FA20 FA11 to FA20
School of Arts & Sciences
Criminal Justice & Intel. StudiesSouthWestern PA Counties 294 222 155 134 -21 -14% -40% -54%Other Western PA Counties 7 7 14 11 -3 -21% 57% 57%Other PA Counties 9 14 21 21 0 0% 50% 133%Not in the state of PA 35 48 60 51 -9 -15% 6% 46%
Criminal Justice&Intel. Std Total: 345 291 250 217 -33 -13% -25% -37%
Humanities & Social SciencesSouthWestern PA Counties 97 56 52 56 4 8% 0% -42%Other Western PA Counties 5 4 5 6 1 20% 50% 20%Other PA Counties 4 2 7 8 1 14% 300% 100%Not in the state of PA 6 12 16 20 4 25% 67% 233%
Humanities & Social Sci Total: 112 74 80 90 10 13% 22% -20%
Literary ArtsSouthWestern PA Counties 50 48 34 32 -2 -6% -33% -36%Other Western PA Counties 1 3 3 2 -1 -33% -33% 100%Other PA Counties 4 3 7 4 -3 -43% 33% 0%Not in the state of PA 7 12 7 3 -4 -57% -75% -57%
Literary Arts Total: 62 66 51 41 -10 -20% -38% -34%
Natural Sciences & Engineering TechSouthWestern PA Counties 304 264 172 143 -29 -17% -46% -53%Other Western PA Counties 12 14 6 12 6 100% -14% 0%Other PA Counties 4 13 20 12 -8 -40% -8% 200%Not in the state of PA 29 93 68 47 -21 -31% -49% 62%
Nat. Sci. & Engineering Tech Total: 349 384 266 214 -52 -20% -44% -39%
PsychologySouthWestern PA Counties 112 135 125 115 -10 -8% -15% 3%Other Western PA Counties 9 8 12 17 5 42% 113% 89%Other PA Counties 10 6 22 15 -7 -32% 150% 50%Not in the state of PA 13 19 25 28 3 12% 47% 115%
Psychology Total: 144 168 184 175 -9 -5% 4% 22%
Table 4.19. Enrollment Trends of Counties by School and Department

Enrollment
2020-21 Point Park University Factbook * 95
Chg from % chg % chg % chgFA11 FA16 FA19 FA20 FA19 to FA20 FA19 to FA20 FA16 to FA20 FA11 to FA20
School of Arts & Sciences (con't)
Miscellaneous (Arts & Sciences)SouthWestern PA Counties 77 58 39 35 -4 -10% -40% -55%Other Western PA Counties 4 1 5 9 4 80% 800% 125%Other PA Counties 4 5 5 2 -3 -60% -60% -50%Not in the state of PA 7 10 13 8 -5 -38% -20% 14%
Miscellaneous (A&S) Total: 92 74 62 54 -8 -13% -27% -41%
School of Business
Accounting, Economic&Finance, Info TechSouthWestern PA Counties 180 121 136 109 -27 -20% -10% -39%Other Western PA Counties 4 8 10 9 -1 -10% 13% 125%Other PA Counties 0 6 6 8 2 33% 33% naNot in the state of PA 5 20 15 18 3 20% -10% 260%
Acct, Econ&Fin, Info Tech Total: 189 155 167 144 -23 -14% -7% -24%
Business ManagementSouthWestern PA Counties 647 605 476 396 -80 -17% -35% -39%Other Western PA Counties 9 16 16 22 6 38% 38% 144%Other PA Counties 4 20 18 25 7 39% 25% 525%Not in the state of PA 39 68 104 90 -14 -13% 32% 131%
Business Management Total: 699 709 614 533 -81 -13% -25% -24%
Sports, Arts & Entertainment MgtSouthWestern PA Counties 137 172 152 124 -28 -18% -28% -9%Other Western PA Counties 14 26 37 32 -5 -14% 23% 129%Other PA Counties 12 19 24 21 -3 -13% 11% 75%Not in the state of PA 40 72 54 44 -10 -19% -39% 10%
Sports, Arts & Entert Mgt Total: 203 289 267 221 -46 -17% -24% 9%
Table 4.19. (Continued)
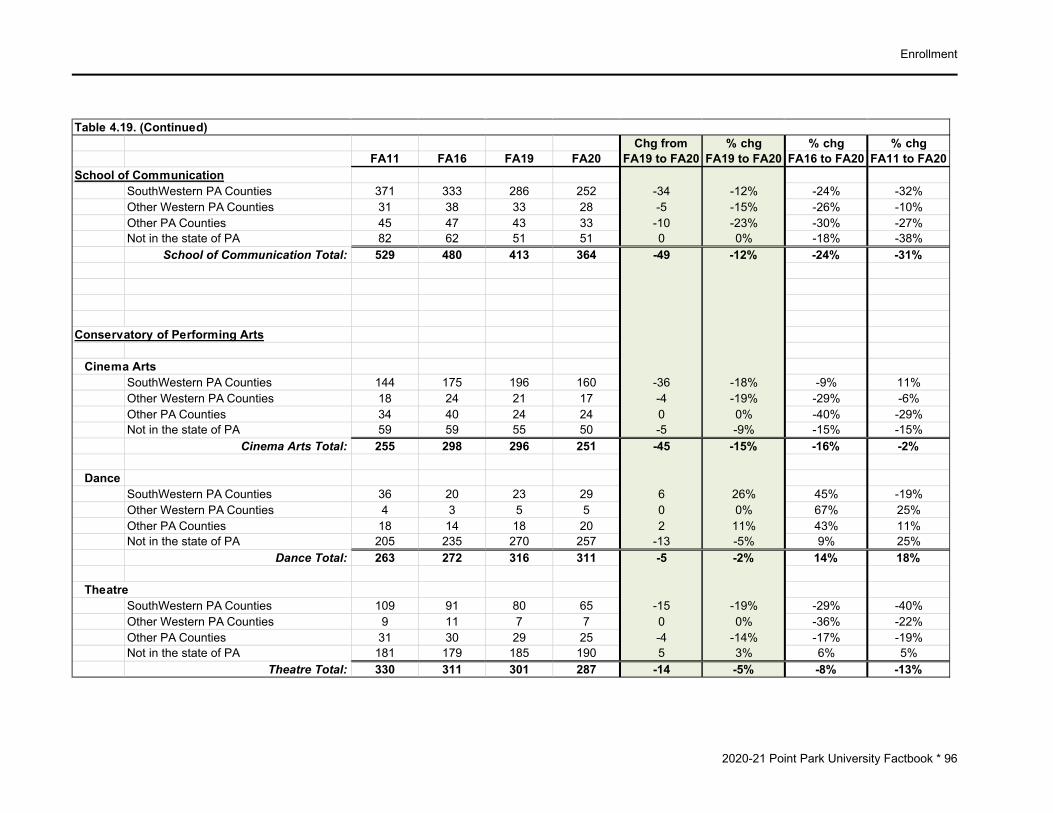
Enrollment
2020-21 Point Park University Factbook * 96
Chg from % chg % chg % chgFA11 FA16 FA19 FA20 FA19 to FA20 FA19 to FA20 FA16 to FA20 FA11 to FA20
School of CommunicationSouthWestern PA Counties 371 333 286 252 -34 -12% -24% -32%Other Western PA Counties 31 38 33 28 -5 -15% -26% -10%Other PA Counties 45 47 43 33 -10 -23% -30% -27%Not in the state of PA 82 62 51 51 0 0% -18% -38%
School of Communication Total: 529 480 413 364 -49 -12% -24% -31%
Conservatory of Performing Arts
Cinema ArtsSouthWestern PA Counties 144 175 196 160 -36 -18% -9% 11%Other Western PA Counties 18 24 21 17 -4 -19% -29% -6%Other PA Counties 34 40 24 24 0 0% -40% -29%Not in the state of PA 59 59 55 50 -5 -9% -15% -15%
Cinema Arts Total: 255 298 296 251 -45 -15% -16% -2%
DanceSouthWestern PA Counties 36 20 23 29 6 26% 45% -19%Other Western PA Counties 4 3 5 5 0 0% 67% 25%Other PA Counties 18 14 18 20 2 11% 43% 11%Not in the state of PA 205 235 270 257 -13 -5% 9% 25%
Dance Total: 263 272 316 311 -5 -2% 14% 18%
TheatreSouthWestern PA Counties 109 91 80 65 -15 -19% -29% -40%Other Western PA Counties 9 11 7 7 0 0% -36% -22%Other PA Counties 31 30 29 25 -4 -14% -17% -19%Not in the state of PA 181 179 185 190 5 3% 6% 5%
Theatre Total: 330 311 301 287 -14 -5% -8% -13%
Table 4.19. (Continued)

Enrollment
2020-21 Point Park University Factbook * 97
Chg from % chg % chg % chgFA11 FA16 FA19 FA20 FA19 to FA20 FA19 to FA20 FA16 to FA20 FA11 to FA20
School of Education
EducationSouthWestern PA Counties 268 311 382 390 8 2% 25% 46%Other Western PA Counties 6 41 52 61 9 17% 49% 917%Other PA Counties 4 60 99 128 29 29% 113% 3100%Not in the state of PA 13 15 27 41 14 52% 173% 215%
Education Total: 291 427 560 620 60 11% 45% 113%
Miscellaneous (Education)SouthWestern PA Counties 53 61 39 13 -26 -67% -79% -75%Other Western PA Counties 1 2 0 0 0 na -100% -100%Other PA Counties 2 4 11 14 3 27% 250% 600%Not in the state of PA 1 1 1 2 1 100% 100% 100%
Miscellaneous (Education) Total: 57 68 51 29 -22 -43% -57% -49%
Community EngagementSouthWestern PA Counties 0 27 42 33 -9 -21% 22% naOther Western PA Counties 0 0 1 1 0 0% na naOther PA Counties 0 0 1 1 0 0% na naNot in the state of PA 0 0 7 5 -2 -29% na na
Community Engagement Total: 0 27 51 40 -11 -22% 48% naGrand Total: 3,920 4,093 3,929 3,591 -338 -9% -12% -8%
Note: Counties are determined by the students' most current address recorded at census.
Table 4.19. (Continued)

Enrollment
2020-21 Point Park University Factbook * 98
Fig. 4.16. NET CHANGE in Enrollment between Fall 2019 and Fall 2020, with a focus on SouthWestern PA Counties
Chg fromCounties FA19 to FA20
SouthWest PA:Allegheny -230Armstrong -6
Beaver -18Butler -18
Fayette 7Greene -3Indiana -4
Lawrence 2Washington -15
Westmoreland -18
Subtotal SW PA: -303
Other Western PA 12
All Western PA: -291
Other PA counties 6Other States&Countries -53
Total NET CHANGE: -338
2 -18
-18 -6
-230
-4
-18-15
7-3

Enrollment
2020-21 Point Park University Factbook * 99
Chg from % chg % chg % chgWestern PA County Breakdown FA11 FA12 FA13 FA14 FA15 FA16 FA17 FA18 FA19 FA20 FA19 to FA20 FA19 to FA20 FA16 to FA20 FA11 to FA20 SouthWest PA Counties: Allegheny 2,258 2,167 2,151 1,984 2,003 2,059 2,018 1,859 1,712 1,482 -230 -13% -28% -34% Armstrong 20 21 21 20 23 28 30 28 29 23 -6 -21% -18% 15% Beaver 111 105 109 92 78 82 85 90 91 73 -18 -20% -11% -34% Butler 91 98 95 83 105 105 124 147 150 132 -18 -12% 26% 45% Fayette 34 43 47 39 41 48 57 44 42 49 7 17% 2% 44% Greene 8 5 3 2 3 9 9 9 9 6 -3 -33% -33% -25% Indiana 10 12 15 13 20 14 18 20 17 13 -4 -24% -7% 30% Lawrence 31 29 27 26 29 34 40 40 40 42 2 5% 24% 35% Washington 115 117 115 106 126 116 130 124 113 98 -15 -13% -16% -15% Westmoreland 201 200 194 176 179 204 219 194 186 168 -18 -10% -18% -16%
Subtotal SW PA: 2,879 2,797 2,777 2,541 2,607 2,699 2,730 2,555 2,389 2,086 -303 -13% -23% -28% Other Western PA Counties: Bedford 2 3 3 2 1 2 2 5 8 8 0 0% 300% 300% Blair 16 13 13 11 13 19 19 23 24 26 2 8% 37% 63% Cambria 19 17 19 26 26 42 51 48 40 44 4 10% 5% 132% Cameron 0 0 0 0 0 0 0 0 0 0 0 na na na Clarion 6 6 5 6 4 5 8 10 10 6 -4 -40% 20% 0% Clearfield 8 4 5 6 7 8 16 15 11 16 5 45% 100% 100% Crawford 13 14 12 13 12 13 15 13 11 7 -4 -36% -46% -46% Elk 3 3 3 2 2 4 9 6 5 8 3 60% 100% 167% Erie 23 20 30 24 37 49 60 48 37 51 14 38% 4% 122% Forest 0 0 0 0 0 0 1 1 0 0 0 na na na Huntingdon 0 0 0 1 1 4 3 6 5 5 0 0% 25% na Jefferson 5 6 6 4 6 6 10 18 11 11 0 0% 83% 120% McKean 3 5 3 3 3 5 4 4 4 4 0 0% -20% 33% Mercer 18 17 12 16 23 23 34 32 31 24 -7 -23% 4% 33% Somerset 10 11 7 8 9 12 19 17 15 13 -2 -13% 8% 30% Venango 4 3 3 5 11 11 15 14 9 12 3 33% 9% 200% Warren 4 4 2 1 1 3 6 7 6 4 -2 -33% 33% 0%
Subtotal Other W-PA: 134 126 123 128 156 206 272 267 227 239 12 5% 16% 78%Total All Western PA Counties: 3,013 2,923 2,900 2,669 2,763 2,905 3,002 2,822 2,616 2,325 -291 -11% -20% -23%
Total from Other PA Counties: 185 183 154 195 214 283 295 324 355 361 6 2% 28% 95%Total Not from the state of PA: 722 721 787 873 867 905 927 953 958 905 -53 -6% 0% 25%
Total Enrollment: 3,920 3,827 3,841 3,737 3,844 4,093 4,224 4,099 3,929 3,591 -338 -9% -12% -8%
Table 4.20. Enrollment Trends of Western Pennsylvania Counties vs. Other PA Counties vs. Not from the state of PA

Enrollment
2020-21 Point Park University Factbook * 100
Count % Count % TotalSchool of Arts & Sciences
Criminal Justice & Intel Stds 51 24% 166 76% 217Humanities & Social Sciences 28 31% 62 69% 90Literary Arts 10 24% 31 76% 41Natural Sci & Engineering Tech 53 25% 161 75% 214Psychology 48 27% 127 73% 175Miscellaneous (Arts & Sciences) 12 22% 42 78% 54
School of Arts & Sciences Total: 202 26% 589 74% 791
School of Business Acct, Econ&Fin, Info Tech 44 31% 100 69% 144Business Management 173 32% 360 68% 533Sports, Arts & Entertainment Mgt 37 17% 184 83% 221
School of Business Total: 254 28% 644 72% 898
School of Communication 72 20% 292 80% 364School of Communication Total: 72 20% 292 80% 364
Conservatory of Performing ArtsCinema Arts 37 15% 214 85% 251Dance 8 3% 303 97% 311Theatre 22 8% 265 92% 287
Conservatory of Perf. Arts Total: 67 8% 782 92% 849
Community Engagement 18 45% 22 55% 40Community Engagement Total: 18 45% 22 55% 40
School of EducationEducation 138 22% 482 78% 620Miscellaneous (Education) 4 14% 25 86% 29
School of Education Total: 142 22% 507 78% 649Grand Total: 755 21% 2,836 79% 3,591
Note: ‘Permanent Residency’ is determined by the students' most current zip code recorded at census; PCHE (Pittsburgh Council on Higher Education) has defined which zip codes make up the geographic boundaries of the City of Pittsburgh.
Table 4.21. Fall 2020 Enrollment - Students' Permanent Residency is City of Pittsburgh vs All Other Locations, by School/Department
Students' Permanent Residency:
Is the City of PittsburghIs Other than City of
Pittsburgh

Retention and Graduation Rates

Retention & Graduation Rates
2020-21 Point Park University Factbook * 101
RETENTION and GRADUATION RATES Overall, first to second year retention for first-time, full-time freshmen decreased slightly between the 2018 and 2019 cohorts (75% and 73%, respectively) and retention for new full-time transfer student dropped for the first time in 5 years to 77%. Traditional on-ground graduate student retention remained at 88% while online graduate student retention increased to 84% (from 77%). Online undergraduate retention increased to 76% (from 70%). See Table 5.1 for additional trend information for all student populations. Upon closer inspection of freshmen retention, significant variation exists among the schools and departments. The biggest increases were experienced in Undecided and Education (+18 and +16 percentage points, respectively). The largest decreases were found in Psychology, Literary Arts, Natural Sciences/Eng Tech and Accounting/Econ/Info Tech (-27, -13, -10, and -10 percentage points, respectively). Retention of freshmen who haven’t decided on a major is closely studied since they are typically retained at a lower rate than students who have declared a major. This year, retention increased eighteen percentage points when compared to last year (59% to 77%). The University continues to implement strategies and assess outcomes in order to engage these students more fully to help them succeed. The largest increases in retention for the transfer undergraduate population were seen in Education, Communication and Cinema (+13, +12, and +12 percentage points, respectively). For traditional graduate student retention, Criminal Justice, Psychology and Natural Sciences saw the largest increases (+23, +15, and +15 percentage points, respectively). Community Engagement experienced the largest decrease over last year from 92% to 63%. Overall, the four-year graduation rate for freshmen decreased four percentage points (from 53% to 49%) and the six-year graduation rate decreased from 60% to 55% (see table 5.8). The largest increase in six-year graduation rates was experienced in Undecided (36% to 47%) while the largest decreases were seen in Humanities (75% to 25%), Education (62% to 42%) and Sports/Arts, Ent Mgmt (71% to 54%) Each year, the Office of Institutional Research and Planning prepares detailed retention reports on the various cohorts for analysis and decision-making. These reports show aggregated data by such variables as gender, race, age, on-campus/commuter, incoming high school grade point average, SAT/ACT scores and many other items. Some of this information is available in tables 5.9 through 5.14.

Retention & Graduation Rates
2020-21 Point Park University Factbook * 102
Fig. 5.1. Overall Fall to Fall Retention Rates by Student Type
79%78%
76%75%
73%
30% 35% 40% 45% 50% 55% 60% 65% 70% 75% 80% 85% 90%
F15 to F16F16 to F17F17 to F18F18 to F19F19 to F20
First-time, Full-time Freshmen
64%52%
74%50%
35%
30% 35% 40% 45% 50% 55% 60% 65% 70% 75% 80% 85% 90%
F15 to F16F16 to F17F17 to F18F18 to F19F19 to F20
Regular Part-time Undergraduates
76%74%
78%81%
77%
30% 35% 40% 45% 50% 55% 60% 65% 70% 75% 80% 85% 90%
F15 to F16F16 to F17F17 to F18F18 to F19F19 to F20
Full-time Undergraduate Transfers
83%83%
85%88%88%
30% 35% 40% 45% 50% 55% 60% 65% 70% 75% 80% 85% 90%
F15 to F16F16 to F17F17 to F18F18 to F19F19 to F20
Graduate Students
60%73%
70%70%
76%
30% 40% 50% 60% 70% 80% 90%
F15 to F16F16 to F17F17 to F18F18 to F19F19 to F20
Online Undergraduate
77%84%
77%77%
84%
30% 40% 50% 60% 70% 80% 90%
F15 to F16F16 to F17F17 to F18F18 to F19F19 to F20
Online Graduate

Retention & Graduation Rates
2020-21 Point Park University Factbook * 103
Table 5.1. Overall Fall to Fall Retention Rates by Student Type*
F15 to F16 F16 to F17 F17 to F18 F18 to F19 F19 to F20
First-time, Full-time Freshmen 79% 78% 76% 75% 73%Regular Part-time Undergraduates 64% 52% 74% 50% 35%Full-time Undergraduate Transfers 76% 74% 78% 81% 77%Graduate Students 83% 83% 85% 88% 88%Online Undergraduate 60% 73% 70% 70% 76%Online Graduate 77% 84% 77% 77% 84%
* Includes those who graduated within one year
30%
40%
50%
60%
70%
80%
90%
100%
F15 to F16 F16 to F17 F17 to F18 F18 to F19 F19 to F20
Fig. 5.2. Fall to Fall Retention Rates of New Students
First-time, Full-time Freshmen Regular Part-time Undergraduates Full-time Undergraduate Transfers
Graduate Students Online Undergraduate Online Graduate

Retention & Graduation Rates
2020-21 Point Park University Factbook * 104
Table 5.2. First-time, Full-time FreshmanFirst Year Retention Rates by School and Academic Department
% DIFF % DIFFEnt. % Ent. % Betw 2019 Ent. % Ent. % Ent. % Betw 2019
Cohort Returning Cohort Returning and 2018 Cohort Returning Cohort Returning Cohort Returning and 2015Arts & Sciences 144 60 130 69 -9 146 73 104 73 127 74 -14
Humanities 11 64 16 63 +1 25 76 38 68 23 70 -6Literary Arts 16 56 13 69 -13 9 78 5 60 16 88 -32Nat Sci & Eng Tech 38 55 31 65 -10 39 72 28 79 46 76 -21Psychology* 34 50 30 77 -27 35 71Crim Justice & Intl Std 45 73 40 70 +3 38 71 33 76 42 69 +4
Business*** 107 70 75 76 -6 103 78 110 74 107 70 0Business** 47 66Management** 63 79Acct,Econ-Fin,IT 17 71 16 81 -10 12 67Business Mgmt 39 72 23 70 +2 35 71Sport,Arts,Ent Mgmt 51 69 36 78 -9 56 84
Conservatory 229 82 245 85 -3 227 80 247 86 209 89 -7Dance 96 87 92 92 -5 78 83 93 88 60 87 0Cinema Arts 61 74 72 71 +3 76 76 76 83 62 94 -20Theatre 72 83 81 88 -5 73 80 78 86 87 87 -4
Communication 90 71 95 68 +3 89 78 88 72 103 78 -7
Education 24 75 17 59 +16 23 70 16 81 16 88 -13
Undecided 35 77 41 59 +18 45 69 41 66 26 69 +8
Total 629 73 603 75 -2 633 76 606 78 588 79 -6
* Psychology was included in Humanities prior to Fall 2017** Sch of Bus departments weren't disaggregated prior to Fall 2016*** Sch of Bus was disaggregated with 3 depts in Fall 2017
Fall 2019 Fall 2016 Fall 2015Fall 2017Fall 2018

Retention & Graduation Rates
2020-21 Point Park University Factbook * 105
Table 5.3. Part-time UndergraduateFirst Year Retention Rates by School and Academic Department
% DIFF % DIFFEnt. % Ent. % Betw 2019 Ent. % Ent. % Ent. % Betw 2019
Cohort Returning Cohort Returning and 2018 Cohort Returning Cohort Returning Cohort Returning and 2015Arts & Sciences 8 50 4 50 0 15 80 22 55 37 65 -15
Humanities - - 1 0 - - 8 50 7 57Literary Arts - - - - - - - - 1 100Nat Sci & Eng Tech 4 50 3 67 0 9 67 9 56 26 65 -15Psychology* 1 0 - - 2 100Crim Justice & Intl Std 3 67 - - 4 100 5 60 3 67 0
Business*** 4 25 5 60 -35 8 100 12 50 12 67 -42Business** 9 33Management** 3 100Acct,Econ-Fin,IT 2 0 2 0 0 3 100Business Mgmt 2 50 1 100 -50 4 100Sport,Arts,Ent Mgmt - - 2 100 1 100
Conservatory 2 50 - - - - - - 1 0 +50Dance - - - - - - - - - -Cinema Arts 2 50 - - - - - - 1 0 +50Theatre - - - - - - - - - -
Communication 2 0 1 0 0 7 29 3 33 2 0 0
Education 1 0 4 50 -50 1 100 6 67 11 73 -73
Undecided - - - - - - 1 0 1 100
Total 17 35 14 50 -15 31 74 44 52 64 64 -29
* Psychology was included in Humanities prior to Fall 2017** Sch of Bus departments weren't disaggregated prior to Fall 2016*** Sch of Bus was disaggregated with 3 depts in Fall 2017
Fall 2019 Fall 2017 Fall 2016 Fall 2015Fall 2018

Retention & Graduation Rates
2020-21 Point Park University Factbook * 106
Table 5.4. Full-time Undergraduate TransferFirst Year Retention Rates by School and Academic Department
% DIFF % DIFFEnt. % Ent. % Betw 2019 Ent. % Ent. % Ent. % Betw 2019
Cohort Returning Cohort Returning and 2018 Cohort Returning Cohort Returning Cohort Returning and 2015Arts & Sciences 57 70 66 82 -12 82 73 104 74 89 73 -3
Humanities 3 67 9 56 +11 8 50 16 56 14 50 +17Literary Arts 2 50 2 50 0 4 25 5 80 11 73 -23Nat Sci & Eng Tech 28 68 20 90 -22 37 81 54 76 42 83 -15Psychology* 6 50 12 75 -25 16 81Crim Justice & Intl Std 18 83 23 91 -8 17 71 29 79 22 68 +15
Business*** 52 79 45 82 -3 63 79 49 76 73 70 +9Business** 24 71Management** 25 80Acct,Econ-Fin,IT 11 82 8 75 +7 15 80Business Mgmt 19 74 14 79 -5 26 73Sport,Arts,Ent Mgmt 22 82 23 87 -5 22 86
Conservatory 37 84 37 87 -3 42 88 29 79 39 77 +7Dance 6 100 4 100 0 6 100 5 100 8 75 +25Cinema Arts 19 95 18 83 +12 20 80 16 75 19 79 +16Theatre 12 58 15 87 -29 16 94 8 75 12 75 -17
Communication 18 89 34 77 +12 38 84 28 64 40 90 -1
Education 10 80 15 67 +13 15 60 10 70 7 86 -6
Undecided 6 50 6 83 -33 8 63 3 100 4 75 -25
Total 180 77 203 81 -4 248 78 223 74 252 76 +1
* Psychology was included in Humanities prior to Fall 2017
** Sch of Bus departments weren't disaggregated prior to Fall 2016
*** Sch of Bus was disaggregated with 3 depts in Fall 2017
Fall 2019 Fall 2017 Fall 2016 Fall 2015Fall 2018
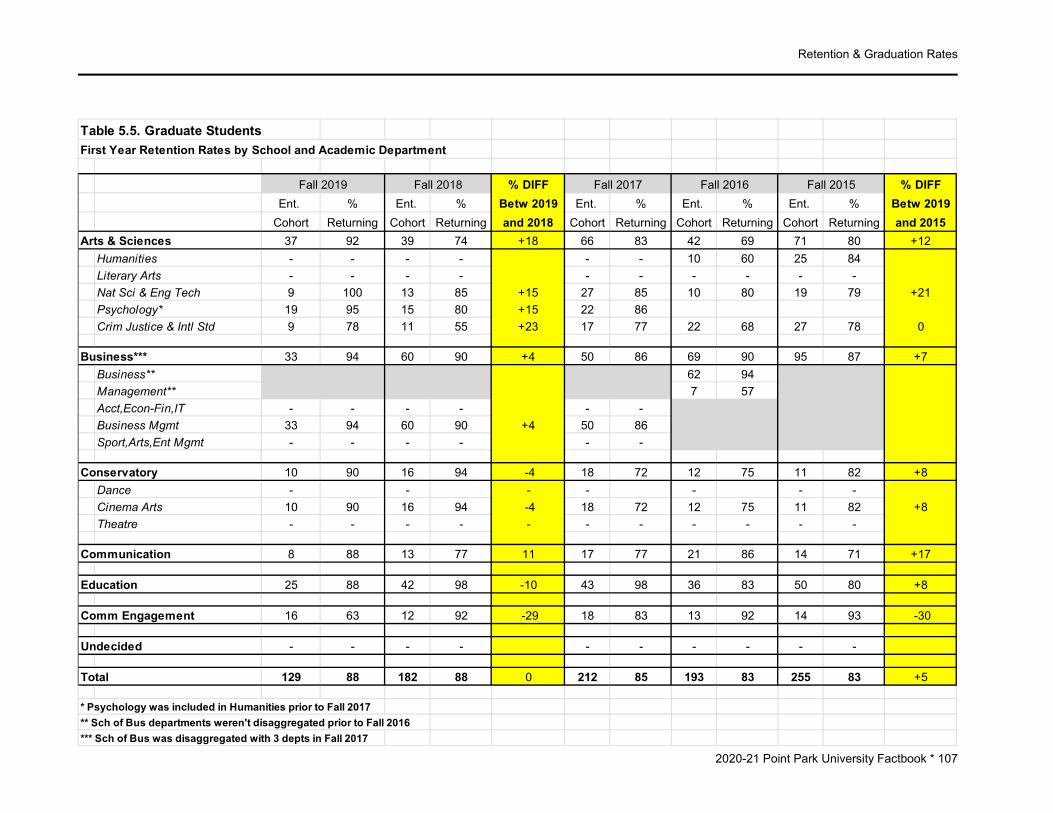
Retention & Graduation Rates
2020-21 Point Park University Factbook * 107
Table 5.5. Graduate StudentsFirst Year Retention Rates by School and Academic Department
% DIFF % DIFFEnt. % Ent. % Betw 2019 Ent. % Ent. % Ent. % Betw 2019
Cohort Returning Cohort Returning and 2018 Cohort Returning Cohort Returning Cohort Returning and 2015Arts & Sciences 37 92 39 74 +18 66 83 42 69 71 80 +12
Humanities - - - - - - 10 60 25 84Literary Arts - - - - - - - - - -Nat Sci & Eng Tech 9 100 13 85 +15 27 85 10 80 19 79 +21Psychology* 19 95 15 80 +15 22 86Crim Justice & Intl Std 9 78 11 55 +23 17 77 22 68 27 78 0
Business*** 33 94 60 90 +4 50 86 69 90 95 87 +7Business** 62 94Management** 7 57Acct,Econ-Fin,IT - - - - - -Business Mgmt 33 94 60 90 +4 50 86Sport,Arts,Ent Mgmt - - - - - -
Conservatory 10 90 16 94 -4 18 72 12 75 11 82 +8Dance - - - - - - -Cinema Arts 10 90 16 94 -4 18 72 12 75 11 82 +8Theatre - - - - - - - - - - -
Communication 8 88 13 77 11 17 77 21 86 14 71 +17
Education 25 88 42 98 -10 43 98 36 83 50 80 +8
Comm Engagement 16 63 12 92 -29 18 83 13 92 14 93 -30
Undecided - - - - - - - - - -
Total 129 88 182 88 0 212 85 193 83 255 83 +5
* Psychology was included in Humanities prior to Fall 2017** Sch of Bus departments weren't disaggregated prior to Fall 2016*** Sch of Bus was disaggregated with 3 depts in Fall 2017
Fall 2019 Fall 2018 Fall 2016 Fall 2015Fall 2017

Retention & Graduation Rates
2020-21 Point Park University Factbook * 108
Table 5.6. Online UndergraduateFirst Year Retention Rates by School and Academic Department
% DIFF % DIFFEnt. % Ent. % Betw 2019 Ent. % Ent. % Ent. % Betw 2019
Cohort Returning Cohort Returning and 2018 Cohort Returning Cohort Returning Cohort Returning and 2015Arts & Sciences 1 100 6 50 +50 7 57 13 69 7 71 +29
Crim Justice & Intl Std 1 100 6 50 +50 6 67 13 69 7 71 +29Humanities - - - - 1 0
Business** 25 48 47 53 -5 38 61 47 64 43 61 -13Business* 31 68Management* 16 56Acct,Econ-Fin,IT 7 43 11 55 -12 13 62Business Mgmt 18 50 36 53 -3 25 60
Communication 2 50 6 67 -17 5 100 2 50
Education 77 86 64 84 +2 36 78 30 90 30 57 +29
Total 105 76 123 70 6 86 70 92 73 80 60 +16
* Sch of Bus departments weren't disaggregated prior to Fall 2016
** Sch of Bus was disaggregated with 3 depts in Fall 2017
Fall 2019 Fall 2018 Fall 2017 Fall 2016 Fall 2015
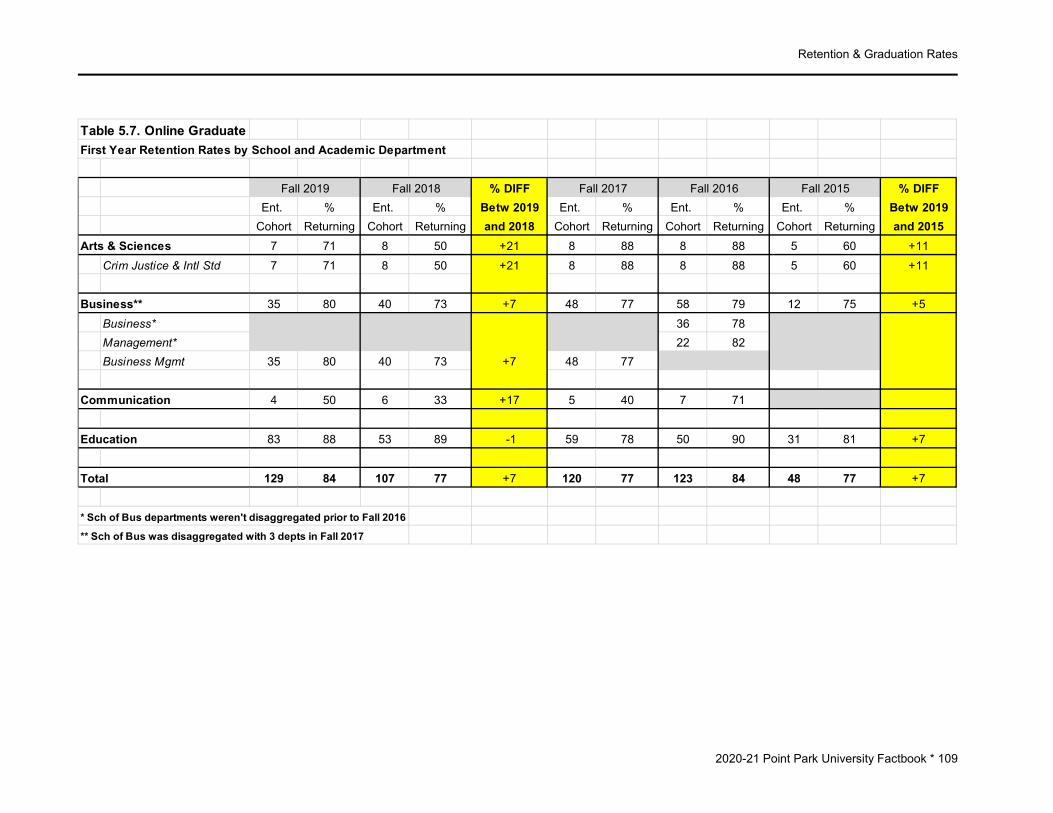
Retention & Graduation Rates
2020-21 Point Park University Factbook * 109
Table 5.7. Online GraduateFirst Year Retention Rates by School and Academic Department
% DIFF % DIFFEnt. % Ent. % Betw 2019 Ent. % Ent. % Ent. % Betw 2019
Cohort Returning Cohort Returning and 2018 Cohort Returning Cohort Returning Cohort Returning and 2015Arts & Sciences 7 71 8 50 +21 8 88 8 88 5 60 +11
Crim Justice & Intl Std 7 71 8 50 +21 8 88 8 88 5 60 +11
Business** 35 80 40 73 +7 48 77 58 79 12 75 +5Business* 36 78Management* 22 82Business Mgmt 35 80 40 73 +7 48 77
Communication 4 50 6 33 +17 5 40 7 71
Education 83 88 53 89 -1 59 78 50 90 31 81 +7
Total 129 84 107 77 +7 120 77 123 84 48 77 +7
* Sch of Bus departments weren't disaggregated prior to Fall 2016
** Sch of Bus was disaggregated with 3 depts in Fall 2017
Fall 2019 Fall 2018 Fall 2017 Fall 2016 Fall 2015

Retention & Graduation Rates
2020-21 Point Park University Factbook * 110
Fall 2012 cohort Fall 2011 cohort Fall 2010 cohortFirst-time, FT Fresh First-time, FT Fresh First-time, FT Fresh
Ent. 4-year 6-year Ent. 4-year 6-year Ent. 4-year 6-year Ent. 4-year 6-year Ent. 4-year 6-yearCohort Grad Rate Grad Rate Cohort Grad Rate Grad Rate Cohort Grad Rate Grad Rate Cohort Grad Rate Grad Rate Cohort Grad Rate Grad Rate
Arts & Sciences 120 41% 48% 98 45% 57% 91 31% 44% 78 34% 47% 90 37% 49%Humanities 8 25% 25% 8 63% 75% 31 26% 26% 20 45% 45% 35 34% 43%Literary Arts 11 64% 64% 8 38% 63% 10 40% 60% 10 40% 40% 13 39% 46%Nat Sci & Eng Tech 47 40% 53% 33 52% 67% 20 40% 55% 19 42% 53% 14 36% 50%Psychology* 16 44% 50% 20 50% 55%Crim Justice/Intl Std 38 37% 42% 29 31% 41% 30 30% 50% 29 35% 59% 28 46% 61%
Business** 106 43% 51% 75 51% 57% 75 49% 64% 71 51% 55% 53 43% 49%Acct,Econ-Fin,IT 13 31% 39% 11 36% 46%Bus Mgmt 28 39% 50% 20 30% 35%Sports,Arts,Ent Mgmt 65 46% 54% 44 64% 71%
Conservatory 255 62% 64% 213 63% 67% 213 72% 74% 191 57% 60% 222 65% 69%Dance 85 67% 68% 82 66% 70% 76 75% 75% 62 52% 53% 84 55% 60%Cinema Arts 78 55% 60% 54 65% 69% 58 60% 67% 63 52% 60% 48 65% 75%Theatre 92 63% 63% 77 58% 62% 79 77% 77% 66 67% 67% 90 76% 76%
Communication 93 41% 47% 107 51% 58% 85 47% 54% 95 51% 55% 113 47% 56%
Education 12 25% 42% 13 23% 62% 20 25% 45% 24 17% 33% 23 30% 44%
Undecided majors 43 33% 47% 31 29% 36% 32 16% 25% 29 35% 45% 35 31% 37%
Total 629 49% 55% 537 53% 60% 496 52% 60% 464 49% 55% 513 51% 58%
Notes:* Psychology was included in Humanities in prior years** Data reported under Sch of Business only in prior years
First-time, FT Fresh
Table 5.8. Four-year and Six-year Graduation Rates (of first-time, full-time freshmen)
Fall 2013 cohortFall 2014 cohortFirst-time, FT Fresh

Retention & Graduation Rates
2020-21 Point Park University Factbook * 111
Table 5.9. One-Year Persistence By Housing Status, Fall 2015-19 cohorts (Freshmen only)
% % % % %2015 2016 2017 2018 2019
(n=588) (n=606) (n=633) (n=603) (n=629)
Living in Residence Halls 81 79 76 77 74
Commuter 75 72 77 66 71
Table 5.10. One-Year Persistence By Course Load, Fall 2015-19 cohorts (On-ground Graduate Students only)
% % % % %2015 2016 2017 2018 2019
(n=255) (n=193) (n=212) (n=182) (n=129)
Full-time 85 84 82 86 93
Part-time 81 82 92 90 81
Table 5.11. One-Year Persistence By Minority Status, Fall 2019 cohort
% % % % %First-time Part-time Full-time Online Online %Freshmen Undergrad Transfer Undergrad Graduate Graduate
(n=629) (n=17) (n=180) (n=105) (n=129) (n=129)
White 74 46 82 82 91 87
Minority 71 17 73 71 66 91
Non-resident Alien 63 - 54 - - 83

Retention & Graduation Rates
2020-21 Point Park University Factbook * 112
Table 5.12. One-Year Persistence By Race, Fall 2019 cohort
% % % % %First-time Part-time Full-time Online Online %Freshmen Undergrad Transfer Undergrad Graduate Graduate
(n=629) (n=17) (n=180) (n=105) (n=129) (n=129)White 74 46 82 82 91 87Black or African-American 73 17 65 67 65 91Asian 83 - 100 100 0 0Hispanic of any race 68 - 81 86 60 100Native Hawaiian/Otr Pacific Islander 100 - - - - -American Indian/Alaska Native 50 - - - - -Non-resident Alien 63 - 54 - - 83Two or more races 70 - 70 0 100 100
Table 5.13. One-Year Persistence By Gender, Fall 2019 cohort
% % % % %First-time Part-time Full-time Online Online %Freshmen Undergrad Transfer Undergrad Graduate Graduate
(n=629) (n=17) (n=180) (n=105) (n=129) (n=129)
Female 73 36 74 75 85 87
Male 73 33 81 79 80 88
Table 5.14. One-Year Persistence By Age, Fall 2019 cohort
% % % % %First-time Part-time Full-time Online Online %Freshmen Undergrad Transfer Undergrad Graduate Graduate
(n=629) (n=17) (n=180) (n=105) (n=129) (n=129)
Traditional (18-24) 73 0 76 50 87 92
Non-traditional (>24) 0 43 85 78 83 85
Academic Programs & Degrees Conferred

Academic Programs and Degrees Conferred
2020-21 Point Park University Factbook * 113
ACADEMIC PROGRAMS And DEGREES CONFERRED Degrees and certificates awarded by Point Park University are authorized by the Pennsylvania Department of Education. The university confers degrees at the Certificate, Associate, Baccalaureate, Masters and Doctorate levels. The University offers a total of 104 degree programs of study. This includes 6 certificate programs, 73 degrees at the undergraduate level, 22 masters programs and 3 doctorate degrees. For a detailed listing, please see table 6.5. During the 2019-20 academic year Point Park granted 1,096 degrees. This number represents a 15% increase in degrees granted from the 2013-14 academic year (table 6.1). Of the 1,096 degrees granted, 32% were awarded by the School of Business, 8% by the School of Communication, 19% by the Conservatory of Performing Arts, 20% by the School of Education, 1% by Community Engagement, and within the School of Arts & Sciences, 7% by the Department of Criminal Justice and Intelligence Studies, 2% by the Department of Humanities & Social Sciences, 1% by the Department of Literary Arts, 8% by the Department of Natural Sciences and Engineering Technology, and 4% by the Department of Psychology (table 6.2). The degrees conferred data in this chapter shows the total number of degrees awarded within an academic year. An academic year in this context is defined as beginning July 1 and ending June 30. This definition is consistent with the Pennsylvania Department of Education’s definition and methodology for reporting degrees awarded.

Academic Programs and Degrees Conferred
2020-21 Point Park University Factbook * 114
Table 6.1 Trends in Degrees Conferred
2013-14 2014-15 2015-16 2016-17 2017-18 2018-19 2019-20 Count % Certificates 3 3 3 38 74 54 79 25 46.3%Associates 4 5 6 4 4 0 2 2 naBachelors 677 692 632 664 669 658 631 -27 -4.1%Masters 267 292 238 245 314 346 343 -3 -0.9%Doctorates 0 0 0 15 14 36 41 5 13.9%Total 951 992 879 966 1,075 1,094 1,096 2 0.2%
Changesfrom 18-19 to 19-20
0
100
200
300
400
500
600
700
800
2013-14 2014-15 2015-16 2016-17 2017-18 2018-19 2019-20
Fig. 6.1. Degrees Conferred Trends
Bachelors
Masters
Doctorates

Academic Programs and Degrees Conferred
2020-21 Point Park University Factbook * 115
Table 6.2. Degrees and Certificates Conferred by Academic School/Department, Academic Year 2019-20% of Total
Certificates Associates Bachelors Masters Doctorates Total UniversitySchool of Arts & Sciences 0 0 164 58 0 222 20.3% Criminal Justice & Intel Std 0 0 51 20 0 71 6.5% Humanities & Social Sci 0 0 16 0 0 16 1.5% Literary Arts 0 0 8 0 0 8 0.7% Nat Sciences & Engr Tech 0 0 64 25 0 89 8.1% Psychology 0 0 25 13 0 38 3.5%
School of Business 0 0 167 181 0 348 31.8% Acct, Econ&Fin, Info Tech 0 0 35 0 0 35 3.2% Business Management 0 0 73 181 0 254 23.2% Sports, Arts & Enter Mgt 0 0 59 0 0 59 5.4%
School of Communication 0 0 79 12 0 91 8.3%
Conservatory of Perf. Arts 0 0 192 12 0 204 18.6% Cinema Arts 0 0 49 12 0 61 5.6% Dance 0 0 74 0 0 74 6.8% Theatre 0 0 69 0 0 69 6.3%
School of Education 79 2 29 80 30 220 20.1%
Community Engagement 0 0 0 0 11 11 1.0%University Total 79 2 631 343 41 1,096 100.0%
71
168
89
3835
254
59
91
6174
69
220
11
0
50
100
150
200
250
Fig. 6.2. Degrees Conferred by Academic Unit, Academic Year 2019-20

Academic Programs and Degrees Conferred
2020-21 Point Park University Factbook * 116
Table 6.3. Degrees and Certificates Awarded by Gender and Race/Ethnicity, Academic Year 2019-20
Am.Indian/ Black or Hispanic NatHawaiian Non-res Two or more Un-Total Female Male Alaska Nat. Asian Afr.Am. of any race /Pacific Isl. Alien White races known
School of Arts & Sciences
Criminal Justice & Intel.StdBachelor of Science 51 34 17 0 1 15 2 0 2 26 5 0Master of Arts 17 4 13 0 0 3 0 0 1 12 0 1Master of Science 3 3 0 0 0 1 0 0 0 2 0 0
Subtotal 71 41 30 0 1 19 2 0 3 40 5 1
Humanities & Social SciBachelor of Arts 15 9 6 0 0 3 1 0 2 8 1 0Bachelor of Science 1 1 0 0 0 0 0 0 0 0 1 0
Subtotal 16 10 6 0 0 3 1 0 2 8 2 0
Literary ArtsBachelor of Arts 8 7 1 0 0 0 0 0 0 8 0 0
Subtotal 8 7 1 0 0 0 0 0 0 8 0 0
Nat Sciences & Engr TechBachelor of Science 64 17 47 0 5 7 2 0 18 29 3 0Master of Science 25 10 15 0 0 0 0 0 15 10 0 0
Subtotal 89 27 62 0 5 7 2 0 33 39 3 0
PsychologyBachelor of Arts 25 21 4 0 0 3 2 0 1 19 0 0Master of Arts 13 11 2 0 0 3 0 0 3 7 0 0
Subtotal 38 32 6 0 0 6 2 0 4 26 0 0
Gender Race/Ethnicity

Academic Programs and Degrees Conferred
2020-21 Point Park University Factbook * 117
Table 6.3. (Continued)
Am.Indian/ Black or Hispanic NatHawaiian Non-res Two or more Un-Total Female Male Alaska Nat. Asian Afr.Am. of any race /Pacific Isl. Alien White races known
School of Business
Acct, Econ&Fin, Info TechBachelor of Science 35 16 19 0 1 4 1 0 0 26 3 0
Subtotal 35 16 19 0 1 4 1 0 0 26 3 0
Business ManagementBachelor of Arts 6 5 1 0 0 5 0 0 0 1 0 0Bachelor of Science 67 33 34 0 0 9 3 1 4 45 5 0Master of Bus Admin 152 68 84 0 4 11 2 0 12 119 3 1Master of Science 29 22 7 0 0 2 1 0 0 25 1 0
Subtotal 254 128 126 0 4 27 6 1 16 190 9 1
Sports, Arts & Enter MgtBachelor of Science 59 37 22 0 0 3 5 0 1 49 1 0
Subtotal 59 37 22 0 0 3 5 0 1 49 1 0
School of Communication
Bachelor of Arts 74 49 25 0 1 6 4 1 0 61 1 0Bachelor of Fine Arts 5 5 0 0 0 1 1 0 0 3 0 0Master of Arts 12 11 1 0 0 1 1 0 0 10 0 0
Subtotal 91 65 26 0 1 8 6 1 0 74 1 0
Gender Race/Ethnicity

Academic Programs and Degrees Conferred
2020-21 Point Park University Factbook * 118
Table 6.3. (Continued)
Am.Indian/ Black or Hispanic NatHawaiian Non-res Two or more Un-Total Female Male Alaska Nat. Asian Afr.Am. of any race /Pacific Isl. Alien White races known
Conservatory of Performing Arts
Cinema ArtsBachelor of Arts 29 14 15 0 0 3 0 0 0 26 0 0Bachelor of Fine Arts 20 13 7 0 0 3 0 0 0 16 1 0Master of Fine Arts 12 6 6 1 0 1 0 0 0 10 0 0
Subtotal 61 33 28 1 0 7 0 0 0 52 1 0
DanceBachelor of Arts 27 24 3 0 0 3 3 0 0 19 2 0Bachelor of Fine Arts 47 42 5 0 5 11 7 0 0 23 1 0
Subtotal 74 66 8 0 5 14 10 0 0 42 3 0
TheatreBachelor of Arts 21 15 6 0 0 2 2 0 0 17 0 0Bachelor of Fine Arts 48 33 15 0 1 5 6 0 1 34 1 0
Subtotal 69 48 21 0 1 7 8 0 1 51 1 0
School of Education
Certificate 79 46 33 1 2 7 2 0 0 65 0 2Associate of Arts 2 2 0 0 0 1 0 0 0 1 0 0Bachelor of Arts 29 21 8 0 0 9 0 0 0 20 0 0Master of Arts 49 38 11 0 0 5 1 0 0 42 1 0Master of Education 31 15 16 1 0 4 0 0 0 26 0 0Doctor of Education 30 16 14 0 0 3 0 0 0 27 0 0
Subtotal 220 138 82 2 2 29 3 0 0 181 1 2
Community EngagementDoctor of Philosophy 11 9 2 0 0 9 0 0 0 1 1 0
Subtotal 11 9 2 0 0 9 0 0 0 1 1 0
University Total 1,096 657 439 3 20 143 46 2 60 787 31 4
Gender Race/Ethnicity
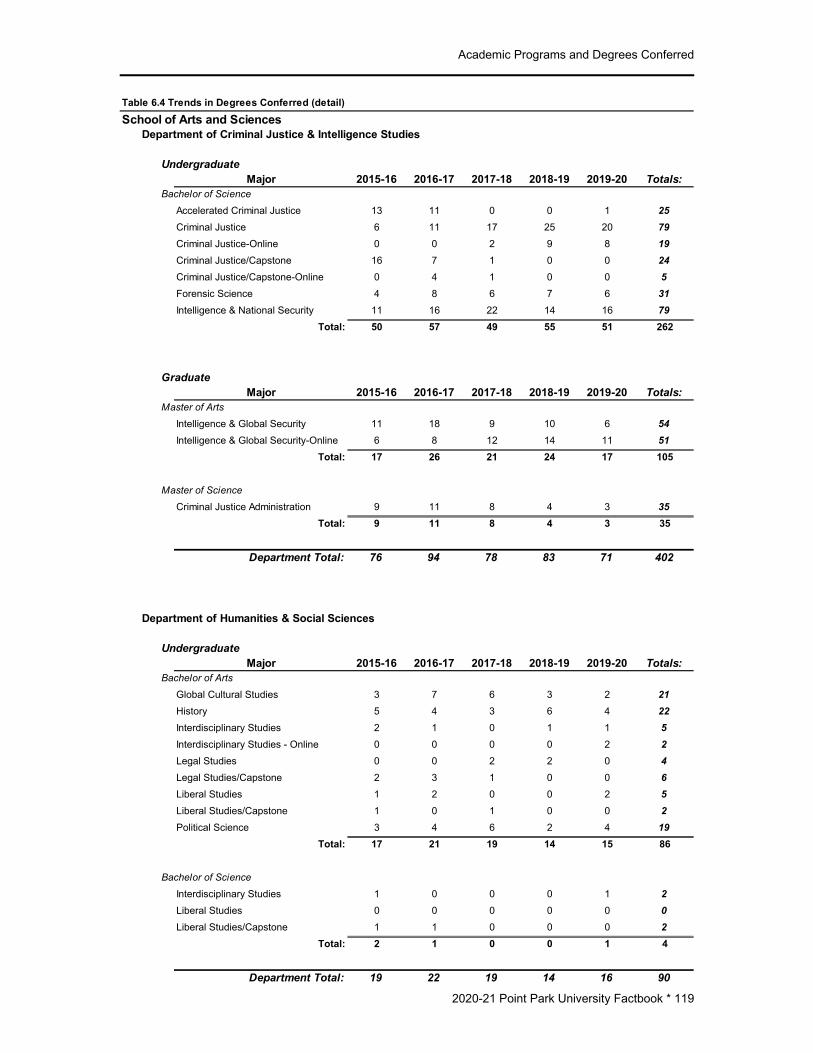
Academic Programs and Degrees Conferred
2020-21 Point Park University Factbook * 119
Table 6.4 Trends in Degrees Conferred (detail)School of Arts and Sciences
Department of Criminal Justice & Intelligence Studies
UndergraduateMajor 2015-16 2016-17 2017-18 2018-19 2019-20 Totals:
Bachelor of Science
Accelerated Criminal Justice 13 11 0 0 1 25Criminal Justice 6 11 17 25 20 79Criminal Justice-Online 0 0 2 9 8 19Criminal Justice/Capstone 16 7 1 0 0 24Criminal Justice/Capstone-Online 0 4 1 0 0 5Forensic Science 4 8 6 7 6 31Intelligence & National Security 11 16 22 14 16 79
Total: 50 57 49 55 51 262
GraduateMajor 2015-16 2016-17 2017-18 2018-19 2019-20 Totals:
Master of Arts
Intelligence & Global Security 11 18 9 10 6 54Intelligence & Global Security-Online 6 8 12 14 11 51
Total: 17 26 21 24 17 105
Master of Science
Criminal Justice Administration 9 11 8 4 3 35Total: 9 11 8 4 3 35
Department Total: 76 94 78 83 71 402
Department of Humanities & Social Sciences
UndergraduateMajor 2015-16 2016-17 2017-18 2018-19 2019-20 Totals:
Bachelor of Arts
Global Cultural Studies 3 7 6 3 2 21History 5 4 3 6 4 22Interdisciplinary Studies 2 1 0 1 1 5Interdisciplinary Studies - Online 0 0 0 0 2 2Legal Studies 0 0 2 2 0 4Legal Studies/Capstone 2 3 1 0 0 6Liberal Studies 1 2 0 0 2 5Liberal Studies/Capstone 1 0 1 0 0 2Political Science 3 4 6 2 4 19
Total: 17 21 19 14 15 86
Bachelor of Science
Interdisciplinary Studies 1 0 0 0 1 2Liberal Studies 0 0 0 0 0 0Liberal Studies/Capstone 1 1 0 0 0 2
Total: 2 1 0 0 1 4
Department Total: 19 22 19 14 16 90

Academic Programs and Degrees Conferred
2020-21 Point Park University Factbook * 120
Table 6.4 (Continued)School of Arts and Sciences
Department of Literary Arts
UndergraduateMajor 2015-16 2016-17 2017-18 2018-19 2019-20 Totals:
Bachelor of Arts
English 3 5 8 11 5 32English/Creative Writing 11 9 13 12 3 48
Total: 14 14 21 23 8 80
Department Total: 14 14 21 23 8 80
Department of Natural Sciences & Engineering Technology
UndergraduateMajor 2015-16 2016-17 2017-18 2018-19 2019-20 Totals:
Associate of Science
Electrical Engineering Tech 2 3 0 0 0 5Mechanical Engineering Tech 0 0 1 0 0 1
Total: 2 3 1 0 0 6
Bachelor of Science
Biological Sciences 7 8 7 8 8 38Biotechnology 1 1 2 0 0 4Biotechnology/Capstone 6 1 1 0 0 8Civil Engineering Technology 6 9 10 13 11 49Electrical Engineering 0 0 0 3 4 7Electrical Engineering Tech 15 16 16 17 5 69Funeral Service 0 1 1 2 1 5Funeral Service/Capstone 10 16 11 10 6 53Health Services 1 1 3 0 1 6Mechanical Engineering 0 0 0 1 10 11Mechanical Engineering Tech 13 12 23 10 16 74Premedical &Preprofessional Studies 2 4 8 4 2 20
Total: 61 69 82 68 64 344
Post-baccalaureateMajor 2015-16 2016-17 2017-18 2018-19 2019-20 Totals:
Bachelor of Science
Civil Engineering Tech 0 1 0 0 0 1Total: 0 1 0 0 0 1
GraduateMajor 2015-16 2016-17 2017-18 2018-19 2019-20 Totals:
Master of Science
Engineering Management 11 11 8 13 17 60Environmental Studies 6 12 4 9 8 39
Total: 17 23 12 22 25 99
Department Total: 80 96 95 90 89 450
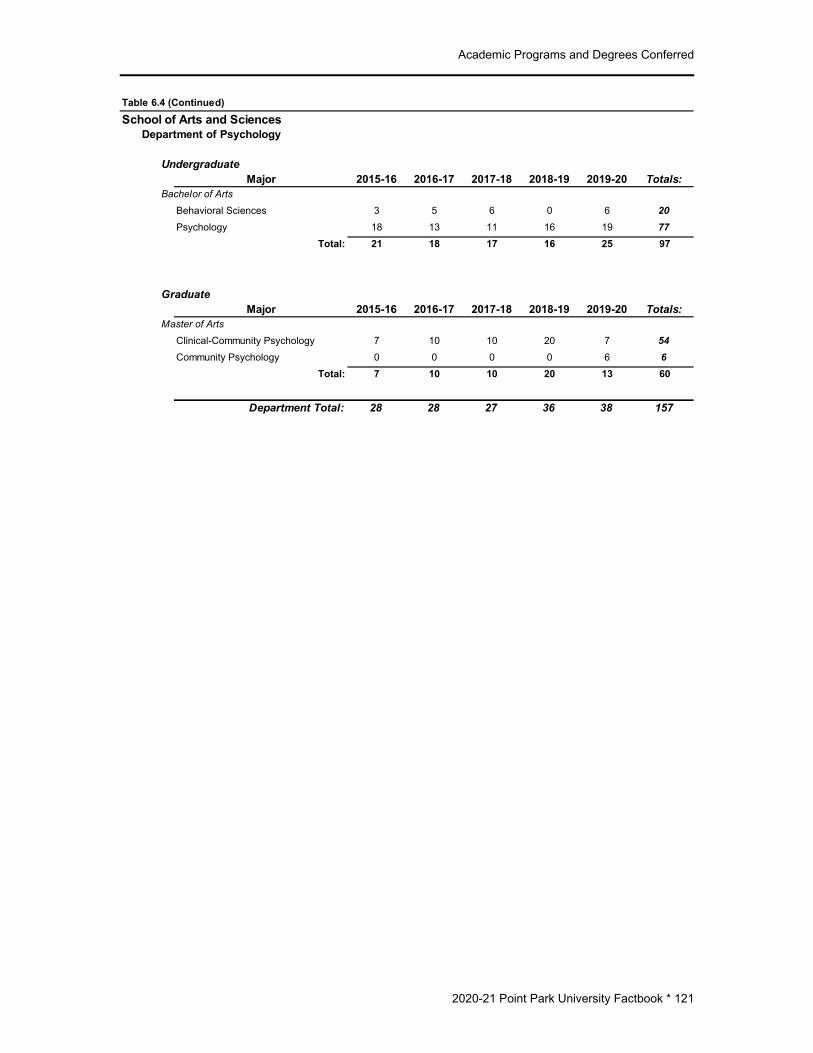
Academic Programs and Degrees Conferred
2020-21 Point Park University Factbook * 121
Table 6.4 (Continued)School of Arts and Sciences
Department of Psychology
UndergraduateMajor 2015-16 2016-17 2017-18 2018-19 2019-20 Totals:
Bachelor of Arts
Behavioral Sciences 3 5 6 0 6 20Psychology 18 13 11 16 19 77
Total: 21 18 17 16 25 97
GraduateMajor 2015-16 2016-17 2017-18 2018-19 2019-20 Totals:
Master of Arts
Clinical-Community Psychology 7 10 10 20 7 54Community Psychology 0 0 0 0 6 6
Total: 7 10 10 20 13 60
Department Total: 28 28 27 36 38 157

Academic Programs and Degrees Conferred
2020-21 Point Park University Factbook * 122
Table 6.4 (Continued)School of Business
Department of Accounting, Economics&Finance, Information Technology
UndergraduateMajor 2015-16 2016-17 2017-18 2018-19 2019-20 Totals:
Bachelor of Science
Accel Information Tech & Mgmt 5 0 0 0 0 5Accounting 21 18 15 9 12 75Accounting-Online 0 0 5 6 8 19Economics and Finance 3 4 5 3 6 21Information Technology 8 4 5 13 6 36Information Technology-Online 0 0 2 2 2 6
Total: 37 26 32 33 34 162
Post-baccalaureateMajor 2015-16 2016-17 2017-18 2018-19 2019-20 Totals:
Bachelor of Science
Accounting 2 2 1 0 1 6Accounting-Online 0 0 7 5 0 12Information Technology 1 0 0 0 0 1
Total: 3 2 8 5 1 19
Department Total: 40 28 40 38 35 181
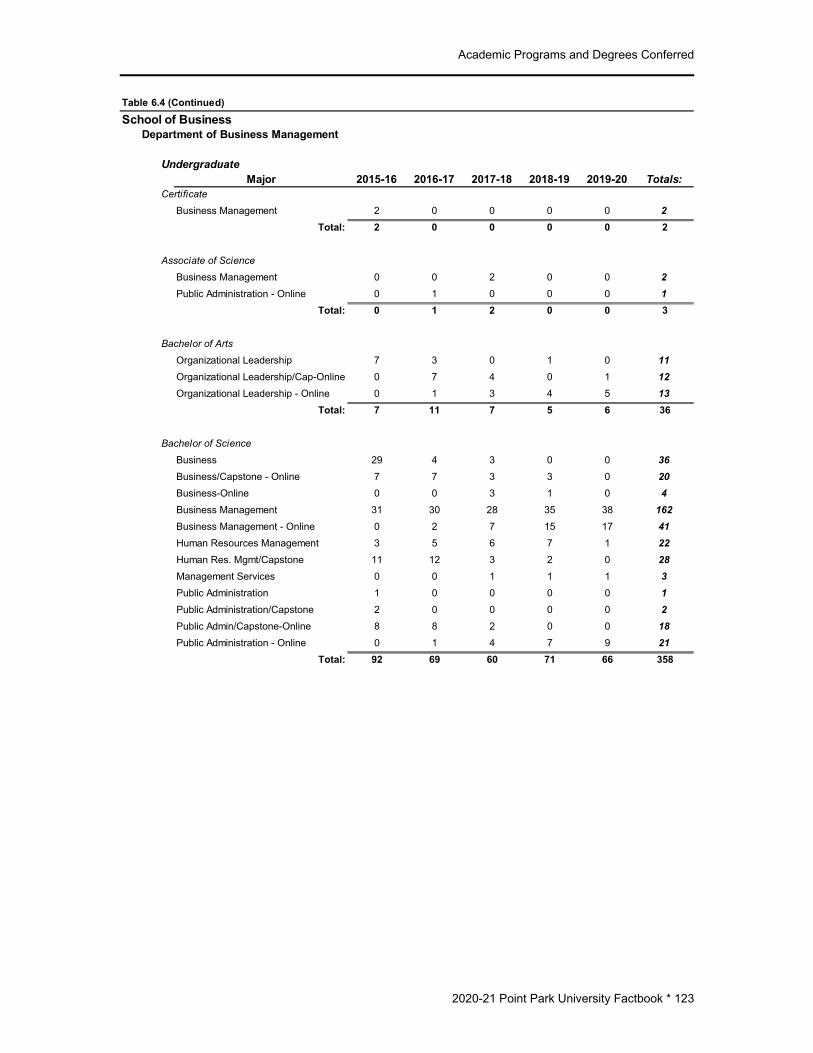
Academic Programs and Degrees Conferred
2020-21 Point Park University Factbook * 123
Table 6.4 (Continued)School of Business
Department of Business Management
UndergraduateMajor 2015-16 2016-17 2017-18 2018-19 2019-20 Totals:
Certificate
Business Management 2 0 0 0 0 2Total: 2 0 0 0 0 2
Associate of Science
Business Management 0 0 2 0 0 2Public Administration - Online 0 1 0 0 0 1
Total: 0 1 2 0 0 3
Bachelor of Arts
Organizational Leadership 7 3 0 1 0 11Organizational Leadership/Cap-Online 0 7 4 0 1 12Organizational Leadership - Online 0 1 3 4 5 13
Total: 7 11 7 5 6 36
Bachelor of Science
Business 29 4 3 0 0 36Business/Capstone - Online 7 7 3 3 0 20Business-Online 0 0 3 1 0 4Business Management 31 30 28 35 38 162Business Management - Online 0 2 7 15 17 41Human Resources Management 3 5 6 7 1 22Human Res. Mgmt/Capstone 11 12 3 2 0 28Management Services 0 0 1 1 1 3Public Administration 1 0 0 0 0 1Public Administration/Capstone 2 0 0 0 0 2Public Admin/Capstone-Online 8 8 2 0 0 18Public Administration - Online 0 1 4 7 9 21
Total: 92 69 60 71 66 358

Academic Programs and Degrees Conferred
2020-21 Point Park University Factbook * 124
Table 6.4 (Continued)School of Business
Department of Business Management (continued)
Post-baccalaureateMajor 2015-16 2016-17 2017-18 2018-19 2019-20 Totals:
Bachelor of Science
Business Management 0 0 0 2 0 2Human Resource Management 0 1 0 1 1 3
Total: 0 1 0 3 1 5
GraduateMajor 2015-16 2016-17 2017-18 2018-19 2019-20 Totals:
Master of Arts
Leadership 0 8 8 4 0 20Organizational Leadership 11 5 1 0 0 17
Total: 11 13 9 4 0 37
MBA
Global Management & Admin 8 9 5 3 0 25Master of Business Admin 117 103 83 49 82 434Master of Business Admin-Online 0 0 44 73 70 187
Total: 125 112 132 125 152 646
Master of Science
Healthcare Admin & Mgmt-Online 0 0 29 30 29 88Total: 0 0 29 30 29 88
Department Total: 237 207 239 238 254 1175
Department of Sports, Arts & Entertainment Management
UndergraduateMajor 2015-16 2016-17 2017-18 2018-19 2019-20 Totals:
Bachelor of Science
Sports, Arts & Entertainment Mgt 60 69 66 73 59 327Total: 60 69 66 73 59 327
Department Total: 60 69 66 73 59 327

Academic Programs and Degrees Conferred
2020-21 Point Park University Factbook * 125
Table 6.4 (Continued)School of Communication
UndergraduateMajor 2015-16 2016-17 2017-18 2018-19 2019-20 Totals:
Bachelor of Arts
Advertising and Public Relations 0 0 1 0 0 1Broadcast Production & Media Mgt 0 3 8 12 10 33Broadcast Production&Programming 3 4 1 0 0 8Broadcasting - On Camera 2 0 0 0 0 2Broadcasting 0 0 0 1 0 1Broadcasting Reporting 10 16 6 7 11 50Journalism 7 9 7 8 8 39Journalism and Mass Comm 1 0 0 1 0 2Mass Communication 0 9 4 7 8 28Mass Communication - Online 0 0 0 1 1 2Multimedia 6 11 16 16 11 60Photojournalism 5 4 7 3 3 22Public Relations & Advertising 13 24 22 25 18 102Public Relations & Adv - Online 0 1 1 1 4 7Public Relations 2 0 0 0 0 2
Total: 49 81 73 82 74 359
Bachelor of Fine Arts
Photography 9 19 7 2 5 42Total: 9 19 7 2 5 42
Bachelor of Science
Integrated Marketing Comm. 5 1 0 0 0 6Total: 5 1 0 0 0 6
Post-baccalaureateMajor 2015-16 2016-17 2017-18 2018-19 2019-20 Totals:
Bachelor of Arts
Journalism & Mass Communication 0 1 0 0 0 1Total: 0 1 0 0 0 1
GraduateMajor 2015-16 2016-17 2017-18 2018-19 2019-20 Totals:
Master of Arts
Communication Technology 7 12 3 5 0 27Communication Technology-Online 0 0 1 6 5 12Journalism and Mass Comm 20 5 0 3 3 31Media Communication 0 3 11 11 4 29
Total: 27 20 15 25 12 99
Department Total: 90 122 95 109 91 507

Academic Programs and Degrees Conferred
2020-21 Point Park University Factbook * 126
Table 6.4 (Continued)Conservatory of Performing Arts
Department of Cinema Arts
UndergraduateMajor 2015-16 2016-17 2017-18 2018-19 2019-20 Totals:
Bachelor of Arts
Animation and Visual Effects 5 6 8 2 4 25Cinema and Digital Arts 1 0 2 0 0 3Cinema and Media Studies 0 0 0 2 4 6Cinema Production 40 45 36 30 17 168Screenwriting 4 9 7 4 1 25Writing for the Screen and Media 0 0 0 0 3 3
Total: 50 60 53 38 29 230
Bachelor of Fine Arts
Animation and Visual Effects 0 0 0 7 5 12Cinema Production 0 0 1 12 9 22Screenwriting 0 0 2 1 6 9
Total: 0 0 3 20 20 43
GraduateMajor 2015-16 2016-17 2017-18 2018-19 2019-20 Totals:
Master of Fine Arts
Writing for the Screen & Stage 14 7 8 15 12 56Total: 14 7 8 15 12 56
Department Total: 64 67 64 73 61 329
Department of Dance
UndergraduateMajor 2015-16 2016-17 2017-18 2018-19 2019-20 Totals:
Bachelor of Arts
Dance 35 23 21 31 27 137Dance Pedagogy 1 1 0 0 0 2
Total: 36 24 21 31 27 139
Bachelor of Fine Arts
Dance 30 33 41 28 47 179Total: 30 33 41 28 47 179
Department Total: 66 57 62 59 74 318
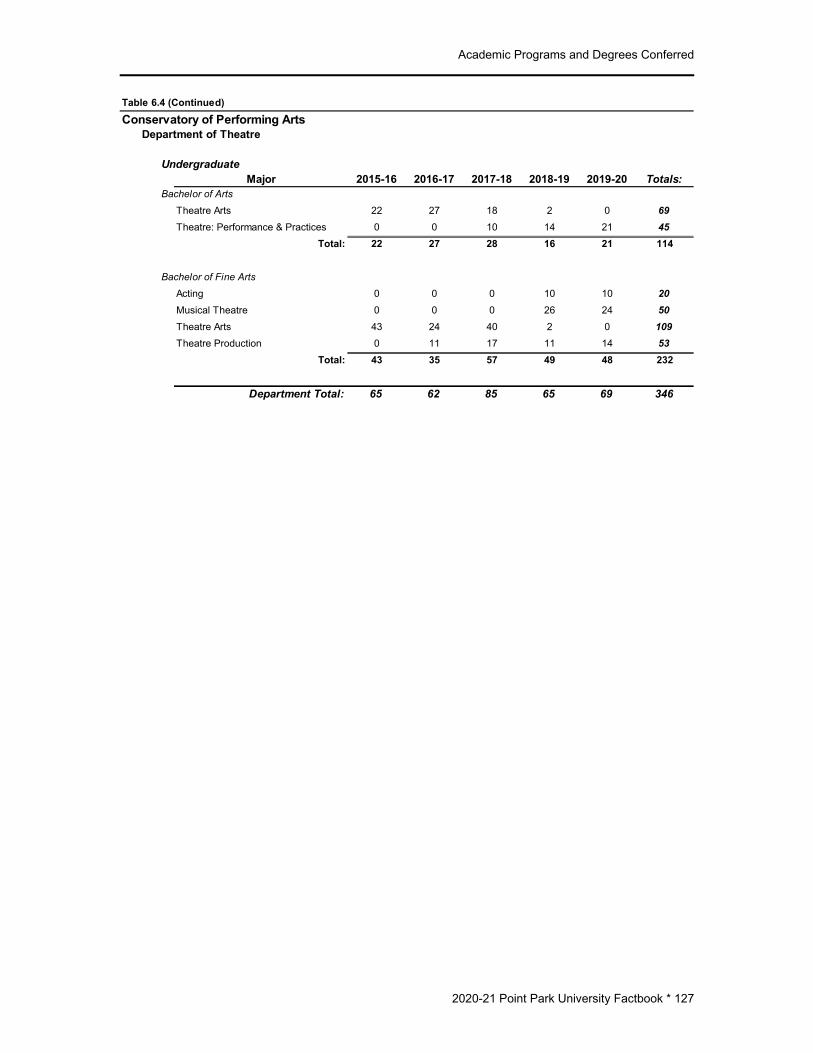
Academic Programs and Degrees Conferred
2020-21 Point Park University Factbook * 127
Table 6.4 (Continued)Conservatory of Performing Arts
Department of Theatre
UndergraduateMajor 2015-16 2016-17 2017-18 2018-19 2019-20 Totals:
Bachelor of Arts
Theatre Arts 22 27 18 2 0 69Theatre: Performance & Practices 0 0 10 14 21 45
Total: 22 27 28 16 21 114
Bachelor of Fine Arts
Acting 0 0 0 10 10 20Musical Theatre 0 0 0 26 24 50Theatre Arts 43 24 40 2 0 109Theatre Production 0 11 17 11 14 53
Total: 43 35 57 49 48 232
Department Total: 65 62 85 65 69 346
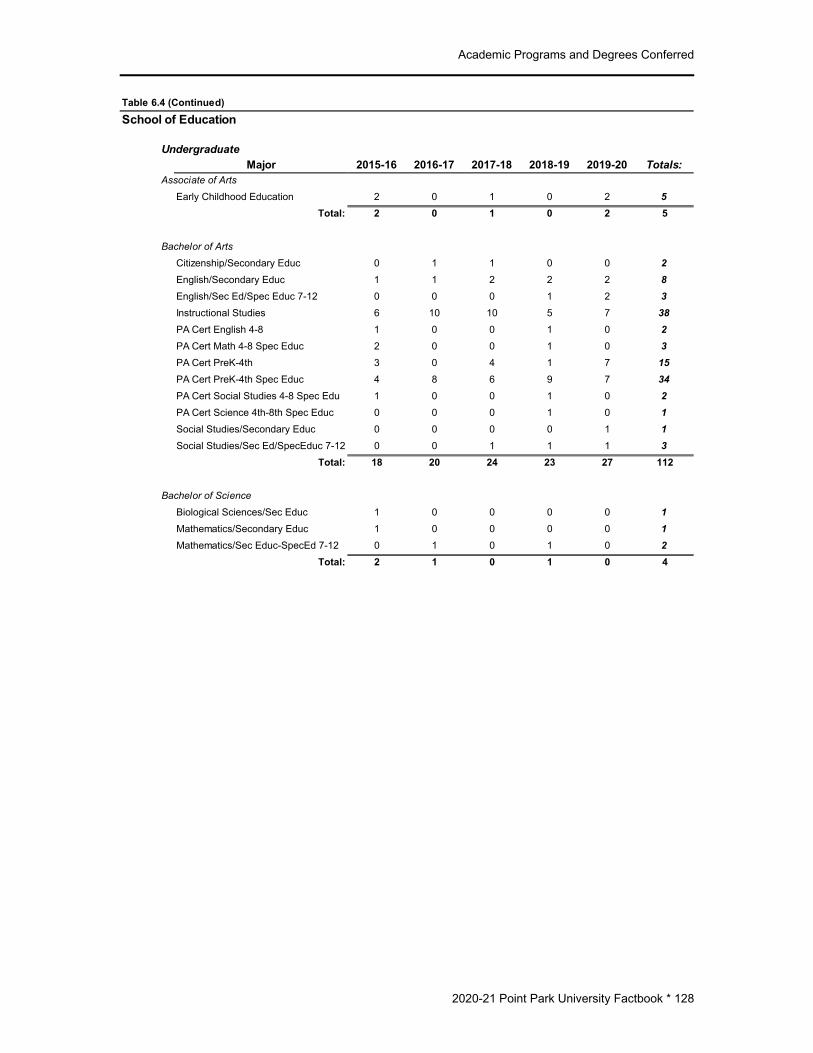
Academic Programs and Degrees Conferred
2020-21 Point Park University Factbook * 128
Table 6.4 (Continued)School of Education
UndergraduateMajor 2015-16 2016-17 2017-18 2018-19 2019-20 Totals:
Associate of Arts
Early Childhood Education 2 0 1 0 2 5Total: 2 0 1 0 2 5
Bachelor of Arts
Citizenship/Secondary Educ 0 1 1 0 0 2English/Secondary Educ 1 1 2 2 2 8English/Sec Ed/Spec Educ 7-12 0 0 0 1 2 3Instructional Studies 6 10 10 5 7 38PA Cert English 4-8 1 0 0 1 0 2PA Cert Math 4-8 Spec Educ 2 0 0 1 0 3PA Cert PreK-4th 3 0 4 1 7 15PA Cert PreK-4th Spec Educ 4 8 6 9 7 34PA Cert Social Studies 4-8 Spec Edu 1 0 0 1 0 2PA Cert Science 4th-8th Spec Educ 0 0 0 1 0 1Social Studies/Secondary Educ 0 0 0 0 1 1Social Studies/Sec Ed/SpecEduc 7-12 0 0 1 1 1 3
Total: 18 20 24 23 27 112
Bachelor of Science
Biological Sciences/Sec Educ 1 0 0 0 0 1Mathematics/Secondary Educ 1 0 0 0 0 1Mathematics/Sec Educ-SpecEd 7-12 0 1 0 1 0 2
Total: 2 1 0 1 0 4

Academic Programs and Degrees Conferred
2020-21 Point Park University Factbook * 129
Table 6.4 (Continued)School of Education
Post-baccalaureateMajor 2015-16 2016-17 2017-18 2018-19 2019-20 Totals:
Certificate
Adult Educ & Administration-Online 1 0 0 0 0 1School Principal K-12 2 2 2 0 0 6School Principal K-12 - Online 0 36 72 54 66 228Superintendent Letter Eligibil. -Online 0 0 0 0 13 13
Total: 3 38 74 54 79 248
Bachelor of Arts
PA Cert PreK-4th 3 3 0 2 1 9Social Studies/Secondary Educ 0 0 1 0 1 2
Total: 3 3 1 2 2 11
Bachelor of Science
Biological Sciences/Sec Educ 1 0 0 0 0 1Total: 1 0 0 0 0 1
GraduateMajor 2015-16 2016-17 2017-18 2018-19 2019-20 Totals:
Master of Arts
Adult Learning & Training-Online 0 0 6 10 9 25Curriculum and Instruction 2 5 5 1 0 13Curriculum and Instruction - Online 0 3 19 19 23 64Educational Administration 3 2 3 2 0 10Educational Administration-Online 0 0 14 14 17 45
Total: 5 10 47 46 49 157
Master of Education
Athletic Coaching - Online 0 0 0 5 18 23Masters Secon Ed Cert 7th-12th 3 7 4 10 3 27Masters Spec Ed Cert PreK-8 0 2 0 0 0 2Masters Spec Ed Cert PreK-8-Online 0 1 16 10 8 35Masters Spec Ed Cert 7-12 0 1 0 0 0 1Masters Spec Ed Cert 7-12-Online 0 0 3 6 2 11Teaching and Leadership 3 2 0 0 0 5
Total: 6 13 23 31 31 104
Doctor of Education
Leadership and Administration 0 15 14 32 30 91Total: 0 15 14 32 30 91
Department Total: 40 100 184 189 220 733

Academic Programs and Degrees Conferred
2020-21 Point Park University Factbook * 130
Table 6.4 (Continued)Community Engagement
GraduateMajor 2015-16 2016-17 2017-18 2018-19 2019-20 Totals:
Doctor of Philosophy
Community Engagement 0 0 0 4 11 15Total: 0 0 0 4 11 15
Department Total: 0 0 0 4 11 15

Academic Programs and Degrees Conferred
2020-21 Point Park University Factbook * 131
Table 6.5. Degrees Offered, Academic Year 2020-21DegreesCertificates:
School of Arts & SciencesCriminal Justice and Intelligence Studies
Intelligence and National Security, CertificateSchool of Business
Business ManagementPublic Administration, Certificate
School of CommunicationSocial Media, Certificate
School of EducationPrograms Leading to Pennsylvania Certification: Reading Specialist, Certificate School Principal K-12, Certificate Superintendent Letter of Eligibility, Certificate
Associate Degrees:School of Education
Early Childhood Education, A.A.
Bachelor Degrees:School of Arts & Sciences
Criminal Justice and Intelligence StudiesCriminal Justice, B.S.Forensic Science, B.S.Intelligence and National Security, B.S.
Humanities and Social SciencesGlobal Cultural Studies, B.A.History, B.A.Interdisciplinary Studies, B.A., B.S.Legal Studies, B.A.Liberal Studies, B.A., B.S.Political Science, B.A.
Literary Arts and Social JusticeEnglish, B.A.Creative Writing, B.A.Social Justice Studies, B.A.
Natural Sciences and Engineering TechnologyBiological Sciences, B.S.Civil Engineering Technology, B.S.Electrical Engineering, B.S.Electrical Engineering Technology, B.S.Specialized Professional Studies - Funeral Service, B.S.Specialized Professional Studies - Funeral Service (Capstone), B.S.Mechanical Engineering, B.S.Mechanical Engineering Technology, B.S.
PsychologyBehavioral Sciences, B.A.Psychology, B.A.

Academic Programs and Degrees Conferred
2020-21 Point Park University Factbook * 132
Table 6.5. (Continued)DegreesBachelor Degrees: (con't)
School of BusinessAccounting, Economics & Finance, Information Technology
Accounting, B.S.Applied Computer Science, B.S.Economics and Finance, B.S.
Business ManagementBusiness Administration, B.S.Business Management, B.S.Human Resource Management, B.S.Marketing and Sales, B.S.Organizational Leadership, B.A.Public Administration, B.S.
Sports, Arts and Entertainment ManagementSports, Arts and Entertainment Management, B.S.
School of CommunicationBroadcast Production and Media Management, B.A.Graphic and Interactive Design, B.F.A.Journalism, B.A.Multimedia, B.A.Photography, B.F.A.Public Relations and Advertising, B.A.Social Media Management, B.A.
Conservatory of Performing ArtsCinema Arts
Animation, B.F.A.Cinema Arts, B.A.Cinema Production, B.F.A.Screenwriting, B.F.A.
DanceDance, B.A., B.F.A.
Theatre Acting, B.F.A.Musical Theatre, B.F.A.Theatre Arts, B.F.A.Theatre Production, B.F.A.

Academic Programs and Degrees Conferred
2020-21 Point Park University Factbook * 133
Table 6.5. (Continued)DegreesBachelor Degrees: (con't)
School of EducationInstructional Studies, B.A. Programs Leading to Pennsylvania Certification: Pre-Kindergarten - 4th Grade, B.A. Pre-Kindergarten - 4th Grade and Special Education (PreK-8), B.A. 4th Grade - 8th Grade (English), B.A. 4th Grade - 8th Grade (English) and Special Education (PreK-8), B.A. 4th Grade - 8th Grade (Math), B.A. 4th Grade - 8th Grade (Math) and Special Education (PreK-8), B.A. 4th Grade - 8th Grade (Science), B.A. 4th Grade - 8th Grade (Science) and Special Education (PreK-8), B.A. 4th Grade - 8th Grade (Social Studies), B.A. 4th Grade - 8th Grade (Social Studies) and Special Education (PreK-8), B.A. Secondary Education - Biology, B.S. Secondary Education - Biology and Special Education (Grades 7-12), B.S. Secondary Education - Citizenship, B.A. Secondary Education - Citizenship and Special Education (Grades 7-12), B.A. Secondary Education - English, B.A. Secondary Education - English and Special Education (Grades 7-12), B.A. Secondary Education - Mathematics, B.S. Secondary Education - Mathematics and Special Education (Grades 7-12), B.S. Secondary Education - Social Studies, B.A. Secondary Education - Social Studies and Special Education (Grades 7-12), B.A.

Academic Programs and Degrees Conferred
2020-21 Point Park University Factbook * 134
Table 6.5. (Continued)DegreesMasters Degrees:
School of Arts & SciencesCriminal Justice and Intelligence Studies
Criminal Justice Administration, M.S.Intelligence and Global Security, M.A.
Natural Sciences and Engineering TechnologyEngineering Management, M.S.Environmental Studies, M.S.
PsychologyCommunity Psychology, M.A.
School of BusinessBusiness Management
Healthcare Administration and Management, M.S.Information Systems and Business Analytics, M.S.Master of Business Administration, M.B.A.Organizational Leadership, M.A.
School of CommunicationCommunication Technology, M.A.Environmental Journalism, M.A.Media Communication, M.A.Public Relations and Advertising, M.A.
Conservatory of Performing ArtsCinema Arts
Writing for the Screen and Stage, M.F.A.
School of EducationAdult Learning and Training, M.A.Athletic Coaching & Administration, M.Ed. Programs Leading to Pennsylvania Certification: Curriculum and Instruction, M.A. Educational Administration, M.A. Education with Certification PreK-4, M.Ed. Secondary Education Certification Grades 7-12, M.Ed. Special Education Certification PreK-12, M.A. Special Education Certification PreK-12, M.Ed.
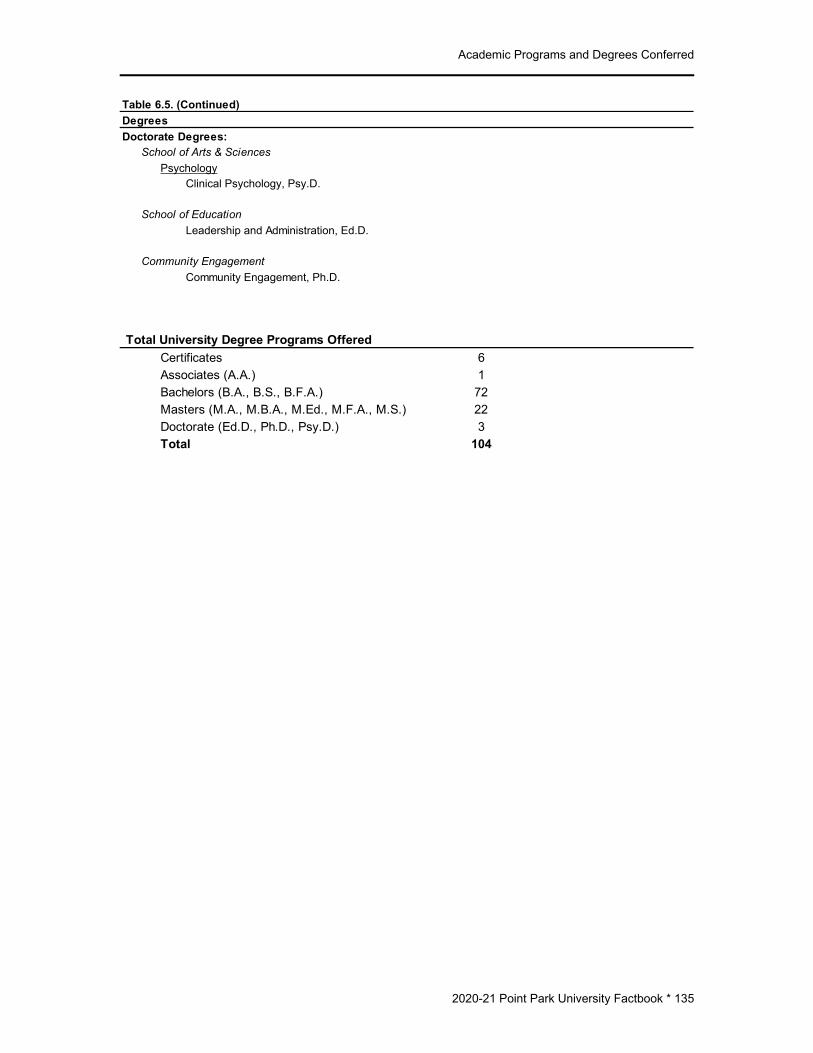
Academic Programs and Degrees Conferred
2020-21 Point Park University Factbook * 135
Table 6.5. (Continued)DegreesDoctorate Degrees:
School of Arts & SciencesPsychology
Clinical Psychology, Psy.D.
School of EducationLeadership and Administration, Ed.D.
Community EngagementCommunity Engagement, Ph.D.
Total University Degree Programs OfferedCertificates 6Associates (A.A.) 1Bachelors (B.A., B.S., B.F.A.) 72Masters (M.A., M.B.A., M.Ed., M.F.A., M.S.) 22Doctorate (Ed.D., Ph.D., Psy.D.) 3Total 104

Faculty and Staff

Faculty & Staff
2020-21 Point Park University Factbook * 136
FACULTY AND STAFF This chapter of the factbook pertains to full-time faculty and staff only. Part-time/adjunct faculty and staff are very transient populations, thus making it difficult to track and include in this chapter. Overall, in fall 2020, there were 144 full-time faculty and 263 full-time staff. The total (407) represents an increase of +3 full-time staff while full-time faculty decreased by -10 over the prior year. When compared to four years ago, Point Park has decreased the number of full-time faculty and staff by -6% (table 7.1) Just over half (51%) of the full-time faculty are male while only 46% of the full-time staff are male, (table 7.2). Only 10% of both full-time faculty and staff are considered being part of a racial/ethnic minority (table 7.3). This is a slight increase from 2019 where 9% of full-time faculty and staff were considered being part of a racial/ethnic minority. To see a more detailed breakdown of full-time faculty by academic department and gender/race, refer to table 7.4. As shown in table 7.5, the median faculty salary from 2019 to 2020 decreased slightly for ‘professor’ (-0.44%), while ‘associate professor’, ‘assistant professor’ and ‘lecturer/teaching artist’ show increases of (+4.25%, +4.04%, and +3.50% respectively). The number of faculty increased for ‘professor’ (from 59 to 60) and ‘associate professor’ (from 35 to 37), and decreased for ‘assistant professor’ (from 35 to 28) and ‘lecturer/teaching artist’ (from 18 to 16). Note that visiting faculty and professionals in residence salaries are not included within the median salary section. According to table 7.6, 65% of the full-time faculty are tenured in fall 2020 while another 22% are on tenure-track. The academic departments of Literary Arts, Communication, Business, Community Engagement, and Education have the highest percentage of full-time faculty who are tenured (90%, 79%, 69%, 67% and 64%, respectively). Table 7.7 shows that the mean years of service for ‘professor’ is at 21.65 while the other ranks have substantially lower number of mean years of service.

Faculty & Staff
2020-21 Point Park University Factbook * 137
Table 7.1. Summary of Full-time Faculty and Staff
Fall 2016 Fall 2019 Fall 2020% change from
'19 to '20% change from
'16 to '20
Full-time Faculty 147 154 144 -6% -2%Full-time Staff 287 260 263 1% -8%
Total 434 414 407 -2% -6%
147 154 144
287
260 263
0
50
100
150
200
250
300
350
Fall 2016 Fall 2019 Fall 2020
Fig. 7.1. Full-time Faculty and Staff
Full-time Faculty
Full-time Staff

Faculty & Staff
2020-21 Point Park University Factbook * 138
Table 7.2. Gender Distribution of Full-time University Personnel, Fall 2020
Total Female N Female % Male N Male %Full-time Faculty 144 71 49.3% 73 50.7%
Full-time Staff 263 142 54.0% 121 46.0%Business & Finance 35 31 88.6% 4 11.4%Comm. Service, Legal, Arts & Media 45 21 46.7% 24 53.3%Computer 12 1 8.3% 11 91.7%Health Professions 1 1 100.0% 0 0.0%Management 49 19 38.8% 30 61.2%Natl Resources, Construction/Maint 11 0 0.0% 11 100.0%Office & Administrative 32 31 96.9% 1 3.1%Other Educational, Training/Library 56 34 60.7% 22 39.3%Production & Transportation 9 0 0.0% 9 100.0%Service Occupation 13 4 30.8% 9 69.2%
Faculty/Staff Total 407 213 52.3% 194 47.7%
49.3%
54.0%
50.7%
46.0%
0.0%
10.0%
20.0%
30.0%
40.0%
50.0%
60.0%
Full-time Faculty Full-time Staff
Fig. 7.2. Full-time University Personnel by Gender, Fall 2020
Female %
Male %

Faculty & Staff
2020-21 Point Park University Factbook * 139
Table 7.3. Race/Ethnicity Distribution of Full-time University Personnel, Fall 2020
N % N % N % N % N % TotalFull-time Faculty 5 3.5% 5 3.5% 5 3.5% 125 86.8% 4 2.8% 144
Full-time Staff 1 0.4% 15 5.7% 1 0.4% 243 92.4% 3 1.1% 263Business & Finance 0 na 1 2.9% 0 na 34 97.1% 0 na 35Comm. Service, Legal, Arts & Media 0 na 5 11.1% 0 na 40 88.9% 0 na 45Computer 1 8.3% 1 8.3% 0 na 9 75.0% 1 8.3% 12Health Professions 0 na 0 na 0 na 1 100.0% 0 na 1Management 0 na 1 2.0% 0 na 47 95.9% 1 2.0% 49Natl Resources, Construction/Maint 0 na 0 na 0 na 11 100.0% 0 na 11Office & Administrative 0 na 1 3.1% 1 3.1% 29 90.6% 1 3.1% 32Other Educational, Training/Library 0 na 4 7.1% 0 na 52 92.9% 0 na 56Production & Transportation 0 na 0 na 0 na 9 100.0% 0 na 9Service Occupation 0 na 2 15.4% 0 na 11 84.6% 0 na 13
Faculty/Staff Total 6 1.5% 20 4.9% 6 1.5% 368 90.4% 7 1.7% 407
AsianBlack or
African-Am WhiteHispanicTwo or more
races
3.5% 3.5% 3.5%
86.8%
2.8%0.4%
5.7%0.4%
92.4%
1.1%0.0%
10.0%
20.0%
30.0%
40.0%
50.0%
60.0%
70.0%
80.0%
90.0%
100.0%
Asian Black or AfricanAmerican
Hispanic White Two or moreraces
Fig. 7.3. Full-time University Personnel by Race/Ethnicity, Fall 2020
Full-time Faculty
Full-time Staff

Faculty & Staff
2020-21 Point Park University Factbook * 140
Table 7.4. Full-time Faculty by School/Department, Gender and Race/Ethnicity, Fall 2020
Male Female Asian
African-
Am Hispanic White
more races
Crim Justice&Intel Std 6 1 0 0 0 7 0Humanities&Social Sci 2 3 0 0 0 5 0Literary Arts 3 7 0 0 0 10 0Natl Sci & Engr Tech 13 4 2 1 0 13 1Psychology 5 4 0 0 1 7 1Business 14 15 1 1 2 24 1Communication 8 6 0 0 0 14 0Conservatory 19 17 1 2 1 31 1Education 3 11 0 1 1 12 0Comm. Engagement 0 3 1 0 0 2 0
Total 73 71 5 5 5 125 4
Gender Race/Ethnicity
Table 7.5. Full-time Faculty Salary by Rank
FT Faculty Salary by Rank
2018-19 Median Sal
($)# FT
Faculty
2019-20 Median Sal
($)# FT
Faculty
2020-21 Median Sal
($)# FT
Faculty
% salary chg '19 to
'20
Professor $90,890 54 $87,847 59 $87,460 60 -0.44%Associate Professor $66,560 40 $69,389 35 $72,338 37 4.25%Assistant Professor $60,412 36 $61,103 35 $63,574 28 4.04%Lecturer/Teaching Artist* $41,600 16 $43,056 18 $44,563 16 3.50%
*does not include Visiting, Professionals in Residence
$20,000
$30,000
$40,000
$50,000
$60,000
$70,000
$80,000
$90,000
$100,000
2018-19 Median Sal($)
2019-20 Median Sal($)
2020-21 Median Sal($)
Fig. 7.4. Full-time Faculty Salary by Rank
Professor
Associate Professor
Assistant Professor
Lecturer/Teaching Artist*
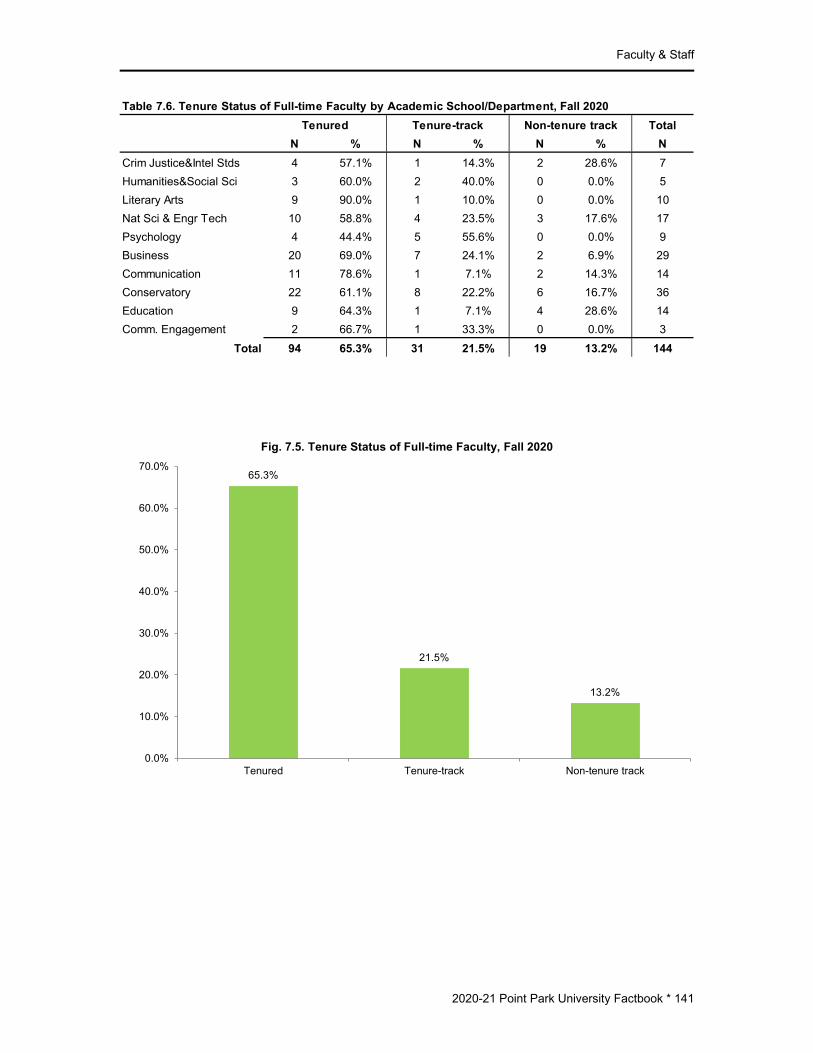
Faculty & Staff
2020-21 Point Park University Factbook * 141
Table 7.6. Tenure Status of Full-time Faculty by Academic School/Department, Fall 2020Total
N % N % N % NCrim Justice&Intel Stds 4 57.1% 1 14.3% 2 28.6% 7Humanities&Social Sci 3 60.0% 2 40.0% 0 0.0% 5Literary Arts 9 90.0% 1 10.0% 0 0.0% 10Nat Sci & Engr Tech 10 58.8% 4 23.5% 3 17.6% 17Psychology 4 44.4% 5 55.6% 0 0.0% 9Business 20 69.0% 7 24.1% 2 6.9% 29Communication 11 78.6% 1 7.1% 2 14.3% 14Conservatory 22 61.1% 8 22.2% 6 16.7% 36Education 9 64.3% 1 7.1% 4 28.6% 14Comm. Engagement 2 66.7% 1 33.3% 0 0.0% 3
Total 94 65.3% 31 21.5% 19 13.2% 144
Tenured Tenure-track Non-tenure track
65.3%
21.5%
13.2%
0.0%
10.0%
20.0%
30.0%
40.0%
50.0%
60.0%
70.0%
Tenured Tenure-track Non-tenure track
Fig. 7.5. Tenure Status of Full-time Faculty, Fall 2020

Faculty & Staff
2020-21 Point Park University Factbook * 142
Table 7.7. Full-time Faculty by Rank and Years of Full-time Service, Fall 2020
Under 1 year 1 to 5 years 6 to 10 years11 to 20 years
21 to 30 years
More than 30 years
Mean Years of Service
Professor 0 0 1 36 12 11 21.65Associate 0 8 26 2 0 1 8.23Assistant 3 23 1 1 0 0 2.98Lecturer* 0 10 2 3 0 1 8.26
Total 3 41 30 42 12 13 12.90*does not include Visiting, Professionals in Residence
21.65
8.23
2.98
8.26
0
5
10
15
20
25
Professor Associate Assistant Lecturer*
Fig. 7.6. Mean Years of Service by Full-time Faculty Rank, Fall 2020

Endowment

Endowment
2020-21 Point Park University Factbook * 143
ENDOWMENT Table 8.1 illustrates how the University’s collective endowment has increased over the years. The total endowment consists of two collective fund groups. It includes both donor-restricted endowment funds (the “Endowment Fund”) which are classified as either temporarily or permanently restricted funds, and non-donor unrestricted funds that have been established by the Board of Trustees to function as reserve-type funds (the “Board Designated Fund”).
Table 8.1. Endowment Values over Five years
8/31/2016 8/31/2017 8/31/2018 8/31/2019 8/31/2020
Endowment $11,896,587 $17,888,231 $19,932,279 $19,944,336 $21,369,554Board Desig. Endowment $22,318,592 $24,603,052 $27,272,659 $26,997,869 $28,589,239
Total Endowment $34,215,179 $42,491,283 $47,204,938 $46,942,205 $49,958,793
$34,215,179
$42,491,283
$47,204,938 $46,942,205 $49,958,793
0.00
10,000,000.00
20,000,000.00
30,000,000.00
40,000,000.00
50,000,000.00
60,000,000.00
2016 2017 2018 2019 2020
Fig. 8.1. Total Endowment Over Five Years


