Factors Affecting Customer Satisfaction in Textile Industry: A Study of Vardhman Group Nonis Jhamb Student, MBA, CBSA Abstract Customer Satisfaction is a term frequently used in marketing. It is a measure of how products and services supplied by a company meet or surpass customer expectation. Here the research has been undertaken in Vardhman Textiles Ltd. for studying customer satisfaction in textile products. An Analysis of the various factors which affect satisfaction level of customers has been done and a relationship between these factors has been found to find scope for further improvement. Primary data has been collected through a structured questionnaire of 80 customers of Vardhman Textiles Ltd. The report is based on exploratory and descriptive design both. In exploratory research, the factors that affect customer satisfaction have been found. The sampling technique used is Simple Lottery Random Sampling in which 80 customers have been randomly selected from all the customers. Descriptive statistics has been used and which include the application of the statistical tools namely: Correlation, Regression, ANOVA, and T-test. Key Words : Customer Satisfaction, Customer Loyalty, Repeat Sales, Cost of Acquiring new Customers. Introduction Customer satisfaction is defined as "the number of customers, or percentage of total customers, whose reported experience with a firm, its products, or its services (ratings) exceeds specified satisfaction goals.” It is seen as a key performance indicator within business and is often part of a Balanced Scorecard. In a competitive marketplace where businesses compete for customers, customer satisfaction is seen as a key differentiator and increasingly has become a key element of business strategy. "Within organizations, customer satisfaction ratings can have powerful effects. They focus employees on the importance of fulfilling customers' expectations. Furthermore, when these ratings dip, they warn of problems that can affect sales and profitability .... These metrics quantify an important dynamic. When a brand has loyal customers, it gains positive word-of-mouth marketing, which is both free and highly effective." Therefore, it is essential for businesses to effectively manage customer satisfaction. To be able do this, firms need reliable and representative measures of satisfaction. Review of Literature 1. Yoganandan.G(2013) The article aimed at reviewing researches conducted on the factors influencing the export performance of Textile industry. The review highlights the positive relationship between GDP, exchange rate,labor, capital (FDI) and technology with export Biz and Bytes (Vol. 8. Issue: 1, 2017)E-ISSN: 0976 0458, Print ISSN: 2320 897X 158 Dr. Satinder Pal Singh Dean Research, CBSA Bhawna Aggarwal Student, MBA, CBSA
Transcript
Factors Affecting Customer Satisfaction in Textile Industry: A Study of Vardhman Group
Nonis Jhamb Student, MBA, CBSA
AbstractCustomer Satisfaction is a term frequently used in marketing. It is a measure of how products and services supplied by a company meet or surpass customer expectation. Here the research has been undertaken in Vardhman Textiles Ltd. for studying customer satisfaction in textile products. An Analysis of the various factors which affect satisfaction level of customers has been done and a relationship between these factors has been found to find scope for further improvement. Primary data has been collected through a structured questionnaire of 80 customers of Vardhman Textiles Ltd. The report is based on exploratory and descriptive design both. In exploratory research, the factors that affect customer satisfaction have been found. The sampling technique used is Simple Lottery Random Sampling in which 80 customers have been randomly selected from all the customers. Descriptive statistics has been used and which include the application of the statistical tools namely: Correlation, Regression, ANOVA, and T-test. Key Words : Customer Satisfaction, Customer Loyalty, Repeat Sales, Cost of Acquiring new Customers.IntroductionCustomer satisfaction is defined as "the number of customers, or percentage of total customers, whose reported experience with a firm, its products, or its services (ratings) exceeds specified satisfaction goals.” It is seen as a key performance indicator within business and is often part of a Balanced Scorecard. In a competitive marketplace where businesses compete for customers, customer satisfaction is seen as a key differentiator and increasingly has become a key element of business strategy."Within organizations, customer satisfaction ratings can have powerful effects. They focus employees on the importance of fulfilling customers' expectations. Furthermore, when these ratings dip, they warn of problems that can affect sales and profitability.... These metrics quantify an important dynamic. When a brand has loyal customers, it gains positive word-of-mouth marketing, which is both free and highly effective."Therefore, it is essential for businesses to effectively manage customer satisfaction. To be able do this, firms need reliable and representative measures of satisfaction.
Review of Literature1. Yoganandan.G(2013) The article aimed at reviewing researches conducted on the factors
influencing the export performance of Textile industry. The review highlights the positive relationship between GDP, exchange rate,labor, capital (FDI) and technology with export
Biz and Bytes (Vol. 8. Issue: 1, 2017)� E-ISSN: 0976 0458, Print ISSN: 2320 897X
158
Dr. Satinder Pal SinghDean Research, CBSA
Bhawna AggarwalStudent, MBA, CBSA
Biz and Bytes (Vol. 8. Issue: 1, 2017)� E-ISSN: 0976 0458, Print ISSN: 2320 897X
159
performance of textile industry. Based on the review, it was suggested that future researches can be done by analyzing impact of these factors on less export oriented industries so that possibly such results maybe compared and new theories could be established.
2. Ikilem Gocek(2012) The independent variables, PSQ, PPQ, BI and PV were found to have influence on CS in the textile industry. For reaching customers and identifying marketing and sales strategies, it is useful for the textile companies to find out if the independent variables that influence CS show differences according to consumer age, gender, education, TMPI and ES.
3. Md. Alauddin(2013) As entire statistics already illustrated that the Bangladesh Labour Cost is astonishingly very low, customers get attracted to the Bangladesh Manufacturers Bangladesh’s Product (Garments) Quality is up to the mark which is by now proven by the several standards like ISO, WRAP etc. This paper stated the need for more emphasis on appointing expert employee and arrange workshop or on training is needed to make the employee more fitting to handle customer requirements and expectation.
4. Noopur Tandon(2013) Textiles industry and its Labor relations are undergoing profound changes which will initiate the need for the management, workers and all stakeholders to be ready for the competition for sustainability.
5. Jeanne Rossomme This paper demonstrates that significant gaps exist in both the academic and trade literature with regard to effective customer satisfaction measurement of business-to-business exchanges. The model presented here, rooted in existing knowledge oforganizational behavior and customer satisfaction processes, provides a practical framework for managers in evaluating the strength of their customer relationships.
6. Ivan GROS(2011) Presented sample of specific B2B corrugated cardboard market segmentation shows the implementation of modern methods of cluster analysis in formulating appropriate marketing and logistics strategies. Knowledge of the segment is essential for implementation of such methods. These methods are nevertheless only scarcely used in praxis on B2B markets in Czech Republic. The second objective of the study was to confirm or refuse the established hypotheses (incl. Price, relationship with supply chain etc.) concerning the behavior of B2B market segments.
7. Ikilem Gocek(2007) In this study the affecting independent variables of customer satisfaction were chosen brand image, perceived service quality and perceived product quality. By these independent variables, it is investigated that if any differences exist in perception of customer satisfaction according to the Turkish textile consumers in the view of gender. In data analysis of this research the SPSS program is used.
8. Devkumar S Callychurn(2014) Unarguably, in spite of a fierce competitive international environment, Company X has been able to position itself as one of the key players in the Mauritian apparel industry. In addition to the quantitative indicators, other success factors of company X include: Technology, branded products, labour force.
9. Hsiu-Yuan Hu(2010) The findings suggest new insights for researchers who investigate the quality of medical service, and also for hospital managers who devote resources exclusively in an attempt to achieve the highest possible levels of patient satisfaction.
10. Jiana Daikh(2015) The purpose of this research is to study the relationship between customer satisfaction and consumer loyalty and apply its relationship into all the market industries including products and services, particularly in financial institutions. The discussion of the study indicated that there is a significant positive relationship between customer loyalty and customer satisfaction, however, it is important to fully understand that the loyalty which is the main goal of each industry is very hard to achieve and is not very easy to be reached by industries due to the customer satisfaction which is very hard to reach by itself, and the service quality as well.
Research MethodologyIn this study primary data and secondary data has been collected. Primary data has been collected through a structured questionnaire of 80 customers of Vardhman Textiles ltd. The report is based on exploratory and descriptive design both. In exploratory research, factors that can affect customer satisfaction have been analysed. The sampling technique is simple random sampling in which 80 customers have been randomly selected from all the customers. Descriptive statistics has been used and it includes the application of the statistical tools namely, correlation, regression, ANOVA, and T-test.Research Objectives1. To study the factors of customer satisfaction in Vardhman group.2. To study the factors from which most of the companies (those are customers) are
dissatisfied.3. To establish relationship between these factors.4. To suggest the recommendations for the scope of improvement.Research DesignThe research design used for this study is of the descriptive type and Causal type. Descriptive research studies are those studies which are concerned with describing the characteristics of a particular individual or a group.Population: The total element of the universe from which sample is selected for the purpose of study is known as population. The population of my research is the employees of company.Sample Size: All the items consideration in any field of inquiry constitutes a universe of population. In this research only a few items can be selected form the population for our study purpose. The items selected constitute what is technically called a sample. Here out sample size is 70 customers from the total population to conduct the study.Data CollectionThe data source: Primary in nature.Primary Data: It is the information that you collect specifically for the purpose of your research project .An Advantage of primary data is that it is specifically tailored to your research needs.The research approach: Survey MethodThe research instrument: Questionnaire MethodThe respondents: Executives, Sr. Executives, Assistant Managers, Managers and Top Management of various companies.Data Analysis and Interpretation
Biz and Bytes (Vol. 8. Issue: 1, 2017)� E-ISSN: 0976 0458, Print ISSN: 2320 897X
160
Frequency Table
Frequency Table
Pie Chart
170
Area or Segment of Dealing
Frequency
Percent Valid Percent Cumulative Percent
Valid
Brands
10
14.3 14.3 14.3
RMGE
11
15.7 15.7 30.0
GAP
12
17.1 17.1 47.1
Distributors
9
12.9 12.9 60.0
Triburg 8 11.4 11.4 71.4
Direct Export Bangladesh 10 14.3 14.3 85.7
Direct export 10 14.3 14.3 100.0
Total 70 100.0 100.0
Biz and Bytes (Vol. 8. Issue: 1, 2017)� E-ISSN: 0976 0458, Print ISSN: 2320 897X
161
InterpretationWorking of the organization is divided into 7 major segments on the basis of the area and type of customers they serve. As the major share is covered under GAP.
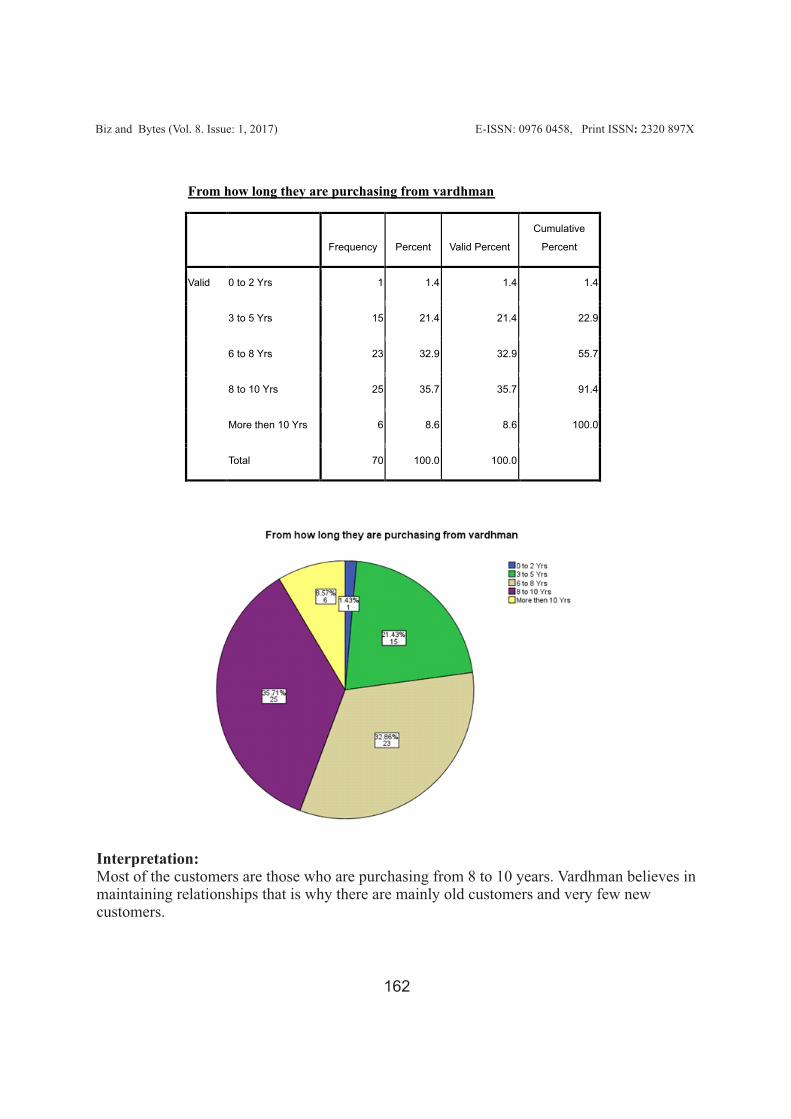
From how long they are purchasing from vardhman
Frequency
Percent
Valid Percent
Cumulative
Percent
Valid
0 to 2 Yrs
1
1.4
1.4 1.4
3 to 5 Yrs
15
21.4
21.4 22.9
6 to 8 Yrs
23
32.9
32.9 55.7
8 to 10 Yrs 25 35.7 35.7 91.4
More then 10 Yrs 6 8.6 8.6 100.0
Total 70 100.0 100.0
Biz and Bytes (Vol. 8. Issue: 1, 2017)� E-ISSN: 0976 0458, Print ISSN: 2320 897X
162
Interpretation:Most of the customers are those who are purchasing from 8 to 10 years. Vardhman believes in maintaining relationships that is why there are mainly old customers and very few new customers.
Biz and Bytes (Vol. 8. Issue: 1, 2017)� E-ISSN: 0976 0458, Print ISSN: 2320 897X
163
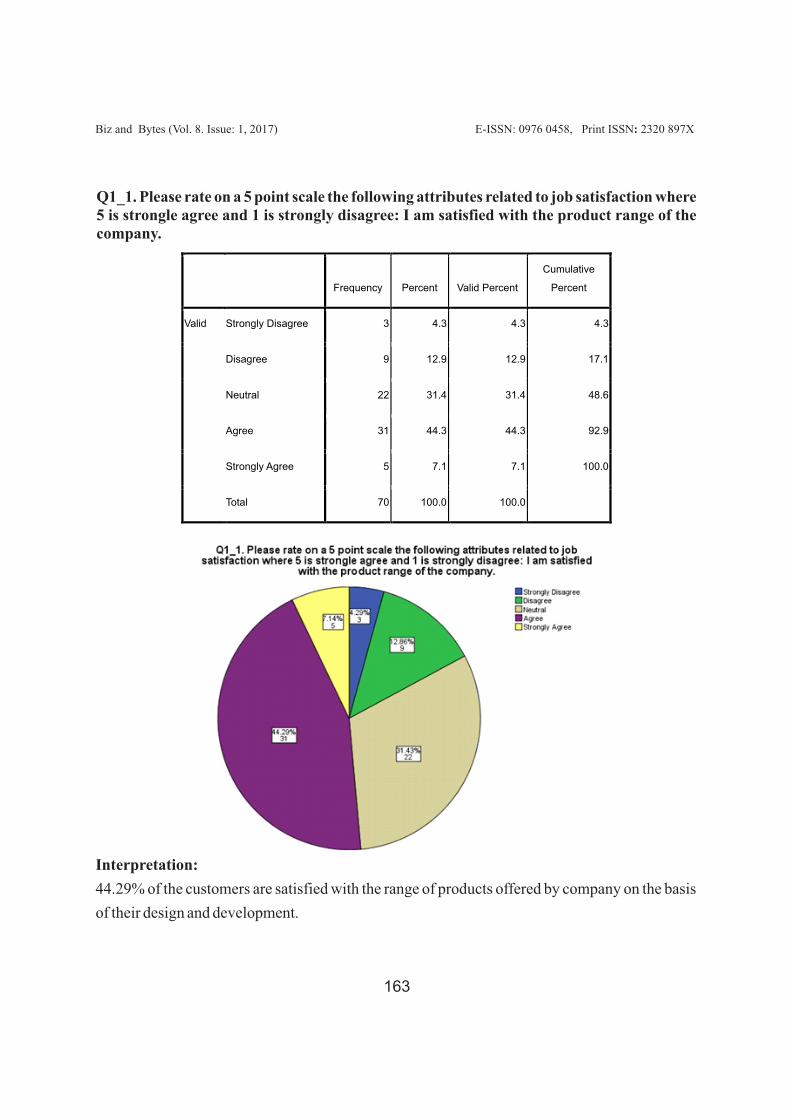
Q1_1. Please rate on a 5 point scale the following attributes related to job satisfaction where 5 is strongle agree and 1 is strongly disagree: I am satisfied with the product range of the company.
Interpretation:
44.29% of the customers are satisfied with the range of products offered by company on the basis
of their design and development.
Frequency
Percent
Valid Percent
Cumulative
Percent
Valid
Strongly Disagree
3
4.3
4.3 4.3
Disagree
9
12.9
12.9 17.1
Neutral
22
31.4
31.4 48.6
Agree
31
44.3
44.3 92.9
Strongly Agree 5 7.1 7.1 100.0
Total 70 100.0 100.0
Biz and Bytes (Vol. 8. Issue: 1, 2017)� E-ISSN: 0976 0458, Print ISSN: 2320 897X
164
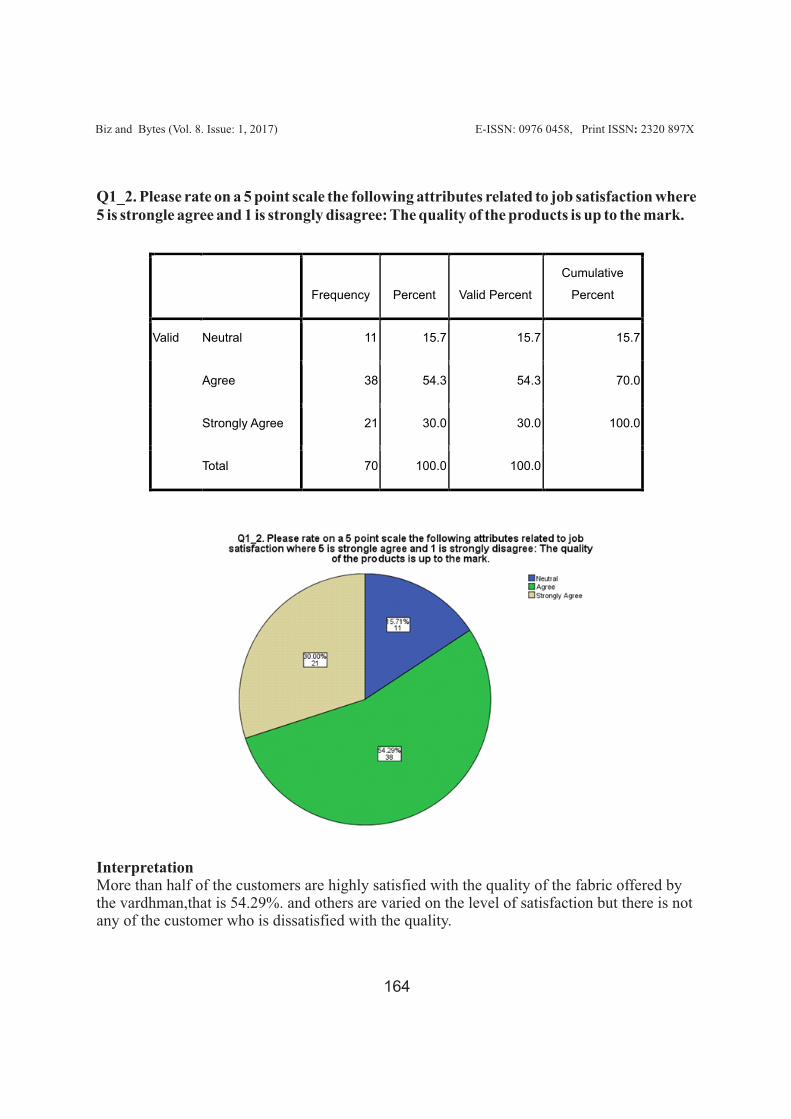
Q1_2. Please rate on a 5 point scale the following attributes related to job satisfaction where 5 is strongle agree and 1 is strongly disagree: The quality of the products is up to the mark.
InterpretationMore than half of the customers are highly satisfied with the quality of the fabric offered by the vardhman,that is 54.29%. and others are varied on the level of satisfaction but there is not any of the customer who is dissatisfied with the quality.
Frequency
Percent
Valid Percent
Cumulative
Percent
Valid Neutral 11
15.7
15.7
15.7
Agree 38
54.3
54.3
70.0
Strongly Agree 21 30.0 30.0 100.0
Total 70 100.0 100.0
Biz and Bytes (Vol. 8. Issue: 1, 2017)� E-ISSN: 0976 0458, Print ISSN: 2320 897X
165
Q1_3. Please rate on a 5 point scale the following attributes related to job satisfaction where 5 is strongle agree and 1 is strongly disagree: The lead time taken by the company is acceptable.
InterpretationOn an average, lead time is acceptable by the customers of different segments. But it is not acceptable in the product specific customer as in the case of yarn dyed fabric.
Frequency
Percent
Valid Percent
Cumulative
Percent
Valid
Strongly Disagree
7
10.0
10.0
10.0
Disagree
18
25.7
25.7
35.7
Neutral
23
32.9
32.9
68.6
Agree
20
28.6
28.6
97.1
Strongly Agree
2
2.9
2.9
100.0
Total 70 100.0 100.0
Biz and Bytes (Vol. 8. Issue: 1, 2017)� E-ISSN: 0976 0458, Print ISSN: 2320 897X
166
Interpretation58.57% of the customers are satisfied with the hand feel of the fabric offer by company and only 1.43% customers are not satisfied
Q1_4. Please rate on a 5 point scale the following attributes related to job satisfaction where 5 is strongle agree and 1 is strongly disagree: The hand feels if the fabric is satisfactory.
Frequency
Percent
Valid Percent
Cumulative
Percent
Valid Disagree 1
1.4
1.4
1.4
Neutral 22
31.4
31.4
32.9
Agree 41 58.6 58.6 91.4
Strongly Agree 6 8.6 8.6 100.0
Total 70 100.0 100.0
Biz and Bytes (Vol. 8. Issue: 1, 2017)� E-ISSN: 0976 0458, Print ISSN: 2320 897X
167
Interpretation51.43% of the customers are highly satisfied with the packaging of the consignment offered by the company and 42.86% are satisfied.
Frequency
Percent
Valid Percent
Cumulative
Percent
Valid Neutral
4
5.7
5.7 5.7
Agree 30 42.9 42.9 48.6
Strongly Agree 36 51.4 51.4 100.0
Total 70 100.0 100.0
Q1_5. Please rate on a 5 point scale the following attributes related to job satisfaction where 5 is strongle agree and 1 is strongly disagree: I am satisfied with the packaging of the products offered by company.
Biz and Bytes (Vol. 8. Issue: 1, 2017)� E-ISSN: 0976 0458, Print ISSN: 2320 897X
168
Frequency
Percent
Valid Percent
Cumulative
Percent
Valid Strongly Disagree
3
4.3
4.3
4.3
Disagree 10
14.3
14.3
18.6
Neutral 25 35.7 35.7 54.3
Agree 29 41.4 41.4 95.7
Strongly Agree 3 4.3 4.3 100.0
Total 70 100.0 100.0
Interpretation41.43% of the customers are satisfied with the prices of the company and 35.71% of the customers are neither satisfied nor dissatisfried.
Q1_6. Please rate on a 5 point scale the following attributes related to job satisfaction where 5 is strongly agree and 1 is strongly disagree: Prices are pretty much satisfactory.
Biz and Bytes (Vol. 8. Issue: 1, 2017)� E-ISSN: 0976 0458, Print ISSN: 2320 897X
169
Frequency
Percent
Valid Percent
Cumulative
Percent
Valid
Neutral
11
15.7
15.7 15.7
Agree 34 48.6 48.6 64.3
Strongly Agree 25 35.7 35.7 100.0
Total 70 100.0 100.0
InterpretationAll the customers are very much satisfied with the response of the executives of the company. As 35.71% are highly satisfied, 48.57% are satisfied.
Q1_7. Please rate on a 5 point scale the following attributes related to job satisfaction where 5 is strongle agree and 1 is strongly disagree: I am satisfied with the response of executives of the company.
Biz and Bytes (Vol. 8. Issue: 1, 2017)� E-ISSN: 0976 0458, Print ISSN: 2320 897X
170
Q1_8. Please rate on a 5 point scale the following attributes related to job satisfaction where 5 is strongly agree and 1 is strongly disagree: I am satisfied with the time taken by company to deliver the consignment.
Frequency
Percent
Valid Percent
Cumulative
Percent
Valid Strongly Disagree 1
1.4
1.4
1.4
Disagree 6
8.6
8.6
10.0
Neutral 27
38.6
38.6
48.6
Agree 31 44.3 44.3 92.9
Strongly Agree 5 7.1 7.1 100.0
Total 70 100.0 100.0
Interpretation44.29% are satisfied with the time taken by company for delivery of consignment and 38.57% are neither satisfied nor dissatisfied.
Biz and Bytes (Vol. 8. Issue: 1, 2017)� E-ISSN: 0976 0458, Print ISSN: 2320 897X
171
Q1_9. Please rate on a 5 point scale the following attributes related to job satisfaction where 5 is strongle agree and 1 is strongly disagree: I am satisfied with the blends of fabric offered by company.
Frequency
Percent
Valid Percent
Cumulative
Percent
Valid Neutral 8
11.4
11.4
11.4
Agree 41 58.6 58.6 70.0
Strongly Agree 21 30.0 30.0 100.0
Total 70 100.0 100.0
Interpretation58.57% of customers are satisfied with the blends of fabric offered by the company and 30% of the customers are highly satisfied.
Biz and Bytes (Vol. 8. Issue: 1, 2017)� E-ISSN: 0976 0458, Print ISSN: 2320 897X
172
Q1_10. Please rate on a 5 point scale the following attributes related to job satisfaction where 5 is strongle agree and 1 is strongly disagree: Serviceability of the company is satisfactory.
Frequency
Percent
Valid Percent
Cumulative
Percent
Valid Disagree 6
8.6
8.6
8.6
Neutral 19
27.1
27.1
35.7
Agree 36 51.4 51.4 87.1
Strongly Agree 9 12.9 12.9 100.0
Total 70 100.0 100.0
Interpretation51.43% of the customers are satisfied with the serviceability of the company and 8.57% of the customers are dissatisfied.
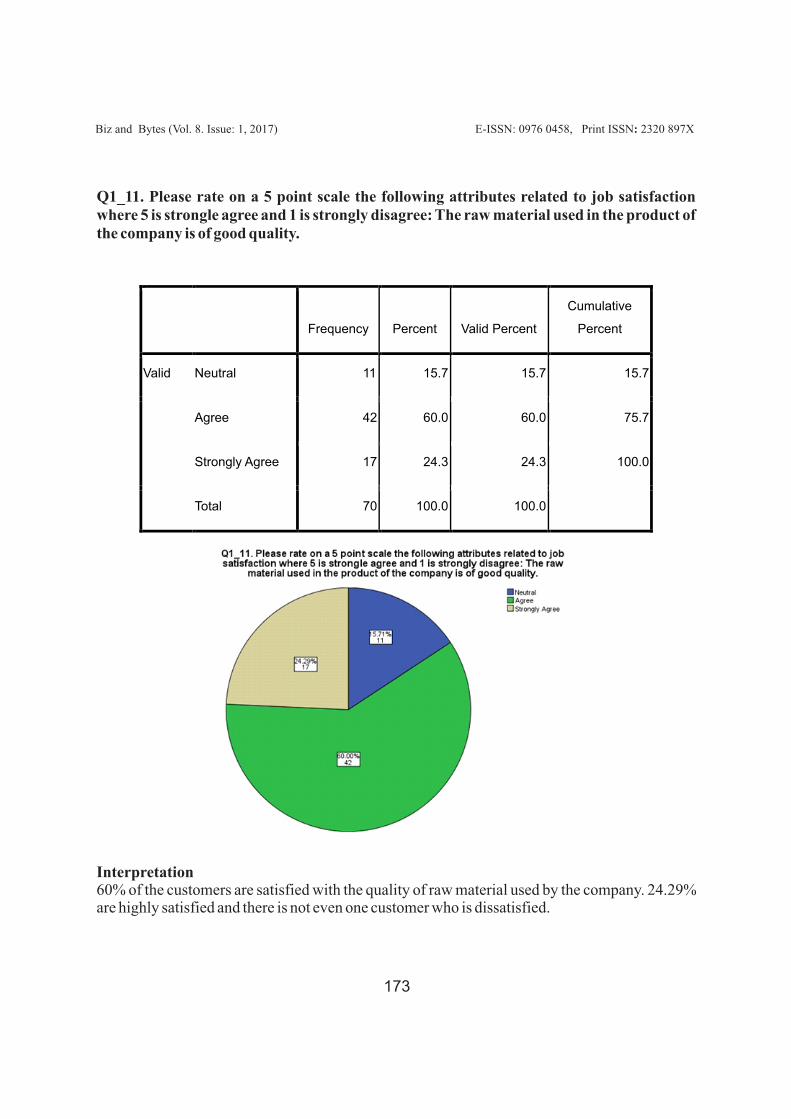
Q1_11. Please rate on a 5 point scale the following attributes related to job satisfaction where 5 is strongle agree and 1 is strongly disagree: The raw material used in the product of the company is of good quality.
Biz and Bytes (Vol. 8. Issue: 1, 2017)� E-ISSN: 0976 0458, Print ISSN: 2320 897X
173
Frequency
Percent
Valid Percent
Cumulative
Percent
Valid
Neutral
11
15.7
15.7
15.7
Agree
42
60.0
60.0
75.7
Strongly Agree
17
24.3
24.3
100.0
Total 70 100.0 100.0
Interpretation60% of the customers are satisfied with the quality of raw material used by the company. 24.29% are highly satisfied and there is not even one customer who is dissatisfied.
Biz and Bytes (Vol. 8. Issue: 1, 2017)� E-ISSN: 0976 0458, Print ISSN: 2320 897X
174
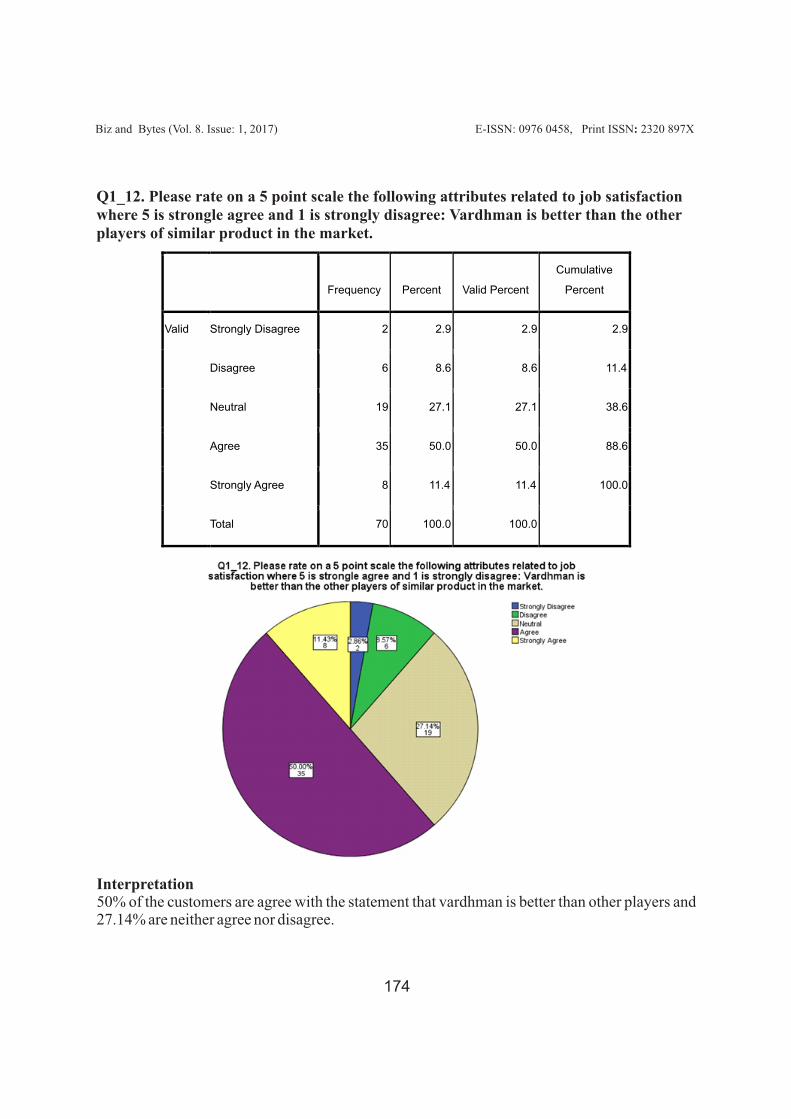
Q1_12. Please rate on a 5 point scale the following attributes related to job satisfaction where 5 is strongle agree and 1 is strongly disagree: Vardhman is better than the other players of similar product in the market.
Frequency
Percent
Valid Percent
Cumulative
Percent
Valid Strongly Disagree 2
2.9
2.9
2.9
Disagree 6
8.6
8.6
11.4
Neutral 19
27.1
27.1
38.6
Agree 35 50.0 50.0 88.6
Strongly Agree 8 11.4 11.4 100.0
Total 70 100.0 100.0
Interpretation50% of the customers are agree with the statement that vardhman is better than other players and 27.14% are neither agree nor disagree.
Biz and Bytes (Vol. 8. Issue: 1, 2017)� E-ISSN: 0976 0458, Print ISSN: 2320 897X
175
Frequency
Percent
Valid Percent
Cumulative
Percent
Valid Strongly Disagree
1
1.4
1.4
1.4
Disagree 1
1.4
1.4
2.9
Neutral 15
21.4
21.4
24.3
Agree 31
44.3
44.3
68.6
Strongly Agree 22 31.4 31.4 100.0
Total 70 100.0 100.0
Interpretation31.43% of customers are highly satisfied with the capacity of the plant, 41.29% are satisfied and 21.43% are neither satisfied nor dissatisfied.
Q1_13. Please rate on a 5 point scale the following attributes related to job satisfaction where 5 is strongle agree and 1 is strongly disagree: The capacity of the manufacturing plant is enough to meet your order requirements.
Frequency
Percent
Valid Percent
Cumulative
Percent
Valid
Neutral
13
18.6
18.6 18.6
Agree
36
51.4
51.4 70.0
Strongly Agree 21 30.0 30.0 100.0
Total 70 100.0 100.0
Interpretation30% of the customers are highly satisfied with the production process followed by the company and 51.43% are satisfied.
Biz and Bytes (Vol. 8. Issue: 1, 2017)� E-ISSN: 0976 0458, Print ISSN: 2320 897X
176
Q1_14. Please rate on a 5 point scale the following attributes related to job satisfaction where 5 is strongle agree and 1 is strongly disagree: The production process followed by the company is able to give the quality product on time.
Biz and Bytes (Vol. 8. Issue: 1, 2017)� E-ISSN: 0976 0458, Print ISSN: 2320 897X
177
Q1_15. Please rate on a 5 point scale the following attributes related to job satisfaction where 5 is strongle agree and 1 is strongly disagree: The strategies and plans of the company are favorable.
Frequency
Percent
Valid Percent
Cumulative
Percent
Valid
Disagree
3
4.3
4.3
4.3
Neutral
15
21.4
21.4
25.7
Agree
33
47.1
47.1
72.9
Strongly Agree
19
27.1
27.1
100.0
Total 70 100.0 100.0
InterpretationThe strategies of the company are favourable for its customers. Only 4.29% of the customers are not satisfied with the policies of the company.
Frequency
Percent
Valid Percent
Cumulative Percent
Valid Strongly Disagree 1
1.4
1.4
1.4
Disagree 1
1.4
1.4
2.9
Neutral 16
22.9
22.9
25.7
Agree 37 52.9 52.9 78.6
Strongly Agree 15 21.4 21.4 100.0
Total 70 100.0 100.0
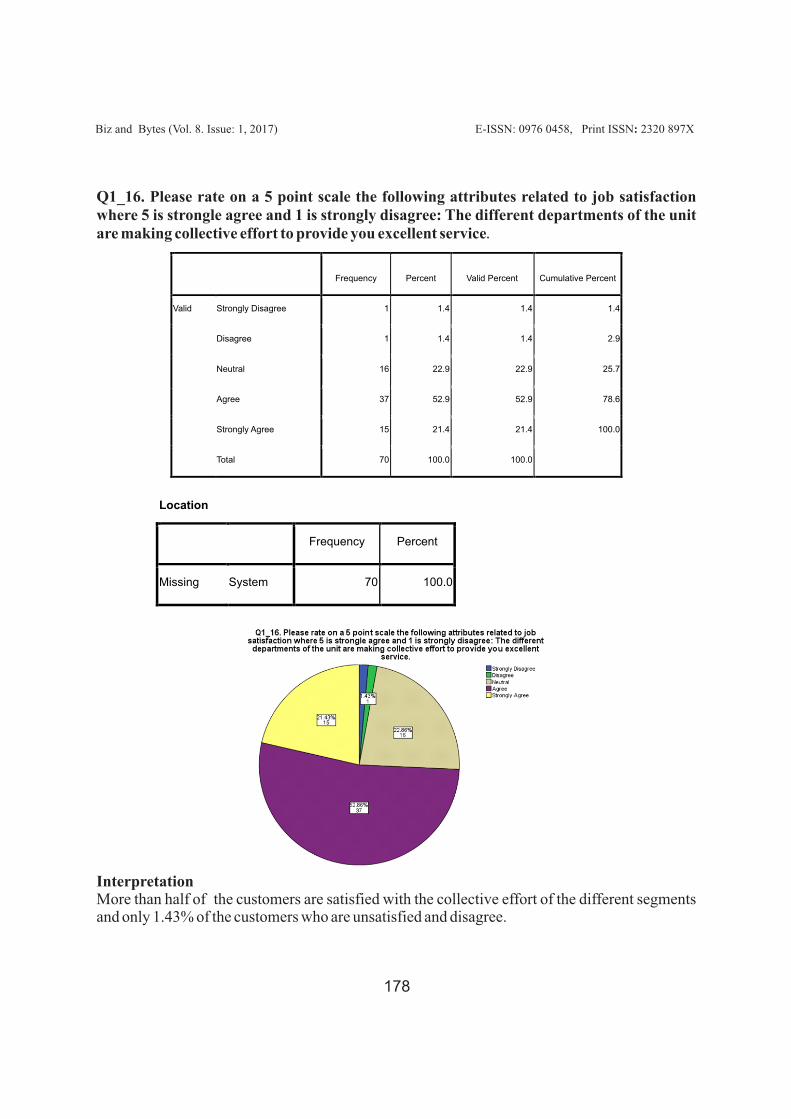
Location
Frequency Percent
Missing System 70 100.0
Biz and Bytes (Vol. 8. Issue: 1, 2017)� E-ISSN: 0976 0458, Print ISSN: 2320 897X
178
Q1_16. Please rate on a 5 point scale the following attributes related to job satisfaction where 5 is strongle agree and 1 is strongly disagree: The different departments of the unit are making collective effort to provide you excellent service.
InterpretationMore than half of the customers are satisfied with the collective effort of the different segments and only 1.43% of the customers who are unsatisfied and disagree.
Q1_1. I am
satisfied
with the
product
range of the company.
Q1_2.
The quality of the
products is up
to the
mark.
Q1_3. the lead time taken by the company is
acceptable.
Q1_4. The hand
feels if the
fabric is
satisfactory.
Q1_5. I am
satisfied
with the
packaging
of the produ
cts offered by
company.
Q1_6. Prices
are pretty much
satisfactory.
Q1_7.I am
satisfied
with the
response of executives of
the compa
ny.
Q1_8. I am
satisfied with the
time taken by compan
y to deliver
the consignment.
Q1_1. I am satisfied with the product range of the company.
1
-0.01
6
-.267*
.307**
0.028
-0.134
-0.092
-0.024
Q1_2. The quality of the products is up to the mark.
-0.016
1
0.088
.365**
-0.021
-0.207
0.157
-0.234
Q1_3. The lead time taken by the company is acceptable.
-.267*
0.088
1
0.088
-0.031
.264*
.276*
.499**
Q1_4. The hand feels if the fabric is satisfactory.
.307**
.365**
0.088
1
0.123
-0.154
0.119
-0.071
Q1_5. I am satisfied with the packaging of the products offered by company.
0.028
-0.02
1
-0.031
0.123
1
-0.122
-0.048
-.238*
Q1_6. Prices are pretty much satisfactory.
-0.134
-0.20
7
.264*
-0.154
-0.122
1
.256*
.469**
Q1_7. I am satisfied with the response of executives of the company.
-0.092
0.157
.276*
0.119
-0.048
.256*
1
.268*
Q1_8. I am satisfied with the time taken by company to deliver the consignment.
-0.024
-0.23
4
.499**
-0.071
-.238*
.469**
.268*
1
Q1_9. I am satisfied with the blends of fabric offered by company.
0.004
0.18
0.102
0.05
-0.036
0.012
0.215
0.111
Q1_10.Serviceability of the company is satisfactory.
-0.11
0.139
.444**
0.152
-.294*
.313**
.424**
.516**
Q1_11.The raw material used in the product of the company is of good quality.
0.067
0.143
0.194
0.166
-0.028
-0.041
.324**
0.118
Q1_12.Vardhman is better than the other players of similar product in the market.
-0.121
-.260*
.305*
-0.062
-0.072
.311**
0.133
.446**
Q1_13.The capacity of the manufacturing plant is enough to meet your order requirements.
-0.067
0.018
.252*
0.041
-0.026
.269*
0.138
.295*
Q1_12.The production process followed by the company is able to give the quality product on time.
-0.043
-0.13
0.222
-0.098
-0.057
.316**
0.042
.419**
Q1_15.The strategies and plans of the company are favorable.
-0.042
0.088
.358**
0.07
-0.003
.379**
0.215
.283*
Q1_16.The different departments of the unit are making collective effort to provide you
excellent service.
-0.13
.243*
.449**
0.216
-0.098
.292*
.321**
.334**
Biz and Bytes (Vol. 8. Issue: 1, 2017)� E-ISSN: 0976 0458, Print ISSN: 2320 897X
179
Correlation of different attributes
Q1_1.I am satisfied with the product range of the company.
Q1_9.I am satisfi
ed with the
blends of
fabric offered by company.
Q1_10. Serviceability of the
company is
satisfactory.
Q1_11.
The raw
material
used in the product of the
company is of good qualit
y.
Q1_12.
Vardhman
is better than the
other players of
similar
product in the
market.
Q1_13.The
capacity of the
manufacturing
plant is enough to meet
your order
requirements.
Q1_14.The
production
process
followed by the
company is
able to give the
quality produc
t on time.
Q1_15.The
strategies and
plans of the company are favora
ble.
Q1_16.The
different
departments of the
unit are making collecti
ve effort to provide
you excelle
nt service
.
Q1_2.The quality of the products is up to the mark.
0.004
-0.11
0.067
-0.121
-0.067
-0.043
-0.042
-0.13
Q1_3.The lead time taken by the company is acceptable.
0.18
0.139
0.143
-.260*
0.018
-0.13
0.088
.243*
Q1_4.The hand feels if the fabric is satisfactory.
0.102
.444**
0.194
.305*
.252*
0.222
.358**
.449**
Q1_5.I am satisfied with the packaging of the products offered by company.
0.05
0.152
0.166
-0.062
0.041
-0.098
0.07
0.216
Q1_6.Prices are pretty much satisfactory.
-0.036
-.294*
-0.028
-0.072
-0.026
-0.057
-0.003
-0.098
Q1_7.I am satisfied with the response of executives of the company.
0.012
.313**
-0.041
.311**
.269*
.316**
.379**
.292*
Q1_8.I am satisfied with the time taken by company to deliver the consignment.
0.215
.424**
.324**
0.133
0.138
0.042
0.215
.321**
Q1_9.I am satisfied with the blends of fabric offered by company.
0.111
.516**
0.118
.446**
.295*
.419**
.283*
.334**
Q1_10.Serviceability of the company is satisfactory.
1
0.176
0.181
0.036
-0.147
0.051
0.154
0.18
Q1_11.The raw material used in the product of the company is of good quality.
0.176
1
.309**
.313**
.372**
0.195
.360**
.522**
Q1_12.Vardhman is better than the other players of similar product in the market.
0.181
.309**
1
-0.038
-0.005
0.11
0.202
0.217
Q1_13.The capacity of the manufacturing plant is enough to meet your order requirements.
0.036
.313**
-
0.038
1
.447**
.330**
.336**
.251*
Q1_14.The production process followed by the company is able to give the quality product on time.
-
0.147 .372**
-
0.005 .447**
1
0.167
0.168
.261*
Q1_15.The strategies and plans of the company are favorable.
0.051 0.195
0.11
.330**
0.167
1
0.134
0.124
Q1_16.The different departments of the unit are making collective effort to provide you excellent service.
0.154 .360** 0.202 .336** 0.168 0.134 1 .488**
0.18 .522** 0.217 .251* .261* 0.124 .488** 1
Biz and Bytes (Vol. 8. Issue: 1, 2017)� E-ISSN: 0976 0458, Print ISSN: 2320 897X
180
HypothesisThe Following hypothesis was tested by One Way Annova Test:1. Ho: There is no significance difference between Total purchase and the product range of
the company. H1: There is significance difference between Total purchase and the product range of the
company.2. Ho: There is no significance difference between Total purchase and the product quality. H1: There is significance difference between Total purchase and the product quality.3. Ho: There is no significance difference between Total purchase and the lead time taken
by the company. H1: There is significance difference between Total purchase and the lead time taken by
the company.4. Ho: There is no significance difference between Total purchase and the hand feel of the
fabric. H1: There is significance difference between Total purchase and the hand feel of the
fabric.5. Ho: There is no significance difference between Total purchase and packaging of the
product. H1: There is significance difference between Total purchase and packaging of the
product.6. Ho: There is no significance difference between Total purchase and prices. H1: There is significance difference between Total purchase and prices.7. Ho: There is no significance difference between Total purchase and the response of
executives of the company. H1: There is significance difference between Total purchase and the response of
executives of the company.8. Ho: There is no significance difference between Total purchase and the delivery time. H1: There is significance difference between Total purchase and the delivery time.9. Ho: There is no significance difference between Total purchase and the blends of fabric. H1: There is significance difference between Total purchase and the blends of fabric10. Ho: There is no significance difference between Total purchase and the serviceability of
the company. H1: There is significance difference between Total purchase and the serviceability of the
company.11. Ho: There is no significance difference between Total purchase and the raw material used
in the product. H1: There is significance difference between Total purchase and the raw material used in
the product.12. Ho: There is no significance difference between Total purchase and competitors. H1: There is significance difference between Total purchase and competitors.13. Ho: There is no significance difference between Total purchase and the manufacturing
capacity of the company.
Biz and Bytes (Vol. 8. Issue: 1, 2017)� E-ISSN: 0976 0458, Print ISSN: 2320 897X
181
ANOVA
Sum of Squares Df Mean Square F Sig.
Q1_1. Please rate on a 5 point
scale the
following attributes
related to job satisfaction where
5 is strongly agree and 1 is
strongly disagree: I am satisfied
with the product range of the
company.
Between Groups
.774 2 .387 .421 .658
Within Groups
61.569 67 .919
Total
62.343 69
Q1_2. Please rate on a 5 point
scale the following attributes
related to job satisfaction where
5 is strongly agree and 1 is
strongly disagree: The quality of
the products is up to the mark.
Between Groups
1.835 2 .917 2.139 .126
Within Groups
28.737 67 .429
Total
30.571 69
Q1_3. Please rate on a 5 point
scale the following attributes
related to job satisfaction where
5 is strongly agree and 1 is
strongly disagree: The lead time
taken by the company is
acceptable.
Between Groups
1.051 2 .525 .489 .616
Within Groups 72.035 67 1.075
Total
73.086 69
Q1_4. Please rate on a 5 point
scale the following attributes
related to job satisfaction where
5 is strongly agree and 1 is
strongly disagree: The hand
feels if the fabric is satisfactory.
Between Groups .129 2 .064 .158 .854
Within Groups 27.243 67 .407
Total27.371 69
Q1_5. Please rate on a 5 point
scale the following attributes
related to job satisfaction where
5 is strongle agree and 1 is
strongly disagree: I am satisfied
with the packaging of the
products offered by company.
Between Groups .530 2 .265 .714 .493
Within Groups 24.842 67 .371
Total
25.371 69
H1: There is significance difference between Total purchase and the manufacturing capacity of the company.
14. Ho: There is no significance difference between Total purchase and the production process of the company.
H1: There is significance difference between Total purchase and the production process of the company.
15. Ho: There is no significance difference between Total purchase and the strategies of the company.
H1: There is significance difference between Total purchase and the strategies of the company.
16. Ho: There is no significance difference between Total purchase and the collective effort of different departments of the company.
H1: There is significance difference between Total purchase and the collective effort of different departments of the company.
Biz and Bytes (Vol. 8. Issue: 1, 2017)� E-ISSN: 0976 0458, Print ISSN: 2320 897X
182
Q1_6. Please rate on a 5 point
scale the following attributes
related to job satisfaction where
5 is strongly agree and 1 is
strongly disagree: Prices are
pretty much satisfactory.
Between Groups
.400
2
.200 .233 .793
Within Groups
57.443
67
.857
Total
57.843
69
Q1_7. Please rate on a 5 point
scale the following attributes
related to job satisfaction where
5 is strongly agree and 1 is
strongly disagree: I am satisfied
with the response of executives
of the company.
Between Groups
1.266
2
.633 1.328 .272
Within Groups
31.934
67
.477
Total
33.200
69
Q1_8. Please rate on a 5 point
scale the following attributes
related to job satisfaction where
5 is strongly agree and 1 is
strongly disagree: I am satisfied
with the time taken by company
to deliver the consignment.
Between Groups
.501
2
.251 .374 .690
Within Groups
44.941
67
.671
Total
45.443
69
Q1_9. Please rate on a 5 point
scale the following attributes
related to job satisfaction where
5 is strongly agree and 1 is
strongly disagree: I am satisfied
with the blends of fabric offered
by company.
Between Groups
1.256
2
.628 1.661 .198
Within Groups
25.330
67
.378
Total
26.586
69
Q1_10. Please rate on a 5 point
scale the following attributes
related to job satisfaction where
5 is strongle agree and 1 is
strongly disagree: Serviceability
of the company is satisfactory.
Between Groups .837 2 .419 .634 .534
Within Groups 44.249 67 .660
Total45.086 69
Q1_11. Please rate on a 5 point
scale the following attributes
related to job satisfaction where
Between Groups .581 2 .291 .724 .489
Within Groups 26.904 67 .402
Biz and Bytes (Vol. 8. Issue: 1, 2017)� E-ISSN: 0976 0458, Print ISSN: 2320 897X
183
Interpretation From the above table it is evident that all p values are greater than .05, hence our null hypothesis gets accepted i.e there is no significance difference between total different factors and customer satisfaction.
Findings and Conclusionã Vardhman is providing good quality product in yarn dyed but still there is scope of
improvement in the plant.ã Lead time is the major problem faced by the customers which need to be altered.ã The strategies followed inside the department are pretty much effective and more can done
by motivating the segments separately according to their different aspects of improvement.
ã All segments have their different strengths and weaknesses, which can be altered within the system.
ã The production process can be revised and its collaboration with the supply chain department is needed to see the problem in the lead time target.
ã The prices can be reduced but for that the capacity of the plant need to be increased.ã The designs and ranges required the updating work. As all customers want improvement
in design and development of the product.
Major problemsã Combined unit of all the products.ã Capacity of the plant is not balanced for all types of fabric.ã Collaboration of all the 3 units for yarn dyed fabric.ã Design and development ã Lead time is more than the customer requirement.ã Coordination among all the departments is not up to the mark.ã Resistance to change in the process and working.
Strength of the companyã Brand identity is strong and establishedã Goodwill is already earned due to old player in the market.â Old customer relationship and retaining them successfully.â Quality of the fabric is up to the mark.ã Product strength that is Stretch range.ã Mélange, Jespy and other irregular fabric. ã Traditional values in work and the TPM policy of the company.
Need of the hourã Separate focus on yarn dyed business and Increase in capacity of plant for that.
Biz and Bytes (Vol. 8. Issue: 1, 2017)� E-ISSN: 0976 0458, Print ISSN: 2320 897X
184
ã Measures for collaboration among all the 3 units.ã Production process should be revised.ã More designers and designing tools required for new product range.ã Coordination among departments or different segments.ã Adoption of changes occurring in dynamic business environment
Revised B to B marketing strategiesã Webinars, Tradeshows and new product range.ã Customer priority need to be focused.ã Campaigns can be introduced for the yarn dyed with public relation building practices.ã More digitalization and dynamicity needed in the working process of the company.ã Balance need to be maintained in the focus on all the products of the company.
ConclusionAs per the findings of the research, the above given solutions can be taken to improve the level of satisfaction of the customers. The factors are affecting but up to the some extent and the level of satisfaction are also different of the customers of the different tier on the basis of quantity of fabric they purchase from the company. \
References[1] Bijlana angelova (2011) “ Measuring Customer Satisfaction with Service Quality Using
American Customer Satisfaction Model (ACSI Model)” International Journal of Academic Research in Business and Social Sciences October 2011, Vol. 1, No. 3
[2] Devkumar S Callychurn(2014)” Key Success Factors for the Apparel ManufacturingIndustry: A Case Study at company X” Proceedings of the World Congress
on Engineering vol.2, pp 2078-0958 Duchess university of technology, vol.5, pp22-29[3] Hsiu-Yuan Hu(2011)” A study of customer satisfaction, customer loyalty and quality
attributes in Taiwan’s medical service industry” African Journal of Business Management Vol. 5(1), pp. 187-195
[4] Ikilem Gocek(2007)” The Perception of Customer Satisfaction in Textile Industry According to Genders in Turkey” International Journal of Social, Behavioral, Educational, Economic, Business and Industrial Engineering Vol:1, pp193-196
[5] Ikilem Gocek(2012)” Determination of a Model Regarding Customer Satisfaction
Biz and Bytes (Vol. 8. Issue: 1, 2017)� E-ISSN: 0976 0458, Print ISSN: 2320 897X
185
ã Adoption of change with the changing business environment.ã Action towards emerging customer requirements.ã Move forward with healthy competition.
Possible solutionã Development of infrastructure for yarn dyed by Separately focused unit.
[9] Jiana Daikh(2015) “A Research Proposal: The Relationship between Customer Satisfaction and Consumer Loyalty”Johnson & Wales University –pp 42.
[10] Maria karalova (2014) “Customer Satisfaction, Product Quality and Performance of Companies” review of economic perspective, vol.14, issue 4,pp. 329–344
[11] Md. Alauddin(2013)” Factors Which Affecting Customer Satisfaction in the Garment Industry of Bangladesh” International Journal of Marketing Studies; Vol. 5,pp 64-74
[12] Prerna dawar (2013) “customer satisfaction in highly competitive economy” international journal of commerce, vol. 2, pp 1156-1164
[13] Sunhilde(2009)” A managerial approach of customer satisfaction drivers in the clothing industry” University of Oradea vol.4, pp334-342
[14] Tondon nupur(2013)” A study on emerging trends in textile industry in India” International Journal of Advancements in Research & Technology, Vol. 2, Issue 7,pp 267-276
[15] Yoganandan.G (2013) “factors affecting the export performance of textile industry in developing countries – A review of literature” International Journal of Commerce, Business and Management. Vol. 2, pp 2319–2828
QuestionnaireA survey is being conducted on “Factors Affecting Customer Satisfaction”. Kindly extend your cooperation in filling the questionnaire. For the following questions, respondents should be asked to indicate whether they agree (A), disagree (D), strongly agree (SA), strongly disagree (SD), or are neutral (N).This information is for academic purpose only:Company name:Company worth:No. of employees:Location:Area/segment of dealing:
Biz and Bytes (Vol. 8. Issue: 1, 2017)� E-ISSN: 0976 0458, Print ISSN: 2320 897X
186
Perception for Textile consumers” International Journal of Business and Social Science vol.3,pp 89-104
[6] Ivan GROS(2011)” b2b segmentation as a tool for marketing & logistic strategy formulation” intellectual economics vol. 1(9),pp. 54–64
[7] Janet manye agbor (2011) “service quality in purchasing and customer satisfaction”[8] Jeanne Rossomme(2003)” Customer satisfaction measurement in a business-to-
business context: a conceptual framework” Journal of business & industrial marketing , vol . 1 8, pp179-195
Biz and Bytes (Vol. 8. Issue: 1, 2017)� E-ISSN: 0976 0458, Print ISSN: 2320 897X
187
Biz and Bytes (Vol. 7. Issue: 1, 2016)� E-ISSN: 0976 0458, Print ISSN: 2320 897X
195
S.no. Survey question SA A N D SD1. I am satisfied with the product range of the company.
2. The quality of the products is up to the mark.
3. The lead time taken by the company is acceptable.
4. The hand feels if the fabric is satisfactory.
5. I am satisfied with the packaging of the products offered by company.
6. Prices are pretty much satisfactory.
7. I am satisfied with the response of executives of the company.
8. I am satisfied with the time taken by company to deliver the consignment.
9. I am satisfied with the blends of fabric offered by company.
10. Serviceability of the company is satisfactory.
11. The raw material used in the product of the company is of good quality.
12. Vardhman is better than the other players of similar product in the market.
13. The capacity of the manufacturing plant is enough to meet your order requirements.
14. The production process followed by the company is able to give the quality product on time.
15. The strategies and plans of the company are favorable.
16. The different departments of the unit are making collective effort to provide you excellent service.