Report Feasibility Report Reclaimed Water for Restoration and Community Projects in Big Pine, CA Prepared for Inyo County Water Department December, 2017 140 W. Huffaker Lane #507 Reno, NV 89511
Transcript
Report
Feasibility ReportReclaimed Water for Restoration
and Community Projectsin Big Pine, CA
Prepared for
Inyo County Water Department December, 2017
140 W. Huffaker Lane#507Reno, NV 89511
Feasibility Study – Reclaimed Water for Restoration and December 2017 Community Projects in Big Pine, CA
i
Table of Contents
LIST OF FIGURES .............................................................................................................................................. II
LIST OF TABLES ................................................................................................................................................ II
3.3 EXISTING EFFLUENT QUALITY...................................................................................................................... 14 3.4 AMOUNT OF WATER AVAILABLE FOR REUSE .................................................................................................. 16 3.5 GEOLOGY, HYDROGEOLOGY, AND SOILS ....................................................................................................... 17 3.6 REUSE IRRIGATION CRITERION .................................................................................................................... 18 3.7 RECYCLED WATER: REUSE REGULATIONS AND REQUIREMENTS ......................................................................... 23 3.8 LAHONTAN RWQCB REGULATIONS AND REQUIREMENTS ................................................................................ 24 3.9 CDPH REGULATIONS AND REQUIREMENTS ................................................................................................... 26
4 PRELIMINARY ALTERNATIVES FOR REUSE ............................................................................................. 28
5 RECOMMENDED ALTERNATIVE FOR REUSE .......................................................................................... 28
5.1 REUSE OF UNDISINFECTED EFFLUENT FOR IRRIGATION AT LADWP REVEGETATION AREA ....................................... 29 5.2 TREATMENT AND APPLICATION (PUMPING) SYSTEM ....................................................................................... 30 5.3 DISTRIBUTION SYSTEM .............................................................................................................................. 31 5.4 IRRIGATION SYSTEM ................................................................................................................................. 36 5.5 PHOTOVOLTAIC SYSTEM AT WRRF .............................................................................................................. 38
6.1 CONSTRUCTION AND CAPITAL IMPROVEMENT COSTS ...................................................................................... 41 6.2 OPERATION AND MAINTENANCE COSTS ....................................................................................................... 43 6.3 LIFECYCLE COSTS ...................................................................................................................................... 43
6.3.A Solar Power Cost Impacts ............................................................................................................... 45
7 CONCLUSIONS AND RECOMMENDATIONS ........................................................................................... 45
Table 6 Distribution System Preliminary Design Parameters ...............................................33
Table 7 Preliminary Estimate of Probable Costs ..................................................................42
Table 8 Preliminary Estimate of Increase in O&M Costs .....................................................43
Table 9 Preliminary Estimate of LiIfe Cycle Costs ...............................................................44
Feasibility Study – Reclaimed Water for Restoration and December 2017 Community Projects in Big Pine, CA
1
1 Executive Summary
Inyo County Water Department has contracted with R.O. Anderson Engineering, Inc.
(ROA), to perform a feasibility study on the viability of recycled water reuse projects for
restoration and community projects in the community of Big Pine, located in Inyo County,
California. The feasibility study is intended to review and evaluate the suitability of the
existing quantity of recycled water presently available for various reclaimed water reuse
opportunities as well as the application of solar energy to offset existing and future costs
associated with generation of recycled water. A grant for a feasibility study was awarded
by the California Department of Water Resources under the Integrated Regional Water
Management Program (IRWMP) with the intent of evaluating recycled water use for land
restoration and community projects in Big Pine. If all involved stakeholders, including the
town of Big Pine, the Big Pine Paiute Tribe, and Inyo County, determine that the project
is feasible based on the findings of this study; the environmental and regulatory review
process, improvement plans and contract documents, and ultimately construction of the
preferred alternative, will follow in subsequent phases.
This study of effluent reuse at the Water Resource Reclamation Facility (WRRF) located
in the Big Pine Community Services District (BPCSD) summarizes ROA’s findings on the
existing condition of the facility and relevant site investigations. It was determined that an
average of 80,000 gallons per day (GPD) (48.6 gallons per minute) of recycled water is
presently available for reuse in Big Pine and can be used for a variety of irrigation
applications. The degree of treatment required varies depending upon how and where
the recycled water is reused as well as the amount of public access to the reuse area.
Allowing a high level of public access to the site will result in greater levels of treatment
being required, subsequently resulting in greater capital cost and greater operation and
maintenance costs. However, with moderate access restrictions, the recycled water can
be applied in certain manners without additional treatment – e.g. subsurface drip
irrigation.
The permitting and regulatory requirements are discussed in the Recommended
Alternative section of this report. In addition to Inyo County Building Permits, approval
will be required from the California Department of Public Health, and Waste Discharge
Requirements (WDR) must be issued by the Lahontan Regional Water Quality Control
Board (LRWQCB, Lahontan). Lahontan will require that both the existing WDR for the
existing sewer plant be modified to allow the reuse and new WDR be issued to the entity
that will operate the reuse systems. The new WDR are not known at this time and it is
recommended that Lahontan be consulted in the next phase of the project to better
estimate these requirements.
All potential reuse sites that were identified during the public input process were
qualitatively evaluated for reuse and a single preferred alternative was selected from
among 18 different projects that were proposed for this feasibility study. The selected
alternative examines reuse of undisinfected recycled water by subsurface trickle
Feasibility Study – Reclaimed Water for Restoration and December 2017 Community Projects in Big Pine, CA
2
irrigation at the Los Angeles Department of Water and Power (LADWP) lands located
south of the BPCSD WRRF that have been reserved for native-revegetation and
mitigation purposes. These lands cover an area of ±160 acres, are currently vacant and
under a State ordered mandate for revegetation with native plant species. Because of
this mandate, the LADWP may find it advantageous to have a source of recycled water
available for irrigation use.
With this alternative there will be no additional treatment or disinfection of the recycled
water and therefore the reuse must not be spray-applied, and the public must be
excluded from the reuse site during irrigation. Recycled water at a continuous flow rate
of about 50 gallons per minute will be withdrawn from the existing BPCSD oxidation
ponds following the secondary clarifier and pumped to the 160-acre LADWP
revegetation area where it will be continuously reused for subsurface drip irrigation. This
alternative has an estimated budgetary capital cost of 1.54 million and an estimated
budgetary annual operation and maintenance (O&M) cost of approximately $6,200. With
the expected delivery of up to 25.5 million gallons or approximately 78 acre-feet annually
(AFA) annually, the O&M Cost is $0.24 per 1000 gallons ($79/AF). The government rate
for water from the Big Pine public water system is $0.44 per 1000 gallons and therefore
use of recycled water is found to be less expensive than domestic water in this
application.
Additionally, this alternative includes an option for the installation of a Photovoltaic Solar
Array to generate renewable energy that may potentially offset the project’s O&M costs
as well as reduce the estimated project lifecycle costs. This system would potentially be
able to generate up to 203,951 kilowatt hours (kWh) annually and would be able to
provide approximately 99.8% of the existing power requirements at the BPCSD WRRF.
The estimated net savings in electrical power consumption is approximately $19,814 per
year, after accounting for O&M costs.
2 Introduction & Project Background
Recent and persistent drought conditions throughout much of the arid west have brought
the issue of water resources conservation to the top of priorities for many municipalities,
especially within California, which has been particularly affected by the ongoing drought.
As communities throughout the region have sought to bolster and augment available
water supplies, the implementation of recycled water as a water-saving measure has
gained steady acknowledgement and acceptance for a variety of uses. Recycled water
is, simply put, the reclamation and application of treated wastewater for beneficial use.
Recycled water affords communities with opportunities such as landscape irrigation,
agricultural uses, and environmental restoration. Inyo County, having identified various
locations and opportunities for using recycled water consistent with the California
Feasibility Study – Reclaimed Water for Restoration and December 2017 Community Projects in Big Pine, CA
3
Recycled Water Policy1 prepared by the State Water Boards, initiated this feasibility
study and contracted with R.O. Anderson Engineering, Inc. (ROA) to develop and
evaluate alternatives for placing reclaimed water generated within the community of Big
Pine to beneficial use.
Big Pine is an unincorporated town in Inyo County, California, located in the Owens
Valley on U.S. Highway 395, 210 miles north of Los Angeles and 15 miles south of the
City of Bishop. Adjacent to Big Pine is the Big Pine Paiute Tribe’s (BPPT, Tribe)
Reservation. The total population of the area consists of approximately 1,750 people
who reside within the town and approximately 500 people who live on the BPPT’s
Reservation. There are approximately 340 existing residential and 20 commercial
connections that are served with public sewerage by the Big Pine Community Services
District (BPCSD, District), while the Tribe provides sanitary sewerage to 462 tribal
members [1]. The District collects and conveys wastewater flows to the BPCSD Water
Resource Recovery Facility (WRRF) located northeast of town where it is treated to
secondary standards via an oxidation ditch followed by a secondary clarifier and
oxidation ponds (effluent polishing), and is ultimately disposed of in percolation and
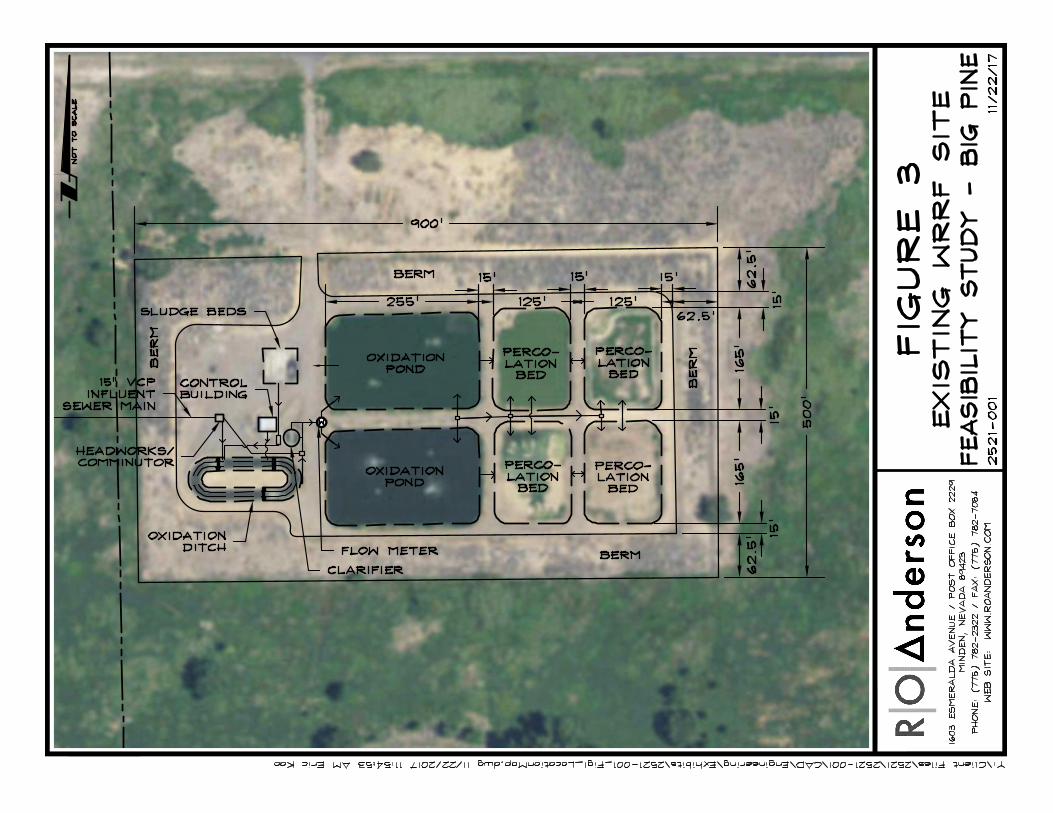
evaporation ponds as shown on Figure 3. The Tribe operates a separate WRRF south of
the District consisting of two evaporation ponds.
2.1 Purpose and Scope
The purpose of this feasibility study is to investigate potential opportunities to
implement reclamation of treated wastewater to irrigate landscaping, recreational
facilities, agriculture, and/or environmental restoration sites in the Big Pine area.
The scope of this study includes the following items:
• Identifying potential alternatives for treatment options and uses of
recycled water from both the BPCSD and BPPT WRRF’s.
• Estimating initial cost, operation and maintenance cost and life cycle cost
of any treatment upgrades and/or new facilities.
• Potential options for solar power generation for the purposes of pumping,
treatment and power generation.
• Certifications required for operations personnel as related to proposed
recommended alternatives.
This feasibility report is the first portion of the scope of work, and consists of
evaluating the preferred alternative from all identified potential alternatives for the
1 The California Recycled Water Policy encourages “…local and regional water agencies to move toward clean,
abundant, local water for California by emphasizing appropriate water recycling, water conservation, and
maintenance of supply infrastructure and the use of stormwater…”
Feasibility Study – Reclaimed Water for Restoration and December 2017 Community Projects in Big Pine, CA
4
reuse of recycled water in Big Pine. Each alternative was presented to
stakeholders for review and the preferred alternative was then selected, the
feasibility of which is reviewed in this study. If the preferred alternative is
determined to be feasible, the subsequent step will be to complete a Title 22
Engineering Report as well as an environmental review, which will be reviewed
by Inyo County, BPCSD and BPPT Council representatives, and the State Board.
Upon approval, a Notice of Intent (NOI) Report will be submitted first to the Inyo
County, BPCSD and BPPT Council representatives for review, then to the
California Regional Water Quality Control Board, Lahontan Region (LRWQCB, or
Lahontan) for approval. Upon submittal of the NOI, the ROA team will prepare
improvement plans and specifications for the selected alternative as selected by
the project stakeholders and approved by the State Board and Lahontan.
2.2 Preliminary Alternatives Analysis
Following the Notice to Proceed issued by Inyo County, a kickoff meeting was
held July 12, 2017. The purpose of the kickoff meeting was to introduce the
overall project and feasibility study to the project’s stakeholders, as well as to
refine the goals and objectives for the project. Stakeholders present at the kickoff
meeting included representatives of the general public, the Tribe, BPCSD, Inyo
County, and ROA. Representatives of the Los Angeles Department of Water and
Power (LADWP) were unable to attend; however, LADWP did provide email
correspondence in advance of the meeting indicating the Department’s interest
in, and support for the project, as well as the following suggestions:
• Determination of appropriate treatment levels to ensure regulatory and
safety requirements for reuse are achieved;
• Potential costs of the design, construction, and installation of the
distributions system;
• Potential costs for operation and maintenance;
The goals and objectives as refined at the kickoff meeting include:
1. Identify potential recycled water applications within and around the town
of Big Pine.
2. Identify alternatives that minimize future operational and maintenance
costs.
3. Identify alternatives that will require a minimal amount of alterations or
upgrades to the existing WRRF, as the addition of advanced treatment
methods will increase O&M costs and may require operators with higher
levels of certification.
4. Identify alternatives that will be attractive to LADWP for meeting their
State mandated revegetating projects.
Feasibility Study – Reclaimed Water for Restoration and December 2017 Community Projects in Big Pine, CA
5
During the kickoff meeting a total of 18 various alternatives were preliminarily
identified. Alternatives ranged from the irrigation of a new driving range and
putting green to application for dust control. Many alternatives included the
application of recycled water for the purpose of revegetating various vacant
parcels – especially the vacant parcel located downtown and south of the school
which is commonly referred to as the Bartell Parcel (APN 004-160-05). Other
alternatives included applying recycled water for the production of a Christmas
tree crop and even for growing hops and barley which might be used for brewing.
Each of the proposed projects identified during the kickoff meeting were then
evaluated (ranked on a scale of 1 to 4) according to a set of criteria jointly
developed by ROA and Inyo County, with input from the project stakeholders.
These criteria are listed as follows:
1. The level of treatment required, with lower levels being preferred so as to
reduce costs and O&M requirements.
2. The overall capital (or construction) cost of the system.
3. The pumping distance required to transport recycled water from the
WRRF to the distribution area.
4. Community acceptance.
5. Amount of labor required.
6. Economic potential.
7. Sources of grant funding necessary for implementation.
8. Associated maintenance costs.
9. Location and ownership of parcels identified as potential sites for reuse.
10. Public access restrictions.
After each project had been evaluated per the above criteria, the preliminary
ratings were then distributed to representatives of the County, BPPT, and
BPCSD for review and comment. A subsequent teleconference was then held
with representatives of the County, BPPT, BPCSD, and ROA to further refine the
evaluation criteria for the proposed project alternatives. It was determined then
that any increase in O&M costs were likely untenable for either the BPPT or
BPCSD as both entities are currently understaffed with strict budgets.
A result of that determination was the identification of potential for a “water trade”
with LADWP. There exist at least two potential mechanisms for such a trade –
the first would be to discharge recycled water into the Big Pine canal, and the
second would be to supply recycled water to existing vacant LADWP lands which
are under a state ordered mandate for re-greening. While the first option would
likely require significant upgrades to the BPCSD treatment plant on order to
achieve a surface water discharge permit (primarily requiring nutrient reduction),
the second option would require relatively little improvements or modifications to
the BPCSD treatment plant as irrigation of the vacant land could be
Feasibility Study – Reclaimed Water for Restoration and December 2017 Community Projects in Big Pine, CA
6
accomplished, depending on the type of plant(s) grown and manner of
application, with undisinfected secondary recycled water.
Presently, LADWP values recycled water at an approximate rate of $460-
$575/AF [2]. At 70,000 to 90,000 gallons per day (GPD), the Big Pine
Community Services District (BPCSD) produces on average approximately 78 to
101-acre feet annually (AFA) which may be valued anywhere from $36,000 to
$58,000 using LADWP’s listed prices. While a wholesale agreement between
the community of Big Pine and LADWP may be possible, there may be a higher
economic (and social) value realized by the community of Big Pine if a trade
could be arranged with LADWP in which Big Pine’s recycled water is applied to
an area that LADWP is already obligated to mitigate and, in turn, an equivalent
amount of water from a yet-to-be determined source – e.g. surface water from
the canal or potable water from the BPCSD’s system, would be used to facilitate
one of the other originally identified alternatives. Some of the advantages of this
approach are as follows:
• It potentially reduces the required level of treatment for the recycled water
supplied from BPCSD’s treatment plant. Depending on the manner of
application and type of vegetation grown, it is possible that no additional
treatment or disinfection would be necessary so long as the area is
properly signed and restricted per Title 22.
• It potentially reduces the pumping distance that would otherwise be
required to deliver recycled water to another identified project site. By
using water that is already adjacent to a potential project site the
infrastructure necessary to apply the water may be substantially reduced.
• It potentially reduces the need for additional Operation and Maintenance
requirements. Because both the BPCSD and BPPT identified O&M costs
as a major obstacle for project feasibility, reducing the potential O&M
financial burden improves project feasibility.
• It potentially reduces the capital costs of implementing a recycled water
project. By avoiding and/or reducing treatment costs, pumping cost, and
O&M costs, the overall project cost would likely be reduced.
Presently, it is uncertain if LADWP will find such an agreement to be favorable,
however, assuming that an agreement could be negotiated, several locations and
projects have been identified where the traded water (received from LADWP) can
be placed into beneficial use in the community. During the above referenced
teleconference one option that was discussed was irrigation of the trees and
landscaping near the existing baseball parks, which is presently funded through
the Big Pine School District. Alleviating this cost to the school district was found
to be quite favorable to the representatives of BPPT and BPCSD and would likely
have the support of the broader community as well.
Feasibility Study – Reclaimed Water for Restoration and December 2017 Community Projects in Big Pine, CA
7
A second public meeting was held with the project stakeholders on August 29,
2017. During the second public meeting, a revised decision matrix which
included eight (8) identified high-scoring alternatives was reviewed and
discussed. These high-scoring projects were selected from the original 18
potential projects previously identified during the Project’s first public meeting.
Stakeholders present included representatives of the public, BPPT, the Big Pine
School District (BPSD), BPCSD, Inyo County, and ROA. Of the identified high-
scoring projects, the stakeholders present came to the consensus that the
application of recycled water to vacant lands presently held by Los Angeles
Department of Water and Power (LADWP) for the restoration of native vegetation
would be the most valuable and cost-effective alternative. This alternative is
evaluated in detail in section 5.
It should be noted, however, that this alternative was not without some
expressed controversy during the second public meeting. Some of the
stakeholders present expressed concern that the alternative appeared to be
providing aid to LADWP to accomplish what is already a state ordered mandate
for native revegetation that, to date, has not been successfully implemented.
Therefore, without the option of a water trade for applying water to beneficial use
at one of the other identified alternatives, this project may ultimately be found
infeasible.
3 Findings: Existing Conditions, Site Investigations
3.1 Existing Sewage Flow Rates
Sanitary sewage collected from within the town of Big Pine is transported to the
headworks of the District’s WRRF. Flow measurements from the town of Big
Pine are not measured regularly at the WRRF, however, previous measurements
were conducted in 2011 by R.O. Anderson and KASL Engineering Consultants
for a Preliminary Engineering Report provided to the BPCSD. It was determined
from those previous measurements that the average daily flow (ADF) entering
the plant was approximately 80,000 gallons per day (GPD) or 0.07 million gallons
per day (MGD) with maximum monthly flows reaching upwards of approximately
140,000 GPD or 0.14 MGD [3]. Figure 1 below shows the distribution of average
and peak monthly flow throughout the year, flows occurring during the growing
season are represented with colored lines. These flow values were verified with
field measurements, pressure transducers, and open channel flow hydraulics
analysis during the previous 2011 study.
Feasibility Study – Reclaimed Water for Restoration and December 2017 Community Projects in Big Pine, CA
8
Figure 1: Big Pine Community Services District - Average Daily Flow & Average Peak
Flow between 2007 and 2009
3.2 Existing Treatment Facilities
There are presently two separate WRRFs that treat municipal wastewater adjacent to
the project area, viz. the Big Pine Community Service District WRRF and the Big Pine
Paiute Tribe WRRF. Each facility is responsible for collecting, treating, and disposing of
the wastewater generated within their respective districts and maintaining compliance
with the Waste Discharge Requirements (WDR) issued through LRWQB. These two
facilities are the only reasonable sources of recycled water for the project at this time,
and each WRRF is described in detail below.
3.2.A BPCSD WRRF
The BPCSD WRRF is located on a parcel of land leased from LADWP
(APN 018-090-19) located down gradient and approximately 1-mile
northeast of town as illustrated on Figure 2. The WRRF was constructed
in the early 1970’s and underwent several operational changes in the
years following. The original operation of the WRRF directed effluent
from an oxidation ditch into a secondary clarifier before reporting to the
oxidation ponds (arranged in parallel). Due to operational difficulties, the
Feasibility Study – Reclaimed Water for Restoration and December 2017 Community Projects in Big Pine, CA
9
clarifier was temporarily removed from service and the oxidation ponds
were operationally rearranged into a series configuration. The clarifier
was recently reinstated per recommendations included with the KASL
Preliminary Engineering Report [3].
The WRRF facility is shown in Figure 3. Flows enter the facility via a 15-
inch diameter gravity sewer main. A manually cleaned bar screen
removes large debris before directing flow by gravity to the oxidation
ditch. The ditch has a water surface area of 6,274 square feet and a
volume of 22,145 cubic feet, resulting in 56.8-hour (2.4 Day) detention
time under average daily flow conditions. Flow is then routed into a
secondary clarifier, which has a diameter of 20 feet and a depth of eight
feet. Flow is detained for a minimum of 3 hours while solids are allowed to
settle.
From the secondary clarifier, effluent flows to the first of a series of two
oxidation ponds. The ponds are operated in series with effluent from
pond #1 discharging into pond #2. Each pond provides a surface area of
37,560 square feet and a volume of 168,940 cubic feet. For average
daily flow, the detention time of each pond is approximately 18 days (36
days total). Four 5-hp aspirating aerators have been installed in each
oxidation pond to promote additional aeration and effluent polishing prior
to disposal.
Secondary effluent is then discharged to a percolation system that
consists of four percolation beds configured in a manner so that only a
single bed operates at a given time in order to allow consistent
distribution between all four beds. Each bed has a surface area of
approximately 19,000 to 20,000 square feet. Beds #1 and #2 have an
effective depth of approximately 3.75 feet while beds #3 and #4 have an
approximate depth of 2.75 feet. Effluent is allowed to percolate through
the beds at an estimated rate of 38.2 feet per year, with subterranean
flow in an easterly direction where it ultimately re-enters the groundwater
system.
Some consideration must be given as to whether the treated water
percolating into the groundwater system from the percolation beds acts
as a significant source of irrigation for plant growth adjacent to and east of
the WRRF, as this water will no longer be available to the percolation
beds on a daily basis if applied to beneficial use elsewhere. Aerial
imagery shows that vegetation presently exists around the WRRF, with
an approximate area of about 35 acres. Based upon this same aerial
imagery the vegetation appears to be oriented in an easterly by
Feasibility Study – Reclaimed Water for Restoration and December 2017 Community Projects in Big Pine, CA
10
northeasterly direction, generally following the site topography which
slopes east towards the Owens River.
There are two streams present that supply a perennial source of water
from the Big Pine Cannel. These two streams originate approximately
1,000 feet west of the WRRF and convey water via open channel flow
eastward. The northern stream approaches the northwest corner of the
WRRF before diverting north around the facility and parallel to the
southern edge of Highway 168. The southern stream runs parallel to the
south end of the WRRF. Established plant growth is evident along the
entire lengths of each channel, while additional growth appears to be
promoted by surface water originating from the channels and flowing west
to east. These two streams appear to be the primary source of water
sustaining the existing vegetation. The orientation, extent, and density of
vegetation appear similar to other locations in the valley near Big Pine
where perennial drainage is present.
The estimated capacity of the percolation beds is 176,000 gallons or 0.54
acre-feet per day [3]. This percolation rate, which is more than twice the
average daily flow at the WRRF, is likely due to a fast draining alluvium
that is expected to be present below the percolation beds. Given the high
percolation rate, it is unlikely that the current method of treated
wastewater disposal is acting as a significant source of water for
surrounding plant growth. If required, a shallow groundwater analysis for
source nutrients like nitrates could be performed downgradient of the
percolation beds to determine if they are, in fact, contributing to the
existing vegetation. Because of the expected groundwater gradient
towards the Owens River (similar to the existing topography), if these
beds are actually sustaining local plant growth adjacent to the WRRF the
extent is probably far less than the 35± acres of existing plant growth, as
much of the vegetal cover (approx. 14 acres) is located upgradient of the
percolation beds.
The District’s current Waste Discharge Requirements (WDR) permits
treatment and disposal of up to 150,000 GPD (0.15 MGD) average dry
weather flow (ADWF). Lahontan Board Order No. 6-95-35, issued to
BPCSD in 1995, is included in Appendix 1 of this Study.
AutoCAD SHX Text
N MAIN ST
AutoCAD SHX Text
U.S. HWY 395
AutoCAD SHX Text
U.S. HWY 395
AutoCAD SHX Text
SR 168
AutoCAD SHX Text
COUNTY RD
AutoCAD SHX Text
LOCUST ST
AutoCAD SHX Text
W CROCKER AVE
AutoCAD SHX Text
DEWEY ST
AutoCAD SHX Text
CHESTNUT ST
AutoCAD SHX Text
WALNUT ST
AutoCAD SHX Text
BLAKE ST
AutoCAD SHX Text
BARTELL RD
AutoCAD SHX Text
HALL ST
AutoCAD SHX Text
FLOWER ALLEY
AutoCAD SHX Text
BAKER CREEK RD
AutoCAD SHX Text
N SCHOOL ST
AutoCAD SHX Text
SCHOOL ST
AutoCAD SHX Text
PINON ST
AutoCAD SHX Text
WEST ST
AutoCAD SHX Text
CORNELL ST
AutoCAD SHX Text
POPLAR ST
AutoCAD SHX Text
CENTER ST
AutoCAD SHX Text
HOME ST
AutoCAD SHX Text
WASHINGTON PARK
AutoCAD SHX Text
CROCKER AVE
AutoCAD SHX Text
PINE ST
AutoCAD SHX Text
CALLINA ST
AutoCAD SHX Text
CRATER ST
AutoCAD SHX Text
RICHARDS ST
AutoCAD SHX Text
BAKER LN
AutoCAD SHX Text
PIPER ST
AutoCAD SHX Text
BOWERS ST
AutoCAD SHX Text
HILL ST
AutoCAD SHX Text
PROJECT BOUNDARY
AutoCAD SHX Text
BPPT TREATMENT PLANT
AutoCAD SHX Text
BIG PINE WASTEWATER TREATMENT PLANT
AutoCAD SHX Text
W
AutoCAD SHX Text
LADWP APN 018-090-19
AutoCAD SHX Text
Y:\Client Files\2521\2521-001\CAD\Engineering\Exhibits\2521-001_Fig1_LocationMap.dwg 11/22/2017 12:02:32 PM Eric Kao 11/22/2017 12:02:32 PM Eric Kao11/22/2017 12:02:32 PM Eric Kao Eric KaoEric Kao
AutoCAD SHX Text
1603 ESMERALDA AVENUE / POST OFFICE BOX 2229
AutoCAD SHX Text
PHONE: (775) 782-2322 / FAX: (775) 782-7084
AutoCAD SHX Text
MINDEN, NEVADA 89423
AutoCAD SHX Text
WEB SITE: WWW.ROANDERSON.COM
AutoCAD SHX Text
FIGURE 2
AutoCAD SHX Text
LOCATION MAP
AutoCAD SHX Text
FEASIBILITY STUDY - BIG PINE
AutoCAD SHX Text
2521-001
AutoCAD SHX Text
11/22/17
AutoCAD SHX Text
BERM
AutoCAD SHX Text
BERM
AutoCAD SHX Text
BERM
AutoCAD SHX Text
OXIDATION POND
AutoCAD SHX Text
OXIDATION POND
AutoCAD SHX Text
BERM
AutoCAD SHX Text
PERCO- LATION BED
AutoCAD SHX Text
OXIDATION DITCH
AutoCAD SHX Text
SLUDGE BEDS
AutoCAD SHX Text
CONTROL BUILDING
AutoCAD SHX Text
CLARIFIER
AutoCAD SHX Text
FLOW METER
AutoCAD SHX Text
HEADWORKS/ COMMINUTOR
AutoCAD SHX Text
PERCO- LATION BED
AutoCAD SHX Text
PERCO- LATION BED
AutoCAD SHX Text
PERCO- LATION BED
AutoCAD SHX Text
15" VCP INFLUENT SEWER MAIN
AutoCAD SHX Text
W
AutoCAD SHX Text
Y:\Client Files\2521\2521-001\CAD\Engineering\Exhibits\2521-001_Fig1_LocationMap.dwg 11/22/2017 11:54:53 AM Eric Kao 11/22/2017 11:54:53 AM Eric Kao11/22/2017 11:54:53 AM Eric Kao Eric KaoEric Kao
AutoCAD SHX Text
1603 ESMERALDA AVENUE / POST OFFICE BOX 2229
AutoCAD SHX Text
PHONE: (775) 782-2322 / FAX: (775) 782-7084
AutoCAD SHX Text
MINDEN, NEVADA 89423
AutoCAD SHX Text
WEB SITE: WWW.ROANDERSON.COM
AutoCAD SHX Text
FIGURE 3
AutoCAD SHX Text
EXISTING WRRF SITE
AutoCAD SHX Text
FEASIBILITY STUDY - BIG PINE
AutoCAD SHX Text
2521-001
AutoCAD SHX Text
11/22/17
AutoCAD SHX Text
NOT TO SCALE
Feasibility Study – Reclaimed Water for Restoration and December 2017 Community Projects in Big Pine, CA
13
• The only authorized disposal site currently allowed are the four
evaporation/percolation ponds.
• The BOD of the effluent shall have a mean of 30 mg/L and a
maximum of 45 mg/L.
• The pH of the effluent shall have a pH not less than 6 pH units and no
more than 9 pH units.
• The effluent shall have a dissolved oxygen concentration of not less
than 1.0 mg/L.
• The Operator of the facility shall have the appropriate grade of
certification in accordance with the Regulations for Wastewater
Treatment Plant Operator Certification and Plant Classification, Title
23 CCR, Division 4, Chapter 14, Section 3670 et.seq. It is noted that
the appropriate grade is not determined by Lahontan but rather by the
Office of Operator Certification.
The WRRF is presently operated by Mr. Frank Carr who holds the
appropriate Grade III Operators Certification. The CSD’s facilities are
maintained under contract by McMurtrie-Tanksley, Inc. Compliance
sampling is collected by the McMurtrie-Tanksley and sent to outside
certified laboratories by express delivery for analysis.
3.2.B BPPT WRRF
The BPPT WRRF is located on a parcel of land owned by the BPPT (APN
018-090-20) located down gradient and approximately 1-mile east of
town, and south of the District’s WRRF. The WRRF consists of two lined
evaporation ponds which handle approximately 20,000 GPD of domestic
wastewater produced from residential areas on tribal land. The beds are
periodically drained to allow removal of sludge that has settled and
collected at the bottom. The BPPT WRRF also includes two percolation
beds, however these beds are not in use at this time. The evaporation
ponds provide primary treatment for the BPPT, however, in order for
treated water to be used as recycled water, a minimum level of secondary
treatment (oxidation system) would need to be implemented.
The most cost-effective method of secondary treatment would likely be to
install an aeration system within each evaporation pond however, this
option would require a sizable increase in plant operation and
maintenance, which is currently outside of the operational budget for the
WRRF. Therefore, the Tribe’s effluent is not eligible for reuse
applications at this time. Should secondary treatment become feasible
for the BPPT at a later date, additional LADWP lands (separate from the
area discussed in this study) have been identified for revegetating which
Feasibility Study – Reclaimed Water for Restoration and December 2017 Community Projects in Big Pine, CA
14
could potentially be utilized by the additional recycled water from the
BPPT.
3.3 Existing Effluent Quality
The effluent quality of the water discharging from the secondary clarifier is unknown at
this time, as no periodic sampling is conducted at this stage of treatment. Consequently,
there are no available measurements of the nitrogen removed through the disposal
process in the evaporation / percolation ponds. Nitrate sample results from the
monitoring wells located east and west of the WRRF are not presently available,
although the CSD reports that the monitoring wells show no significant nitrogen [4]. Due
to the rapid infiltration rates and long wet-dry cycles of typical use, it is expected that
approximately 20% to 30% of the nitrogen is removed through the evaporation /
percolation ponds [5].
It will be necessary to conduct sampling of the effluent and the monitoring wells prior to
submittal of the final design, and this will be accomplished through the Groundwater
Non-Degradation Analysis which is discussed in greater detail below. High priority
parameters will include Ammonia or TKN, Nitrates and groundwater depth. For the
purposes of this study, lab results of primary effluent samples taken from the Lone Pine
WRRF were utilized and they are included in Table 1 below. These results were
determined for a similar recycled water feasibility study conducted for Lone Pine by ROA
previously. It was assumed that these results are representative of Big Pine as both
facilities treat domestic wastewater with similar characteristics.
Feasibility Study – Reclaimed Water for Restoration and December 2017 Community Projects in Big Pine, CA
15
Table 1: Lone Pine Effluent Quality
Test Location
Sample
Date Tested Parameter Test Method Result RDL Units
Lone Pine Effluent 1/26/2012 Dissolved Ammonia, as Nitrogen SM 4500 NH3 D 19 1.2 mg/L
Lone Pine Effluent 1/26/2012 Ammonia, as Nitrogen SM 4500 NH3 D 19 1.2 mg/L
Lone Pine Effluent 1/26/2012 Total Suspended Solids (TSS) SM 2540D 53 10 mg/L
Lone Pine Effluent 1/26/2012 Bicarbonate (HCO3) SM 2320B 260 1.0 mg/L
Lone Pine Effluent 1/26/2012 Carbonate (CO3) SM 2320B <1.0 1.0 mg/L
Lone Pine Effluent 1/26/2012 Hydroxide (OH) SM 2320B <1.0 1.0 mg/L
Lone Pine Effluent 1/26/2012 Total Alkalinity SM 2320B 220 1.0mg/L as
Lone Pine Effluent 11/15/2011 pH SM 4500H+ B 7.5 1.0 pH
Lone Pine Effluent 11/15/2011 Disolved BOD SM 5210B ND 20 mg/L
Lone Pine Effluent 11/15/2011 MBAS SM 5540C 0.36 0.20 mg/L
Lone Pine Effluent 1/26/2012 Particle Size Distribution
high
diameter
(um) %
high
diameter
(um) %
1000 0.000 16 14.640
707 0.000 11 1.281
500 0.000 7.8 3.422
354 0.110 5.5 3.173
250 0.615 3.9 1.250
177 0.690 2.8 1.091
125 0.196 2 1.019
88 0.002 1.4 1.294
63 0.342 1 0.208
44 9.734 0.69 0.000
31 29.993 0.49 0.000
22 30.951 0.35 0.000
0.24 0.000
Monitoring Well North 11/15/2011 Nitrate as N EPA 300.0 ND 0.20 mg/L
Monitoring Well North 11/15/2011 Semivolatile Organic Compounds (Combined) EPA 625 ND
Monitoring Well North 11/15/2011 Volatile Organic Compounds (Combined) EPA 624 ND
Monitoring Well East 11/15/2011 Nitrate as N EPA 300.0 ND 0.20 mg/L
Monitoring Well East 11/15/2011 Semivolatile Organic Compounds (Combined) EPA 625 ND
Monitoring Well East 11/15/2011 Volatile Organic Compounds (Combined) EPA 624 ND
Feasibility Study – Reclaimed Water for Restoration and December 2017 Community Projects in Big Pine, CA
16
3.4 Amount of Water Available for Reuse
The amount of water available for reuse is the average daily discharge from the
WRRF, which is the inflow to the WRRF minus the net losses in the WRRF.
These losses include evaporation from all exposed surface water and infiltration
occurring within the percolation beds. Some additional losses may occur due to
seepage within the lined oxidation ponds and overtopping during high flow
events, however such events occur rarely and, for the purposes of this report,
may be considered negligible. The estimated pan evaporation for the Owens
Valley area is 70 inches per year, while the average annual rainfall is reported at
4.6 inches per year [6]. This results in an annual pan evaporation of 65 inches.
Assuming actual pond evaporation is 90% of pan evaporation, the net annual
combined evaporation of the percolation ponds, oxidation ditch and oxidation
ponds is estimated to be 10,000 gallons per day. It is important to note that the
net annual combined evaporation will be less than the stated 10,000 GPD for the
recommended alternative included with this study, as the recycled water will be
drawn directly drawn from the oxidation pond prior to disposal in the percolation
ponds (effectively reducing the available surface area for evaporation).
The percolation beds are operated in a cycle; one bed is loaded until the liquid
level is approximately 1 foot below the interconnection piping. The effluent is
then directed to the next bed while the previous bed’s volume infiltrates.
Operators report that beds 1, 2 and 4 are loaded 62.5% annually, while bed 3 is
loaded 57.1% annually [3]. Based on this information the infiltration capacity is
estimated to be 149,000 gallons per day, assuming the annual average flow
remains at 71,000 gallons per day.
It is worth noting that the amount of effluent available for use after the oxidation
ponds is somewhat reduced due to evaporation and a greater quantity of effluent
could, therefore, be recovered if flow was diverted directly from the secondary
clarifier prior to entering the oxidation ponds. Additionally, for irrigation activities
occurring during the months of April through September, a higher average daily
flow of 80,000 GPD is potentially available (Figure 4) based on the average daily
flow as discussed in Section 3.1 above.
Feasibility Study – Reclaimed Water for Restoration and December 2017 Community Projects in Big Pine, CA
17
Figure 4: Big Pine Community Services District - Daily Flow for April Through
September
3.5 Geology, Hydrogeology, and Soils
Big Pine is located on the valley floor of the Owens Valley at an elevation of
approximately 3,989 feet. The valley fill consists of unconsolidated to moderately
consolidated detritus eroded from the surrounding bedrock mountains in excess
of 1,000 feet deep [7].The principle source of replenishment for groundwater in
the Owens Valley is percolation of stream flow from the surrounding mountains.
Lesser sources of recharge include infiltration of excess irrigation waters and
precipitation. Groundwater quality is generally sufficient to meet drinking water
standards. Groundwater upgradient of Big Pine has a typical nitrate
concentration of 0.5 mg/L [8].
The area is included in the Owens Valley Groundwater Basin (6-12) of the South
Lahontan Region. Beneficial uses of groundwater include: municipal and
domestic supply; agricultural supply; industrial service supply; freshwater
replenishment; and wildlife habitat. Groundwater flow in the area is generally
from west to east following the surface topography. The depth to groundwater
varies over the area; the nearest USGS groundwater monitoring well is located
±2300 feet southwest of the WRRF and reports an average depth of
approximately 24 feet [8], while LADWP has a groundwater monitoring well
Feasibility Study – Reclaimed Water for Restoration and December 2017 Community Projects in Big Pine, CA
18
(T572) situated about 300 feet north of the BPCSD WRRF that reports
groundwater levels of 10 to 15 feet below ground surface, on average [9]. Two
regulatory monitoring wells are in place adjacent to the WRRF. Well #1 is
located upgradient of the WRRF (40 feet west of the WRRF northeast fence
corner) and Well #2 is located downgradient (40 feet east of the WRRF eastern
fence). The average groundwater depth is 14 feet for the upgradient well and 12
feet for the downgradient well [3].
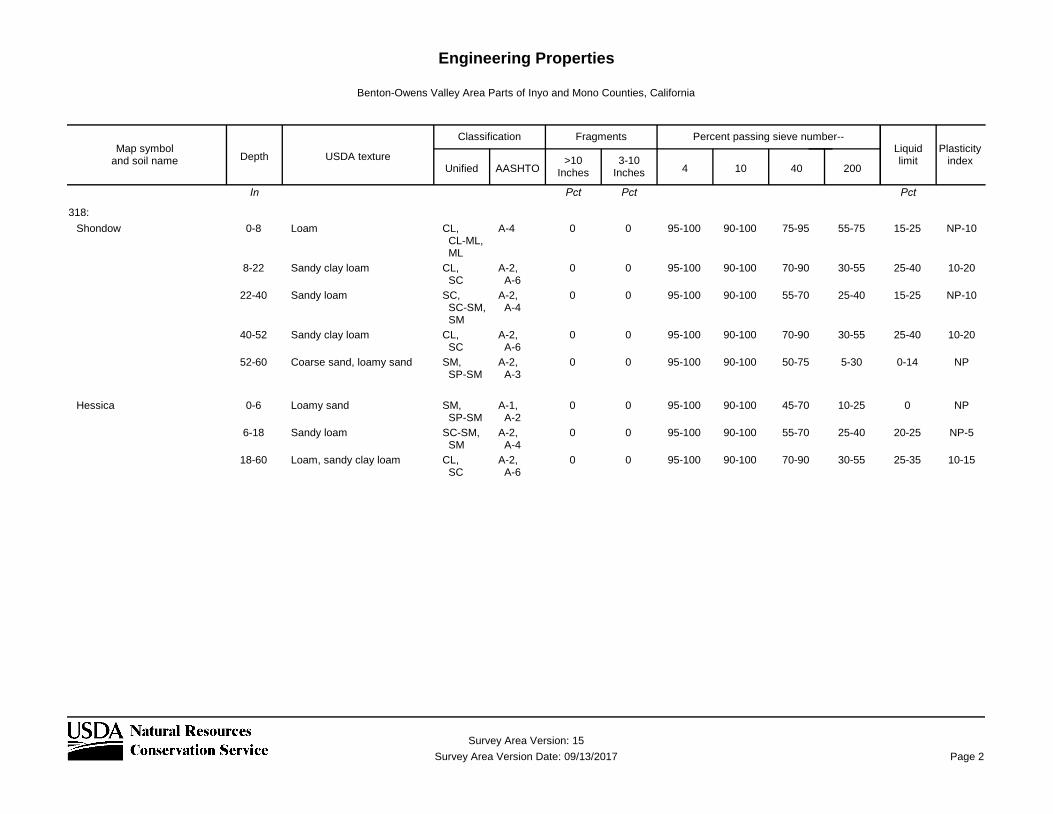
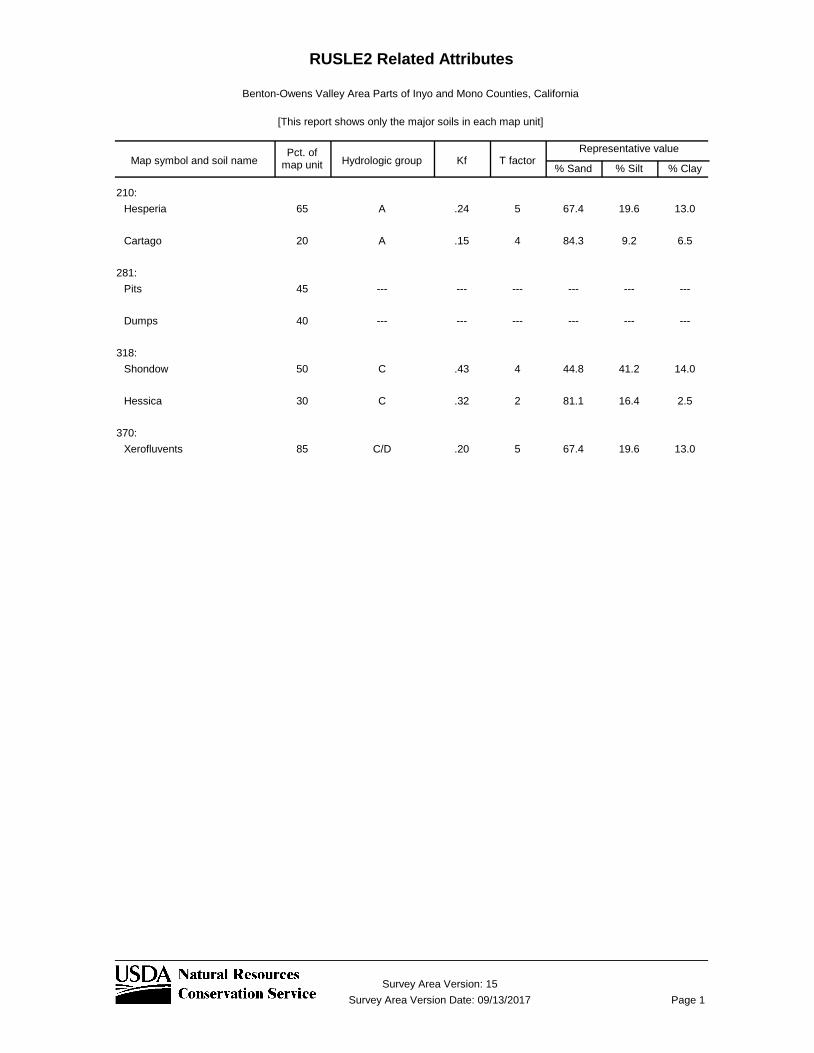
Soils in the area have been classified and their properties cataloged by the
Natural Resource Conservation Service (NRCS). Included in Appendix 2 is an
NRCS Custom Soil Report for soils in the vicinity of potential reuse areas. The
selected alternative for this feasibility study had identified up to 160± acres of
existing vacant LADWP lands south of the BPCSD and BPPT treatment plants as
being the preferred location for irrigation applications of reuse water. From
general field investigations the properties of the surface soils in the NRCS Report
appear reasonable for the identified manner of application except as discussed
later in this section. The soils in this area are a combination of Hesperia (65%)
and Cartago (20%), the typical soil profiles for these soils are included in
Appendix 2.
Several methods of irrigation and wastewater disposal have been identified by
USDA as being favorable for the soil conditions present in this area, including
disposal by irrigation and slow rate treatment of wastewater2. USDA has also
identified micro-irrigation (including both above ground and subsurface drip) as a
viable method of distribution for the soil available within the area of distribution.
The water holding capacity is approximately 0.13 in/in [10]. This capacity implies
that the soil will release water faster than may be desirable, however this can be
overcome by more frequent irrigation with lesser amounts of water which will
promote saturation throughout the day so that the water is more available to
plants prior to percolation below the root zone.
3.6 Reuse Irrigation Criterion
In order to conserve water and avoid overirrigation that could potentially promote
nutrients (e.g. nitrogen) being carried to the aquifer and causing degradation of
the groundwater, it is imperative that effluent irrigation be properly designed and
managed. Proper irrigation applies the calculated amount of water needed to
meet the evapotranspiration (ET) rates of the plants while also providing
2 Slow rate treatment of wastewater is defined as a process in which wastewater is applied to land at a rate
normally between 0.5 inch and 4.0 inches per week. The applied wastewater is treated as it moves through the
soil. Much of the treated water may percolate to the ground water, and some enters the atmosphere through
evapotranspiration. The applied water generally is not allowed to run off the surface.
Feasibility Study – Reclaimed Water for Restoration and December 2017 Community Projects in Big Pine, CA
19
sufficient additional water necessary to leach accumulated salts as well as to
account for the inefficiency of the application of water, such as uneven
distribution of water and evaporation of exposed surface water that has not yet
permeated the soil or water that volatilizes when sprayed above crops.
For this feasibility study, only subsurface drip irrigation of native plant species is
considered as irrigation was the preferred alternative identified during the public
outreach process. Subsurface drip was selected over spray irrigation based on
several factors. The primary consideration was the efficiency of SDI over other
forms of irrigation such as spray and flood methods. Drip irrigation applies
controlled quantities of water to areas where seeds have been planted, resulting
in irrigation of the only the areas intended for plant growth. Significantly less
water will be lost to evaporation, and as the water amount is controlled, plant
roots will be able to absorb and utilize more water before it is lost through
percolation into deeper soil. Additionally, spray irrigation would require higher
levels of treatment under Title 22, as the spray of water has a higher chance of
impacting public health during windy conditions. Flood irrigation would not
require any additional treatment; however, this method would be inefficient due to
evaporation losses and uneven distribution, as well as the potential to
significantly disturb the uniformity of the top soil.
Daily ET rates for grass species have been preliminarily determined by using
information available from CIMIS Station 35 located in Bishop California. Climate
data is provided in Table 2, ET data has been summed and averaged for each
month for the period of December 2016 through November 2017 and is
presented on Figure 5. The annual average total ET is approximately 58 inches
per year with approximately 42 inches of ET occurring within the growing season
between April 1st and September 30th [11].
The leaching requirements will depend upon the salinity tolerance of the selected
native vegetation to be planted as well as the salinity of the effluent [12]. For the
purposes of this study, a turf or pasture of perennial ryegrass with a salinity
tolerance of 6 mmho/cm was assumed, along with an average irrigation
efficiency of 90% for subsurface drip irrigation. A list of potential species for
revegetation as provided by Inyo County is shown on Table 3 below. The actual
salinity tolerance and water requirements for the plants to be selected will need
to be determined prior to final design.
The Desert Research Institute (DRI) was contacted to provide comment
regarding the irrigation requirements for native plant species listed in Table 3,
which are likely to be considered for this project. DRI provided the following
comment: “These native plants live off of precipitation with the aid of some shallow groundwater, but usually depth to water is 5-30 ft so that the ET is only a few to 12 inches more than precipitation” [13]. Although this response is valid for
Feasibility Study – Reclaimed Water for Restoration and December 2017 Community Projects in Big Pine, CA
20
the majority of the relevant plant species in Table 3, the parcel of land in question
has shown that revegetation has not yet occurred naturally with available
amounts of precipitation, therefore an alternative source of water is likely
necessary in order to promote consistent growth of native species. Evaluation of
a potential water source for this project was similarly listed as a necessary action
in a recent draft of the site mitigation plan [14].
Once the revegetation has been established and the plant root zone is in contact
with the existing groundwater it is expected that precipitation will be sufficient to
sustain the target native ground cover of eight (8) percent [14] although this may
take up to 40 years to accomplish. More recent ET estimates were completed in
2006 through combined data prepared by USGS and Steinwald, et al, for native
vegetation decoupled from the water table [15]. These ET estimates indicate that
the actual water demand for establishing 8% native vegetation via drip irrigation
may be substantially less than those discussed above and in Figure 5 below, due
in part to the increased efficiency of drip irrigation over natural processes.
However, this will need to be confirmed during final design.
Figure 5: Monthly Evapotranspiration Rates
Feasibility Study – Reclaimed Water for Restoration and December 2017 Community Projects in Big Pine, CA
21
Table 2: Climate Data for CIMIS Bishop Station 35
Month Year
De
c-1
6
Jan
-17
Feb
-17
Mar
-17
Ap
r-1
7
May
-17
Jun
-17
Jul-
17
Au
g-1
7
Sep
-17
Oct
-17
No
v-1
7
An
nu
al T
ots
/Avg
s
Gro
win
g Se
aso
n
Tots
/Avg
s
Total ET (in) 1.76 1.49 2.12 4.79 6.14 7.18 8.18 8.1 6.87 5.32 3.99 2.5 58.4 41.79
3.7 Recycled Water: Reuse Regulations and Requirements
Recycled water is promoted within the State of California and its regulatory
agencies including the California Department of Public Health (CDPH) and the
Lahontan Regional Water Quality Control Board (LRWQCB). However, for public
health and safety, as well as the protection of the natural environment, the
requirements for application of recycled water are quite rigorous. Approval from
Inyo County (including Inyo County Environmental Health and Inyo County
Building Department) CDPH, and the LRWQCB will be required. Inyo County will
review the proposed design and provide comments on the environmental
document as well as a review of plans to ensure applicable environmental
considerations as well as building, plumbing and electrical codes are met. These
reviews will come in subsequent phases of the project. Approval requirements
from the CDPH and the LRWQCB are discussed in further detail below.
The application frequency depends upon the water holding capacity of the soil as
well as the plant crop and will be determined at the time of final design when
specific information regarding the irrigation system and reuse area are more fully
known. Preliminarily, it is expected that the entire volume of available reuse
water (approx. 80,000 GPD or 0.25 AF-day during the irrigation season) will be
routed to the irrigation system on a daily basis. If irrigation operations are halted,
either for routine maintenance or a system failure, it is anticipated that there will
be minimal to no impact on plant vitality as the native species proposed for this
project are expected to be well adjusted to arid desert environments. These
plants should be capable of enduring short periods of no irrigation. If shutdowns
lasting longer than a couple days are experienced, it may be necessary to supply
water from an alternate source like the Big Pine Canal. This is discussed in
greater detail in Section 5.2.
Feasibility Study – Reclaimed Water for Restoration and December 2017 Community Projects in Big Pine, CA
24
3.8 Lahontan RWQCB Regulations and Requirements
The LRWQCB regulates ground and surface waters in the region and especially
the discharges to these waters including the existing Big Pine WRRF that
discharges treated effluent to groundwater via percolation. The primary
mechanism of regulation is through establishment of Waste Discharge
Requirements (WDR) like those in place for the WRRF that are included in
Appendix 1. There are both initial fees and annual fees associated with WDR.
In addition to issuing the WDR, LRWQCB will be the reviewing agency for the
future Environmental Permitting and Documentation and will ensure CEQA
compliance. Lahontan only issues WDR once the facilities are in place that would
produce the discharge. Lahontan is required to include in their WDR the
requirements of the CDPH. Therefore, the application for waste discharge
requirements will be made after the Environmental Review is complete, final
improvement plans and specifications are prepared, and CDPH has reviewed
and approved the engineering report for the production, distribution, and use of
recycled water.
It is noted that the existing WDR for the District does not allow reuse and
therefore effluent reuse will require a new WDR for the District. It is anticipated
that the current WDR will be updated to allow discharge to another entity besides
the current permitted discharge to percolation ponds. At the same time the other,
yet to be determined entity (presumably LADWP), will obtain a separate set of
WDR for effluent reuse. There are several examples of this two-party WDR
scheme within the Lahontan Region.
In either updating WDR or issuing new WDR to a new entity, Lahontan will
ensure that the requirements reflect current regulations and policies. It is noted
that the District’s WDR were last updated in 1995 and it is recommended that the
proposed reuse be submitted to Lahontan for discussion of potential WDR
changes and requirements before proceeding further with the project.
It is expected that Lahontan will enforce the requirement of making findings to
support any discharge to groundwater that is of lesser quality than the receiving
water through a Groundwater Non-Degradation Analysis. Nitrogen is of primary
concern in this study. From the limited data available, it is expected that the
receiving water (groundwater) has concentrations of nitrogen that are less than
0.5 mg/L. From recent sampling it was found that Nitrate Nitrogen loading in the
effluent from the CBP WRRF is approximately 2.6 mg/L [3]. However, other
constituents, especially ammonia, need to be characterized in the effluent as
well. At the time of this study, current effluent samples were not available for
review. Therefore, findings must be made to support allowing the existing WRRF
discharge to continue. Similar findings must also be made to allow the proposed
Feasibility Study – Reclaimed Water for Restoration and December 2017 Community Projects in Big Pine, CA
25
new reuse. This analysis will also be required in order to ensure that the project
meets all applicable CEQA requirements.
The findings must be in accordance with the Non-Degradation Objective as
stated in the Basin Plan: “the existing high quality shall be maintained until or
unless it has been demonstrated to the State that any change in water quality will
be consistent with the maximum benefit of the people of the State, and will not
unreasonably affect present and probable future beneficial uses of such water.
Therefore, unless these conditions are met, background water quality
concentrations (the concentrations of substances in natural waters which are
unaffected by waste management practices or contamination incidents) are
appropriate water quality goals to be maintained. If it is determined that some
degradation is in the best interest of the people of California, some increase in
pollutant level may be appropriate. However, in no case may such increases
cause adverse impacts to existing or probable future beneficial uses of waters of
the State” [16]
This project will have an overall benefit to groundwater because the reuse of
effluent will most probably remove more nitrogen than the existing method of
disposal by percolation through the proposed agronomic reuptake of nutrients
through irrigation. However, it is unknown if Lahontan will determine that this step
towards reducing nitrogen is sufficient to allow the proposed manner of reuse.
Communication with Lahontan and the eventual application for new and revised
WDRs will determine the actual findings and Waste Discharge Requirements.
The following is a list of anticipated satisfactory and unsatisfactory responses
that Lahontan may provide regarding key elements of the proposal:
• Economics and the economic impact to the area of providing additional
nitrogen removal.
Satisfactory Response: The community of Big Pine is disadvantaged
and additional nitrogen removal beyond what is proposed would be an
economic hardship.
Unsatisfactory Response: Sewer rates within Big Pine are reasonable
and the Community can afford additional nitrogen removal above what is
proposed.
• The technical feasibility of additional nitrogen removal.
Satisfactory Response: The proposed summer reuse satisfactorily
achieves common methods of nitrogen removal and given the existing
treatment works and winter climate additional nitrogen removal prior to
disposal through the evaporation / percolation ponds is not reasonably
technically feasible.
Unsatisfactory Response: Modifications of the WRRF are, although
difficult and expensive, technically feasible to achieve much greater
Feasibility Study – Reclaimed Water for Restoration and December 2017 Community Projects in Big Pine, CA
26
nitrogen removal in the winter and an increased removal in the summer
(over reuse alone).
• The potential adverse impacts to groundwater and surface water of not
providing additional nitrogen removal.
Satisfactory Response: The existing groundwater monitoring wells show
no significant nitrogen increases and the proposed reuse will only lessen
this impact, if any.
Unsatisfactory Response: Even though the monitoring wells show no
significant increase it is believed that the effluent reaching groundwater is
degrading the groundwater.
The future WDR for the reuse may include the following.
• Monthly and/or quarterly analysis of the applied water for chemical
constituents during the period of reuse. These are in addition to the analysis
required by the existing WDR of the District.
• Depending upon the method of reuse up to daily analysis of bacteria and
pathogens during the period the effluent is used (not anticipated for the
proposed manner of application via subsurface drip).
• Depending upon the method of reuse up to continuous monitoring of chlorine
residual and turbidity during the period of reuse (not anticipated as
disinfection is not being proposed).
• Up to several groundwater monitoring wells sampled on an up to quarterly
basis for chemical constituents.
• Fencing and/or posting of the reuse sites.
• Flow reporting.
• Possible additional reporting requirements that estimate the nitrogen and
hydraulic loading as well as nitrogen uptake of the reuse.
3.9 CDPH Regulations and Requirements
The California Department of Public Health (San Bernardino Office for the Big
Pine area) regulates public health concerns with respect to effluent reuse. They
follow the Water Recycling Criteria as contained in Sections 60301 through
60355, inclusive, of the California Code of Regulations, Title 22 and require an
engineering report for the production, distribution and use of recycled water.
There are review fees assessed by CDPH for the review of the report. This report
will be prepared as part of the final engineering design but for this feasibility
study it is important that the proposed reuse follow the criterion. There are
different criterion depending upon the manner of reuse and exposure to the
public. A summary of the criterion is presented in Table 4.
Feasibility Study – Reclaimed Water for Restoration and December 2017 Community Projects in Big Pine, CA
27
Table 4 Matrix Summary of Reuse Regulations
Undisinfected
secondary
Disinfected
secondary - 23
Disinfected
secondary – 2.2
Disinfected
tertiary -2.2
Additional
Treatment of
Existing
Effluent
No additional
treatment
Chlorination and
daily coliform
bacteria testing
Chlorination and
daily coliform
bacteria testing
Filtered,
Chlorinated and
daily coliform
bacteria testing
w/continuous
turbidity
monitoring
Irrigation
Uses
No food crops, no
milking animals
allowed
No food crops but
milking animals ok
Above ground food
crops ok if no
sprinkler irrigation
All uses, posting
required
Access
Restrictions
No public access
within 14 days after
irrigation, no school
yards, or parks.
Only flood irrigation
or drip, no spray
irrigation.
Controlled Public
access ok,
including
cemeteries and
golf courses. No
playgrounds or
school yards. No
spray irrigation
within 100’ of
residence, school
or playground.
Controlled Public
access ok,
including
cemeteries and
golf courses. No
playgrounds or
school yards. No
sprinkler irrigation
within 100’ of
residence, school
or playground
All access
including school
and playground
ok. Sprinkler
Irrigation ok.
Operation
and
Maintenance
least O&M Medium O&M Higher O&M cost Highest O&M
Application
methodFlood irrigation
Flood or spray with
limitations
Flood or spray with
limitationsFlood or spray
Expected
Operator
Certification
Level
Grade 1 Grade 1or 2 Grade 1or 2 Grade 3
Feasibility Study – Reclaimed Water for Restoration and December 2017 Community Projects in Big Pine, CA
28
4 Preliminary Alternatives for Reuse
A number of alternatives were investigated and evaluated as potential uses for recycled
water reuse, a preliminary qualification matrix of these alternatives is shown in Appendix 3.
Much of the qualification criterion is self-explanatory, however some specific criterion is
described below.
• Simplicity of Reuse Operations – The persons operating the irrigation systems will
have to be aware of and comply with the requirements of Lahontan and CDPH as
well as have some knowledge and experience with piping and control systems.
Therefore, a simpler reuse system is preferred.
• Operator certification – A higher operator certification is more difficult to acquire and
may not be available locally.
• Capital Costs for Distribution - Effluent will be piped to the reuse area and the piping
cost is significant. These costs also include the irrigation system.
• Operation and Maintenance Costs – Higher levels of treatment and complex
distribution systems will increase the annual costs for maintaining the system.
5 Recommended Alternative for Reuse
The Preliminary Alternatives for Reuse are listed in Appendix 3. Each alternative was
considered and ultimately one alternative was selected from the preliminary alternatives.
This alternative involves pumping recycled water to LADWP lands located about 0.5 miles
south of the BPCSD WRRF for use in subsurface drip irrigation (SDI) of native plant species.
The selection of this alternative was based on the following conclusions made by
stakeholders present during the preliminary evaluation:
• LADWP is under a state mandate to revegetate select parcels throughout the Big
Pine area determined to be barren of any native plant growth. This mandate
determined that the identified parcels have been impacted by ground water utilization
due in part to aquifer pumping activities. LADWP had been directed to revegetate
the parcels with native vegetation, the stakeholders anticipate that LADWP will
require a source of water for irrigation and that the recycled water available at the
WRRF will adequately meet much of the demand for revegetating activities at this
location. If LADWP is receptive to the use of recycled water for this application, the
stakeholders would seek to enter into a “water trade” agreement with LADWP and
trade use of the recycled water from the WRRF for access to other sources of
surface water or treated water in the Big Pine area in amount commensurate for
beneficial uses elsewhere. The anticipated use of this water would likely be to
accomplish one of the other preliminary alternatives included with this report.
Feasibility Study – Reclaimed Water for Restoration and December 2017 Community Projects in Big Pine, CA
29
• The LADWP revegetation area exists within the same parcel as the WRRF, therefore
the total distance required to pump recycled water to a feasible reuse area would be
significantly reduced when compared with other proposed alternatives.
• The Title 22 Requirements for SDI are much less restrictive than those of other
proposed alternatives. Recycled water would only be required to be treated to
secondary treatment levels, no tertiary treatment or disinfection would be necessary.
As the WRRF already produces recycled water treated to secondary standards,
construction of additional infrastructure at the WRRF would not be required.
Additionally, the operational and maintenance costs will be significantly reduced as
the proposed alternative will have a relatively low impact to these costs as compared
with other proposed alternatives.
5.1 Reuse of Undisinfected Effluent for Irrigation at LADWP
Revegetation Area
With this alternative, only secondary treatment (oxidation) is required to meet
Title 22 requirements. That means that disinfection of the recycled water will not
be required for this type of application. However, certain administrative controls
will be necessary to maintain compliance with these requirements. Reuse water
must not be aerosolized, such as sprayed for aboveground irrigation, in order to
avoid the possibility of undisinfected water being carried outside the designated
reuse area by strong wind events. Fencing and signage will also be required
around the boundary of the irrigation area to inform the public that un-disinfected
recycled water is being utilized for irrigation and public access is restricted.
Because the water will be supplied subterraneously, workers at the site will have
very little exposure to the recycled water. While not required, basic personal
protective equipment (PPE) is recommended for workers during repairs to the
system where contact with recycled water is possible. The recommended PPE is
limited to gloves and safety glasses.
The preliminary design was based on a conservative design flow of 70,000
gallons per day, the available flow may be as great as 80,000 gallons per day.
The actual design flow will be determined upon final design of the system.
Recycled water at a continuous flow rate of ±50 GPM will be withdrawn from the
southern oxidation pond and pumped to the 160-acre LADWP Revegetation Area
where it will be continuously reused for Subsurface Drip Irrigation (SDI). The SDI
system will initially be able to irrigate up to approximately 100 acres of area for
distribution, utilization of the entire 160 acres is not being considered as this
would require bridging the LADWP freshwater canal. This alternative is
illustrated on Figure 6, preliminary design parameters are shown in Table 5.
Feasibility Study – Reclaimed Water for Restoration and December 2017 Community Projects in Big Pine, CA
30
Table 5 Preliminary Design Parameters
5.2 Treatment and Application (Pumping) System
No additional treatment or disinfection will be required for this alternative as the
irrigation application method requires only undisinfected secondary-treated
recycled water. Effluent will be pumped from the oxidation pond via a
submersible booster pump as shown on Figure 7. Using the oxidation pond as
the source of reuse water is preferable as it will act as an equalization basin and
allow for consistent dosing to the distribution area. The booster pump will be a 5
horsepower (hp) centrifugal pump that will boost the pressure to approximately
50 psi at 48.6 gallons per minute. This pump will be equipped with a soft start so
that it speeds up slowly and does not create hydraulic surges in the system.
Further, the pump will have an automatic shut down if the pressure should
exceed a set value. This is necessary should there be a malfunction in a
downstream automatic valve or the irrigator discontinue reuse without shutting
down the pump first.
A flow meter will be installed on the effluent line downstream of the pump to
record the flows. The pressure in the pipeline will be approximately 50 psi at the
booster pump and decrease to approximately 5 psi at the southeast end of the
reuse area, a lower pressure is acceptable because there will be no sprinklers in
the system. The pump will be stationed either within a wet-well adjacent to the
oxidation pond, or directly within the pond utilizing a rail system and cat-walk to
allow access for maintenance needs. During the winter it is expected that the
system will be drained to prevent freezing.
Available Area 110 Acres
Number of Irrigation Zones 6
Area per Zone 16.7 acres
Total Utilized Area 103.7 acres
% of Total Area Available 94.2% 0.00
70,000 GPD
48.61 GPM
Flushing Velocity 1.5 FPS
Dosing Period per Zone 1 hr
Doses per Day 4
Total Daily Dosing Period 4 hr
Total System Volume 47,905 gal
Hazzen Williams C 150
Total Elevation Change 12 ft
Available Flow
Feasibility Study – Reclaimed Water for Restoration and December 2017 Community Projects in Big Pine, CA
31
While it will increase the capital cost, a redundant supply pump is recommended.
This will afford for a more resilient system as the backup pump will be readily
available in the event that the primary pump fails. Should there be a in the piping
system, reuse will stop until the condition is corrected. As this system can
withstand brief shutdowns, no backup power is proposed and therefore in a
power outage reuse will also stop until power is restored. In either scenario, flow
would then continue from the oxidation ponds to the percolation ponds for
disposal until the irrigation system is placed back into service. Disruption to
reuse operations during a prolonged shutdown may be avoided by installing a
camlock fitting on the distribution system adjacent to the Big Pine Canal and
using a bypass-style diesel fired centrifugal pump to withdraw water from the
Canal and discharge it into the distribution system through the camlock. This
approach would also provide a good opportunity for flushing the system with
fresh water should an accumulation of salts or other mineral scaling/deposition
occur at the drip emitters.
Following the pump, flow will pass through a self-cleaning disk filter containing a
100-micron filtration media, followed by flow and pressure gauges. This will
ensure that debris and sediment are precluded from the distribution system to
avoid clogging of the emitters and inefficiency in the irrigation system.
5.3 Distribution System
The distribution system will consist of a 7,000-lineal foot 4-inch diameter force
main that will direct flow from the pump to the distribution area directly south of
the WRRF as shown on Figure 6. Because there is no need for a chlorine contact
period the force main may be 4 inches in diameter. The distribution system will
run north to south and distribute flow into six parallel irrigation zones. The force
main will require additional easements in order to cross LADWP land before
reaching the reuse area.
A 4-inch return line will be installed along the south side of the revegetation area
and run from south to north. This line will run parallel to the influent distribution
line and ultimately discharge excess flow back into the oxidation pond. The
purpose of the flush line will be to allow excess flow to return to the oxidation
pond during flushing events.
In order to minimize impacts and reduce ground disturbance, both the supply and
return lines are expected to be installed via horizontal direction drilling (HDD).
HDD is a trenchless technology that does not require ground disturbance for
lineal utility construction except for two small pits where the bore enters and exits
the ground. The entry pit where the bore will begin will be positioned within the
BPWRRF boundary, and the receiving pit will be positioned onsite near the point
of connection to the irrigation system where the ground has been previously
Feasibility Study – Reclaimed Water for Restoration and December 2017 Community Projects in Big Pine, CA
32
disturbed by drill seeding activity. This method will also allow for installing the
proposed pipelines below the Big Pine Creek return (between the BPWRRF and
BPPT’s WRRF) to the Owens River without any disturbance of the creek or
riparian areas. It is estimated that the bore will pass below the flowline of the
creek by a minimum depth of 10 feet, as this is typical to avoid oversaturated soil
conditions at the interface between surface water and subsurface shallow
groundwater.
A separate, larger submersible pump will be installed to facilitate flushing events.
The flush pump will be rated at 22 horsepower and will provide 150 psi at 207
gallons per minute of flow. It is expected that flushing events will occur on a
monthly basis, or as often as needed depending upon the system performance.
Preliminary design parameters for the distribution system are shown on Table 6.
Feasibility Study – Reclaimed Water for Restoration and December 2017 Community Projects in Big Pine, CA
33
Table 6 Distribution System Preliminary Design Parameters
Number of Drippers
Dripper Spacing 10 ft 10 ft
Dripper Flow Rate 0.40 GPH 0.03 GPM
Dripper Spacing 120 inches 120 inches
Number of Laterals per zone
Lateral Diameter 0.56 in 0.56 in
Lateral Spacing 10 ft 10 ft
Lateral Length 405 ft 405 ft
Total Lateral Length 437,500 ft 437,500 ft
Lateral Flow Rate 0.27 GPM 1.15 GPM
Lateral Velocity 0.35 ft/s 1.5 ft/s
Frictional Losses 0.6 ft 8.7 ft
Distribution Line Diameter 4 in 4 in
Distribution Line Length per Zone 1,800 ft 1,800 ft
Total Distribution Line Length 10,802 ft 10,802 ft
Distribution Line Flow Rate 48.6 GPM 207.3 GPM
Distribution Line Velocity 1.24 FPS 5.29 FPS
Frictional Losses 2.8 ft 40.4 ft
Influent Line Diameter 4 in 4 in
Influent Line Length 6,615 ft 6,615.00 ft
Influent Line Flow Rate 48.6 GPM 207.3 GPM
Influent Line Velocity 1.24 FPS 5.29 FPS
Frictional Losses 10.1 ft 148.6 ft
Flush Line Diameter 4 in 4 in
Flush Line Length 7,020 ft 7,020 ft
Flush Line Flow Rate 0 GPM 158.7 GPM
Flush Line Velocity 0 FPS 4.05 FPS
Frictional Losses 0 ft 96.1 ft
Total length of 4" Pipe 24,437 ft 24,437 ft
Total length of dripline 437,500 ft 437,500 ft
Total System Friction Losses 13.5 ft 293.9 ft
Totals
Influent Line
Flush Line
For Regular FlowFor 1.5 FPS flushing velocity
in LateralParameter
41
180 180
41
Distribution Line
Lateral
Emitter
AutoCAD SHX Text
3960
AutoCAD SHX Text
4000
AutoCAD SHX Text
N MAIN ST
AutoCAD SHX Text
U.S. HWY 395
AutoCAD SHX Text
U.S. HWY 395
AutoCAD SHX Text
SR 168
AutoCAD SHX Text
LOCUST ST
AutoCAD SHX Text
BARTELL RD
AutoCAD SHX Text
POPLAR ST
AutoCAD SHX Text
CENTER ST
AutoCAD SHX Text
HOME ST
AutoCAD SHX Text
WASHINGTON PARK
AutoCAD SHX Text
CROCKER AVE
AutoCAD SHX Text
PINE ST
AutoCAD SHX Text
CALLINA ST
AutoCAD SHX Text
CRATER ST
AutoCAD SHX Text
RICHARDS ST
AutoCAD SHX Text
BAKER LN
AutoCAD SHX Text
PIPER ST
AutoCAD SHX Text
BOWERS ST
AutoCAD SHX Text
HILL ST
AutoCAD SHX Text
BOWERS ST
AutoCAD SHX Text
CRATER ST
AutoCAD SHX Text
RICHARDS ST
AutoCAD SHX Text
PIPER ST
AutoCAD SHX Text
NEWMAN ST
AutoCAD SHX Text
EXISTING BPPT TREATMENT PLANT
AutoCAD SHX Text
EXISTING BIG PINE WASTEWATER TREATMENT PLANT
AutoCAD SHX Text
BIG PINE CANAL
AutoCAD SHX Text
4" SSFM
AutoCAD SHX Text
A
AutoCAD SHX Text
A
AutoCAD SHX Text
A
AutoCAD SHX Text
A
AutoCAD SHX Text
A
AutoCAD SHX Text
A
AutoCAD SHX Text
A
AutoCAD SHX Text
A
AutoCAD SHX Text
4" SSFM
AutoCAD SHX Text
4" SSFM
AutoCAD SHX Text
4" SSFM
AutoCAD SHX Text
4" SSFM
AutoCAD SHX Text
ZONE 1
AutoCAD SHX Text
ZONE 2
AutoCAD SHX Text
ZONE 3
AutoCAD SHX Text
ZONE 4
AutoCAD SHX Text
ZONE 5
AutoCAD SHX Text
ZONE 6
AutoCAD SHX Text
NEW DISK FILTER
AutoCAD SHX Text
NEW FLOW METER & PRESSURE TRANSDUCER
AutoCAD SHX Text
EXISTING OXIDATION POND
AutoCAD SHX Text
NEW POWER & CONTROL UNDERGROUND CONDUIT
AutoCAD SHX Text
NEW 4" INFLUENT LINE, APPROX. 2720 LF
AutoCAD SHX Text
NEW 4" FLUSH LINE, APPROX. 2720 LF
AutoCAD SHX Text
4" SSFM
AutoCAD SHX Text
NEW LIFT STATION WITH SUBMERSIBLE PUMPS
AutoCAD SHX Text
LADWP LAND
AutoCAD SHX Text
W
AutoCAD SHX Text
PT
AutoCAD SHX Text
(16.74 ACRES, TYP.)
AutoCAD SHX Text
W
AutoCAD SHX Text
1603 ESMERALDA AVENUE / POST OFFICE BOX 2229
AutoCAD SHX Text
PHONE: (775) 782-2322 / FAX: (775) 782-7084
AutoCAD SHX Text
MINDEN, NEVADA 89423
AutoCAD SHX Text
WEB SITE: WWW.ROANDERSON.COM
AutoCAD SHX Text
Y:\Client Files\2521\2521-001\CAD\Engineering\Exhibits\2521-001_Fig1_LocationMap.dwg 11/22/2017 11:55:19 AM Eric Kao 11/22/2017 11:55:19 AM Eric Kao11/22/2017 11:55:19 AM Eric Kao Eric KaoEric Kao
AutoCAD SHX Text
2521-001
AutoCAD SHX Text
11/22/17
AutoCAD SHX Text
FIGURE 5
AutoCAD SHX Text
PROJECT MAP
AutoCAD SHX Text
FEASIBILITY STUDY - BIG PINE
AutoCAD SHX Text
SCALE: 1" = 750'
AutoCAD SHX Text
AERATION ROTOR, TYP. OF 2
AutoCAD SHX Text
15" VCP PIPE, INFLUENT SEWER
AutoCAD SHX Text
HEADWORKS/ COMMINUTOR
AutoCAD SHX Text
CONTROL BLDG
AutoCAD SHX Text
DITCH OUTLET WEIR
AutoCAD SHX Text
BYPASS DISTRIBUTION BOX
AutoCAD SHX Text
FLOW METER
AutoCAD SHX Text
CLARIFIER
AutoCAD SHX Text
SLUDGE BED
AutoCAD SHX Text
OXIDATION DITCH
AutoCAD SHX Text
OXIDATION POND
AutoCAD SHX Text
BERM
AutoCAD SHX Text
BERM
AutoCAD SHX Text
NEW LIFT STATION
AutoCAD SHX Text
NEW FLUSH PUMP
AutoCAD SHX Text
NEW DISTRIBUTION PUMP
AutoCAD SHX Text
NEW 4" FLUSH LINE
AutoCAD SHX Text
NEW 4" INFLUENT LINE
AutoCAD SHX Text
NEW DISK FILTER
AutoCAD SHX Text
NEW FLOW METER
AutoCAD SHX Text
NEW PRESSURE TRANSDUCER
AutoCAD SHX Text
PERCOLATION BED
AutoCAD SHX Text
W
AutoCAD SHX Text
PT
AutoCAD SHX Text
NEW POWER & CONTROL UNDERGROUND CONDUIT
AutoCAD SHX Text
OXIDATION POND
AutoCAD SHX Text
PIPE, TYP.
AutoCAD SHX Text
W
AutoCAD SHX Text
PERCOLATION BED
AutoCAD SHX Text
Y:\Client Files\2521\2521-001\CAD\Engineering\Exhibits\2521-001_Fig1_LocationMap.dwg 11/22/2017 11:57:24 AM Eric Kao 11/22/2017 11:57:24 AM Eric Kao11/22/2017 11:57:24 AM Eric Kao Eric KaoEric Kao
AutoCAD SHX Text
1603 ESMERALDA AVENUE / POST OFFICE BOX 2229
AutoCAD SHX Text
PHONE: (775) 782-2322 / FAX: (775) 782-7084
AutoCAD SHX Text
MINDEN, NEVADA 89423
AutoCAD SHX Text
WEB SITE: WWW.ROANDERSON.COM
AutoCAD SHX Text
FIGURE 6
AutoCAD SHX Text
WRRF PUMP STATION
AutoCAD SHX Text
FEASIBILITY STUDY - BIG PINE
AutoCAD SHX Text
2521-001
AutoCAD SHX Text
11/22/17
AutoCAD SHX Text
NOT TO SCALE
Feasibility Study – Reclaimed Water for Restoration and December 2017 Community Projects in Big Pine, CA
36
5.4 Irrigation System
Flow will be directed to one of three SDI zones as shown on Figure 8. The flow
direction will be controlled by a system of automatic solenoid valves which will
alternate between zones based on either a 4-hour dosing period per zone or four
1-hour dosing periods distributed throughout the day. Each zone consists of an
1,800-lineal foot 4-inch distribution line conveying flow into 180 driplines
arranged in parallel, each running about 405 feet in length. The drip lines will be
rated at 0.4 gallons per hour in order to maximize the area being irrigated.
Orifices along the dripline will be spaced at 10 feet and laterals will be spaced at
10 feet, with each orifice irrigating approximately 3 square feet.
The return line will be equipped with two manual gate valves located at the
northeast corner of the distribution area. During normal operations any excess
flow available at the end of the dripline will be looped back into the system for
redistribution. During flushing events, the redistribution valve will be closed, and
the return valve opened to allow flow to return to the oxidation pond. Each zone
will be equipped with air release valves both prior to the driplines as well as at
the end of each dripline group in order to purge air from the lines during each
dosing. Check valves will be installed along the receiving flush line to prevent
backflow into any of the SDI zones.
Should the recycled water irrigation system be out of service, the only reasonable
alternative would be to divert flow through a mobile pumping system using a
camlock connection point installed after the primary pump system as described in
Section 5.2 above. Water could potentially be supplied from the Big Pine Canal
or from a water truck, although the latter offers limited capacities typically less
than 5,000 gallons. The Big Pine Canal as an alternative (temporary) source of
water offers the distinct advantage of potentially being able to provide enough
water to both operate the system for irrigation as well as to flush the entire
system, while a water truck would not be able to irrigate the system or flush the
whole system. Potentially a water truck could be used to flush individual zones
of the system as each zone has a distribution and lateral pipe volume of about
2,100 gallons.
A properly signed fence will be required around the reuse area to exclude the
public. It is expected that the public may be allowed access to the reuse site 14
days after irrigation similar to Title 22, Section 60304, d, 3 that allows public
access to Christmas tree farms 14 days after irrigation with recycled water. This
means that the public could potentially access the site during the months of
October through February, depending on the actual irrigation season dates.
Prior to proceeding with this alternative this should be verified with the California
Department of Public Health that this is also their interpretation.
AutoCAD SHX Text
Y:\Client Files\2521\2521-001\CAD\Engineering\Exhibits\2521-001_Fig1_LocationMap.dwg 11/22/2017 11:56:05 AM Eric Kao 11/22/2017 11:56:05 AM Eric Kao11/22/2017 11:56:05 AM Eric Kao Eric KaoEric Kao
AutoCAD SHX Text
1603 ESMERALDA AVENUE / POST OFFICE BOX 2229
AutoCAD SHX Text
PHONE: (775) 782-2322 / FAX: (775) 782-7084
AutoCAD SHX Text
MINDEN, NEVADA 89423
AutoCAD SHX Text
WEB SITE: WWW.ROANDERSON.COM
AutoCAD SHX Text
FIGURE 7
AutoCAD SHX Text
SUBSURFACE DRIP IRRIGATION SYSTEM
AutoCAD SHX Text
FEASIBILITY STUDY - BIG PINE
AutoCAD SHX Text
2521-001
AutoCAD SHX Text
11/22/17
AutoCAD SHX Text
ZONE 1
AutoCAD SHX Text
A
AutoCAD SHX Text
A
AutoCAD SHX Text
AIR RELEASE VALVE, TYP.
AutoCAD SHX Text
4" CHECK VALVE, TYP.
AutoCAD SHX Text
4" INFLUENT LINE
AutoCAD SHX Text
4" FLUSH LINE
AutoCAD SHX Text
4" RETURN DISCHARGE LINE
AutoCAD SHX Text
4" INFLUENT LINE
AutoCAD SHX Text
LATERALS PER ZONE:180 EMITTER SPACING:10' LATERAL SPACING:10' LATERAL LENGTH=405'
AutoCAD SHX Text
RETURN GATE VALVE
AutoCAD SHX Text
4" DISTRIBUTION LINE
AutoCAD SHX Text
4" COLLECTION LINE
AutoCAD SHX Text
POWER & CONTROL UNDERGROUND CONDUIT, IN COMMON TRENCH
AutoCAD SHX Text
ZONE 2
AutoCAD SHX Text
ZONE 3
AutoCAD SHX Text
ZONE 4
AutoCAD SHX Text
ZONE 5
AutoCAD SHX Text
ZONE 6
AutoCAD SHX Text
A
AutoCAD SHX Text
A
AutoCAD SHX Text
A
AutoCAD SHX Text
A
AutoCAD SHX Text
A
AutoCAD SHX Text
A
AutoCAD SHX Text
4" SOLENOID VALVE, TYP.
AutoCAD SHX Text
ADJACENT LINES IN COMMON TRENCH, TYP.
AutoCAD SHX Text
NOT TO SCALE
Feasibility Study – Reclaimed Water for Restoration and December 2017 Community Projects in Big Pine, CA
38
5.5 Photovoltaic System at WRRF
Included with this alternative is the option to incorporate a Photovoltaic System
Solar Array that will supplement the current power supply to the WRRF. The
average annual electricity usage of the existing WRRF is approximately 191,500
[13] D. J. Huntington, "Email Correspondence," Desert Research Institute, Reno, 2017.
[14] LADWP, "BP 160 Draft Revegetation Plan for 1991 EIR (December 2016),"
Independence, 2016.
[15] H. R. O. D. Steinwald A.L., "Water Balance for Great Basin Phreatophytes Derived
from Eddy Covariance, Soil Water, and Water Table Measurements," Journal of
Hydrology, vol. 329, pp. 595-605, 2006.
[16] California Regional Water Quality Control Board, Lahontan Region, "Basin Plan," 2005.
[17] Inyo County Water Department, "Inyo County Water Department Annual Report,"
ICWD, Independence, 2016-2017.
[18] Los Angeles Department of Water and Power, "2017 Annual Owens Valley Report,"
LADWP, Los Angeles, 2017.
[19] Inyo County Water Department, Request for Statement of Qualifications - Reclaimed
Water for Restoration and Community Projects in Big Pine, CA, Independence: ICWD,
2017.
[20] R.O. Anderson Engineering, "Feasibility Study for Effluent Reuse in Lone Pine," 2012.
Feasibility Study – Reclaimed Water for Restoration and December 2017 Community Projects in Big Pine, CA
49
9 Appendices
Appendix 1: California Regional Water Quality Control Board, Lahontan Region Board
Order No. 6-95-35
Appendix 2: NRCS Custom Soil Report for soils in the vicinity of potential reuse areas
Appendix 3: Preliminary Alternatives Analysis for recycled water uses in the Big Pine area
Appendix 4: NREL Photovoltaic Solar Array Design Summary
Appendix 1
California Regional Water Quality Control Board, Lahontan Region
Board Order No. 6-95-35
Appendix 2
NRCS Custom Soil Report for soils in the vicinity of potential reuse
areas
Map – Area of Interest
Benton-Owens Valley Area Parts of Inyo and Mono Counties, California
USDA Soil Survey
Component Legend
Benton-Owens Valley Area Parts of Inyo and Mono Counties, California
Pct. ofmap unit Component name Component kind
Pct. Slope
Low RV HighMap unit symbol and name
[This report shows only the major soils in each map unit]
210:
Hesperia-Cartago complex, 0 to 5 percent slopes
Hesperia65 Series 0 3 5
Cartago20 Series 0 3 5
281:
Pits-Dumps complex, 0 to 50 percent slopes
Pits45 Miscellaneous area 0 25 50
Dumps40 Miscellaneous area 0 25 50
318:
Shondow-Hessica association, 0 to 2 percent slopes
Shondow50 Series 0 1 2
Hessica30 Series 0 1 2
370:
Xerofluvents, 0 to 5 percent slopes
Xerofluvents85 Taxon above family 0 3 5
Page 1
Survey Area Version: 15
Survey Area Version Date: 09/13/2017
This report shows only the major soils in each map unit
Component Text
Benton-Owens Valley Area Parts of Inyo and Mono Counties, California
[Only those components that have entries for the selected text kinds and categories are included in this report. This report shows only the major soils in each map unit]
210 - Hesperia-Cartago complex, 0 to 5 percent slopesMap unit:
Componet: Hesperia
Text kind/Category: Nontechnical description/GENSOIL
The Hesperia component makes up 65 percent of the map unit. Slopes are 0 to 5 percent. This component is on fan piedmonts, alluvial fans. The parent material consists of alluvium derived from granite. Depth to a root restrictive layer is greater than 60 inches. The natural drainage class is well drained. Water movement in the most restrictive layer is high. Available water to a depth of 60 inches (or restricted depth) is moderate. Shrink-swell potential is low. This soil is not flooded. It is not ponded. There is no zone of water saturation within a depth of 72 inches. Organic matter content in the surface horizon is about 0 percent. This component is in the R029XG017CA Loamy 5-8" P.z. ecological site. Nonirrigated land capability classification is 7e. Irrigated land capability classification is 2s. This soil does not meet hydric criteria. The calcium carbonate equivalent within 40 inches, typically, does not exceed 1 percent.
Componet: Cartago
Text kind/Category: Nontechnical description/GENSOIL
The Cartago component makes up 20 percent of the map unit. Slopes are 0 to 5 percent. This component is on alluvial fans, fan piedmonts. The parent material consists of alluvium derived from granite. Depth to a root restrictive layer is greater than 60 inches. The natural drainage class is somewhat excessively drained. Water movement in the most restrictive layer is high. Available water to a depth of 60 inches (or restricted depth) is very low. Shrink-swell potential is low. This soil is not flooded. It is not ponded. There is no zone of water saturation within a depth of 72 inches. Organic matter content in the surface horizon is about 0 percent. This component is in the R029XG011CA Sandy 5-8" P.z. ecological site. Nonirrigated land capability classification is 7e. Irrigated land capability classification is 3s. This soil does not meet hydric criteria.
281 - Pits-Dumps complex, 0 to 50 percent slopesMap unit:
Componet: Pits
Text kind/Category: Nontechnical description/GENSOIL
Generated brief soil descriptions are created for major soil components. The Pits is a miscellaneous area.
Componet: Dumps
Text kind/Category: Nontechnical description/GENSOIL
Generated brief soil descriptions are created for major soil components. The Dumps is a miscellaneous area.
Page 1
Survey Area Version: 15
Survey Area Version Date: 09/13/2017
Component Text
Benton-Owens Valley Area Parts of Inyo and Mono Counties, California
318 - Shondow-Hessica association, 0 to 2 percent slopesMap unit:
Componet: Shondow
Text kind/Category: Nontechnical description/GENSOIL
The Shondow component makes up 50 percent of the map unit. Slopes are 0 to 2 percent. This component is on stream terraces, river valleys. The parent material consists of alluvium derived from mixed. Depth to a root restrictive layer is greater than 60 inches. The natural drainage class is somewhat poorly drained. Water movement in the most restrictive layer is moderately low. Available water to a depth of 60 inches (or restricted depth) is moderate. Shrink-swell potential is low. This soil is rarely flooded. It is not ponded. A seasonal zone of water saturation is at 66 inches during March, April, May. Organic matter content in the surface horizon is about 2 percent. This component is in the R029XG002CA Saline Meadow ecological site. Nonirrigated land capability classification is 7s. This soil meets hydric criteria. The calcium carbonate equivalent within 40 inches, typically, does not exceed 3 percent. The soil has a strongly saline horizon within 30 inches of the soil surface. The soil has a maximum sodium adsorption ratio of 37 within 30 inches of the soil surface.
Componet: Hessica
Text kind/Category: Nontechnical description/GENSOIL
The Hessica component makes up 30 percent of the map unit. Slopes are 0 to 2 percent. This component is on higher remnants of stream terraces, river valleys. The parent material consists of alluvium derived from mixed. Depth to a root restrictive layer is greater than 60 inches. The natural drainage class is well drained. Water movement in the most restrictive layer is moderately low. Available water to a depth of 60 inches (or restricted depth) is moderate. Shrink-swell potential is moderate. This soil is rarely flooded. It is not ponded. There is no zone of water saturation within a depth of 72 inches. Organic matter content in the surface horizon is about 2 percent. This component is in the R029XG007CA Saline Bottom ecological site. Nonirrigated land capability classification is 7s. This soil does not meet hydric criteria. The calcium carbonate equivalent within 40 inches, typically, does not exceed 3 percent. The soil has a very slightly saline horizon within 30 inches of the soil surface. The soil has a maximum sodium adsorption ratio of 19 within 30 inches of the soil surface.
370 - Xerofluvents, 0 to 5 percent slopesMap unit:
Componet: Xerofluvents
Text kind/Category: Nontechnical description/GENSOIL
The Xerofluvents component makes up 85 percent of the map unit. Slopes are 0 to 5 percent. This component is on drainageways, river valleys. The parent material consists of alluvium derived from mixed. Depth to a root restrictive layer is greater than 60 inches. The natural drainage class is poorly drained. Water movement in the most restrictive layer is moderately high. Available water to a depth of 60 inches (or restricted depth) is low. Shrink-swell potential is moderate. This soil is frequently flooded. It is not ponded. A seasonal zone of water saturation is at 12 inches during March, April, May, June. Organic matter content in the surface horizon is about 1 percent. This component is in the R029XG027CA Streambank ecological site. Nonirrigated land capability classification is 6w. This soil meets hydric criteria.
Page 2
Survey Area Version: 15
Survey Area Version Date: 09/13/2017
Engineering Properties
Benton-Owens Valley Area Parts of Inyo and Mono Counties, California
Map symboland soil name
[Absence of an entry indicates that the data were not estimated. This report shows only the major soils in each map unit]
34-60 0-5 15-25 45-65 40-60 20-55 0-35 5-40 NP-20Stratified very gravelly sand to very cobbly sandy clay loam
GC, GP, GP-GM, SP
A-1, A-2, A-3
Page 3
Survey Area Version: 15
Survey Area Version Date: 09/13/2017
Physical Soil Properties
Benton-Owens Valley Area Parts of Inyo and Mono Counties, California
Map symboland soil name
[Entries under "Erosion Factors--T" apply to the entire profile. Entries under "Wind Erodibility Group" and "Wind Erodibility Index" apply only to the surface layer. Absence of an entry indicates that data were not estimated. This report shows only the major soils in each map unit]
Benton-Owens Valley Area Parts of Inyo and Mono Counties, California
Pct. ofmap unit Hydrologic group
Representative value
% Sand % Silt % ClayMap symbol and soil name T factorKf
[This report shows only the major soils in each map unit]
210:
Hesperia 65 A 67.4 19.6 13.05.24
Cartago 20 A 84.3 9.2 6.54.15
281:
Pits 45 --- --- --- ---------
Dumps 40 --- --- --- ---------
318:
Shondow 50 C 44.8 41.2 14.04.43
Hessica 30 C 81.1 16.4 2.52.32
370:
Xerofluvents 85 C/D 67.4 19.6 13.05.20
Page 1
Survey Area Version: 15
Survey Area Version Date: 09/13/2017
Soil Features
Benton-Owens Valley Area Parts of Inyo and Mono Counties, California
Map symboland soil name
[Absence of an entry indicates that the feature is not a concern or that data were not estimated. This report shows only the major soils in each map unit]
Initial Total
Potentialfor frostaction Uncoated
steelConcrete
Risk of corrosionSubsidenceRestrictive layer
HardnessKindDepthto top Thickness
In In In In
210:
Hesperia 0 0 Moderate Low Low--- --- --- ---
Cartago 0 0 Low Low Low--- --- --- ---
281:
Pits 0 --- Low --- ------ --- --- ---
Dumps 0 --- Low --- ------ --- --- ---
318:
Shondow 0 0 Moderate High High--- --- --- ---
Hessica 0 0 Low Moderate Moderate--- --- --- ---
370:
Xerofluvents 0 0 Moderate High Low--- --- --- ---
Page 1
Survey Area Version: 15
Survey Area Version Date: 09/13/2017
Water Features
Benton-Owens Valley Area Parts of Inyo and Mono Counties, California
Map symboland soil name
[Depths of layers are in feet. See text for definitions of terms used in this table. Estimates of the frequency of ponding and flooding apply to the whole year rather than to individual months. Absence of an entry indicates that the feature is not a concern or that data were not estimated. This report shows only the major soils in each map unit]
Surface water depth
Duration Frequency
FloodingPondingWater tableHydrologic
group Upperlimit
Lowerlimit
Ft
Months
Ft Ft
Duration FrequencySurface runoff
210:
Hesperia A Very low --- None --- None---Jan-Dec
Cartago A Negligible --- None --- None---Jan-Dec
281:
Pits --- --- --- None --- None---Jan-Dec
Dumps --- --- --- None --- None---Jan-Dec
Page 1
Survey Area Version: 15
Survey Area Version Date: 09/13/2017
Water Features
Benton-Owens Valley Area Parts of Inyo and Mono Counties, California
Map symboland soil name Surface water
depthDuration Frequency
FloodingPondingWater tableHydrologic
group Upperlimit
Lowerlimit
Ft
Months
Ft Ft
Duration FrequencySurface runoff
318:
Shondow C High --- None Long (7 to 30 days)
Rare---January --- ---
--- None Long (7 to 30 days)
Rare---February --- ---
--- None Long (7 to 30 days)
Rare---March 5.0->6.0 >6.0
--- None Long (7 to 30 days)
Rare---April 5.0->6.0 >6.0
--- None Long (7 to 30 days)
Rare---May 5.0->6.0 >6.0
--- None Long (7 to 30 days)
Rare---June --- ---
--- None Long (7 to 30 days)
Rare---July --- ---
--- None Long (7 to 30 days)
Rare---August --- ---
--- None Long (7 to 30 days)
Rare---September --- ---
--- None Long (7 to 30 days)
Rare---October --- ---
--- None Long (7 to 30 days)
Rare---November --- ---
--- None Long (7 to 30 days)
Rare---December --- ---
Page 2
Survey Area Version: 15
Survey Area Version Date: 09/13/2017
Water Features
Benton-Owens Valley Area Parts of Inyo and Mono Counties, California
Map symboland soil name Surface water
depthDuration Frequency
FloodingPondingWater tableHydrologic
group Upperlimit
Lowerlimit
Ft
Months
Ft Ft
Duration FrequencySurface runoff
318:
Hessica C High --- None Very brief (4 to 48 hours)
Rare---January --- ---
--- None Very brief (4 to 48 hours)
Rare---February --- ---
--- None Very brief (4 to 48 hours)
Rare---March --- ---
--- None Very brief (4 to 48 hours)
Rare---April --- ---
--- None Very brief (4 to 48 hours)
Rare---May --- ---
--- None Very brief (4 to 48 hours)
Rare---June --- ---
--- None Very brief (4 to 48 hours)
Rare---July --- ---
--- None Very brief (4 to 48 hours)
Rare---August --- ---
--- None Very brief (4 to 48 hours)
Rare---September --- ---
--- None Very brief (4 to 48 hours)
Rare---October --- ---
--- None Very brief (4 to 48 hours)
Rare---November --- ---
--- None Very brief (4 to 48 hours)
Rare---December --- ---
370:
Xerofluvents C/D Low --- None Long (7 to 30 days)
Frequent---March 0.5-1.5 >6.0
--- None Long (7 to 30 days)
Frequent---April 0.5-1.5 >6.0
--- None Long (7 to 30 days)
Frequent---May 0.5-1.5 >6.0
--- None Long (7 to 30 days)
Frequent---June 0.5-1.5 >6.0
Page 3
Survey Area Version: 15
Survey Area Version Date: 09/13/2017
Sewage Disposal
Benton-Owens Valley Area Parts of Inyo and Mono Counties, California
Map symboland soil name
Pct.of
mapunit
Rating class andlimiting features Value
Rating class andlimiting features Value
[The information in this table indicates the dominant soil condition but does not eliminate the need for onsite investigation. The numbers in the value columns range from 0.01 to 1.00. The larger the value, the greater the potential limitation. The columns that identify the rating class and limiting features show no more than five limitations for any given soil. The soil may have additional limitations. This report shows only the major soils in each map unit]
Septic tankabsorption fields
Sewagelagoons
210:
65Hesperia Not limited Very limited
Seepage 1.00
Slope 0.08
20Cartago Very limited Very limited
Filtering capacity 1.00 Seepage 1.00
Slope 0.08
281:
45Pits Not rated Not rated
40Dumps Not rated Not rated
318:
50Shondow Very limited Very limited
Seepage, bottom layer
1.00
Slow water movement 1.00
Flooding 0.40
Depth to saturated zone
0.08
Seepage 1.00
Flooding 0.40
30Hessica Very limited Very limited
Slow water movement 1.00
Flooding 0.40
Seepage 1.00
Flooding 0.40
370:
85Xerofluvents Very limited Very limited
Flooding 1.00
Depth to saturated zone
1.00
Slow water movement 1.00
Flooding 1.00
Seepage 1.00
Depth to saturated zone
1.00
Slope 0.08
Page 1
Survey Area Version: 15
Survey Area Version Date: 09/13/2017
Agricultural Disposal of Wastewater by Irrigation and Overland Flow
Benton-Owens Valley Area Parts of Inyo and Mono Counties, California
Map symboland soil name
Pct.of
mapunit
Rating class andlimiting features Value
Rating class andlimiting features Value
[The information in this table indicates the dominant soil condition but does not eliminate the need for onsite investigation. The numbers in the value columns range from 0.01 to 1.00. The larger the value, the greater the potential limitation. The columns that identify the rating class and limiting features show no more than five limitations for any given soil. The soil may have additional limitations. This report shows only the major soils in each map unit]
Disposal ofwastewaterby irrigation
Overland flowof wastewater
210:
65Hesperia Not limited Very limited
Seepage 1.00
20Cartago Very limited Very limited
Filtering capacity 1.00
Droughty 1.00
Seepage 1.00
281:
45Pits Not rated Not rated
40Dumps Not rated Not rated
318:
50Shondow Very limited Very limited
Filtering capacity 1.00
Sodium content 1.00
Slow water movement 1.00
Salinity 0.50
Sodium content 1.00
Flooding 0.40
30Hessica Very limited Very limited
Filtering capacity 1.00
Sodium content 1.00
Slow water movement 1.00
Seepage 1.00
Sodium content 1.00
Flooding 0.40
370:
85Xerofluvents Very limited Very limited
Depth to saturated zone
1.00
Flooding 1.00
Slow water movement 0.31
Droughty 0.01
Seepage 1.00
Depth to saturated zone
1.00
Flooding 1.00
Page 1
Survey Area Version: 15
Survey Area Version Date: 09/13/2017
Agricultural Disposal of Wastewater by Rapid Infiltration and Slow
Rate Treatment
Benton-Owens Valley Area Parts of Inyo and Mono Counties, California
Map symboland soil name
Pct.of
mapunit
Rating class andlimiting features Value
Rating class andlimiting features Value
[The information in this table indicates the dominant soil condition but does not eliminate the need for onsite investigation. The numbers in the value columns range from 0.01 to 1.00. The larger the value, the greater the potential limitation. The columns that identify the rating class and limiting features show no more than five limitations for any given soil. The soil may have additional limitations. This report shows only the major soils in each map unit]
Rapid infiltrationof wastewater
Slow rate treatmentof wastewater
210:
65Hesperia Somewhat limited Not limited
Slow water movement 0.31
20Cartago Somewhat limited Very limited
Cobble content 0.01 Filtering capacity 1.00
281:
45Pits Not rated Not rated
40Dumps Not rated Not rated
318:
50Shondow Very limited Very limited
Slow water movement 1.00
Depth to saturated zone
1.00
Filtering capacity 1.00
Sodium content 1.00
Slow water movement 0.96
Salinity 0.50
30Hessica Very limited Very limited
Slow water movement 1.00 Filtering capacity 1.00
Sodium content 1.00
Slow water movement 0.96
370:
85Xerofluvents Very limited Very limited
Flooding 1.00
Slow water movement 1.00
Depth to saturated zone
1.00
Depth to saturated zone
1.00
Flooding 1.00
Slow water movement 0.21
Page 1
Survey Area Version: 15
Survey Area Version Date: 09/13/2017
Irrigation - General and Sprinkler
Benton-Owens Valley Area Parts of Inyo and Mono Counties, California
Map symboland soil name
Pct.of
mapunit
Rating class andlimiting features Value
Rating class andlimiting features Value
Rating class andlimiting features Value
[The information in this table indicates the dominant soil condition but does not eliminate the need for onsite investigation. The numbers in the value columns range from 0.01 to 1.00. The larger the value, the greater the potential limitation. The columns that identify the rating class and limiting features show no more than five limitations for any given soil. The soil may have additional limitations. This report shows only the major soils in each map unit]
Irrigation general
Irrigationsprinkler
(close spaced outlet drops)
Irrigationsprinkler(general)
210:
65Hesperia Very limited Somewhat limited Not limited
Rapid water movement
1.00
Seepage 0.45
Slope 0.04
Slope 0.48
20Cartago Very limited Somewhat limited Somewhat limited
Rapid water movement
1.00
Seepage 1.00
Low water holding capacity
1.00
Slope 0.04
Low water holding capacity
0.99
Slope 0.48
Low water holding capacity
0.99
281:
45Pits Not rated Not rated Not rated
40Dumps Not rated Not rated Not rated
318:
50Shondow Very limited Very limited Very limited
Seepage 1.00
Excess Sodium 1.00
Excess Salt 0.50
Low water holding capacity
0.11
Excess Sodium 1.00
Excess Salt 0.50
Slow water movement 0.29
Low water holding capacity
0.27
Excess Sodium 1.00
Excess Salt 0.50
Slow water movement 0.29
Low water holding capacity
0.27
30Hessica Very limited Somewhat limited Somewhat limited
Benton-Owens Valley Area Parts of Inyo and Mono Counties, California
Map symboland soil name
Pct.of
mapunit
Rating class andlimiting features Value
Rating class andlimiting features Value
[The information in this table indicates the dominant soil condition but does not eliminate the need for onsite investigation. The numbers in the value columns range from 0.01 to 1.00. The larger the value, the greater the potential limitation. The columns that identify the rating class and limiting features show no more than five limitations for any given soil. The soil may have additional limitations. This report shows only the major soils in each map unit]
Irrigationmicro
(above ground)
Irrigationmicro
(subsurface drip)
210:
65Hesperia Somewhat limited Somewhat limited
Seepage 0.19 Seepage 0.19
20Cartago Very limited Very limited
Seepage 1.00
Low water holding capacity
0.99
Seepage 1.00
Low water holding capacity
0.99
281:
45Pits Not rated Not rated
40Dumps Not rated Not rated
318:
50Shondow Very limited Very limited
Excess Sodium 1.00
Excess Salt 0.50
Low water holding capacity
0.27
Seepage 0.19
Excess Sodium 1.00
Excess Salt 0.50
Low water holding capacity
0.27
Seepage 0.19
30Hessica Very limited Very limited
Seepage 1.00
Excess Sodium 0.99
Too alkaline 0.50
Seepage 1.00
Excess Sodium 0.99
Shrink-swell (LEP 3-6) 0.50
Too alkaline 0.50
370:
85Xerofluvents Somewhat limited Somewhat limited
Frequent or very frequent flooding
0.70
Large surface stones 0.67
Seepage 0.19
Low water holding capacity
0.06
Frequent or very frequent flooding
0.70
Large surface stones 0.67
Seepage 0.19
Low water holding capacity
0.06
Page 1
Survey Area Version: 15
Survey Area Version Date: 09/13/2017
Irrigation - Surface
Benton-Owens Valley Area Parts of Inyo and Mono Counties, California
Map symboland soil name
Pct.of
mapunit
Rating class andlimiting features Value
Rating class andlimiting features Value
[The information in this table indicates the dominant soil condition but does not eliminate the need for onsite investigation. The numbers in the value columns range from 0.01 to 1.00. The larger the value, the greater the potential limitation. The columns that identify the rating class and limiting features show no more than five limitations for any given soil. The soil may have additional limitations. This report shows only the major soils in each map unit]
Irrigationsurface(graded)
Irrigationsurface(level)
210:
65Hesperia Very limited Very limited
Rapid water movement
1.00
Slope 1.00
Seepage 0.45
Rapid water movement
1.00
Slope 1.00
Seepage 0.45
20Cartago Very limited Very limited
Rapid water movement
1.00
Seepage 1.00
Low water holding capacity
1.00
Slope 1.00
Rapid water movement
1.00
Seepage 1.00
Low water holding capacity
1.00
Slope 1.00
281:
45Pits Not rated Not rated
40Dumps Not rated Not rated
318:
50Shondow Very limited Very limited
Seepage 1.00
Excess Sodium 1.00
Excess Salt 0.50
Low water holding capacity
0.11
Seepage 1.00
Excess Sodium 1.00
Excess Salt 0.50
Low water holding capacity
0.11
30Hessica Very limited Very limited
Seepage 1.00
Excess Sodium 0.99
Too alkaline 0.50
Seepage 1.00
Excess Sodium 0.99
Too alkaline 0.50
370:
85Xerofluvents Very limited Very limited
Slope 1.00
Rapid water movement
0.71
Frequent or very frequent flooding
0.70
Seepage 0.45
Low water holding capacity
0.25
Slope 1.00
Rapid water movement
0.71
Frequent or very frequent flooding
0.70
Seepage 0.45
Low water holding capacity
0.25
Page 1
Survey Area Version: 15
Survey Area Version Date: 09/13/2017
Damage by Fire and Seedling Mortality on Forestland
Benton-Owens Valley Area Parts of Inyo and Mono Counties, California
Map symboland soil name
Pct.of
mapunit
Rating class andlimiting features Value
Rating class andlimiting features Value
[The information in this table indicates the dominant soil condition but does not eliminate the need for onsite investigation. The numbers in the value columns range from 0.01 to 1.00. The larger the value, the greater the potential limitation. The columns that identify the rating class and limiting features show no more than five limitations for any given soil. The soil may have additional limitations. This report shows only the major soils in each map unit]
Potential fordamage to soil
by fire
Potential forseedling mortality
210:
65Hesperia Low Low
20Cartago High Low
Texture/rock fragments
1.00
281:
45Pits Not rated Not rated
40Dumps Not rated Not rated
318:
50Shondow Low High
Soil reaction 1.00
Salinity 1.00
Available water 1.00
Wetness 0.50
30Hessica High Moderate
Texture/rock fragments
1.00 Soil reaction 0.50
370:
85Xerofluvents Low High
Wetness 1.00
Available water 1.00
Page 1
Survey Area Version: 15
Survey Area Version Date: 09/13/2017
Windbreaks and Environmental Plantings
Benton-Owens Valley Area Parts of Inyo and Mono Counties, California
Map symboland soil name
[Absence of an entry indicates that trees generally do not grow to the given height on the soil. This report shows only the major soils in each map unit]
8 feet or less >8 to 15 feet >15 to 25 feet >25 to 35 feet >35 feet
Trees having predicted 20-year average height of--
210:
Hesperia --- --- --- --- ---
Cartago --- --- --- --- ---
281:
Pits --- --- --- --- ---
Dumps --- --- --- --- ---
318:
Shondow --- --- --- --- ---
Hessica --- --- --- --- ---
370:
Xerofluvents --- --- --- --- ---
Page 1
Survey Area Version: 15
Survey Area Version Date: 09/13/2017
Survey Area Data Summary
Benton-Owens Valley Area Parts of Inyo and Mono Counties, California
Survey area version:
Survey area version established date:
Tabular data version:
Tabular data version established date:
Tabular data NASIS export date:
Tabular data certification status:
Tabular data certification status description:
15
9/13/2017 8:37:47 PM
10
9/13/2017 8:37:47 PM
9/11/2017 4:33:16 PM
certified, major components
A full set of national interpretations were included with the export. From the NSSC Regional group, the BLM interpretations and the AGR - Pesticide Loss interpretations were included. From Region 2, the AGR - Avocado Root Rot Hazard, AGR - CA Revised Storie Index, GRL - Western Juniper Encroachment Potential - OR, and WLF-Desert Tortoise interpretations were included.
WMS - Subsurface Water Management, System Installation 9/27/2012 8:16:35 PM 9/11/2017 4:33:24 PM
WMS - Subsurface Water Management, System Performance 9/27/2012 8:16:35 PM 9/11/2017 4:33:24 PM
WMS - Surface Water Management, System 9/27/2012 8:16:35 PM 9/11/2017 4:33:24 PM
Interpretation design date is the date that the interpretation logic was last modified.Interpretation generation date is the date that the corresponding interpretive results were actually generated.
Page 4
Survey Area Version: 15
Survey Area Version Date: 09/13/2017
Appendix 3
Preliminary Alternatives Analysis for recycled water uses in the Big Pine
RECYCLED WATER FORRESTORATION AND COMMUNITY PROJECTS
CITY OF BIG PINE, CALIFORNIA
Legend1000 ft radius
2000 ft radius
3000 ft radius
4000 ft radius
5000 ft radius
6000 ft radius
7000 ft radius
8000 ft radius
LADWP Land Holdings
Inyo Co. Parcels
Big Pine Wastewater Treatment Plant
BPPT Treatment Plant
Project K Borwns Campground
Project M BP Regreening
Project L Dog Park
Project H Putting Green
Project C Baseball Field
Project O Big Pine 20 Acre Reveg.
Project O Big Pine 160 Acre Reveg.
Prjcts. B, E, F, I, J, N, Bartell Parcel
Project Q Triangle Park
Project D (approx.) BPPT Econ. Dev.
Appendix 4
NREL Photovoltaic Solar Array Design Summary
11/22/2017 PVWatts Calculator
http://pvwatts.nrel.gov/pvwatts.php 1/1
Caution: Photovoltaic system performancepredictions calculated by PVWatts® includemany inherent assumptions anduncertainties and do not reflect variationsbetween PV technologies nor site-specificcharacteristics except as represented byPVWatts® inputs. For example, PV moduleswith better performance are notdifferentiated within PVWatts® from lesserperforming modules. Both NREL and privatecompanies provide more sophisticated PVmodeling tools (such as the System AdvisorModel at http://sam.nrel.gov) that allow formore precise and complex modeling of PVsystems.
The expected range is based on 30 years ofactual weather data at the given locationand is intended to provide an indication ofthe variation you might see. For moreinformation, please refer to this NREL report:The Error Report.
Disclaimer: The PVWatts® Model ("Model")is provided by the National RenewableEnergy Laboratory ("NREL"), which isoperated by the Alliance for SustainableEnergy, LLC ("Alliance") for the U.S.Department Of Energy ("DOE") and may beused for any purpose whatsoever.
The names DOE/NREL/ALLIANCE shall notbe used in any representation, advertising,publicity or other manner whatsoever toendorse or promote any entity that adopts oruses the Model. DOE/NREL/ALLIANCE shallnot provide
any support, consulting, training orassistance of any kind with regard to the useof the Model or any updates, revisions ornew versions of the Model.
YOU AGREE TO INDEMNIFYDOE/NREL/ALLIANCE, AND ITS AFFILIATES,OFFICERS, AGENTS, AND EMPLOYEESAGAINST ANY CLAIM OR DEMAND,INCLUDING REASONABLE ATTORNEYS'FEES, RELATED TO YOUR USE, RELIANCE,OR ADOPTION OF THE MODEL FOR ANYPURPOSE WHATSOEVER. THE MODEL ISPROVIDED BY DOE/NREL/ALLIANCE "AS IS"AND ANY EXPRESS OR IMPLIEDWARRANTIES, INCLUDING BUT NOTLIMITED TO THE IMPLIED WARRANTIES OFMERCHANTABILITY AND FITNESS FOR APARTICULAR PURPOSE ARE EXPRESSLYDISCLAIMED. IN NO EVENT SHALLDOE/NREL/ALLIANCE BE LIABLE FOR ANYSPECIAL, INDIRECT OR CONSEQUENTIALDAMAGES OR ANY DAMAGES WHATSOEVER,INCLUDING BUT NOT LIMITED TO CLAIMSASSOCIATED WITH THE LOSS OF DATA ORPROFITS, WHICH MAY RESULT FROM ANYACTION IN CONTRACT, NEGLIGENCE OROTHER TORTIOUS CLAIM THAT ARISES OUTOF OR IN CONNECTION WITH THE USE ORPERFORMANCE OF THE MODEL.
The energy output range is based onanalysis of 30 years of historical weatherdata for nearby , and is intended to providean indication of the possible interannualvariability in generation for a Fixed (openrack) PV system at this location.
203,951 kWh/Year*RESULTS
System output may range from 198,241 to 209,519kWh per year near this location.
Month Solar Radiation( kWh / m 2 / day )
AC Energy( kWh )
Energy V alue( $ )
January 4.77 13,490 1,719
February 5.41 13,743 1,751
March 6.85 18,965 2,416
April 7.50 19,479 2,482
May 7.32 19,015 2,422
June 7.35 18,078 2,303
July 7.38 18,464 2,352
August 7.54 18,743 2,388
September 7.15 17,687 2,253
October 6.13 16,601 2,115
November 5.64 15,023 1,914
December 5.19 14,662 1,868
Annual 6.52 203,950 $ 25,983
Location and Station Identification
Requested Location Big Pine, CA
Weather Data Source (TMY3) BISHOP AIRPORT, CA 15 mi
Latitude 37.37° N
Longitude 118.35° W
PV System Specifications (Commercial)
DC System Size 115 kW
Module T ype Standard
Array T ype Fixed (open rack)
Array T ilt 36°
Array Azimuth 180°
System Losses 15%
Inverter Efficiency 96%
DC to AC Size Ratio 1.1
Economics
Average Cost of Electricity Purchased from Utility 0.13 $/kWh