Office of Freight Management and Operations 1200 New Jersey Avenue SE Washington, D.C. 20590 www.ops.fhwa.dot.gov/freight 202-366-9210 FHWA’s Freight Fluidity Program – Measuring Supply Chains to Inform Planning and Investment Federal Highway Administration Office of Freight Management and Operations
Transcript
Office of Freight Management and Operations 1200 New Jersey Avenue SE Washington, D.C. 20590 www.ops.fhwa.dot.gov/freight 202-366-9210
FHWA’s Freight Fluidity Program – Measuring Supply Chains to Inform Planning and Investment
Federal Highway Administration Office of Freight Management and Operations
What is freight fluidity?
Public Sector Decision-Making
• National – National priorities and investments – National Strategic Freight Plan – Conditions and Performance Report – Programs and funding
• State and Region – State and regional transportation plans – State Freight Plans – Investments (Capital and Operational) – Economic development, corridor development
• Local – Use of highway funding for investments (Capital and Operational) – Economic development – Local plans and programs
Public Sector Freight Performance Measurement • Highway
– Truck Travel Time – Truck Counts
• Railroad – Shipper information (Waybill), tonnage, value and limited O/D.
• Air Cargo -Landing weights at cargo bearing airports
• Marine – Tonnage and Value – Vessel probe data – not public, not used
N/A Source: Transport Canada - Economic Analysis & Research
0.0
2.0
4.0
6.0
8.0
10.0
Days
of T
rans
it
Week of the Year
2012 Weekly Rail Transit time: PV to Various Destinations
Destination 1
Destination 2
Source: Transport Canada - Economic Analysis & Research
Canadian Example
9-day strike: May 23, 2012, Week 20
Return to Normal: Week 28
Residual effects Trend
Source: Transport Canada Fluidity database.
Fluidity Applications Throughout the U.S.
• Federal – FHWA TRB workshop – FHWA/DOC/I-95 Analysis – North American Transportation Statistics Interchange – North American Fluidity System implementation
• Autos – General Motors auto parts – From US and NAFTA suppliers to auto assembly plant in Tennessee
• Retail – Target® consumer goods – From Ports of Los Angeles/Long Beach and Seattle/Tacoma via
Chicago to metropolitan New York
• Electronics – Panasonic electronics – Between manufacturing and assembly facilities in San Diego and
Tijuana
• Agriculture – Soybean exports – From Illinois farms to Louisiana port
• Food – Perdue processed chicken – From Delmarva region to Mid-Atlantic markets
18
Retail Supply Chain (Target)
19
Retail Supply Chain Measures Seattle to New York
20
Links and Nodes Sources Notes West Coast port (Seattle) Dray move ATRI, Chainalytics Transload or Consolidation Center Dray move ATRI, Chainalytics West Coast rail intermodal terminal TransCore, Chainalytics Rail move TransCore, Chainalytics Midwest rail intermodal interchange TransCore, Chainalytics Rail move Available for purchase East Coast rail intermodal terminal Available for purchase Dray move ATRI, Chainalytics East Coast Regional Distribution Center Truck P&D move ATRI, Chainalytics Retail Store
Retail Supply Chain Performance Seattle to New York
21
Links and Nodes Transit Time/Dwell Time
(Hours) Reliability
(95% travel time) Cost
(2014 $’s) West Coast port (Seattle)
Dray move 1.0 1.4 $299
Transload or Consolidation Center
Dray move 1.0 2.25 $308
West Coast rail intermodal terminal 20
Rail move 104 154 $3,178
Midwest rail intermodal interchange 71 160
Rail move
East Coast rail intermodal terminal
Dray move 1.1 1.4 $318
East Coast Regional Distribution Center
Truck P&D move 6.0 9.5 $775
Retail Store
Totals $4,878
Estimated using ATRI data for truck transit times, TransCore data for rail times, Chainalytics data for costs. Reliability factor for Midwest interchange was produced for sum of West Coast plus Midwest dwell, but most of delay is in Midwest (Chicago)
Retail Supply Chain Measures Los Angeles/Long Beach to New York
22
Links and Nodes Source Notes West Coast port Dray move ATRI, Chainalytics
Transload or Consolidation Center Dray move ATRI, Chainalytics
West Coast rail intermodal terminal Available for purchase Rail move Available for purchase Midwest rail intermodal interchange Available for purchase Rail move Available for purchase East Coast rail intermodal terminal Available for purchase
Dray move ATRI, Chainalytics
East Coast Regional Distribution Center Truck P&D move ATRI, Chainalytics
Retail Store
Retail Supply Chain Performance Los Angeles/Long Beach to New York
23
Links and Nodes Transit Time/Dwell Time
(Hours) Reliability
(95% travel time) Cost
(2014 $’s) West Coast port (LA/SB)
Dray move 1.3 1.8 $326
Transload or Consolidation Center
Dray move 0.4 0.5 $259
West Coast rail intermodal terminal
Rail move $3,742
Midwest rail intermodal interchange
Rail move
East Coast rail intermodal terminal
Dray move 1.1 1.4 $318
East Coast Regional Distribution Center
Truck P&D move 6.0 9.5 $775
Retail Store
Totals $5,420
Estimated using ATRI data for truck transit times, Chainalytics for costs
Electronics Supply Chain (Panasonic)
24
Border Crossing Otay Mesa
Production Facility
San Diego, CA
Production Facility
Tijuana, Mexico
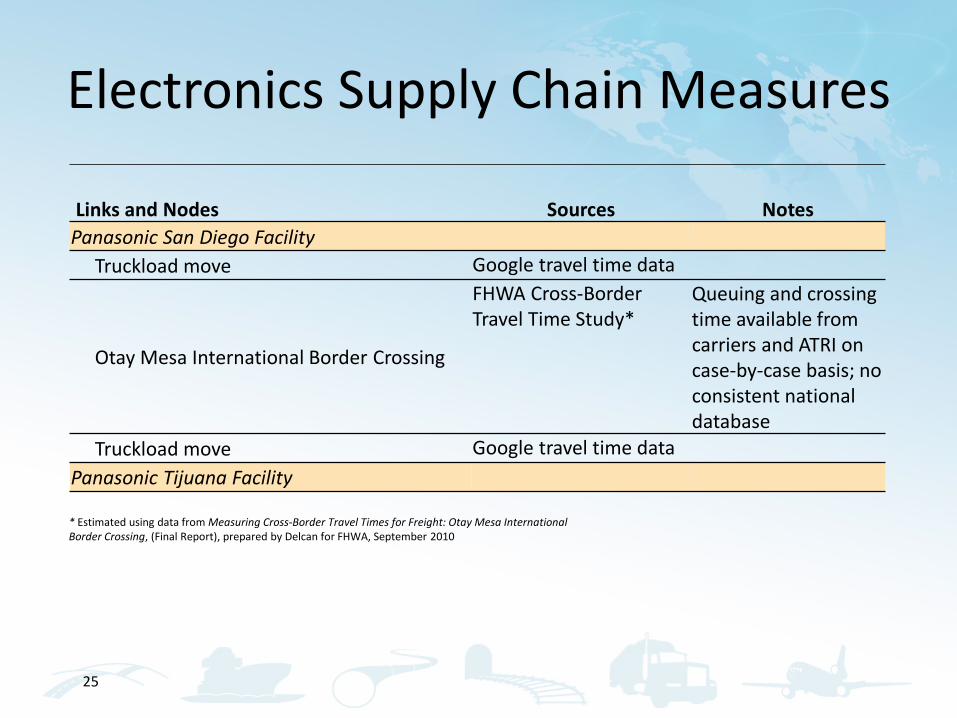
Electronics Supply Chain Measures
25
Links and Nodes Sources Notes Panasonic San Diego Facility Truckload move Google travel time data
Otay Mesa International Border Crossing
FHWA Cross-Border Travel Time Study*
Queuing and crossing time available from carriers and ATRI on case-by-case basis; no consistent national database
Truckload move Google travel time data Panasonic Tijuana Facility
* Estimated using data from Measuring Cross-Border Travel Times for Freight: Otay Mesa International Border Crossing, (Final Report), prepared by Delcan for FHWA, September 2010
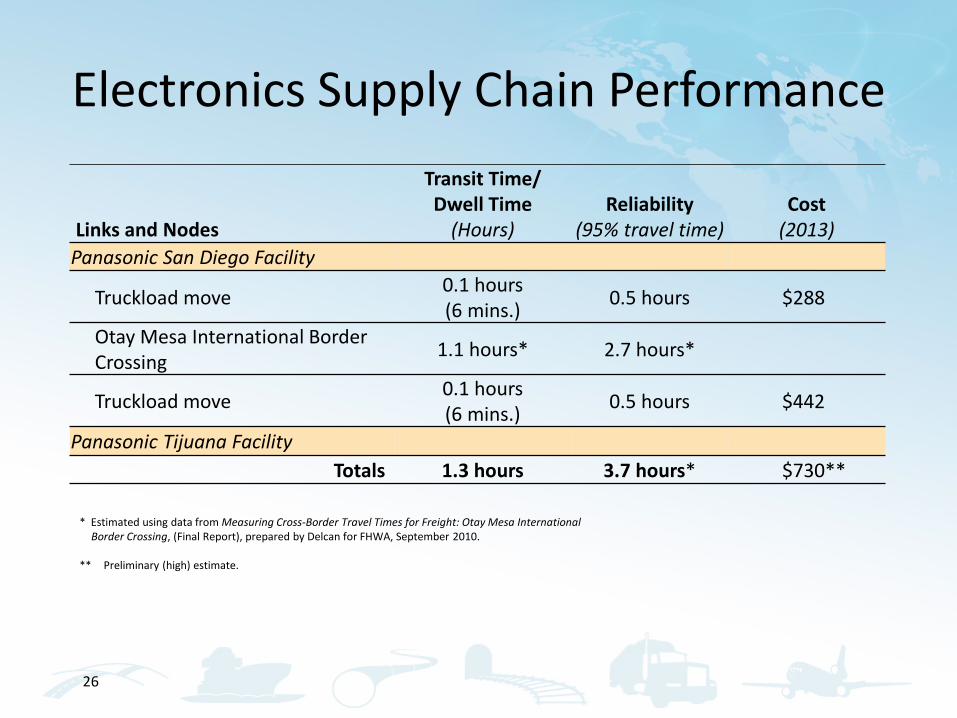
Electronics Supply Chain Performance
26
Links and Nodes
Transit Time/ Dwell Time
(Hours) Reliability
(95% travel time) Cost
(2013) Panasonic San Diego Facility
Truckload move 0.1 hours (6 mins.) 0.5 hours $288
Otay Mesa International Border Crossing 1.1 hours* 2.7 hours*
* Estimated using data from Measuring Cross-Border Travel Times for Freight: Otay Mesa International Border Crossing, (Final Report), prepared by Delcan for FHWA, September 2010.
** Preliminary (high) estimate.
North American Fluidity Analysis: Automotive Supply Chain with Border Crossing
FHWA Probe Data Representation of the Same Automotive Supply Chain
Fluidity Next Steps
• Implement U.S. and potential North America fluidity measurement program.
• Work with partners on continued supply chain analysis, state and regional analyses.
• Improve data and analytical options.
• Investigate Big Data – aggregated transactional data options.