1 PROSPECTUS FOR TREASURY BILL ISSUES FOR THE PERIOD JULY 2011– JUNE 2012 BY THE GOVERNMENT OF ST. VINCENT AND THE GRENADINES Ministry of Finance Administrative Centre P.O. Box 608 Kingstown ST. VINCENT AND THE GRENADINES e-mail: [email protected]Tel: (784) 456-1111 Ext368 Fax: (784) 457-2943 The Prospectus has been drawn up in accordance with the rules of the Regional Government Securities Market. The Regional Debt Co-ordinating Committee and Eastern Caribbean Central Bank accept no responsibility for the content of this Prospectus, make no representations as to its accuracy or completeness and expressly disclaim any liability whatsoever for any loss whatsoever arising from or reliance upon the whole or any part of the contents of this Prospectus. If you are in doubt about the contents of this document or need financial or investment advice you should consult a person licensed under the Securities Act or any other duly qualified person who specialises in advising on the acquisition of government instruments or other securities. July 2011
Transcript
1
PROSPECTUS
FOR TREASURY BILL ISSUES FOR THE PERIOD
JULY 2011– JUNE 2012
BY THE GOVERNMENT OF ST. VINCENT AND THE GRENADINES
The Prospectus has been drawn up in accordance with the rules of the Regional Government Securities Market. The Regional Debt Co-ordinating Committee and Eastern Caribbean Central Bank accept no responsibility for the content of this Prospectus, make no representations as to its accuracy or completeness and expressly disclaim any liability whatsoever for any loss whatsoever arising from or reliance upon the whole or any part of the contents of this Prospectus. If you are in doubt about the contents of this document or need financial or investment advice you should consult a person licensed under the Securities Act or any other duly qualified person who specialises in advising on the acquisition of government instruments or other securities.
July 2011
2
TABLE OF CONTENTS I. GENERAL INFORMATION ................................................................................................................................4
II. INFORMATION ON THE TREASURY BILL ISSUE ......................................................................................5
III EXECUTIVE SUMMARY....................................................................................................................................8
IV. HISTORY ..............................................................................................................................................................9
V. DEMOGRAPHICS...............................................................................................................................................10
VI. FINANCIAL ADMINISTRATION AND MANAGEMENT .........................................................................10 TRANSPARENCY AND ACCOUNTABILITY..................................................................................................................11
VII. MACRO ECONOMIC PERFORMANCE......................................................................................................12 ECONOMIC GROWTH .............................................................................................................................................12 INFLATION ..............................................................................................................................................................12
VIII. SECTORAL DEVELOPMENTS .................................................................................................................13 TOURISM...................................................................................................................................................................14 MANUFACTURING .....................................................................................................................................................15 CONSTRUCTION.........................................................................................................................................................15
IX. BALANCE OF PAYMENTS .............................................................................................................................15 THE CURRENT ACCOUNT.........................................................................................................................................16 THE CAPITAL AND FINANCIAL ACCOUNT .................................................................................................................17
X. GOVERNMENT FISCAL OPERATIONS ......................................................................................................17 REVENUE .................................................................................................................................................................18 EXPENDITURE ........................................................................................................................................................ 19 2011 REVENUE AND EXPENDITURE BUDGET............................................................................................................. 19 MEDIUM TERM PROJECTIONS (2011-2013)...........................................................................................................20
XI PUBLIC DEBT.....................................................................................................................................................20 EXTERNAL DEBT......................................................................................................................................................21 DOMESTIC DEBT ......................................................................................................................................................22 DEBT SERVICE .........................................................................................................................................................22 LEGISLATIVE AUTHORITY........................................................................................................................................23 DEBT PROJECTIONS..................................................................................................................................................24
DEBT STRATEGY 2011 -2013 ................................................................................................................................24 MEDIUM TERM STRATEGY.......................................................................................................................................25
XII. MONEY AND CREDIT..................................................................................................................................26
XIII. MONEY TRANSFER COMPANIES...........................................................................................................27
XIV. INSURANCE SECTOR.................................................................................................................................27
XV. MONEY LAUNDERING AND ILLICIT ACTIVITIES..............................................................................29
3
XVI. BANKING AND FINANCIAL INSTITUTIONS ........................................................................................30 OVERVIEW ...............................................................................................................................................................30
XVII. CURRENT ISSUES OF GOVERNMENT SECURITIES. .........................................................................32 1. TREASURY BILLS...........................................................................................................................................32 2. BONDS ..........................................................................................................................................................32
XVIII SECURITY ISSUANCE PROCEDURES, CLEARING AND SETTLEMENT, REGISTRATION OF OWNERSHIP AND SECONDARY MARKET ACTIVITY.................................................................................34
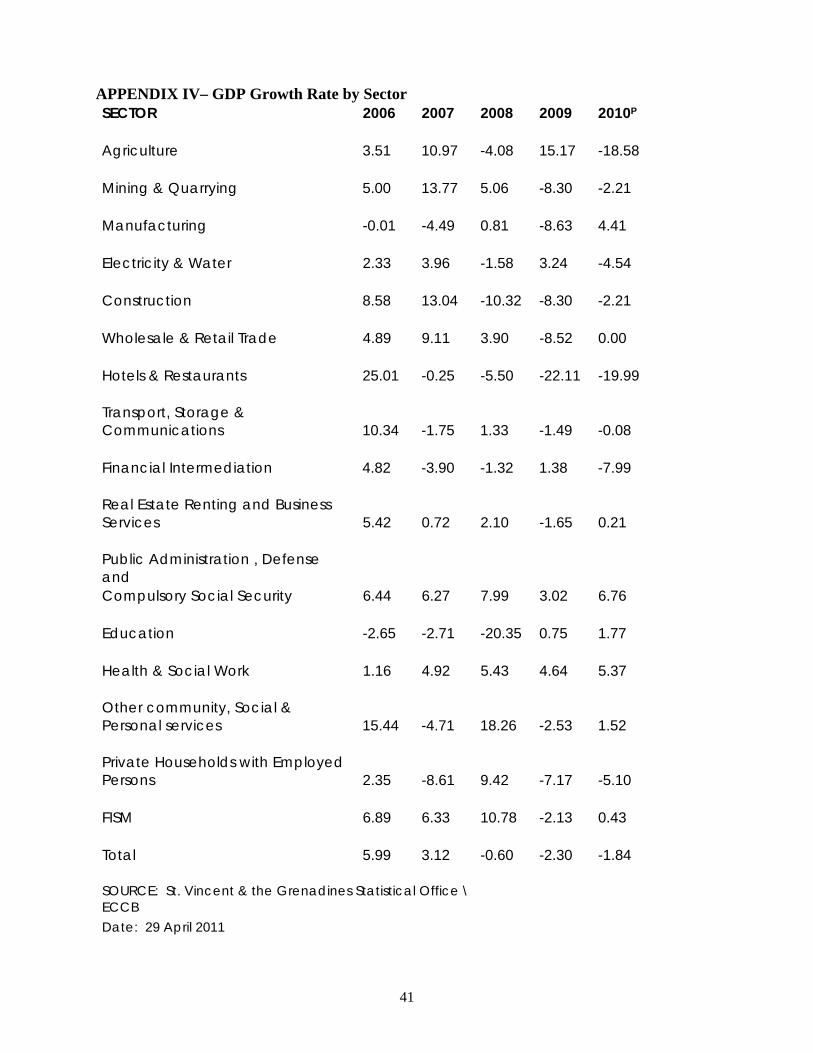
APPENDIX I - LIST OF LICENSED INTERMEDIARIES APPENDIN II - GOVERNMENT FISCAL OPERATIONS APPENDIX III – GOVERNMENT FISCAL OPERATIONS (% growth) APPENDIX IV- GDP GROWTH RATE BY SECTOR APPENDIX V BALANCE OF PAYMENTS SUMMARY APPENDIX VI – SELECTED PUBLIC SECTOR DEBT INDICATORS
4
I. GENERAL INFORMATION Issuer: The Government of St. Vincent and the Grenadines Address: The Ministry of Finance and Planning Administrative Centre P.O. Box 608 Bay Street Kingstown St. Vincent and the Grenadines E-mail: [email protected] Telephone No.: (784) 456-1111 Ext. 368 Facsimile No.: (784) 457-2943 Contact Persons: Hon. Dr. Ralph E. Gonsalves, Prime Minister and Minister of Finance
Mr. Maurice Edwards, Director General, Ministry of Finance Mrs. Ingrid Fitzpatrick, Accountant General
Ms. Deidre Anthony, Debt Manager Date of Publication: July 2011 Registration: This prospectus will be registered with the Regional Debt Coordinating Committee (RDCC). Purpose of Issue: To refinance the existing issues of Treasury Bills issued on the Primary Market via the Regional Government Securities Market (RGSM) and to provide for liquidity in these instruments by virtue of being traded on the Secondary Market via the Eastern Caribbean Securities Exchange (ECSE) platform. Amount of Issue: Monthly issues of XCD25.0 million each Broker: Bank of St Vincent and the Grenadines Ltd Legislative Authority: The Treasury Bills Act Chapter 320 as amended This Prospectus is issued for the purpose of giving information to the public. The Government of St. Vincent and the Grenadines accepts full responsibility for the accuracy of the information given, and confirm having made all reasonable enquiries, that to the best of its knowledge and belief there are no other facts, the omission of which would make any statement in this prospectus misleading.
5
II. INFORMATION ON THE TREASURY BILL ISSUE
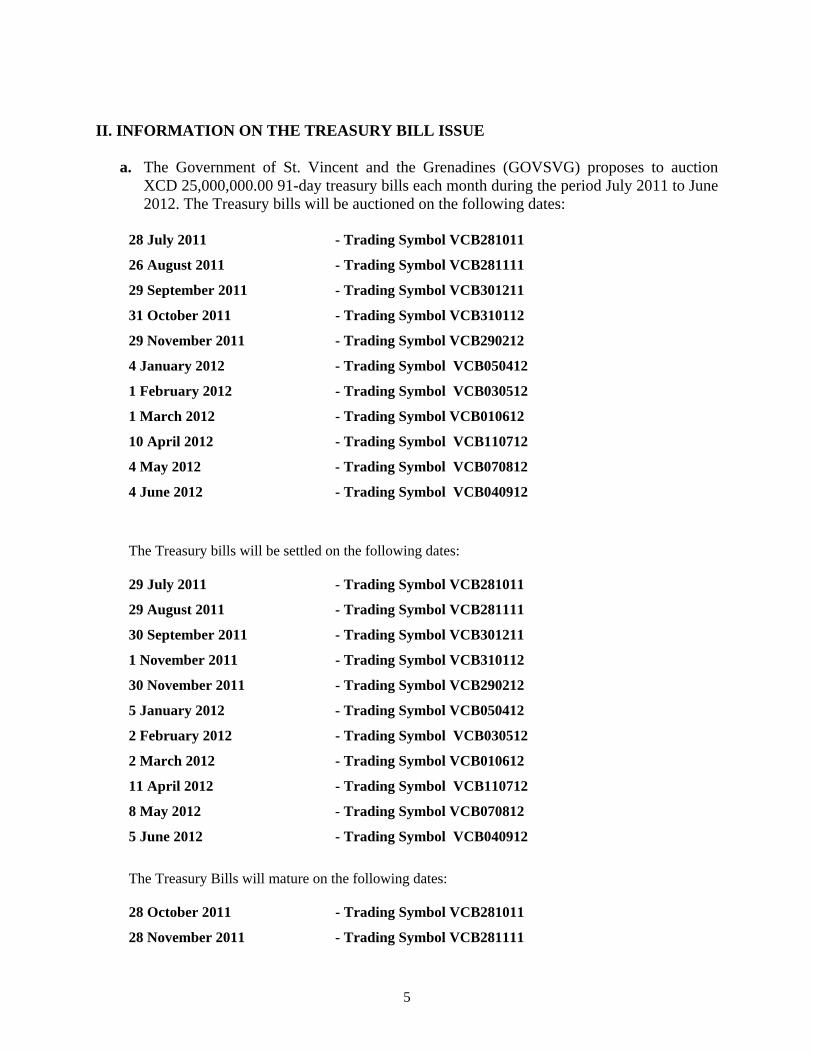
a. The Government of St. Vincent and the Grenadines (GOVSVG) proposes to auction XCD 25,000,000.00 91-day treasury bills each month during the period July 2011 to June 2012. The Treasury bills will be auctioned on the following dates:
28 July 2011 - Trading Symbol VCB281011
26 August 2011 - Trading Symbol VCB281111
29 September 2011 - Trading Symbol VCB301211
31 October 2011 - Trading Symbol VCB310112
29 November 2011 - Trading Symbol VCB290212
4 January 2012 - Trading Symbol VCB050412
1 February 2012 - Trading Symbol VCB030512
1 March 2012 - Trading Symbol VCB010612
10 April 2012 - Trading Symbol VCB110712
4 May 2012 - Trading Symbol VCB070812
4 June 2012 - Trading Symbol VCB040912
The Treasury bills will be settled on the following dates: 29 July 2011 - Trading Symbol VCB281011
29 August 2011 - Trading Symbol VCB281111
30 September 2011 - Trading Symbol VCB301211
1 November 2011 - Trading Symbol VCB310112
30 November 2011 - Trading Symbol VCB290212
5 January 2012 - Trading Symbol VCB050412
2 February 2012 - Trading Symbol VCB030512
2 March 2012 - Trading Symbol VCB010612
11 April 2012 - Trading Symbol VCB110712
8 May 2012 - Trading Symbol VCB070812
5 June 2012 - Trading Symbol VCB040912
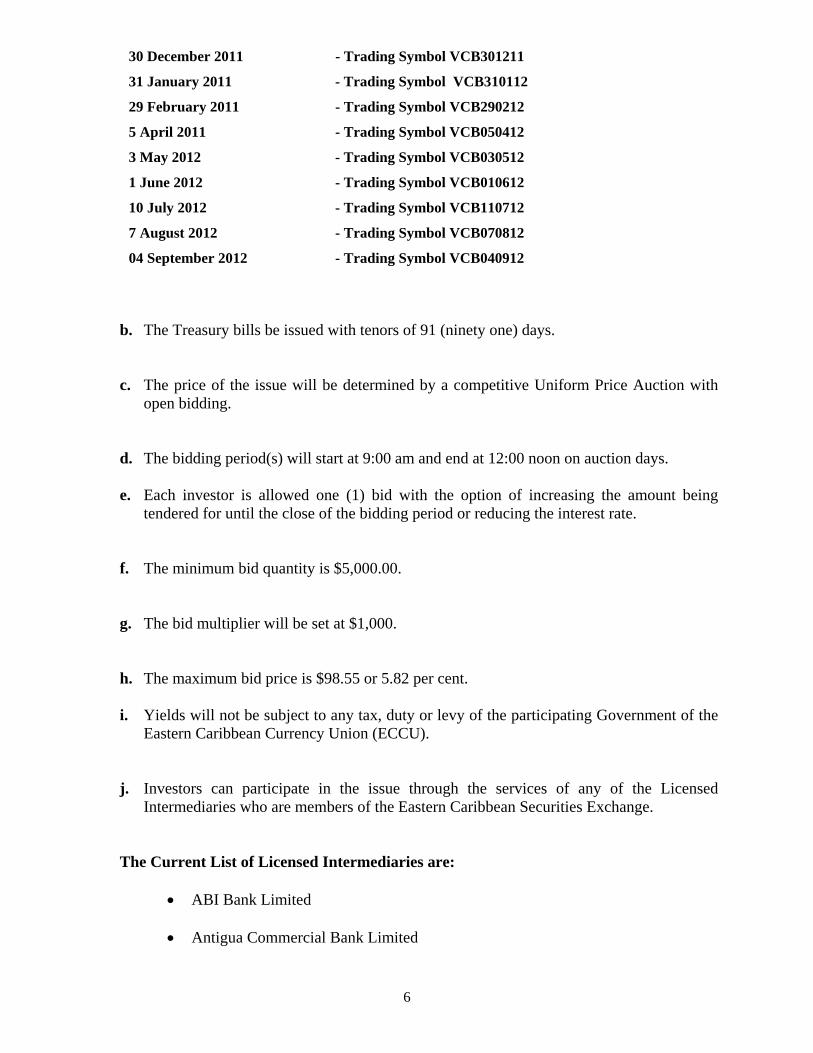
The Treasury Bills will mature on the following dates: 28 October 2011 - Trading Symbol VCB281011
28 November 2011 - Trading Symbol VCB281111
6
30 December 2011 - Trading Symbol VCB301211
31 January 2011 - Trading Symbol VCB310112
29 February 2011 - Trading Symbol VCB290212
5 April 2011 - Trading Symbol VCB050412
3 May 2012 - Trading Symbol VCB030512
1 June 2012 - Trading Symbol VCB010612
10 July 2012 - Trading Symbol VCB110712
7 August 2012 - Trading Symbol VCB070812
04 September 2012 - Trading Symbol VCB040912
b. The Treasury bills be issued with tenors of 91 (ninety one) days. c. The price of the issue will be determined by a competitive Uniform Price Auction with
open bidding.
d. The bidding period(s) will start at 9:00 am and end at 12:00 noon on auction days.
e. Each investor is allowed one (1) bid with the option of increasing the amount being
tendered for until the close of the bidding period or reducing the interest rate.
f. The minimum bid quantity is $5,000.00.
g. The bid multiplier will be set at $1,000.
h. The maximum bid price is $98.55 or 5.82 per cent.
i. Yields will not be subject to any tax, duty or levy of the participating Government of the Eastern Caribbean Currency Union (ECCU).
j. Investors can participate in the issue through the services of any of the Licensed Intermediaries who are members of the Eastern Caribbean Securities Exchange.
The Current List of Licensed Intermediaries are:
• ABI Bank Limited
• Antigua Commercial Bank Limited
7
• Bank of Nevis Limited
• ECFH Global Investment Solutions Limited
• Bank of St Vincent and the Grenadines Ltd
• National Mortgage Finance Company of Dominica Limited
• St. Kitts Nevis Anguilla National Bank Limited
• Financial Investment and Consultancy Services Ltd – Saint Lucia
• First Citizens Investment Services Limited – Saint Lucia
• First Citizens Investment Services Limited – Trinidad and Tobago
• National Bank of Anguilla
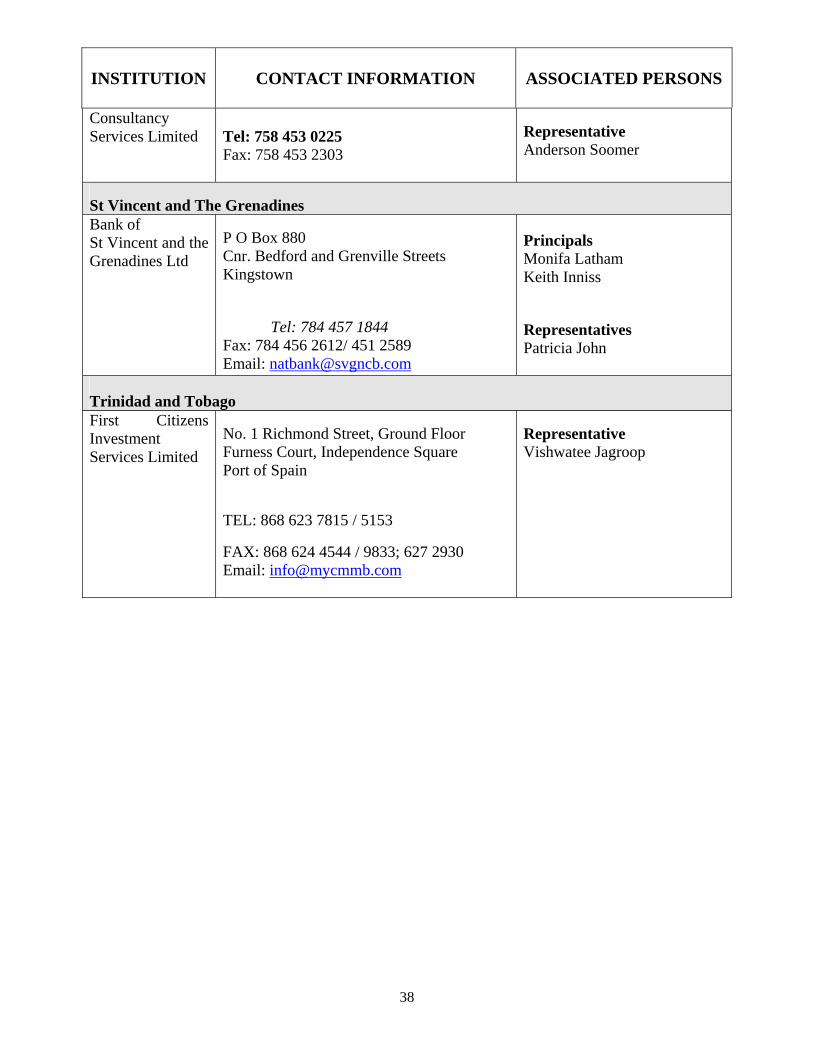
Contact information for the Intermediaries is presented in Appendix I.
8
III EXECUTIVE SUMMARY
The Government of St. Vincent and the Grenadines is proposing to raise EC$25 million monthly
during the period July 2011 to June 2012 through the issuance of 91-day Treasury Bills to be
auctioned on the Regional Government Securities Market. During the bidding periods, which
will be opened at 9:00 a.m. on the auction days and closed at 12:00 noon on the same days, bids
of amounts of not less than EC$5,000 and in multiples of EC$1,000 will be processed through
intermediaries licensed by the Eastern Caribbean Securities Regulatory Commission. The
proceeds of these issues will be used to refinance maturing treasury bills.
Preliminary estimates indicate that economic activity contracted further in 2010 as a result of a
prolonged drought in the first half of the year and the effects of hurricane Tomas in the latter part of the
year. In addition, the housing and economic infrastructure were severely damaged as a result of the high
winds and landslides associated with the hurricane.
For the fiscal year ending December 31, 2010 the central government fiscal position improved
when compared to 2009. Current revenue which totalled $482.46 million increased by 3.5 per
cent, while current expenditure rose by 2.4per cent to $481.19 million during the period.
Consequently the central government current balance improved, moving from a deficit of $3.38
million in 2009 to a surplus $1.27 million in 2010. The overall balance also improved, moving
from a deficit of $54.99 million in 2009 to a surplus of $12.56 million in 2010.
Preliminary indicators are that the total public sector debt as at December 30th, 2010 stood at
EC$1.22 billion representing a 5.2 per cent increase over December 30th 2009. Concomitant
with the increase in the stock of debt was an increase in debt service. Central Government total
debt service including sinking fund contributions amounted to $122.2 million in 2010 an increase
of 5 per cent over the 2009 amount of $116.33.
Even as the international financial crises have began to ease in some countries, its impact will
continue to threaten growth potential during the medium term. The tourism sector is likely to be
affected as the main tourism source countries battle with recovery. Consequently, the
government is continuing a series of measures designed to bring relief to the tourism sector in an
effort to cushion the impact of the global slowdown.
9
IV. HISTORY
Known by the Caribs as “Hairoun” (Land of the Blessed), St. Vincent and the Grenadines was
first inhabited by the Ciboney, a group of Meso-Indians. The economy of these hunter-gatherers
depended heavily on marine resources as well as the land. Another indigenous group, the
Arawak, who entered the West Indies from Venezuela, gradually displaced the Ciboney. Then
less than 100 years before the European settlers, the Caribs arrived in the islands and conquered
the Arawak.
The first permanent settlers arrived on the shores of the islands in 1635. These new inhabitants
were African slaves who escaped the sinking of the Dutch slave ship on which they were being
transported. The escaped Africans intermarried with the Caribs and became known as “black
Caribs”. After several skirmishes, the black Caribs and the original Carib Indians agreed in 1700
to subdivide the islands between themselves; the original Carib Indians occupying the Leeward
and the Black Caribs, the Windward.
In 1763, St. Vincent and the Grenadines was ceded to Britain. Restored to French rule in 1779,
St. Vincent and the Grenadines was regained by the British under the Treaty of Versailles in
1783. Conflict between the British and the black Caribs continued until 1796, when General
Abercrombie crushed a revolt fomented by the French radical Victor Hugues. More than 5,000
black Caribs were eventually deported to Roatan, an island off the coast of Honduras.
From 1763 until independence, St. Vincent and the Grenadines passed through various stages of
colonial status under the British. A representative assembly was authorized in 1776, Crown
Colony government installed in 1877, a legislative council created in 1925, and universal adult
suffrage granted in 1951. During this period, the British made several unsuccessful attempts to
affiliate St. Vincent and the Grenadines with other Windward Islands in order to govern the
region through a unified administration. The most notable was the West Indies Federation,
which collapsed in 1962. St. Vincent and the Grenadines was granted associate statehood status
in 1969, giving it complete control over its internal affairs. Following a referendum in 1979, St.
Vincent and the Grenadines became the last of the Windward Islands to gain independence and
became a member of the Commonwealth of Nations.
10
V. DEMOGRAPHICS
The last population census for St. Vincent and the Grenadines which was conducted in 2001
estimated the population at one hundred and twelve thousand (112,000) with GDP per capita of
US$3,116 compared with a 2000 GDP per capita of US$3,055. In 2001, males accounted for
50.9 per cent of the population while females accounted for 49.1 per cent, indicating that at the
last census the sex ratio of the population was almost equal. This is consistent with the findings
of the 1991 census. St. Vincent and the Grenadines has an area of 388 sq. km and population
density per sq. km of 288. Life expectancy at birth is 68.8 years and infant mortality rate, per
thousand live births is 16.3.
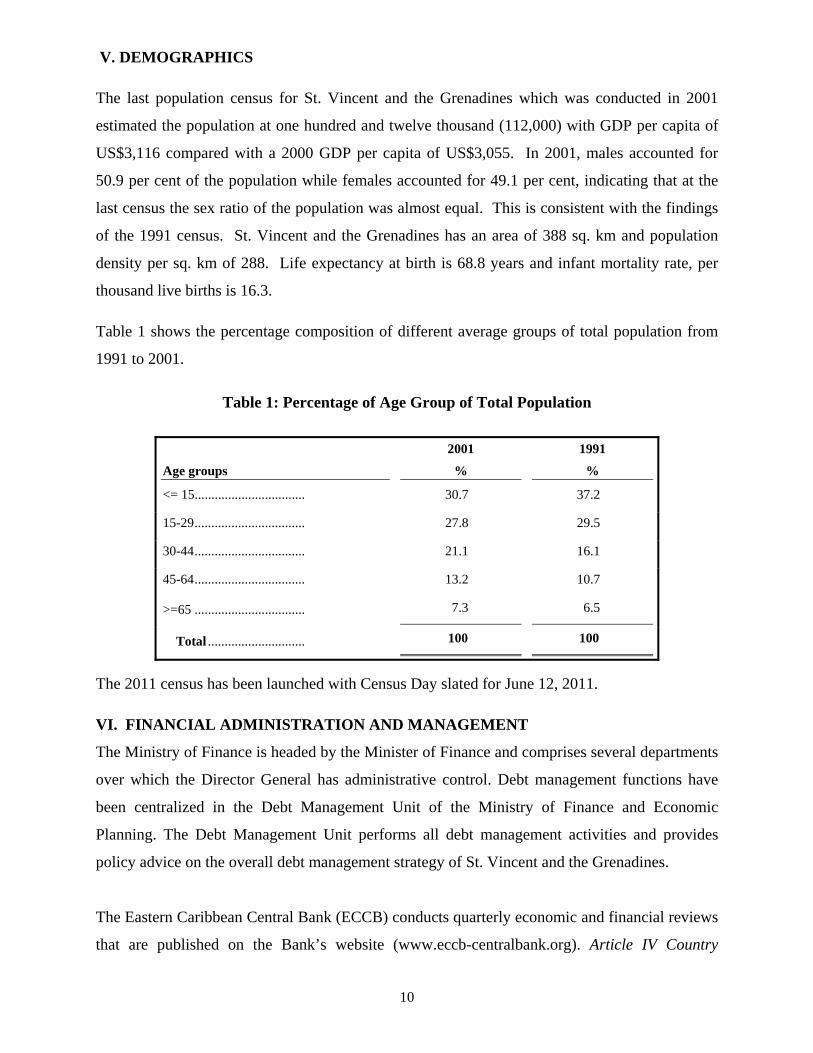
Table 1 shows the percentage composition of different average groups of total population from
1991 to 2001.
Table 1: Percentage of Age Group of Total Population
Age groups
2001
%
1991
%
<= 15................................. 30.7 37.2
15-29................................. 27.8 29.5
30-44................................. 21.1 16.1
45-64................................. 13.2 10.7
>=65 ................................. 7.3 6.5
Total ............................. 100 100
The 2011 census has been launched with Census Day slated for June 12, 2011.
VI. FINANCIAL ADMINISTRATION AND MANAGEMENT
The Ministry of Finance is headed by the Minister of Finance and comprises several departments
over which the Director General has administrative control. Debt management functions have
been centralized in the Debt Management Unit of the Ministry of Finance and Economic
Planning. The Debt Management Unit performs all debt management activities and provides
policy advice on the overall debt management strategy of St. Vincent and the Grenadines.
The Eastern Caribbean Central Bank (ECCB) conducts quarterly economic and financial reviews
that are published on the Bank’s website (www.eccb-centralbank.org). Article IV Country
11
Reviews conducted by the International Monetary Fund (IMF) are also published and available
on the Fund’s Website (www.imf.org)
The Ministry of Finance and Economic Planning seeks to establish a client-oriented environment
conducive to the attainment of sustainable economic development and improvement of the
quality of life of all citizens of St. Vincent and the Grenadines through sound economic
management and the promotion of good governance.The main objective of the Government is to
maintain a stable and productive economy, with a focus on education and training, sharpened
business competitiveness, further tax reductions, sensible debt management and fiscal
consolidation. The Government aims to build a modern, competitive, post-colonial economy
with the following central elements:
i) maintaining macro-economic fundamentals of a stable currency, low inflation,
fiscal prudence, enhanced competitiveness, and increased productivity;
ii) placing social equity at the center of the considerations in the fashioning of
economic policy;
iii) pursuing a policy of balanced economic growth which is sustainable and which
generates quality employment;
iv) establishing partnerships with the Private Sector for creating wealth and to boost
economic activity;
v) implementing a Public Sector Investment Programme to create, among other things,
a fiscal stimulus to the economy;
vi) providing an appropriate balance between the conflicting objectives of injecting a
fiscal stimulus and maintaining a sustainable debt path ;
vii) education and training for living and production; and
viii) deepening regional integration and integrated production.
Transparency and Accountability The Government has adopted a system for strengthening the institutional framework for
democratic accountability and monitoring of fiscal matters. As a result, the fiscal position of the
Government is reported monthly to the Cabinet. Additionally the fiscal and debt position are
reported annually in the Government Estimates of Revenue and expenditure, which is available
to the public from the Ministry of Finance. Information on the government’s fiscal and debt
operations is also published quarterly via the local media and the government’s website. The
ECCB also conducts quarterly economic and financial reviews, which are published across the
12
region annually. Article IV Country Reviews conducted by the IMF are also published and are
available on the fund’s external website. Further, efforts are being made to have the Audited
Reports of the government available on a more timely basis. The latest Audited Report of the
government for the fiscal year 2007 was laid before the Parliament on March 4th 2010.
VII. MACRO ECONOMIC PERFORMANCE
Economic Growth
Preliminary estimates indicate that economic activity in St. Vincent and the Grenadines
contracted in 2010 albeit at a reducing rate when compared to 2009. Real GDP is estimated to
have declined by 1.8 percent in 2010 compared to a 2.3 percent decline in 2009. This
performance was largely attributed to decline in the agriculture, hotels and restaurants,
construction and, Financial Intermediation sectors.
Inflation
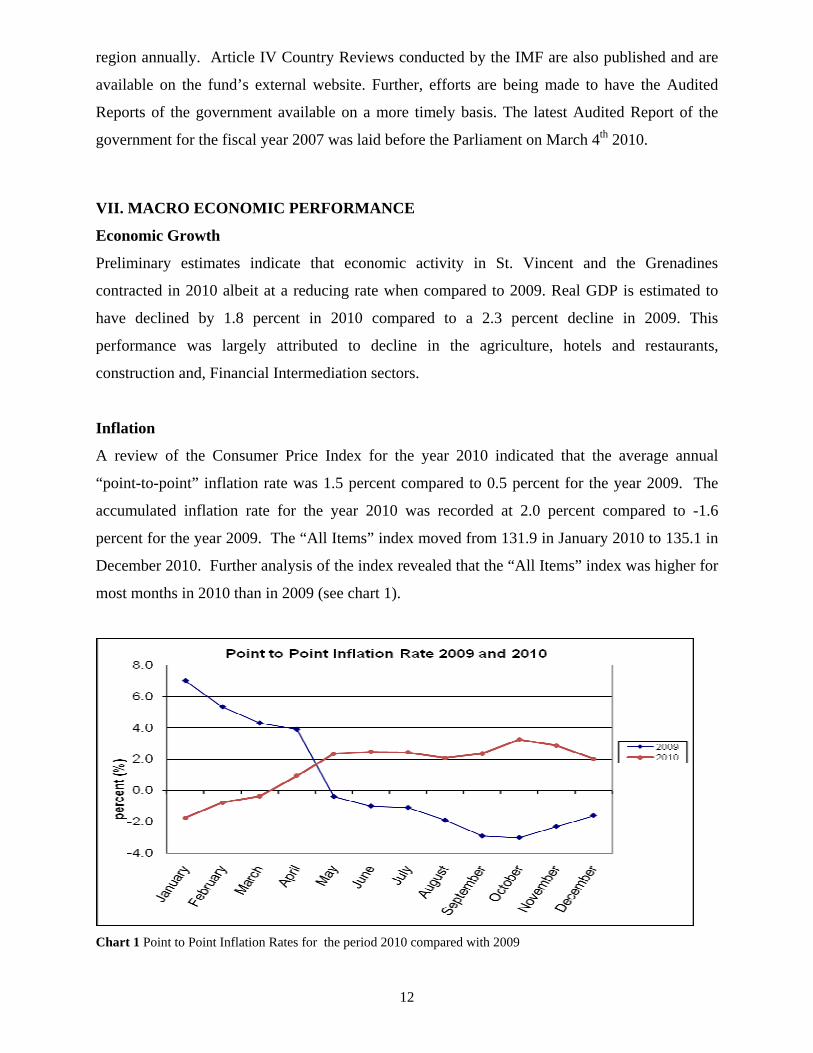
A review of the Consumer Price Index for the year 2010 indicated that the average annual
“point-to-point” inflation rate was 1.5 percent compared to 0.5 percent for the year 2009. The
accumulated inflation rate for the year 2010 was recorded at 2.0 percent compared to -1.6
percent for the year 2009. The “All Items” index moved from 131.9 in January 2010 to 135.1 in
December 2010. Further analysis of the index revealed that the “All Items” index was higher for
most months in 2010 than in 2009 (see chart 1).
Chart 1 Point to Point Inflation Rates for the period 2010 compared with 2009
13
The monthly inflation fluctuated throughout the year 2010 with the lowest recorded as -0.4
percent for the month of January and the highest 0.8 percent for the month of April. For the
months of July, August and December 2010 the monthly inflation rate was less than half a
percentage point. The “point-to-point” inflation rates were higher in 2010 compared to 2009
which recorded mostly negative rates.
VIII. SECTORAL DEVELOPMENTS Agriculture
In spite of the several challenges that continue to affect agriculture this sector continues to play a
significant role in the economy of St. Vincent and the Grenadines. It is the economic mainstay
and contributes immensely to economic and social development, particularly as it relates to the
livelihoods of rural peoples. Agricultural output decreased from EC106.56 million in 2009 to
EC$86.76 million in 2010 resulting in 6.24 percent contribution to GDP in 2010 compared with
7.53 percent in 2009. This decreased output can be attributed to the effects of a prolonged
drought in the first half of 2010 and the damages caused by hurricane Tomas, particularly to the
banana and plantain crops which were completely destroyed. The report of the core Damage and
Needs Assessment Committee estimated the damage to the agriculture sector at $35.0 million. In
the face of the destruction caused by Tomas, the Government immediately mobilised and
fashioned, a many-faceted and well structured recovery and rehabilitation programme. It
involves continued assistance to banana farmers, with income and input support aimed at
facilitating the replanting of over 2,000 acres of bananas and 1,800 acres of plantains; assistance
to vegetable and fruit crop farmers with planting materials, seedlings and fertilizers, technical
assistance to livestock farmers for the refurbishment of their animal houses, the replacement of
livestock, and the provision of feeds.
The Recovery and Rehabilitation Plan also takes into consideration the promotion of
programmes in support of production, technical support, training and education of over 2,100
farmers in production technologies, agri-business management, good agricultural practices and
pest and disease control. These measures are expected to see improvements in the sector in the
medium term.
14
Tourism
Tourism, as measured by the Hotels and Restaurants sub-sector, declined from EC$36.3 million
in 2009 to EC$29.0 million in 2010.resulting in 2.1 percent contribution to GDP compared to 2.6
percent in 2009. Tourism is a key employment sector and contributes significantly to
Government revenue.
Visitor arrivals during the year 2010 decreased by 14.7 per cent to 231,121 compared with
270,912 for the period 2009. The sector recorded decline in cruise ship passengers, stay-over and
same-day, while yacht visitors registered an increase. Activity in the cruise ship sector decreased
by 25.8 per cent to 110,954 in 2010 compared with 146,462 during the corresponding period in
2009. In contrast, activity in the yachting sub-sector increased by 4.3 per cent, while the stay-
over visitor arrivals decreased by 3.9 per cent with 72,478 in 2010 compared to 75,446 over the
comparative period in 2009.
Table 1. Visitor Arrivals By Visitor Type
DEC DEC JAN - DEC JAN - DEC ACTUAL % VISITOR TYPE
2010 2009 2010 2009 CHANGE CHANGE BY AIR
STAY-OVER 9,034 9,600 72,478 75,446 (2,968) (3.9)
SAME DAY 434 425 5,086 5,185 (99) (1.9)
SUB TOTAL 9,468 10,025 77,564 80,631 (3,067) (3.8)
SUB TOTAL 23,903 34,058 153,557 190,321 (36,764) (19.3)
TOTAL 33,371 44,083 231,121 270,952 (39,831) (14.7)
Source: St. Vincent and the Grenadines Tourism Authority
The majority of the country’s tourists come from the Caribbean U.S.A, Europe, South America
and Canada,. In 2010, 33.1 per cent of the stay-over visitors came from the Caribbean, followed
by 29.7 per cent from the U.S.A, 16.7 per cent from the U.K., 9.4 per cent from Canada and 11.1
per cent from other countries.
15
The government continues to be cognizant of the importance of this sector to the overall
economic performance, including foreign exchange earnings and employment opportunities.
Thus, in 2011, efforts will be made to collaborate with the private sector to facilitate the
implementation of the following pipeline projects:
1. The continued development of the Buccama Resorts.
2. The development of the Adams Bay Hotel Project on Bequia.
3. The expansion of the Resort on Canouan involving the existing developers and new equity partners from international tourism.
4. The development of a 55 room resort on Mayreau.
5. The development of hotel and associated tourism facilities at Chatham Bay and Ashton, Union Island.
6. The planned expansion and further development of the Petit St. Vincent Resort.
7. The further development of Palm Island.
Manufacturing
St. Vincent and the Grenadines has a small manufacturing sector which contributed 4.7 per cent
of the economy’s GDP in 2010, a marginal increase from 4.4 per cent in 2009. The Government
is continuing its effort to make the sector internationally competitive by providing incentives to
local companies to increase their productivity. These include the reduction of Company Income
Tax and the development of the Small and Medium Enterprise (SME) sector by increasing
access to credit and improving business and entrepreneurial skills of the labor force.
Construction
The construction sector declined marginally in 2010 contributing 9.03 percent to GDP compared
with 9.06 percent in 2009. The decline in the construction sector was influenced by lower levels
of investment in both the public and private sectors.
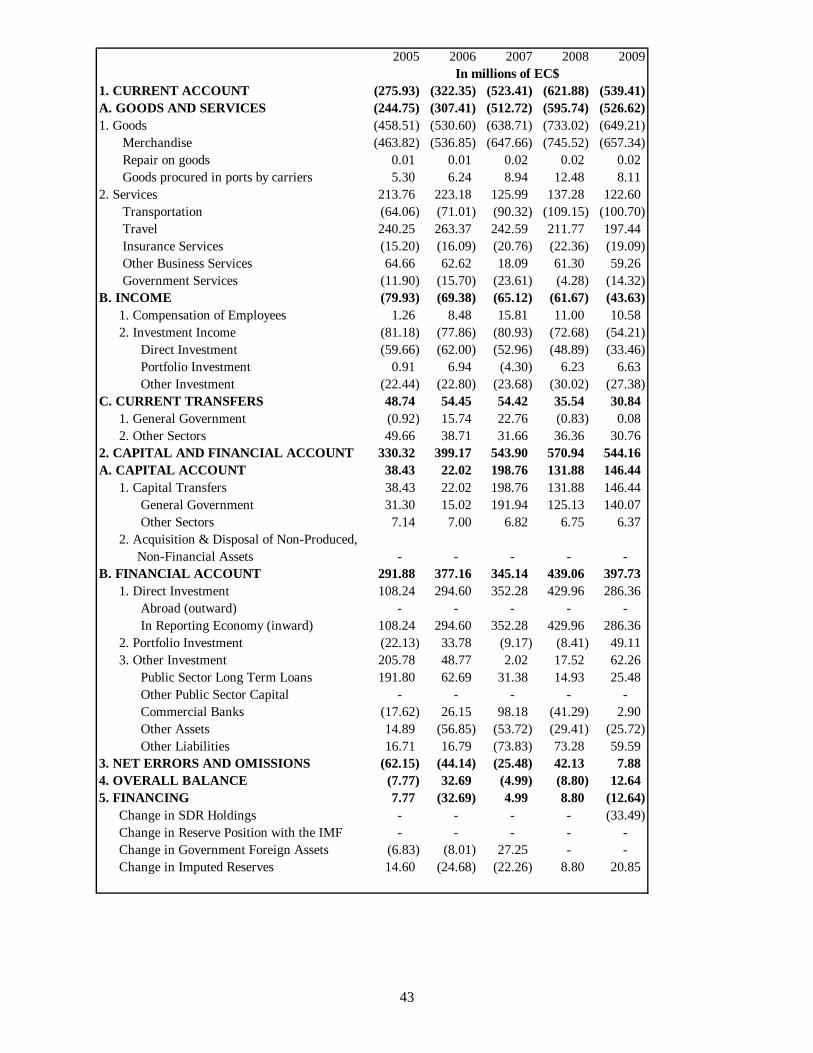
IX. BALANCE OF PAYMENTS The overall Balance of Payments position improved in 2009, moving from a deficit of EC$8.8m
(0.05 percent of GDP) in 2008 to a surplus of EC$12.6m representing 0.1 per cent of GDP. This
16
outcome was the result of a decline in the current account deficit and allocations of IMF Special
Drawing Rights.
The Current Account
The components of the current account within the Balance of Payments consist of the goods, the
services, the income and current transfers accounts. The current account deficit narrowed from
EC$621.9m (32.9 percent of GDP) in 2008 to EC$539.4m (28.6 percent of GDP) in 2009,
influenced by a 10.7 per cent decline in merchandise imports. Merchandise imports fell from
EC$1008.4m (53.4 percent of GDP) in 2008 to EC901.48m (47.7 percent of GDP) in 2009. The
movement in merchandise imports was attributed in part to a lower import bill associated with
decreased in value of imports of food and live animals, machinery and transport equipment,
crude materials and manufactured goods. Additionally, the value of exports decreased from
EC$141.0m in 2008 to EC$135.2m in 2008.
Services account surplus recorded a 10.7 percent decline of EC$122.6m in 2009 compared to
2008. This surplus represented a 6.5 percent of GDP in 2009 compared to a 7.2 percent of GDP
in 2008. This movement was influenced mainly by an 8.9 percent decrease in gross travel
receipts to EC$236.4m in 2009. Notwithstanding that visitor arrivals increased by 8.4 percent in
2009 mainly due to a 28.1 percent increase in the sub-category cruise passengers, visitor
expenditure decreased as a result of a 10.7 percent decrease in the sub-category stay-over
visitors.
The income account measures income flows in and out of the country, including the payment of
interest on external indebtedness. Net outflows on the income account declined by 2.3 percent of
GDP in 2009. This movement was largely due to a decline in reinvested earnings moving from
EC$24.8m in 2008 to EC$6.5m in 2009.
There was a net inflow of current transfers of EC$30.8m in 2009, a decrease of 13.2 percent.
Among current transfers, general government transfers increased from a deficit of EC$0.8m in
2008 to a surplus of EC$0.8m in 2009, while transfers in “Other Sectors” decreased from
EC$36.4m in 2008 to EC$ 30.8m in 2009.
17
The Capital and financial account
In 2009, the surplus on the Capital and Financial Account declined by 4.7 per cent to EC$
544.2m (28.8 per cent of GDP), down from EC$570.9m (30.2 percent of GDP) in 2008. The
Capital Account surplus increased by 11.0 percent of GDP, reflecting an increase in capital
grants received by central government. Net inflows on the financial account fell by 9.4 per cent
to EC$397.7m (21.1 per cent of GDP) in 2009 compared with EC$439.1m (23.3 per cent of GDP)
in 2008. This increase was associated mainly with a 32.9 per cent decrease in inflows from direct
investment.
FOREIGN TRADE
Merchandise Trade in St. Vincent and the Grenadines consists of a mix of exports and imports,
with a heavier weighting on imports. Exports are made to countries such as the U.K., the U.S.,
Canada and countries within the CARICOM region and consist primarily of domestic exports of
agricultural and banana products and manufactured items such as flour and rice. Items such as
food, beverages, machinery and transport equipment, manufactured goods, chemicals, oils and
fuels, are imported from countries such as the U.K., the U.S., CARICOM member countries and
Japan.
Exports
In 2010 total exports declined to $110.9m from $135.2.0m in 2009. Banana exports fell from
EC$17.1m in 2009 to EC$12.1m in 2010. Manufactured exports fell from EC$61.28m in 2009
to EC$60.34m in 2010.
Imports Total imports recorded an increase in 2010 moving from EC$900.7m in 2009 to EC$912.5m in
2010. Total imports represented 47.8 per cent of GDP in 2009
X. GOVERNMENT FISCAL OPERATIONS
For the fiscal year ending December 31, 2010 the central government fiscal position improved
with the current balance moving from a deficit of EC$3.24 million in 2009 to a surplus of
EC$10.65 million in 2010.The primary balance was a surplus of EC$73.39 million in contrast to
a deficit of EC$3.83 million in 2009. The overall balance also improved, realising a surplus of
EC$20.99 million in 2010 from a deficit of EC$54.84 million over the corresponding period in
2009 (see Appendix II).
18
Revenue
As at December 31, 2010 Current Revenue totalled EC$483.80 million, this represents an
increase of 3.7 percent when compared with the same period in 2009. This improved revenue
performance was due primarily to a significant increase of 80.9 per cent in receipts from non-tax
sources including; Fees, Fines and Permits (up by 13.6 per cent), Interest Rents and Dividends
(up by 33.7 per cent) and Other Revenue (up 457.0 per cent). The significant increase in Other
Revenue was mainly due to the receipt of funding for budget support from the European Union.
Interest Rents and Dividends benefited from the receipt of currency profits from the ECCB.
Of the tax revenue, receipt from licences increased by 15.4 per cent to $25.4 million while taxes
on domestic transactions grew marginally by 0.8 per cent to total $105.93 million. At the same
time taxes on income and profits and taxes on international trade declined by 1.4 per cent and 7.3
per cent respectively. The fall in taxes on income and profit resulted from lower collections of
corporation and withholding taxes during the period. The decline in taxes on international trade
was mainly on account of reduced receipts from Customs Service Charge, Excise Duty and VAT.
Capital inflows as at December 31, 2010 amounted to $88.74 million, this represents an increase
of 13.2% when compared to the same period in 2009 and was mainly due to a very significant
increase in Other Revenue (which went up by $70.0 million) as grant receipts declined
significantly by 76.8%. The collection from Other Revenue is broken down as follows:
o Revenue from the sale of a fixed asset (the NCB) totalling $42.0 million
o Proceeds for the sale of SDRs in the amount of $27.9 million
o Other Revenue $0.1million
The prices of gasoline and diesel are adjusted by the government to reflect changes in
international prices. Consequently the retail prices of gasoline and diesel were adjusted only
three times in 2010 compared to six times in 2009. As at December 31, 2010 the retail prices of
gasoline and diesel stood at EC$12.20 and EC$10.35 per gallon respectively, compared to
EC$10.61 and EC$9.03 per gallon respectively as at December 2009.
19
Expenditure
Recurrent expenditure as at December 31, 2010 amounted to EC$473.15 million and represented
a marginal increase of 0.7 per cent when compared with the same period in 2009. During the
period, expenditure on personal emoluments increased by 6.6 per cent to $203.89 million while
outlays on wages fell by 13.5 per cent to $17.93 million. The increased expenditure on personal
emoluments was mostly due to a 5 per cent salary enhancement received public servants during
the period while wages were reduced mainly as a result of the formation of a new statutory body
to undertake public works previously done by the central government. Outlays on Transfers and
Subsidies rose by 9.3 per cent to $131.87 million. This rise in expenditure was mainly the result
of increased spending on grants and contributions and pension payments over the period.
Spending on Goods and Services fell by 22.1 per cent to $67.07 million chiefly on account of
reduced expenditure on supplies and materials, Maintenance Services and utilities.
As at December 31 2010, Capital Expenditure amounted to EC$78.40 million. This amount was
down 39.7 per cent from the amount spent during the same period in 2009 and is reflective of a
scaling down or omission of a number of the larger projects that were budgeted for in 2010.
2011 Revenue and Expenditure Budget
The expenditure budget for 2011 amounts to EC$786.48 million, comprising recurrent
expenditure (including amortization) of EC$609.81 million and capital expenditure of
EC$176.67 million. The total budget is EC$127 million or 13.9 per cent less than the 2010
approved estimates. The 2011 estimates of current expenditure (excluding amortization) is
EC$532.07 million, which is 1.7 per cent more than the estimates for 2010.
The projected growth in revenue for 2011 will come primarily from more efficient tax collection
along with some new revenue measures. The 2011 estimate of capital expenditure is significantly
lower than the 2010 estimates. This is in keeping with the Government’s effort to spend only on
vital items of expenditure of undoubted merit. Table 3 shows the breakdown in Capital
Expenditure by Sector.
20
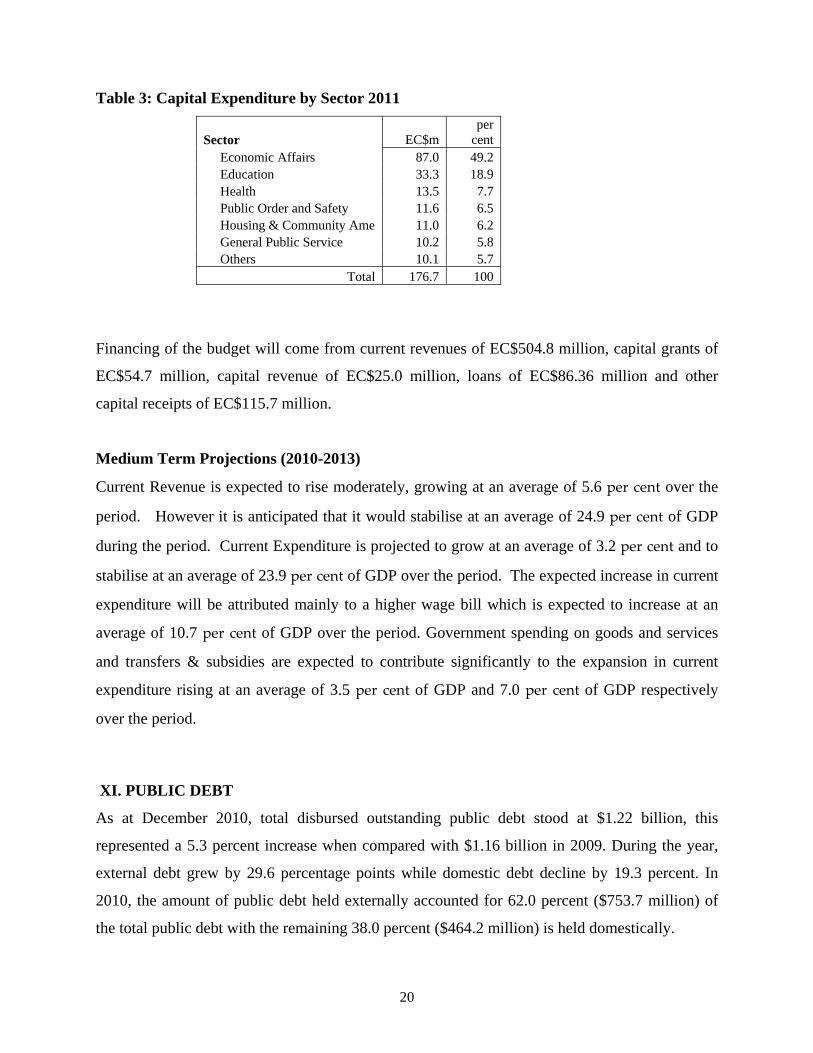
Table 3: Capital Expenditure by Sector 2011
Sector EC$m per
cent Economic Affairs 87.0 49.2 Education 33.3 18.9 Health 13.5 7.7 Public Order and Safety 11.6 6.5 Housing & Community Ame 11.0 6.2 General Public Service 10.2 5.8 Others 10.1 5.7
Total 176.7 100
Financing of the budget will come from current revenues of EC$504.8 million, capital grants of
EC$54.7 million, capital revenue of EC$25.0 million, loans of EC$86.36 million and other
capital receipts of EC$115.7 million.
Medium Term Projections (2010-2013)
Current Revenue is expected to rise moderately, growing at an average of 5.6 per cent over the
period. However it is anticipated that it would stabilise at an average of 24.9 per cent of GDP
during the period. Current Expenditure is projected to grow at an average of 3.2 per cent and to
stabilise at an average of 23.9 per cent of GDP over the period. The expected increase in current
expenditure will be attributed mainly to a higher wage bill which is expected to increase at an
average of 10.7 per cent of GDP over the period. Government spending on goods and services
and transfers & subsidies are expected to contribute significantly to the expansion in current
expenditure rising at an average of 3.5 per cent of GDP and 7.0 per cent of GDP respectively
over the period.
XI. PUBLIC DEBT
As at December 2010, total disbursed outstanding public debt stood at $1.22 billion, this
represented a 5.3 percent increase when compared with $1.16 billion in 2009. During the year,
external debt grew by 29.6 percentage points while domestic debt decline by 19.3 percent. In
2010, the amount of public debt held externally accounted for 62.0 percent ($753.7 million) of
the total public debt with the remaining 38.0 percent ($464.2 million) is held domestically.
21
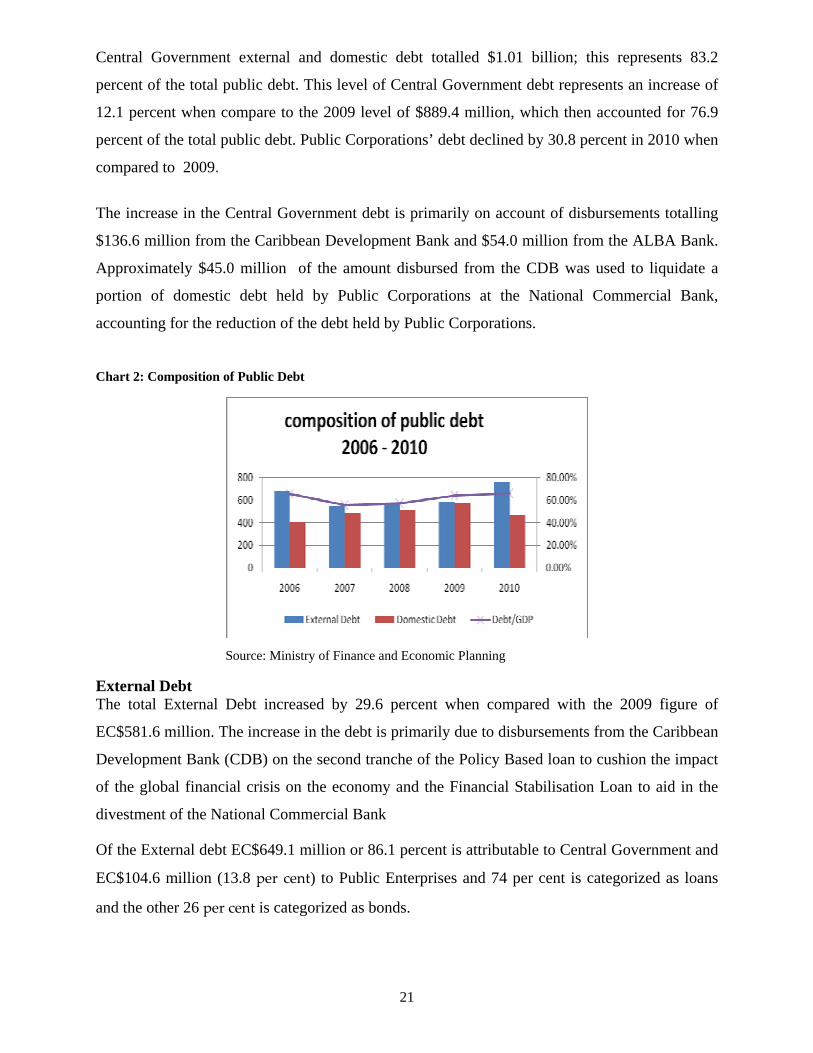
Central Government external and domestic debt totalled $1.01 billion; this represents 83.2
percent of the total public debt. This level of Central Government debt represents an increase of
12.1 percent when compare to the 2009 level of $889.4 million, which then accounted for 76.9
percent of the total public debt. Public Corporations’ debt declined by 30.8 percent in 2010 when
compared to 2009.
The increase in the Central Government debt is primarily on account of disbursements totalling
$136.6 million from the Caribbean Development Bank and $54.0 million from the ALBA Bank.
Approximately $45.0 million of the amount disbursed from the CDB was used to liquidate a
portion of domestic debt held by Public Corporations at the National Commercial Bank,
accounting for the reduction of the debt held by Public Corporations.
Chart 2: Composition of Public Debt
Source: Ministry of Finance and Economic Planning
External Debt The total External Debt increased by 29.6 percent when compared with the 2009 figure of
EC$581.6 million. The increase in the debt is primarily due to disbursements from the Caribbean
Development Bank (CDB) on the second tranche of the Policy Based loan to cushion the impact
of the global financial crisis on the economy and the Financial Stabilisation Loan to aid in the
divestment of the National Commercial Bank
Of the External debt EC$649.1 million or 86.1 percent is attributable to Central Government and
EC$104.6 million (13.8 per cent) to Public Enterprises and 74 per cent is categorized as loans
and the other 26 per cent is categorized as bonds.
22
The CDB is the largest creditor with EC$397.7 million (52.8.0 per cent. This was followed by
bondholders $125.4 million (16.6 per cent) and IDA/IBRD EC$56.2 million (8.7 per cent %).
With respect to currency composition 76.23 per cent of the debt is denominated in United States
Dollars, and 10.95 per cent in Special Drawing Rights.
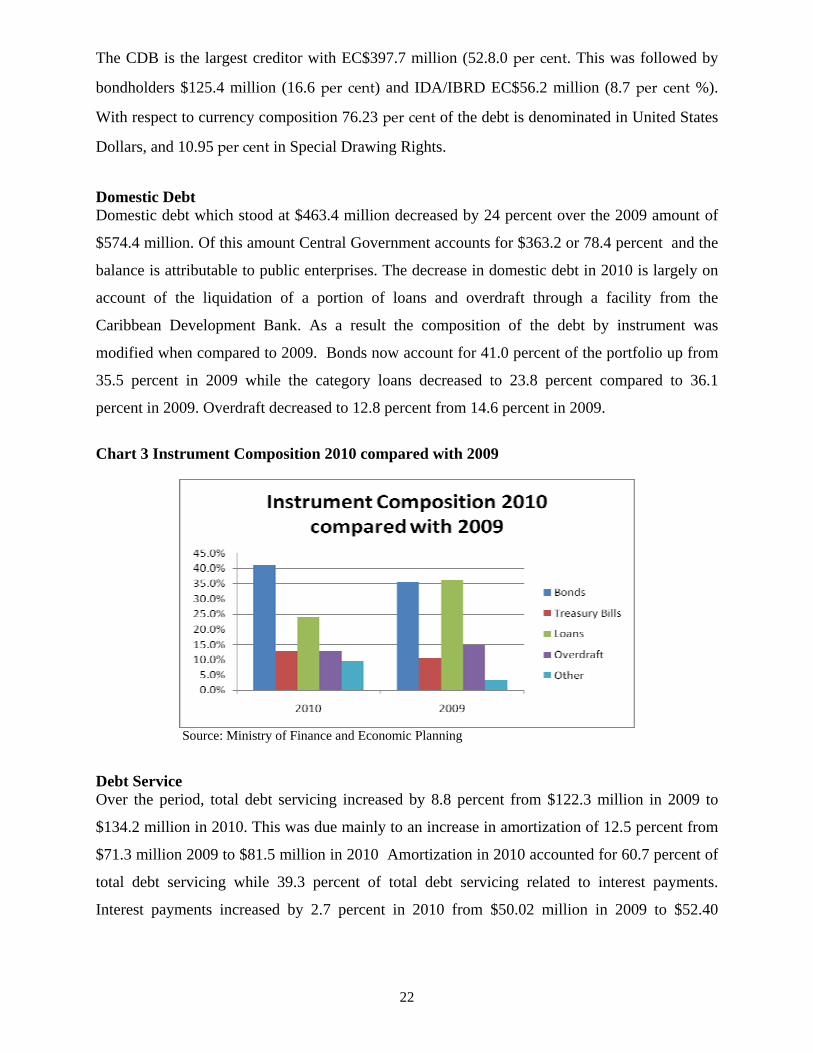
Domestic Debt Domestic debt which stood at $463.4 million decreased by 24 percent over the 2009 amount of
$574.4 million. Of this amount Central Government accounts for $363.2 or 78.4 percent and the
balance is attributable to public enterprises. The decrease in domestic debt in 2010 is largely on
account of the liquidation of a portion of loans and overdraft through a facility from the
Caribbean Development Bank. As a result the composition of the debt by instrument was
modified when compared to 2009. Bonds now account for 41.0 percent of the portfolio up from
35.5 percent in 2009 while the category loans decreased to 23.8 percent compared to 36.1
percent in 2009. Overdraft decreased to 12.8 percent from 14.6 percent in 2009.
Chart 3 Instrument Composition 2010 compared with 2009
Source: Ministry of Finance and Economic Planning
Debt Service Over the period, total debt servicing increased by 8.8 percent from $122.3 million in 2009 to
$134.2 million in 2010. This was due mainly to an increase in amortization of 12.5 percent from
$71.3 million 2009 to $81.5 million in 2010 Amortization in 2010 accounted for 60.7 percent of
total debt servicing while 39.3 percent of total debt servicing related to interest payments.
Interest payments increased by 2.7 percent in 2010 from $50.02 million in 2009 to $52.40
23
million in 2010. Sinking fund contributions amounted to $12.0 million in 2010 compared with
$6 million in 2009.
Debt servicing as a percentage of recurrent revenue moved from 22.9 percent in 2009 to 23.6
percent in 2010 this represents a 5.0 percent increase from the 2009 ratio. Over the period, the
debt to GDP ratio1, increased by 2.6 percent, moving from 61.2 percent in 2009 to 62.9 percent
in 2010.
Legislative Authority The primary legislation which governs and explicitly authorises the Government to borrow is the
Finance Administration Act (FAA) 2004 (Act No 28 of 2004). The Act authorises the Minister
of Finance when authorised by resolution of the House of Assembly to borrow money in a
financial year “to meet current requirements from a bank or other financial institution by means
of advances to an amount not exceeding in the aggregate the sum specified in the resolution.”
The current limit on short term2 borrowing is EC$75.0million.
The Treasury Bills Act Cap 320 governs the issuance of the T-bills within St. Vincent and the
Grenadines. The Act authorizes the Minister of Finance to borrow money by the issue of
treasury bills. Further the Minister may direct that the treasury bills be issued by the Accountant
General or by a financial institution outside St. Vincent and the Grenadines. Section 3 (4) of the
Treasury Bills Act provides that the principal sum of T-bills outstanding at any one time, shall
not exceed 15.0 per cent of the estimated annual revenue of St. Vincent and the Grenadines for
the current financial year.
In relation to the authority to borrow from multilateral the Caribbean Development Bank Loans
Act covers all loans from the CDB and the International Financial Organisations Act (1980)
authorises the Minister of Finance to sign agreements with the World Bank and the International
Monetary Fund. Similar acts authorising borrowing from other multilaterals also exist including
OPEC Fund for International Development. There is no Act that limits the amount that can be
borrowed by the government.
1The base year of the GDP have been revise from 1990 to 2006 2 The limit for short term borrowing excludes Treasury Bills
24
The Government Guarantee of Loans Act 1984 gives government the authority to guarantee
loans by lending agencies to corporations. The current limit specified for all guarantees issued
by government is EC$300.0m.
Debt Projections Central Government Public Debt is projected to increase in 2011 to around 58 per cent of GDP
from 55 per cent of GDP in 2010. The increase is projected to be driven by new borrowings for
the 2011 Public Sector Investment Programme. Additionally, disbursements from relief loans to
fund rehabilitation following the effects of natural disasters are expected to increase the debt. By
2014, the public debt as a percentage of GDP is projected to decrease as prospects for growth
increases.
DEBT STRATEGY 2011 -2013
The main risks that the government faces with respect to the public debt portfolio are interest rate
risk, exchange rate risk, refinancing risk and liquidity risk.
Interest rate risk refers to the risk that developments in interest rate will lead to higher borrowing
costs. The concept also covers refinancing risk, which is the risk that existing debt will have to
be refinanced at a time when market conditions are unfavourable. Exchange rate risk is the risk
that the value of the debt will increase as a consequence of development in the international
markets for foreign currency.
The government aims to minimize all of these risks by adopting appropriate policies and most
importantly by controlling the size of the debt itself and the cost of servicing the debt. The table
below summarizes the main type of risk and the strategy for these risks.
Type of Risk Management of Risk
1. Liquidity and Refinancing Risk • Prepare annual cash flow and
borrowing plans and monitor on a monthly basis
• Minimize the proportion of short-term debt
• Smooth the maturity profile • Maintain fiscal reserves
25
2. Interest Rate Risk • Avoid floating interest rate debt as far
as possible • Minimize bunching of loan
repayments through the use of sinking funds and reducing debt instruments.
3. Foreign Exchange Risk • As far as possible raise all debts in
domestic currency or US dollars. Limit non EC/US dollars external debt to 20 percent of total external debt
• Use hedging where feasible.
Medium Term Strategy Over the medium-to-long-term Government aims to restrict the public debt to no more than 75%
of GDP which is the level which we consider to be sustainable for St. Vincent and the
Grenadines. In determining this debt level we considered several factors including cost of debt
servicing and the ratio of revenue collection to GDP. In order to attain this target the following
strategies will be adopted:-
1. Establishing strict limits on the contraction of new debts and ensuring that the projects to
be financed are feasible in terms of their contribution to economic development and
poverty reduction.
2. Reducing operational losses of public enterprise. In this regard, Government has
established a Monitoring Committee on Public Enterprises, headed by the Prime Minister,
to monitor the performances of all public enterprises. The Ministry of Finance and
Economic Planning has delegated an officer for direct liaison and monitoring of public
enterprises. Additionally the Government has restructured its Consolidated Overdraft
loan to accommodate the assumption of a portion of non-performing loans by Public
Enterprises.
3. Issue all Government Securities on the Regional Government Securities Market (RGSM)
4. Contraction of new debt would be concessionary from multinational and bilateral
creditors.
26
XII. MONEY AND CREDIT
Monetary liabilities (M2) grew by 2.6 per cent during 2010, compared with growth of 0.3 per
cent during 2009. Quasi money expanded by 5.7 per cent, as a result of increases in private
sector savings deposits, foreign currency deposits and time deposits. Narrow money (M1) fell by
3.8 per cent, largely on account of a decline of 20.3 per cent ($12.9m) in currency with the
public. Currency with the public was negatively impacted by a fall in currency in circulation,
consistent with weak economic activity.
Domestic credit contracted by 13.3 per cent to $892.0m, influenced by declines in borrowing by
central government and non-financial public enterprises. Net credit to the central government
fell by 82.5 per cent, while lending to the non-financial public enterprises more than halved as
government refinanced a large proportion of their debt in the commercial banking system with
lower interest rate external borrowing. Private sector credit rose by 1.8 per cent, as loans
extended to businesses and households increased by 3.6 per cent and 0.8 per cent respectively.
An analysis of the distribution of credit by economic activity indicates that outstanding loans
decreased by 7.6 per cent, compared with a fall of 3.1 per cent during 2009. The main source of
the decrease was a decline of 52.9 per cent ($93.4m) in borrowing for public administration, as
government repaid a number of public corporations’ loans. Credit for construction,
transportation and acquisition of property also fell, consistent with the contraction in economic
activity. Declines were also recorded in outstanding loans for manufacturing and agriculture.
Those declines were partly offset by increases of 62.8 per cent and 4.2 per cent in credit for
tourism and distributive trades, respectively.
The net foreign assets of the banking system grew by 31.4 per cent to $474.4m during 2010, in
contrast to a decline of 6.2 per cent during the prior year. This outcome was partially influenced
by growth of 10.9 per cent in the net foreign assets of commercial banks, mirroring an increase
in assets held with institutions in other ECCB territories. Likewise, St Vincent and the
Grenadines’ imputed share of the reserves held by the ECCB grew by 47.3 per cent to $299.1m.
Liquidity in the commercial banking system rose during 2010. This was evidenced by a 5.6 percentage
point increase to 43.3 per cent in the ratio of liquid assets to total deposits plus liquid liabilities. The
loans and advances to deposits ratio declined by 10.3 percentage points to 75.3 per cent.
27
Commercial banks’ weighted average interest rate on deposits decreased by 17 basis points to 2.76 per
cent and that on loans fell by 14 basis points to 9.00 per cent. Consequently, the weighted average
interest rate spread between loans and deposits grew to 6.24 percentage points from 6.21 percentage
points at the end of December 2009.
XIII. MONEY TRANSFER COMPANIES
Money Transfer business is governed by the Money Services Business Act No. 27 of 2005. The
Ministry of Finance/Supervisory and Regulatory Division is responsible for the general
administration of this Act and the supervision of these operations.
“Money services business” includes (a) the business of providing (i) transmission of money or
monetary value in any form, (ii) check cashing, (iii) currency exchange, (iv) issuance or sale of
money orders or traveler’s checks; and (v) any other services that may be specified by notice
published in the Gazette; or (b) the business of operating as agents for money transfer business
and their principals.
The following companies currently act as agents for money transfer businesses and their
principals:
• Grace Kennedy Money Transfer—Western Union
• Going Places Money Transfer—MoneyGram
• RBTT Bank Caribbean Limited Money Transfer Business—MoneyGram
• St Vincent Building and Loan Association Money Transfer—Jamaica National Money
Transfer Services
• Postal Corporation - MoneyGram
XIV. INSURANCE SECTOR The insurance business in St. Vincent and the Grenadines is governed by the Insurance Act No.
45 of 2003, which came into operation on January 01, 2004 and the Motor Vehicle Insurance
(Third Party Risk) Act No. 4 of 2003. The Supervisor of Insurance is responsible for the general
administration of the Insurance Act and the general protection of policy-holders. There are 22
insurance companies, including 9 long-term insurance companies and 13 motor and general
insurance companies. The names of these insurance companies are as follows:
28
Long-term Insurance companies
• American Life Insurance Co. (ALICO)
• British American
• CLICO International Life
• Colonial Life
• Demerara Mutual Life Assurance Society Ltd.
• Guyana and Trinidad Mutual Life
• Guardian Life of the Caribbean
• Sagicor Capital Life
• Sagicor Life
Motor and General Insurance Companies
• The Beacon Insurance Company
• Caribbean Alliance
• Guardian General Insurance
• CLICO International General
• Great Northern Insurances
• Gulf Insurance
• Guyana and Trinidad Fire & General
• Island Heritage
• Metrocint General Insurance Co. Ltd.
• St Hill Insurance Co. Ltd.
• St. Vincent Insurances Ltd.
• United Insurance
• West Indian Insurances Ltd.
The Insurance sub-sector is mainly made up of branches/agencies of CARICOM based
insurance companies. There are also five locally incorporated companies. The Insurance laws
and Regulations apply equally to both domestic and foreign companies. The fallout of the
Trinidad and Tobago based C L Financial Group has emphasized the need to strengthen the
regulatory and supervisory framework of non-bank institutions. The government in collaboration
with the ECCB and other regional leaders is coordinating information sharing and a regional
29
response the crisis.
Most recent data shows that the total assets in the insurance market increased by 5.1 per cent
during 2009 to total EC$426.3million.
Gross premiums including annuities decreased by 12.0 per cent to EC$130.7 million in 2009
compared with $148.5 million in 2008. The motor and general sub-sector registered an increase
of 1.6 percent while the long-term sub-sector decreased by 20.2 percent. It should be noted that
the 2009 statutory returns for British American are still outstanding and the 2008 figures were
used instead. In the motor and general insurance sub-sector, seven companies controlled 74.6
percent of the market when ranked by their gross premium. Motor and Accident and sickness
classes of business both saw increases of 4.7 percent and 8.6 percent respectively while the
property class decreased by 2.6 per cent.
Insurance penetration (premium as a percentage of GDP) moved from 7.9 per cent in 2008 to 6.9
per cent in 2009. Motor and general remained relatively flat over the last five years at
approximately 3.5 per cent of GDP while long-term insurance continuously fluctuated to 3.9 per
cent of GDP in 2009.
During the year 2009, reinsurance for amounted to EC$39.1 million for short-term insurance
business and $1.4 million for long-term insurance business.
The industry’s statutory deposits held by the supervisor of insurance during the year amounted
to EC$28.0 million which comprised of $7.4 million in Government Securities and $20.6 million
in cash .
XV. MONEY LAUNDERING AND ILLICIT ACTIVITIES
The Financial Intelligence Unit (FIU) was established in May 2002, in accordance with the
Financial Intelligence Unit Act of 2001. The functions of the FIU include:
1. receipt and analysis of suspicious transaction reports that are required to
be made under the Proceeds of Crime and Money Laundering
(Prevention) Act, Act No. 39 of 2001;
30
2. collection of information from financial institutions and other relevant
bodies for the purpose of investigating relevant offences;
3. investigation of relevant offences;
4. dissemination of information;
5. international cooperation in the exchange of financial information;
6. awareness raising and education of financial and business institutions on
their obligations to detect, prevent and deter money laundering and
associated offences.
The FIU works in close partnership with other national agencies to ensure that the country has a
comprehensive anti-money laundering system that identifies and effectively addresses suspected
illegal activity, The Government has used the establishment of the FIU as a means of monitoring
money laundering and has made important legislative changes to bring the anti money
laundering laws in line with international best practices. In 2009 the IMF conducted an extensive
evaluation of the anti-money laundering and counter financing of terrorism regime for St.
Vincent and the Grenadines. The assessors reviewed the institutional frameworks, the relevant
laws, regulations, guidelines and other requirements and systems in place to deter and punish
money laundering.
XVI. BANKING AND FINANCIAL INSTITUTIONS
Overview
The financial sector in St. Vincent and the Grenadines consists of four banks The Bank of St.
Vincent and the Grenadines, formerly the National Commercial Bank of St. Vincent and the
Grenadines as well as branches of three foreign banks including First Caribbean International,
RBTT Bank and Bank of Nova Scotia, two non-bank financial institutions, several credit unions,
a Building and Loan Society (BLS) and insurance companies.
All of the above institutions are regulated either by the ECCB or the Ministry of Finance and
Planning. The Money Services Business Act, which became operational in April 2006, has
improved accounting and registration of money transfer institutions.
In 2010, as the global economy continued its recovery from the recent global financial crisis, the
ECCU continued to grapple with the challenges in the financial sector, particularly the insurance
sector. In this regard, St. Vincent and the Grenadines have met with mixed results. On the one hand,
31
the government has dealt successfully with the liquidity problems at the then National Commercial
Bank (NCB) through divestment of the majority shareholding in the Bank; on the other hand,
progress on the British American Insurance Company (BAICO) issue has been very slow. Under the
divestment programme, the Government of St. Vincent and the Grenadines divested eighty percent
(80%) of its common shares in NCB in two phases.
With respect to BIACO the company remains under judicial management throughout the Eastern
Caribbean and the judicial managers are accountable to the Court and have the powers and
obligations as provided under the respective Insurance Acts. In St. Vincent and the Grenadines as
well as the other ECCU member territories, the judicial managers have presented their findings
and recommendations to their respective Courts and the reports have been accepted by the High
Court. During 2010, the judicial managers completed the sale of the property portfolio of BAICO
to Caribbean Alliance Insurance Company. Additionally, ECCU governments have finalised
arrangements for the settlement of health insurance claims, particularly those claims for urgent
medical treatment within certain defined parameters.
The Government is continuing its financial sector reform programme that is designed to enhance
the regulation and supervision of its financial sector with the ultimate objective of bringing the
regulatory and supervisory functions in line with international best practices. In this regard the
government has been working with the ECCB and other ECCU governments in fostering the
establishment of a modern, highly sophisticated and efficiently regulated financial system.
With respect to CLICO International Life Insurance Company, the ECCU Regulators have been
informed by the Barbadian authorities of their intention to place that company under judicial
management. As a result similar actions are being contemplated in each ECCU territory
including St. Vincent and the Grenadines.
The experiences of CL Financial Group and the British American Insurance Company (BAICO)
highlighted the need for continuous upgrade of our regulatory framework, especially with respect
to non-bank financial institutions (NBFI). The new framework will include a shift from a
solvency approach for insurance regulation to a risk-based approach. Accordingly, the
Supervisory and Regulatory Division established in 2009 in the Ministry of Finance and
Planning to oversee the regulation and supervision of the insurance companies, the BLS,
32
the money transfer operations, and ultimately credit unions will enhance its surveillance of
NBFIs.
Foreign Exchange and International Reserves
St. Vincent and the Grenadines and the ECCB have adopted a fixed exchange rate regime
whereby exchange rates for the sale of EC dollars into other currencies are determined by the
ECCB. Since 1976, the EC dollar has been pegged to the U.S. dollar at a rate of EC$2.70 to
U.S.$1.00.
XVII. CURRENT ISSUES OF GOVERNMENT SECURITIES.
As at March 31, 2011, the Government’s outstanding securities traded on the Regional
Government Securities Market are listed hereunder:
1. TREASURY BILLS
• Issues Outstanding Issue $60.0M
• Type of Issue Government of St Vincent and The Grenadines Treasury
Bills
• Maturity in days 91 days
• Date of Issues Every 91 days
• Discount rate N/A
• Yields Weighted Avg. 5.82 per cent
• Discount Price $98.54 – $98.54
2. BONDS
VCG 100814 • Amount Outstanding $30.0 M
• Type of Issue St Vincent and The Grenadines Development Bonds
• Original Maturity 10 years
• Remaining Maturity 3 years
• Date of subscription August 2004,
• Redemption Date August 2014,
• Coupon Rate 7.0 per cent
• Amount offered for sale $30.0 Million
33
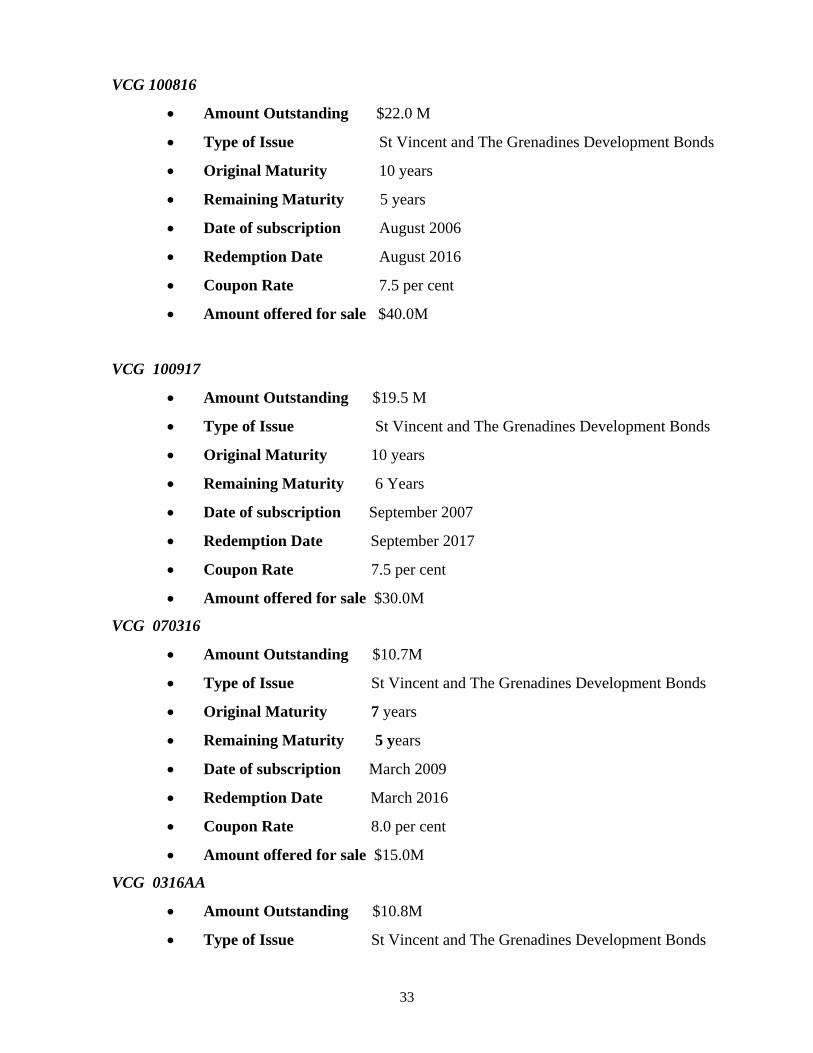
VCG 100816
• Amount Outstanding $22.0 M
• Type of Issue St Vincent and The Grenadines Development Bonds
• Original Maturity 10 years
• Remaining Maturity 5 years
• Date of subscription August 2006
• Redemption Date August 2016
• Coupon Rate 7.5 per cent
• Amount offered for sale $40.0M
VCG 100917
• Amount Outstanding $19.5 M
• Type of Issue St Vincent and The Grenadines Development Bonds
• Original Maturity 10 years
• Remaining Maturity 6 Years
• Date of subscription September 2007
• Redemption Date September 2017
• Coupon Rate 7.5 per cent
• Amount offered for sale $30.0M
VCG 070316
• Amount Outstanding $10.7M
• Type of Issue St Vincent and The Grenadines Development Bonds
• Original Maturity 7 years
• Remaining Maturity 5 years
• Date of subscription March 2009
• Redemption Date March 2016
• Coupon Rate 8.0 per cent
• Amount offered for sale $15.0M
VCG 0316AA
• Amount Outstanding $10.8M
• Type of Issue St Vincent and The Grenadines Development Bonds
34
• Original Maturity 7 years
• Remaining Maturity 5 years
• Date of subscription April 2009
• Redemption Date April 2016
• Coupon Rate 8.0 per cent
• Amount offered for sale $15.0M
VCG 0316AB
• Amount Outstanding $11.9M
• Type of Issue St Vincent and The Grenadines Development Bonds
• Original Maturity 7 years
• Remaining Maturity 5 years
• Date of subscription May 2009
• Redemption Date May 2016
• Coupon Rate 8.0 per cent
• Amount offered for sale $16.7M
XVIII SECURITY ISSUANCE PROCEDURES, CLEARING AND SETTLEMENT, REGISTRATION OF OWNERSHIP AND SECONDARY MARKET ACTIVITY
The Treasury bills will be issued and listed on the Regional Government Securities
Market (RGSM). This market operates on the Eastern Caribbean Securities Exchange
(ECSE) trading platform for both primary issuance and secondary trading. The pricing
methodology to be used for selling the securities will be a Competitive Uniform Price
auction with open bidding. The ECSE is responsible for dissemination of market
information, providing intermediaries with market access, administering the auction
process and monitoring and surveillance of the auctions.
The ECSE, through the Eastern Caribbean Central Securities Depository (ECCSD), is
responsible for facilitating clearance and settlement for securities allotted. The ECCSD
ensures that funds are deposited to the issuing government’s account. The ECSE,
through the Eastern Caribbean Central Securities Registry (ECCSR), records and
maintains ownership of government securities in electronic book-entry form. The
35
ECCSR mails confirmation of proof of ownership letters to all investors who were
successful in the auction. The ECCSR will also process corporate action on behalf of
issuing governments.
Intermediaries are responsible for interfacing with prospective investors, collecting
applications for subscription and processing the same for bidding on the ECSE platform.
Investors must provide the intermediaries with funds to cover the cost of the transaction.
For this particular offering, the government will pay the intermediaries for costs related to
the issue. A list of licensed intermediaries is provided in Appendix 1. Clients that are
successful will be informed of their payment obligations and funds deducted from their
respective accounts with the intermediary.
As an issuer in the RGSM, the Government of St Vincent and the Grenadines will be
subject to the rules, guidelines and procedures developed by the Regional Debt Co-
ordinating Committee (RDCC) for the operation of the market including ongoing