82
Financial Report 2016
FinancialReport2016


24 Significant events
24 Group accounting policies
33 Non-current assets
40 Current assets
42 Shareholders’ equity
43 Non-current and current provisions
44 Non-current tax assets and liabilities
46 Non-current and current debt
48 Main components of change in net surplus cash
49 Other current liabilities
50 Sales and other revenues from operations
51 Operating profit and EBITDA
52 Income from net surplus cash and other financial income and expenses
53 Income tax expense
54 Basic and diluted earnings per share
55 Segment information
57 Financial instruments
59 Off balance sheet commitments at 31 December 2016
60 Off balance sheet commitments at 31 December 2015
61 Average headcount and employee benefit obligations
63 Related-party disclosures
64 Additional cash flow statement information
65 Held-for-sale assets and operations
65 Auditors’ fees
66 List of principal consolidated entities at 31 December 2016
18
4
24
7172
MANAGEMENT REPORT
CONSOLIDATED FINANCIAL STATEMENTS
NOTES TO THE CONSOLIDATED FINANCIAL STATEMENTS
STATUTORY AUDITORS’ REPORT
PARENT COMPANY FINANCIAL STATEMENTS

Bouygues Construction | 2016 Financial Report
2/3
Keyfigures
Sales (-1%)
€11.8bn
Current operating margin (-0.1 point)
2.8%
Bouygues Construction: Shared innovation A global player in construction with operations in over 80 countries, Bouygues Construction designs, builds and operates building, infrastructure and industrial projects. As a responsible and committed leader in sustainable construction, Bouygues Construction makes innovation its primary added value. Innovation is shared for the benefit of its customers and its 50,100 employees.
at 31 December 2016
Employees50,100
Order book(+4%)
€20.2bn
Net profit attributable to the Group (+16%)
€320m
2/3
Management report Consolidated financial statements Notes to the consolidated financial statements Statutory auditors’ report Parent company financial statements
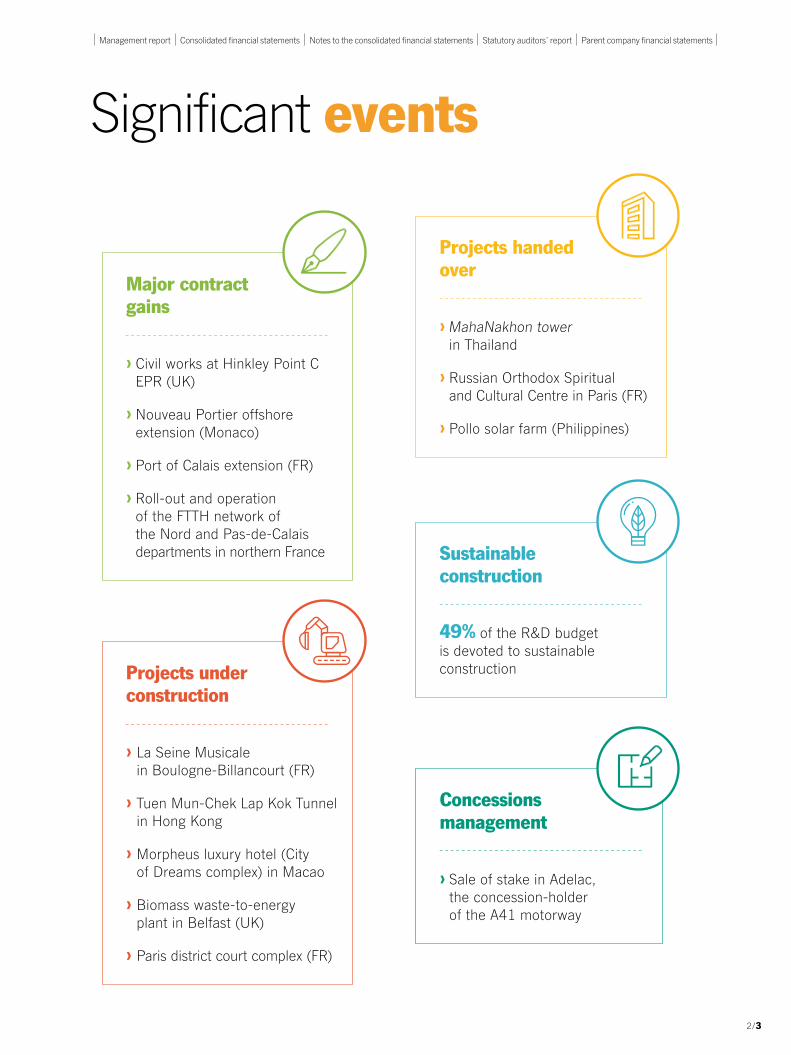
Major contract gains
› Civil works at Hinkley Point C EPR (UK)
› Nouveau Portier offshore extension (Monaco)
› Port of Calais extension (FR)
› Roll-out and operation of the FTTH network of the Nord and Pas-de-Calais departments in northern France
Significant events
Projects under construction
› La Seine Musicale in Boulogne-Billancourt (FR)
› Tuen Mun-Chek Lap Kok Tunnel in Hong Kong
› Morpheus luxury hotel (City of Dreams complex) in Macao
› Biomass waste-to-energy plant in Belfast (UK)
› Paris district court complex (FR)
Projects handed over
› MahaNakhon tower in Thailand
› Russian Orthodox Spiritual and Cultural Centre in Paris (FR)
› Pollo solar farm (Philippines)
Sustainableconstruction
49% of the R&D budgetis devoted to sustainableconstruction
Concessions management
› Sale of stake in Adelac, the concession-holder of the A41 motorway
Management reportProfile
Bouygues Construction operates in the building, infrastructure and industrial sectors with the aim of being a global player that spans the entire construction industry value chain.Bouygues Construction is acknowledged as a benchmark player in sustainable construction through the construction of many eco-neighbourhoods, low-carbon (timber-frame) buildings and structures certified against the best world eco-standards, as well as through the rehabilitation of sites in order to reach positive-energy status.As a pro-active and socially-responsible company, Bouygues Construction performs its corporate social responsibility duties to the full, particularly by supporting its corporate foundation Terre Plurielle, adhering to strong ethical and managerial commitments, and by prioritising health and safety.
Growth strategy and opportunities
Bouygues Construction’s strategy in the building, infrastructure and industrial sectors is based on a number of priorities:• expanding its core activities in the places where Bouygues Construction has a long-term presence (France, Switzerland,
Hong Kong, Australia, the UK, etc.) and, more broadly speaking, by targeting value-added projects while taking a highly selective approach and ensuring that risks are controlled;
• ensuring customer satisfaction over the long term, in particular through after-sales support;• capitalising on its knowledge of markets in key sectors, such as rehabilitation, healthcare and hotels, and encouraging synergies
in order to propose full-service offerings which meet customers’ needs;• ensuring control over execution and high-quality products and services while improving productivity in order to further enhance
performance in the building process.
In its various market sectors, Bouygues Construction is aiming in particular to:• expand method of intervention and skills in property development by drawing on its LinkCity(1) network;• be a top player in the major infrastructure (bridges, tunnels) market and in power grid installation in France and worldwide;• adapt its model for concessions and public-private partnerships (PPP) to changing needs, especially in terms of investment;• in energy production, offer turnkey solutions (power stations, solar farms, biomass plants, etc.), favour strategic partnerships
and position Bouygues Construction on the EPC (engineering, procurement and construction) market;• enhance its skills in industrial processes and maintenance and develop cutting-edge skills in areas such as robotics, automation, smart
buildings and the Internet of Things;• in digital technology, roll out telecommunications infrastructure offerings in France and on international markets.
Strengths and assets
An innovative, responsible and pro-active player, Bouygues Construction has many strengths to draw on in all of its business segments.• Bouygues Construction’s know-how is based primarily on the talent of its 50,100 employees, spread out in over 80 countries, who share
the same customer-focused values.• Distinctive, high value-added products and services driven by innovation in all its forms:
- digital, in particular with BIM (Building Information Modeling), which industrialises processes and operating methods, and enables information sharing all the way down to worksite level;
- technological, with R&D teams focused on those areas that offer the most promising prospects to the business segments, such as materials and structures, energy efficiency, building methods, ergonomy and productivity, eco-design, smart buildings, sustainable neighbourhoods and urban services, tunnel-boring machines and prestressing;
- operational, including the roll-out of lean management techniques at all levels in order to improve efficiency; - commercial, in order to offer distinctive products and services; - managerial, by continually improving organisational structures and rolling out collaborative working methods in order to increase
agility and performance.• A strong international presence: Bouygues Construction operates worldwide on a long-term basis through well-established local
subsidiaries or on one-off, technically complex major projects. These two approaches are complementary and give the company the necessary flexibility to mobilise its resources quickly on strong potential markets. Bouygues Construction generates over half its sales on international markets.
(1) As of 1 January 2016, the new brand name for Bouygues Construction’s property development subsidiaries.
Bouygues Construction | 2016 Financial Report
4/5
• Long experience of managing complex projects: thanks to its motivated teams with high technical skills, Bouygues Construction is able to fully meet the needs of public and private customers.
• The capacity to adapt to changing markets: the level of the order book provides good medium-term visibility, enabling costs to be adjusted while focusing investment on the most buoyant markets.
• A policy of controlling operating and financial risks: strict application of procedures at all levels of the company guarantees that the right projects are selected and carried out smoothly.
• Robust financial performance: over the last ten years, Bouygues Construction has demonstrated its capacity to preserve profitability and maintain a robust financial situation.
Outlook for 2017
Bouygues Construction enjoys good visibility, backed up by:• orders at 31 December 2016 to be executed in 2017 worth €9.0 billion;• sustained international activity, especially in places less affected by the economic crisis, such as Hong Kong, Singapore, Canada,
Switzerland, the UK and Australia, which are highly rated by the NGO Transparency International;• a long-term order book (to be executed beyond five years) worth €2.5 billion at 31 December 2016;• a sound financial structure, with a net cash position of €3.4 billion;• a lead in sustainable construction, to which the company devotes much of its R&D budget; • a commitment to shared innovation for the benefit of customers.
Tight control over the execution of major projects, a selective approach to orders and innovation will continue to be central priorities for Bouygues Construction in 2017, together with protecting the health and safety of employees and project partners.
Market position
Given the organisational structure of its direct competitors, it is difficult to make like-for-like comparisons between them and Bouygues Construction.• In Europe: based on the 2015 ranking published by trade magazine Le Moniteur in December 2016, the Bouygues group’s construction
businesses (Bouygues Construction, Bouygues Immobilier, Colas) is the third largest in Europe after the Spanish firm ACS (Hochtief, Germany’s leading construction firm, has been a subsidiary of ACS since 2011) and Vinci’s Contracting and Property Development division, and ahead of the Swedish contractor Skanska and the French contractor Eiffage.
• In the world: the Group’s construction businesses activity is placed ninth in the 2015 ENR ranking of international contractors published in August 2016, based on the share of sales generated on international markets.
• In France: in a French building and civil works market worth about €200 billion according to a Euroconstruct estimate in December 2016, Bouygues Construction (excluding Bouygues Energies & Services) is one of the top three contractors ahead of Eiffage Construction and behind Vinci Construction (2015 ranking published by Le Moniteur in December 2016). The market also includes many small and medium-sized firms. In energy and services, Bouygues Energies & Services is in sixth place after Vinci Energies, Spie, Eiffage Énergie, Dalkia and Engie-Cofely (2015 ranking published by Le Moniteur in December 2016).
Excellent commercial performance and robust financial results
Exceptional order intake: €12,633 millionOrder intake in 2016 reach a record €12,633 million. It included ten contracts worth more than €100 million, six of them on international markets.
In France, order intake amounted to €5,761 million, 17% more than in 2015. Orders included the roll-out of FTTH (Fibre To The Home) networks in the Nord, Pas-de-Calais and Savoie departments, the Port of Calais extension, Tour Alto in the La Défense business district of Paris, renovation of the Louvre Post Office building in central Paris, Campus Luminy in Marseille, several packages for the construction of property complexes in the Wacken Europe international business district in Strasbourg, and the two Trigone office buildings in Issy-les-Moulineaux.
Order intake on international markets came to €6,872 million, close to the level in 2015. Orders included civil engineering works for the Hinkley Point C EPR nuclear plant in the UK, the Monaco offshore extension project, a new section of Line 3 of the Cairo metro in Egypt, six hotel complex projects in Cuba, Les jardins du couchant property development at Nyon and new lots for packages for the Erlenmatt (Basel) and GreenCity (Zurich) eco-neighbourhoods in Switzerland, the Clementi property development in Singapore, University 6 in Turkmenistan, Hounslow Civic Centre in the UK and Joseph Brant Hospital in Ontario, Canada.
4/5
Management report Consolidated financial statements Notes to the consolidated financial statements Statutory auditors’ report Parent company financial statements

Buildings with environmental certification accounted for 72% of the order intake, the same as in 2015.
A record order book giving long-term visibility (€20.2 billion)The order book at end-2016 stood at a high €20.2 billion, up 4% on end-December 2015, with international markets accounting for 58%. Europe (excluding France) and the Asia-Oceania zones are the two most important international regions. Orders booked at end-2016 to be executed in 2017 amounted to €9.0 billion and orders to be executed beyond 2017 amounted to €11.2 billion, giving good visibility on future activity.
Sales: €11,815 million (stable like-for-like and at constant exchange rates(2))Sales in 2016 fell 1.3% year-on-year to €11,815 million, with building and civil works accounting for 81% and energies and services for 19%. Like-for-like and at constant exchange rates, they were stable.
Sales in France fell 3% to €5,527 million, reflecting hesitation on the part of both public and private investors, and represented 47% of total sales. Sales outside France were stable at €6,288 million despite a fall in the pound sterling.
Robust operating resultsCurrent operating profit came to €326 million, versus €349 million in 2015, and the current operating margin stood at 2.8%, compared with 2.9% in 2015.
Financial income amounted to €17 million, compared with €26 million in 2015.
Net profit attributable to the Group came to a high €320 million, versus €276 million in 2015, boosted by the capital gain on the sale of the stake in Adelac, a motorway concession company.
A record net cash surplus: €3,387 millionBouygues Construction posted a record net cash position of €3.4 billion at end-2016.
Developments in Bouygues Construction’s markets and activities
Construction needs around the world are growing due to increased urbanisation and challenges related to the environment and climate change. Technological progress also offers increased opportunities. The areas most concerned are urban rehabilitation, renovation and residential energy efficiency, transport, urban infrastructure, energy infrastructure and amenity projects.
Drawing on its expertise throughout the value chain, Bouygues Construction can offer its customers increasingly competitive solutions for complex major projects.
Shared innovation as client serviceAs it continually adapts to meet client needs, Bouygues Construction’s main focus is on shared innovation.
We are driving innovation throughout the value chain: • In the design phase, Bouygues Construction highlights its expertise in Building Information Modeling, which can be used to manage all
the information needed to design and build a structure.• In the construction phase, Bouygues Construction promotes the use of innovative methods and materials, for example Panobloc®
composite panels (timber lattice incorporating insulating materials) and the ABC (Autonomous Building for Citizens) programme, which aims to produce buildings that are self-sufficient in water and energy, and optimise waste management.
• In the operational phase, Bouygues Construction is responsive to client needs in terms of usage, energy efficiency and optimal infrastructure management. For example, the Hypervision® tool measures and predicts energy and fluid consumption as part of a process of continually improving building performance and residents’ convenience.
Leading player in sustainable constructionBuilding an environmental dimension into the design, construction and operation/maintenance of structures and embracing new renewable energies and energy renovation represents major global challenge.
(2) Definitions: - at constant exchange rates: change after translating foreign-currency sales for the current period at the exchange rates for the comparative period. - on a like-for-like basis: change in sales for the periods compared, recalculated so that divested entities are included, or acquired entities excluded, over the same length of time in each
period.
Bouygues Construction | 2016 Financial Report
6/7

Bouygues Construction designs and constructs buildings that are self-sufficient in 100% renewable energies and smart electricity supply networks (Smart Grids). We support renewable energy producers, and offer our clients innovative infrastructures like connected eco-districts (for example the Erlenmatt and GreenCity eco-districts in Switzerland and the Noés eco-village in Val-de-Reuil, France), biomass plants and solar farms. Bouygues Construction was a pioneer in carrying out the very first HQE™ (High Environmental Quality) certified renovations of contemporary tertiary buildings, office towers (the “First” tower at La Défense in Paris) and Haussmannian buildings (BBC-Effinergie® energy rating), and buildings with BEAM Plus (3), BREEAM®(4) and LEED® (5) certification.
Through its Réavenir programme, Bouygues Construction also offers solutions that cut the energy consumption of buildings while improving the lives of their occupants. Réavenir is based on three commitments: respect the environment and residents, engage in dialogue for active and participative refurbishment, and guarantee performance.
Building and civil worksIn 2016, sales in the building and civil works segment came to €9,580 million, lower than the 2015 figure of €9,857 million. Sales amounted to €4,406 million in France and €5,174 million on international markets.
FranceContrasting conditions prevailed on the construction market in France. Government policy in support of housing construction, such as the Pinel tax incentives and the zero-interest loan scheme, combined with low interest rates directly favoured the building sector despite pressure on government budgets and hesitation on the part of private and industrial investors.
The construction market in the Paris region is supported by substantial housing needs and the “Grand Paris” major infrastructure programme, which offers attractive long-term opportunities. The “Grand Paris Express” project (the largest since the 1960s) represents a civil works market worth €25 billion over the period to 2030.
The market was also boosted by renovation needs stemming from recent environmental legislation (the Grenelle environment laws) and the appeal of the capital, reflected in innovation programmes such as “Réinventer Paris” and “Réinventer la Seine”.
In the rest of France, the building segment remained under pressure, with projects tending to become smaller. Winning large-scale projects continues to be a very long and highly complex process, though some programmes such as the Institute for the Sustainable City help to sustain the market.
2016 sales: €4,406 million (-4%)In the Paris region, Bouygues Construction continued work on major amenity projects such as the Paris district court complex, La Seine Musicale in Boulogne-Billancourt, renovation of the Longchamp racecourse and rehabilitation of the Louvre Post Office building in Paris.
In the commercial property segment, work continued on several office rehabilitation projects in Paris, on Rue des Archives, Rue Malakoff and Boulevard de Grenelle. Commercial activity in the segment was marked by the order for the Tour Alto tower in the La Défense business district of Paris.
Construction work also continued on several work packages for the Batignolles property development in Paris, comprising offices, social and private housing and shops.
Elsewhere in France, Bouygues Construction’s four regional building subsidiaries were particularly active on the public-sector education and culture markets, with projects including renovation of the University of Bordeaux campus, extension and rehabilitation of the museum of fine arts in Nantes and the handover in 2016 of a new residential complex on the Saint-Jean-d’Angély campus of the University of Nice-Sophia-Antipolis.
In the healthcare sector, Bouygues Construction continued work on two buildings for the Strasbourg teaching hospitals and on the new hospital at Saint-Laurent-du-Maroni in French Guiana.
In the private sector, Bouygues Construction continued work on the Sky 56 office building in Lyon and took orders for several work packages for the construction of property complexes in the Wacken Europe business district in Strasbourg.
Work continued on major projects such as the property development programme associated with Stade Vélodrome stadium in Marseille, Lyon-Saint Exupéry airport and the future Bordeaux Métropole Arena entertainment complex.
(3) BEAM Plus: Building Environmental Assessment Method (Hong Kong certification).(4) BREEAM®: Building Research Establishment Environmental Assessment Method (UK certification).(5) LEED®: Leadership in Energy and Environmental Design (US certification).
6/7
Management report Consolidated financial statements Notes to the consolidated financial statements Statutory auditors’ report Parent company financial statements
In civil works, Bouygues Construction continue to work on complex major projects, including civil engineering for the Flamanville EPR nuclear power plant, the viaduct on the New coastal road on Reunion Island, the L2 Marseille bypass, the Nîmes-Montpellier railway bypass, the second tunnel package of the Paris metro Line 14 extension project, phases 3 and 5 of the Nice tramway and the renovation and extension of a wastewater pre-treatment plant in Clichy, north of Paris. Another highlight of 2016 was the order for a major project to extend the Port of Calais. In addition, regional branches all over France specialise in smaller-scale civil engineering projects and earthworks.
EuropeThe construction market in Europe has been showing signs of recovery since 2014, especially in Sweden, Ireland, the UK and some eastern European countries (Hungary, Poland and the Czech Republic).
In Western Europe, Bouygues Construction subsidiaries are particularly active in the UK, and in Switzerland. In the UK, uncertainty about what will happen to the economy following the Brexit vote in June 2016 helped to stabilise a construction market that was overheating. In Switzerland, the construction sector remained steady as a result of a flourishing economy.
2016 sales: €2,126 million (-3%)In the UK, Bouygues Construction’s activity was underpinned by urban regeneration projects. The company continued work on the Canning Town project in London, the Gascoigne Estate in Barking and Addlestone town centre in Surrey, and was chosen to develop and build a new Civic Centre in Hounslow, west London. Work also continued on the Manhattan Loft Gardens tower, which has now reached its definitive height. The development will play a key role in renewing and reinvigorating Stratford in east London.
In the education sector, Bouygues Construction continued work on The Triangle, the new headquarters of Cambridge University’s examination board, and recently booked an order for a property development project involving the construction of a university technical college and student residences at Ebury Bridge Centre in London. It also started construction work on a secondary school and on a centre for autism in Pembroke (Wales).
In late 2016, the company won the civil engineering contract for the Hinkley Point C EPR nuclear power plant.
Bouygues Construction also continued work on a proton-beam therapy cancer treatment centre in London.
Demand in Switzerland remained strong, especially on the housing market. Bouygues Construction drew on its expertise in putting together complex property development projects with stringent environmental requirements, building the Im Lenz eco-neighbourhood in Lenzburg, the L’Atelier complex in Geneva and the Faubourg 1227 residential complex at Carouge (Geneva). On other occasions this same level of expertise was able to win contracts for entire neighbourhoods such as Les jardins du couchant, a residential complex in Nyon, for another lots in the Erlenmatt eco-neighbourhood in Basel and two new lots for the GreenCity eco-neighbourhood in Zurich.
In Central Europe, Bouygues Construction has well-established positions through local subsidiaries in Poland and the Czech Republic, which continued to expand their building activities.
Elsewhere in Europe, Bouygues Construction is also involved on a one-off basis in major infrastructure projects. Work on the new confinement shelter for the damaged nuclear reactor at Chernobyl in Ukraine, which is being built in partnership with Vinci, has culminated in the largest moveable land-based structure ever built. The arch will make the accident site safe and, with a lifetime of 100 years, allow for the eventual dismantling of the existing shelter and management of the radioactive waste. In Croatia, work continued on the construction of a new terminal at Zagreb Airport and renovation of the existing terminal.
Asia - OceaniaGrowth rates on Asian markets remained very high despite a slowdown in China due to a fall in regional funding, consumption and imports.
Hong Kong, Singapore and Myanmar (since it opened up its economy) continue to be high-potential countries. Australia is heavily dependent on the mining industry, which accounts for 20% of its GDP, and consequently on exports. The Australian government’s current policy aims to support the economy by investing in training and infrastructure.
2016 sales: €1,912 million (+5%)Bouygues Construction has a strong local presence in the Asia-Oceania region, especially in Hong Kong, where it has been a player for 60 years, and in Singapore. Civil works activity continued unabated in Hong Kong. Several major projects are under construction, including a section of the giant Hong Kong-Zhuhai-Macao bridge, the sub-sea Tuen Mun-Chek Lap Kok road tunnel, two twin-tube tunnels for the six kilometre extension of the Shatin to Central Link metro line, and two 4.8-kilometre tunnels for the dual two lane highway linking the north-east of Hong Kong to the Liantang boundary control point with mainland China.
Bouygues Construction | 2016 Financial Report
8/9

Bouygues Construction is a recognised player on the Asian building market, especially for high-rise structures. In Singapore, work continued on the Bishan and Buangkok condominium tower blocks. In Bangkok, the company is building three residential tower blocks and the new Australian Embassy complex. In 2016, it handed over the MahaNakhon tower, the tallest residential building in Thailand. In Macao, work continued on the 39-storey, 6-star luxury Morpheus hotel in the heart of the City of Dreams entertainment complex.
In Myanmar, Bouygues Construction continued to establish its presence, building the second phase of the Star City residential complex in Yangon. In Australia, work continued on the NorthConnex motorway link project in Sydney.
Africa - Middle EastMajor projects are expected in Africa, linked in particular to rapid urbanisation, though the geopolitical context remains fragile and heavily dependent on prices for raw materials. In the Middle East, the economic situation is uncertain because it is highly reliant on the price of oil. However, transport infrastructure needs and the exploitation of natural resources make this a high-potential region for construction firms.
2016 sales: €753 million (-3%)In Africa, Bouygues Construction’s building and civil engineering firms work on major infrastructure projects. In Egypt, after taking part in the construction of Lines 1 and 2 of the Cairo metro, the company started work on the new phase of Line 3. Bouygues Construction is currently operating the Riviera Marcory bridge in Abidjan, Ivory Coast, and building the Ridge Hospital extension in Accra, Ghana. In Nigeria, work continued on the corporate headquarters of Nigeria LNG, a company which produces liquefied natural gas, and the Jabi Lake Mall in Abuja.
The company’s expertise in earthworks for opencast mining is illustrated in its operation of gold mines at Kibali in the Democratic Republic of Congo, Tongon in Ivory Coast and Gounkoto in Mali.
Bouygues Construction is involved in roadbuilding projects in several African countries in response to considerable demand, especially in Ivory Coast and Gabon.
In the Middle East, the company started building two sewage tunnels in Qatar as part of a strategic project to collect, pump and treat wastewater in the south of Doha. It also completed work on the Qatar Petroleum District in the same city, a vast complex that includes nine high-rise office buildings.
Americas - CaribbeanThere are opportunities in the Americas, especially the United States and Canada, as a result of the stated intention of rebuilding infrastructure, though they are tempered by a risk of greater protectionism. In Cuba, the expanding hotel industry and the need for infrastructure such as airports and port facilities make the country an attractive proposition for Bouygues Construction.
2016 sales: €348 million (-20%)The Americas/Caribbean region is growing strongly. Bouygues Construction has a long-term presence in Cuba, where it is a recognised specialist in the construction of turnkey luxury hotel complexes. The company continued construction work on around a dozen up-market hotel complexes in Havana, on Cayo Santa Maria, Cayo Coco and Cayo Crus and at Varadero, and also took orders for six new hotels in 2016. The number of tourists visiting the island has soared, opening up great prospects for the Cuban hotel industry.
In the United States, Bouygues Construction put the finishing touches to the Brickell City Centre development in Miami, a complex comprising offices, shops, apartments and hotels.
In Canada, the company continued work on Iqaluit International Airport in the country’s Arctic north.
Energies and servicesBouygues Energies & Services contributed €2,235 million to Bouygues Construction’s consolidated sales compared with €2,118 million in 2015, a rise of 6%. Bouygues Energies & Services has three business lines: network infrastructure, facilities management and electrical and HVAC engineering. It also builds turnkey power generation facilities such as biomass power plants and solar farms.
There is growing demand in industry for cutting-edge expertise in areas such as robotization and smart buildings, as well as for complex processes and industrial maintenance. In addition, environmental issues, demographic growth, spreading urbanisation and increasingly scarce raw materials make energy efficiency in buildings a central concern. Fast-growing telecommunications needs have also increased demand for network infrastructure. These key trends on the energy and services markets offer Bouygues Energies & Services sources of growth, both in the countries where it has most of its operations (France, the UK, Switzerland and Canada) and in emerging countries, especially in Asia and Africa.
8/9
Management report Consolidated financial statements Notes to the consolidated financial statements Statutory auditors’ report Parent company financial statements
France2016 sales: €1,121 million (+4%)
In addition to its traditional networks activity, Bouygues Energies & Services, through its Axione subsidiary, helps local authorities to implement their digital development policies. Axione continued to roll out very-high-speed broadband networks in the Oise, Eure-et-Loir, Vaucluse and Aisne departments. In 2016 it took orders to roll out FTTH (Fibre To The Home) networks in the Nord, Pas-de-Calais and Savoie departments. These three contracts involve activating more than 750,000 new FTTH connections.
In electrical and HVAC engineering, Bouygues Energies & Services provided mechanical and electrical equipment for the L2 Marseille bypass and electrical and HVAC engineering packages for the Saint-Laurent-du-Maroni hospital in French Guiana. It also handed over a thermal power plant in the French part of the Caribbean island of Saint-Martin.
In the framework of public-private partnerships, Bouygues Energies & Services provided maintenance services for the Paris zoo, the French Defence Ministry in Paris and the University of Bordeaux. It also continued a number of street-lighting contracts, the most important one being with the City of Paris.
International2016 sales: €1,114 million (+7%)
Bouygues Energies & Services is continuing to expand in its three main lines of business (FM, energy and digital networks, and electrical, HVAC and mechanical engineering) in Europe (especially the UK and Switzerland), Africa (Gabon and Ivory Coast) and North America (Canada).
On international markets, Bouygues Energies & Services is an expert in major turnkey power grid infrastructure projects. It handed over a turnkey solar farm in the Philippines, currently the largest such facility in south-east Asia, and continued work on a thermal power station in Gibraltar and two biomass waste-to-energy gasification plants in the UK, at Hoddesdon, north of London, and in Belfast (Northern Ireland).
It has a facilities management (maintenance and services) business in Europe, with contracts as the offices of Crédit Suisse in Switzerland and King’s College, London in the UK.
In Africa, Bouygues Energies & Services is involved in power transport and distribution, mainly in Ivory Coast and Gabon.
In Canada, Bouygues Energies & Services provides FM for Surrey Hospital and the RCMP headquarters. It is expanding on the electrical engineering market via its Plan Group subsidiary, which in 2016 was awarded the electrical engineering package for Joseph Brant Hospital in Ontario.
FM contracts, both in France and elsewhere, guarantee Bouygues Energies & Services recurring long-term income.
Risk management policy
The risks facing Bouygues Construction in 2016 were of a similar nature to those identified in previous years: operational risks relating to major projects, risks relating to employee security, risks relating to economic and political instability, and compliance risk.
Risk management policy
Internal control
Evaluation of internal controlDuring 2016, Bouygues Construction again deployed internal control self-assessment in depth across the organisational structure, including a number of production departments and branch offices.
Overall, the campaign involved over 500 people in more than 100 entities or units, representing more than 80% of Bouygues Construction sales. On average, each entity or unit evaluated 80 principles from the risk management and internal control framework.
Seven common themes were addressed: six covering general principles, and one covering accounting and financial principles. In addition to issues relating to legal compliance and information systems, entities also performed self-assessments on subcontracting.
Bouygues Construction | 2016 Financial Report
10/11

The self-assessment campaign was conducted during the spring, with summary reports presented in the autumn. The data collected were used to compile findings about the effectiveness of internal control within Bouygues Construction, and to develop and implement action plans with a view to constantly improving the internal control system.
Each entity develops its own action plans. At Bouygues Construction level, managers of the support functions oversee action plans for the common themes:• Legal compliance: awareness campaigns relating to the Group’s compliance programmes continued during 2016. The key action plans
in this area are described in the “Risk factors” section of this report. • Information systems: the 2016 campaign shows the progress that has been made in continuity of service, security and regulatory
compliance. Roll out of the information systems security policy is ongoing, with a particular focus on applications that host sensitive data and the administration of access and user authorisations.
• Subcontracting: the key areas of attention are measures to combat illegal employment practices, and the prevention of subcontractor default.
• Accounting and treasury: the 2016 campaign focused on a review of customer account processes and guarantees. Overall, the results of the assessments point to good levels of controls over these processes.
The 2016 campaign continued the process of extending the roll out of the internal control systems to front-line entities and units. By providing high-quality feedback and pooling their results, those involved are helping internal control to become a training, team-building and management tool.
Risk mappingRisk mapping is now integrated into the Bouygues Construction management cycle as part of the strategic plan. It is also submitted to the Accounts Committee and the Board of Directors.
This management process provides a shared vision of major risks at both entity and Group level, with the aim of constantly improving control over those risks. In addition, synergies between risk management, internal control and internal audit can add value to the organisation’s control processes. The annual internal audit plan includes a number of assignments which address the key risks identified by the mapping process.
The risk mapping campaign is conducted in the spring. The work done at entity level is supplemented by contributions from the support functions, forming the basis for risk mapping across the Group as a whole.
Key risk factsheets, which identify action plans, are updated during the campaign.
Resources deployedThe internal control roll out strategy adopted by Bouygues Construction reflects the Group’s decentralised structure, and the decision to rely on strong and highly-structured support functions. The control environment is adapted accordingly:
Role of the Bouygues Construction holding company Overall management of the internal control system is handled by a dedicated team within the Legal Affairs, Insurance, Audit, Internal Control and Legal Compliance department. The holding company plays the lead role in the process, co-ordinates the self-assessment campaigns, and provides methodological support to the entities. It also prepares the Group-level summary report, monitors transverse action plans, and drafts Group-level risk mapping.
Role of the entitiesWithin the entities, internal control is the responsibility of the Corporate Secretary. Each entity compiles its own risk mapping, and presents it as part of the strategic plan. Internal control correspondents are responsible for the roll out of self-assessment campaigns. The Corporate Secretary of each operational unit is responsible for onward deployment within the unit itself.
Role of the support functionsThe support functions bind the process together, building on the work done at entity level. Managers of the support functions and centres of excellence are responsible for approving certain principles; they also prepare a summary report, and monitor transverse action plans. The support functions also carry out their own risk mapping.
Training and awareness programmesNumerous training and awareness programmes form part of the campaign: discussion forums and feedback meetings, committee meetings at support function level, and reporting to the Executive Committees. A co-ordinating committee for those responsible for internal control at entity level provides a forum for information sharing across the Group’s entities.
10/11
Management report Consolidated financial statements Notes to the consolidated financial statements Statutory auditors’ report Parent company financial statements

Accounting and financial internal controlThe entities have specific resources in both accounting and financial control. Accounting teams may be centralised or decentralised, depending on the circumstances. Financial controllers – present at every level of the organisation – work closely with operational managers. Both functions operate on the double reporting principle.
The financial control and accounting functions both report to the Corporate Secretary. Shared resource centres are currently being set up in the main territories where Bouygues Construction operates. These centres enable subsidiaries based in the same geographical territory to access shared accounting resources.
Operational risks
Risks associated with major projects in the design or execution phaseMajor projects are a potential source of risk for Bouygues Construction because of their size and number. They frequently involve complex packages (public-private partnerships, concessions, long-term contracts), which call for risks to be allocated commensurately with the capacities of the company. The 2016 order intake includes a number of large-scale building and civil works contracts, with contracts in international markets particularly prominent.
The types of risk inherent in major projects include:• in the design phase: design flaws, miscalculation and under-budgeting, poor assessment of the local environment, inadequate
contractual analysis, etc.;• in the execution phase: technical or financial default by a customer, partner or subcontractor, difficulty in recruiting sufficient staff
or adequately qualified staff, and execution defects leading to cost overruns, quality problems or failure to meet deadlines, etc.
To achieve tighter control over these two major risk areas, Bouygues Construction has an organisational structure that reflects the specific requirements of each business, backed up by rigorous selection, approval and control procedures.
Each entity has access to substantial, highly-qualified resources in technical fields such as design, costing, feasibility studies and methods. Clusters of staff with extensive expertise in highly specialised areas (tall buildings, materials engineering, facades and sustainable construction, for example) share knowledge and capitalise on experience across all Bouygues Construction entities.
The support function structure, which operates on similar lines, has been strengthened. Separate departments covering legal affairs, human resources, accounting, management control, information systems and procurement are headed up by members of the Bouygues Construction management team. Specialist clusters dedicated to treasury management, financial engineering, tax and insurance provide expertise to all Group entities.
Approval and control procedures apply at each key stage in design and execution. For major projects, project selection and key risks and opportunities are subject to systematic monitoring.
Key operational risks are further mitigated by the fact that project execution teams are highly professional and adequately staffed, and are actively supervised by experienced managers.
Design and execution processes are documented in management systems at operational unit level, and are subject to measures designed to enhance performance and control:• particular attention is paid to the pre-execution phase of major projects, especially in design, contract drafting and site preparation;• in the design phase, external consultants are used to back up in-house expertise on technical issues for the highest-risk projects;• regular costing audits are performed on the reliability of procedures for expenses, subcontractor budgets, and site supervision costs;• support functions are systematically involved upfront, especially in contract management and procurement;• particular care is taken in the selection and monitoring of customers and partners;• the subcontracting process is closely supervised, with major subcontractors and partners thoroughly assessed before awarding
highly-sensitive work packages (such as architectural and technical trades);• risk monitoring is assisted by the use of specifically developed procedures and tools.
In 2016, the main areas of focus were management of the works phase and oversight of project managers, plus managing stakeholder engagement and the drafting of tender documentation for major projects.
Bouygues Construction | 2016 Financial Report
12/13

Risks relating to employee securityBouygues Construction generates 47% of its sales in France and 73% in OECD countries.Operations outside those regions potentially expose employees to security risk in respect of terrorism, criminal acts, organised crime, etc.
Bouygues Construction has responded to the level of terrorist risk worldwide, and to threats directed at French interests and French nationals, by reinforcing existing security measures designed to protect people at all of its sites.
The Security Committee constantly monitors the situation in countries where Bouygues Construction has ongoing or prospective operations, and implements appropriate preventive measures and solutions in response to risks as they arise.
In 2016, the increased focus on security was reflected in the appointment of a Security Director at Bouygues Construction, with the following key responsibilities: • monitoring and preventing security risks in countries where Bouygues Construction is present;• co-ordinating and directing resources in security risk situations;• oversight of the security specialists employed by each entity;• overseeing the security action plan.
The Security Committee regularly reviews the security situation in countries where Bouygues Construction has operations. Particularly close attention is paid to countries for which the French Foreign Ministry has recommended vigilance in relation to the risk of terrorist attacks, especially in the Sahel region of Africa. Restrictions are placed on movements in response to any warnings that may be issued, and the company regularly reminds the relevant employees of the rules regarding vigilance.
Regularly updated business continuity plans are also in place in the various countries in which Bouygues Construction has operations. A key aim of such plans is to safeguard people, in particular by ensuring that guidelines issued by French embassies in at-risk countries are strictly followed, and by liaising with the embassies to develop evacuation plans for various alert levels. In addition, flexible and responsive organisational structures mean that in exceptional circumstances, Bouygues Construction can withdraw from countries where such risks materialise while keeping its losses to a minimum.
Risks related to economic and political instabilityThere are a number of factors generating instability and uncertainty that may disrupt Bouygues Construction’s operations:• persistently weak world economic growth, and sluggish international trade;• difficulties in commodity producing countries due to a slowdown in demand from China and worsening public finances in oil
and gas exporting countries;• volatility in stock markets;• the economic consequences of Brexit, and the risk of a backlash against globalisation.
The euro zone is likely to see a downturn in growth during 2017, with France below the average.
However, the European construction market has returned to growth, and this applies to France too.
High borrowing levels and public spending constraints are holding back investment, while low interest rates are boosting household spending power.
In France, the upturn in the new residential property market is expected to continue, along with a gradual upturn in new commercial property. The business climate in civil works is improving.
Bouygues Construction’s positioning in developed countries limits its exposure to uncertainties, but may lead to a risk of exposure to economic stagnation in those countries and to tough market conditions. In the rest of the world, Bouygues Construction needs to monitor the situation carefully and take preventive measures in legal, financial and insurance matters.
Nevertheless, Bouygues Construction has many strengths to help it resist and adapt to the economic climate. A diverse business mix and broad geographical footprint mean that the company is less exposed than a mono-line or mono-region business.
In addition, Bouygues Construction enjoys a favourable business environment in some countries or sectors. This applies to those parts of Asia where the company has a long-standing presence, in particular Hong Kong where Bouygues Construction is executing many large infrastructure projects. Bouygues Construction is also engaged in a geographical diversification strategy, focusing on expansion in buoyant markets such as the United States, Canada and Australia.
12/13
Management report Consolidated financial statements Notes to the consolidated financial statements Statutory auditors’ report Parent company financial statements

The healthy order backlog, which represented 18 months of sales as of the end of December 2016, gives good visibility in the short term. Bouygues Construction analyses forecasts to anticipate adverse trends, so that it can react appropriately and reallocate production resources to less affected markets or activities.
Finally, Bouygues Construction encourages job mobility between its businesses and geographical areas and the development of synergies between Group entities, so that it is always well placed to anticipate, react and adapt to changes in the economic environment.
Commodities riskBouygues Construction is not exposed to significant commodities risk.
Industrial and environmental risksBecause of the nature of its business, Bouygues Construction is not exposed to significant industrial or environmental risk, and is not subject to regulations on classified sites or to REACH(6).
Legal risk
Compliance riskWith compliance obligations becoming ever more demanding, Bouygues Construction has tightened its ethics policies to ensure that the principles contained in the Group’s compliance programmes are strictly applied.
Ethical compliance falls within the remit of Legal Affairs, working in conjunction with Audit and Internal Control; all three departments are under common management. Resources have been made available for Ethics and Compliance administration to provide oversight, conduct research and surveys as needed, and manage the tools used in this area.
In 2016, new hires were once again required to sign up to Ethics and Compliance commitments. A large-scale ethics awareness campaign in the form of a “serious game” is ongoing. Rules relating to patronage, sponsorship and hospitality have been widely disseminated, and are monitored by appropriate tools. An Ethics and Compliance investigation is conducted ahead of any decision to do business in a new country.
Compliance reviews, covering the full range of Ethics and Compliance issues across the various entities, were introduced in 2016.
Claims and litigation
South Africa: Gautrain ProjectThis rail infrastructure project linking South Africa’s principal airport to Johannesburg and Pretoria came fully into service on 8 June 2012.
Although this rail link has been a striking commercial success with higher than expected travel demand, a number of difficulties remained between Gauteng Province and Bombela Ltd, the concession company holding the contract, in which Bouygues Travaux Publics owns a 17% equity stake. These difficulties have given rise to several disputes.
These disputes led to arbitral proceedings before the Arbitration Foundation of Southern Africa which resulted in favourable awards either for the Province or for Bombela Ltd.
The Province and Bombela Ltd therefore decided to end these disputes permanently by concluding a settlement agreement on 21 November 2016. In this agreement, each party agreed to waive its rights against the other party in relation to the disputes.
The Settlement Agreement has therefore permanently ended the disputes which arose regarding the project.
France: Flamanville EPRCherbourg District Court found Bouygues Travaux Publics and Bouygues Bâtiment Grand Ouest (ex-Quille Construction) liable for various breaches of the employment legislation, on 7 July 2015. The Court ordered them to pay fines of €25,000 and €5,000 respectively. They have appealed this judgement. The hearing took place before the Caen Court of Appeal in November 2016.
The judgement is expected in March 2017.
(6) "Registration, Evaluation, Authorisation and Restriction of Chemicals" - a regulation of the European Union.
Bouygues Construction | 2016 Financial Report
14/15

France: Île-de-France Regional Authority ContractsFollowing a Competition Council (now the Competition Authority) ruling of 9 May 2007, the Île-de-France Regional Authority filed a compensation claim in 2008 for losses it claims to have incurred as a result of the anti-competitive practices by construction companies in connection with the awarding of public works contracts for the renovation of secondary school buildings in the region.
The Regional Authority’s summary application to the Paris District Court was rejected in a ruling issued on 15 January 2009 on the ground that, prima facie, there were serious reasons for objecting in principle to the compensation claim.
After being invited to appeal on the merits, the Regional Authority filed a further claim in the Paris District Court in February 2010, this time claiming damages for a loss estimated at €358 million based on the joint and several liability of the parties collectively liable for the loss, i.e. the companies and individuals found to have engaged in anti-competitive practices.
In a ruling of 17 December 2013, the Paris District Court ruled the Regional Authority’s claim inadmissible. The Regional Authority appealed to the Paris Court of Appeal on 22 January 2014. Nevertheless, after an application by the Prefect of the Île-de-France region, the Conflicts Court decided on 16 November 2015 that this dispute came within the jurisdiction of the Administrative Courts. To date, the Île-de-France Regional Authority has not brought any new action the Administrative Courts.
France: EOLEFollowing a Competition Council (now Competition Authority) ruling of 21 March 2006, imposing fines on a number of companies for general collusion in sharing contracts and specific collusion on tranches 34B and 37B of the East-West Express Rail Link (Eole) project, on 21 March 2011 SNCF brought an action in damages before the Paris Administrative Court seeking relief for losses that it claims to have suffered as a result of anti-competitive practices by construction companies when the project tranches were awarded.
The Paris Administrative Court rejected all of the SNCF’s claims on 31 May 2016. The SNCF has appealed this judgement. No hearing date has been fixed at the present time.
Insurance - Risk coverageBouygues Construction’s policy on insurance cover focuses on optimising and ensuring the continuing validity of the policies contracted for the company and its subsidiaries; the aim is to protect against exceptionally large or numerous potential claims at a cost that does not impair the company’s competitiveness.
This long-term approach to insurance cover requires partnerships with high-quality insurers with excellent financial solidity. To preserve these partnerships and prevent information being used to the detriment of Bouygues Construction, especially in legal disputes, the amount of premiums and the terms of cover are kept strictly confidential, especially in liability insurance.
In addition to insurance policies required by law, Bouygues Construction also takes out liability cover against loss or injury to third parties for which Group companies may be liable. Because Group companies vary greatly in size and in the nature of their operations, cover is tailored to the risks incurred, but is generally in excess of €5 million per claim.
Permanent premises (like the headquarters building, branch offices, depots and workshops) are protected by comprehensive insurance policies that provide cover up to a contractual rebuild cost agreed with the insurers on a maximum probable loss basis.
Projects in progress are usually covered by contractors’ comprehensive insurance policies that provide protection for property damage. The insured sum is generally the market value.
However, in some cases, the insured sum may be limited by the total capacity available in the world insurance market, in light of specific criteria such as geographic location, the type of project (e.g. tunnels), the risk covered (e.g. cyclones or earthquakes), or the nature of the cover (e.g. ten-year construction guarantees for major building projects).
For all these contracts, deductibles are set so as to optimise the overall cost to Bouygues Construction, based on the likelihood of claims and the premium reductions that can be obtained from insurers by increasing the deductible.
Finally, Bouygues Construction and its subsidiaries operate a prevent and protect policy, including the development of new measures to further reduce the incidence and financial effect of accidents and claims.
14/15
Management report Consolidated financial statements Notes to the consolidated financial statements Statutory auditors’ report Parent company financial statements

Credit and/or counterparty risk
Commercial credit and counterparty riskThe fact that our projects and operational units are structurally cash-positive is a fundamental principle underpinning the financial security of our operations. Cash flow and financial risk projections are prepared for major projects from the prospecting phase onwards, and are regularly updated.
The quality and financial soundness of sensitive customers, consortium members, partners, suppliers and subcontractors is closely analysed. Depending on the contractual and commercial context of a project, we may:• require an upfront advance from the customer before works commence;• require the customer to provide bank guarantees against payments;• assign trade receivables without recourse;• take out export risk insurance (covering against country risk and political risk);• take out credit insurance.
The Bouygues Construction Group is not exposed to any risk of dependency on a specific customer.
In the case of ad-hoc consortia, temporary allocations of cash between consortium members are covered by bank guarantees securing the return of the cash.
Banking credit and counterparty riskAny investment of funds with a third party requires the prior approval of the Treasury Department, in terms of both the choice of bank counterparty (based on an analysis of the bank’s rating) and the type of instrument.
The main investment products used are:• certificates of deposit and term deposits with a maturity of no more than six months with high-grade counterparties;• term accounts and interest-bearing accounts with high-grade banks offering daily liquidity;• pure money-market funds offering daily liquidity.
These investments are subject to review and monitoring on a monthly basis.
No losses arose during 2016 on any of the investment products used by the Group.
As of 31 December 2016, no single bank held more than 10% of the Group’s available liquidity. Over 90% of investments are placed with counterparties rated investment grade or better (minimum: Standard & Poors BBB+).
Liquidity riskAs of 31 December 2016, net cash amounted to €3,952 million, and the Group also had €352 million of undrawn confirmed credit facilities on that date. Consequently, Bouygues Construction is not exposed to liquidity risk. The bank loans contracted by the Group contain no financial covenants or trigger event clauses.
Interest rate risk
Exposure to interest rate riskInterest rate risk exposure arises on floating-rate debt recognised in the balance sheet, and is hedged by floating-rate investments. Bouygues Construction negotiates upfront payments with customers before starting work on a contract, and hence has a substantial net cash surplus which is invested in the short term in products that are sensitive to interest rate movements.
Interest rate risk hedging policyThe only instruments that can be used for interest rate risk hedging purposes are interest rate swaps, caps and collars. These instruments are used solely for hedging purposes, are contracted solely with high-grade French and foreign banks, and carry no liquidity risk in the event of reversal. Specific reports are prepared for those responsible for the management and supervision of the relevant Group companies describing the use of these instruments, the selection of counterparties with whom they are contracted, and more generally, the management of exposure to interest rate risk.
Bouygues Construction’s policy is to hedge at Group level some or all of its financial assets and liabilities, where these are foreseeable and recurring. Given the Group’s level of debt and capital expenditure needs, use of the financial instruments listed above is limited to hedging the company’s risk exposures.
Bouygues Construction | 2016 Financial Report
16/17

Currency risk
Exposure to currency riskBouygues Construction has low exposure to currency risk in routine commercial transactions. Where possible, expenses relating to a contract are incurred in the same currency as that in which the contract is billed.
This applies to most construction projects executed outside France, on which local currency expenses (sub-contracting and supplies) represent a much higher proportion than euro-denominated expenses. Bouygues Construction also pays particular attention to risks relating to assets denominated in non-convertible currencies, and to country risk generally.
Currency risk hedging policy The only instruments that can be used for currency risk hedging purposes are forward currency purchases and sales, currency swaps and currency options. These instruments are used solely for hedging purposes, are contracted solely with high-grade French and foreign banks, and carry no liquidity risk in the event of reversal. Specific reports are prepared for those responsible for the management and supervision of the relevant Group companies describing the use of these instruments, the selection of counterparties with whom they are contracted, and more generally, the management of exposure to currency risk.
Bouygues Construction Group policy is to hedge systematically all residual exposure to currency risk on commercial transactions relative to the functional currency of a project or entity. If the future cash flow is certain, the currency risk is hedged by buying or selling currency forward, or by means of currency swaps. For some large contracts, options may be taken out for hedging purposes before the contract award has been confirmed. Equity investments in foreign companies are usually hedged by a liability of a similar amount in the same currency in the books of the entity that holds the investment.
Risk relating to equities and other financial instrumentsBouygues Construction has no exposure to equities risk.
Financial instruments may occasionally be contracted to hedge a commodities risk, provided that an adequate instrument is available on the financial markets. These instruments are used solely for hedging purposes and are contracted solely with high-grade banks.
16/17
Management report Consolidated financial statements Notes to the consolidated financial statements Statutory auditors’ report Parent company financial statements
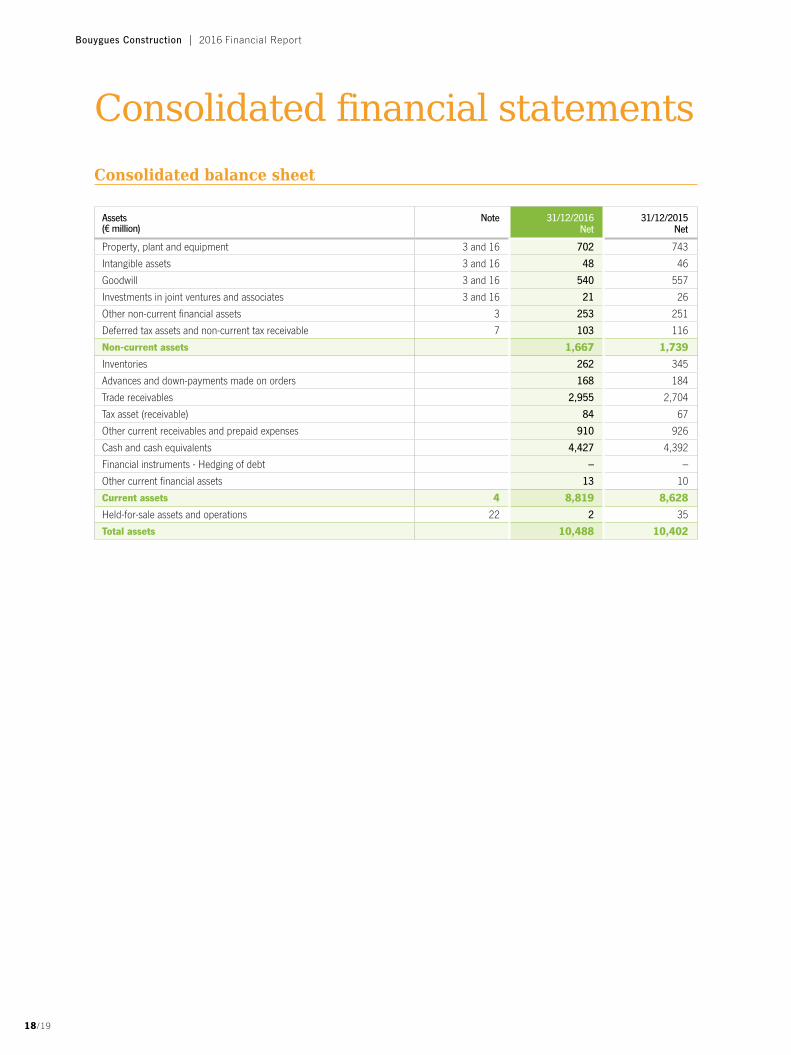
Consolidated financial statementsConsolidated balance sheet
Assets (€ million)
Note 31/12/2016 Net
31/12/2015 Net
Property, plant and equipment 3 and 16 702 743
Intangible assets 3 and 16 48 46
Goodwill 3 and 16 540 557
Investments in joint ventures and associates 3 and 16 21 26
Other non-current financial assets 3 253 251
Deferred tax assets and non-current tax receivable 7 103 116
Non-current assets 1,667 1,739
Inventories 262 345
Advances and down-payments made on orders 168 184
Trade receivables 2,955 2,704
Tax asset (receivable) 84 67
Other current receivables and prepaid expenses 910 926
Cash and cash equivalents 4,427 4,392
Financial instruments - Hedging of debt – –
Other current financial assets 13 10
Current assets 4 8,819 8,628
Held-for-sale assets and operations 22 2 35
Total assets 10,488 10,402
Bouygues Construction | 2016 Financial Report
18/19
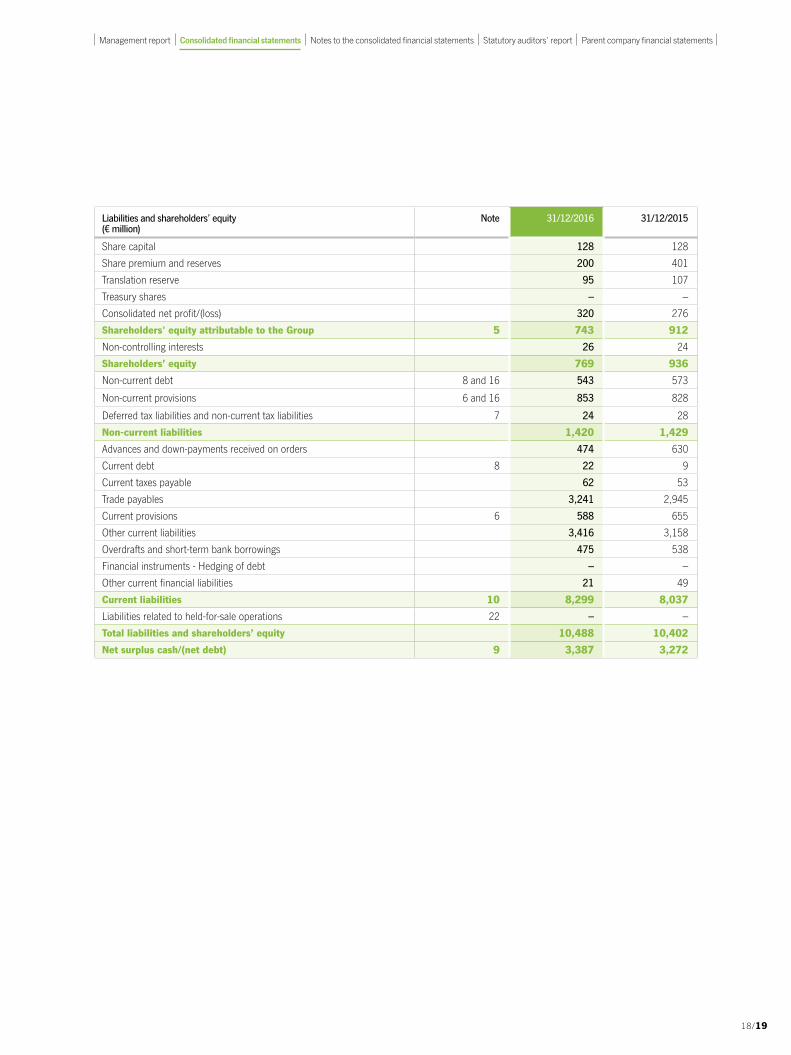
Liabilities and shareholders’ equity (€ million)
Note 31/12/2016 31/12/2015
Share capital 128 128
Share premium and reserves 200 401
Translation reserve 95 107
Treasury shares – –
Consolidated net profit/(loss) 320 276
Shareholders' equity attributable to the Group 5 743 912
Non-controlling interests 26 24
Shareholders’ equity 769 936
Non-current debt 8 and 16 543 573
Non-current provisions 6 and 16 853 828
Deferred tax liabilities and non-current tax liabilities 7 24 28
Non-current liabilities 1,420 1,429
Advances and down-payments received on orders 474 630
Current debt 8 22 9
Current taxes payable 62 53
Trade payables 3,241 2,945
Current provisions 6 588 655
Other current liabilities 3,416 3,158
Overdrafts and short-term bank borrowings 475 538
Financial instruments - Hedging of debt – –
Other current financial liabilities 21 49
Current liabilities 10 8,299 8,037
Liabilities related to held-for-sale operations 22 – –
Total liabilities and shareholders’ equity 10,488 10,402
Net surplus cash/(net debt) 9 3,387 3,272
18/19
Management report Consolidated financial statements Notes to the consolidated financial statements Statutory auditors’ report Parent company financial statements

Consolidated income statement
(€ million) Note Full year 2016 Full year 2015
Sales(1) 11 and 16 11,815 11,975
Other revenues from operations 116 91
Purchases used in production (6,779) (7,070)
Personnel costs (2,738) (2,749)
External charges (1,713) (1,619)
Taxes other than income tax (147) (153)
Net depreciation and amortisation expense (227) (190)
Net charges to provisions and impairment losses (193) (238)
Changes in production and property development inventories (68) 19
Other income from operations(2) 497 558
Other expenses on operations (237) (275)
Current operating profit/(loss) 12 and 16 326 349
Other operating income – –
Other operating expenses (23) (35)
Operating profit/(loss) 12 and 16 303 314
Financial income 27 27
Financial expenses (13) (18)
Income from net surplus cash/(cost of net debt) 13 and 16 14 9
Other financial income 13 and 16 37 46
Other financial expenses 13 and 16 (34) (29)
Income tax 14 and 16 (119) (108)
Share of profits/(losses) of joint ventures and associates 3 and 16 121 56
Net profit/(loss) from continuing operations 16 322 288
Net profit/(loss) from discontinued and held-for-sale operations 22 – –
Net profit/(loss) 16 322 288
Net profit/(loss) attributable to the Group 16 320 276
Net profit/(loss) attributable to non-controlling interests 2 12
Basic earnings per share from continuing operations (€) 15 187.55 161.76
Diluted earnings per share from continuing operations (€) 15 187.55 161.76
(1) Of which sales generated abroad. 6,288 6,286(2) Of which reversals of unutilised provisions/impairment losses. 209 244
Bouygues Construction | 2016 Financial Report
20/21

Consolidated statement of recognised income and expense
(€ million) Full year 2016 Full year 2015
Net profit/(loss) 322 288
ITEMS NOT RECLASSIFIABLE TO PROFIT OR LOSS
Actuarial gains/losses on post-employment benefits (9) (5)
Change in remeasurement reserve – –
Net tax effect of items not reclassifiable to profit or loss (1) 1
Share of non-reclassifiable income and expense of joint ventures and associates – –
ITEMS RECLASSIFIABLE TO PROFIT OR LOSS
Change in cumulative translation adjustment (12) 53
Net change in fair value of financial instruments used for hedging purposes and of other financial assets (including available-for-sale financial assets) 24 (7)
Net tax effect of items reclassifiable to profit or loss (3) 1
Share of reclassifiable income and expense of joint ventures and associates 13 5
Income and expense recognised directly in equity 12 48
Total recognised income and expense 334 336
Recognised income and expense attributable to the Group 331 323
Recognised income and expense attributable to non-controlling interests 3 13
20/21
Management report Consolidated financial statements Notes to the consolidated financial statements Statutory auditors’ report Parent company financial statements

Consolidated statement of changes in shareholders’ equity
(€ million) Share capital
& share premium
Reserves related to
capital/ Retained earnings
Consolidated reserves and
profit/(loss)
Treasury shares
Items recognised directly in
equity
Total attributable
to the Group
Non- controlling
interests
Total
Position at 31 December 2014 143 246 458 – (18) 829 12 841
MOVEMENTS DURING 2015
Capital and reserves transactions, net – 5 (5) – – – – –
Acquisitions/disposals of treasury shares – – – – – – – –
Acquisitions/disposals without loss of control – – – – – – – –
Dividend paid – – (253) – – (253) (1) (254)
Other transactions with shareholders – – – – – – – –
Net profit/(loss) – – 276 – – 276 12 288
Translation adjustment – – – – 53 53 1 54
Other recognised income and expense – – – – (6) (6) – (6)
Total recognised income and expense(2) – – 276 – 47 323 13 336
Other transactions (changes in scope of consolidation and other items)
– – 13 – – 13 – 13
Position at 31 December 2015 143 251 489 – 29 912 24 936
MOVEMENTS DURING 2016
Capital and reserves transactions, net – (5) 5 – – – – –
Acquisitions/disposals of treasury shares – – – – – – – –
Acquisitions/disposals without loss of control – – – – – – – –
Dividend paid – – (500) – – (500) (1) (501)
Other transactions with shareholders – – – – – – – –
Net profit/(loss) – – 320 – – 320 2 322
Translation adjustment – – – – (12) (1) (12) 1 (11)
Other recognised income and expense – – – – 23 23 – 23
Total recognised income and expense(2) – – 320 – 11 331 3 334
Other transactions (changes in scope of consolidation and other items)
– – – – – – – –
Position at 31 December 2016 143 246 314 – 40 743 26 769
(1) Change in translation reserve.
Attributable to: Group Non-controlling interests
Total
Controlled entities (13) 1 (12)Joint ventures and associates 1 – 1
(12) 1 (11)
(2) See statement of recognised income and expense.
Bouygues Construction | 2016 Financial Report
22/23

Consolidated cash flow statement
Cash flow from continuing operations (€ million) Note Full year 2016 Full year 2015
A - NET CASH GENERATED BY/(USED IN) OPERATING ACTIVITIES
Net profit/(loss) from continuing operations 322 288Share of (profits)/losses reverting to joint ventures and associates, net of dividends received (8) 11
Elimination of dividends (non-consolidated companies) (15) (15)Charges to/(reversals of) depreciation, amortisation, impairment & non-current provisions 261 208
Gains and losses on asset disposals (128) (127)Miscellaneous non-cash charges (3) 3Sub-total 429 368(Income from net surplus cash)/cost of net debt (14) (9)Income tax 119 108Cash flow 16 534 467Income taxes paid (121) (146)Changes in working capital related to operating activities (1) 194 326Net cash generated by/(used in) operating activities 607 647
B - NET CASH GENERATED BY/(USED IN) INVESTING ACTIVITIES
Purchase price of property, plant and equipment and intangible assets 16 (217) (252)Proceeds from disposals of property, plant and equipment and intangible assets 44 38Net liabilities related to property, plant and equipment and intangible assets (8) 15Purchase price of non-consolidated companies and other investments 16 (2) (2)Proceeds from disposals of non-consolidated companies and other investments 1 4Net liabilities related to non-consolidated companies and other investments – –Effects of changes in scope of consolidation 21Purchase price of investments in consolidated activities 16 (4) (14)Proceeds from disposals of investments in consolidated activities 144 57Net liabilities related to consolidated activities (1) 1Other effects of changes in scope of consolidation (cash of acquired and divested companies) 17 2
Other cash flows related to investing activities (changes in loans, dividends received from non-consolidated companies) 27 24
Net cash generated by/(used in) investing activities 1 (127)
C - NET CASH GENERATED BY/(USED IN) FINANCING ACTIVITIES
Capital increases/(reductions) paid by shareholders & non-controlling interests and other transactions between shareholders – –
Dividends paid
Dividends paid to shareholders of the parent company (500) (253)Dividends paid by consolidated companies to non-controlling interests (1) (1)Change in current and non-current debt (6) 9Income from net surplus cash/(cost of net debt) 14 9Other cash flows related to financing activities – –Net cash generated by/(used in) financing activities (493) (236)
D - EFFECT OF FOREIGN EXCHANGE FLUCTUATIONS (17) 122
Change in net cash position (A + B + C + D) 98 406Net cash position at start of period 4 and 10 3,854 3,449Net cash flows 98 406Other non-monetary flows – (1)Net cash position at end of period 4 and 10 3,952 3,854
Cash flows from discontinued and held-for-sale operations 22
Net cash position at start of period – –Net cash flows – –Net cash position at end of period – –
(1) Definition of change in working capital related to operating activities: current assets minus current liabilities (excluding income taxes paid, which are reported separately).
22/23
Management report Consolidated financial statements Notes to the consolidated financial statements Statutory auditors’ report Parent company financial statements

Notes to the consolidated financial statementsNote 1. Significant events
1.1 Significant events of the year
• On 15 June 2016 Bouygues Travaux Publics, a subsidiary of Bouygues Construction, sold its residual equity interest in Autoroute de Liaison Seine Sarthe (ALIS), which holds the concession for the Rouen-Alençon section of the A28 motorway in France.
The assets sold, for €35 million, comprised 10% of the capital and shareholder loans.
• On 9 November 2016, the Bouygues Group sold its 46.10% equity interest in ADELAC (39.20% owned by Bouygues Construction, 6.90% by Colas), which holds the concession for a 19-kilometre stretch of the A41 “Autoroute des Deux Lacs” motorway in France, to AREA.
The Bouygues Construction subsidiaries Bouygues Travaux Publics, Quille and Bouygues Bâtiment Sud-Est sold their equity interests in ADELAC, along with the associated shareholder loans.
The €110 million gain arising on the sale is recognised in “Share of profits/(losses) of joint ventures and associates” in the income statement.
1.2 Significant events and changes in scope of consolidation since 31 December 2016
There have been no significant events since 31 December 2016.
Note 2. Group accounting policies
The financial statements of the Bouygues Construction group include the financial statements of Bouygues Construction SA and its subsidiaries, its investments in associates and joint ventures, and its joint operations. The financial statements are presented in millions of euros, and take account of Recommendation 2013-03 on the presentation of financial statements, issued on 7 November 2013 by the French national accounting standard-setter, the Conseil National de la Comptabilité (CNC), now the Autorité des Normes Comptables (ANC).
The consolidated financial statements were closed off by the Board of Directors on 20 February 2017, and will be submitted for approval by the forthcoming Annual General Meeting on 18 April 2017.
The consolidated financial statements for the year ended 31 December 2016 were prepared in accordance with International Financial Reporting Standards (IFRS) using the historical cost convention, except for certain financial assets and liabilities measured at fair value where this is a requirement under IFRS. They include comparatives as at and for the year ended 31 December 2015.
The Bouygues Construction group applied the same standards, interpretations and accounting policies for the year ended 31 December 2016 as were applied in its consolidated financial statements for the year ended 31 December 2015, except for new IFRS requirements applicable from 1 January 2016 as mentioned below.
• Principal new IFRS standards, amendments and interpretations effective within the European Union and mandatorily applicable or permitted for early adoption from 1 January 2016:
- Amendments to IAS 7: Statement of Cash Flows These amendments lay down the principle that an entity should provide disclosures that enable users of financial statements to evaluate changes in liabilities arising from financing activities, including both changes arising from cash flows and non-cash changes.To meet this requirement, Bouygues Construction provides a reconciliation between the opening and closing financial positions as regards liabilities included in financing activities, in Note 9.These amendments are applicable to annual reporting periods beginning on or after 1 January 2017, and have been early adopted in the consolidated financial statements for the year ended 31 December 2016.
Bouygues Construction | 2016 Financial Report
24/25
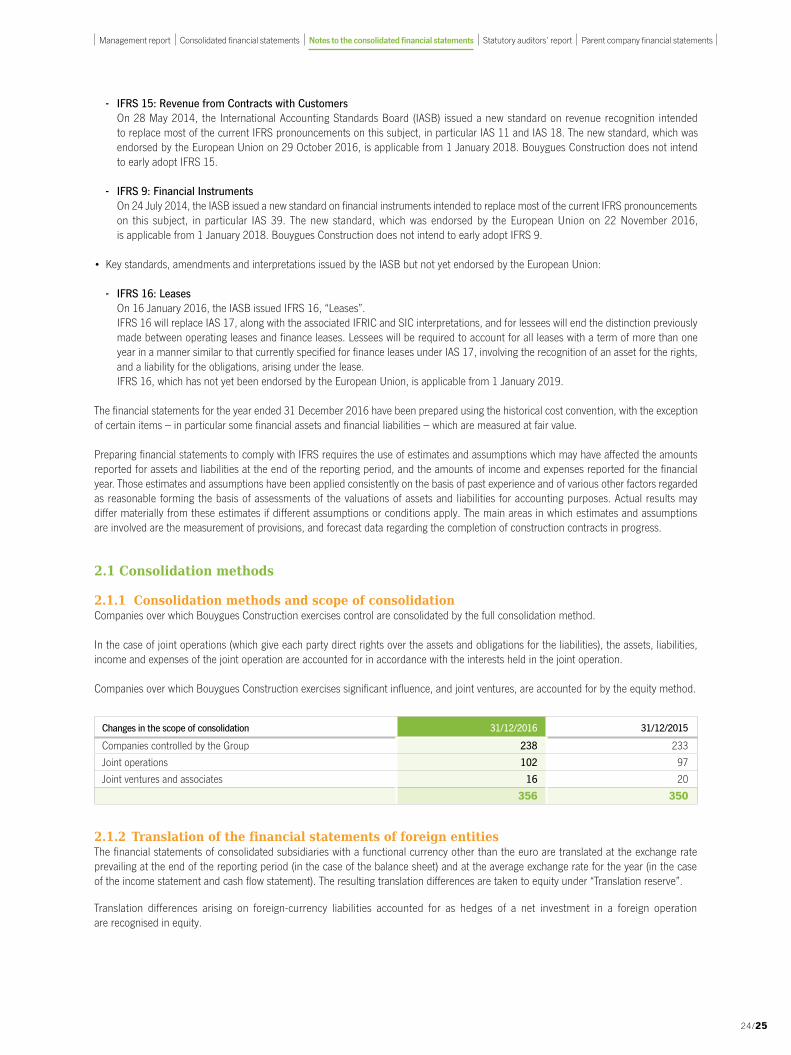
- IFRS 15: Revenue from Contracts with CustomersOn 28 May 2014, the International Accounting Standards Board (IASB) issued a new standard on revenue recognition intended to replace most of the current IFRS pronouncements on this subject, in particular IAS 11 and IAS 18. The new standard, which was endorsed by the European Union on 29 October 2016, is applicable from 1 January 2018. Bouygues Construction does not intend to early adopt IFRS 15.
- IFRS 9: Financial InstrumentsOn 24 July 2014, the IASB issued a new standard on financial instruments intended to replace most of the current IFRS pronouncements on this subject, in particular IAS 39. The new standard, which was endorsed by the European Union on 22 November 2016, is applicable from 1 January 2018. Bouygues Construction does not intend to early adopt IFRS 9.
• Key standards, amendments and interpretations issued by the IASB but not yet endorsed by the European Union:
- IFRS 16: LeasesOn 16 January 2016, the IASB issued IFRS 16, “Leases”.IFRS 16 will replace IAS 17, along with the associated IFRIC and SIC interpretations, and for lessees will end the distinction previously made between operating leases and finance leases. Lessees will be required to account for all leases with a term of more than one year in a manner similar to that currently specified for finance leases under IAS 17, involving the recognition of an asset for the rights, and a liability for the obligations, arising under the lease.IFRS 16, which has not yet been endorsed by the European Union, is applicable from 1 January 2019.
The financial statements for the year ended 31 December 2016 have been prepared using the historical cost convention, with the exception of certain items – in particular some financial assets and financial liabilities – which are measured at fair value.
Preparing financial statements to comply with IFRS requires the use of estimates and assumptions which may have affected the amounts reported for assets and liabilities at the end of the reporting period, and the amounts of income and expenses reported for the financial year. Those estimates and assumptions have been applied consistently on the basis of past experience and of various other factors regarded as reasonable forming the basis of assessments of the valuations of assets and liabilities for accounting purposes. Actual results may differ materially from these estimates if different assumptions or conditions apply. The main areas in which estimates and assumptions are involved are the measurement of provisions, and forecast data regarding the completion of construction contracts in progress.
2.1 Consolidation methods
2.1.1 Consolidation methods and scope of consolidationCompanies over which Bouygues Construction exercises control are consolidated by the full consolidation method.
In the case of joint operations (which give each party direct rights over the assets and obligations for the liabilities), the assets, liabilities, income and expenses of the joint operation are accounted for in accordance with the interests held in the joint operation.
Companies over which Bouygues Construction exercises significant influence, and joint ventures, are accounted for by the equity method.
Changes in the scope of consolidation 31/12/2016 31/12/2015
Companies controlled by the Group 238 233
Joint operations 102 97
Joint ventures and associates 16 20
356 350
2.1.2 Translation of the financial statements of foreign entitiesThe financial statements of consolidated subsidiaries with a functional currency other than the euro are translated at the exchange rate prevailing at the end of the reporting period (in the case of the balance sheet) and at the average exchange rate for the year (in the case of the income statement and cash flow statement). The resulting translation differences are taken to equity under “Translation reserve”.
Translation differences arising on foreign-currency liabilities accounted for as hedges of a net investment in a foreign operation are recognised in equity.
24/25
Management report Consolidated financial statements Notes to the consolidated financial statements Statutory auditors’ report Parent company financial statements

2.1.3 Translation of transactions denominated in foreign currenciesEntities that have the euro as their functional currency translate foreign-currency transactions into euros at the exchange rate prevailing on the transaction date. Monetary assets and liabilities denominated in foreign currencies at the end of the reporting period are translated at the closing exchange rate, with the resulting translation differences recognised in profit or loss for the period.
2.1.4. Deferred taxationDeferred taxation is recognised on all differences between the carrying amount and the tax base of assets or liabilities (balance sheet liability method). These differences arise from:• Temporary differences between the carrying amount and tax base of assets or liabilities, which may be:
- items generating a tax liability in the future (deferred tax liabilities), arising mainly from income that is liable to tax in future periods; or - items deductible from taxable profits in the future (deferred tax assets), mainly provisions that are temporarily non-deductible for tax
purposes. Deferred tax assets are reviewed at the end of each reporting period, and recognised where it is probable there will be sufficient taxable profits to enable the temporary differences to be offset.
• Tax losses available for carry-forward (deferred tax assets), provided that there is a strong probability of recovery in future periods.
Deferred taxes are measured at the tax rate applicable at the end of the reporting period, adjusted as necessary for the effect of changes in tax legislation.
The effects of changes in corporate income tax rates are recognised in profit or loss for the period, in accordance with the liability method.
The estimated amount of non-recoverable taxes on dividends payable by French or foreign subsidiaries is covered by a provision where material.
2.1.5. Concession contracts and Public-Private Partnerships (PPP)The Bouygues Construction group has equity interests in associates that have been awarded concession/PPP contracts; these are accounted for in accordance with IFRIC 12.
2.2. Accounting policies and valuation methods
2.2.1. Assets
a. Non-current assets
Property, plant and equipmentProperty, plant and equipment are measured at acquisition cost.
Where an item of property, plant and equipment consists of significant components with different useful lives or different depreciation methods, each component is accounted for and depreciated as a separate item of property, plant and equipment (component-based approach).
The cost of an item of property, plant and equipment comprises the purchase price (after deducting any commercial discounts and rebates), plus import duties and non-refundable taxes and any costs directly attributable to bringing the asset to the location and condition necessary for it to be capable of operating as intended by management.
Subsequent costs are recognised as an expense unless they improve the performance of the asset as originally specified, extend its useful life, or reduce the cost of operating the asset as previously established.
Following initial recognition as an asset, items of property, plant and equipment are carried at cost less accumulated depreciation and impairment. The Bouygues Construction group accounts for property, plant and equipment using the historical cost model.
Depreciation is calculated over the expected useful life of the asset. The useful life of an asset is the period over which the Group expects the asset to be available for use.
The depreciable amount of an asset is cost less any estimated residual value net of costs of disposal. The residual value of an item of property, plant and equipment is the amount the Group would receive currently for the asset if the asset were already of the age and in the condition expected at the end of its useful life (excluding the effects of inflation).
Bouygues Construction | 2016 Financial Report
26/27

The principal useful lives applied are:• buildings: 10, 20 or 30 years, depending on whether the building is of lightweight or durable construction;• plant, equipment and tooling: 3 to 8 years;• other property, plant and equipment: 3 to 10 years, depending on the type of asset (vehicles, office equipment and furniture, etc.).
Depreciation periods are reviewed annually, and may be adjusted if expectations differ from previous estimates. Any such changes in estimates are accounted for prospectively.
Finance leasesA finance lease is a contract under which substantially all the risks and rewards of ownership are transferred to the lessee, whether or not title is ultimately transferred to the lessee.
Assets acquired under finance leases are, if material, recognised as an asset in the balance sheet under “Property, plant and equipment”, with a matching liability recognised under “Debt” on the liabilities side of the balance sheet.These assets are depreciated over their expected useful lives.
Site rehabilitation costsRehabilitation costs arising from the gradual deterioration of a site are covered by provisions recognised on the liabilities side of the balance sheet.
Investment propertiesThe Bouygues Construction group has not identified any asset that qualifies as an investment property.
Intangible assetsIAS 38 defines an intangible asset as an identifiable non-monetary asset without physical substance which is controlled by the entity. An asset is identifiable:• if it is separable, i.e. capable of being independently sold, transferred, licensed, rented or exchanged;• or if it is derived from contractual or other legal rights, whether separable or not.
Intangible assets with finite useful lives are depreciable. Intangible assets with indefinite useful lives are not depreciable, but are tested for impairment annually.
Development expensesDevelopment expenses are capitalised if the IAS 38 criteria are met, i.e. if they are expected to generate future economic benefits and their cost can be reliably measured.
Incorporation and research expenses are expensed as incurred.
Intangible assets with no legal protection Acquired intangible assets with no legal protection are included in goodwill.
Business combinationsWith effect from 1 January 2010, business combinations have been accounted for in accordance with the revised IFRS 3 and IAS 27, which use the concept of “obtaining control” in determining the accounting treatment to be applied to acquisitions or disposals of equity interests; depending on the circumstances, the impacts of such acquisitions and disposals are recognised either in consolidated profit or loss or in equity.
In a business combination, the fair value of the consideration transferred is allocated to the identifiable assets and liabilities of the acquiree, which are measured at fair value at the acquisition date and presented in the balance sheet using the full fair value method in accordance with the revised IFRS 3. This method involves remeasuring the assets and liabilities acquired at fair value in full (including non-controlling interests), rather than remeasuring just the percentage interest acquired.
The revised IFRS 3 allows entities to elect one of two methods of accounting for non-controlling interests in each business combination:• at fair value (full goodwill method), i.e. the non-controlling interests are allocated their share of goodwill;• at the non-controlling interests’ proportionate share of the acquired entity’s identifiable assets and liabilities (partial goodwill method),
i.e. no share of goodwill is allocated to the non-controlling interests.
Goodwill recognised prior to 1 January 2004 continues to be measured using the partial fair value method. This method involves restricting the fair value remeasurement of identifiable items to the percentage interest acquired. Non-controlling interests in these items are measured on the basis of the carrying amount of the items as shown in the balance sheet of the acquired entity. The revised standards allow the acquirer to elect to account for each new business combination on either a full goodwill basis or a partial goodwill basis.
26/27
Management report Consolidated financial statements Notes to the consolidated financial statements Statutory auditors’ report Parent company financial statements
Fair value is the price that would be received for an asset or paid to settle a liability in an arm’s length transaction between market participants at the date of measurement.
Goodwill is the excess of the acquisition cost over the acquirer’s interest in the fair value of the acquiree’s identifiable assets, liabilities and contingent liabilities that can be reliably measured at the acquisition date.
It represents the payment made by the acquirer in anticipation of the future economic benefits arising from assets that cannot be individually identified and separately recognised, and is reported separately as an asset under “Goodwill” in the balance sheet.Negative goodwill (i.e. gain from a bargain purchase) is taken to the income statement in the period in which the acquisition is made.The purchase price allocation period is limited to the time required to identify and measure the acquired entity’s assets and liabilities, the non-controlling interests, the consideration transferred and the fair value of any previously held equity interest, subject to a maximum period of 12 months.
Subsequent to initial recognition, goodwill is measured at cost less accumulated impairment losses in accordance with IAS 36, and is tested for impairment annually. Impairment losses are charged to the income statement as an operating item.
Goodwill is allocated to the Cash Generating Unit (CGU) benefiting from the business combination or to the group of CGUs at the level of which return on investment is measured.
The value in use of CGUs is determined using the Discounted Cash Flow (DCF) method, applying the following principles:• the discount rate is determined by reference to the weighted average cost of capital;• the cash flows used are derived from the medium-term business plan prepared by the management of the CGU;• the terminal value is calculated by aggregating the DCF to infinity, based on normative cash flows and a perpetual growth
rate that is consistent with the growth potential of the markets in which the CGU operates and with its competitive position in those markets.
Bouygues Construction has identified two CGUs:
• A CGU comprising French and international Building and Civil Engineering activities:The business plan used was prepared within the context of the Group’s management cycle.The assumptions applied include no changes in the scope of the Group’s Building and Civil Engineering activities, and the continuation of those activities as a going concern over the three-year period covered by the business plan.The Bouygues Construction group has set a year by year profitability target for its Building and Civil Engineering activities.This target is incorporated into the assumptions used in the business plan, which also takes into account past experience and external sources of information.Discount rate applied: 7.06%/6.47%, depending on the assumptions used. Growth rate applied: 1%.There were no events or circumstances requiring the recognition of an impairment loss in 2016.
• A CGU comprising French and international Energy and Services activities:The business plan used was prepared within the context of the Group’s management cycle.The assumptions applied include no changes in the scope of the Group’s Energy and Services activities, and the continuation of those activities as a going concern over the three-year period covered by the business plan.The Bouygues Construction group has set a year by year profitability target for its Energy and Services activities. This target is incorporated into the assumptions used in the business plan, which also takes into account past experience and external sources of information.Discount rate applied: 5.55%/5.08%, depending on the assumptions used. Growth rate applied: 1%.There were no events or circumstances requiring the recognition of an impairment loss in 2016.
Financial assetsInvestments in non-consolidated companies and other long-term investment securities
Investments in non-consolidated companies and other long-term investment securities are classified as available-for-sale financial assets, and are recognised at fair value in the balance sheet.
Changes in fair value are recognised in equity except in the case of other-than-temporary impairment, in which case the impairment loss is recognised in profit or loss for the period. When an asset is derecognised, the change in fair value previously recognised in equity is reclassified to profit or loss.
Non-current loans receivableLoans, advances to non-consolidated companies, and deposits and caution money are measured at fair value on initial recognition, and subsequently at amortised cost.
Bouygues Construction | 2016 Financial Report
28/29

b. Current assets
InventoriesInventories are stated at the lower of cost (weighted average unit cost) or market price.Where the realisable value of inventory is lower than cost, an impairment loss is recognised.
Trade and other receivablesTrade receivables are essentially short-term, and are carried at face value net of impairment allowances recorded to reflect the probability of recovery.
In line with the percentage of completion method of accounting for long-term contracts, trade receivables include:• statements issued as works are executed or services provided, and accepted by the project owner;• unbilled receivables, arising where works are entitled to acceptance but billing or acceptance by the project owner has been temporarily
delayed.
Cash and cash equivalentsCash equivalents (short-term investments) are measured at fair value and classified as available-for-sale financial assets.
Cash, short-term deposits and bank overdrafts:Because of the short-term nature of these items, the carrying amounts shown in the consolidated financial statements are a reasonable estimate of market value.
2.2.2. Liabilities and shareholders’ equity
a. Non-current liabilities
Non-current provisionsA provision is recorded where the Group has a present obligation to a third party at the end of the reporting period resulting from a past event, the settlement of which is expected to result in a probable outflow from the Group of resources embodying economic benefits that can be measured reliably.
These mainly comprise:
Employee benefits
Provisions for lump-sum retirement benefit obligations:The Group records a provision for its obligations to pay lump-sum benefits to its employees on retirement, to the extent that those obligations are not covered by insurance policies.This provision is calculated using the projected unit credit method based on final salary, projected to the retirement date.
The amount of the provision is determined on the basis of the relevant collective agreement, and taking account of the following factors:• classification of employees into groups with common characteristics in terms of status, age and length of service;• monthly salary, uplifted by a coefficient to reflect the applicable percentage of employer’s social security charges;• final salary inflation rate;• discount rate applied to the obligation over the projected period to the retirement date; • employee turnover rate, determined by age bracket and socio-professional category;• life expectancy, determined using the INSEE 2006-2008 mortality table.
In accordance with the revised IAS 19, all actuarial gains and losses on defined-benefit post-employment benefit plans are recognised in non-current provisions, with the matching entry recognised in equity via the statement of recognised income and expense.
Provision for long-service awards:The Group records a provision for its obligations in respect of long-service awards (10, 20, 30 and 40 years) using the projected unit credit method, projected over the period to the date of the award.
Provisions for litigation, claims and foreseeable risk exposures
Customer warranty provisionsThese provisions are intended to cover risks for which the company is liable during the warranty period (essentially the ten-year warranty in France).
28/29
Management report Consolidated financial statements Notes to the consolidated financial statements Statutory auditors’ report Parent company financial statements

The provision is determined by applying a statistical rate (determined annually by reference to warranty information specific to each entity) to sales.
b. Current liabilities
Trade and other payablesBecause of the short-term nature of these liabilities, the carrying amounts shown in the consolidated financial statements are a reasonable estimate of market value.
Advances and down-payments received on ordersThis item comprises advances and down-payments received from customers on construction contract starts.
Current provisionsThese mainly comprise:• provisions for project risks and project completion;• provisions for expected losses to completion. These relate to construction contracts in progress, and take account of claims accepted
by the client. They are measured on a contract by contract basis, with no netting between them.
2.2.3. Income statement
a. Consolidated salesConsolidated sales represent the aggregate amount of contract revenues, sales of products and sales of services, including sales generated by entities controlled by Bouygues Construction and by joint operations (after eliminating intercompany transactions).
Sales are broken down into construction contracts, sales of goods, and sales of services.
b. Accounting for construction contractsAll activities related to construction contracts are accounted for using the percentage of completion method.
Under this method, the revenue recognised equals the latest estimate of the total selling price of the contract multiplied by the actual completion rate determined by reference to the physical state of progress of the works. The latest estimate of the total selling price takes account of claims accepted by the client.
If it is regarded as probable that a contract will generate a loss on completion, a provision for expected losses on completion is recognised as a current provision in the balance sheet. The loss is provided for in full as soon as it can be reliably measured, irrespective of the completion rate.
c. Profits/losses from joint operationsThese represent the Group’s share of profits or losses from non-consolidated partnerships and non-consolidated joint ventures; as such, they are a component of operating profit and are reported on the lines “Other income from operations” and “Other expenses on operations”.
d. Operating profitOperating profit represents the net amount of all income and expenses not generated by financing activities, by associates or by discontinued or held-for-sale operations, and excluding income taxes.
Any impairment of goodwill is recognised as a charge against operating profit.
e. Income from net surplus cashIncome from net surplus cash comprises all gains, losses, income and expenses generated by components of net surplus cash during the period (see Note 9, “Change in net surplus cash”), including gains and losses on related interest rate and currency hedges.
f. Other financial income and expensesThis comprises financial income and expenses that are of a non-operating nature and do not relate to components of net surplus cash.
Bouygues Construction | 2016 Financial Report
30/31

2.2.4. Financial instrumentsSome Group entities use hedging instruments to limit the impact on the income statement of fluctuations in exchange rates and interest rates. The Group’s policy on the use of financial instruments is described below.
The only instruments used for hedging purposes are:• forward currency purchases and sales, currency swaps and currency options for currency risk hedging purposes;• interest rate swaps and purchases of caps and collars for interest rate risk hedging purposes.
These instruments:• are used solely for hedging purposes;• are contracted solely with high-grade French and foreign banks;• carry no liquidity risk in the event of reversal.
Specific reports are prepared on a regular basis for those responsible for the management and supervision of the relevant Group companies, describing the use of hedging instruments; the selection of counterparties with whom they are contracted; and more generally, the management of exposure to currency risk and interest rate risk.
a. Financial risks to which the Group is exposed, and principles applied to the management of those risks
Currency riskIn general, the Bouygues Construction group has little exposure to currency risk in routine commercial transactions. Where possible, expenses relating to a contract are incurred in the same currency as that in which the contract is billed. This applies to most construction projects executed outside France, on which local currency expenses (subcontracting and supplies) represent a much higher proportion than euro-denominated expenses. Particular attention is paid to risks relating to assets denominated in non-convertible currencies, and to country risk generally.
Group policy is to hedge systematically all residual exposure to currency risk on commercial transactions relative to the functional currency of a project or entity. If the future cash flow is certain, the currency risk is hedged by buying or selling currency forward, or by means of currency swaps. For some large contracts, options may be taken out for hedging purposes before the contract award has been confirmed.
Equity investments in foreign companies are usually hedged by a liability of a similar amount in the same currency in the books of the entity that holds the investment.
Interest rate riskInterest rate risk exposure arises on floating-rate debt recognised in the balance sheet, and is hedged by floating-rate investments.
The Group’s income statement could be adversely affected by a significant fall in European interest rates. Interest rate swaps may be contracted to lock in the income streams from the Group’s surplus cash.
b. Hedge accounting policies and rulesThe Group accounts for hedges in accordance with IAS 39.
Hedge accounting is applied where a derivative instrument wholly or partly offsets changes in the fair value or cash flows of a hedged item. Hedge effectiveness is assessed on a regular basis, and at least once a quarter.
To qualify for hedge accounting, financial instruments must meet the following conditions:• formal designation and documentation of the hedging relationship on inception of the hedge;• hedge effectiveness demonstrated throughout the life of the financial instrument.
If a hedging relationship cannot be demonstrated, all changes in fair value are recognised in profit or loss.
All derivative instruments are measured at fair value. Fair value is the quoted market price in the case of listed instruments, or is determined using calculation and valuation models based on market data (yield curves, exchange rates, etc.) in other cases.
No embedded derivatives within the meaning of IAS 39 have been identified within the Bouygues Construction Group.
30/31
Management report Consolidated financial statements Notes to the consolidated financial statements Statutory auditors’ report Parent company financial statements

Cash flow hedgesA cash flow hedge is a hedge of the exposure to variability in the future cash flows from a hedged item or a future transaction.
Where a derivative instrument is used to hedge the exposure to variability in the cash flows from a firm commitment or a forecast transaction, the change in the fair value of the portion of the hedging instrument that is determined to be an effective hedge is recognised directly in equity.
The change in fair value of the portion of the hedge regarded as ineffective is recognised immediately in profit or loss.
Fair value hedgesThe purpose of a fair value hedge is to limit the variability of the fair value of an asset or a liability recognised in the balance sheet.
Where a derivative instrument hedges exposure to changes in the fair value of a receivable or a payable, the change in the fair value of the hedging instrument is recognised immediately in profit or loss. The gain or loss on the hedged item attributable to the hedged risk is accounted for as an adjustment to the carrying amount of the hedged item, and is recognised directly in profit or loss.
The fair value of hedged items corresponds to their carrying amount translated into euros using the rate prevailing at the end of the reporting period.
Hedge of a net investment in a foreign operationA hedge of a net investment in a foreign operation is a hedge of the currency risk exposure on the parent company’s interest in the net assets of that operation.
Where a liability denominated in a foreign currency is used to hedge a net investment in a foreign operation, translation differences arising between that currency and the euro are recognised directly in equity. If the hedging instrument is a derivative instrument, the change in the fair value of the portion of the hedging instrument that is determined to be an effective hedge is recognised directly in equity; the change in fair value of the ineffective portion is recognised immediately in profit or loss.
2.2.5. Cash flow statementThe cash flow statement is presented in accordance with IAS 7 and with ANC recommendation 2013-03 of 7 November 2013 (indirect method).
The net profit of consolidated entities is adjusted to eliminate the impact of transactions with no cash effect, and of income and expenses related to investing or financing activities.
Cash flow as reported in the cash flow statement is defined as follows:Net profit from consolidated entities before net depreciation and amortisation expense, net changes in provisions and impairment losses, gains and losses on asset disposals, income from net surplus cash/cost of net debt (included in financing activities in the cash flow statement), and net income tax expense for the period.
The cash flow statement explains changes in the Group’s net cash position, which is defined as the net total of the following balance sheet items:• cash and cash equivalents;• overdrafts and short-term bank borrowings.
No cash or cash equivalents were unavailable as of 31 December 2016.
2.2.6. Off balance sheet commitmentsA summary of off balance sheet commitments is provided in Note 18.
2.2.7. EBITDAEBITDA equals “Current operating profit” after stripping out “Net depreciation and amortisation expense”, “Net charges to provisions and impairment losses”, and reversals of unused provisions and impairment losses reported in “Other income from operations”.
The competitiveness and employment tax credit (“CICE”) to which French companies are entitled is recognised in current operating profit, as a reduction in personnel costs.
Bouygues Construction | 2016 Financial Report
32/33

2.2.8. Free cash flowFree cash flow equals cash flow after income from net surplus cash (or cost of net debt) and income tax expense, less net capital expenditure for the period.
Net capital expenditure equals the purchase price of property, plant and equipment and intangible assets acquired during the period, net of proceeds from disposals and investment grants obtained.
2.2.9. Net surplus cashNet surplus cash is the sum total of the following items:• cash and cash equivalents;• overdrafts and short-term bank borrowings;• non-current and current debt;• financial instruments (used to hedge financial liabilities measured at fair value).
2.3. Other information
Comparability of the financial statements:The impact of changes in the scope of consolidation between 1 January and 31 December 2016 does not impair the comparability of the consolidated financial statements as presented.
Under the revised IAS 1, “Presentation of Financial Statements”, the Group has elected to present the components of comprehensive income in two detailed statements, as permitted by the IASB:• an income statement;• a statement of recognised income and expense that reports other comprehensive income, including income and expenses recognised
directly in equity.
Bouygues Construction is included in the scope of consolidation of Bouygues SA for the purposes of the presentation of the Bouygues SA consolidated financial statements.
Note 3. Non-current assets
For a breakdown of non-current assets by business segment see Note 16, “Segment Information”.
Acquisitions of non-current assets during the year, net of disposals 31/12/2016 31/12/2015
Acquisitions of property, plant and equipment (1) 207 244
Acquisitions of intangible assets (1) 10 8
Capital expenditure 217 252
Acquisitions of non-current financial assets(investments in consolidated and non-consolidated companies, other long-term investments) 6 16
Acquisitions of non-current assets 223 268
Disposals of non-current assets (189) (99)
Acquisitions of non-current assets, net of disposals 34 169
(1) Net of investment grants obtained (netted off the asset in the balance sheet).
32/33
Management report Consolidated financial statements Notes to the consolidated financial statements Statutory auditors’ report Parent company financial statements
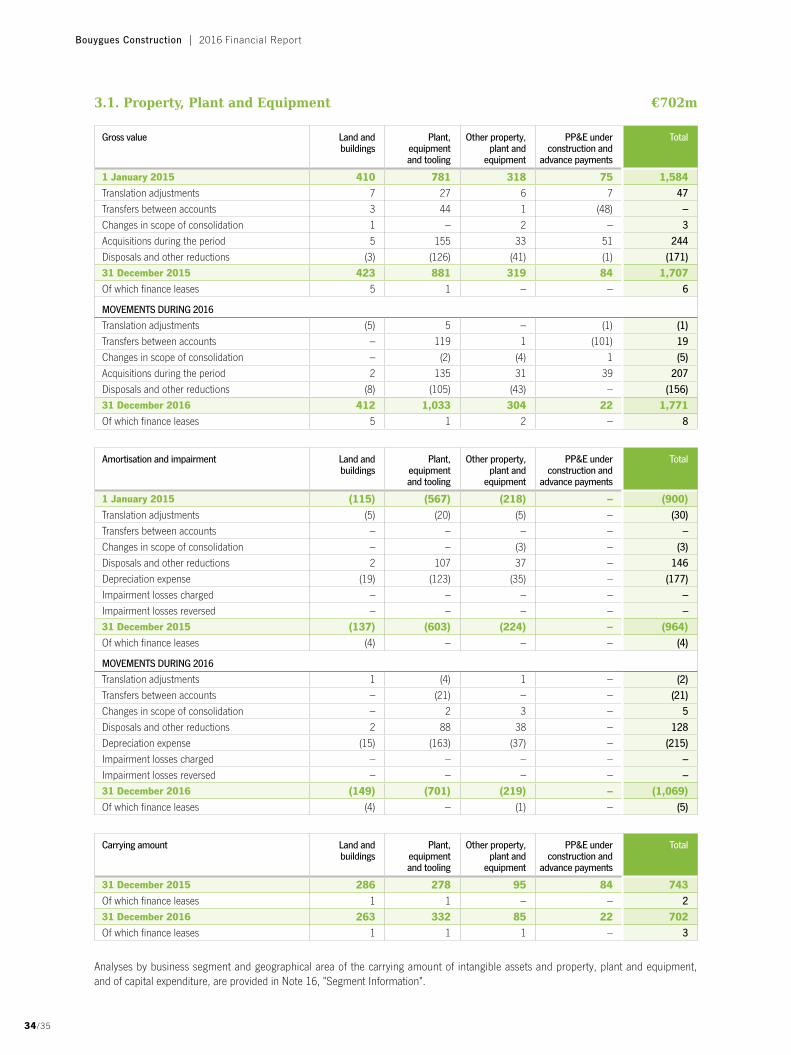
3.1. Property, Plant and Equipment €702m
Gross value Land and buildings
Plant, equipment and tooling
Other property, plant and
equipment
PP&E under construction and
advance payments
Total
1 January 2015 410 781 318 75 1,584
Translation adjustments 7 27 6 7 47
Transfers between accounts 3 44 1 (48) –
Changes in scope of consolidation 1 – 2 – 3
Acquisitions during the period 5 155 33 51 244
Disposals and other reductions (3) (126) (41) (1) (171)
31 December 2015 423 881 319 84 1,707
Of which finance leases 5 1 – – 6
MOVEMENTS DURING 2016
Translation adjustments (5) 5 – (1) (1)
Transfers between accounts – 119 1 (101) 19
Changes in scope of consolidation – (2) (4) 1 (5)
Acquisitions during the period 2 135 31 39 207
Disposals and other reductions (8) (105) (43) – (156)
31 December 2016 412 1,033 304 22 1,771
Of which finance leases 5 1 2 – 8
Amortisation and impairment Land and buildings
Plant, equipment and tooling
Other property, plant and
equipment
PP&E under construction and
advance payments
Total
1 January 2015 (115) (567) (218) – (900)
Translation adjustments (5) (20) (5) – (30)
Transfers between accounts – – – – –
Changes in scope of consolidation – – (3) – (3)
Disposals and other reductions 2 107 37 – 146
Depreciation expense (19) (123) (35) – (177)
Impairment losses charged – – – – –
Impairment losses reversed – – – – –
31 December 2015 (137) (603) (224) – (964)
Of which finance leases (4) – – – (4)
MOVEMENTS DURING 2016
Translation adjustments 1 (4) 1 – (2)
Transfers between accounts – (21) – – (21)
Changes in scope of consolidation – 2 3 – 5
Disposals and other reductions 2 88 38 – 128
Depreciation expense (15) (163) (37) – (215)
Impairment losses charged – – – – –
Impairment losses reversed – – – – –
31 December 2016 (149) (701) (219) – (1,069)
Of which finance leases (4) – (1) – (5)
Carrying amount Land and buildings
Plant, equipment and tooling
Other property, plant and
equipment
PP&E under construction and
advance payments
Total
31 December 2015 286 278 95 84 743
Of which finance leases 1 1 – – 2
31 December 2016 263 332 85 22 702
Of which finance leases 1 1 1 – 3
Analyses by business segment and geographical area of the carrying amount of intangible assets and property, plant and equipment, and of capital expenditure, are provided in Note 16, "Segment Information".
Bouygues Construction | 2016 Financial Report
34/35

3.2. Intangible assets €48m
Gross value Development expenses
Concessions, patents and
similar rights
Other intangible
assets
Total
1 January 2015 – 126 27 153
Translation adjustments – 1 – 1
Transfers between accounts – – – –
Changes in scope of consolidation – – – –
Acquisitions during the period – 7 1 8
Disposals and other reductions – (5) – (5)
31 December 2015 – 129 28 157
MOVEMENTS DURING 2016
Translation adjustments – (1) (2) (3)
Transfers between accounts – 2 (2) –
Changes in scope of consolidation – – 5 5
Acquisitions during the period – 7 3 10
Disposals and other reductions – (3) – (3)
31 December 2016 – 134 32 166
Amortisation and impairment Development expenses
Concessions, patents and
similar rights
Other intangible
assets
Total
1 January 2015 – (93) (9) (102)
Translation adjustments – (1) – (1)
Transfers between accounts – – – –
Changes in scope of consolidation – – – –
Disposals and other reductions – 5 – 5
Amortisation expense – (11) (2) (13)
Impairment losses charged – – – –
Impairment losses reversed – – – –
31 December 2015 – (100) (11) (111)
MOVEMENTS DURING 2016
Translation adjustments – 2 – 2
Transfers between accounts – – – –
Changes in scope of consolidation – – – –
Disposals and other reductions – 3 – 3
Amortisation expense – (11) (1) (12)
Impairment losses charged – – – –
Impairment losses reversed – – – –
31 December 2016 – (106) (12) (118)
Carrying amount Development expenses
Concessions, patents and
similar rights
Other intangible
assets
Total
31 December 2015 – 29 17 46
31 December 2016 – 28 20 48
34/35
Management report Consolidated financial statements Notes to the consolidated financial statements Statutory auditors’ report Parent company financial statements

3.3. Goodwill €540m
Gross value Impairment Carrying amount
Building & Civil Engineering
Energy & Services
1 January 2015 528 – 528 239 289
Changes in scope of consolidation, translation adjustments & other movements 29 – 29 12 17
Impairment losses – – – – –
31 December 2015 557 – 557 251 306
Changes in scope of consolidation, translation adjustments & other movements (17) – (17) (16) (1)
Impairment losses – – – – –
31 December 2016 540 – 540 235 305
3.4. Non-current financial assets €274m
Investments in joint ventures
and associates
Other non-current financial assets Total gross value
Amortisation and impairment
Carrying amount
Investments in non-consolidated
companies
Other non-current
assets
1 January 2015 75 147 223 445 (131) 314
Translation adjustments 1 7 6 14 0 14
Transfers between accounts 10 (24) (11) (25) (3) (28)
Changes in scope of consolidation (14) 38 – 24 38 62
Acquisitions and other increases 10 3 39 52 – 52
Disposals and other reductions (13) (12) (51) (76) – (76)
Amortisation and impairment, net – – – – (61) (61)
31 December 2015 69 159 206 434 (157) 277
Translation adjustments 1 2 – 3 – 3
Transfers between accounts (1) 22 11 32 1 33
Changes in scope of consolidation – 7 (1) 6 (4) 2
Acquisitions and other increases 7 2 19 28 – 28
Disposals and other reductions (12) (26) (35) (73) – (73)
Amortisation and impairment, net – – – – 4 4
31 December 2016 64 166 200 430 (156) 274
Bouygues Construction | 2016 Financial Report
36/37

3.4.1. Investments in joint ventures and associates €21m
Share of net assets
hold
Goodwill on joint ventures and
associates
Carrying amount
1 January 2015 75 – 75
Translation adjustments 1 – 1
Transfers between accounts 10 – 10
Changes in scope of consolidation (14) – (14)
Acquisitions and other increases 10 – 10
Disposals and other reductions (13) – (13)
Impairment losses (43) – (43)
31 December 2015 26 – 26
Translation adjustments 1 – 1
Transfers between accounts (1) – (1)
Changes in scope of consolidation – – –
Acquisitions and other increases 7 – 7
Disposals and other reductions (12) – (12)
Impairment losses – – –
31 December 2016 21 – 21
The Bouygues Construction group owns a number of investments in joint ventures and associates, a list of which is provided in Note 24, "List of principal consolidated entities".
Summary information about the assets, liabilities, income and expenses of the Bouygues Construction group's principal joint ventures and associates is provided below.
Figures are for 100% of the joint venture/associate 31/12/2016 31/12/2015
Stade de France Stade de France Adelac
Non-current assets (1) 202 197 813
Current assets 70 53 38
Total assets 272 250 851
Shareholders’ equity 40 43 (65)
Non-current liabilities 155 148 854
Current liabilities 77 59 62
Total liabilities & shareholders' equity 272 250 851
Sales 56 56 47
Operating profit/(loss) (5) (1) 26
Net profit/(loss) (3) – (12)
(1) Net of investment grants obtained.
Movements during the period 01/01/2016 Net movements during 2016 (1)
31/12/2016
Stade de France 11 – 11
Adelac – – –
Zaic 2 2 4
Warnowquerung – – –
Bina (Fincom and Istra) – – –
TransJamaican 1 – 1
Socoprim – – –
VSL Corée 6 (6) –
VSL Japon 2 – 2
VSL Chili 2 – 2
Other 2 (1) 1
Total 26 (5) 21
(1) Includes the Group's share of net profit/loss for the period, acquisitions, changes in scope of consolidation, translation adjustments, dividends paid, capital increases, and changes in the fair value of financial instruments.Accumulated unrecognised losses on joint ventures and associates: €(20) million.
36/37
Management report Consolidated financial statements Notes to the consolidated financial statements Statutory auditors’ report Parent company financial statements

3.4.2. Investments in non-consolidated companies €90m
Investments in non-consolidated companies (1)
31/12/2016 Total assets (2)
Total current &
non-current liabilities (2)
Total sales (2)
Net profit/ (loss) (2)
Gross value Impairment Carrying amount
% interest
FRENCH COMPANIES
Foncière Point du Jour 10 (8) 2 100% 2 – – –
Fichallenge 2 (1) 1 100% 1 6 – –
Other investments in French companies 19 (3) 16
Sub-total 31 (12) 19
FOREIGN COMPANIES
Hong Kong IEC Limited 67 – 67 15% 134 31 53 (9)
VSL Corporation (United States) 22 (22) – 100% – – – –
C.C.I.B (Romania) 6 (6) – 22% 29 58 7 (1)
Frog Electr. Cont (South Africa) 5 (5) – 100% – – – –
Equiby Limited (Jersey) 5 (5) – 68% 10 – – –
Vorspanntechnik (Germany) 2 (2) – 100% – – – –
Other investments in foreign companies 28 (24) 4
Sub-total 135 (64) 71
Total 166 (76) 90
Investments in non-consolidated companies (1)
31/12/2015 Total assets (2)
Total current &
non-current liabilities (2)
Total sales (2)
Net profit/ (loss) (2)
Gross value Impairment Carrying amount
% interest
FRENCH COMPANIES
Foncière Point du Jour 10 (8) 2 100% 2 – – –
Fichallenge 2 (1) 1 100% 1 5 – 2
Other investments in French companies 18 (3) 15
Sub-total 30 (12) 18
FOREIGN COMPANIES
Hong Kong IEC Limited 65 – 65 15% 140 31 48 (13)
VSL Corporation (United States) 22 (22) – 100% – – – –
C.C.I.B (Romania) 6 (6) – 22% 29 57 8 (1)
Frog Electr. Cont (South Africa) 5 (5) – 100% – – – –
Equiby Limited (Jersey) 5 (5) – 68% 10 – – –
Vorspanntechnik (Germany) 2 (2) – 100% – – – –
VSL Offshore (Singapore) 2 (1) 1 100% 1 1 2 –
Other investments in foreign companies 22 (17) 5
Sub-total 129 (58) 71
Total 159 (70) 89
(1) Not consolidated because: • the Group does not exercise control or significant influence over the entity; • the potential contribution of the entity to the consolidated financial statements is immaterial.(2) Based on available annual information.
Bouygues Construction | 2016 Financial Report
38/39

3.4.3. Other non-current assets €163mThe main items included in this heading are:• Advances to non-consolidated companies 67• Non-current loans and receivables 64• Other long-term investments: 32
comprising: • Deposits and caution money 26 • Other long-term investment securities 6
3.4.4. Analysis of investments in non-consolidated companies and other non-current assets by type €253mThe figures below do not include joint ventures or associates.
Available-for-sale financial assets
Loans and receivables
Financial assets at fair value through
profit or loss
Held-to-maturity financial assets
Total
31 December 2015 96 155 – – 251
Movements during 2016 – 2 – – 2
31 December 2016 96 157 – – 253
Due within less than 1 year – 17 – – 17
Due within 1 to 5 years – 64 – – 64
Due after more than 5 years 96 76 – – 172
3.4.5. Joint operationsThe Bouygues Construction group owns a number of investments in joint operations. A list of the principal consolidated entities as of 31 December 2016 is provided in Note 24.
Summary information about the assets, liabilities, income and expenses of joint operations is provided below.
Bouygues Construction share 31/12/2016 31/12/2015
Non-current assets 153 112
Current assets 988 902
Total assets 1,141 1,014
Shareholders’ equity (160) (203)
Non-current liabilities 38 35
Current liabilities 1,263 1,182
Total liabilities & shareholders' equity 1,141 1,014
Sales 1,500 1,426
Operating profit/(loss) 119 (62)
Net profit/(loss) 114 (65)
3.5. Non-current tax assets €103m
31/12/2016 31/12/2015
Deferred tax assets(1) 103 116
Other non-current tax assets – –
Total non-current tax assets(1) 103 116
(1) See Note 7, “Non-current tax assets and liabilities”, for details.
38/39
Management report Consolidated financial statements Notes to the consolidated financial statements Statutory auditors’ report Parent company financial statements

Note 4. Current assets
4.1. Inventories €262m
Inventories 31/12/2016 31/12/2015
Gross value Impairment Carrying amount
Gross value Impairment Carrying amount
Raw materials and supplies, finished goods and property development inventories 287 (25) 262 360 (15) 345
Total 287 (25) 262 360 (15) 345
Impairment of inventories Charged during the year Reversed during the year
2016 2015 2016 2015
Raw materials and supplies, finished goods and property development inventories (14) (4) 4 2
Total (14) (4) 4 2
4.2. Advances and down-payments made on orders €168m
31/12/2016 31/12/2015
Gross value Impairment Carrying amount
Gross value Impairment Carrying amount
Advances and down-payments made on orders 168 – 168 184 – 184
Total 168 – 168 184 – 184
4.3. Trade and other receivables €3,949m
31/12/2016 31/12/2015
Gross value Impairment Carrying amount
Gross value Impairment Carrying amount
Trade receivables (including unbilled receivables) 3,173 (218) 2,955 2,926 (222) 2,704
Current tax assets (tax receivable) 84 – 84 67 – 67
Other current receivables & prepaid expenses:
Other operating receivables (employees, social security, government and other) 360 (7) 353 369 (5) 364
Sundry receivables (including current accounts) 512 (44) 468 494 (41) 453
Prepaid expenses 89 – 89 109 – 109
Total trade and other receivables 4,218 (269) 3,949 3,965 (268) 3,697
4.4. Split of trade receivables between non past due and past due as of 31 December 2016 (ageing of trade receivables)
Non past due balances
Balances past due by Total
0-6 months 6-12 months > 12 months
Trade receivables 2,398 374 88 313 3,173
Impairment (4) (4) (3) (207) (218)
Total trade receivables 2,394 370 85 106 2,955
Comparative at 31 December 2015 2,120 401 79 104 2,704
4.5. Other current financial asset €13m
See Note 17, “Financial instruments”.
Bouygues Construction | 2016 Financial Report
40/41

4.6. Cash and cash equivalents €4,427m
31/12/2016 31/12/2015
Gross value Impairment Carrying amount
Gross value Impairment Carrying amount
Bouygues Relais 2,127 – 2,127 2,298 – 2,298
Uniservice 1,410 – 1,410 1,234 – 1,234
Other cash 889 – 889 849 – 849
Cash equivalents 1 – 1 11 – 11
Total 4,427 – 4,427 4,392 – 4,392
Split by currency 2016
Euro Poundsterling
Swiss franc
Hong Kong dollar
Singapore dollar
Canadian dollar
Australian dollar
US dollar
CFA franc
Qatari riyal
Other Total
Cash 2,517 342 547 432 82 81 26 213 14 31 141 4,426
Cash equivalents – – – 1 – – – – – – – 1
Total 2,517 342 547 433 82 81 26 213 14 31 141 4,427
Split by currency 2015
Euro Poundsterling
Swiss franc
Hong Kong dollar
Singapore dollar
Canadian dollar
Australian dollar
US dollar
CFA franc
Qatari riyal
Other Total
Cash 2,728 267 456 336 100 49 51 220 20 47 107 4,381
Cash equivalents 11 – – – – – – – – – – 11
Total 2,739 267 456 336 100 49 51 220 20 47 107 4,392
Cash equivalents have a maturity of less than 3 months, or are readily convertible into cash.The net cash position shown in the cash flow statement comprises the following items:
31/12/2016 31/12/2015
Cash 4,426 4,381
Cash equivalents 1 11
Total 4,427 4,392
Overdrafts and short-term bank borrowings (475) (538)
Net cash position 3,952 3,854
40/41
Management report Consolidated financial statements Notes to the consolidated financial statements Statutory auditors’ report Parent company financial statements

Note 5. Shareholders’ equity
5.1. Share capital €127,967,250
As of 31 December 2016, the share capital amounted to €127,967,250, comprising 1,706,230 shares with a par value of €75.Movements during the period were as follows:
01/01/2016 Movements during 2016 31/12/2016
Reduction Increases
Shares 1,706,230 – – 1,706,230
Investment certificates – – – –
Number of shares 1,706,230 – – 1,706,230
Par value €75 – – €75
Share capital (€) 127,967,250 – – 127,967,250
5.2. Items recognised directly in equity
5.2.1. Translation reserve €95mThe translation reserve represents translation differences arising since 1 January 2004, when the reserve was deemed to be zero under the option allowed by IFRS 1.
The translation reserve includes the cumulative translation differences of joint ventures and associates.
The table below shows the principal translation differences in the year ended 31 December 2016 arising on foreign companies reporting in:
Currency 31/12/2015 Movements during 2016 31/12/2016
Pound sterling (2) 12 10
Swiss franc 5 3 8
US dollar (8) 1 (7)
Hong Kong dollar 5 3 8
Singapore dollar 1 – 1
Australian dollar 2 – 2
South African rand 103 (29) 74
Other currencies 1 (2) (1)
Total 107 (12) 95
5.2.2. Fair value remeasurement reserve €(12)mThe fair value remeasurement reserve is used to record changes in fair value that will be reclassified to profit or loss at a future date. It includes fair value remeasurements of (i) financial instruments used as cash flow hedges and (ii) available-for-sale financial assets.
31/12/2015 Movements during 2016 31/12/2016
Fair value remeasurement reserve (45) 33 (12)
Total (45) 33 (12)
5.2.3. Other reserves €(43)m
31/12/2015 Movements during 2016 31/12/2016
Revaluation reserve 4 – 4
Actuarial gains/(losses) (37) (10) (47)
Total (33) (10) (43)
Bouygues Construction | 2016 Financial Report
42/43

Note 6. Non-current and current provisions
6.1. Non-current provisions €853m
Employee benefits
Litigation and claims
Customer warranties
Risks on subsidiaries
and affiliates
Miscellaneous foreign risks
Other non-current
provisions
Total
1 January 2015 199 169 292 35 80 87 862
Translation adjustments 1 – 3 – – 3 7
Transfers between accounts – (1) – 3 (1) 2 3
Changes in method and in scope of consolidation, other movements – (1) – (1) – – (2)
Recognised directly in equity 5 – – – – – 5
Charges to provisions 6 50 78 1 3 60 198
Reversals (provisions used) (9) (12) (51) – (52) (4) (128)
Reversals (provisions not used) (4) (32) (24) (6) (24) (27) (117)
31 December 2015 198 173 298 32 6 121 828
MOVEMENTS DURING 2016
Translation adjustments – – (3) – – – (3)
Transfers between accounts – (1) – – – (1) (2)
Changes in method and in scope of consolidation, other movements – – – (18) – (2) (20)
Recognised directly in equity 9 – – – – – 9
Charges to provisions 14 49 78 2 29 33 205
Reversals (provisions used) (16) (14) (49) (2) (2) (8) (91)
Reversals (provisions not used) (1) (37) (23) (1) (1) (10) (73)
31 December 2016 204 170 301 13 32 133 853
6.2. Current provisions €588m
Risks on completed
projects
Project completion
expenses
Expected losses to completion
Other current provisions
Total
1 January 2015 65 247 196 91 599
Translation adjustments 4 16 (7) (3) 10
Transfers between accounts 5 (4) – – 1
Changes in method and in scope of consolidation, other movements – (1) 4 – 3
Charges to provisions 27 106 137 35 305
Reversals (provisions used) (14) (68) (70) (17) (169)
Reversals (provisions not used) (14) (58) (15) (7) (94)
31 December 2015 73 238 245 99 655
MOVEMENTS DURING 2016
Translation adjustments – 2 – 2 4
Transfers between accounts 1 – – 3 4
Changes in method and in scope of consolidation, other movements – – – – –
Charges to provisions 16 90 114 36 256
Reversals (provisions used) (5) (76) (97) (29) (207)
Reversals (provisions not used) (21) (32) (66) (5) (124)
31 December 2016 64 222 196 106 588
42/43
Management report Consolidated financial statements Notes to the consolidated financial statements Statutory auditors’ report Parent company financial statements

Note 7. Non-current tax assets and liabilities Assets €103m Liabilities €24m
7.1. Non-current tax assets
Movement in deferred tax assets in the consolidated balance sheet 31/12/2015 Movements during 2016 31/12/2016
Net gain/(expense)
Other movements
Deferred tax assets 116 (9) (4) 103
7.2. Deferred tax assets by business segment
Type of deferred taxation by business segment
Deferred tax assets
31/12/2015
Changes in scope of
consolidation
Translationadjustments
Movements during 2016 Other Deferred tax assets
31/12/2016Gain Expense
(A) TAX LOSSES AVAILABLE FOR CARRY-FORWARD
Building & Civil Engineering 7 – – – (1) – 6
Energy & Services 3 – – 2 – – 5
Sub-total: tax losses 10 – – 2 (1) – 11
(B) TEMPORARY DIFFERENCES (1)
Building & Civil Engineering 95 – – 1 (13) (2) 81
Energy & Services 11 – – 2 – (2) 11
Sub-total: temporary differences 106 – – 3 (13) (4) 92
Total deferred tax assets 116 – – 5 (14) (4) 103
7.3. Non-current tax liabilities
Movement in deferred tax liabilitiesin the consolidated balance sheet
31/12/2015 Movements during 2016 31/12/2016
Net (gain)/expense
Other movements
Deferred tax liabilities 28 (5) 1 24
7.4. Deferred tax liabilities by business segment
Type of deferred taxation by business segment
Deferred tax liabilities
31/12/2015
Changes in scope of
consolidation
Translationadjustments
Movements during 2016 Other Deferred taxliabilities
31/12/2016Gain Expense
TEMPORARY DIFFERENCES (1)
Building & Civil Engineering 27 1 – (6) 1 – 23
Energy & Services 1 – – – – – 1
Sub-total: temporary differences 28 1 – (6) 1 – 24
Total deferred tax liabilities 28 1 – (6) 1 – 24
(1) Arising on differences between tax and accounting treatments, and on consolidation adjustments.
Bouygues Construction | 2016 Financial Report
44/45

7.5. Main sources of deferred taxation
31/12/2016 31/12/2015
Deferred tax assets 103 116
Employee benefits 38 45
Customer warranties 14 14
Expected losses to completion 35 45
Provisions for customer disputes and bad debts 4 4
Tax losses available for carry-forward 11 10
Other sources of deferred tax assets 1 (2)
Deferred tax liabilities 24 28
Total 79 88
7.6. Period to recovery of deferred tax assets
31 December 2016 Less than 2 years 2 to 5 years More than 5 years Total
Deferred tax assets 71 12 20 103
7.7. Unrecognised deferred tax assets
31/12/2016 31/12/2015
Bouygues Group tax election 94 78
Other assets 144 144
Total 238 222
44/45
Management report Consolidated financial statements Notes to the consolidated financial statements Statutory auditors’ report Parent company financial statements
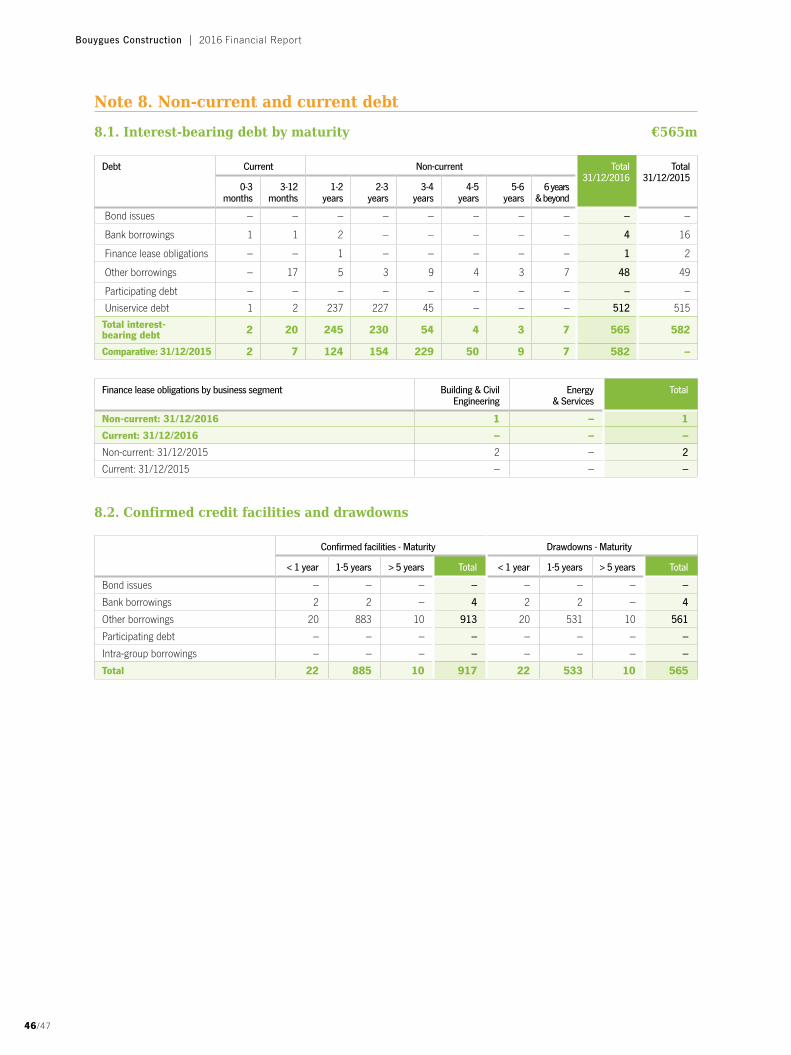
Note 8. Non-current and current debt
8.1. Interest-bearing debt by maturity €565m
Debt Current Non-current Total 31/12/2016
Total 31/12/2015
0-3 months
3-12 months
1-2 years
2-3 years
3-4 years
4-5 years
5-6 years
6 years& beyond
Bond issues – – – – – – – – – –
Bank borrowings 1 1 2 – – – – – 4 16
Finance lease obligations – – 1 – – – – – 1 2
Other borrowings – 17 5 3 9 4 3 7 48 49
Participating debt – – – – – – – – – –
Uniservice debt 1 2 237 227 45 – – – 512 515
Total interest- bearing debt 2 20 245 230 54 4 3 7 565 582
Comparative: 31/12/2015 2 7 124 154 229 50 9 7 582 –
Finance lease obligations by business segment Building & Civil Engineering
Energy & Services
Total
Non-current: 31/12/2016 1 – 1
Current: 31/12/2016 – – –
Non-current: 31/12/2015 2 – 2
Current: 31/12/2015 – – –
8.2. Confirmed credit facilities and drawdowns
Confirmed facilities - Maturity Drawdowns - Maturity
< 1 year 1-5 years > 5 years Total < 1 year 1-5 years > 5 years Total
Bond issues – – – – – – – –
Bank borrowings 2 2 – 4 2 2 – 4
Other borrowings 20 883 10 913 20 531 10 561
Participating debt – – – – – – – –
Intra-group borrowings – – – – – – – –
Total 22 885 10 917 22 533 10 565
Bouygues Construction | 2016 Financial Report
46/47

8.3. Liquidity at 31 December 2016
As of 31 December 2016, the net cash position was €3,952 million, plus €352 million of undrawn confirmed credit facilities as of that date.
See Note 4.6 for more details about cash and cash equivalents.
(1) Non-current debt (€543 million) and current debt (€22 million).
Consequently, the Bouygues Construction group is not exposed to liquidity risk.
The bank loans contracted by the Bouygues Construction group contain no financial covenants or trigger event clauses.
8.4. Split of current and non-current debt by interest rate type
Split of current and non-current debt, including the effect of all open interest rate hedges at the end of the reporting period:
31/12/2016 31/12/2015
Fixed rate (1) 1% 1%
Floating rate 99% 99%
(1) Rates fixed for more than one year.
8.5. Split of debt by currency
Euro Poundsterling
Swiss franc
US dollar
Czech koruna
Polish zloty
Hong Kong dollar
Canadian dollar
Other Total
Non-current 31/12/2016 – 126 169 75 26 31 18 98 – 543
Current 31/12/2016 – – – – – – 6 16 – 22
Non-current 31/12/2015 4 147 168 53 26 32 25 115 3 573
Current 31/12/2015 – – – – – – 6 – 3 9
An analysis of debt by business segment is provided in Note 16, “Segment information”.
5,000
4,500
4,000
3,500
3,000
2,500
2,000
1,500
1,000
500
0
Available cash Debt maturity schedule (1)
Undrawnconfirmed credit
facilities
Liquidity 2017 2018 2019 2020 2021 2022 2023 & beyond
Net cashposition
46/47
Management report Consolidated financial statements Notes to the consolidated financial statements Statutory auditors’ report Parent company financial statements

Note 9. Main components of change in net surplus cash €3,387m
9.1. Change in net surplus cash
31/12/2015 Cash flows Changes in scope of
consolidation
Translation adjustments
Other items
31/12/2016
Cash and cash equivalents 4,392 52 1 (18) – 4,427
Overdrafts and short-term bank borrowings (538) 46 16 1 – (475)
Net cash position 3,854 98 17 (17) – 3,952 (1)
Non-current debt (573) (7) – 12 25 (543)
Current debt (9) 13 – (1) (25) (22)
Financial instruments - hedging of debt – – – – – –
Debt (582) 6 (2) – 11 – (565)
Net surplus cash 3,272 104 17 (6) – 3,387
(1) Net cash position as analysed in the cash flow statement (net cash flows + non-monetary movements).(2) Net cash generated by/(used in) financing activities.
9.2. Principal movements in net surplus cash
Net surplus cash at 31 December 2015 3,272
Net cash generated by operating activities 607
Net cash generated by investing activities 1
Dividends paid (501)
Income from net surplus cash 14
Effect of changes in scope of consolidation on debt –
Effect of exchange rates on net cash position and debt (6)
Other movements –
Net surplus cash at 31 December 2016 3,387
Bouygues Construction | 2016 Financial Report
48/49
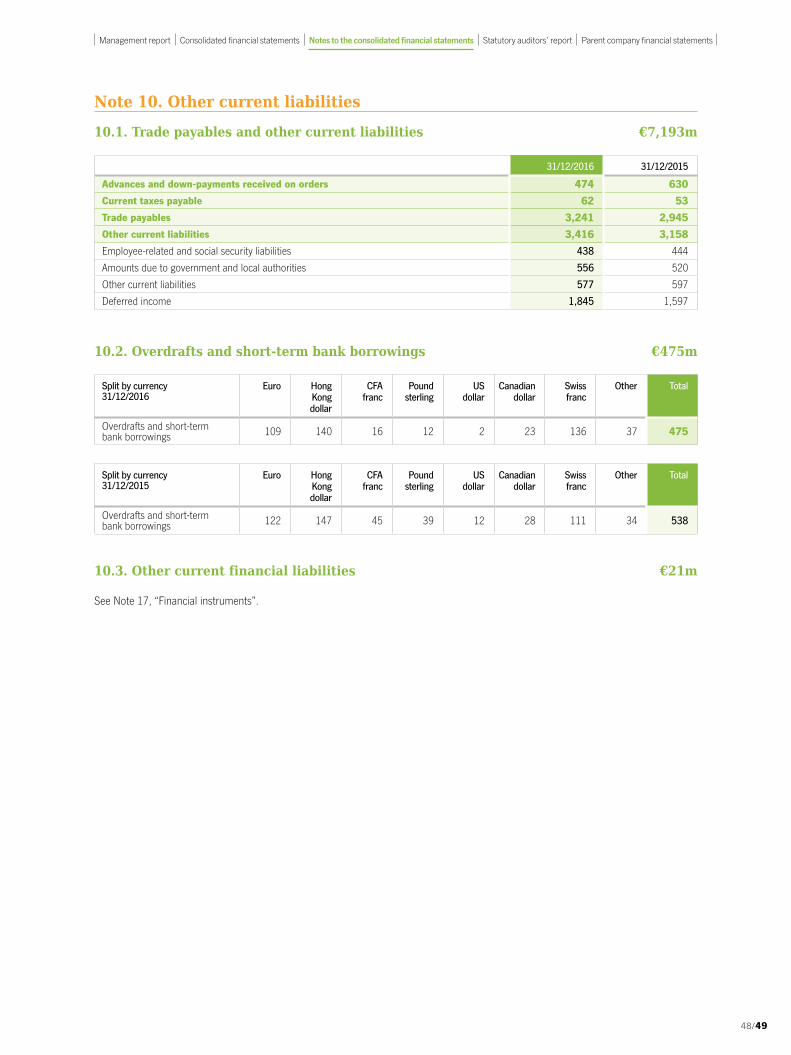
Note 10. Other current liabilities
10.1. Trade payables and other current liabilities €7,193m
31/12/2016 31/12/2015
Advances and down-payments received on orders 474 630
Current taxes payable 62 53
Trade payables 3,241 2,945
Other current liabilities 3,416 3,158
Employee-related and social security liabilities 438 444
Amounts due to government and local authorities 556 520
Other current liabilities 577 597
Deferred income 1,845 1,597
10.2. Overdrafts and short-term bank borrowings €475m
Split by currency 31/12/2016
Euro Hong Kong dollar
CFA franc
Poundsterling
US dollar
Canadian dollar
Swiss franc
Other Total
Overdrafts and short-term bank borrowings 109 140 16 12 2 23 136 37 475
Split by currency31/12/2015
Euro Hong Kong dollar
CFA franc
Poundsterling
US dollar
Canadian dollar
Swiss franc
Other Total
Overdrafts and short-term bank borrowings 122 147 45 39 12 28 111 34 538
10.3. Other current financial liabilities €21m
See Note 17, “Financial instruments”.
48/49
Management report Consolidated financial statements Notes to the consolidated financial statements Statutory auditors’ report Parent company financial statements
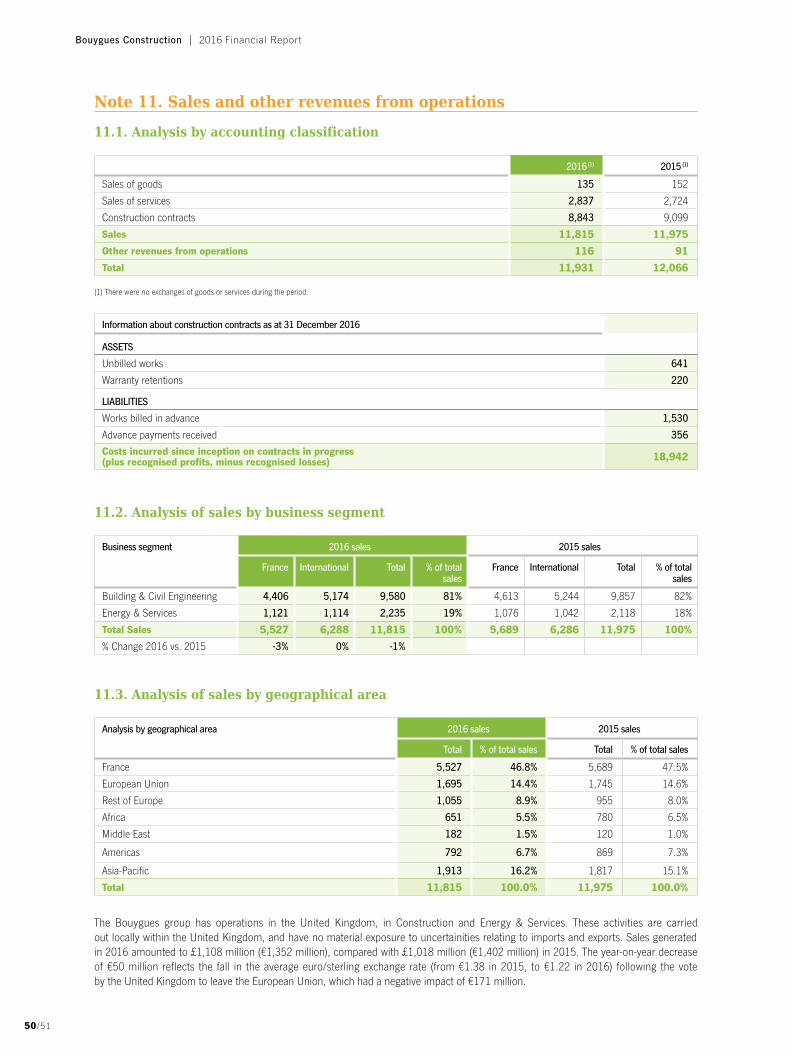
Note 11. Sales and other revenues from operations
11.1. Analysis by accounting classification
2016 (1) 2015 (1)
Sales of goods 135 152
Sales of services 2,837 2,724
Construction contracts 8,843 9,099
Sales 11,815 11,975
Other revenues from operations 116 91
Total 11,931 12,066
(1) There were no exchanges of goods or services during the period.
Information about construction contracts as at 31 December 2016
ASSETS
Unbilled works 641
Warranty retentions 220
LIABILITIES
Works billed in advance 1,530
Advance payments received 356
Costs incurred since inception on contracts in progress(plus recognised profits, minus recognised losses) 18,942
11.2. Analysis of sales by business segment
Business segment 2016 sales 2015 sales
France International Total % of total sales
France International Total % of total sales
Building & Civil Engineering 4,406 5,174 9,580 81% 4,613 5,244 9,857 82%
Energy & Services 1,121 1,114 2,235 19% 1,076 1,042 2,118 18%
Total Sales 5,527 6,288 11,815 100% 5,689 6,286 11,975 100%
% Change 2016 vs. 2015 -3% 0% -1%
11.3. Analysis of sales by geographical area
Analysis by geographical area 2016 sales 2015 sales
Total % of total sales Total % of total sales
France 5,527 46.8% 5,689 47.5%
European Union 1,695 14.4% 1,745 14.6%
Rest of Europe 1,055 8.9% 955 8.0%
Africa 651 5.5% 780 6.5%
Middle East 182 1.5% 120 1.0%
Americas 792 6.7% 869 7.3%
Asia-Pacific 1,913 16.2% 1,817 15.1%
Total 11,815 100.0% 11,975 100.0%
The Bouygues group has operations in the United Kingdom, in Construction and Energy & Services. These activities are carried out locally within the United Kingdom, and have no material exposure to uncertainities relating to imports and exports. Sales generated in 2016 amounted to £1,108 million (€1,352 million), compared with £1,018 million (€1,402 million) in 2015. The year-on-year decrease of €50 million reflects the fall in the average euro/sterling exchange rate (from €1.38 in 2015, to €1.22 in 2016) following the vote by the United Kingdom to leave the European Union, which had a negative impact of €171 million.
Bouygues Construction | 2016 Financial Report
50/51

11.4. Analysis of sales by type of contract (%)
Type of contract 2016 2015
France International Total France International Total
Public-sector contracts (1) 44% 40% 42% 45% 41% 43%
Private-sector contracts 56% 60% 58% 55% 59% 57%
(1) Sales billed directly to government departments, local authorities or public enterprises in France and abroad.
Note 12. Operating profit and EBITDA
12.1. Operating profit
2016 2015
Current operating profit (1)
Sales 11,815 11,975
Other revenues from operations 116 91
Purchases used in production and external charges (8,492) (8,689)
Personnel costs (2,738) (2,749)
Taxes other than income tax (147) (153)
Net depreciation & amortisation expense (227) (190)
Net charges to provisions & impairment losses (193) (238)
Change in production and property development inventories (68) 19
Other income and expenses on operations:
∙ Reversals of impairment losses and unused provisions 209 244
∙ Net gains on disposals of non-current assets 18 15
∙ Net foreign exchange gains/(losses) (17) (24)
∙ Other income/(expenses) 50 48
Sub-total: current operating profit 326 349
Other operating income and expenses(2) (23) (35)
Operating profit(3) 303 314
(1) An analysis by business segment is provided in Note 16.(2) Costs incurred on implementation of the new organisational structure.(3) Includes rental expense of €426 million in 2016 and €395 million in 2015.
12.2. EBITDA
2016 2015
Current operating profit 326 349
Elimination of net depreciation and amortisation expense and net charges to provisions and impairment losses:
∙ Net depreciation & amortisation expense 227 190
∙ Net charges to provisions & impairment losses 193 238
Elimination of items included in other operating income:
∙ Reversals of unused provisions and impairment losses (209) (244)
EBITDA 537 533
50/51
Management report Consolidated financial statements Notes to the consolidated financial statements Statutory auditors’ report Parent company financial statements

Note 13. Income from net surplus cash and other financial income and expenses
13.1. Components of income from net surplus cash
2016 2015
Cost of debt (6) (6)
Income from cash and cash equivalents 20 15
Income from net surplus cash 14 9
Income from net surplus cash comprises:
2016 2015
Net interest expense on debt (6) (6)
Interest expense on finance leases – –
Impact of financial instruments on debt – –
Sub-total (6) (6)
Net interest income from cash and cash equivalents 20 15
Impact of financial instruments on net cash position – –
Income from available-for-sale financial assets and cash equivalents – –
Sub-total 20 15
13.2. Breakdown of other financial income and expenses
2016 2015
Dividends from non-consolidated companies 15 15
Net (increase)/decrease in financial provisions 5 (10)
Net discounting expense – –
Change in fair value of other financial assets and liabilities – –
Current account waivers, gains and losses on disposals of investments in non-consolidated companies and of other financial assets, net interest other than on debt, and other items (17) 12
Other financial income/(expenses), net 3 17
An analysis by business segment is provided in Note 16.
Bouygues Construction | 2016 Financial Report
52/53

Note 14. Income tax expense
14.1. Analysis of income tax expense
2016 2015
France Other countries Total France Other countries Total
Tax payable to the tax authorities (49) (61) (110) (61) (52) (113)
Change in deferred tax liabilities (1) (2) 5 – 5 – – –
Change in deferred tax asset (1) (2) (11) 2 (9) 8 1 9
Dividend taxes – (5) (5) – (4) (4)
Total (55) (64) (119) (53) (55) (108)
An analysis by business segment is provided in Note 16.2016 2015
(1) Includes deferred taxes arising from: temporary differences (4) 5 tax loss carry-forwards 1 4 changes in tax rates or new taxes (1) –
(2) Includes tax charges/credits on temporary differences from prior periods not previously recognised:- current taxes- deferred taxes
– –– –
14.2. Tax proof (reconciliation between standard tax rate and effective tax rate)
Differences between the standard corporate income tax rate applicable in France and the effective tax rate based on the consolidated financial statements are explained as follows:
2016 2015
Standard tax rate in France 34.43% 34.43%
Differences in tax rates between France and other countries -2.70% -1.05%
Unrecognised deferred tax assets and creation/utilisation of tax loss carry-forwards -0.97% 7.05%
Effect of permanent differences -1.59% -12.60%
Flat-rate and reduced-rate taxes -1.60% -1.66%
Dividend taxes 1.03% 0.95%
Other -1.57% 0.19%
Effective tax rate 27.03% 27.31%
52/53
Management report Consolidated financial statements Notes to the consolidated financial statements Statutory auditors’ report Parent company financial statements

Note 15. Basic and diluted earnings per share
Basic earnings per share is calculated by dividing net profit attributable to the Group by the weighted average number of shares outstanding during the year (excluding the average number of ordinary shares bought and held as treasury shares), i.e. 1,706,230 shares.
2016 2015
Net profit attributable to the Group €320m €276m
Weighted average number of shares outstanding 1,706,230 1,706,230
Basic earnings per share €187.55 €161.76
Diluted earnings per share is calculated by reference to the weighted average number of shares outstanding, adjusted for the conversion of all potentially dilutive shares. Because Bouygues Construction does not use dilutive instruments, there is no difference between basic earnings per share and diluted earnings per share.
2016 2015
Net profit used to calculate diluted earnings per share €320m €276m
Weighted average number of shares outstanding used to calculate diluted earnings per share 1,706,230 1,706,230
Diluted earnings per share €187.55 €161.76
Bouygues Construction | 2016 Financial Report
54/55
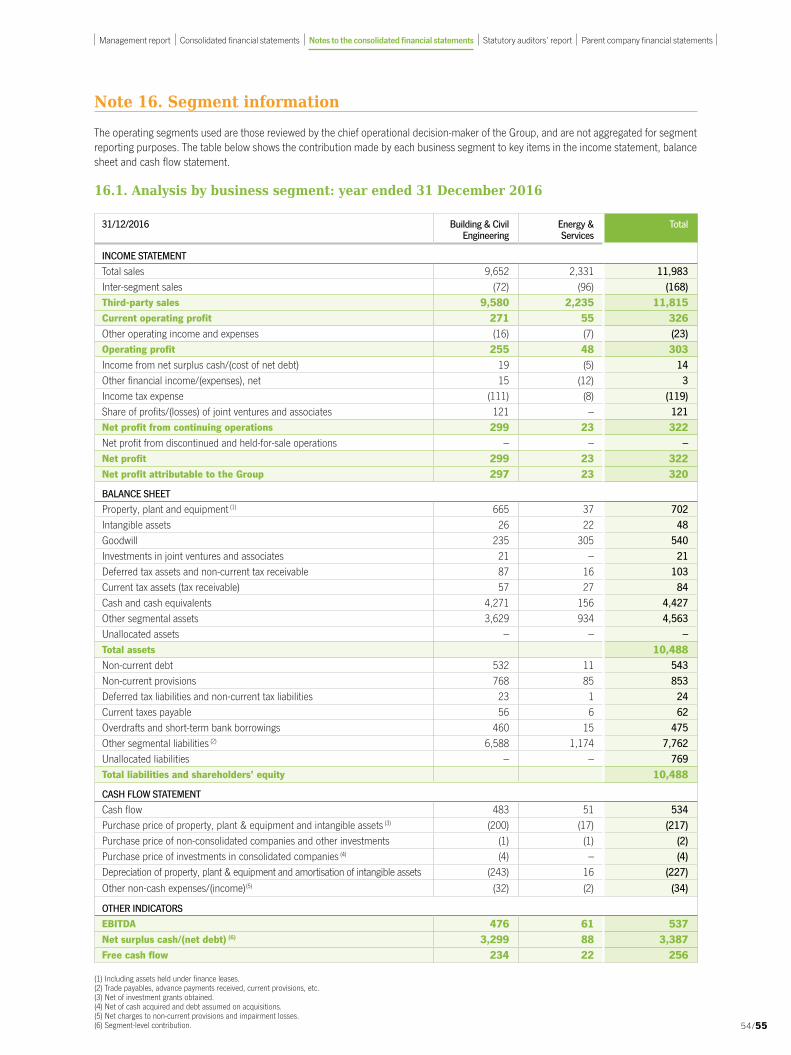
Note 16. Segment information
The operating segments used are those reviewed by the chief operational decision-maker of the Group, and are not aggregated for segment reporting purposes. The table below shows the contribution made by each business segment to key items in the income statement, balance sheet and cash flow statement.
16.1. Analysis by business segment: year ended 31 December 2016
31/12/2016 Building & Civil Engineering
Energy & Services
Total
INCOME STATEMENT
Total sales 9,652 2,331 11,983
Inter-segment sales (72) (96) (168)Third-party sales 9,580 2,235 11,815 Current operating profit 271 55 326 Other operating income and expenses (16) (7) (23)Operating profit 255 48 303 Income from net surplus cash/(cost of net debt) 19 (5) 14
Other financial income/(expenses), net 15 (12) 3
Income tax expense (111) (8) (119)
Share of profits/(losses) of joint ventures and associates 121 – 121 Net profit from continuing operations 299 23 322 Net profit from discontinued and held-for-sale operations – – –Net profit 299 23 322 Net profit attributable to the Group 297 23 320
BALANCE SHEET
Property, plant and equipment (1) 665 37 702
Intangible assets 26 22 48
Goodwill 235 305 540
Investments in joint ventures and associates 21 – 21
Deferred tax assets and non-current tax receivable 87 16 103
Current tax assets (tax receivable) 57 27 84
Cash and cash equivalents 4,271 156 4,427
Other segmental assets 3,629 934 4,563
Unallocated assets – – –Total assets 10,488 Non-current debt 532 11 543
Non-current provisions 768 85 853
Deferred tax liabilities and non-current tax liabilities 23 1 24
Current taxes payable 56 6 62
Overdrafts and short-term bank borrowings 460 15 475
Other segmental liabilities (2) 6,588 1,174 7,762
Unallocated liabilities – – 769 Total liabilities and shareholders’ equity 10,488
CASH FLOW STATEMENT
Cash flow 483 51 534
Purchase price of property, plant & equipment and intangible assets (3) (200) (17) (217)
Purchase price of non-consolidated companies and other investments (1) (1) (2)
Purchase price of investments in consolidated companies (4) (4) – (4)
Depreciation of property, plant & equipment and amortisation of intangible assets (243) 16 (227)
Other non-cash expenses/(income) (5) (32) (2) (34)
OTHER INDICATORS
EBITDA 476 61 537 Net surplus cash/(net debt) (6) 3,299 88 3,387 Free cash flow 234 22 256
(1) Including assets held under finance leases.(2) Trade payables, advance payments received, current provisions, etc.(3) Net of investment grants obtained.(4) Net of cash acquired and debt assumed on acquisitions.(5) Net charges to non-current provisions and impairment losses.(6) Segment-level contribution. 54/55
Management report Consolidated financial statements Notes to the consolidated financial statements Statutory auditors’ report Parent company financial statements

16.2. Analysis by business segment: year ended 31 December 2015
31/12/2015 Building & Civil Engineering
Energy & Services
Total
INCOME STATEMENT
Total sales 9,928 2,216 12,144
Inter-segment sales (71) (98) (169)
Third-party sales 9,857 2,118 11,975
Current operating profit 292 57 349
Other operating income and expenses (26) (9) (35)
Operating profit 266 48 314
Income from net surplus cash/(cost of net debt) 12 (3) 9
Other financial income/(expenses), net 16 1 17
Income tax expense (94) (14) (108)
Share of profits/(losses) of joint ventures and associates 55 1 56
Net profit from continuing operations 255 33 288
Net profit from discontinued and held-for-sale operations – – –
Net profit 255 33 288
Net profit attributable to the Group 244 32 276
BALANCE SHEET
Property, plant and equipment (1) 703 40 743
Intangible assets 25 21 46
Goodwill 251 306 557
Investments in joint ventures and associates 25 1 26
Deferred tax assets and non-current tax receivable 102 14 116
Current tax assets (tax receivable) 43 24 67
Cash and cash equivalents 4,181 211 4,392
Other segmental assets 3,668 787 4,455
Unallocated assets – – –
Total assets 10,402
Non-current debt 546 27 573
Non-current provisions 743 85 828
Deferred tax liabilities and non-current tax liabilities 28 – 28
Current taxes payable 48 5 53
Overdrafts and short-term bank borrowings 506 32 538
Other segmental liabilities (2) 6,407 1,039 7,446
Unallocated liabilities – – 936
Total liabilities and shareholders’ equity 10,402
CASH FLOW STATEMENT
Cash flow 395 72 467
Purchase price of property, plant & equipment and intangible assets (3) (237) (15) (252)
Purchase price of non-consolidated companies and other investments (1) (1) (2)
Purchase price of investments in consolidated companies (4) – (12) (12)
Depreciation of property, plant & equipment and amortisation of intangible assets 172 18 190
Other non-cash expenses/(income) (5) 11 7 18
OTHER INDICATORS
EBITDA 456 77 533
Net surplus cash/(net debt) (6) 3,131 141 3,272
Free cash flow 113 41 154
(1) Including assets held under finance leases.(2) Trade payables, advance payments received, current provisions, etc.(3) Net of investment grants obtained.(4) Net of cash acquired and debt assumed on acquisitions.(5) Net charges to non-current provisions and impairment losses.(6) Segment-level contribution.
Bouygues Construction | 2016 Financial Report
56/57

16.3. Analysis by geographical area
31/12/2016 France(incl. overseasdepartments)
EuropeanUnion
Rest ofEurope
Africa Asia-Pacific-
Oceania
Americas MiddleEast
Total
INCOME STATEMENT
Third-party sales 5,527 1,695 1,055 651 1,913 792 182 11,815
BALANCE SHEET
Property, plant and equipment (1) 393 19 27 59 172 16 16 702
Intangible assets 37 10 – 1 – – – 48
CASH FLOW STATEMENT
Acquisitions of property, plant & equipment and intangible assets 77 7 9 15 91 3 15 217
Acquisitions of investments in non-consolidated companies and other investments
1 – – 1 – – – 2
Acquisitions of investments in consolidated companies, net of acquired cash – 4 – – – – – 4
(1) Including assets held under finance leases.
31/12/2015 France(incl. overseasdepartments)
EuropeanUnion
Rest ofEurope
Africa Asia-Pacific-
Oceania
Americas MiddleEast
Total
INCOME STATEMENT
Third-party sales 5,689 1,745 955 780 1,817 869 120 11,975
BALANCE SHEET
Property, plant and equipment (1) 394 23 33 82 187 18 6 743
Intangible assets 40 6 – – – – – 46
CASH FLOW STATEMENT
Acquisitions of property, plant & equipment and intangible assets (76) (5) (12) (21) (128) (5) (5) (252)
Acquisitions of investments in non-consolidated companies and other investments
(2) – – – – – – (2)
Acquisitions of investments in consolidated companies, net of acquired cash – – – – – (12) – (12)
(1) Including assets held under finance leases.
Note 17. Financial instruments
The disclosures presented below show aggregate notional amounts at 31 December 2016 for each type of financial instrument used, split by residual maturity for interest rate hedges and by currency for currency hedges.
17.1. Interest rate and currency hedges
17.1.1. Analysis by business segment
(€ million) Building & Civil Engineering Energy & Services Total 31/12/2016 Total 31/12/2015
Forward purchases 314 50 364 527
Forward sales 332 35 367 301
Currency swaps 7 – 7 5
Interest rate swaps (1) 15 – 15 3
Interest rate options (caps, floors) – – – –
Commodities derivatives – – – 1
Total 668 85 753 837
(1) Bouygues Construction Relais: €4m at a fixed rate paid of 0.77%; Bouygues Development: €11m at a fixed rate paid of 0.81%.
56/57
Management report Consolidated financial statements Notes to the consolidated financial statements Statutory auditors’ report Parent company financial statements

17.1.2. Analysis by maturity and original currency
(€ million) Maturity Total Original currency
< 1 year
1 to 5 years
> 5 years
EUR CHF GBP USD HKD CAD Other
Forward purchases 355 9 – 364 216 7 5 99 4 5 28
Forward sales 304 63 – 367 32 1 28 158 95 21 32
Currency swaps 7 – – 7 – – – – – – 7
Interest rate swaps – 15 – 15 4 – 11 – – – –
Interest rate options (caps, floors) – – – – – – – – – – –
Commodities derivatives – – – – – – – – – – –
Total 666 87 – 753 252 8 44 257 99 26 67
17.2. Market value of hedging instruments
Derivatives recognised as assets (€ million)
Original currency Total Fair value hedge
Cash flow hedge
Hedge of net investment
in foreign operation
EUR USD GBP CHF Other
Forward purchases 2 1 – – 1 4 – 4 –
Forward sales 7 – 2 – – 9 – 9 –
Currency swaps – – – – – – – – –
Interest rate swaps – – – – – – – – –
Interest rate options (caps, floors) – – – – – – – – –
Commodities derivatives – – – – – – – – –
Total recognised as assets 9 1 2 – 1 13 – 13 –
Derivatives recognised as liabilities (€ million)
Original currency Total Fair value hedge
Cash flow hedge
Hedge of net investment
in foreign operation
EUR USD GBP CHF Other
Forward purchases (6) (4) – – – (10) (2) (8) –
Forward sales – (9) – – (2) (11) (1) (10) –
Currency swaps – – – – – – – – –
Interest rate swaps – – – – – – – – –
Interest rate options (caps, floors) – – – – – – – – –
Commodities derivatives – – – – – – – – –
Total recognised as liabilities (6) (13) – – (2) (21) (3) (18) –
Total net asset/(liability) 3 (12) 2 – (1) (8) (3) (5) –
In the event of a +1.00% movement in the yield curve, the market value of the hedging instruments portfolio would decrease by €0.1 million.
In the event of a 1% adverse movement in the euro against each of the other currencies, the hedging instruments portfolio would have a negative market value of €13.0 million.
These calculations were prepared by the Group, or obtained from the banks with which the instruments were contracted.
Bouygues Construction | 2016 Financial Report
58/59

Note 18. Off balance sheet commitments at 31 December 2016
This note discloses information about guarantee commitments, sundry contractual commitments, and lease commitments.
18.1. Guarantee commitments
31/12/2016 Less than 1 year 1 to 5 years More than 5 years
Pledges, mortgages and collateral 5 – 4 1
Guarantees and endorsements given (1) 69 4 44 21
Total guarantee commitments given 74 4 48 22
Pledges, mortgages and collateral – – – –
Guarantees and endorsements received – – – –
Total guarantee commitments received – – – –
(1) In connection with its ordinary activities, the Bouygues Construction Group grants multi-year guarantees (such as ten-year building guarantees), which are usually covered by statistically-based provisions on the liabilities side of the balance sheet. Contract guarantees provided by banks to Group customers represent off balance sheet commitments for those banks. Where such guarantees are liable to result in payments being made, a provision is recognised in the Group’s consolidated balance sheet.
18.2. Sundry contractual commitments
31/12/2016 Less than 1 year 1 to 5 years More than 5 years
Lump-sum retirement benefit obligations – – – –
Unmatured bills – – – –
Other – – – –
Total sundry contractual commitments given – – – –
Lump-sum retirement benefit obligations – – – –
Unmatured bills – – – –
Other – – – –
Total sundry contractual commitments received – – – –
No material off balance sheet commitments have been omitted from this disclosure, in accordance with applicable accounting standards.
18.3. Operating leases
31/12/2016 Less than 1 year 1 to 5 years More than 5 years
Operating lease commitments (given/received) 44 10 31 3
These figures show the minimum future lease payments due until the normal renewal date of the lease (or earliest potential termination date) under operating leases relating to current operations (land, buildings, plant & equipment, etc.).
18.4. Finance leases (already recognised as liabilities in the balance sheet)
31/12/2016 Less than 1 year 1 to 5 years More than 5 years
Finance lease commitments 4 1 2 1
58/59
Management report Consolidated financial statements Notes to the consolidated financial statements Statutory auditors’ report Parent company financial statements

Note 18. Off balance sheet commitments at 31 December 2015
This note discloses information about guarantee commitments, sundry contractual commitments, and lease commitments.
18.5. Guarantee commitments
31/12/2015 Less than 1 year 1 to 5 years More than 5 years
Pledges, mortgages and collateral 5 – 1 4
Guarantees and endorsements given (1) 50 4 46 –
Total guarantee commitments given 55 4 47 4
Pledges, mortgages and collateral – – – –
Guarantees and endorsements received – – – –
Total guarantee commitments received – – – –
(1) In connection with its ordinary activities, the Bouygues Construction Group grants multi-year guarantees (such as ten-year building guarantees), which are usually covered by statistically-based provisions on the liabilities side of the balance sheet. Contract guarantees provided by banks to Group customers represent off balance sheet commitments for those banks.Where such guarantees are liable to result in payments being made, a provision is recognised in the Group’s consolidated balance sheet.
18.6. Sundry contractual commitments
31/12/2015 Less than 1 year 1 to 5 years More than 5 years
Lump-sum retirement benefit obligations – – – –
Unmatured bills – – – –
Other – – – –
Total sundry contractual commitments given – – – –
Lump-sum retirement benefit obligations – – – –
Unmatured bills – – – –
Other – – – –
Total sundry contractual commitments received – – – –
No material off balance sheet commitments have been omitted from this disclosure, in accordance with applicable accounting standards.
18.7. Operating leases
31/12/2015 Less than 1 year 1 to 5 years More than 5 years
Operating lease commitments (given/received) 41 8 26 7
These figures show the minimum future lease payments due until the normal renewal date of the lease (or earliest potential termination date) under operating leases relating to current operations (land, buildings, plant & equipment, etc.).
18.8. Finance leases (already recognised as liabilities in the balance sheet)
31/12/2015 Less than 1 year 1 to 5 years More than 5 years
Finance lease commitments 3 1 2 –
Bouygues Construction | 2016 Financial Report
60/61

Note 19. Average headcount and employee benefit obligations
19.1. Average headcount
2016 2015
Managerial staff 8,628 8,648
Technical, supervisory & clerical staff 5,353 5,583
Site workers 6,173 6,709
Sub-total - headcount France 20,154 20,940
Expatriate staff and local employment contracts 30,957 30,781
Total average headcount 51,111 51,721
19.2. Employee benefit obligations
19.2.1. Employee benefit obligations
31/12/2015 Movementsduring 2016
31/12/2016
Lump-sum retirement benefits 163 2 165
Long service awards 30 1 31
Other post-employment benefits (pensions) 2 5 7
Total 195 8 203
These obligations are covered by provisions, recorded as non-current liabilities.
19.2.2. Employee benefit obligations: pensions and other post-employment benefits, excluding long-service awards
19.2.2.1. Defined-contribution plans
2016 2015
Amount recognised as an expense 190 191
The figures disclosed above are the contributions paid to pension funds for compulsory and top-up schemes.
19.2.2.2. Defined-benefit plans (retirement benefit obligations)
a. Amounts recognised in the balance sheet
Lump-sum retirement benefits Pensions
31/12/2016 31/12/2015 31/12/2016 31/12/2015
Present value of obligation 165 163 29 26
Fair value of plan assets – – (22) (24)
Net obligation recognised 165 163 7 2
60/61
Management report Consolidated financial statements Notes to the consolidated financial statements Statutory auditors’ report Parent company financial statements
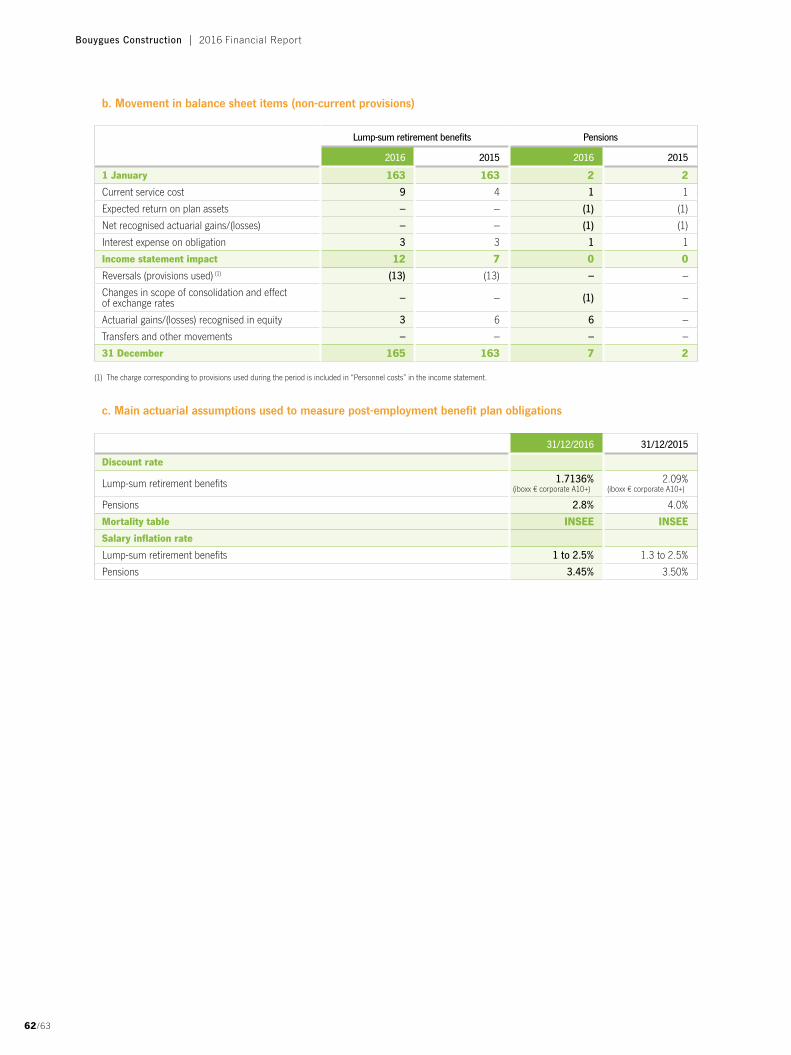
b. Movement in balance sheet items (non-current provisions)
Lump-sum retirement benefits Pensions
2016 2015 2016 2015
1 January 163 163 2 2
Current service cost 9 4 1 1
Expected return on plan assets – – (1) (1)
Net recognised actuarial gains/(losses) – – (1) (1)
Interest expense on obligation 3 3 1 1
Income statement impact 12 7 0 0
Reversals (provisions used) (1) (13) (13) – –
Changes in scope of consolidation and effect of exchange rates – – (1) –
Actuarial gains/(losses) recognised in equity 3 6 6 –
Transfers and other movements – – – –
31 December 165 163 7 2
(1) The charge corresponding to provisions used during the period is included in “Personnel costs” in the income statement.
c. Main actuarial assumptions used to measure post-employment benefit plan obligations
31/12/2016 31/12/2015
Discount rate
Lump-sum retirement benefits 1.7136%(iboxx € corporate A10+)
2.09%(iboxx € corporate A10+)
Pensions 2.8% 4.0%
Mortality table INSEE INSEE
Salary inflation rate
Lump-sum retirement benefits 1 to 2.5% 1.3 to 2.5%
Pensions 3.45% 3.50%
Bouygues Construction | 2016 Financial Report
62/63

Note 20. Related-party disclosures
20.1. Related-party disclosures
Expenses Income Receivables Payables
2016 2015 2016 2015 2016 2015 2016 2015
Parties with an ownership interest (192) (192) 252 214 3,614 (1) 3,604 897 911
Joint operations (23) (43) 193 199 321 265 219 205
Joint ventures and associates (1) (4) 3 25 6 18 4 4
Other related parties (5) (6) 38 29 57 60 47 57
Total (221) (245) 486 467 3,998 3,947 1,167 1,177
Due within less than 1 year 3,963 3,913 658 771
Due within 1 to 5 years 19 19 509 406
Due after more than 5 years 16 15 – –
Of which bad debt write-offs – –
Of which impairment of receivables 72 74
(1) Includes Bouygues Relais: €2,127 million and Uniservice: €1,410 million.
The off balance sheet commitments disclosed in Note 18 to these consolidated financial statements include €11 million of commitments to related parties.
20.2. Disclosures about remuneration and benefits paid to directors and senior executives
• Disclosures about senior executives cover members of the Executive Committee in post on 31 December 2016. • Direct remuneration amounted to €14,156 thousands, comprising €8,460 thousands of basic remuneration and €5,696 thousands
of variable remuneration paid in 2017 on the basis of 2016 performance. • Short-term benefits: none. • Post-employment benefits: members of the Executive Committee belong to a top-up retirement plan based on 0.92% of their reference
salary for each year’s membership of the plan. This top-up plan is contracted out to an insurance company. Contributions paid into the fund managed by the insurance company amounted to €408 thousands in 2016.
• Long-term benefits: none.• Termination benefits: these comprise lump-sum retirement benefits of €4,057 thousands as of 31 December 2016. • Share-based payment: 286,500 stock options were awarded on 30 May 2016, at an exercise price of €28.997.
The earliest exercise date is 31 May 2018.
62/63
Management report Consolidated financial statements Notes to the consolidated financial statements Statutory auditors’ report Parent company financial statements

Note 21. Additional cash flow statement information
21.1. Cash flows of acquired and divested subsidiaries
Breakdown by business segment of cash flows resulting from acquisitions and divestments of consolidated companies.
Building & CivilEngineering
Energy &Services
Group total 2016
Property, plant and equipment – – –
Intangible assets (4) – (4)
Goodwill – – –
Non-current financial assets 6 1 7
Deferred tax assets and non-current tax receivable – – –
Cash and cash equivalents – 1 1
Held-for-sale assets 23 – 23
Impact on equity – – –
Non-current and current debt – – –
Non-current provisions – (1) (1)
Deferred tax liabilities and non-current tax liabilities – – –
Overdrafts and short-term bank borrowings – (16) (16)
Working capital needs 1 19 20
Net divestment/(acquisition) cost 26 4 30
Gains on divestments of consolidated companies 113 (1) 112
Receivables on disposals/liabilities on acquisitions – (1) (1)
Cash divested or acquired – 15 15
Net cash flow arising from divestments and acquisitions of consolidated companies 139 17 156
Building & CivilEngineering
Energy &Services
Group total 2015
Property, plant and equipment – (2) (2)
Intangible assets – – –
Goodwill – (12) (12)
Non-current financial assets (30) – (30)
Deferred tax assets and non-current tax receivable – (1) (1)
Cash and cash equivalents – (2) (2)
Impact on equity – – –
Non-current and current debt – 3 3
Non-current provisions – 4 4
Deferred tax liabilities and non-current tax liabilities – – –
Overdrafts and short-term bank borrowings – – –
Working capital needs – (4) (4)
Net divestment/(acquisition) cost (30) (14) (44)
Gains on divestments of consolidated companies 87 – 87
Receivables on disposals/liabilities on acquisitions – – –
Cash divested or acquired – 2 2
Net cash flow arising from divestments and acquisitions of consolidated companies 57 (12) 45
Bouygues Construction | 2016 Financial Report
64/65

21.2. Calculation of free cash flow
31/12/2016 31/12/2015
CASH FLOW 534 467
Income from net surplus cash 14 9
Income taxes (119) (108)
Cash flow after income from net surplus cash and income taxes 429 368
Purchase price of property, plant & equipment and intangible assets (217) (252)
Proceeds from disposals of property, plant & equipment and intangible assets 44 38
Net capital expenditure (173) (214)
Free cash flow 256 154
Note 22. Held-for-sale assets and operations €2m
As of 31 December 2016, this item comprised items of property, plant and equipment being sold in the United Kingdom.
As of 31 December 2015, it comprised the assets relating to the sale of the residual 10% equity interest in ALIS and shareholder loans. That sale was completed on 15 June 2016 (see Note 1.1, “Significant events of the year”).
Note 23. Auditors’ fees
The table below shows fees paid to the auditors (and member firms of their networks) responsible for the audit of the consolidated financial statements of Bouygues Construction and consolidated companies (excluding joint ventures and associates), as expensed through the income statement in 2016.
Type of engagement (in thousand €)
Mazars network Ernst & Young network Other firms Total fee expense
2016 % 2015 2016 % 2015 2016 % 2015 2016 2015
A - AUDIT
Audit of consolidated and individual company financial statements
2,217 98% 2,237 3,475 90% 3,650 286 62% 272 5,978 6,159
Related engagements 50 2% 30 334 9% 48 47 10% 223 431 301
Sub-total 1 2,267 100% 2,267 3,809 99% 3,698 333 73% 495 6,409 6,460
B - OTHER SERVICES
Legal, tax, employment law – – 15 55 1% 65 79 17% (1) 134 79
Other – – – – – – 46 10% 5 46 5
Sub-total 2 – – 15 55 1% 65 125 27% 4 180 84
Total fee expense 2,267 100% 2,282 3,864 100% 3,763 458 100% 499 6,589 6,544
64/65
Management report Consolidated financial statements Notes to the consolidated financial statements Statutory auditors’ report Parent company financial statements

Note 24. List of principal consolidated entities at 31 December 2016
Company City Country % interest % control
31/12/2016 31/12/2015 31/12/2016 31/12/2015
FULLY CONSOLIDATED
1- Bouygues Construction
Bouygues Construction SA Guyancourt France 100.00% 100.00% 100.00% 100.00%
∙ France
Bouygues Construction Relais SNC Guyancourt France 99.50% 99.50% 99.50% 99.50%
Challenger Investissement SAS Guyancourt France 100.00% 100.00% 100.00% 100.00%
Challenger SNC Guyancourt France 100.00% 100.00% 100.00% 100.00%
Distrimo SNC Cléon France 99.93% 99.93% 100.00% 100.00%
Bouygues Construction Materiel SNC Tourville-La-Rivière France 99.93% 99.93% 100.00% 100.00%
GIE Bouygues Construction Purchasing Guyancourt France 100.00% 100.00% 100.00% 100.00%
Structis SNC Guyancourt France 98.98% 98.98% 99.00% 99.00%
Bouygues Construction Middle East Guyancourt France 99.99% 99.99% 100.00% 100.00%
∙ Other countries
Bypar SARL Luxembourg Luxembourg 100.00% 100.00% 100.00% 100.00%
Structis Maroc Casablanca Morocco 100.00% 100.00% 100.00% 100.00%
2 - Bouygues Bâtiment Île-De-France
Bouygues Bâtiment Île-de-France SA Guyancourt France 100.00% 100.00% 100.00% 100.00%
∙ France
Bati Renov SA Orly France 99.35% 99.35% 99.35% 99.35%
Bouygues Bâtiment Île-de-France PPP SA Guyancourt France 100.00% 100.00% 100.00% 100.00%
Brézillon SA Margny-Lès-Compiègne France 99.35% 99.35% 99.35% 99.35%
Élan SARL Guyancourt France 99.99% 99.99% 99.99% 99.99%
Linkcity Île-de-France (formerly Sodearif) Guyancourt France 99.99% 99.99% 99.99% 99.99%
Cogemex SAS Ivry-sur-Seine France 100.00% 100.00% 100.00% 100.00%
3 - Entreprises France-Europe Subsidiaries
∙ France
Linkcity Centre Sud-Ouest (formerly Cirmad Centre Sud-Ouest) Merignac France 100.00% 100.00% 100.00% 100.00%
Linkcity Nord-Est (formerly Cirmad Nord-Est) Nancy France 100.00% 100.00% 100.00% 100.00%
Linkcity Sud-Est (formerly Cirmad Grand Sud) Colombier Saugnieu France 100.00% 100.00% 100.00% 100.00%
Linkcity Grand Ouest (formerly Cirmad Prospectives) Rouen France 100.00% 100.00% 100.00% 100.00%
Bouygues Bâtiment Centre Sud-Ouest (formerly DV) Merignac France 100.00% 100.00% 100.00% 100.00%
Bouygues Bâtiment Sud-Est (formerly GFC) Colombier Saugnieu France 100.00% 100.00% 100.00% 100.00%
Bouygues Bâtiment Grand Ouest (formerly Quille Construction) Nantes France 100.00% 100.00% 100.00% 100.00%
Bouygues Bâtiment Nord-Est (formerly Pertuy) Nancy France 100.00% 100.00% 100.00% 100.00%
Quille SA Rouen France 100.00% 100.00% 100.00% 100.00%
∙ Other countries
Acieroid SA Barcelona Spain 100.00% 100.00% 100.00% 100.00%
Bouygues Belgium Brussels Belgium 100.00% 100.00% 100.00% 100.00%
Colt España L’Hospitalet de Llobregat Spain 60.00% 60.00% 60.00% 60.00%
Losinger Holding AG Lucerne Switzerland 100.00% 100.00% 100.00% 100.00%
Losinger Marazzi AG Koniz Switzerland 100.00% 100.00% 100.00% 100.00%
Richelmi SA Monaco Monaco 100.00% 100.00% 100.00% 100.00%
4 - Bouygues Bâtiment International
Bouygues Bâtiment International SA Guyancourt France 100.00% 100.00% 100.00% 100.00%
∙ France
Kohler Investment Guyancourt France 100.00% 100.00% 100.00% 100.00%
Bouygues Construction | 2016 Financial Report
66/67

Company City Country % interest % control
31/12/2016 31/12/2015 31/12/2016 31/12/2015
∙ Other countries
Americaribe Inc. Miami United States 100.00% 100.00% 100.00% 100.00%
Americaribe Ghana Accra Ghana 100.00% 100.00% 100.00% 100.00%
Bouygues Construction India Building Projects LLP Mumbai India 100.00% 100.00% 100.00% 100.00%
Bouygues Bâtiment Guinée équatoriale SA Malabo Equatorial Guinea 99.96% 99.96% 99.96% 99.96%
Bouygues Bâtiment Trinidad & Tobago Port of Spain Trinidad & Tobago 100.00% 100.00% 100.00% 100.00%
Bouygues Construcaõ Brasil Sao Paulo Brazil 100.00% 100.00% 100.00% 100.00%
Bouygues Construction Nigeria Ltd Abuja Nigeria 86.37% 86.37% 86.37% 86.37%
Bouygues Construction Ghana Accra Ghana 100.00% 100.00% 100.00% 100.00%
Bouygues Construcciones Perú Lima Peru 100.00% 100.00% 100.00% 100.00%
Bouygues Thai Ltd Nonthaburi Thailand 49.00% 49.00% 49.00% 49.00%
Bouygues UK Ltd London United Kingdom 100.00% 100.00% 100.00% 100.00%
Bouygues Building Canada Vancouver Canada 100.00% 100.00% 100.00% 100.00%
Bouygues Development Ltd London United Kingdom 100.00% 100.00% 100.00% 100.00%
Bouygues Thai/VSL Australia Ltd Bangkok Thailand 92.32% 92.32% 99.97% 99.97%
Bymaro Casablanca Morocco 99.99% 99.99% 99.99% 99.99%
Byme Singapore Private Company Ltd Singapore Singapore 100.00% 100.00% 100.00% 100.00%
Byme USA Inc. Miami United States 100.00% 100.00% 100.00% 100.00%
Bysolar Asia Ltd Hong Kong China – 100.00% – 100.00%
Dragages et Travaux Publics Singapore PTE Ltd Singapore Singapore 100.00% 100.00% 100.00% 100.00%
Dragages Engineering and Construction Nigeria Ltd Abuja Nigeria 100.00% 100.00% 100.00% 100.00%
Hallmark - BY Development Ltd London United Kingdom 100.00% – 100.00% –
Karmar SA Warsaw Poland 100.00% 100.00% 100.00% 100.00%
Leadbitter Bouygues Holding Limited and its subsidiaries Abingdon United Kingdom – 100.00% – 100.00%
Setao Abidjan Ivory Coast 78.61% 78.61% 78.61% 78.61%
Thomas Vale Group Worcestershire United Kingdom 100.00% 100.00% 100.00% 100.00%
Tower Hamlets LEP Ltd London United Kingdom 80.00% 80.00% 80.00% 80.00%
VCES Holding SRO and its subsidiaries Prague Czech Republic 100.00% 100.00% 100.00% 100.00%
Westminster Local Education Partnership Ltd London United Kingdom 90.00% 90.00% 90.00% 90.00%
Linkcity Poland (formerly Bypolska Property Development) Warsaw Poland 100.00% 100.00% 100.00% 100.00%
5 - Other Bâtiment International subsidiaries
∙ Other countries
Asiaworld Expo Management Ltd Hong Kong China 100.00% 100.00% 100.00% 100.00%
Byme Engineering Hong Kong Limited Hong Kong China 90.00% 90.00% 90.00% 90.00%
Dragages et Travaux Publics (Hong Kong) Limited Hong Kong China 100.00% 100.00% 100.00% 100.00%
Dragages - Bouygues TP MTRC SCL 1128 Hong Kong China 100.00% 100.00% 100.00% 100.00%
IEC Investments Ltd Hong Kong China 60.00% 60.00% 60.00% 60.00%
Dragages Construction Macau Ltd Macau China 100.00% 100.00% 100.00% 100.00%
6- Bouygues Travaux Publics
Bouygues TP SA Guyancourt France 100.00% 100.00% 100.00% 100.00%
∙ France
DTP SAS Guyancourt France 100.00% 100.00% 100.00% 100.00%
Bouygues Construction Services Nucléaires Guyancourt France 100.00% 100.00% 100.00% 100.00%
BYTP Régions France SA Labège France 100.00% 100.00% 100.00% 100.00%
Europe Fondations Guyancourt France 100.00% 100.00% 100.00% 100.00%
∙ Other countries
Bouygues Construction Australia PTY Ltd Sydney Australia 100.00% 100.00% 100.00% 100.00%
Bouygues Travaux Publics MC (Monaco) Monaco Monaco 100.00% – 100.00% –
Bouygues Civil Works Johannesburg South Africa 100.00% 100.00% 100.00% 100.00%
Bouygues Civil Works Florida Miami United States 100.00% 100.00% 100.00% 100.00%
DCW Hong Kong China 100.00% 100.00% 100.00% 100.00%
66/67
Management report Consolidated financial statements Notes to the consolidated financial statements Statutory auditors’ report Parent company financial statements

Company City Country % interest % control
31/12/2016 31/12/2015 31/12/2016 31/12/2015
Gounkoto Mining Services Bamako Mali 100.00% 100.00% 100.00% 100.00%
Kibali Minig Services (KMS) SPRL Watsa Province Orientale
Democratic Rep. Congo 100.00% 100.00% 100.00% 100.00%
Mining and Rehandling Services (Mars) Bamako Mali 100.00% 100.00% 100.00% 100.00%
Prader Losinger SA Sion Switzerland 99.67% 99.67% 99.67% 99.67%
Société de Construction du Pont Riviera Marcory Abidjan Ivory Coast 100.00% 100.00% 100.00% 100.00%
Tongonaise des Mines Korhogo Ivory Coast 100.00% 100.00% 100.00% 100.00%
Société Ivoirienne du Métro d’Abidjan (Sicma) SA Abidjan Ivory Coast 100.00% – 100.00% –
7 - VSL
VSL International Ltd Köniz Switzerland 100.00% 100.00% 100.00% 100.00%
∙ Other countries
VSL Construction Systems Barcelona Spain 99.75% 99.75% 99.75% 99.75%
VSL Civil Works Ltd Subingen Switzerland 100.00% 100.00% 100.00% 100.00%
Intrafor Hong Kong Limited Hong Kong China 100.00% 100.00% 100.00% 100.00%
VSL Engineering (China) Hefei China 60.00% 60.00% 60.00% 60.00%
VSL Australia PTY Ltd Sydney Australia 100.00% 100.00% 100.00% 100.00%
VSL Annahutte System AG Rapperswil-Jona Switzerland 69.91% 70.00% 70.00% 70.00%
VSL Brasil Recuperacaõ Construcaõ LTDA Sao Paulo Brazil – 100.00% – 100.00%
VSL Canada Toronto Canada 100.00% 100.00% 100.00% 100.00%
VSL Hong Kong Hong Kong China 100.00% 100.00% 100.00% 100.00%
VSL India Chennai India 100.00% 100.00% 100.00% 100.00%
VSL Indonesia Jakarta Indonesia 67.00% 67.00% 67.00% 67.00%
VSL Malaysia Kuala Lumpur Malaysia 100.00% 100.00% 100.00% 100.00%
VSL Mexico Mexico D.F Mexico 100.00% 100.00% 100.00% 100.00%
VSL Middle East LLC Dubai United Arab Emirates 80.00% 80.00% 80.00% 80.00%
VSL Middle East Qatar Doha Qatar 78.40% 78.40% 98.00% 98.00%
VSL Philippines Mandaluyong Philippines 80.00% 80.00% 80.00% 80.00%
VSL Polska Warsaw Poland 100.00% 100.00% 100.00% 100.00%
VSL Portugal Paco De Arcos Portugal 99.33% 99.33% 99.33% 99.33%
VSL Singapour Singapore Singapore 100.00% 100.00% 100.00% 100.00%
VSL Suisse Subingen Switzerland 99.88% 99.88% 99.88% 99.88%
VSL Systems (Bruneï) Darussalam Brunei 60.00% 60.00% 60.00% 60.00%
VSL Systems Manufacturer (Spain) Barcelona Spain 100.00% 100.00% 100.00% 100.00%
VSL Tchequecz Prague Czech Republic 100.00% 100.00% 100.00% 100.00%
VSL Thailand Bangkok Thailand 82.15% 82.15% 88.00% 88.00%
VSL Vietnam Ltd Ho Chi Minh City Vietnam 100.00% 100.00% 100.00% 100.00%
8 - Bouygues Energies & Services
Bouygues Energies & Services SAS Montigny-Le-Bretonneux France 100.00% 100.00% 100.00% 100.00%
∙ France
Axione Malakoff France 100.00% 100.00% 100.00% 100.00%
Bouygues E&S Fondations Montigny-Le-Bretonneux France 100.00% 100.00% 100.00% 100.00%
Bouygues E&S FM France Montigny-Le-Bretonneux France 100.00% 100.00% 100.00% 100.00%
Bouygues E&S Industrie et Logistique Montigny-Le-Bretonneux France 100.00% 100.00% 100.00% 100.00%
Bouygues E&S SPV Management Montigny-Le-Bretonneux France 100.00% 100.00% 100.00% 100.00%
Bouygues E&S Maintenance Industrielle Feyzin France 100.00% 100.00% 100.00% 100.00%
Marc Favre SAS Valleiry France 100.00% 100.00% 100.00% 100.00%
Thiais Lumière SAS Montigny-Le-Bretonneux France 100.00% 100.00% 100.00% 100.00%
Bouygues Construction | 2016 Financial Report
68/69

Company City Country % interest % control
31/12/2016 31/12/2015 31/12/2016 31/12/2015
∙ Other countries
Axione Gabon SA Libreville Gabon 100.00% – 100.00% –
Bouygues E&S Technics Schweiz (formerly Balestra Galiotto TCC) Grand-Lancy Switzerland 100.00% 100.00% 100.00% 100.00%
Barking & Dagenham Schools Project Ltd London United Kingdom 100.00% 100.00% 100.00% 100.00%
Barnet Hospital Project Ltd London United Kingdom 100.00% 100.00% 100.00% 100.00%
BY Home Ltd London United Kingdom 100.00% 100.00% 100.00% 100.00%
Lewisham Schools Project Ltd London United Kingdom 100.00% 100.00% 100.00% 100.00%
Mid Essex Hospital Project Ltd London United Kingdom 100.00% 100.00% 100.00% 100.00%
North Middlesex Hospital Project Ltd London United Kingdom 100.00% 100.00% 100.00% 100.00%
Central Middlesex Hospital Project Ltd London United Kingdom 100.00% 100.00% 100.00% 100.00%
Bouygues E&S Infrastructure UK Hatfield United Kingdom 100.00% 100.00% 100.00% 100.00%
Bouygues E&S FM UK London United Kingdom 100.00% 100.00% 100.00% 100.00%
Bouygues E&S Congo Brazzaville Congo – 100.00% – 100.00%
Bouygues E&S Contracting UK East Kilbride Scotland 100.00% 100.00% 100.00% 100.00%
Bouygues E&S Côte d’Ivoire Abidjan Ivory Coast 93.85% 90.17% 93.85% 90.17%
Bouygues E&S FM Canada Vancouver BC Canada 100.00% 100.00% 100.00% 100.00%
Bouygues E&S UK London United Kingdom 100.00% 100.00% 100.00% 100.00%
Europland Ltd London United Kingdom 100.00% 100.00% 100.00% 100.00%
Gastier and its subsidiaries Montreal Canada 85.00% 85.00% 85.00% 85.00%
GIE Lumen Libreville Gabon 63.31% 63.31% 75.00% 75.00%
Icel Maidstone Ltd and its subsidiaries London United Kingdom 100.00% 100.00% 100.00% 100.00%
Bouygues E&S FM Schweiz (formerly Mibag Property FM) Zurich Switzerland 100.00% 100.00% 100.00% 100.00%
Mibag Property Managers AG Zug Switzerland 100.00% 100.00% 100.00% 100.00%
Mindful Experience Inc. Toronto Canada 43.35% 43.35% 51.00% 51.00%
Peterborough Schools Project Ltd London United Kingdom 100.00% 100.00% 100.00% 100.00%
Plan Group Inc. and its subsidiaries Toronto Canada 85.00% 85.00% 85.00% 85.00%
Bouygues E&S Gabon Libreville Gabon 84.42% 84.42% 84.42% 84.42%
West Middlesex Hospital Project Ltd London United Kingdom 100.00% 100.00% 100.00% 100.00%
Abakus Byes Solar UK Hatfield United Kingdom 100.00% – 100.00% –
Bouygues E&S Japan Tokyo Japan 100.00% – 100.00% –
JOINT OPERATIONS
1 - Bouygues Bâtiment Île-de-France
Chrysalis Developpement SAS Paris France 65.00% 65.00% 65.00% 65.00%
2 - Entreprises France-Europe subsidiaries
XXL Marseille SNC Marseille France 50.00% – 50.00% –
3 - Bouygues Bâtiment International
Byma PTE Singapore Singapore 60.00% 60.00% 60.00% 60.00%
Byma Myanmar Ltd Rangoon Myanmar 60.00% 60.00% 60.00% 60.00%
CMBI SNC Antananarivo Madagascar 50.00% – 50.00% –
4 - Bouygues Travaux Publics
Bombela Civils JV Ltd Johannesburg South Africa 45.00% 45.00% 45.00% 45.00%
Société pour la réalisation du Port de Tanger Méditerranée Tangier Morocco 66.67% 66.67% 66.67% 66.67%
TMBYS SAS Guyancourt France 66.67% 66.67% 66.67% 66.67%
Oc’via Maintenance SAS Guyancourt France 49.00% 49.00% 49.00% 49.00%
GIE Oc’via Construction Nîmes France 49.00% 49.00% 49.00% 49.00%
GIE L2 Construction Marseille France 56.50% 56.50% 56.50% 56.50%
GIE Constructeurs CSO Vichy Lyon France 66.00% 66.00% 66.00% 66.00%
GIE Compagnie Maritime du Littoral Rueil-Malmaison France 33.00% – 33.00% –
GIE Prefa Réunion Le Port Reunion Island 33.00% 33.00% 33.00% 33.00%
GIE Viaduc du Littoral Le Port Reunion Island 33.00% 33.00% 33.00% 33.00%
KAS 1 Limited Saint Helier Jersey 49.90% 49.90% 49.90% 49.90%
68/69
Management report Consolidated financial statements Notes to the consolidated financial statements Statutory auditors’ report Parent company financial statements

Company City Country % interest % control
31/12/2016 31/12/2015 31/12/2016 31/12/2015
5 - Bouygues Energies & Services
Themis FM SAS Versailles France 50.00% 50.00% 50.00% 50.00%
Evesa SAS Paris France 33.00% 33.00% 33.00% 33.00%
Plessentiel GIE Guyancourt France 28.50% 28.50% 28.50% 28.50%
Plessentiel SAS Guyancourt France 28.50% 28.50% 28.50% 28.50%
JOINT VENTURES AND ASSOCIATES
1 - Bouygues Construction
Consortium Stade de France SA Saint-Denis France 33.33% 33.33% 33.33% 33.33%
2 - Entreprises France-Europe subsidiaries
Europerfil L’hospitalet de Llobregat Spain – 50.00% – 50.00%
3 - Bouygues Bâtiment International
Anfab21 SAS Casablanca Morocco 15.00% 15.00% 15.00% 15.00%
Bouygues Construction Qatar LLC Doha Qatar 49.00% 49.00% 49.00% 49.00%
Hermes Airports Ltd Nicosia Cyprus 22.00% 22.00% 22.00% 22.00%
Zaic A Limited Leeds United Kingdom 20.77% 20.77% 20.77% 20.77%
Bedford Riverside Regeneration Bedford United Kingdom 50.00% 50.00% 50.00% 50.00%
4 - Bouygues Travaux Publics
Adelac SAS Archamps France – 39.20% – 39.20%
Bina Fincom Zagreb Croatia 45.00% 45.00% 45.00% 45.00%
Bombela TKC JV PTY Ltd Johannesburg South Africa 25.00% 25.00% 25.00% 25.00%
TransJamaican Highway Limited Kingston Jamaica 48.89% 48.89% 48.89% 48.89%
Warnowquerung Rostock Germany 30.00% 30.00% 30.00% 30.00%
5 - VSL
GPN2 Rueil-Malmaison France 48.00% 48.00% 48.00% 48.00%
VSL Corée Seoul South Korea – 31.82% – 31.82%
VSL Japon Tokyo Japan 25.00% 25.00% 25.00% 25.00%
VSL Sistemas Especiales de Construction Santiago Chile 50.00% 50.00% 50.00% 50.00%
6 - Bouygues Energies & Services
Abakus BYES Solar UK Hatfield United Kingdom – 51.00% – 51.00%
Betron Ottawa Canada 42.50% 42.50% 50.00% 50.00%
A complete list of companies included in the consolidation is available from the Bouygues SA Investor Relations Department.
Bouygues Construction | 2016 Financial Report
70/71

Statutory auditors’ report on the consolidated financial statementsTo the Shareholders,
In compliance with the assignment entrusted to us by your annual general meetings, we hereby report to you, for the year ended 31 December 2016 on:• the audit of the accompanying consolidated financial statements of Bouygues Construction;• the justification of our assessments;• the specific verification required by law.
These consolidated financial statements have been approved by the board. Our role is to express an opinion on these consolidated financial statements based on our audit.
I. Opinion on the consolidated financial statements
We conducted our audit in accordance with professional standards applicable in France; those standards require that we plan and perform the audit to obtain reasonable assurance about whether the consolidated financial statements are free of material misstatement. An audit involves performing procedures, using sampling techniques or other methods of selection, to obtain audit evidence about the amounts and disclosures in the consolidated financial statements. An audit also includes evaluating the appropriateness of accounting policies used and the reasonableness of accounting estimates made, as well as the overall presentation of the consolidated financial statements. We believe that the audit evidence we have obtained is sufficient and appropriate to provide a basis for our audit opinion.
In our opinion, the consolidated financial statements give a true and fair view of the assets and liabilities and of the financial position of the Group as at 31 December 2016 and of the results of its operations for the year then ended in accordance with International Financial Reporting Standards as adopted by the European Union.
II. Justification of our assessments
In accordance with the requirements of article L. 823-9 of the French commercial code (Code de commerce) relating to the justification of our assessments, we bring to your attention the following matters:• Current and non-current provisions appearing in the balance sheet were assessed in accordance with methods and accounting principles
described in Note 2.2.2: "Liabilities and shareholders' equity" to the consolidated financial statements. In light of the available information, our assessment of these provisions was based primarily on analysis of the processes implemented by management to identify and evaluate risks.
• As stated in Note 2.2.3 to the consolidated financial statements, the Group accounts for construction contracts using the percentage of completion method, which results in year-end margin being measured on the basis of the latest estimate of the total margin of the contract. Our work consisted mainly in assessing the appropriateness of the assumptions taken and of the recognized margin.
These assessments were made as part of our audit of the consolidated financial statements taken as a whole, and therefore contributed to the opinion we formed which is expressed in the first part of this report.
III. Specific verification
As required by law we have also verified in accordance with professional standards applicable in France the information presented in the Group’s management report.
We have no matters to report as to its fair presentation and its consistency with the consolidated financial statements.
Paris-La Défense, March 24th, 2016The statutory auditors
MAZARS ERNST & YOUNG AuditJulien Marin-Pache Guillaume Potel Laurent Vitse
70/71
Management report Consolidated financial statements Notes to the consolidated financial statements Statutory auditors’ report Parent company financial statements

Parent company financial statementsBouygues Construction SA: balance sheet at 31 December 2016
Assets(€ million)
31/12/2016 31/12/2015
Gross Amortisation,depreciation
& impairment
Net Net
Intangible assets 77 60 18 22
Property, plant and equipment 27 16 11 12
Long-term investments:
∙ Holdings in subsidiaries and affiliates 666 28 638 646
∙ Other 427 0 427 432
Sub-total 1,093 28 1,065 1,078
Non-current assets 1,197 103 1,094 1,111
Inventories and work in progress 0 0 0 0
Advances and down-payments made on orders 0 0 0 0
Trade receivables 17 0 17 20
Other receivables 262 14 247 307
Short-term investments 0 0 0 0
Cash 2,148 0 2,148 2,317
Current assets 2,427 14 2,412 2,643
Other assets 88 0 88 103
Total assets 3,712 118 3,595 3,858
Bouygues Construction | 2016 Financial Report
72/73

Liabilities and equity(€ million)
31/12/2016 31/12/2015
Share capital 128 128
Share premium 15 15
Revaluation reserves 0 0
Other reserves 13 13
Retained earnings (15) 236
Net profit for the year 371 249
Investment grants 0 0
Restricted provisions 0 0
Shareholders’ equity 512 640
Other forms of equity 0 0
Provisions 44 48
Debt 561 556
Advances and down-payments received on orders 0 0
Trade payables 32 25
Other payables 61 68
Non-financial liabilities 93 92
Overdrafts and short-term bank borrowings 2,318 2,441
Accruals and deferred income 66 81
Total liabilities and shareholders’ equity 3,595 3,858
72/73
Management report Consolidated financial statements Notes to the consolidated financial statements Statutory auditors’ report Parent company financial statements

Bouygues Construction SA: income statement for the year ended 31 December 2016
(€ million) 2016 2015
Sales 178 174
Other operating revenue 2 2
Purchases and changes in inventory 0 0
Taxes other than income tax (4) (3)
Personnel costs (65) (61)
Other operating expenses (106) (105)
Depreciation, amortisation, impairment & provisions, net (8) (8)
Profits/(losses) from shared operations 2 1
Operating profit/(loss) (1) (0)
Financial income and expenses 377 251
Pre-tax profit on ordinary activities 376 250
Exceptional items 0 0
Employee profit-sharing 0 0
Income tax expense (5) (2)
Net profit for the year 371 249
Bouygues Construction | 2016 Financial Report
74/75

Bouygues Construction SA: cash flow statement for the year ended 31 December 2016
(€ million) 2016 2015
A - OPERATING ACTIVITIES
Cash flow
∙ Net profit for the year 371 249
∙ Depreciation and amortisation 8 9
∙ Net change in impairment and provisions (1) 4 7
∙ Net gains on asset disposals and other items (2) 0 0
Sub-total 383 265
Change in working capital:
∙ Current assets, other assets, accruals and deferred income 78 (80)
∙ Net advances and down-payments received, non-financial liabilities & other items (13) 44
Net cash generated by/(used in) operating activities 448 229
B - INVESTING ACTIVITIES
Increases in non-current assets:
∙ Acquisitions of intangible assets and property, plant & equipment (4) (3)
∙ Acquisitions of holdings in subsidiaries and affiliates 0 (6)
Sub-total (4) (10)
Disposals of non-current assets:
∙ Disposals of intangible assets and property, plant & equipment 0 0
∙ Disposals of holdings in subsidiaries and affiliates 0 0
Other financial investments, net (8) (24)
Amounts receivable in respect of non-current assets, net 0 0
Net cash generated by/(used in) investing activities (11) (34)
C - FINANCING ACTIVITIES
Increase in shareholders’ equity 0 0
Dividends paid during the year (500) (253)
Change in net debt 18 16
Net cash generated by/(used in) financing activities (482) (237)
Change in net cash position (A+B+C) (45) (42)
Net cash position at 1 January (3) (124) (82)
Net cash flows during the year, excluding transfers between accounts (45) (42)
Impact of transfers between accounts – –
Net cash position at end of period (3) (169) (124)
(1) Excluding impairment of current assets.(2) Net of corporate income tax.(3) Cash + Short-term investments - Overdrafts and short-term bank borrowings.
74/75
Management report Consolidated financial statements Notes to the consolidated financial statements Statutory auditors’ report Parent company financial statements
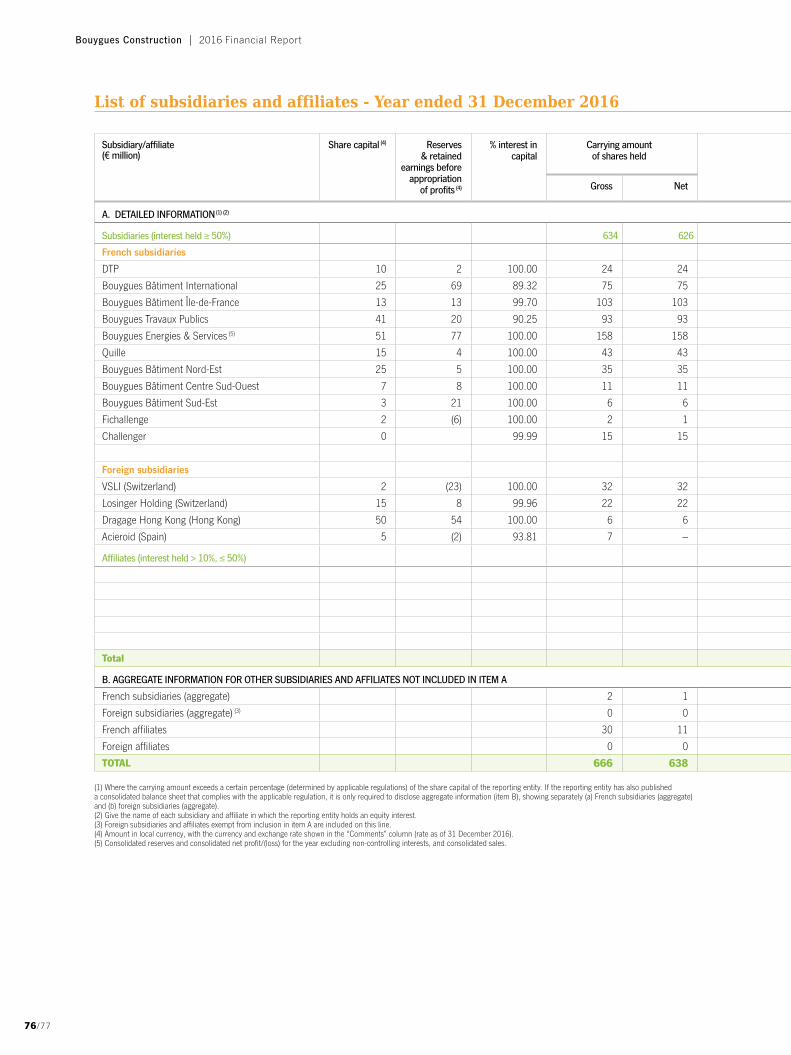
List of subsidiaries and affiliates - Year ended 31 December 2016
Subsidiary/affiliate (€ million)
Share capital (4) Reserves & retained
earnings before appropriation
of profits (4)
% interest in capital
Carrying amount of shares held
Loans & advances
receivable by the parent
Guarantees given by the
parent
Sales for last financial year
Net profit/(loss) for last financial
year
Dividends received by the
parent during the year
Comments
Gross Net
A. DETAILED INFORMATION (1) (2)
Subsidiaries (interest held ≥ 50%) 634 626 669 180
French subsidiaries
DTP 10 2 100.00 24 24 38 8
Bouygues Bâtiment International 25 69 89.32 75 75 134 97 523 33
Bouygues Bâtiment Île-de-France 13 13 99.70 103 103 0 1,733 44 28
Bouygues Travaux Publics 41 20 90.25 93 93 44 49 924 215 195
Bouygues Energies & Services (5) 51 77 100.00 158 158 261 26 2,331 23 41
Quille 15 4 100.00 43 43 4 36 43
Bouygues Bâtiment Nord-Est 25 5 100.00 35 35 0 316 13 7
Bouygues Bâtiment Centre Sud-Ouest 7 8 100.00 11 11 0 9 202 8 12
Bouygues Bâtiment Sud-Est 3 21 100.00 6 6 0 413 14 13
Fichallenge 2 (6) 100.00 2 1 – (1)
Challenger 0 99.99 15 15 18 2
Foreign subsidiaries
VSLI (Switzerland) 2 (23) 100.00 32 32 87 25 17 CHF 1 = €0.931185
Losinger Holding (Switzerland) 15 8 99.96 22 22 0 – 51 49 CHF 1 = €0.931185
Dragage Hong Kong (Hong Kong) 50 54 100.00 6 6 132 254 5 HKD 1 = €0.122323
Acieroid (Spain) 5 (2) 93.81 7 – 9 36 (11)
Affiliates (interest held > 10%, ≤ 50%)
Total
B. AGGREGATE INFORMATION FOR OTHER SUBSIDIARIES AND AFFILIATES NOT INCLUDED IN ITEM A
French subsidiaries (aggregate) 2 1 8 7
Foreign subsidiaries (aggregate) (3) 0 0 0
French affiliates 30 11 0
Foreign affiliates 0 0 0
TOTAL 666 638 678
(1) Where the carrying amount exceeds a certain percentage (determined by applicable regulations) of the share capital of the reporting entity. If the reporting entity has also published a consolidated balance sheet that complies with the applicable regulation, it is only required to disclose aggregate information (item B), showing separately (a) French subsidiaries (aggregate) and (b) foreign subsidiaries (aggregate).(2) Give the name of each subsidiary and affiliate in which the reporting entity holds an equity interest.(3) Foreign subsidiaries and affiliates exempt from inclusion in item A are included on this line.(4) Amount in local currency, with the currency and exchange rate shown in the “Comments" column (rate as of 31 December 2016).(5) Consolidated reserves and consolidated net profit/(loss) for the year excluding non-controlling interests, and consolidated sales.
Bouygues Construction | 2016 Financial Report
76/77

List of subsidiaries and affiliates - Year ended 31 December 2016
Subsidiary/affiliate (€ million)
Share capital (4) Reserves & retained
earnings before appropriation
of profits (4)
% interest in capital
Carrying amount of shares held
Loans & advances
receivable by the parent
Guarantees given by the
parent
Sales for last financial year
Net profit/(loss) for last financial
year
Dividends received by the
parent during the year
Comments
Gross Net
A. DETAILED INFORMATION (1) (2)
Subsidiaries (interest held ≥ 50%) 634 626 669 180
French subsidiaries
DTP 10 2 100.00 24 24 38 8
Bouygues Bâtiment International 25 69 89.32 75 75 134 97 523 33
Bouygues Bâtiment Île-de-France 13 13 99.70 103 103 0 1,733 44 28
Bouygues Travaux Publics 41 20 90.25 93 93 44 49 924 215 195
Bouygues Energies & Services (5) 51 77 100.00 158 158 261 26 2,331 23 41
Quille 15 4 100.00 43 43 4 36 43
Bouygues Bâtiment Nord-Est 25 5 100.00 35 35 0 316 13 7
Bouygues Bâtiment Centre Sud-Ouest 7 8 100.00 11 11 0 9 202 8 12
Bouygues Bâtiment Sud-Est 3 21 100.00 6 6 0 413 14 13
Fichallenge 2 (6) 100.00 2 1 – (1)
Challenger 0 99.99 15 15 18 2
Foreign subsidiaries
VSLI (Switzerland) 2 (23) 100.00 32 32 87 25 17 CHF 1 = €0.931185
Losinger Holding (Switzerland) 15 8 99.96 22 22 0 – 51 49 CHF 1 = €0.931185
Dragage Hong Kong (Hong Kong) 50 54 100.00 6 6 132 254 5 HKD 1 = €0.122323
Acieroid (Spain) 5 (2) 93.81 7 – 9 36 (11)
Affiliates (interest held > 10%, ≤ 50%)
Total
B. AGGREGATE INFORMATION FOR OTHER SUBSIDIARIES AND AFFILIATES NOT INCLUDED IN ITEM A
French subsidiaries (aggregate) 2 1 8 7
Foreign subsidiaries (aggregate) (3) 0 0 0
French affiliates 30 11 0
Foreign affiliates 0 0 0
TOTAL 666 638 678
(1) Where the carrying amount exceeds a certain percentage (determined by applicable regulations) of the share capital of the reporting entity. If the reporting entity has also published a consolidated balance sheet that complies with the applicable regulation, it is only required to disclose aggregate information (item B), showing separately (a) French subsidiaries (aggregate) and (b) foreign subsidiaries (aggregate).(2) Give the name of each subsidiary and affiliate in which the reporting entity holds an equity interest.(3) Foreign subsidiaries and affiliates exempt from inclusion in item A are included on this line.(4) Amount in local currency, with the currency and exchange rate shown in the “Comments" column (rate as of 31 December 2016).(5) Consolidated reserves and consolidated net profit/(loss) for the year excluding non-controlling interests, and consolidated sales.
76/77
Management report Consolidated financial statements Notes to the consolidated financial statements Statutory auditors’ report Parent company financial statements

Bouygues Construction Corporate Communications department. Design and production: April 2017. The French or English versions of the 2016 Financial report can be downloaded from www.bouygues-construction.com


Bouygues Construction1, avenue Eugène Freyssinet Guyancourt78065 Saint-Quentin-en-Yvelines Cedex
Tel: +33 (0)1 30 60 33 00
www.bouygues-construction.com • blog.bouygues-construction.comtwitter.com/bouygues_c • youtube.com/bouyguesconstruction


