Financial Results for Fiscal Year Ending March 31, 2018 This is an English translation of Japanese presentation materials prepared in connection with the disclosure of the financial results of Monex Group, Inc. It includes information derived from the consolidated financial statements of Monex Group, Inc. which are prepared in accordance with International Financial Reporting Standards (“IFRSs”). This material is not intended to recommend or conduct solicitation for any product or service, etc. <Forward-looking Statements> This presentation material contains forward-looking statements that are based on our current expectations, assumptions, estimates and projections about our industry and us. These forward-looking statements are subject to various risks and uncertainties. Generally, these forward-looking statements can be identified by the use of terms such as "may" "will" "expect" "anticipate" "estimate" "plan" and other similar words. These statements discuss future expectations, identify strategies, contain projections of results of operations or of our financial condition and state other "forward-looking" information. Our operations are subject to risks, uncertainties and other factors that could cause our actual results to differ materially from those contained in any forward-looking statement. April 26, 2018 (TSE 1st Section: 8698)
Transcript
Financial Results for Fiscal Year Ending March 31, 2018
This is an English translation of Japanese presentation materials prepared in connection with the disclosure of the financial results of Monex Group, Inc. It includes information derived from the consolidated financial statements of Monex Group, Inc. which are prepared in accordance with International Financial Reporting Standards (“IFRSs”). This material is not intended to recommend or conduct solicitation for any product or service, etc.
<Forward-looking Statements> This presentation material contains forward-looking statements that are based on our current expectations, assumptions, estimates and projections about our industry and us. These forward-looking statements are subject to various risks and uncertainties. Generally, these forward-looking statements can be identified by the use of terms such as "may" "will" "expect" "anticipate" "estimate" "plan" and other similar words. These statements discuss future expectations, identify strategies, contain projections of results of operations or of our financial condition and state other "forward-looking" information. Our operations are subject to risks, uncertainties and other factors that could cause our actual results to differ materially from those contained in any forward-looking statement.
April 26, 2018 (TSE 1st Section: 8698)
Our Business Principles
Always a step ahead of the “Y” in "MONEY," our name MONEX symbolizes our position as a forerunner in finance. In the face of an ever-changing future, the Monex Group utilizes state-of-the-art IT technologies and world-class financial expertise to design innovative ways of managing money and to redefine finance for a new era. We will strive to support everyone’s investment and economic needs.
To achieve this we are committed to: - Celebrating the diversity of each and every one of our customers and employees; - Driving the future of technology and first class financial professionalism that
empowers traders and investors; and - Creating new value to contribute to all stakeholders
1
Table of Contents
Our Business Principles p. 1 Table of Contents p. 2
I. Highlights p.3 - p.13 II. Consolidated Performance p.14 - p.28 III. Business Update p.29 - p.35 IV. Mid- & Long-Term Initiatives p.36 - p.39 Appendix: Group Overview
p.40 -
p.49
2
I. Highlights II. Consolidated Performance III. Business Update IV. Mid- & Long-Term Initiatives
Appendix. Group Overview
3
4
Business Overview 1/3
Monex Group
Japan US Asia-
Pacific Crypto-Asset
Business
EBITDA* ¥14.4B in FYE 2018
(+114% vs FYE 2017)
Monex, Inc. Net operating income:
¥5.4B in FYE 2018
Monex Ventures, Inc. Net operating income:
¥2.7B in FYE 2018
EBITDA* ¥100M in FYE 2018
Online securities: Monex Boom
Securities (H.K.) Ltd. in Hong Kong
Monex Securities Australia Pty Ltd
in Australia
In addition to our “Sum of the Parts” corporate value, we aim to further increase corporate value through cross-segment collaboration
EBITDA* ¥2.9B in FYE 2018,
¥4.8B if 4Q is annualized
TradeStation Group, Inc. Record high active
accounts (4Q). Assets in custody: $5.2B
at the end of FYE Mar. 2018 Profitability has stabilized and if interest rates continue to go up, net interest income will increase, further raising profits
Coincheck, Inc. New member of Monex Group
since April 2018
*Refer to P6 for actual in FYE 2018
Focus on enhancing governance and
internal control with the aim to register
as a cryptocurrency exchange
* EBITDA=The amount equivalent to operating income + amortization and depreciation
5
Business Overview 2/3
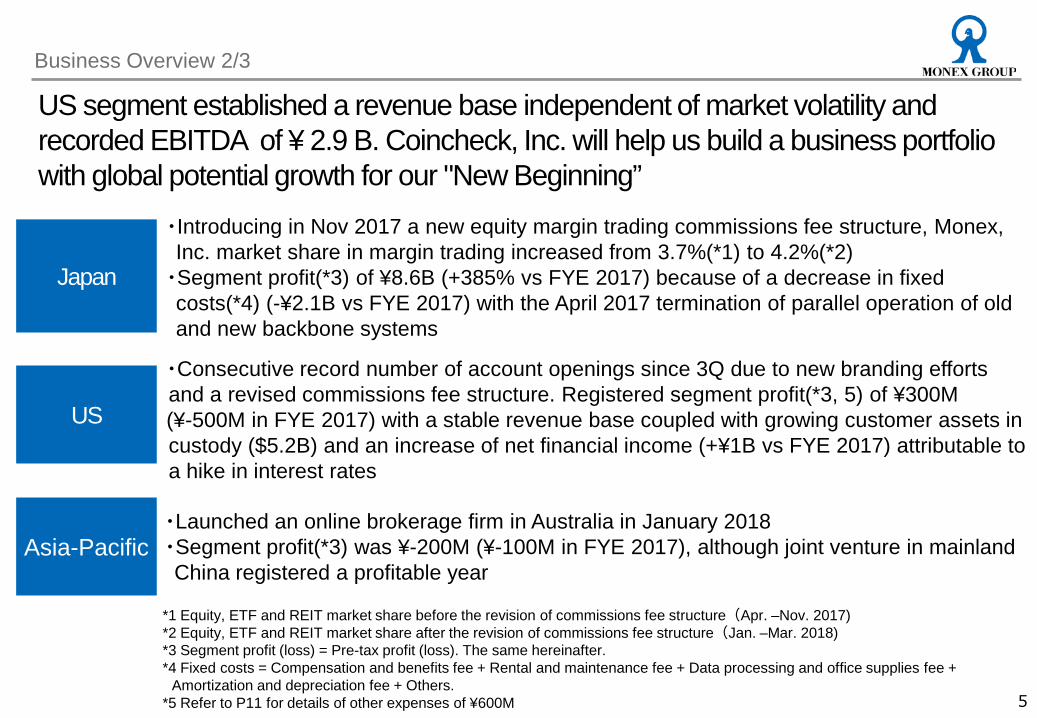
・Introducing in Nov 2017 a new equity margin trading commissions fee structure, Monex, Inc. market share in margin trading increased from 3.7%(*1) to 4.2%(*2)
・Segment profit(*3) of ¥8.6B (+385% vs FYE 2017) because of a decrease in fixed costs(*4) (-¥2.1B vs FYE 2017) with the April 2017 termination of parallel operation of old and new backbone systems
*1 Equity, ETF and REIT market share before the revision of commissions fee structure(Apr. –Nov. 2017) *2 Equity, ETF and REIT market share after the revision of commissions fee structure(Jan. –Mar. 2018) *3 Segment profit (loss) = Pre-tax profit (loss). The same hereinafter. *4 Fixed costs = Compensation and benefits fee + Rental and maintenance fee + Data processing and office supplies fee +
Amortization and depreciation fee + Others. *5 Refer to P11 for details of other expenses of ¥600M
・Launched an online brokerage firm in Australia in January 2018 ・Segment profit(*3) was ¥-200M (¥-100M in FYE 2017), although joint venture in mainland China registered a profitable year
Japan
US
・Consecutive record number of account openings since 3Q due to new branding efforts and a revised commissions fee structure. Registered segment profit(*3, 5) of ¥300M (¥-500M in FYE 2017) with a stable revenue base coupled with growing customer assets in custody ($5.2B) and an increase of net financial income (+¥1B vs FYE 2017) attributable to a hike in interest rates
Asia-Pacific
US segment established a revenue base independent of market volatility and recorded EBITDA of ¥ 2.9 B. Coincheck, Inc. will help us build a business portfolio with global potential growth for our "New Beginning”
【Reference】 Financial performance during the two months when service was suspended and then partially resumed (Forecast) (Billion yen)
6
Business Overview 3/3
FYE 2018 (12 months)
Sales (Netting) * 62.6
Selling, general and administrative expenses 8.8
Operating income 53.7
Profit before income taxes 6.3
→ Operating income was positive even during the period when service was suspended and then partially resumed
* Netting revenue from sales and cost of cryptocurrency sold
Coincheck, Inc. joined Monex Group as a wholly owned subsidiary on April 16, 2018
Crypto- Asset
Business
Feb. – Mar. 2018 (2 months)
Sales (Netting) * 2.0
Selling, general and administrative expenses 1.5
Operating income 0.5
Financial performance of Coincheck, Inc. in FYE 2018 (Forecast) (Billion yen)
Extraordinary loss ¥47.3 billion
7
Revision of Shareholder Distribution Policy
■Reason for the change
Return total return ratio to 75% on a multi-year basis in FYE March 2019
・ Since Coincheck, Inc. joined Monex Group in April 2018, we expect to make further investment for future growth of our group. For this and other reasons, the assumptions behind calculating shareholders’ return have changed since the previous revision in January 2018 and the Company decided to return the total return ratio to 75% on a multi-year basis
・ Total shareholders return ratio of 75% is a combination of dividends and share buybacks. The lower limit of dividends is 2% DOE (dividend on equity) annually
■Points of the revision Original(until FYE March. 2018) Revised(From FYE Mar. 2019)
The Company aims to provide returns to its shareholders based on the business performance, while securing investment capacity for growth, and targets at a 100% total return ratio* on a single-year basis from the fiscal year ending March 31, 2018 to the fiscal year ending March 31, 2021.
The Company aims to provide returns to its shareholders based on the business performance, while securing investment capacity for growth, and targets at a 75% total return ratio* on a multi-year basis.
8
Highlights FYE Mar. 2018 (12 months) 1/3
Japan
US
Asia-Pacific
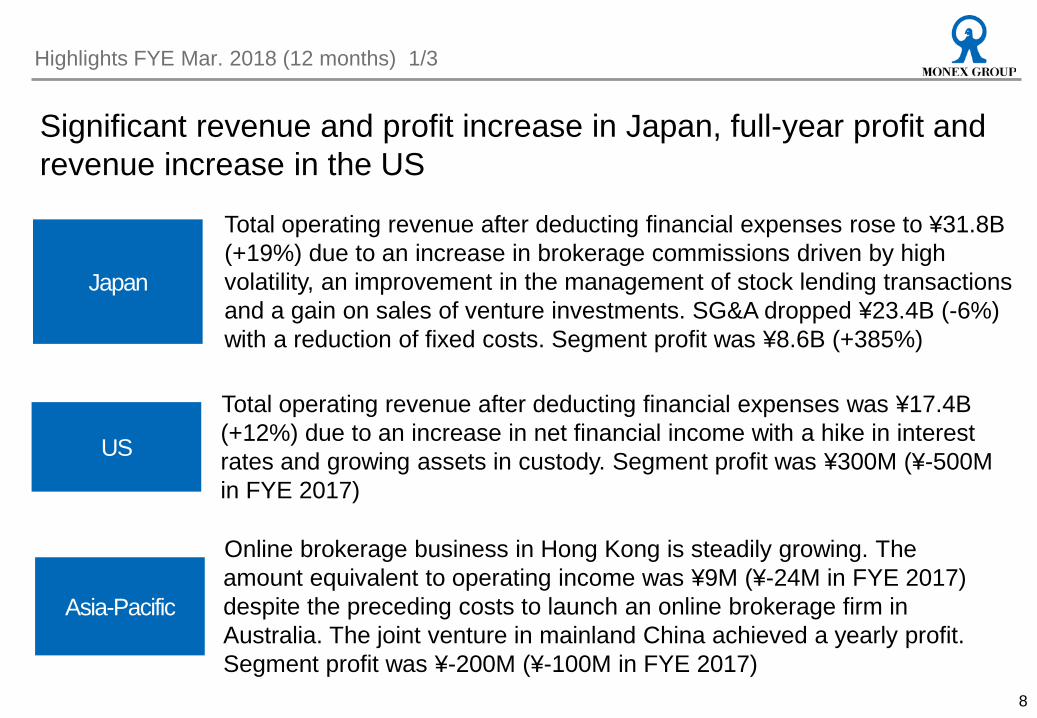
Total operating revenue after deducting financial expenses rose to ¥31.8B (+19%) due to an increase in brokerage commissions driven by high volatility, an improvement in the management of stock lending transactions and a gain on sales of venture investments. SG&A dropped ¥23.4B (-6%) with a reduction of fixed costs. Segment profit was ¥8.6B (+385%)
Total operating revenue after deducting financial expenses was ¥17.4B (+12%) due to an increase in net financial income with a hike in interest rates and growing assets in custody. Segment profit was ¥300M (¥-500M in FYE 2017)
Online brokerage business in Hong Kong is steadily growing. The amount equivalent to operating income was ¥9M (¥-24M in FYE 2017) despite the preceding costs to launch an online brokerage firm in Australia. The joint venture in mainland China achieved a yearly profit. Segment profit was ¥-200M (¥-100M in FYE 2017)
Significant revenue and profit increase in Japan, full-year profit and revenue increase in the US
50,051 45,209
49,642 41,852
49,155
10,354 3,494 3,554 298
6,730
0
20,000
40,000
60,000
2014/3 2015/3 2016/3 2017/3 2018/3
Total operating revenue after deducting financial expensesProfit attributable to owners of the Company
9
Highlights FYE Mar. 2018 (12 months) 2/3
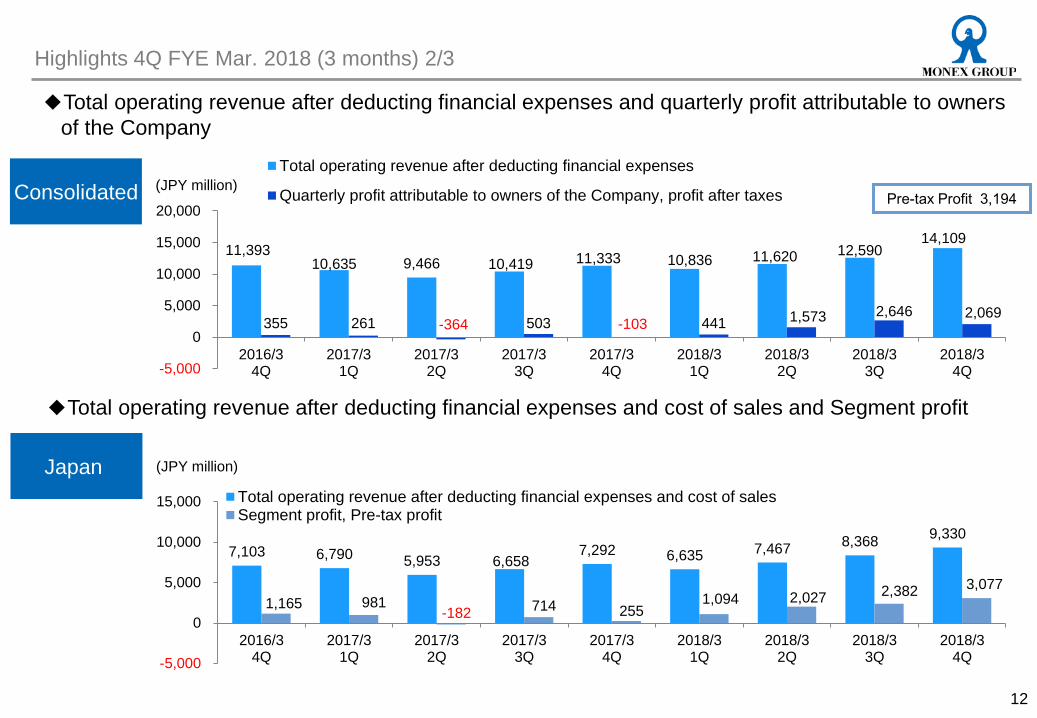
Pre-tax Profit 8,631
(JPY million)
(JPY million) Consolidated
Japan
◆Total operating revenue after deducting financial expenses and quarterly profit attributable to owners of the Company
◆Total operating revenue after deducting financial expenses and cost of sales and Segment profit
36,460 30,410 31,822
26,692 31,799
19,497 10,498
5,887 1,768 8,581
0
20,000
40,000
60,000
2014/3 2015/3 2016/3 2017/3 2018/3
Total operating revenue after deducting financial expenses and cost of salesSegment profit
582 607 830
707 931
-138 -156 -30 -97 -225
-500
-200
100
400
700
1,000
2014/3 2015/3 2016/3 2017/3 2018/3
10
Highlights FYE Mar. 2018 (12 months) 3/3
US
Asia-Pacific
(JPY million)
(JPY million)
◆Total operating revenue after deducting financial expenses and cost of sales and Segment profit
13,243 14,637
18,541 15,616
17,417
-2,388 -4,340 -525 -457 281
-10,000
-5,000
0
5,000
10,000
15,000
20,000
2014/3 2015/3 2016/3 2017/3 2018/3
Total operating revenue after deducting financial expenses and cost of salesSegment profit
11
Highlights 4Q FYE Mar. 2018 (3 months) 1/3
Japan
US
Asia-Pacific
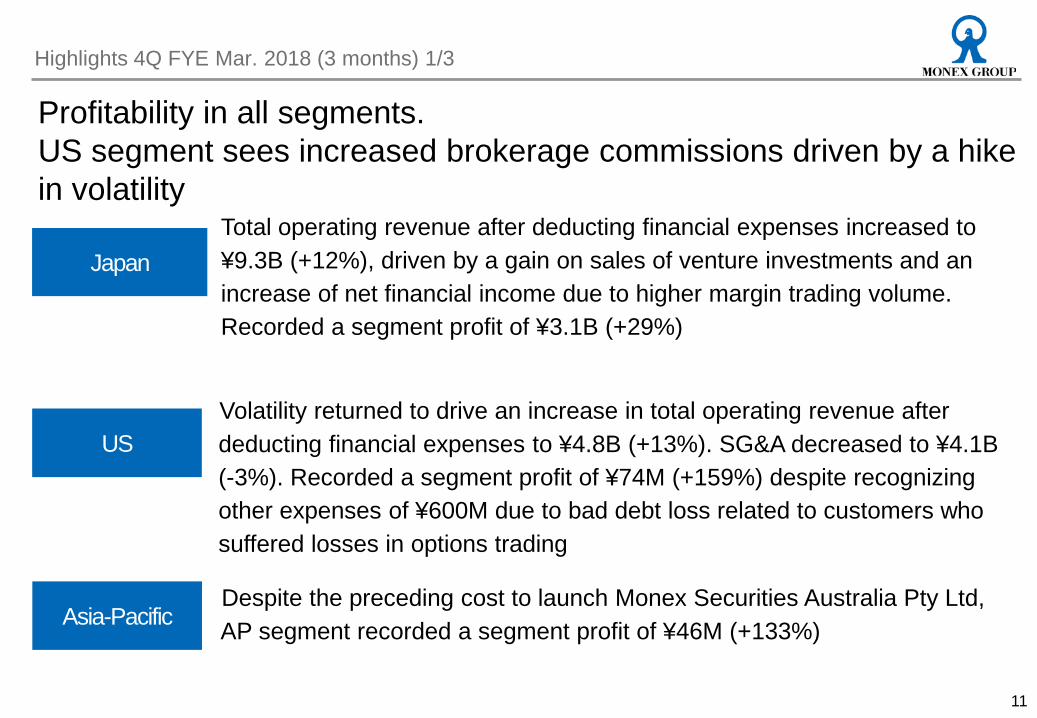
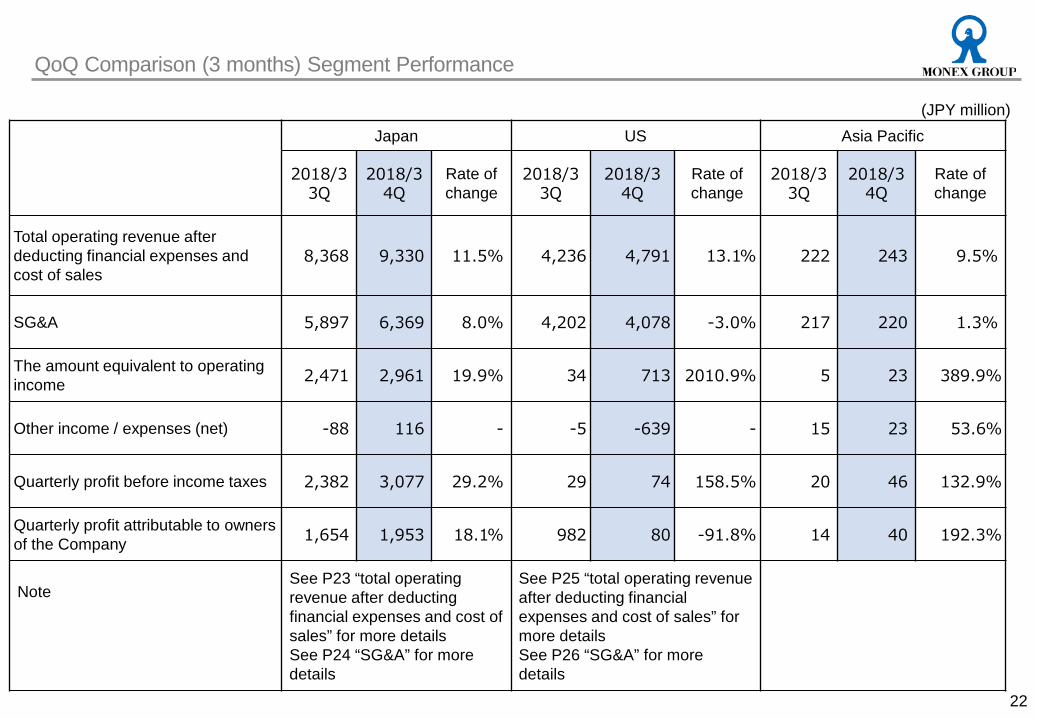
Total operating revenue after deducting financial expenses increased to ¥9.3B (+12%), driven by a gain on sales of venture investments and an increase of net financial income due to higher margin trading volume. Recorded a segment profit of ¥3.1B (+29%)
Volatility returned to drive an increase in total operating revenue after deducting financial expenses to ¥4.8B (+13%). SG&A decreased to ¥4.1B (-3%). Recorded a segment profit of ¥74M (+159%) despite recognizing other expenses of ¥600M due to bad debt loss related to customers who suffered losses in options trading
Despite the preceding cost to launch Monex Securities Australia Pty Ltd, AP segment recorded a segment profit of ¥46M (+133%)
Profitability in all segments. US segment sees increased brokerage commissions driven by a hike in volatility
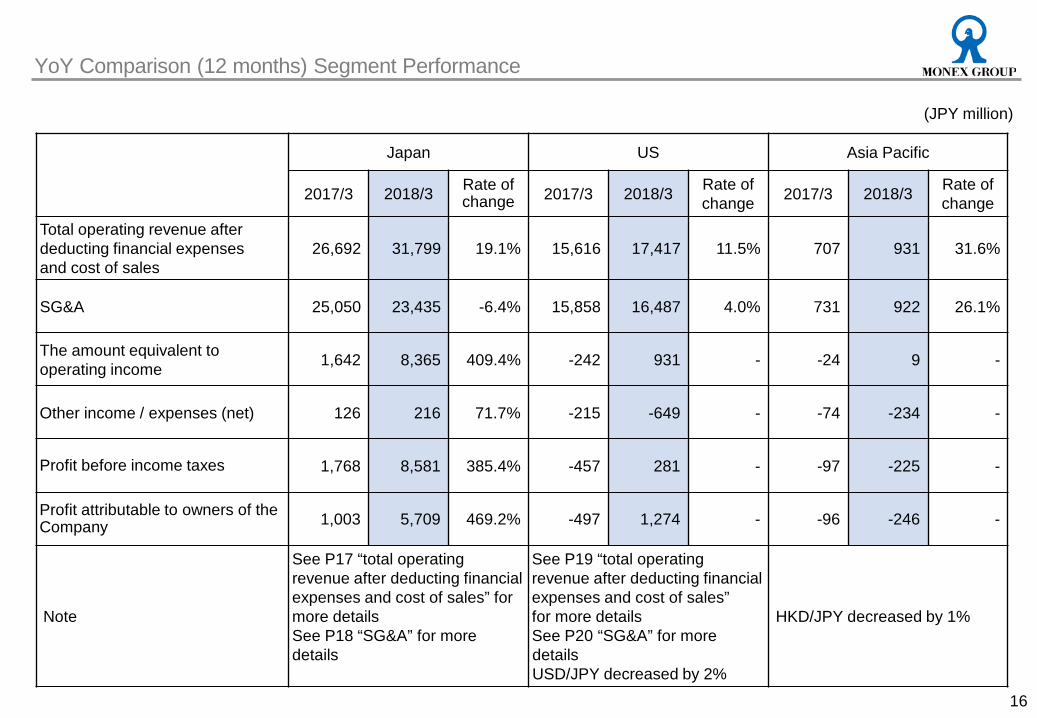
The amount equivalent to operating income 1,642 8,365 409.4% -242 931 - -24 9 -
Other income / expenses (net) 126 216 71.7% -215 -649 - -74 -234 -
Profit before income taxes 1,768 8,581 385.4% -457 281 - -97 -225 -
Profit attributable to owners of the Company 1,003 5,709 469.2% -497 1,274 - -96 -246 -
Note
See P17 “total operating revenue after deducting financial expenses and cost of sales” for more details See P18 “SG&A” for more details
See P19 “total operating revenue after deducting financial expenses and cost of sales” for more details See P20 “SG&A” for more details USD/JPY decreased by 2%
HKD/JPY decreased by 1%
YoY Comparison (12 months) Segment Performance
(JPY million)
12,547 14,082
6,719
10,235 4,643
3,978 2,783
3,505
0
5,000
10,000
15,000
20,000
25,000
30,000
35,000
2017/3 2018/3
17
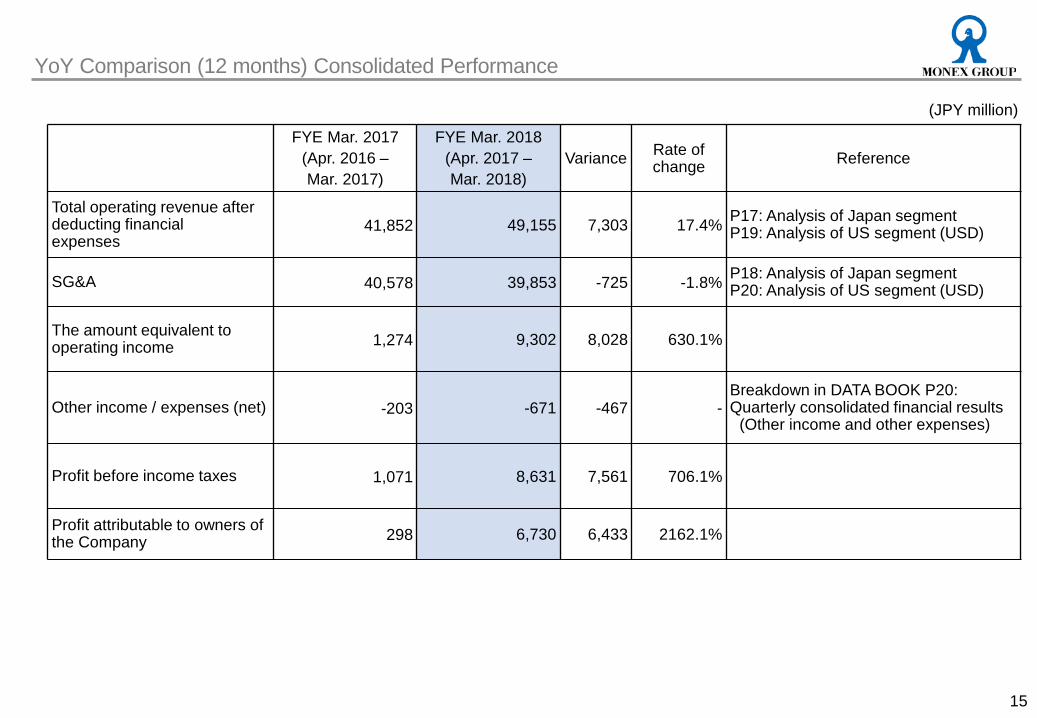
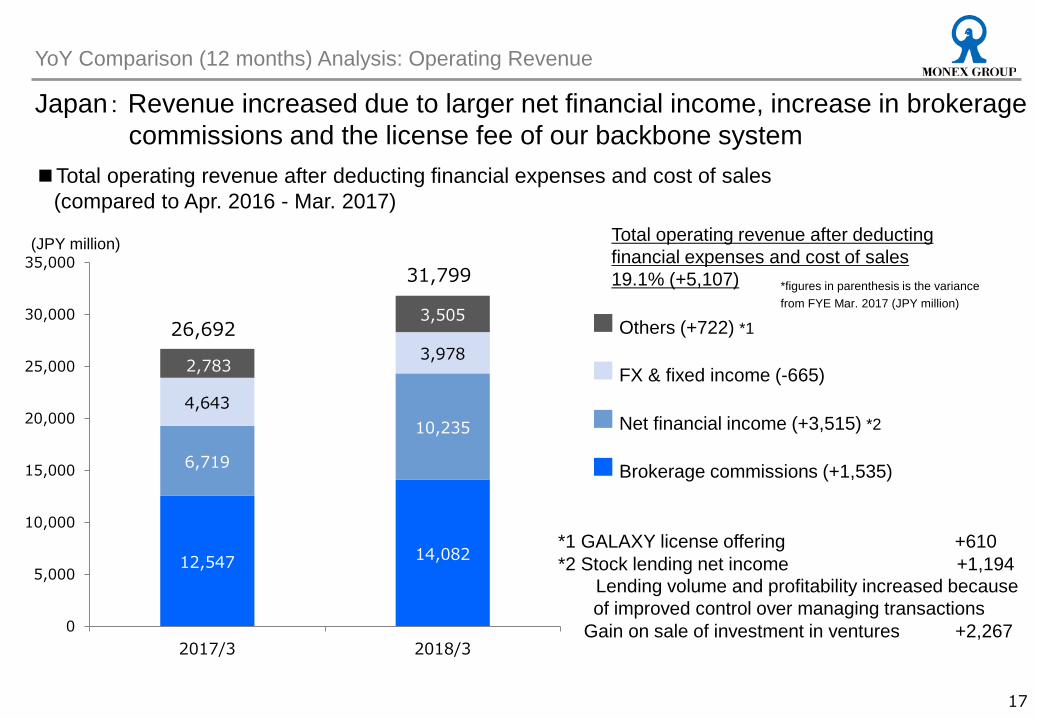
■Total operating revenue after deducting financial expenses and cost of sales (compared to Apr. 2016 - Mar. 2017)
Japan: Revenue increased due to larger net financial income, increase in brokerage commissions and the license fee of our backbone system
Total operating revenue after deducting financial expenses and cost of sales 19.1% (+5,107)
*figures in parenthesis is the variance from FYE Mar. 2017 (JPY million)
(JPY million)
*1 GALAXY license offering +610 *2 Stock lending net income +1,194 Lending volume and profitability increased because
of improved control over managing transactions Gain on sale of investment in ventures +2,267
26,692
31,799
13,895 12,277
4,206 4,029
1,924 2,203
1,780 1,668
1,506 1,784
1,740 1,473
0
5,000
10,000
15,000
20,000
25,000
30,000
2017/3 2018/3
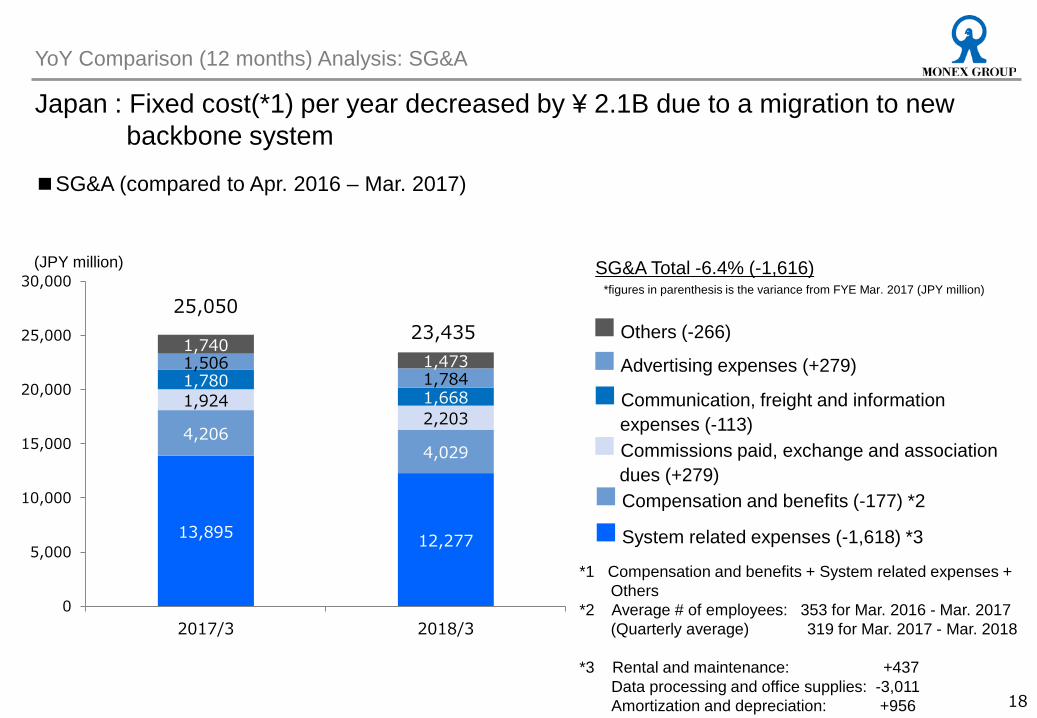
*1 Compensation and benefits + System related expenses + Others *2 Average # of employees: 353 for Mar. 2016 - Mar. 2017 (Quarterly average) 319 for Mar. 2017 - Mar. 2018 *3 Rental and maintenance: +437 Data processing and office supplies: -3,011 Amortization and depreciation: +956 18
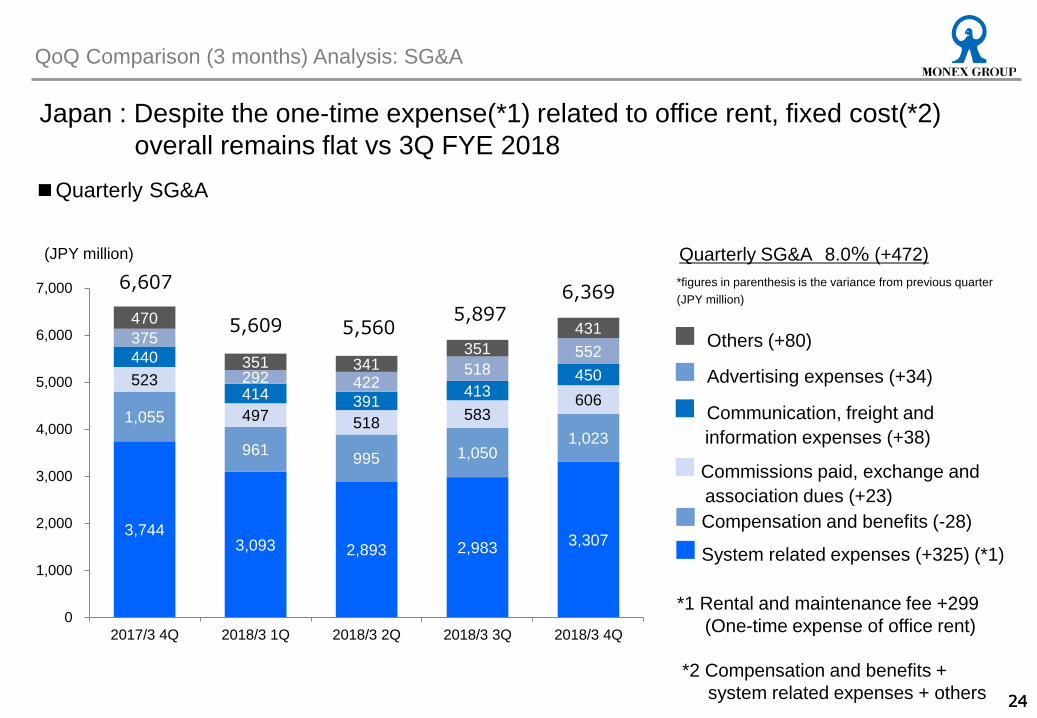
■SG&A (compared to Apr. 2016 – Mar. 2017)
Japan : Fixed cost(*1) per year decreased by ¥ 2.1B due to a migration to new backbone system
YoY Comparison (12 months) Analysis: SG&A
(JPY million)
■System related expenses (-1,618) *3
■Compensation and benefits (-177) *2
■Commissions paid, exchange and association dues (+279)
■Others (-266)
■Communication, freight and information expenses (-113)
■Advertising expenses (+279)
SG&A Total -6.4% (-1,616) *figures in parenthesis is the variance from FYE Mar. 2017 (JPY million)
25,050 23,435
67,808 73,056
31,073 39,821
32,079 34,011
12,701
10,371
0
20,000
40,000
60,000
80,000
100,000
120,000
140,000
160,000
180,000
2017/3 2018/3
19
■ Total operating revenue after deducting financial expenses and cost of sales (compared to Apr. 2016 - Mar. 2017)
US:Increase in net financial income due to higher yields from rate increases on growing client cash balances. Brokerage commissions from options and futures trading increased
Total operating revenue after deducting financial expenses and cost of sales 9.5% (+13,600) *figures in parenthesis is the variance from FYE Mar. 2017 (USD thousand)
■Brokerage Fees (+1,933) *1
143,660 157,260
*1 Payment for Order Flow (the compensation and benefit that a brokerage receives by connecting orders to different parties to be executed) increased +3,155
54,387 58,404
28,318 26,566
16,564 16,008
17,838 18,093 9,102 11,115
19,675 18,673
0
20,000
40,000
60,000
80,000
100,000
120,000
140,000
160,000
2017/3 2018/3
(USD thousand)
20
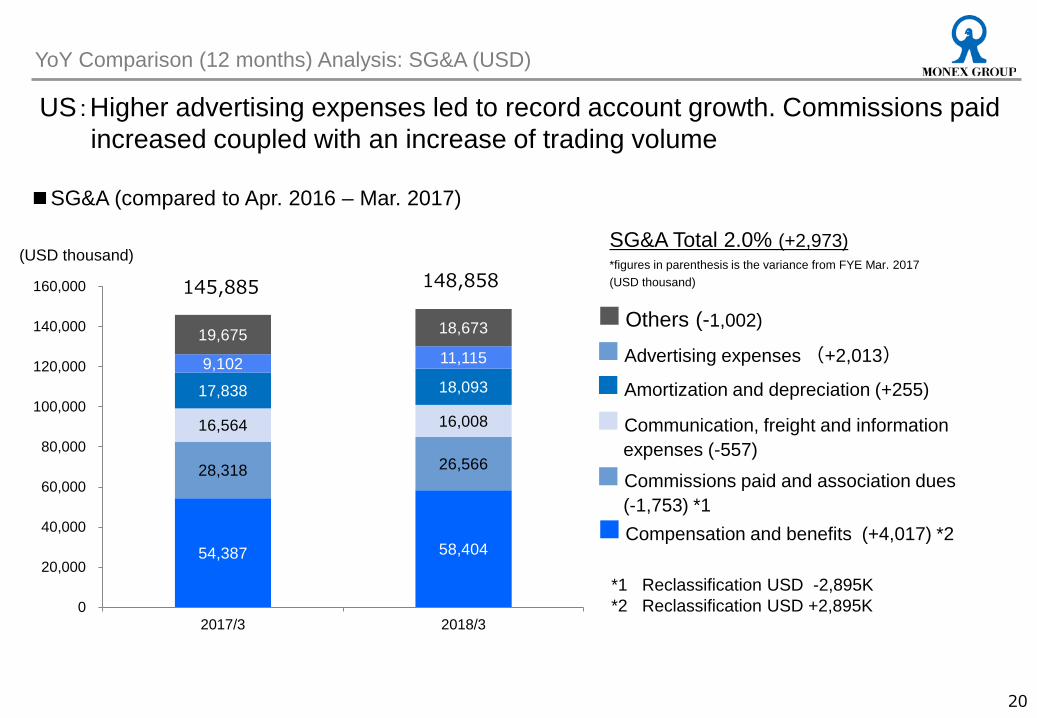
■SG&A (compared to Apr. 2016 – Mar. 2017)
YoY Comparison (12 months) Analysis: SG&A (USD)
US:Higher advertising expenses led to record account growth. Commissions paid increased coupled with an increase of trading volume
*figures in parenthesis is the variance from FYE Mar. 2017 (USD thousand)
■Compensation and benefits (+4,017) *2
■Commissions paid and association dues (-1,753) *1
■Communication, freight and information expenses (-557)
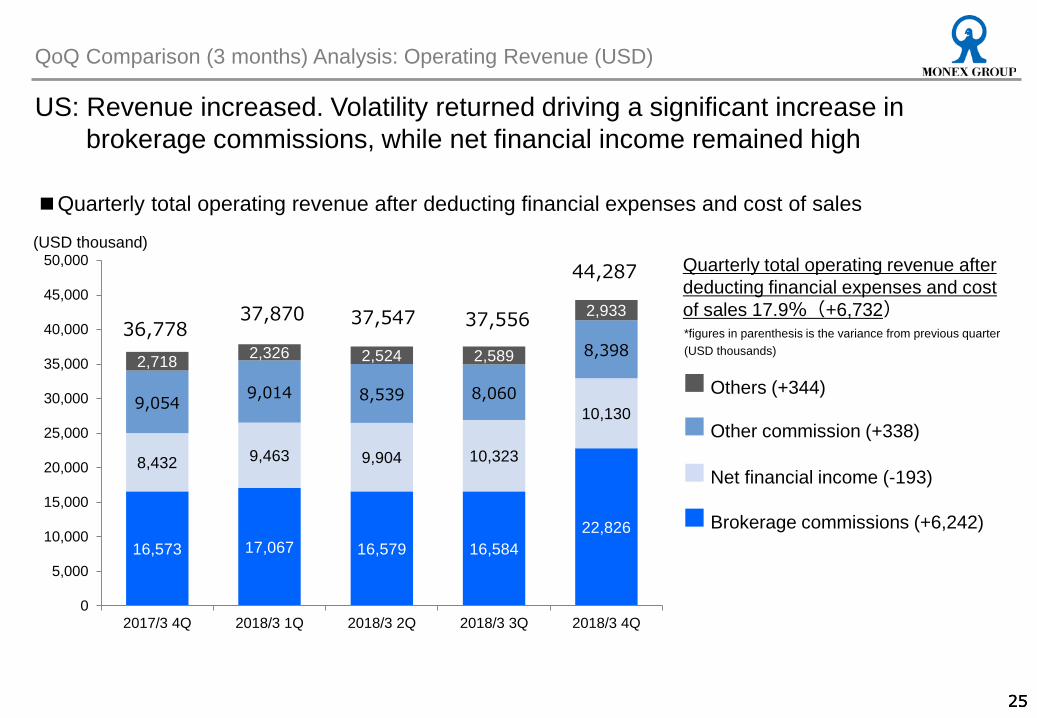
Quarterly total operating revenue after deducting financial expenses and cost of sales 17.9%(+6,732) *figures in parenthesis is the variance from previous quarter (USD thousands)
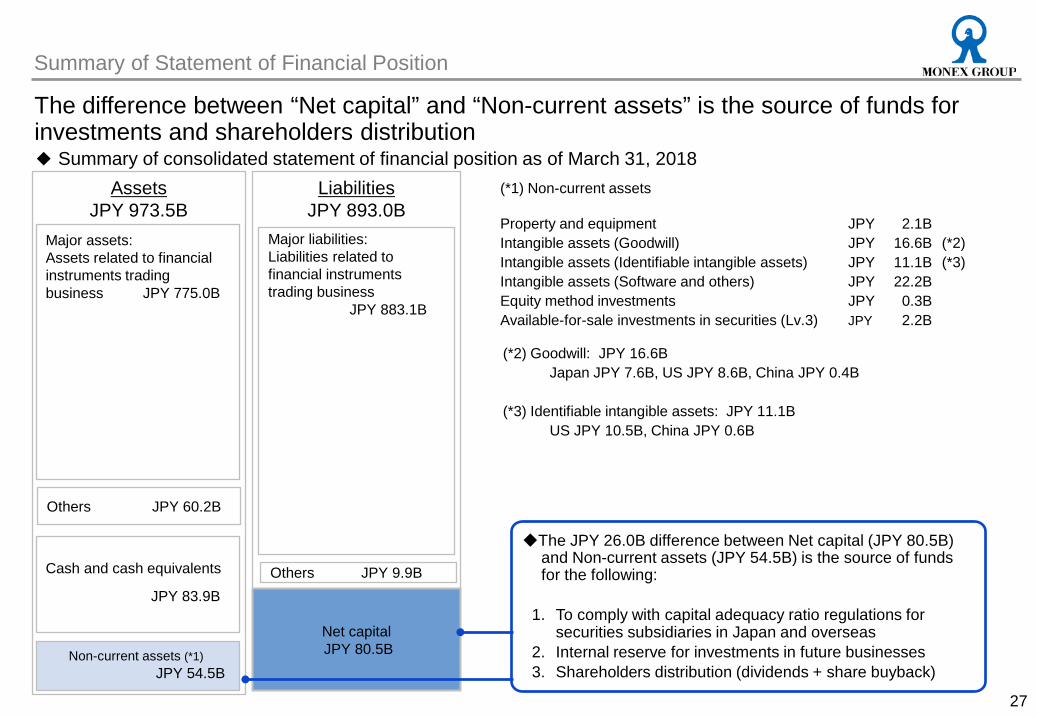
Major assets: Assets related to financial instruments trading business JPY 775.0B
Major liabilities: Liabilities related to financial instruments trading business JPY 883.1B Cash and cash equivalents
JPY 83.9B
27
Others JPY 60.2B
Others JPY 9.9B
The difference between “Net capital” and “Non-current assets” is the source of funds for investments and shareholders distribution
◆The JPY 26.0B difference between Net capital (JPY 80.5B) and Non-current assets (JPY 54.5B) is the source of funds for the following:
1. To comply with capital adequacy ratio regulations for
securities subsidiaries in Japan and overseas 2. Internal reserve for investments in future businesses 3. Shareholders distribution (dividends + share buyback)
Return total return ratio (*1) to 75% on a multi-year basis since FYE Mar, 2019
(*1) Total return ratio = (dividend paid*3 + amount of share buyback*4) /profit attributable to owners of the Company (*2) Total return amount = dividend paid + amount of share buyback (*3) Refer to P49 “Dividend history” for more information of dividend per share (*4) Amount of share buyback : JPY 3.1B in Jun. 2011, 5.5B in May 2013, 1.2B in Jul.-Aug.2015, 1.0B in May-Jun. 2016, 1.0B in May 2017, 3.0B in Feb.-Mar. 2018
(million yen)
28
Shareholders’ Distribution
◆Total return amount(*2) and total return ratio ◆Return on Equity ratio
1,825 1,537
599
1,229
5,178
2,359
2,728 1,459 2,721
3,098
5,514
1,162
1,000
4,030
48% 77%
260%
31%
103%
68%
109%
827%
100%
0%
100%
200%
300%
400%
500%
600%
700%
800%
900%
0
2,000
4,000
6,000
8,000
10,000
12,000
FYEMar.2010
FYEMar.2012
FYEMar.2014
FYEMar.2016
FYEMar.2018
Amount of acquisition of own shares(left)Amount of dividends (left)Total return ratio(right)
7.1%
2.9% 2.0%
5.0%
12.9%
4.2% 4.1%
0.4%
8.3%
0%
5%
10%
15%
FYEMar.2010
FYEMar.2011
FYEMar.2012
FYEMar.2013
FYEMar.2014
FYEMar.2015
FYEMar.2016
FYEMar.2017
FYEMar.2018
29
I. Highlights II. Consolidated Performance III. Business Update IV. Mid- & Long-Term Initiatives Appendix. Group Overview
Business Update Japan segment (1) Customer base expansion 1/2
30
Expanded customer base with new product development, our area of strength
For active traders
- High performance tool designed for active traders. Flat-rate plans at the lowest price level in the industry - Over 10,000 account openings. Number of funded accounts and active accounts increased by about 370%
and 570%, respectively - The trading volume share of TradeStation via Monex, Inc. steadily growing and reached about 4.6%
For US equity traders
- Record high number of transactions and number of active accounts in 4Q. Number of transactions increased by about 41% (vs 3Q). Number of active accounts increased by about 39%(vs 3Q)
- Launched Japanese yen settlement service in March, 2018 to enable customers to trade from yen and improve customer usability
Japanese equities trading platform tool, TradeStation
US equities offering
Award-winning fund, Monex Japan Growth Equity Fund (aka, The Fund @Monex) - Received the R&I Fund Award 2018 in three different categories: 【Best Fund Award】 Japan Equity Investment Trust Category, Japan Equity NISA Category
【Excellent Fund Award】 Japan Equity 10-year Investment Trust Category
For investors
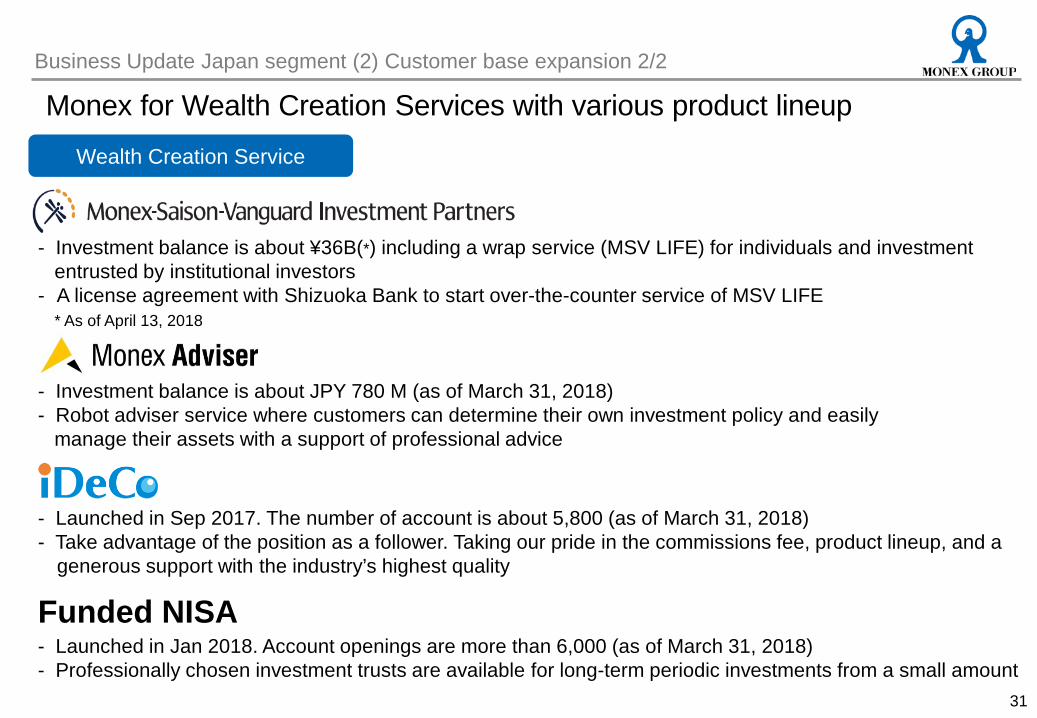
- Investment balance is about ¥36B(*) including a wrap service (MSV LIFE) for individuals and investment entrusted by institutional investors - A license agreement with Shizuoka Bank to start over-the-counter service of MSV LIFE * As of April 13, 2018
Business Update Japan segment (2) Customer base expansion 2/2
31
Wealth Creation Service
- Investment balance is about JPY 780 M (as of March 31, 2018) - Robot adviser service where customers can determine their own investment policy and easily manage their assets with a support of professional advice
Monex for Wealth Creation Services with various product lineup
- Launched in Sep 2017. The number of account is about 5,800 (as of March 31, 2018) - Take advantage of the position as a follower. Taking our pride in the commissions fee, product lineup, and a
generous support with the industry’s highest quality
- Launched in Jan 2018. Account openings are more than 6,000 (as of March 31, 2018) - Professionally chosen investment trusts are available for long-term periodic investments from a small amount
Funded NISA
Monex 61%
54%
0%
20%
40%
60%
80%
0 1,000,000 2,000,000 3,000,000
46%
70%
0%
50%
100%
Monex Average for main onlinesecurities firms*
32
Business Update Japan segment (3) Customer base of Monex, Inc.
Aiming to double equities commissions through acquisition of active traders as well as investors, Monex's main customer base
◆Active account ratio (as of December 31, 2017) (active account ratio)
(total accounts)
◆Customer assets per account (as of December 31, 2017)
(JPY million)
◆Margin trading ratio (3Q FYE Mar. 2018) ◆Stock brokerage commission share (1Q FYE Mar. 2010 - 3Q FYE Mar. 2018)
Higher ratio than the average of the main online securities firms = Good quality customer base
Larger than the average of the main online securities firms = Good quality customer base
■ Steady profit structure and a further increase in revenue by higher volatility and interest rates - Increased brokerage commission in 4Q due to high volatility of 17.4* (vs 10.3* in 3Q)
- As an increase in volatility accelerated transactions in 4Q, Commission received + Net financial income increased by about 18% from the previous quarter
- After the expiration of interest rate swap in November 2018, $ 1 B of customers’ assets in custody will earn a higher rate of interest. Assuming the US Federal Fund rate is raised 25 bps in both June and December 2018, net interest income in FYE 2019 would increase by $ 11 M (vs FYE 2018)
0
5
10
15
20
25
0
10
20
30
40
50
4Q of FYEMar. 2016
1Q of FYEMar. 2017
2Q of FYEMar. 2017
3Q of FYEMar. 2017
4Q of FYEMar. 2017
1Q of FYEMar. 2018
2Q of FYEMar. 2018
3Q of FYEMar. 2018
4Q of FYEMar. 2018
Commission received + Net financial income (Left) VIX(Close Ave)(Right)
◆VIX and commission received + net financial income
(USD million)
◆Net interest income (*1) and US Federal Fund rate
(%) (USD million)
*1 Excluding net interest income from margin trading and stock lending
*2 Assuming the rate will be raised 25bps respectively in June and December 2018
* 2
Significant increase
in net financial income
*VIX close average price
35
Business Update Asia Pacific Segment
■ Quarterly financial results of Monex Boom Securities (HK) - Amount equivalent to operating income increases 76% from 3Q due to steadily growing
revenue including an increase of brokerage commissions - Various promotions and PR activities to expand customer base - Launched futures trading service on April 23, 2018
Explore business opportunities in Asia Pacific area
■ Launched online securities business operation in Australia
- Monex Securities Australia Pty Ltd operates online securities business since January 2018
- The company makes use of the system of the HK-based brokerage subsidiary in order to lighten the infrastructure and offer cost-competitive services
- Strengthen marketing for recognition to enlarge customer base - Establish a business model in Australia, leading to business expansion in other regions
■Providing technology and knowledge of online brokerage business through a joint venture in PRC
36
I. Highlights II. Consolidated Performance III. Business Update IV. Mid- & Long-Term Initiatives Appendix. Group Overview
37
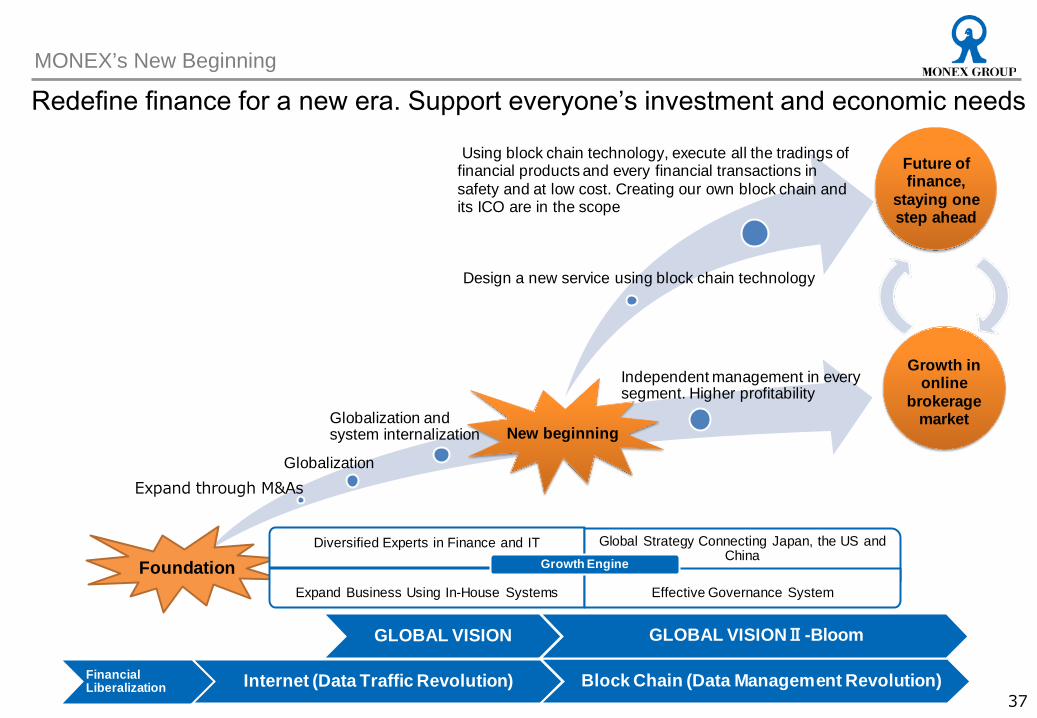
MONEX’s New Beginning
Redefine finance for a new era. Support everyone’s investment and economic needs
Globalization
Globalization and system internalization
Independent management in every segment. Higher profitability
Financial Liberalization
GLOBAL VISION
New beginning
Foundation
Internet (Data Traffic Revolution) Block Chain (Data Management Revolution)
GLOBAL VISIONⅡ-Bloom
Growth in online
brokerage market
Diversified Experts in Finance and IT Global Strategy Connecting Japan, the US and China
Expand Business Using In-House Systems Effective Governance System
Growth Engine
Using block chain technology, execute all the tradings of financial products and every financial transactions in safety and at low cost. Creating our own block chain and its ICO are in the scope
Design a new service using block chain technology
Future of finance,
staying one step ahead
Expand through M&As
38
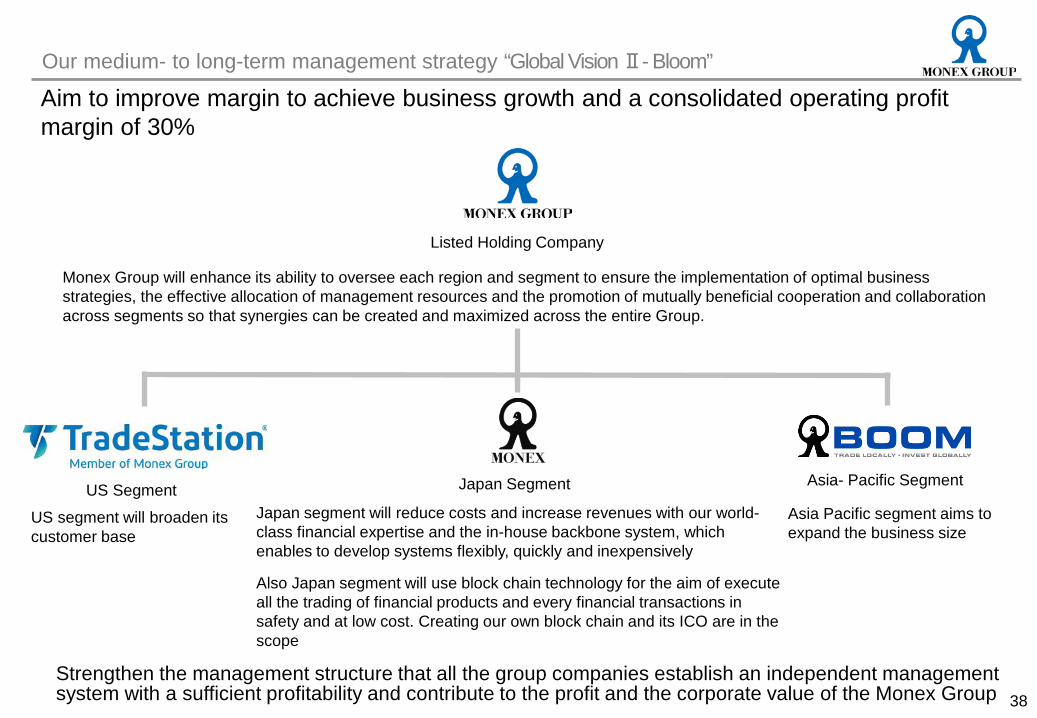
Our medium- to long-term management strategy “Global Vision Ⅱ- Bloom”
Aim to improve margin to achieve business growth and a consolidated operating profit margin of 30%
Japan segment will reduce costs and increase revenues with our world-class financial expertise and the in-house backbone system, which enables to develop systems flexibly, quickly and inexpensively Also Japan segment will use block chain technology for the aim of execute all the trading of financial products and every financial transactions in safety and at low cost. Creating our own block chain and its ICO are in the scope
Strengthen the management structure that all the group companies establish an independent management system with a sufficient profitability and contribute to the profit and the corporate value of the Monex Group
US segment will broaden its customer base
Asia Pacific segment aims to expand the business size
Monex Group will enhance its ability to oversee each region and segment to ensure the implementation of optimal business strategies, the effective allocation of management resources and the promotion of mutually beneficial cooperation and collaboration across segments so that synergies can be created and maximized across the entire Group.
Listed Holding Company
US Segment Japan Segment Asia- Pacific Segment
Adoption of “company with three committees” structure - Highly effective executive management monitoring system - Adopted “company with committees” structure in June 2013 - Each of the three committees is chaired by an independent & outside director
Directors with various backgrounds - Six* out of nine directors qualify as “independent & outside” directors and four independent & outside directors have managed companies - Appointed a lead outside director. Actively exchanges opinions at meetings led by the lead outside director and
composed mainly by independent & outside directors - Various backgrounds: Management experience (current/former CEOs of listed companies or global companies), Expertise
(lawyer, CPA*), Business experience (finance, IT, global business), Culture & society (gender, country of residence, nationality)
39
Establish global-standard corporate governance practices and emphasize on dialogue with retail/institutional investors
Fair disclosure and dialogue for retail/institutional investors - Timely and fair information disclosure both in Japanese and English - Active dialogue with shareholders: CEO holds quarterly presentation sessions for retail shareholders - Annual general meeting of shareholders is held on weekend so that retail shareholders can attend the meeting (Reference)
13th ordinary general meeting of shareholders (June 24, 2017) Attendance of shareholders: 685
Corporate Governance
* Subjects for approval at the ordinary general shareholders meetings in June 23, 2018
40
I. Highlights II. Consolidated Performance III. Business Update IV. Mid- & Long-Term Initiatives Appendix. Group Overview
41
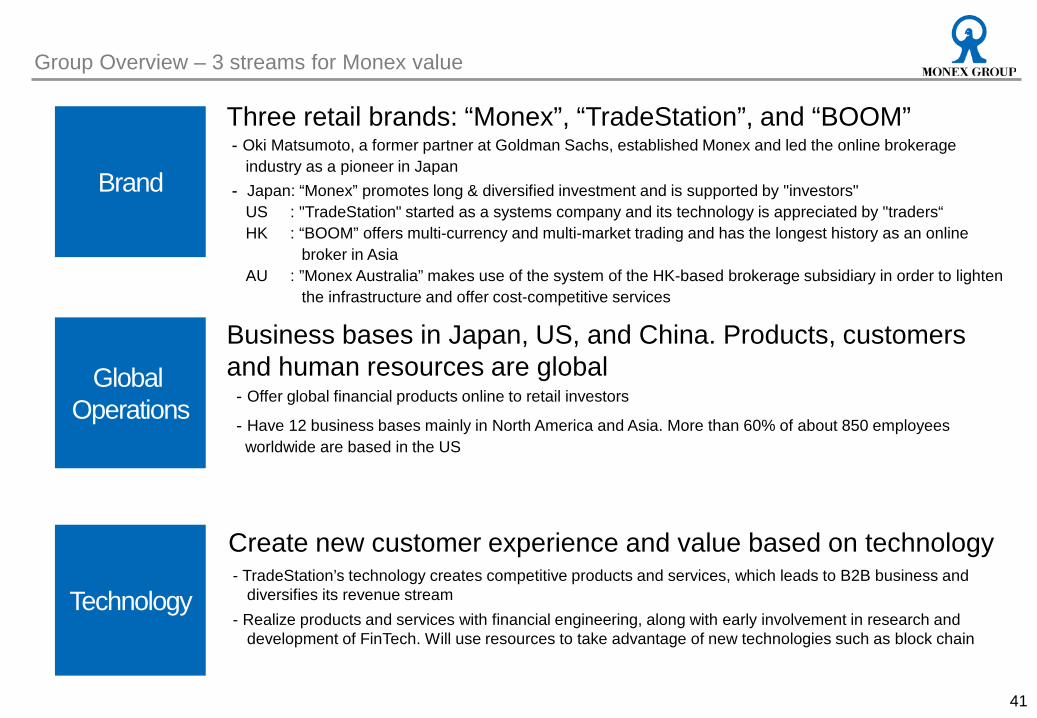
Group Overview – 3 streams for Monex value
Business bases in Japan, US, and China. Products, customers and human resources are global -Offer global financial products online to retail investors
-Have 12 business bases mainly in North America and Asia. More than 60% of about 850 employees worldwide are based in the US
Three retail brands: “Monex”, “TradeStation”, and “BOOM” -Oki Matsumoto, a former partner at Goldman Sachs, established Monex and led the online brokerage
industry as a pioneer in Japan - Japan: “Monex” promotes long & diversified investment and is supported by "investors"
US : "TradeStation" started as a systems company and its technology is appreciated by "traders“ HK : “BOOM” offers multi-currency and multi-market trading and has the longest history as an online
broker in Asia AU : ”Monex Australia” makes use of the system of the HK-based brokerage subsidiary in order to lighten the infrastructure and offer cost-competitive services
Create new customer experience and value based on technology - TradeStation’s technology creates competitive products and services, which leads to B2B business and
diversifies its revenue stream - Realize products and services with financial engineering, along with early involvement in research and
development of FinTech. Will use resources to take advantage of new technologies such as block chain
Brand
Global Operations
Technology
0
100
200
300
400
500
600
2000/3 2006/3 2010/3 2012/3 2018/3
42
Expanded through M&As inside Japan Expanded globally Globalization & system internalization
Operating revenue in Asia-pacific segment Operating revenue in US segment
Operating revenue in Japan segment
(JPY million)
◆Consolidated Operating Revenue
Japan: 1.76M accounts, US: 93K accounts, HK: 10K accounts. Monex has a global customer base Aim for continuous growth in the online brokerage business for retail investors as our core business
Group Overview
Japan 57%
System related expenses*2 29%
Compensation and benefits 10%
Communication, freight and information expenses 4%
Advertising expenses 4% Commissions paid 5%
Others 4%
System related expenses 8%
Compensation and benefits*2
Communication, freight and information expenses 4%
Advertising expenses 3%
Commissions paid 7%
Others 3%
U.S. 41%
AP 2%
Japan 64% U.S.
34%
Equities*1 28%
Equities 7%
Futures and Options 1%
Futures*1 11%
FX 8%
Mutual Funds 4%
Financial income 20%
Others 2%
Financial income 9%
Options*1 5%
Others 2%
AP 2%
43
Group Overview-Revenues, Costs: 60% from Japan, 40% from US; Employees: 40% in Japan, 60% in US
◆Employees by segment and by department
◆SG&A by segment and by cost items ◆Total operating revenue after deducting financial expenses by region and by business
*1. Total operating revenue after deducting financial expenses : US accounts for 1/3. Revenue in Japan primarily from equities while revenue in the US primarily from futures and options
*2. Total SG&A : Japan accounts for 60% and US and AP accounts for 40%. However, half of the Japanese portion is made up of system related costs, whereas the largest percentage of the US total is from compensation and benefits costs.
*3. Employees: US account for 60%. US has a larger number of technology-related employees as it internally develops its system
Revenue JPY 49,155M (FYE Mar. 2018)
SG&A JPY 39,853M (FYE Mar. 2018)
Employees 853 persons
(as of Mar. 2018)
Technology 8%
Technology*3 39%
Marketing 11%
Marketing 5%
Operation 9%
Operation 6%
Others 10%
Others 8%
Japan 38%
US*3 57%
AP 5%
44
Group Overview-Corporate value creation process
As experts in finance, our personnel strive to expand customer base using IT technology
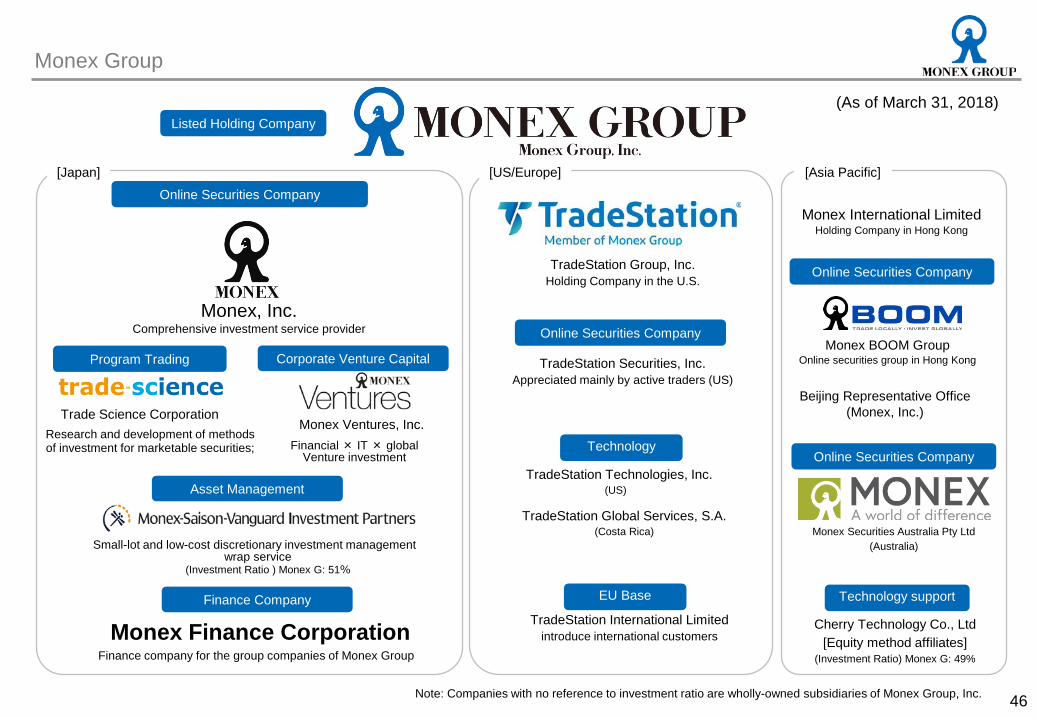
Monex BOOM Group Online securities group in Hong Kong
Technology support
Asset Management
Small-lot and low-cost discretionary investment management wrap service
(Investment Ratio ) Monex G: 51%
Monex Securities Australia Pty Ltd (Australia)
Finance Company
Finance company for the group companies of Monex Group Monex Finance Corporation
Online Securities Company
47
Overview of Monex Group and Main Subsidiary Companies
■ Monex Group, Inc. (Tokyo, Japan) TSE 1st Sec. Code: 8698 - Chairman, Representative Executive Officer, CEO: Oki Matsumoto
- Established in 2004
- Financial holding company with major online brokerage firm subsidiaries in Japan, US and China (Hong Kong)
■ Monex, Inc. (Tokyo, Japan) One of the major online brokerage firms in Japan - President : Oki Matsumoto
- Founded in 1999
- Aims to provide retail investors the level of creative products & services offered to institutional investors
- First in the Japanese industry to offer unique services & products for retail investors (Examples): PTS/ECN, stock lending, lead manager in an IPO as an online broker, RMB bonds, No.1 U.S. equity service in Japan (the largest number of stock names available, the longest trading hours & the lowest commissions), offering the largest-class private equity fund in the world, First smartphone app for US equity as major online broker
- Products & services: Equities (Japan, U.S., Hong Kong), futures & options, FX, mutual funds, bonds, investment education, etc.
- # of total accounts: 1,760,805 - # of active accounts: 1,045,035 - (“Active accounts”: accounts with balance or with at least one
trade or transaction a year.)
- Customers’ assets in custody: JPY 4.2290 trillion
■ TradeStation Group (HQ in Florida, U.S.) Online securities group with award-winning trading technology development capabilities - President: John Bartleman - Founded in 1982, joined Monex Group in Jun. 2011 - An award-winning TradeStation platform recognized and highly
regarded by active traders; a multi-asset platform with a robust algorithm trading language (EasyLanguage®) that enables sophisticated analysis capabilities and back-testing ability
- Licenses “TradeStation” platform as a technology provider to brokers in Japan, China and Korea
- Products & services: Equities (U.S.), options and futures - # of active accounts: 74,810 - Customers’ assets in custody: JPY 550,769 million ■ Monex Boom Securities Group (Hong Kong) Offers access to over 12 markets - COO: Ivan Law - Founded in 1997, joined Monex Group in Dec. 2010 - First online stockbroker for retail investors in Asia Pacific - Products & services: Equities (12 markets such as Hong Kong, US,
Japan, etc.) Trades available in 6 currencies in a single trading account
- # of accounts with balance: 12,195 - Customers’ assets in custody: JPY 169,082 million
■ Monex Securities Australia Pty Ltd (Australia) - By utilizing the system and operating structure of Monex Boom
Securities Group - Managing Director: Alex Douglas - Founded in 2010, joined Monex Group in June 2011
The numbers above are as of March 31, 2018.
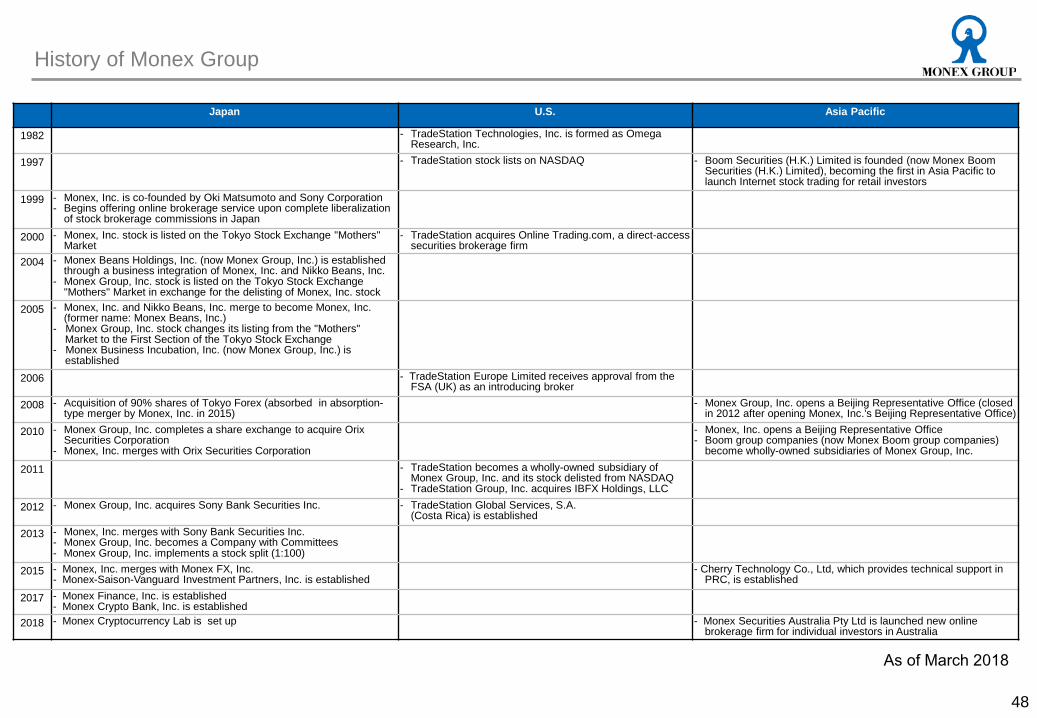
History of Monex Group
Japan U.S. Asia Pacific
1982 - TradeStation Technologies, Inc. is formed as Omega Research, Inc.
1997 - TradeStation stock lists on NASDAQ - Boom Securities (H.K.) Limited is founded (now Monex Boom Securities (H.K.) Limited), becoming the first in Asia Pacific to launch Internet stock trading for retail investors
1999 - Monex, Inc. is co-founded by Oki Matsumoto and Sony Corporation - Begins offering online brokerage service upon complete liberalization
of stock brokerage commissions in Japan
2000 - Monex, Inc. stock is listed on the Tokyo Stock Exchange "Mothers" Market
- TradeStation acquires Online Trading.com, a direct-access securities brokerage firm
2004 - Monex Beans Holdings, Inc. (now Monex Group, Inc.) is established through a business integration of Monex, Inc. and Nikko Beans, Inc.
- Monex Group, Inc. stock is listed on the Tokyo Stock Exchange "Mothers" Market in exchange for the delisting of Monex, Inc. stock
2005 - Monex, Inc. and Nikko Beans, Inc. merge to become Monex, Inc. (former name: Monex Beans, Inc.)
- Monex Group, Inc. stock changes its listing from the "Mothers" Market to the First Section of the Tokyo Stock Exchange - Monex Business Incubation, Inc. (now Monex Group, Inc.) is established
2006 - TradeStation Europe Limited receives approval from the FSA (UK) as an introducing broker
2008 - Acquisition of 90% shares of Tokyo Forex (absorbed in absorption-type merger by Monex, Inc. in 2015)
- Monex Group, Inc. opens a Beijing Representative Office (closed in 2012 after opening Monex, Inc.'s Beijing Representative Office)
2010 - Monex Group, Inc. completes a share exchange to acquire Orix Securities Corporation
- Monex, Inc. merges with Orix Securities Corporation
- Monex, Inc. opens a Beijing Representative Office - Boom group companies (now Monex Boom group companies)
become wholly-owned subsidiaries of Monex Group, Inc. 2011 - TradeStation becomes a wholly-owned subsidiary of
Monex Group, Inc. and its stock delisted from NASDAQ - TradeStation Group, Inc. acquires IBFX Holdings, LLC
2012 - Monex Group, Inc. acquires Sony Bank Securities Inc. - TradeStation Global Services, S.A. (Costa Rica) is established
2013 - Monex, Inc. merges with Sony Bank Securities Inc. - Monex Group, Inc. becomes a Company with Committees - Monex Group, Inc. implements a stock split (1:100)
2015
- Monex, Inc. merges with Monex FX, Inc. - Monex-Saison-Vanguard Investment Partners, Inc. is established
- Cherry Technology Co., Ltd, which provides technical support in PRC, is established
2017 - Monex Finance, Inc. is established - Monex Crypto Bank, Inc. is established
2018 - Monex Cryptocurrency Lab is set up - Monex Securities Australia Pty Ltd is launched new online brokerage firm for individual investors in Australia
48
As of March 2018
Shizuoka Bank 26.5%
Foreign institutions, etc.
12.3%
Individuals, etc.
21.9% Fina
ncia
l in
stitu
tions
12
.1%
Oth
er in
stitu
tions
3.
7%
FYE Mar. 2014
FYE Mar. 2015
FYE Mar. 2016
FYE Mar. 2017
FYE Mar. 2018
Equity attributable to owners of the Company per share (BPS)
280.52 yen
302.18 yen
302.03 yen
290.00 Yen
298.50 Yen
Earnings per share attributable to owners of the Company (EPS)
35.76 yen 12.15yen 12.46yen 1.06yen 24.33yen
Rate of Return on Equity(ROE) 12.9% 4.2% 4.1% 0.4% 8.3%
Dividends per share 18.0yen 8.2yen 9.6yen 5.2yen 10.0yen
Investors’ Guide ■Pursue returns to shareholders through ROE improvement
◆ Our basic policy for shareholders distribution To provide returns to shareholders based on our business
performance, while reserving necessary capital as a growing company
◆ Dividend history
◆Major shareholders and shareholder breakdown (as of Mar. 31, 2018)
◆Indicators per share
■Shareholders & indicators per share
49
Year-end Interim
(yen)
Securities companies 3.4%
Stock split was implemented on Oct. 1, 2013 and the above figures are adjusted retroactively since FYE Mar. 2014
FMR LLC (Fidelity) 10.6%
The graph made by Monex based on shareholders’ list as of Mar. 31, 2018 and the Large shareholding report .
Momo, Inc.* and Oki Matsumoto 9.2%
* Formerly known as Oki Matsumoto, Inc.
Monex Group, Inc. 0.2%
Stock split was implemented on Oct. 1, 2013 and the above figures are adjusted retroactively since FYE Mar. 2014