Page 1
(Securities Code:7537 / TSE1st Section)
Financial Results for the 2nd Quarter of Fiscal Year Ending March 31, 2014
November 2013
Copyright © 2002-2013 MARUBUN CORPORATION All Rights Reserved.
Page 2
1H FY3/14 Summary of Consolidated Financial Results
Copyright © 2002-2013 MARUBUN CORPORATION All Rights Reserved.
Page 3
1H 3/14 Summary of Consolidated Financial Results
Copyright © 2002-2013 MARUBUN CORPORATION All Rights Reserved. 3
Electronic Devices Business Increased 17.8% as a result of robust sales of Special-Use ICs for communication modules and Memory ICs for PCs and computer peripherals
Electronic Systems Business Increased 3.4% as a result of increase in semiconductor non-destructive testing equipment in Measurement & Inspection Equipment, and inclusion of an equity method affiliate as a consolidated subsidiary
Net sales increased by ¥16,335 million (+15.9% YoY)
SG&A expenses Decreased 2.8% as a result of personnel downsizing
Operating income increased by ¥657 million (+126.7% YoY)
Increase in equity in net income of affiliates
Decrease in interest expenses
Ordinary income increased by ¥796 million (+210.9% YoY)
Decrease in extraordinary loss posted during the previous term (¥349 million)
Net income recorded a surplus with an increase of ¥691 million YoY
Page 4
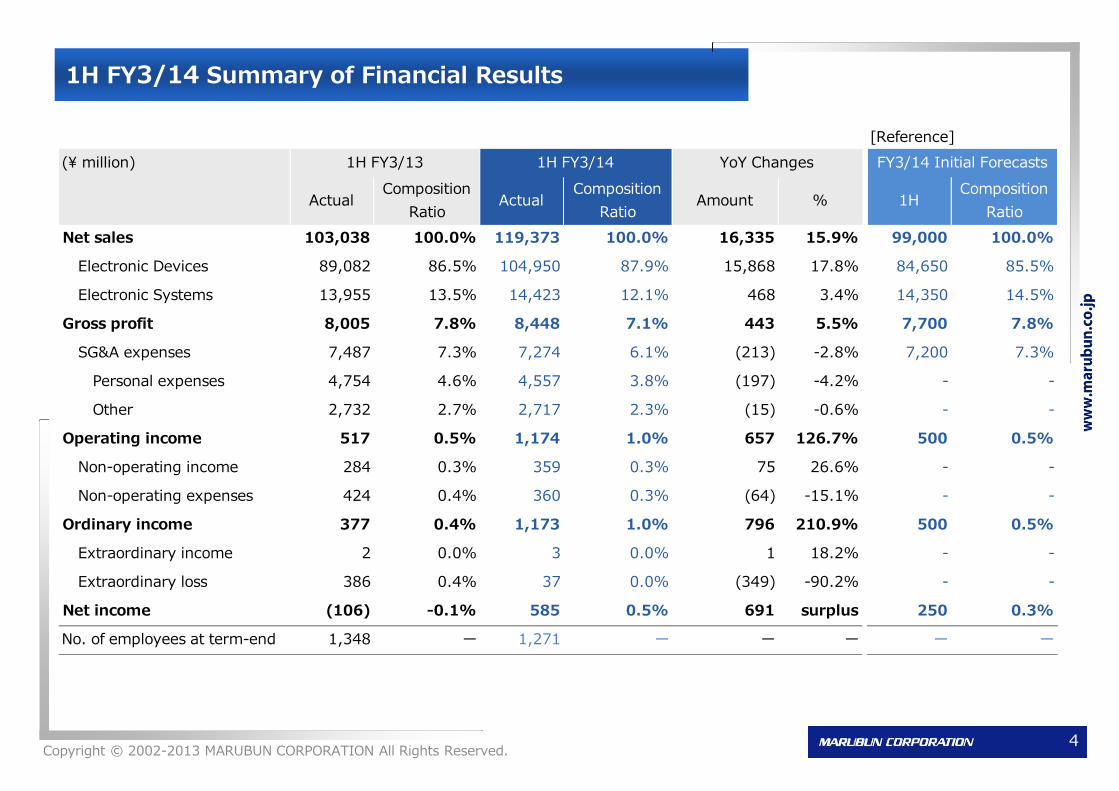
1H FY3/14 Summary of Financial Results
Copyright © 2002-2013 MARUBUN CORPORATION All Rights Reserved. 4
[Reference]
(\ million)
ActualComposition
RatioActual
Composition
RatioAmount % 1H
Composition
Ratio
Net sales 103,038 100.0% 119,373 100.0% 16,335 15.9% 99,000 100.0%
Electronic Devices 89,082 86.5% 104,950 87.9% 15,868 17.8% 84,650 85.5%
Electronic Systems 13,955 13.5% 14,423 12.1% 468 3.4% 14,350 14.5%
Gross profit 8,005 7.8% 8,448 7.1% 443 5.5% 7,700 7.8%
SG&A expenses 7,487 7.3% 7,274 6.1% (213) -2.8% 7,200 7.3%
Personal expenses 4,754 4.6% 4,557 3.8% (197) -4.2% - -
Other 2,732 2.7% 2,717 2.3% (15) -0.6% - -
Operating income 517 0.5% 1,174 1.0% 657 126.7% 500 0.5%
Non-operating income 284 0.3% 359 0.3% 75 26.6% - -
Non-operating expenses 424 0.4% 360 0.3% (64) -15.1% - -
Ordinary income 377 0.4% 1,173 1.0% 796 210.9% 500 0.5%
Extraordinary income 2 0.0% 3 0.0% 1 18.2% - -
Extraordinary loss 386 0.4% 37 0.0% (349) -90.2% - -
Net income (106) -0.1% 585 0.5% 691 surplus 250 0.3%
No. of employees at term-end 1,348 ー 1,271 ー ー ー ー ー
1H FY3/13 1H FY3/14 YoY Changes FY3/14 Initial Forecasts
Page 5
14,106 14,192
1,322 1,431
11,15517,246
6,633
5,410
34,524
45,203
6,317
5,594
14,824
15,448
1H FY3/13 1H FY3/14
(¥ million)
89,082
104,950
1H FY3/14 Electronic Devices Business Net Sales Breakdown by Product
Copyright © 2002-2013 MARUBUN CORPORATION All Rights Reserved.
Electronic Components Increase in LCD panels for TVs and decrease in organic ELs for smartphones
Custom IC Decrease in ICs for consumer electronics
Special-Use IC Substantial increase in ICs for communication modules
Micro-Processor Decrease in ICs for smartphones and OA equipment
Memory IC Increase in ICs for PCs and computer peripherals
Standard Logic IC
Analog IC Increase in ICs for car electronics and decrease in ICs for game consoles
13/3月期 1-2Q 14/3月期 1-2Q
5
Page 6
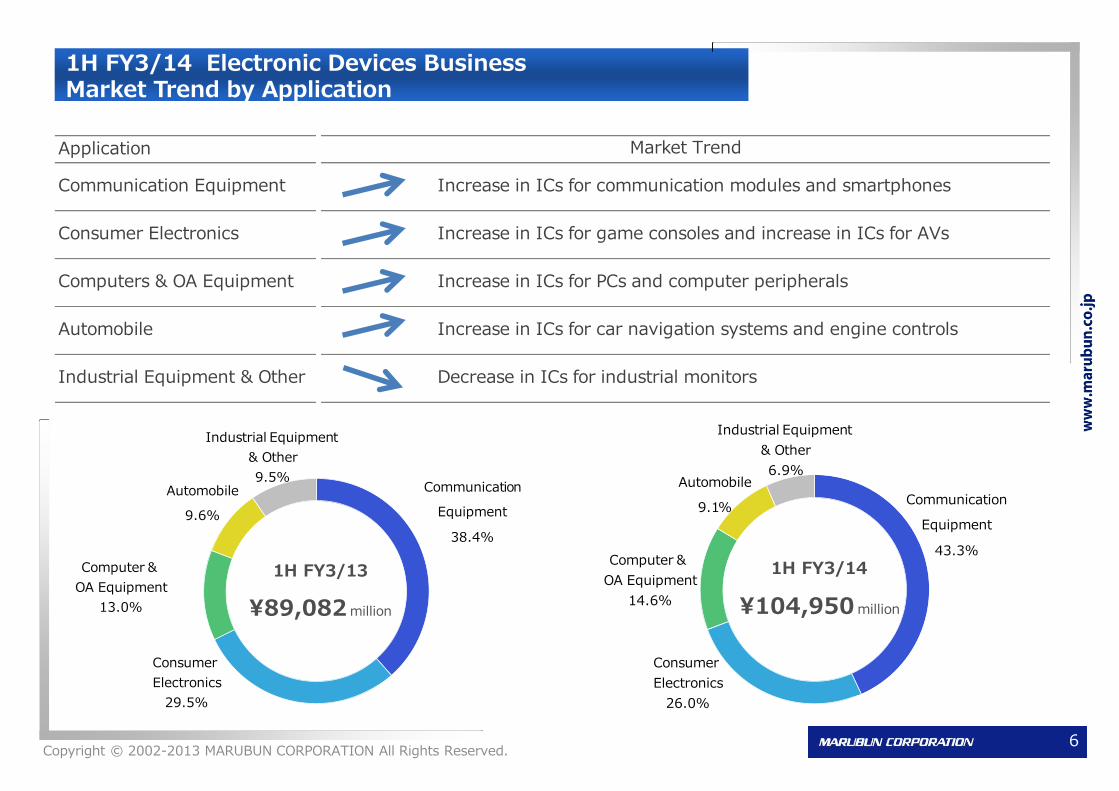
1H FY3/14 Electronic Devices Business Market Trend by Application
Copyright © 2002-2013 MARUBUN CORPORATION All Rights Reserved. 6
Application
Communication Equipment Increase in ICs for communication modules and smartphones
Consumer Electronics Increase in ICs for game consoles and increase in ICs for AVs
Computers & OA Equipment Increase in ICs for PCs and computer peripherals
Automobile Increase in ICs for car navigation systems and engine controls
Industrial Equipment & Other Decrease in ICs for industrial monitors
Market Trend
Automobile
9.1%
Consumer
Electronics
26.0%
Computer &
OA Equipment
14.6%
Industrial Equipment
& Other
6.9%
1H FY3/14
¥104,950 million
Communication
Equipment
43.3%
Communication
Equipment
38.4%
Automobile
9.6%
1H FY3/13
¥89,082 million
Consumer
Electronics
29.5%
Computer &
OA Equipment
13.0%
Industrial Equipment
& Other
9.5%
Page 7
1,942 1,651
4,238 5,027
752 116
1,256 1,665
5,7685,963
1H FY3/13 1H FY3/14
(¥ million)
13,95514,423
1H FY3/14 Electronic Systems Business Net Sales Breakdown by Product
Copyright © 2002-2013 MARUBUN CORPORATION All Rights Reserved.
Medical Equipment Increase in dialysis equipment
Laser Equipment Increase in optical communication components
Scientific Equipment Decrease in thin-film equipment for power semiconductor manufacturing
Measurement & Inspection Equipment Increase in semiconductor non-destructive testing equipment and inclusion of Hokushinrika as a consolidated subsidiary
Space & Defense Electronics Increase in coponents for artificial satellites
7
Page 8
443
213
139
1 2 3 4 51H FY3/13 1H FY3/14
377
1,173
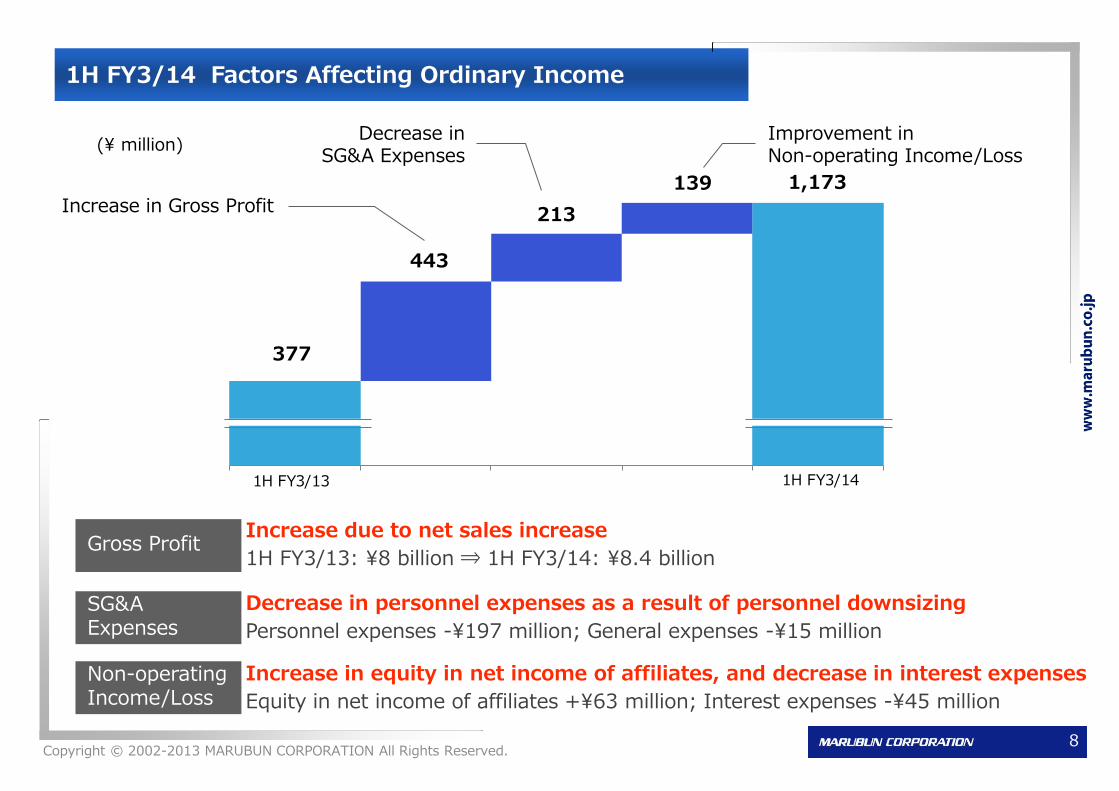
1H FY3/14 Factors Affecting Ordinary Income
Increase in Gross Profit
Decrease in SG&A Expenses
Improvement in Non-operating Income/Loss
Gross Profit
SG&A Expenses
Non-operating Income/Loss
Increase due to net sales increase
1H FY3/13: ¥8 billion ⇒ 1H FY3/14: ¥8.4 billion
Decrease in personnel expenses as a result of personnel downsizing
Personnel expenses -¥197 million; General expenses -¥15 million
Increase in equity in net income of affiliates, and decrease in interest expenses
Equity in net income of affiliates +¥63 million; Interest expenses -¥45 million
Copyright © 2002-2013 MARUBUN CORPORATION All Rights Reserved. 8
(¥ million)
Page 9
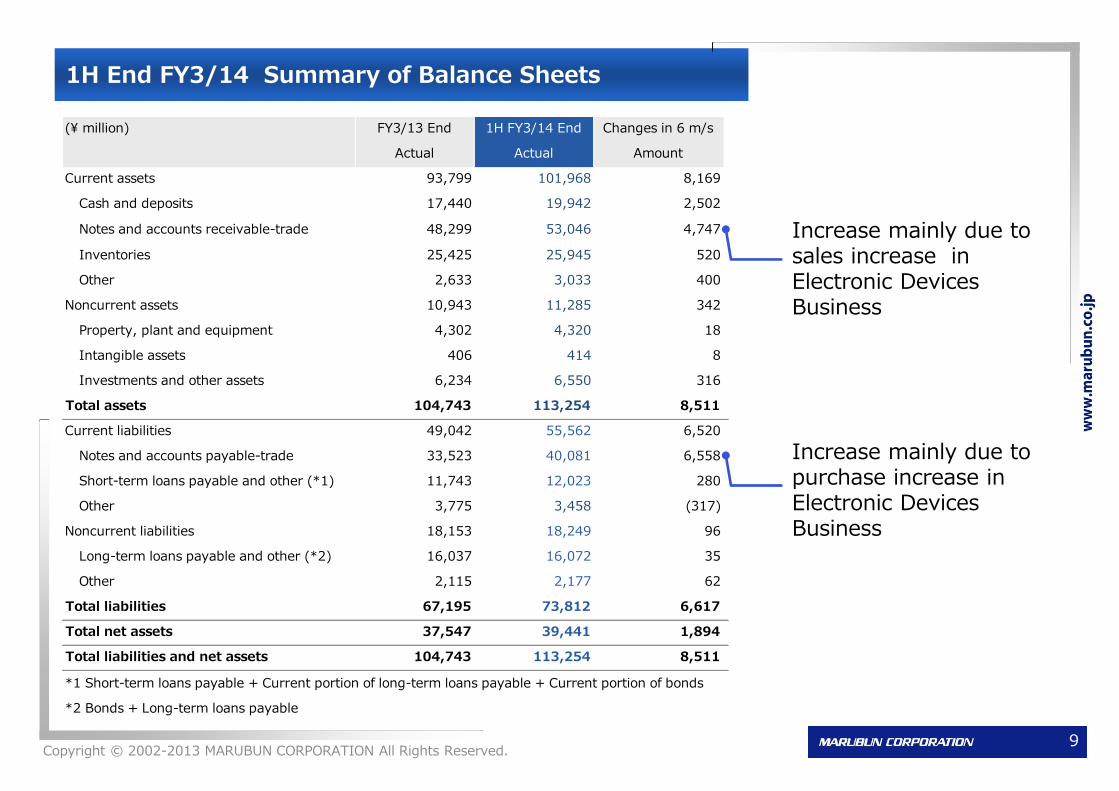
1H End FY3/14 Summary of Balance Sheets
Increase mainly due to sales increase in Electronic Devices Business
Copyright © 2002-2013 MARUBUN CORPORATION All Rights Reserved. 9
Increase mainly due to purchase increase in Electronic Devices Business
(\ million) FY3/13 End 1H FY3/14 End Changes in 6 m/s
Actual Actual Amount
Current assets 93,799 101,968 8,169
Cash and deposits 17,440 19,942 2,502
Notes and accounts receivable-trade 48,299 53,046 4,747
Inventories 25,425 25,945 520
Other 2,633 3,033 400
Noncurrent assets 10,943 11,285 342
Property, plant and equipment 4,302 4,320 18
Intangible assets 406 414 8
Investments and other assets 6,234 6,550 316
Total assets 104,743 113,254 8,511
Current liabilities 49,042 55,562 6,520
Notes and accounts payable-trade 33,523 40,081 6,558
Short-term loans payable and other (*1) 11,743 12,023 280
Other 3,775 3,458 (317)
Noncurrent liabilities 18,153 18,249 96
Long-term loans payable and other (*2) 16,037 16,072 35
Other 2,115 2,177 62
Total liabilities 67,195 73,812 6,617
Total net assets 37,547 39,441 1,894
Total liabilities and net assets 104,743 113,254 8,511
*1 Short-term loans payable + Current portion of long-term loans payable + Current portion of bonds
*2 Bonds + Long-term loans payable
Page 10
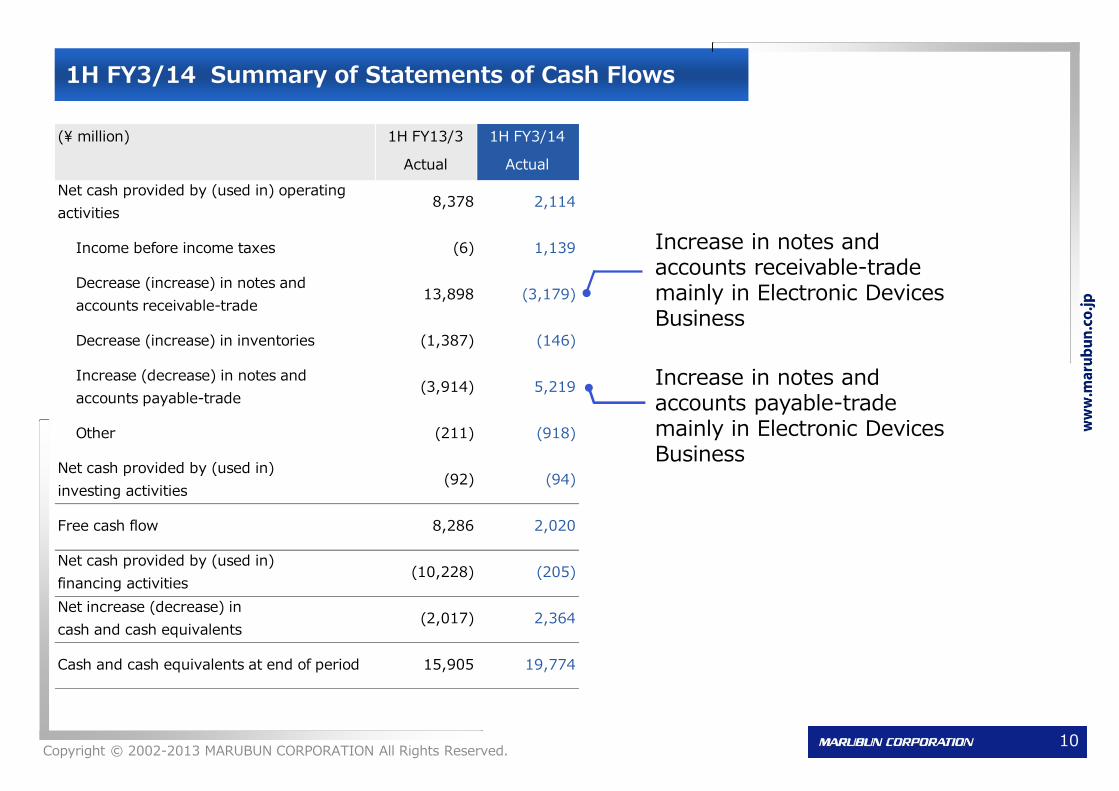
1H FY3/14 Summary of Statements of Cash Flows
Copyright © 2002-2013 MARUBUN CORPORATION All Rights Reserved.
Increase in notes and accounts receivable-trade mainly in Electronic Devices Business
10
Increase in notes and accounts payable-trade mainly in Electronic Devices Business
(\ million) 1H FY13/3 1H FY3/14
Actual Actual
8,378 2,114
Income before income taxes (6) 1,139
Decrease (increase) in notes and
accounts receivable-trade13,898 (3,179)
Decrease (increase) in inventories (1,387) (146)
Increase (decrease) in notes and
accounts payable-trade(3,914) 5,219
Other (211) (918)
(92) (94)
Free cash flow 8,286 2,020
(10,228) (205)
(2,017) 2,364
15,905 19,774
Net cash provided by (used in) operating
activities
Net cash provided by (used in)
investing activities
Net increase (decrease) in
cash and cash equivalents
Net cash provided by (used in)
financing activities
Cash and cash equivalents at end of period
Page 11
Progress of Business Strategies and Key Initiatives
Copyright © 2002-2013 MARUBUN CORPORATION All Rights Reserved.
Page 12
Strategies for Electronic Devices Business
Copyright © 2002-2013 MARUBUN CORPORATION All Rights Reserved.
Proposing product line-up and services which match market needs
Expand the base business
Introduce Key Performance Indicators (KPIs) representing the indices valued by suppliers
Strengthen sales for car electronics and industrial equipment
Enhance global services
Accelerate efforts to acquire new commercial rights
Enhance the Demand Creation (DC) function
Separate account sales from DC functions
Rearrange FAE (by application and technology)
Promote development of new products
Semiconductors: Custom ICs and ICs for networks
Environment: Crystal-type solar panels, and batteries
PCBs and electronic components: Single-layer and multilayer boards, and connectors
12
Page 13
1H 1H1H 1H
2H 2H
2H
0
5,000
10,000
15,000
20,000
FY3/10 FY3/11 FY3/12 FY3/13
(¥ million)
2H
fore-
cast
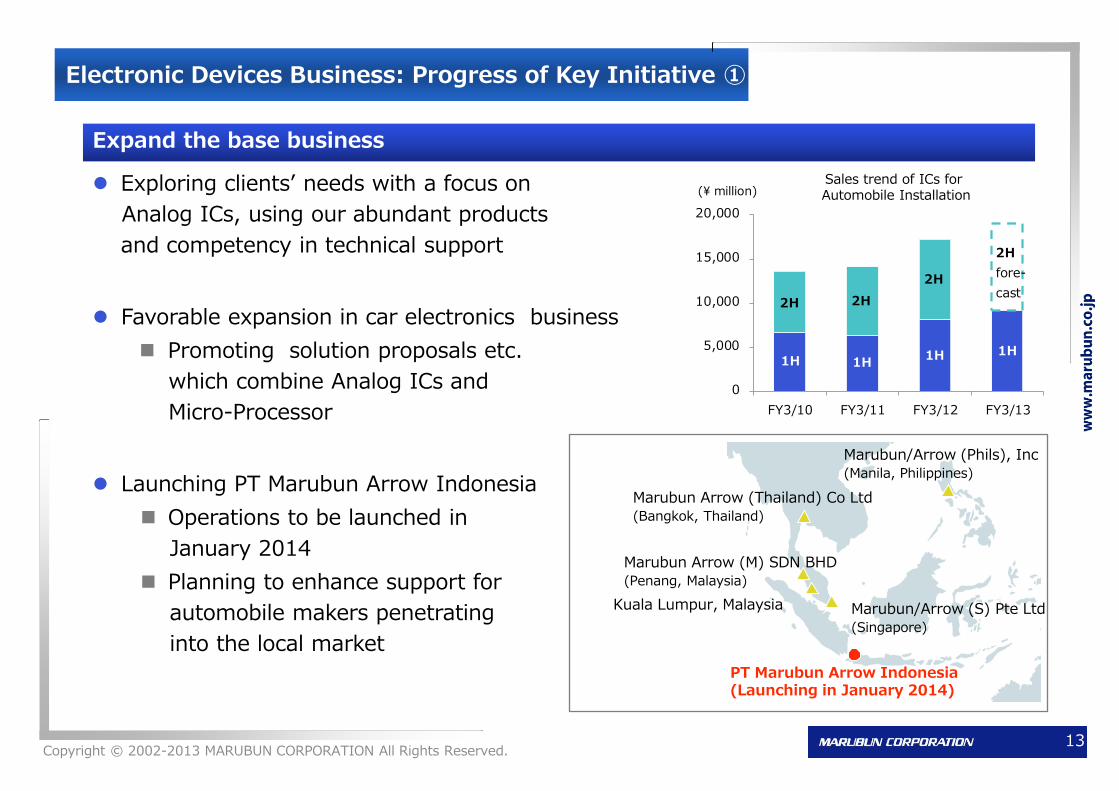
Electronic Devices Business: Progress of Key Initiative ①
Copyright © 2002-2013 MARUBUN CORPORATION All Rights Reserved.
Expand the base business
Exploring clients’ needs with a focus on
Analog ICs, using our abundant products
and competency in technical support
Favorable expansion in car electronics business
Promoting solution proposals etc.
which combine Analog ICs and
Micro-Processor
Launching PT Marubun Arrow Indonesia
Operations to be launched in
January 2014
Planning to enhance support for
automobile makers penetrating
into the local market
13
Marubun/Arrow (Phils), Inc (Manila, Philippines)
PT Marubun Arrow Indonesia (Launching in January 2014)
Marubun/Arrow (S) Pte Ltd (Singapore)
Kuala Lumpur, Malaysia
Marubun Arrow (Thailand) Co Ltd (Bangkok, Thailand)
Marubun Arrow (M) SDN BHD (Penang, Malaysia)
Sales trend of ICs for Automobile Installation
Page 14
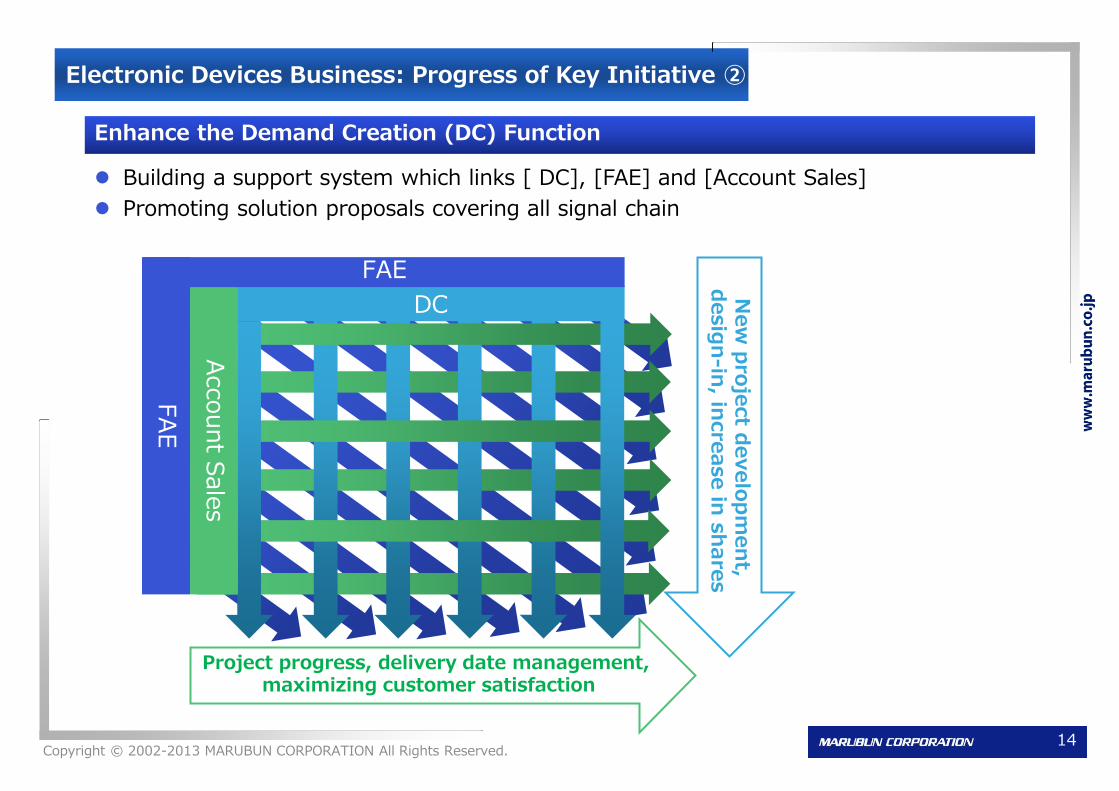
Electronic Devices Business: Progress of Key Initiative ②
14 Copyright © 2002-2013 MARUBUN CORPORATION All Rights Reserved.
Enhance the Demand Creation (DC) Function
Building a support system which links [ DC], [FAE] and [Account Sales]
Promoting solution proposals covering all signal chain
DC
Account S
ale
s
FAE
FA
E
New
pro
ject d
evelo
pm
en
t, d
esig
n-in
, incre
ase in
sh
are
s
Project progress, delivery date management, maximizing customer satisfaction
Page 15
Semiconductors
Custom ICs
Promoting orders received for ASICs of Open Silicon Inc.
Started handling custom products of Quick Logic corporation
ICs for networks
Started handling timing devices of IDT Inc.
Environment
Packaging solar panels and peripheral systems
Expand market in solar sharing at agriculture
PCBs and electronic components
Started handling connectors of Molex Inc. in Japan
Promoting design-in of PCBs of Unimicron Technology Corporation
Electronic Devices Business: Progress of Key Initiative ③
15 Copyright © 2002-2013 MARUBUN CORPORATION All Rights Reserved.
Promote development of new products
Solar Cell Packages For Solar Power Sharing
At agriculture
IDT Inc. Timing Device
Page 16
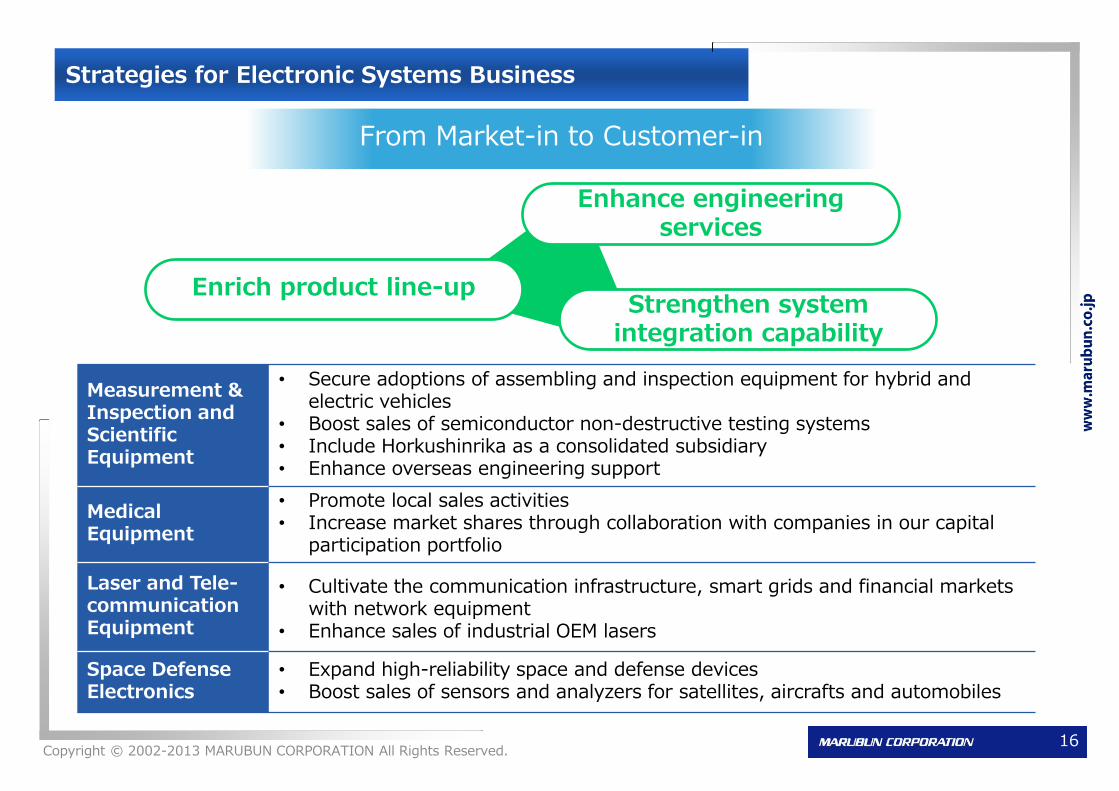
Strategies for Electronic Systems Business
Copyright © 2002-2013 MARUBUN CORPORATION All Rights Reserved.
Measurement & Inspection and Scientific Equipment
• Secure adoptions of assembling and inspection equipment for hybrid and electric vehicles
• Boost sales of semiconductor non-destructive testing systems • Include Horkushinrika as a consolidated subsidiary • Enhance overseas engineering support
Medical Equipment
• Promote local sales activities • Increase market shares through collaboration with companies in our capital
participation portfolio
Laser and Tele- communication Equipment
• Cultivate the communication infrastructure, smart grids and financial markets with network equipment
• Enhance sales of industrial OEM lasers
Space Defense Electronics
• Expand high-reliability space and defense devices • Boost sales of sensors and analyzers for satellites, aircrafts and automobiles
From Market-in to Customer-in
Strengthen system integration capability
Enhance engineering services
Enrich product line-up
16
Page 17
Electronic Systems Business: Topics
17 Copyright © 2002-2013 MARUBUN CORPORATION All Rights Reserved.
Acquired the ISO/IEC17025 certification for calibration services
Acquired “ISO/IEC17025” an international standard certification
for calibration competence and quality, in calibration services for
acceleration sensors
⇒ As a certified calibration institution, developed calibration
certified issuing services in addition to the existing calibration
service
Boosted sales of semiconductor non-destructive testing systems
Proposed a system combining both infrared
and X-ray inspection equipments for
deficiency inspection purposes
⇒ Reduction of inspection time and
improvement in degree of accuracy led to
high evaluation with increase in orders
Semi-conductor
Infrared inspection + X-ray inspection
Page 18
FY3/14 Summary of Consolidated Financial Forecasts
Copyright © 2002-2013 MARUBUN CORPORATION All Rights Reserved.
Page 19
FY3/14 Summary of Financial Forecasts (Based on Revised Forecasts)
19 Copyright © 2002-2013 MARUBUN CORPORATION All Rights Reserved.
Electronic Devices Business Expecting an increase in Special-Use ICs for communication
modules and Memory ICs
Electronic Systems Business Expecting a decrease in thin-film equipment for power
semiconductor manufacturing in Scientific Equipment
Net sales expected to increase ¥32,800 million (+14.9%) YoY,
¥27,500 million (+12.2%) vs. initial forecasts
Operating income expected to increase ¥509 million (+17.0%) YoY, ¥150 million (+4.5%) vs. initial forecasts
Expecting a decrease in extraordinary loss posted during the previous term
Net income expected in increase ¥818 million (+95.3%) YoY and
¥125 million (+8.1%) vs. initial forecasts
Ordinary income expected to increase ¥850 million (+34.0%) YoY, ¥150 million (+4.7%) vs. initial forecasts
Page 20
FY3/14 Revised Financial Forecasts
Copyright © 2002-2013 MARUBUN CORPORATION All Rights Reserved. 20
(\ million)
ActualComposition
Ratio
Initial Forecasts
(As of May 8, 2013
Revised Forecasts
(As of Oct xx, 2013)Amount % Amount %
Net sales 220,200 100.0% 225,500 253,000 32,800 14.9% 27,500 12.2%
Electronic Devices 187,247 85.0% 185,700 214,800 27,553 14.7% 29,100 15.7%
Electronic Systems 32,953 15.0% 39,800 38,200 5,247 15.9% (1,600) -4.0%
Gross profit 17,763 8.1% 18,100 18,250 487 2.7% 150 0.8%
SG&A expenses 14,771 6.7% 14,750 14,750 (21) -0.1% 0 0.0%
Operating income 2,991 1.4% 3,350 3,500 509 17.0% 150 4.5%
Non-operating income 640 0.3% - - - - - -
Non-operating expenses 1,132 0.5% - - - - - -
Ordinary income 2,500 1.1% 3,200 3,350 850 34.0% 150 4.7%
Extraordinary income 124 0.1% - - - - - -
Extraordinary loss 731 0.3% - - - - - -
Net income 857 0.4% 1,550 1,675 818 80.9% 125 8.1%
FY3/13 Changes vs. Initial ForecastsFY3/14 YoY Changes
Page 21
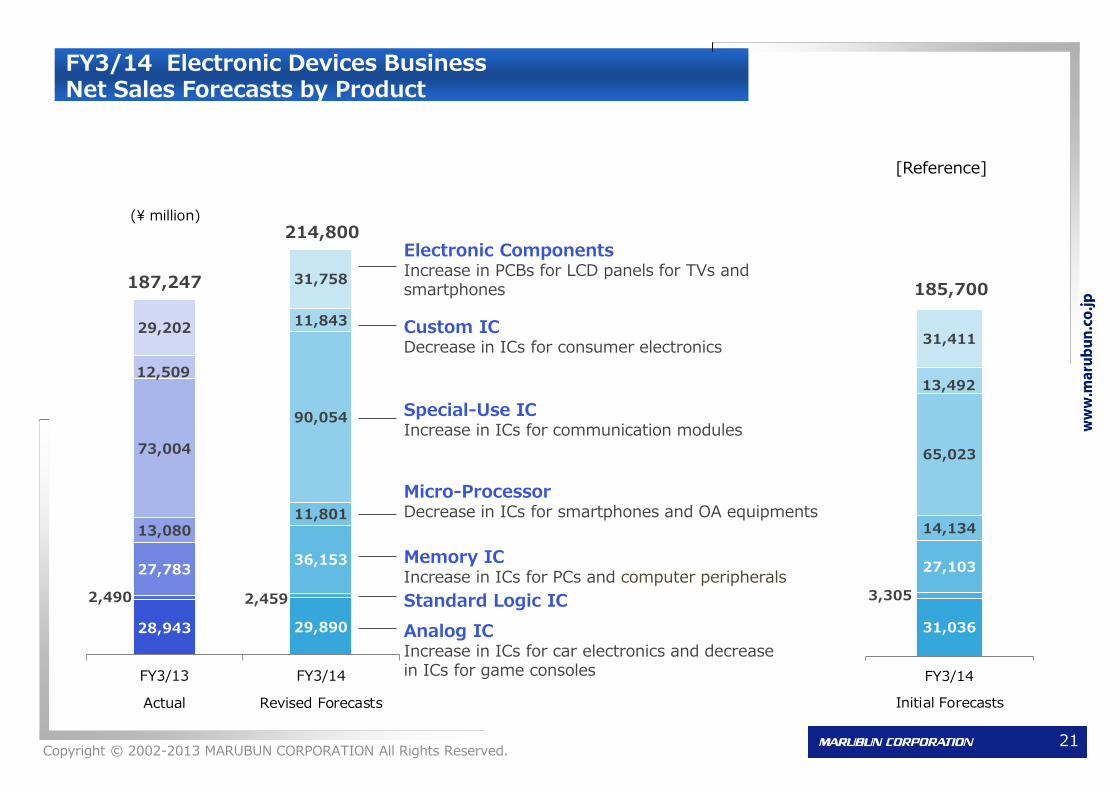
28,943 29,890
2,490 2,459
27,78336,153
13,08011,801
73,004
90,054
12,509
11,84329,202
31,758
FY3/13
Actual
FY3/14
Revised Forecasts
214,800
187,247
(¥ million)
FY3/14 Electronic Devices Business Net Sales Forecasts by Product
Copyright © 2002-2013 MARUBUN CORPORATION All Rights Reserved.
Electronic Components Increase in PCBs for LCD panels for TVs and smartphones
Custom IC Decrease in ICs for consumer electronics
Special-Use IC Increase in ICs for communication modules
Micro-Processor Decrease in ICs for smartphones and OA equipments
Memory IC Increase in ICs for PCs and computer peripherals
Standard Logic IC
Analog IC Increase in ICs for car electronics and decrease in ICs for game consoles
21
31,036
3,305
27,103
14,134
65,023
13,492
31,411
FY3/14
Initial Forecasts
185,700
[Reference]
Page 22
4,833 4,670
9,86813,347
2,620
1,0292,997
3,721
12,636
15,432
FY3/13
Actual
FY3/14
Revised Forecasts
(¥ million)
38,200
32,953
4,970
2,730
3,629
FY3/14
Initial Forecasts
39,800
14,477
13,995
FY3/14 Electronic Devices Business Net Sales Forecasts by Product
Medical Equipment Increase in dialysis, diagnostic image and other equipments
Laser Equipment Increase in optical communications components
Scientific Equipment Decrease in thin-film equipment for power semiconductor manufacturing
Measurement & Inspection Equipment Increase in semiconductor non-destructive testing equipment, and inclusion of Hokushinrika as a consolidated subsidiary
Space and Defense Electronics Decrease in satellite components
Copyright © 2002-2013 MARUBUN CORPORATION All Rights Reserved.
[Reference]
22
Page 23
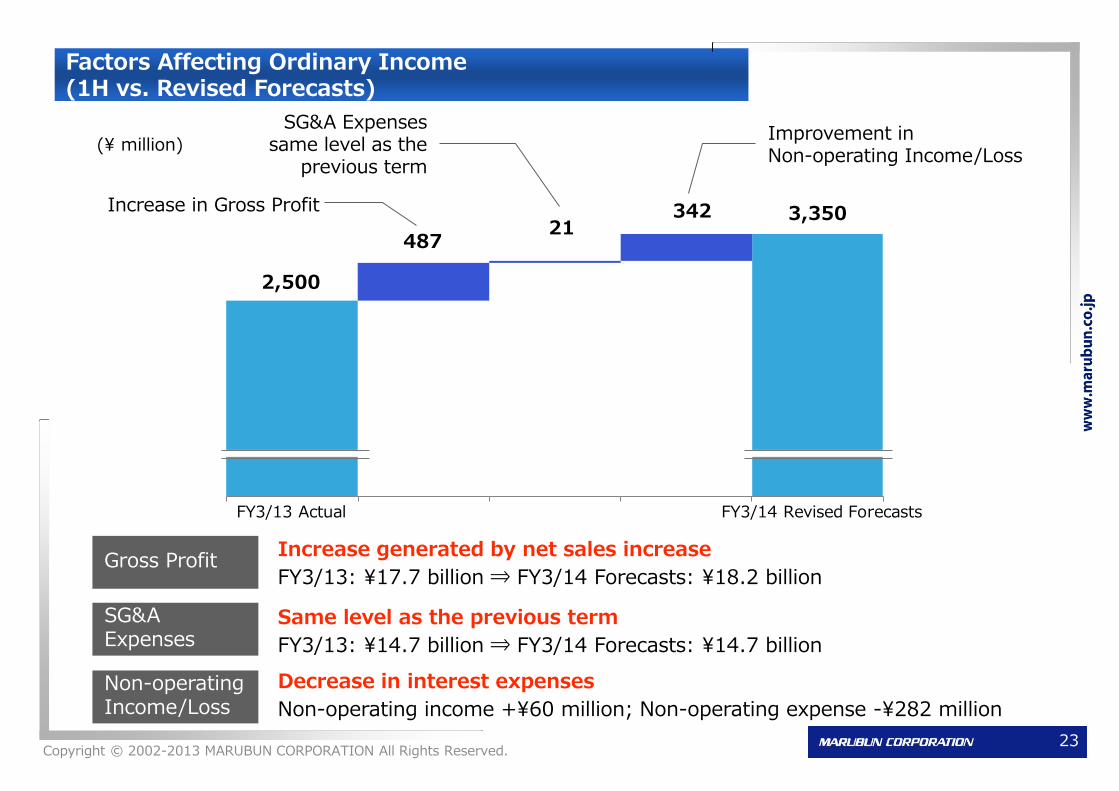
48721
342
1 2 3 4 5FY3/13 Actual FY3/14 Revised Forecasts
2,500
3,350
Factors Affecting Ordinary Income (1H vs. Revised Forecasts)
Increase in Gross Profit
SG&A Expenses same level as the
previous term
Improvement in Non-operating Income/Loss
Increase generated by net sales increase
FY3/13: ¥17.7 billion ⇒ FY3/14 Forecasts: ¥18.2 billion
Same level as the previous term
FY3/13: ¥14.7 billion ⇒ FY3/14 Forecasts: ¥14.7 billion
Decrease in interest expenses
Non-operating income +¥60 million; Non-operating expense -¥282 million
Copyright © 2002-2013 MARUBUN CORPORATION All Rights Reserved. 23
Gross Profit
SG&A Expenses
Non-operating Income/Loss
(¥ million)
Page 24
Return to Shareholders
Copyright © 2002-2013 MARUBUN CORPORATION All Rights Reserved.
Dividends Forecast
24
(\)FY3/13
Actual
FY3/14
Forecasts
Annual Dividend per Share 15.00 16.00
Interim Dividend 6.00 6.00
Year-End Dividend 9.00 10.00
Page 25
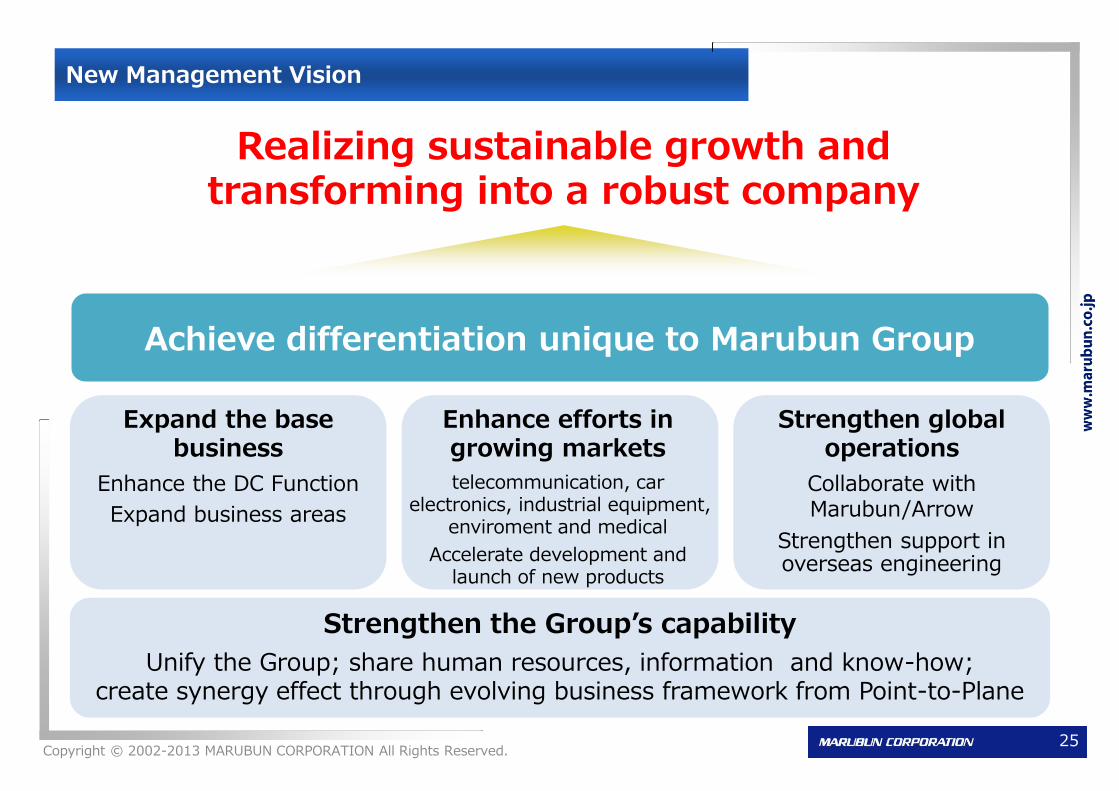
New Management Vision
Expand the base business
Enhance the DC Function
Expand business areas
Enhance efforts in growing markets
telecommunication, car electronics, industrial equipment,
enviroment and medical
Accelerate development and launch of new products
Strengthen global operations
Collaborate with Marubun/Arrow
Strengthen support in overseas engineering
Strengthen the Group’s capability
Unify the Group; share human resources, information and know-how; create synergy effect through evolving business framework from Point-to-Plane
Achieve differentiation unique to Marubun Group
Realizing sustainable growth and transforming into a robust company
25 Copyright © 2002-2013 MARUBUN CORPORATION All Rights Reserved.
Page 26
Appendix
Copyright © 2002-2013 MARUBUN CORPORATION All Rights Reserved.
Page 27
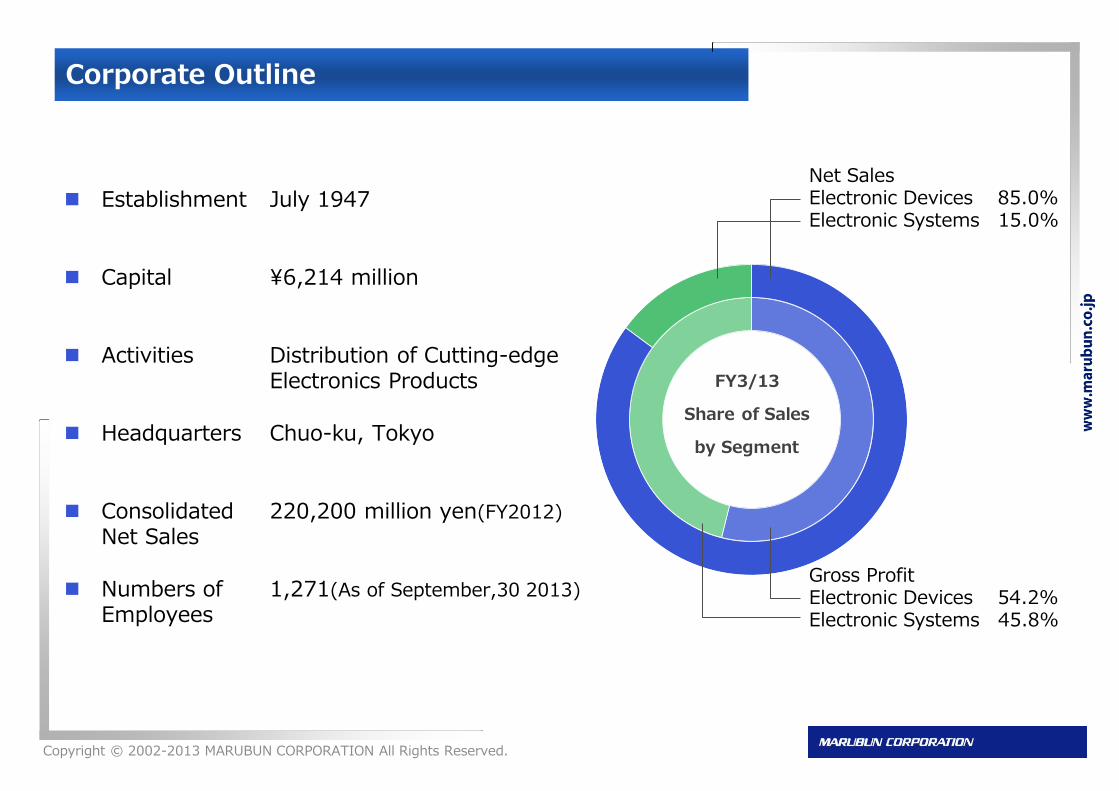
Corporate Outline
Establishment July 1947
Capital ¥6,214 million
Activities Distribution of Cutting-edge Electronics Products
Headquarters Chuo-ku, Tokyo
Consolidated Net Sales
220,200 million yen(FY2012)
Numbers of Employees
1,271(As of September,30 2013)
Net Sales Electronic Devices 85.0% Electronic Systems 15.0%
FY3/13
Share of Sales
by Segment
Gross Profit Electronic Devices 54.2% Electronic Systems 45.8%
Copyright © 2002-2013 MARUBUN CORPORATION All Rights Reserved.
Page 28
History of Company Operations
Japan Over Seas
1844
2013 Business acquisition Hokushin Rika.
1897 The dry goods wholesale business discontinued; Horikoshi Office established to manage the property.
1947 Established Marubun Corp. to sell machinery, instruments and daily-use sundries.
1985 Established Logistics Center.
1997 Listed on the 2nd Section of the Tokyo Stock Exchange.
1952 Contracted with Rocke International, Inc., to serve as their representative office, and began import and sales of American machinery.
1968
1988
1989
1994
1999 Established Marubun/Arrow USA, LLC.
1998 Established Marubun/Arrow Asia Limited.
2001
2005
1965 Imported and sold ICs (made by TI) at first in Japan.
1961 Established Marubun Tsusho Co.,Ltd.
2007 Business acquisition of Foresight Techno Co.,Ltd.
2001
2002
2006
Copyright © 2002-2013 MARUBUN CORPORATION All Rights Reserved.
Listed on the 1st Section of the Tokyo Stock Exchange.
Established Marubun Semicon Corporation to sell SUMSUNG Semiconductors.
Established subsidiary in Singapore.
Established representative office in USA.
Established subsidiary in Taiwan.
Established subsidiary in Hong Kong.
Established subsidiary in Malaysia.
Established subsidiary in Thailand.
Established subsidiary in Shanghai and Philippines.
Dry goods wholesaler "Horikoshi" started a business, at the site of the present company headquarters, that went by the name Marubun.
Page 29
Trend of 10 years
0.0%
10.0%
20.0%
30.0%
40.0%
50.0%
0
50,000
100,000
150,000
200,000
250,000
300,000
FY3/04 FY3/05 FY3/06 FY3/07 FY3/08 FY3/09 FY3/10 FY3/11 FY3/12 FY3/13
(¥ million) Net Sales Foreign Sales Ratio
Copyright © 2002-2013 MARUBUN CORPORATION All Rights Reserved.
Page 30
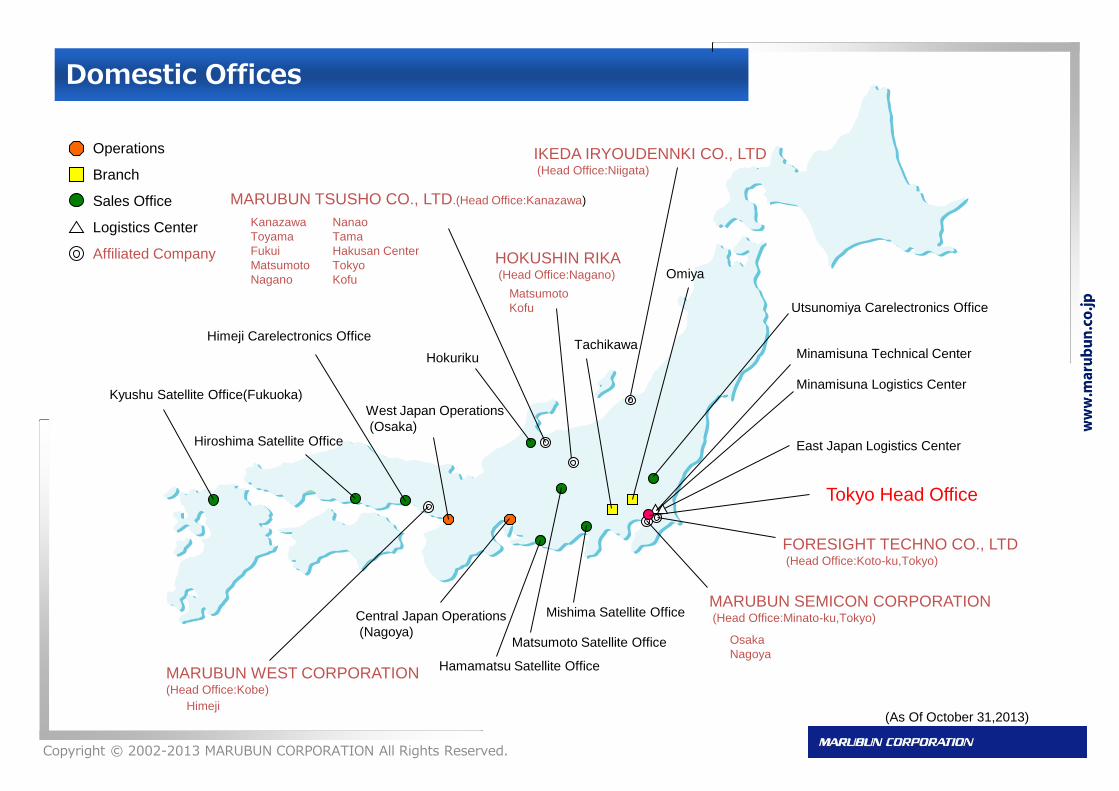
Domestic Offices
Copyright © 2002-2013 MARUBUN CORPORATION All Rights Reserved.
Tokyo Head Office
MARUBUN TSUSHO CO., LTD.(Head Office:Kanazawa)
MARUBUN WEST CORPORATION (Head Office:Kobe)
MARUBUN SEMICON CORPORATION (Head Office:Minato-ku,Tokyo)
Minamisuna Technical Center
Minamisuna Logistics Center
East Japan Logistics Center
Omiya
Tachikawa
Matsumoto Satellite Office
Central Japan Operations
(Nagoya)
West Japan Operations
(Osaka)
Utsunomiya Carelectronics Office
Himeji Carelectronics Office
Osaka
Nagoya
Kanazawa
Toyama
Fukui
Matsumoto
Nagano
Nanao
Tama
Hakusan Center
Tokyo
Kofu
Kyushu Satellite Office(Fukuoka)
Operations
Branch
Sales Office
Logistics Center
Affiliated Company
Hamamatsu Satellite Office
Hiroshima Satellite Office
Himeji
Hokuriku
Mishima Satellite Office
FORESIGHT TECHNO CO., LTD (Head Office:Koto-ku,Tokyo)
(As Of October 31,2013)
IKEDA IRYOUDENNKI CO., LTD (Head Office:Niigata)
HOKUSHIN RIKA (Head Office:Nagano)
Matsumoto
Kofu
Page 31
World-wide Sales Network
MARUBUN CORPORATION Other MARUBUN/ARROW USA, LLC MARUBUN/ARROW ASIA, LTD.
MARUBUN/ARROW(SHANGHAI) CO., LTD (Shanghai)
MARUBUN ARROW(THAI) CO., LTD. (Bangkok)
Marubun Semicon(Shanghai) Co., Ltd. (Shanghai)
MARUBUN/ARROW(HK) LTD (Hong Kong)
MARUBUN ARROW(M) SDN BHD (Penang)
MARUBUN/ARROW(S) PTE LTD (Singapore)
Dalian,China Nanjing,China
Shenzhen,China
Kuala Lunpur,Malaysia
MARUBUN/ARROW ASIA, LTD.
MARUBUN/ARROW(PHILS) INC. (Manila,Philippines)
MARUBUN/ARROW USA, LLC (Head Office:Santa Clara)
Marubun Taiwan Inc. (Taipei)
MARUBUN SEMICON(H.K.) LIMITED (Hong Kong)
MARUBUN CORPORATION
Denver
Chicago
Detroit
Atlanta Dallas
San Diego
Foothill Ranch
MARUBUN SEMICON CORPORATION(Singapore)
Copyright © 2002-2013 MARUBUN CORPORATION All Rights Reserved.
(As Of September 30,2013)
Page 32
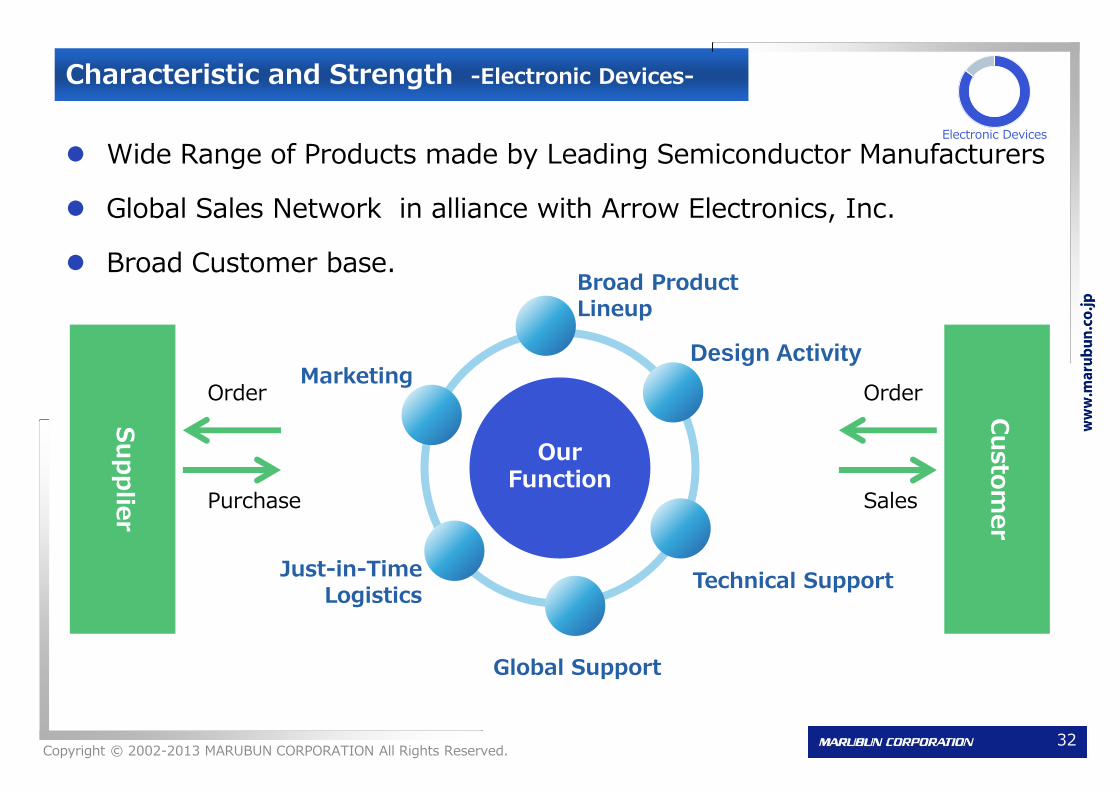
Wide Range of Products made by Leading Semiconductor Manufacturers
Global Sales Network in alliance with Arrow Electronics, Inc.
Broad Customer base.
Characteristic and Strength -Electronic Devices-
Copyright © 2002-2013 MARUBUN CORPORATION All Rights Reserved.
Our Function
Su
pp
lier
Cu
sto
mer
Order
Purchase
Order
Sales
Broad Product Lineup
Design Activity
Technical Support
Global Support
Marketing
Just-in-Time Logistics
Electronic Devices
32
Page 33
Affiliations -Electronic Devices-
* Marubun/Arrow USA, Future Technology & Service Co., Ltd. :Affiliate company
Company Headquarters Establishment Shares Principal Business
Marubun Semicon Corporation Minato-ku, Tokyo Mar. 2005 100.0%
Marubun Semicon (Shanghai) Co., Ltd. Shanghai, China Mar. 2005 100.0%
Marubun Semicon (H.K.) Ltd. Hong Kong, China Jan. 2010 100.0%
Marubun USA Corporation California, U.S.A. Oct. 1983 100.0% Devices Business/Holding Company
Marubun Taiwan, Inc. Taipei, Taiwan Nov. 1989 100.0% Devices Business
Marubun/Arrow Asia, Ltd. Hong Kong, China Oct. 1998 50.0% Devices Business/Holding Company
Marubun/Arrow (S) Pte Ltd. Anson Road, Singapore Mar. 1988 50.0%
Marubun/Arrow (HK) Ltd. Hong Kong, China Aug. 1994 50.0%
Marubun Arrow (Thailand) Co., Ltd. Bangkok, Thailand Oct. 2000 50.0%
Marubun/Arrow (Phils), Inc. Laguna, Philippines Oct. 2001 50.0%
Marubun Arrow (M) SDN BHD Penang, Malaysia Jun. 2006 50.0%
Marubun/Arrow (Shanghai) Co., Ltd. Shanghai, China Sep. 2002 50.0%
Marubun/Arrow USA, LLC* California, U.S.A. Nov. 1998 50.0%
Future Technology & Service Co., Ltd. * Toshima-ku, Tokyo Nov. 2006 29.3% Devices Business
Devices Business
Devices Business
Copyright © 2002-2013 MARUBUN CORPORATION All Rights Reserved.
Electronic Devices
Page 34
Main Products (by Application) -Electronic Devices-
Copyright © 2002-2013 MARUBUN CORPORATION All Rights Reserved. 34
Com
munic
ation
Equip
ment
Consu
mer
Equip
ment
Com
pute
r &
OA
Auto
mobile
Indust
rial
Equip
ment
Semiconductor
Analog ● ● ● ● ●
Discrete ● ● ● ●
Standard Logic IC ● ● ● ● ●
DRAM ● ● ● ●
Flash ● ● ●
MPU,MCU ● ● ● ● ●
DSP ● ● ● ●
ASSP ● ● ●
Display Driver ● ● ●
DMD ● ● ●
LED ●
Custom IC ● ● ● ●
Erectronic Components
● ● ● ●
OELD ● ●
● ● ● ●
●
Application
Analog IC
Memory IC
Micro-
Processor
Special-Use
IC
LCD Panel
Crystal Device
Board Computer
Electronic Devices
Communicati
on
Equipment
40.3%
Consumer
Electronics
26.6%
Computer &
OA
Equipment
14.1%
Automobile
9.7%
産業機器
その他
9.0%
13/3月期 デバイス事業 用途別売上高
187,247百万円
Communication
Equipment
40.3%
Consumer
Electronics
26.7%
Computer &
OA Equipment
14.1%
Automobile
9.7%
Industrial
Equipment
& Other
9.2%
Electronic
Devices
FY3/13
¥187,247million
Page 35
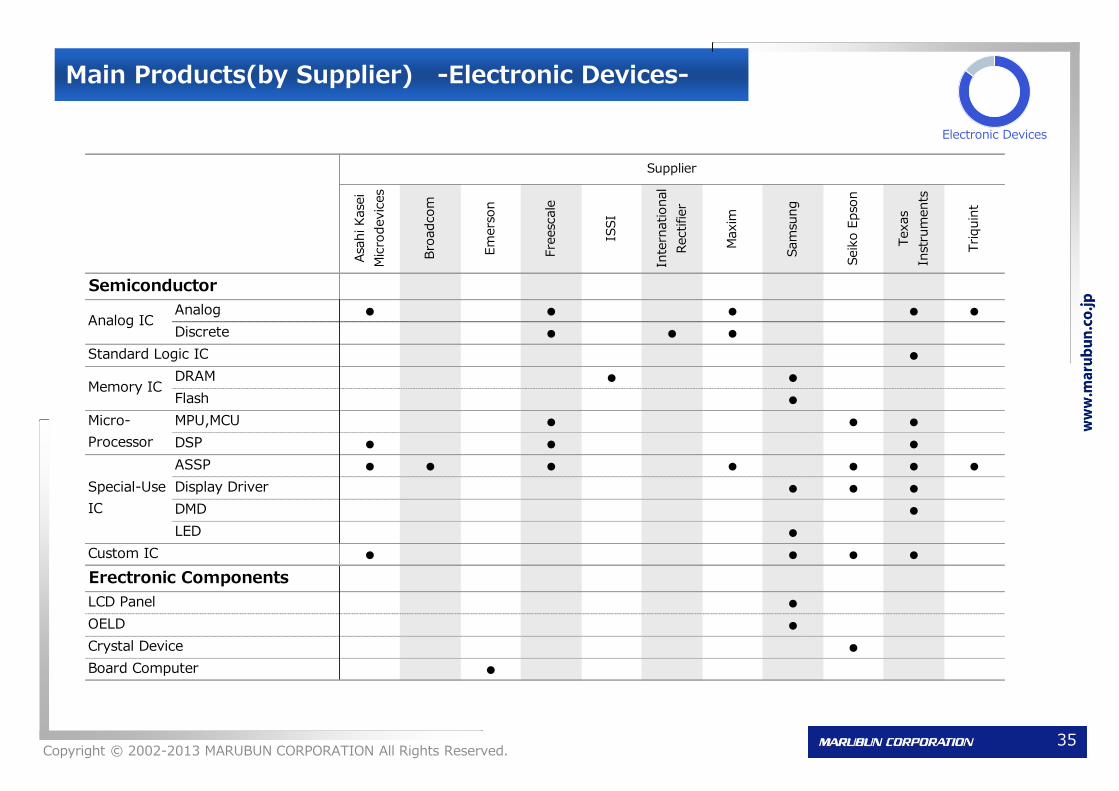
Main Products(by Supplier) -Electronic Devices-
Copyright © 2002-2013 MARUBUN CORPORATION All Rights Reserved. 35
Asa
hi Kase
i
Mic
rodevic
es
Bro
adcom
Em
ers
on
Fre
esc
ale
ISSI
Inte
rnational
Rectifier
Maxim
Sam
sung
Seik
o E
pso
n
Texas
Inst
rum
ents
Triquin
t
Semiconductor
Analog ● ● ● ● ●
Discrete ● ● ●
Standard Logic IC ●
DRAM ● ●
Flash ●
MPU,MCU ● ● ●
DSP ● ● ●
ASSP ● ● ● ● ● ● ●
Display Driver ● ● ●
DMD ●
LED ●
Custom IC ● ● ● ●
Erectronic Components
●
OELD ●
●
●Board Computer
Analog IC
Memory IC
Supplier
Micro-
Processor
Special-Use
IC
LCD Panel
Crystal Device
Electronic Devices
Page 36
Providing Unrivaled Products in High-end Markets
Value-added Technical Support
(System Integration, Installation and Maintenance Services)
Characteristic and Strength -Electronic Systems-
Order
Purchase
Order
Sale
Development cooperation
Technical support
Consultation
Marketing
Su
pp
lier
Cu
sto
mer
Operation Training
Maintenance
Repair
Calibration
Our Function
Electronic Systems
Copyright © 2002-2013 MARUBUN CORPORATION All Rights Reserved. 36
Page 37
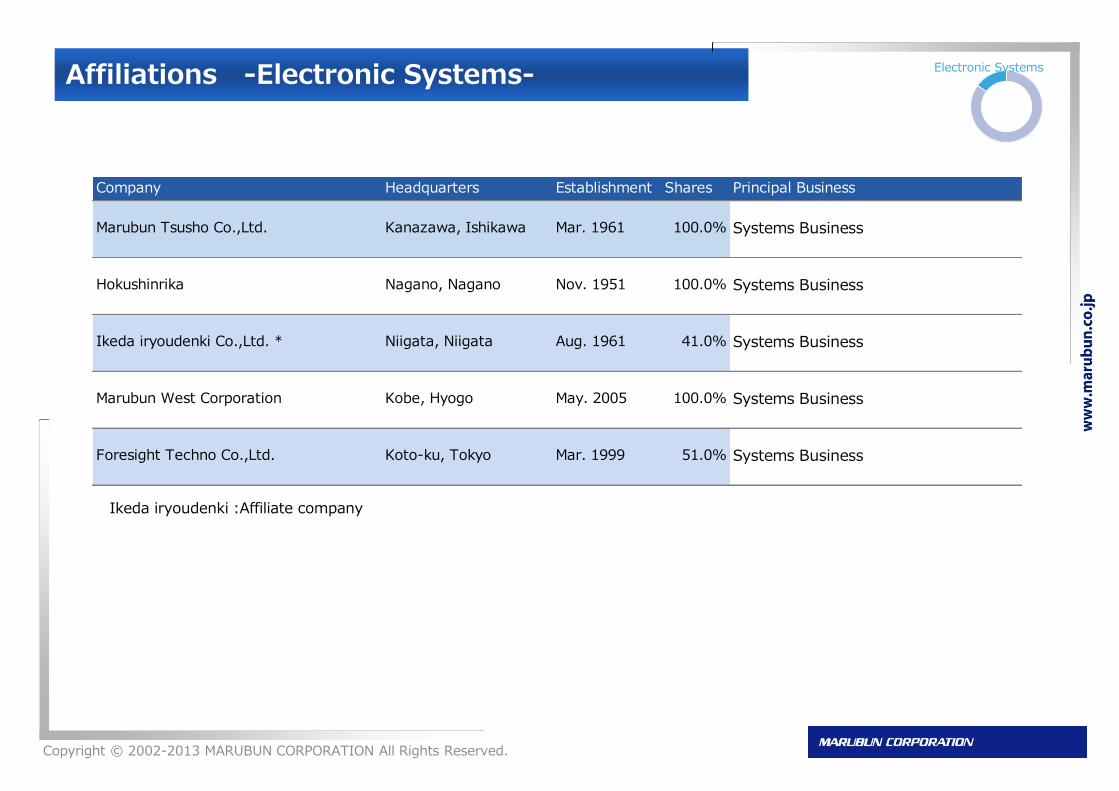
Affiliations -Electronic Systems-
Company Headquarters Establishment Shares Principal Business
Marubun Tsusho Co.,Ltd. Kanazawa, Ishikawa Mar. 1961 100.0% Systems Business
Hokushinrika Nagano, Nagano Nov. 1951 100.0% Systems Business
Ikeda iryoudenki Co.,Ltd. * Niigata, Niigata Aug. 1961 41.0% Systems Business
Marubun West Corporation Kobe, Hyogo May. 2005 100.0% Systems Business
Foresight Techno Co.,Ltd. Koto-ku, Tokyo Mar. 1999 51.0% Systems Business
Copyright © 2002-2013 MARUBUN CORPORATION All Rights Reserved.
Electronic Systems
Ikeda iryoudenki :Affiliate company
Page 38
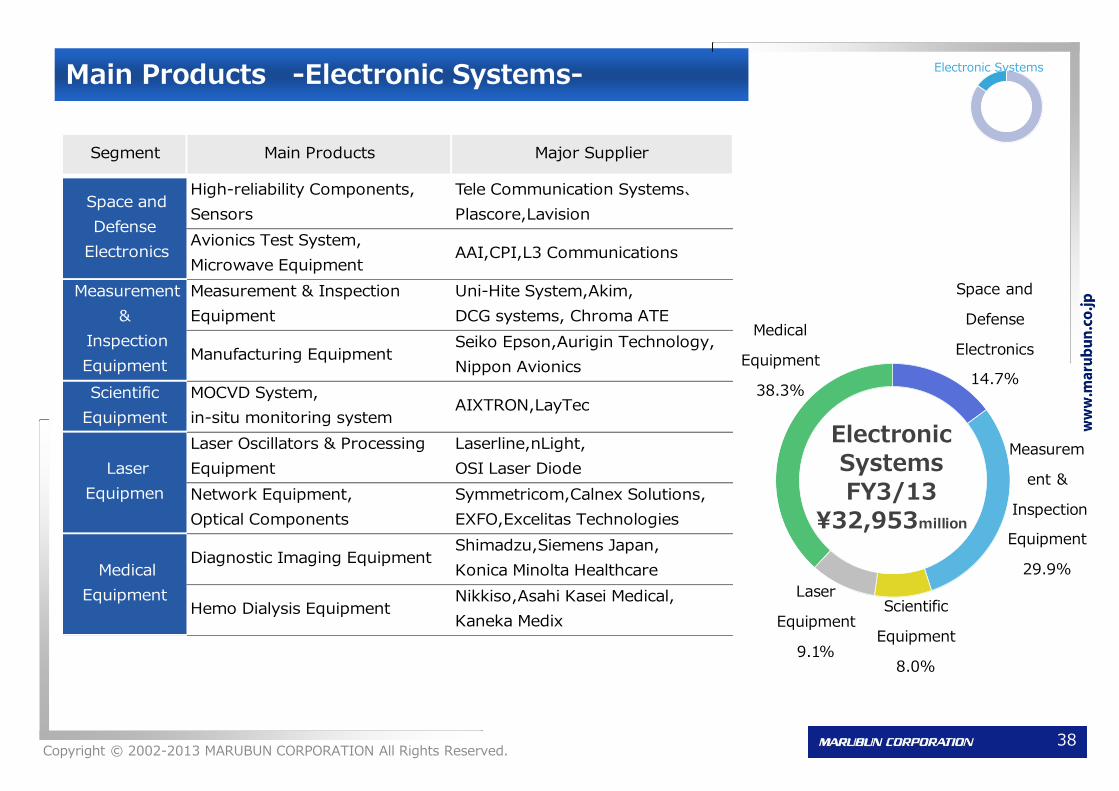
Main Products -Electronic Systems-
Copyright © 2002-2013 MARUBUN CORPORATION All Rights Reserved.
Segment Main Products Major Supplier
High-reliability Components,
Sensors
Tele Communication Systems、
Plascore,Lavision
Avionics Test System,
Microwave EquipmentAAI,CPI,L3 Communications
Measurement & Inspection
Equipment
Uni-Hite System,Akim,
DCG systems, Chroma ATE
Manufacturing EquipmentSeiko Epson,Aurigin Technology,
Nippon Avionics
Scientific
Equipment
MOCVD System,
in-situ monitoring systemAIXTRON,LayTec
Laser Oscillators & Processing
Equipment
Laserline,nLight,
OSI Laser Diode
Network Equipment,
Optical Components
Symmetricom,Calnex Solutions,
EXFO,Excelitas Technologies
Diagnostic Imaging EquipmentShimadzu,Siemens Japan,
Konica Minolta Healthcare
Hemo Dialysis EquipmentNikkiso,Asahi Kasei Medical,
Kaneka Medix
Medical
Equipment
Measurement
&
Inspection
Equipment
Space and
Defense
Electronics
Laser
Equipmen
38
Space and
Defense
Electronics
14.7%
Measurem
ent &
Inspection
Equipment
29.9%
Scientific
Equipment
8.0%
Laser
Equipment
9.1%
Medical
Equipment
38.3%
Electronic
SystemsFY3/13
¥32,953million
Electronic Systems
Page 39
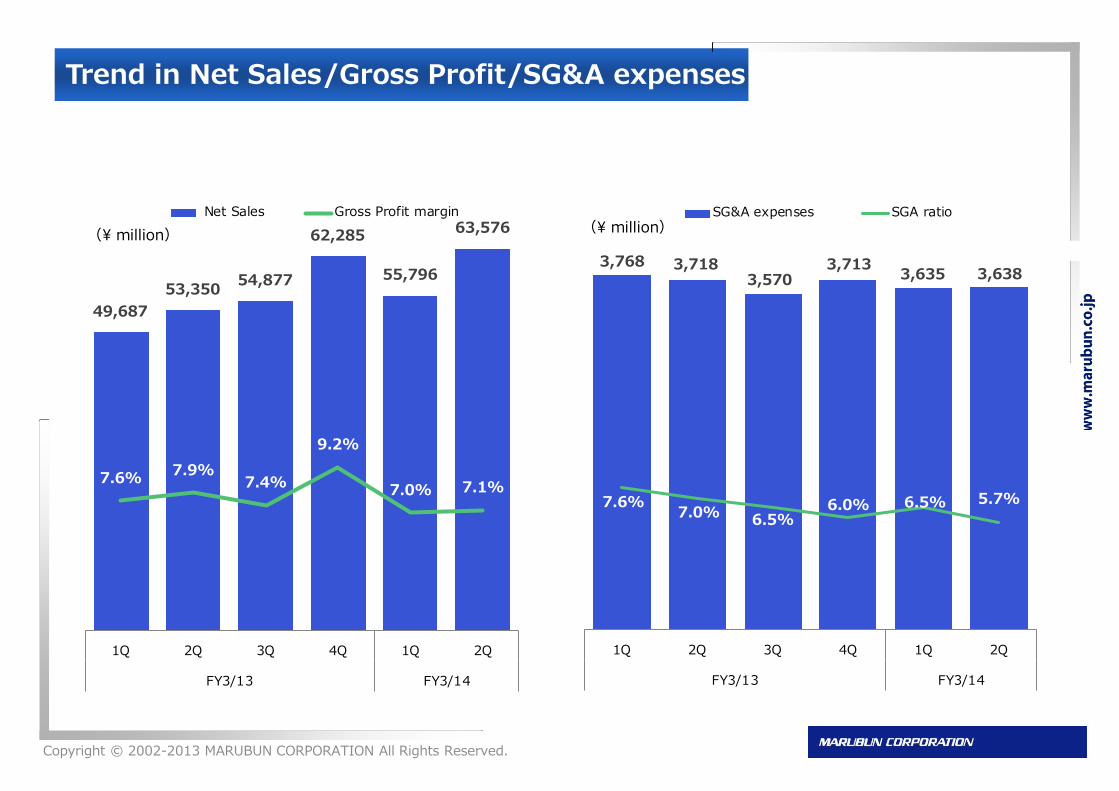
3,768 3,7183,570
3,713 3,6353,638
7.6%7.0% 6.5%
6.0% 6.5% 5.7%
0.0%
10.0%
20.0%
1Q 2Q 3Q 4Q 1Q 2Q
FY3/13 FY3/14
SG&A expenses SGA ratio(¥ million)
3,718 3,7133,635
3,7683,570
Trend in Net Sales/Gross Profit/SG&A expenses
Copyright © 2002-2013 MARUBUN CORPORATION All Rights Reserved.
49,687
53,35054,877
62,285
55,796
63,576
7.6%7.9%
7.4%
9.2%
7.0% 7.1%
1Q 2Q 3Q 4Q 1Q 2Q
FY3/13 FY3/14
Net Sales Gross Profit margin
(¥ million)
Page 40
Trend in Orders/Sales
Orders Sales
43,41346,329 45,220
52,41155,697 54,890
8,1678,881
7,886
8,181
10,673 10,355
51,581
55,21053,107
60,593
66,37165,246
1Q 2Q 3Q 4Q 1Q 2Q
FY3/13 FY3/14
Electronic Devices Electronic Systems
(¥ million)
44,536 44,54648,223 49,941 50,550
54,399
5,1518,804
6,654
12,3435,246
9,177
49,687
53,35054,877
62,285
55,796
63,576
1Q 2Q 3Q 4Q 1Q 2Q
FY3/13 FY3/14
Electronic Devices Electronic Systems
(¥ million)
Copyright © 2002-2013 MARUBUN CORPORATION All Rights Reserved.
Page 41
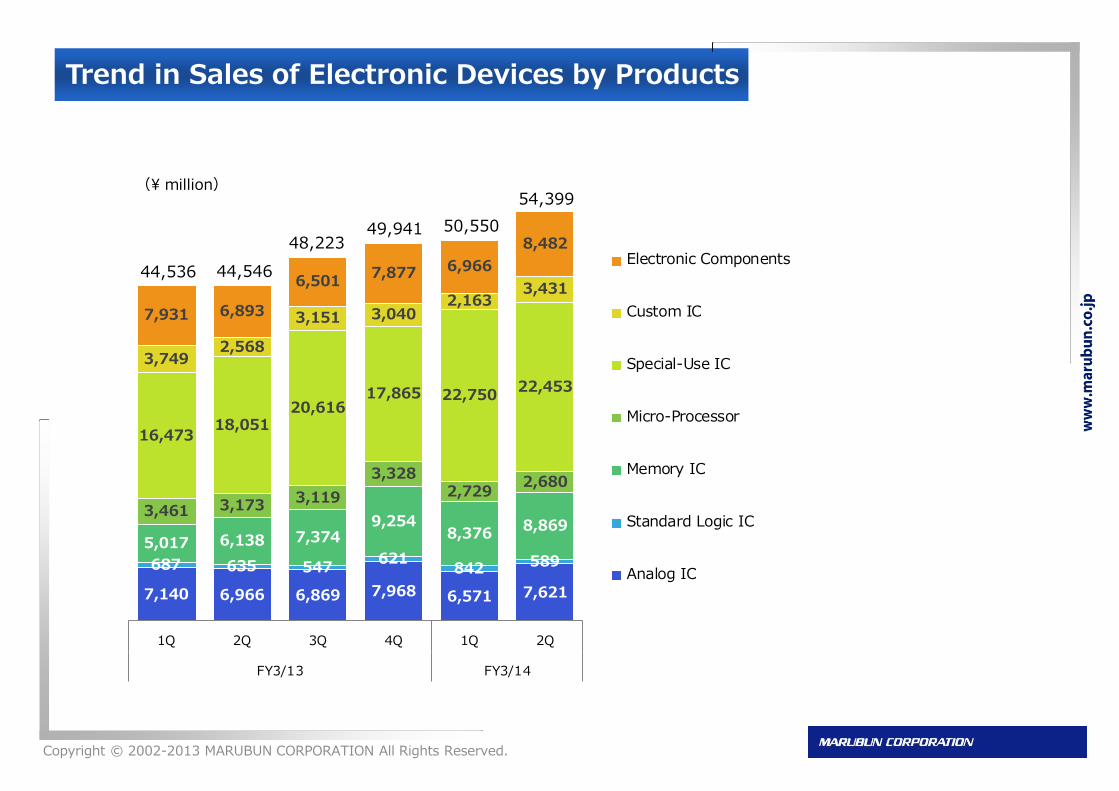
Trend in Sales of Electronic Devices by Products
7,140 6,966 6,869 7,968 6,571 7,621
687 635 547621
842 5895,017 6,138 7,374
9,2548,376
8,8693,461 3,173
3,119
3,3282,729
2,680
16,47318,051
20,61617,865 22,750
22,453
3,7492,568
3,151 3,0402,163
3,431
7,931 6,893
6,5017,877 6,966
8,482
1Q 2Q 3Q 4Q 1Q 2Q
FY3/13 FY3/14
Electronic Components
Custom IC
Special-Use IC
Micro-Processor
Memory IC
Standard Logic IC
Analog IC
(¥ million)
44,536 44,546
48,22349,941 50,550
54,399
Copyright © 2002-2013 MARUBUN CORPORATION All Rights Reserved.
Page 42
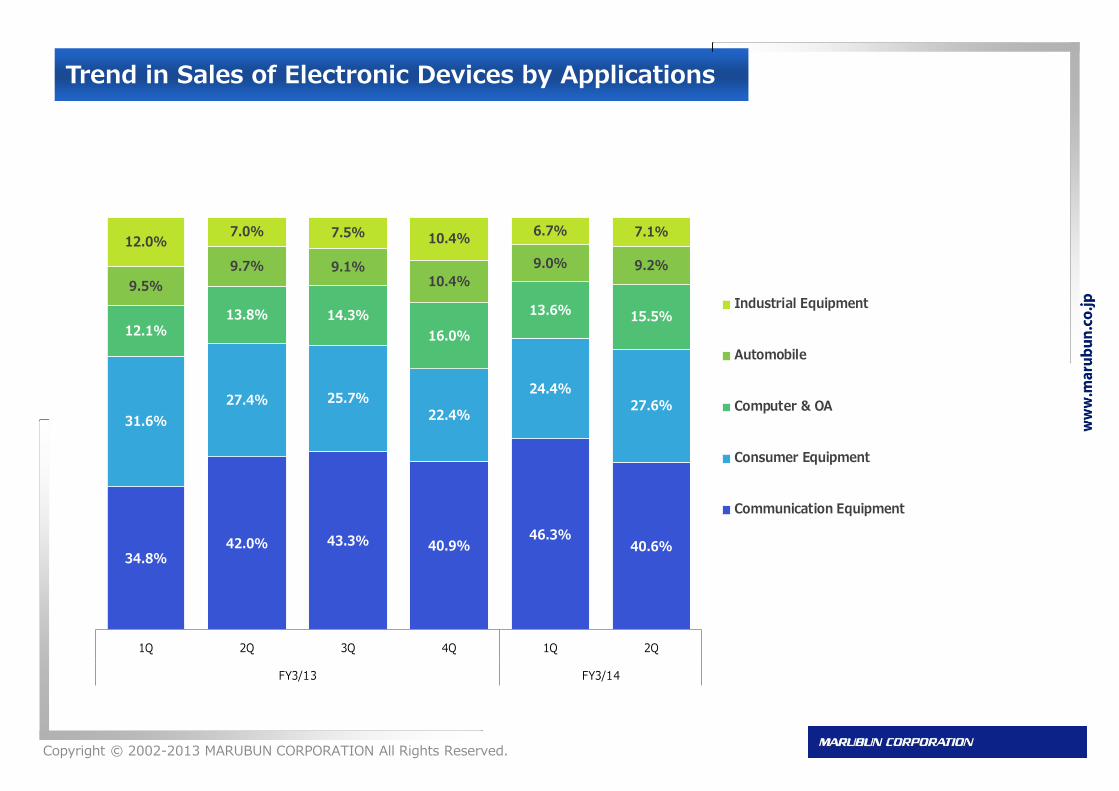
Trend in Sales of Electronic Devices by Applications
34.8%42.0% 43.3% 40.9%
46.3%40.6%
31.6%
27.4% 25.7%22.4%
24.4%27.6%
12.1%13.8% 14.3%
16.0%
13.6% 15.5%
9.5%
9.7% 9.1%10.4%
9.0% 9.2%
12.0%7.0% 7.5% 10.4%
6.7% 7.1%
1Q 2Q 3Q 4Q 1Q 2Q
FY3/13 FY3/14
Industrial Equipment
Automobile
Computer & OA
Consumer Equipment
Communication Equipment
Copyright © 2002-2013 MARUBUN CORPORATION All Rights Reserved.
Page 43
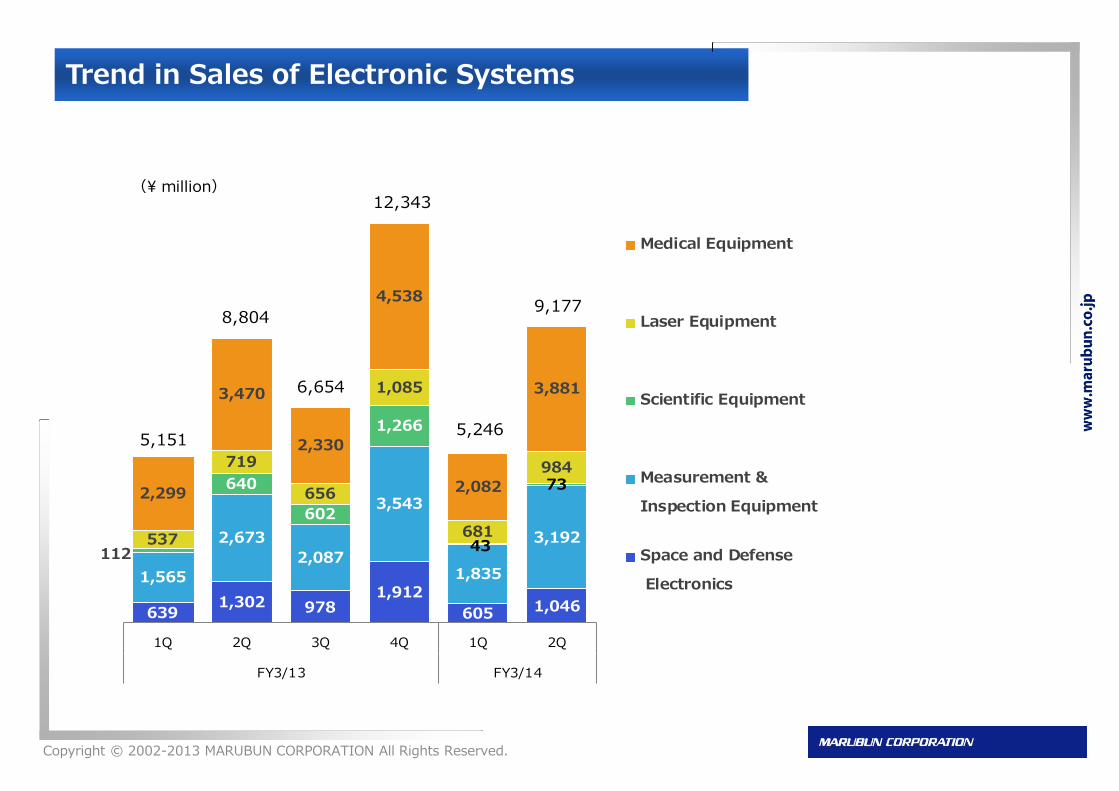
Trend in Sales of Electronic Systems
6391,302 978
1,912
605 1,046
1,565
2,673
2,087
3,543
1,835
3,192112
640
602
1,266
43
73
537
719
656
1,085
681
984
2,299
3,470
2,330
4,538
2,082
3,881
1Q 2Q 3Q 4Q 1Q 2Q
FY3/13 FY3/14
Medical Equipment
Laser Equipment
Scientific Equipment
Measurement &
Inspection Equipment
Space and Defense
Electronics
(¥ million)
5,151
8,804
6,654
12,343
5,246
9,177
Copyright © 2002-2013 MARUBUN CORPORATION All Rights Reserved.
Page 44
Cautionary Statement
Within the presentation, information on the future performance such as results forecasts is
based on the data available at the time this presentation was prepared that the Company
assumes reasonable. Actual performance depends on various important factors and may
differ significantly from the estimates contained herein.
MARUBUN CORPORATION
CORPORATE PLANNING Dept.
PHONE +81-3-3639-3010
E-mail [email protected]
Contact
Copyright © 2002-2013 MARUBUN CORPORATION All Rights Reserved. 44