53
(Component Unit of the Commonwealth of Pennsylvania) FINANCIAL STATEMENTS AND INDEPENDENT AUDITOR’S REPORT For the Years Ended June 30, 2019 and 2018

22
(Component Unit of the Commonwealth of Pennsylvania)
FINANCIAL STATEMENTS
AND
INDEPENDENT AUDITOR’S REPORT
For the Years Ended June 30, 2019 and 2018
23
PENNSYLVANIA INFRASTRUCTURE INVESTMENT AUTHORITY
TABLE OF CONTENTS
Page
Independent Auditor’s Report 1 - 3
Management’s Discussion and Analysis 4 - 10
Basic Financial Statements:
Statements of Net Position 11-12
Statements of Revenues, Expenses, and Changes in Net Position 13
Statements of Cash Flows 14 - 15
Notes to Financial Statements 16 - 37
Required Supplementary Information:
Schedules of PENNVEST’s Proportionate Share of the Net Pension Liability 38
Schedules of PENNVEST’s Contributions – Pension 39
Schedules of PENNVEST’s Proportionate Share of the Net OPEB Liability 40
Schedules of PENNVEST’s Contribution - OPEB 41
Other Supplemental Information:
Federal Clean Water State Revolving Loan Fund:
Schedules of Net Position 42
Schedules of Revenues, Expenses, and Changes in Net Position 43
Schedules of Cash Flows 44
Federal Drinking Water State Revolving Loan Fund:
Schedules of Net Position 45
Schedules of Revenues, Expenses, and Changes in Net Position 46
Schedules of Cash Flows 47
Notes to Fund Schedules 48
Schedules of Delinquent Loans 49
Independent Auditor’s Report on Internal Control Over Financial Reporting andon Compliance and Other Matters Based on an Audit of Financial StatementsPerformed in Accordance with Government Auditing Standards 50 - 51

24

25
26
27
PENNSYLVANIA INFRASTRUCTURE INVESTMENT AUTHORITYMANAGEMENT’S DISCUSSION AND ANALYSIS
For the Year Ended June 30, 2019
4
This section of Pennsylvania Infrastructure Investment Authority’s (“PENNVEST” or “Program”) annual financial report presents the Management’s Discussion and Analysis (“MD&A”) of PENNVEST’s financial performance during the fiscal year that ended June 30, 2019. It is intended to be read in conjunction with the PENNVEST financial statements and accompanying notes, which follow this section.
FINANCIAL HIGHLIGHTS
In 2019, the Total Net Position increased by $198.8 million. The increase was mainly as a result of Total Assets increasing by $159.6 million and Total Liabilities decreasing by $40.1 million. Total Assets increased primarily due to an increase in gross loan receivables (noncurrent) of $74.8 million that was driven by increasing funding demand that resulted in an increase in the outstanding loan portfolio. There were also increases in cash and cash equivalents of approximately $49.6 million, an increase in income from investments of approximately $13.8 million and a decrease in allowance for loan losses of $16.1 million.
OVERVIEW OF THE FINANCIAL STATEMENTS
This annual report consists of three parts: management’s discussion and analysis, financial statements, and supplemental information. The financial statements also include notes that explain in more detail some of the information in the financial statements. The MD&A serves as an introduction to the basic financial statements and supplementary information and presents management’s examination and analysis of PENNVEST’s financial condition and performance.
REQUIRED FINANCIAL STATEMENTS
The financial statements of PENNVEST report information about PENNVEST using accounting methods similar to those used by private sector companies. These statements offer short-term and long-term financial information about its activities.
The Statements of Net Position include all PENNVEST’s assets, deferred outflows of resources, liabilities and deferred inflows of resources and provides information about investments, revenue bonds, and federal government obligations. All of the current year’s revenues are accounted for in the Statements of Revenues, Expenses and Changes in Net Position. These statements measure the fiscal condition of PENNVEST’s operations over the past year and can be used to determine whether PENNVEST has remained creditworthy and in a positive financial order. The final required financial statements are the Statements of Cash Flows. The primary purpose of these statements is to provide information about PENNVEST’s cash receipts and cash disbursements, net changes in cash resulting from operations, investing, and financing activities and provides answers to such questions as, where did the cash come from, what was the cash used for, and what was the change in cash balance during the report period.
FINANCIAL ANALYSIS
The issued report provides comparative statements for a two-year period. This presentation enables a reader to determine by category the basic analysis of a year’s activity. The Statements of Net Position, and the Statements of Revenues, Expenses, and Changes in Net Position report information about PENNVEST and provide an excellent examination of financial performance.
28
PENNSYLVANIA INFRASTRUCTURE INVESTMENT AUTHORITYMANAGEMENT’S DISCUSSION AND ANALYSIS, Continued
For the Year Ended June 30, 2019
5
FINANCIAL ANALYSIS, Continued
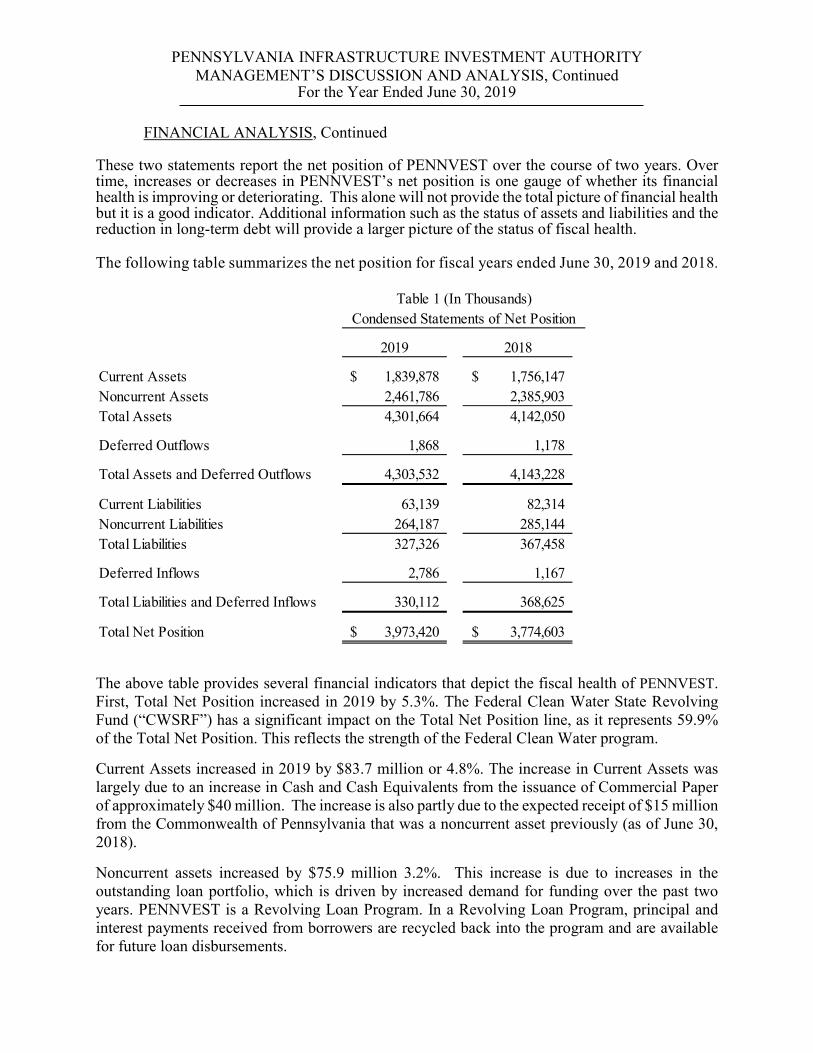
These two statements report the net position of PENNVEST over the course of two years. Over time, increases or decreases in PENNVEST’s net position is one gauge of whether its financial health is improving or deteriorating. This alone will not provide the total picture of financial health but it is a good indicator. Additional information such as the status of assets and liabilities and the reduction in long-term debt will provide a larger picture of the status of fiscal health.
The following table summarizes the net position for fiscal years ended June 30, 2019 and 2018.
2019 2018
Current Assets 1,839,878$ 1,756,147$Noncurrent Assets 2,461,786 2,385,903Total Assets 4,301,664 4,142,050
Deferred Outflows 1,868 1,178
Total Assets and Deferred Outflows 4,303,532 4,143,228
Current Liabilities 63,139 82,314Noncurrent Liabilities 264,187 285,144Total Liabilities 327,326 367,458
Deferred Inflows 2,786 1,167
Total Liabilities and Deferred Inflows 330,112 368,625
Total Net Position 3,973,420$ 3,774,603$
Table 1 (In Thousands)Condensed Statements of Net Position
The above table provides several financial indicators that depict the fiscal health of PENNVEST.First, Total Net Position increased in 2019 by 5.3%. The Federal Clean Water State Revolving Fund (“CWSRF”) has a significant impact on the Total Net Position line, as it represents 59.9% of the Total Net Position. This reflects the strength of the Federal Clean Water program.
Current Assets increased in 2019 by $83.7 million or 4.8%. The increase in Current Assets was largely due to an increase in Cash and Cash Equivalents from the issuance of Commercial Paper of approximately $40 million. The increase is also partly due to the expected receipt of $15 million from the Commonwealth of Pennsylvania that was a noncurrent asset previously (as of June 30, 2018).
Noncurrent assets increased by $75.9 million 3.2%. This increase is due to increases in the outstanding loan portfolio, which is driven by increased demand for funding over the past two years. PENNVEST is a Revolving Loan Program. In a Revolving Loan Program, principal and interest payments received from borrowers are recycled back into the program and are available for future loan disbursements.
29
PENNSYLVANIA INFRASTRUCTURE INVESTMENT AUTHORITYMANAGEMENT’S DISCUSSION AND ANALYSIS, Continued
For the Year Ended June 30, 2019
6
FINANCIAL ANALYSIS, Continued
The ability to encumber against future year revenues is critical for a revolving program. Noncurrent Loans Receivable, Gross, are those future loans that are due in more than one year. The Noncurrent Assets total is reduced by the Allowance for Loan Losses which is $28.9 million for the year ended June 30, 2019.
Current Liabilities decreased in 2019 by $19.2 million or 23.3%; driven by payoff of outstanding commercial paper.
Noncurrent Liabilities decreased in 2019 by $21.0 million or 7.3%. The decrease is primarily the result debt service payments on outstanding General Obligation bonds.
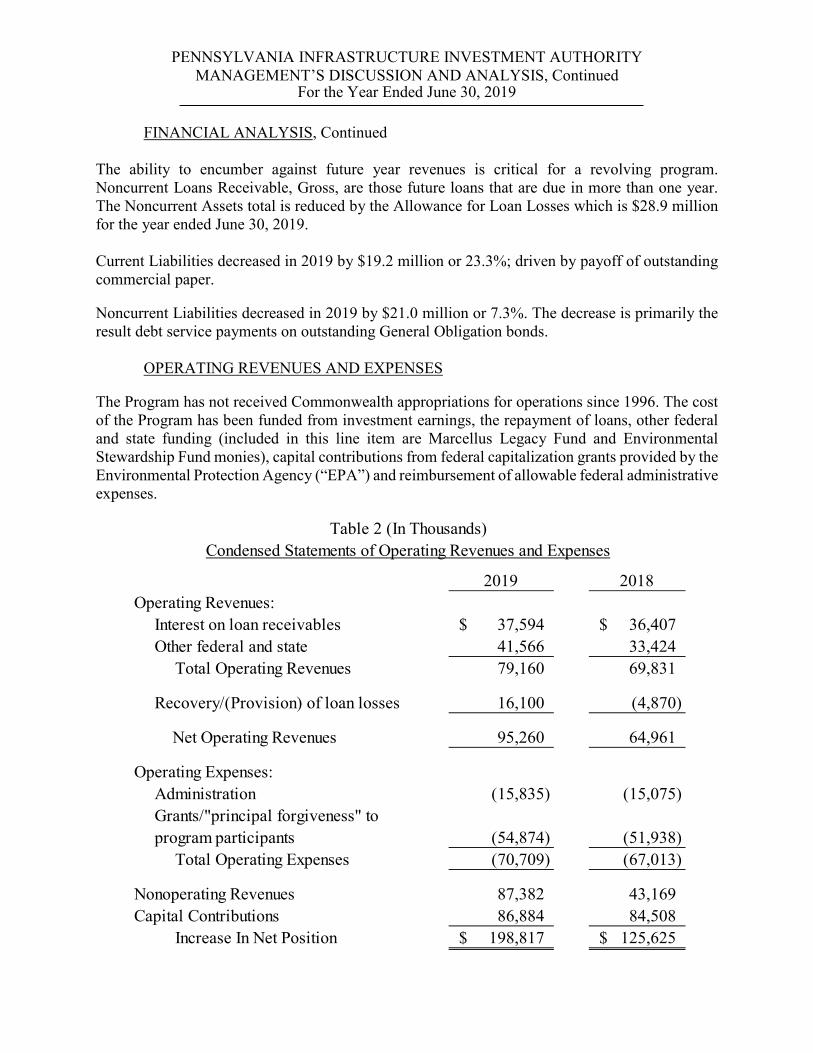
OPERATING REVENUES AND EXPENSES
The Program has not received Commonwealth appropriations for operations since 1996. The cost of the Program has been funded from investment earnings, the repayment of loans, other federal and state funding (included in this line item are Marcellus Legacy Fund and Environmental Stewardship Fund monies), capital contributions from federal capitalization grants provided by the Environmental Protection Agency (“EPA”) and reimbursement of allowable federal administrative expenses.
2019 2018Operating Revenues:
Interest on loan receivables 37,594$ 36,407$Other federal and state 41,566 33,424
Total Operating Revenues 79,160 69,831
Recovery/(Provision) of loan losses 16,100 (4,870)
Net Operating Revenues 95,260 64,961
Operating Expenses:Administration (15,835) (15,075)Grants/"principal forgiveness" toprogram participants (54,874) (51,938)
Total Operating Expenses (70,709) (67,013)
Nonoperating Revenues 87,382 43,169Capital Contributions 86,884 84,508
Increase In Net Position 198,817$ 125,625$
Table 2 (In Thousands)Condensed Statements of Operating Revenues and Expenses
30
PENNSYLVANIA INFRASTRUCTURE INVESTMENT AUTHORITYMANAGEMENT’S DISCUSSION AND ANALYSIS, Continued
For the Year Ended June 30, 2019
7
OPERATING REVENUES AND EXPENSES, Continued
The Operating Revenues (as shown in Table 2), in 2019 were driven by the Other Federal and State Operating Grants of $41.6 million, and interest payments on loans of $37.6 million.
The Total Operating Expenses (as shown in Table 2) increased by 5.5%, or $3.7 million in 2019.Increases in the amount disbursed as Grant/“Principal Forgiveness” primarily accounted for this increase. These increases are a direct effect on how many applicants qualify for rate or Grant/”Principal Forgiveness” subsidy.
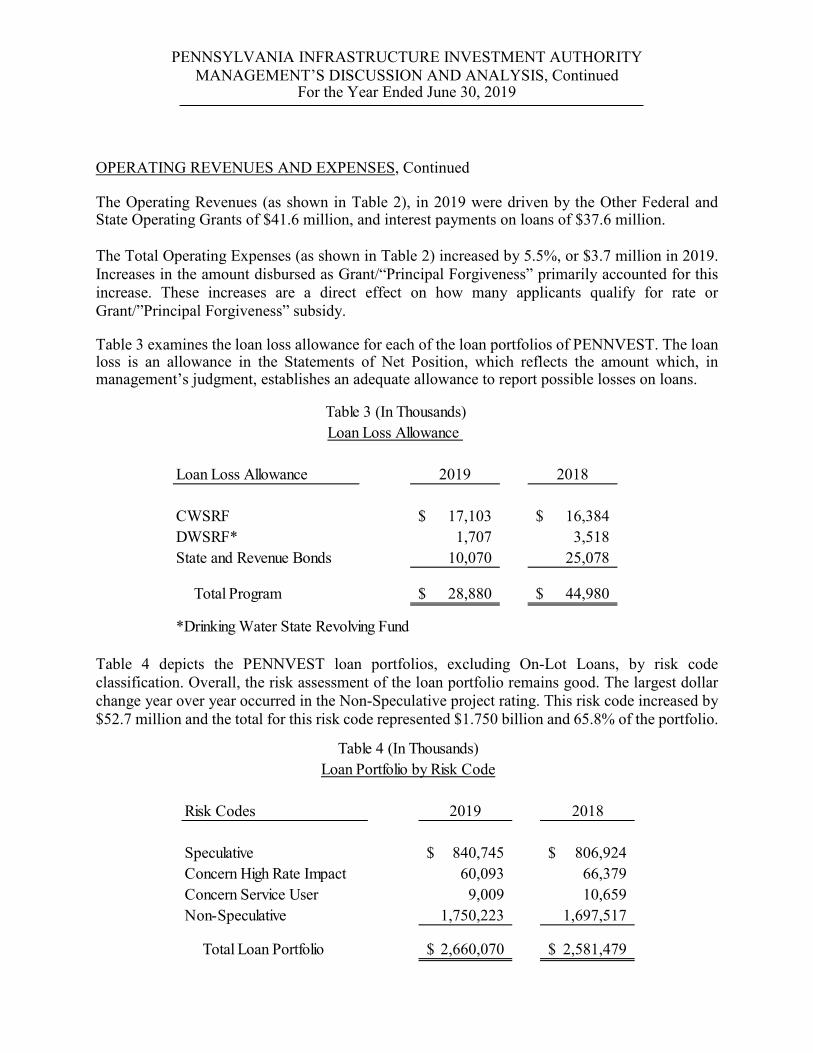
Table 3 examines the loan loss allowance for each of the loan portfolios of PENNVEST. The loan loss is an allowance in the Statements of Net Position, which reflects the amount which, in management’s judgment, establishes an adequate allowance to report possible losses on loans.
Table 4 depicts the PENNVEST loan portfolios, excluding On-Lot Loans, by risk code classification. Overall, the risk assessment of the loan portfolio remains good. The largest dollar change year over year occurred in the Non-Speculative project rating. This risk code increased by $52.7 million and the total for this risk code represented $1.750 billion and 65.8% of the portfolio.
Loan Loss Allowance 2019 2018
CWSRF 17,103$ 16,384$DWSRF* 1,707 3,518State and Revenue Bonds 10,070 25,078
Total Program 28,880$ 44,980$
*Drinking Water State Revolving Fund
Table 3 (In Thousands)Loan Loss Allowance
Risk Codes 2019 2018
Speculative 840,745$ 806,924$Concern High Rate Impact 60,093 66,379Concern Service User 9,009 10,659Non-Speculative 1,750,223 1,697,517
Total Loan Portfolio 2,660,070$ 2,581,479$
Table 4 (In Thousands)Loan Portfolio by Risk Code

31
PENNSYLVANIA INFRASTRUCTURE INVESTMENT AUTHORITYMANAGEMENT’S DISCUSSION AND ANALYSIS, Continued
For the Year Ended June 30, 2019
8
REVENUES
As PENNVEST is a Revolving Loan Program, it is essential that loan repayments be made in a timely manner. Over 99.67% of all loans in every PENNVEST portfolio are submitting repayments electronically with the electronic funds transfer program offered under the Automatic Clearing House (ACH) system; however, funds must be available for payment in the borrowers’ accounts. By all accounts, the PENNVEST ACH system is working and funds are available for repayment. Table 5 illustrates the loan receipts by the different loan portfolios of PENNVEST.
As can be observed from Table 5, loan receipts vary for each of the PENNVEST portfolios. These receipts are categorized as deposits that do not include any transfers. The CWSRF Program had the largest dollar collection of $109.2 million or 51.5% of the total collected. The CWSRF is a major portfolio in the PENNVEST program. Total loan receipts decreased by $19.7 million from 2018, which is reflective of older projects being paid-in-full combined with lower than usual loan approvals during the prior few years.
Loan Receipts 2019 2018
CWSRF Federal Loans 109,164$ 125,356$DWSRF Federal Loans 44,118 41,927State and Revenue Bond Loans 58,684 64,426
Total 211,966$ 231,709$
Table 5 (In Thousands)Loan Receipts from Customers
Table 6 is an illustration of the PENNVEST disbursements to customers. The total disbursement of $255.0 million reflects an increase of $24.9 million from 2018 or an increase of 10.8%. The CWSRF Federal disbursements were the primary driver of this increase, making up 76.6% of the Total Disbursements. The large increase in the CWSRF was heavily influenced by increasing applications over the past two years.
Loan Disbursements 2019 2018
CWSRF Federal Loans 195,321$ 154,194$DWSRF Federal Loans 37,403 37,897State and Revenue Bond Loans 22,315 38,065
All Portfolios Disbursements 255,039$ 230,156$
Loan Disbursements to CustomersTable 6 (In Thousands)

32
PENNSYLVANIA INFRASTRUCTURE INVESTMENT AUTHORITYMANAGEMENT’S DISCUSSION AND ANALYSIS, Continued
For the Year Ended June 30, 2019
9
LONG-TERM DEBT ADMINISTRATION
In 2015, PENNVEST issued Revenue Bonds Series 2015A, in the amount of $65.0 million. The bonds were issued at a premium of $8.3 million. The proceeds of the bonds together with other available funds were used to pay off the outstanding commercial paper.
In 2018, PENNVEST issued Revenue Bonds Series 2018A, in the amount of $50.0 million. The bonds were issued at a premium of $8.4 million. The issuance was the first utilizing the Federal State Revolving Fund (“SRF”) funds as collateral for the issuance.
At June 30, 2019, PENNVEST had $116.9 million of revenue bond debt and $30.1 million commercial paper debt outstanding. Revenue Bonds Payable decreased in 2019 by $7.5 million from the previous year due to debt service. The following is a summary of Revenue Bond activity for the 2018-2019 fiscal year.
See Notes 6 and 7 to the financial statements for detailed descriptions of the outstanding debt and the current year activity.
FUTURE PROGRAMS UNDER DEVELOPMENT
Commercial Paper Programs
PENNVEST established a Commercial Paper (CP) program in 2010-2011 in our Commonwealth program (state funded projects). This mechanism allows PENNVEST to better manage the cash flows so that funds on hand with the Commonwealth Treasurer can be invested for a longer term and a higher rate than would otherwise be the case.
PENNVEST entered into a Federal SRF Trust Indenture and First Supplemental Trust agreements and issued $50 million in SRF Revenue Bonds in January 2018. These indentures allow for the issuance of revenue bonds, commercial paper, and implementation of a loan/bond guarantee program. It is cross-collateralized with both the CWSRF and DWSRF. In February 2019, PENNVEST issued Tax-Exempt Extendable Maturity Commercial Paper (“EMCP”) Notes (Series 2019A) in an aggregate principal amount outstanding at any time up to $75 million as an additional tool to leverage the SRF funds and support future needs of the program. Zion’s Bank was selected as the Trustee.
Table 7 (In Thousands)Outstanding debt July 1, 2018 $ 174,609 Less: Principal payments (26,691)Net change in unamortized premium (1,071)
Outstanding debt at June 30, 2019 $ 146,847

33
PENNSYLVANIA INFRASTRUCTURE INVESTMENT AUTHORITYMANAGEMENT’S DISCUSSION AND ANALYSIS, Concluded
For the Year Ended June 30, 2019
10
FUTURE PROGRAMS UNDER DEVELOPMENT, Continued
Nutrient Trading
During FY 2018-2019 PENNVEST continued to track the Nutrient Subsidy Value for projects that may be able to create nutrient credits. PENNVEST may claim repayment of the subsidy value when the credits are sold or if credits are needed for the Trading Bank. Further, PENNVEST has a collateral interest in 2 projects. Department of Environmental Protection (DEP) continues to certify, verify and register nutrient credits.
Loan Guarantee Program
During 2018-2019 PENNVEST continued developing a Loan Guarantee program to supplement its loan program. This allows PENNVEST to provide further assistance to the borrowers when the cost of the project is more than PENNVEST can lend. The Loan Guarantee allows the borrowers to find private financing for the balance of a project with a reduced interest rate.
Riparian Buffer Initiative
Projects are currently being installed with the first year approvals. Year 2 application cut off has resulted in considerably more applicants than available funds. The 2019-2020 fiscal year will bring the final series of approvals for this program. The expectation that we can collect business model related information in a few as three years after installation.
CONTACTING PENNVEST’S DIRECTOR OF FINANCIAL MANAGEMENT
This financial report is designed to provide bondholders, investors, creditors, and federal and state agencies with a general overview of PENNVEST’s finances and to demonstrate PENNVEST’s accountability as a governmental agency. If you have any questions about this report or need additional financial information, contact Steven Anspach, Executive Director of Financial Management, PENNVEST, 333 Market Street, 18th Floor, Harrisburg, PA 17101.
34
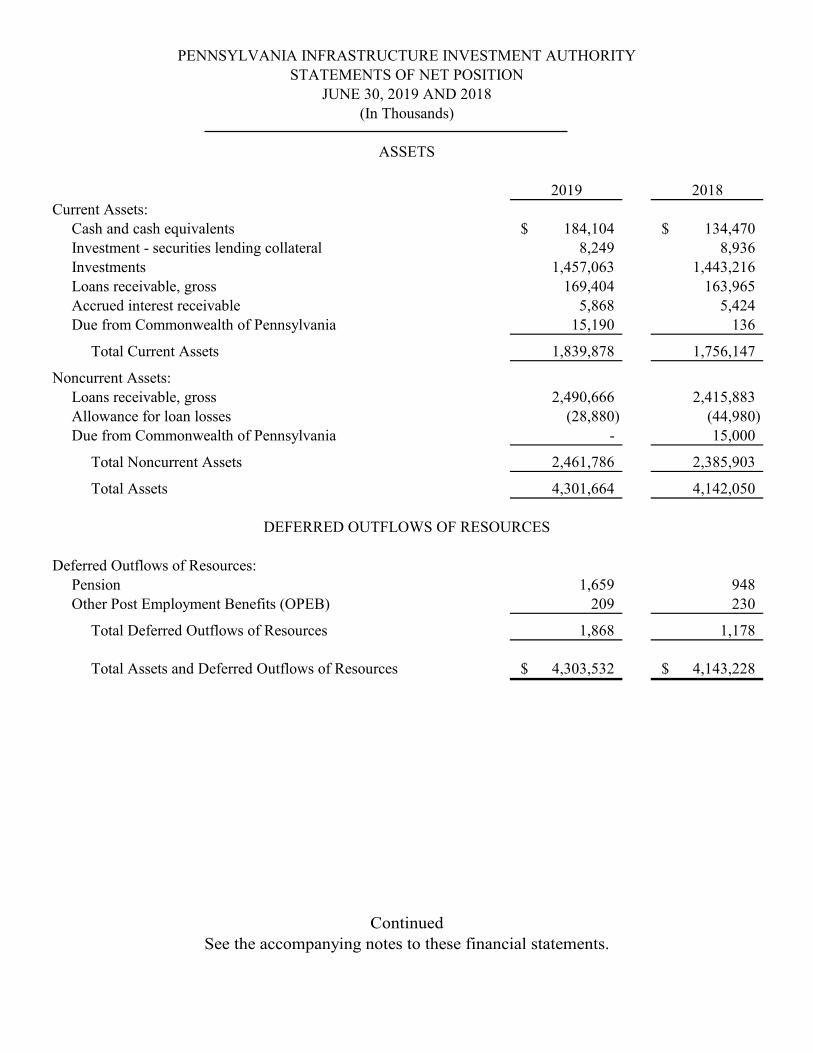
ContinuedSee the accompanying notes to these financial statements.
11
2019 2018Current Assets:
Cash and cash equivalents 184,104$ 134,470$ Investment - securities lending collateral 8,249 8,936Investments 1,457,063 1,443,216Loans receivable, gross 169,404 163,965Accrued interest receivable 5,868 5,424Due from Commonwealth of Pennsylvania 15,190 136
Total Current Assets 1,839,878 1,756,147
Noncurrent Assets:Loans receivable, gross 2,490,666 2,415,883Allowance for loan losses (28,880) (44,980)Due from Commonwealth of Pennsylvania - 15,000
Total Noncurrent Assets 2,461,786 2,385,903
Total Assets 4,301,664 4,142,050
Deferred Outflows of Resources:Pension 1,659 948Other Post Employment Benefits (OPEB) 209 230
Total Deferred Outflows of Resources 1,868 1,178
Total Assets and Deferred Outflows of Resources 4,303,532$ 4,143,228$
ASSETS
PENNSYLVANIA INFRASTRUCTURE INVESTMENT AUTHORITYSTATEMENTS OF NET POSITION
JUNE 30, 2019 AND 2018(In Thousands)
DEFERRED OUTFLOWS OF RESOURCES

See the accompanying notes to these financial statements.12
Current Liabilities:Accounts payable 1,862$ 1,034$Due to federal government 1,934 1,725Due to Commonwealth of Pennsylvania 14,120 13,768Securities lending obligation 8,249 8,936Short-term obligations 30,123 50,371Compensated absences 117 101Current portion of net OPEB liability 84 119Current portion of revenue bonds payable 6,650 6,260
Total Current Liabilities 63,139 82,314
Noncurrent Liabilities:Due to Commonwealth of Pennsylvania 140,480 152,851Compensated absences 500 430Noncurrent revenue bonds payable 110,074 117,978Net pension liability 7,573 6,105Net OPEB liability 5,560 7,780
Total Noncurrent Liabilities 264,187 285,144
Total Liabilities 327,326 367,458
Deferred Inflows of Resources:Pension 142 440OPEB 2,644 727
Total Deferred Inflows of Resources 2,786 1,167
Total Liabilities and Deferred Inflows of Resources 330,112 368,625
Restricted:Federal clean water revolving loan program 2,378,279 2,251,405Federal drinking water revolving loan program 762,295 717,556
Total Restricted 3,140,574 2,968,961
Unrestricted 832,846 805,642
Total Net Position 3,973,420$ 3,774,603$
NET POSITION
DEFERRED INFLOWS OF RESOURCES
PENNSYLVANIA INFRASTRUCTURE INVESTMENT AUTHORITYSTATEMENTS OF NET POSITION, Continued
JUNE 30, 2019 AND 2018(In Thousands)
LIABILITIES

See the accompanying notes to these financial statements.13
2019 2018Operating Revenues:
Interest on loans receivable 37,594$ 36,407$Federal and state grants 41,566 33,424
Operating Revenues before Recovery/(Provision) for Loan Losses 79,160 69,831
Recovery/(Provision) of loan losses 16,100 (4,870)
Net Operating Revenues 95,260 64,961
Operating Expenses:Administration 15,835 15,075Grants/"principal forgiveness" to program participants 54,874 51,938
Total Operating Expenses 70,709 67,013
Operating Income (Loss) 24,551 (2,052)
Nonoperating Revenues/(Expenses):Investment income 94,641 47,529Interest and amortization expense (7,259) (4,088)Bond issuance costs - (272)
Total Nonoperating Revenues 87,382 43,169
Income before Capital Contributions 111,933 41,117
Capital Contributions:Other federal and state grants 86,884 84,508
Total Capital Contributions 86,884 84,508
Increase In Net Position 198,817 125,625
Net Position - Beginning of Year, before Restatement 3,774,603 3,656,019Cumulative effect of change in accounting principle - (7,041)Net Position - Beginning of Year, after Restatement 3,774,603 3,648,978
Net Position - End of Year 3,973,420$ 3,774,603$
STATEMENTS OF REVENUES, EXPENSES, AND CHANGES IN NET POSITIONFOR THE YEARS ENDED JUNE 30, 2019 AND 2018
(In Thousands)
PENNSYLVANIA INFRASTRUCTURE INVESTMENT AUTHORITY
ContinuedSee the accompanying notes to these financial statements.
14
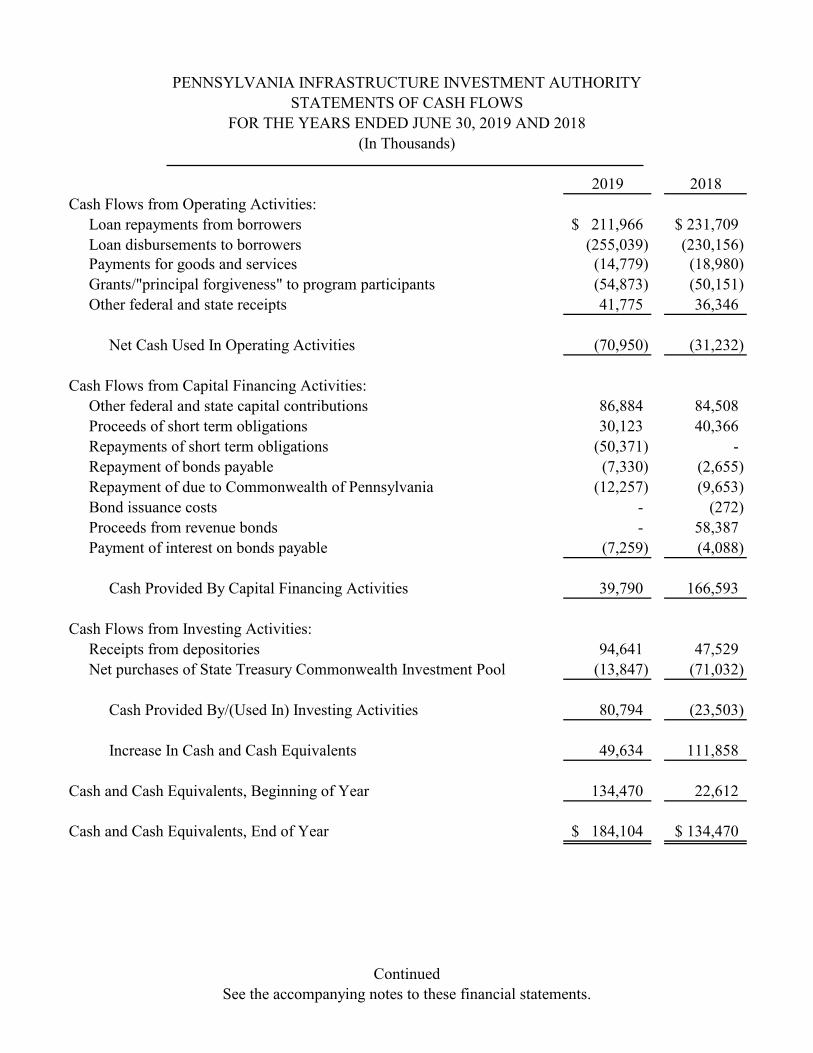
2019 2018Cash Flows from Operating Activities:
Loan repayments from borrowers 211,966$ 231,709$ Loan disbursements to borrowers (255,039) (230,156) Payments for goods and services (14,779) (18,980) Grants/"principal forgiveness" to program participants (54,873) (50,151) Other federal and state receipts 41,775 36,346
Net Cash Used In Operating Activities (70,950) (31,232)
Cash Flows from Capital Financing Activities:Other federal and state capital contributions 86,884 84,508 Proceeds of short term obligations 30,123 40,366 Repayments of short term obligations (50,371) - Repayment of bonds payable (7,330) (2,655) Repayment of due to Commonwealth of Pennsylvania (12,257) (9,653) Bond issuance costs - (272) Proceeds from revenue bonds - 58,387 Payment of interest on bonds payable (7,259) (4,088)
Cash Provided By Capital Financing Activities 39,790 166,593
Cash Flows from Investing Activities:Receipts from depositories 94,641 47,529 Net purchases of State Treasury Commonwealth Investment Pool (13,847) (71,032)
Cash Provided By/(Used In) Investing Activities 80,794 (23,503)
Increase In Cash and Cash Equivalents 49,634 111,858
Cash and Cash Equivalents, Beginning of Year 134,470 22,612
Cash and Cash Equivalents, End of Year 184,104$ 134,470$
FOR THE YEARS ENDED JUNE 30, 2019 AND 2018(In Thousands)
PENNSYLVANIA INFRASTRUCTURE INVESTMENT AUTHORITYSTATEMENTS OF CASH FLOWS

See the accompanying notes to these financial statements.15
2019 2018Reconciliation of Operating Income to Net Cash Used InOperating Activities:
Operating income (loss) 24,551$ (2,052)$Adjustments to reconcile operating income (loss) to net cash
(used in)/provided by operating activities:(Recovery)/Provision of loan losses (16,100) 4,870Cumulative effect of change in accounting principle - (7,041)
Changes in operating assets and liabilities:Loan receivable, gross (80,222) (34,558)Accrued interest receivable (444) (296)Due to federal government 209 2,943Deferred outflow (690) 507Accounts payable 828 (2,477)Accrued compensated absences 86 41Unearned revenue - (21)Net pension liability 1,468 (786)Net OPEB liability (2,255) 6,649Deferred inflow 1,619 989
Total adjustments (95,501) (29,180)Net Cash Used In Operating Activities (70,950)$ (31,232)$
FOR THE YEARS ENDED JUNE 30, 2019 AND 2018(In Thousands)
PENNSYLVANIA INFRASTRUCTURE INVESTMENT AUTHORITYSTATEMENTS OF CASH FLOWS, Continued

39
PENNSYLVANIA INFRASTRUCTURE INVESTMENT AUTHORITYNOTES TO FINANCIAL STATEMENTS
FOR THE YEARS ENDED JUNE 30, 2019 and 2018(In Thousands Except for Percentages)
16
1. SUMMARY OF SIGNIFICANT ACCOUNTING POLICIES
Organization
The Pennsylvania Infrastructure Investment Authority (“PENNVEST”) is an instrumentality of the Commonwealth of Pennsylvania (“Commonwealth”) created by Act 16 of the General Assembly in March of 1988 (the “PENNVEST Act”). The purpose of PENNVEST is to finance long-term, low-interest loans for corporations, partnerships, sole proprietorships, non-profit organizations, authorities, and municipalities for repair, construction, reconstruction, rehabilitation, extension, and improvement of drinking water, storm water, and wastewater systems. PENNVEST’s On-Lot Program provides funding for the improvement of septic systems.PENNVEST is funded through revenue bonds, federal grants, Commonwealth appropriations, Commonwealth general obligation bonds, and the use of recycled loan repayments.
A governing body of thirteen members, administers the operations of PENNVEST. The Chairman of the governing body is the Governor or the Governor’s designee. Other members include cabinet secretaries, legislators, and local government leaders, as well as representatives of the engineering community and the drinking water and wastewater industries.
PENNVEST, which is a component unit of the Commonwealth reporting entity, is presented as an Enterprise Fund on the accrual basis of accounting. Criteria considered in making this determination include the Commonwealth’s appointment of PENNVEST’s Board and the Commonwealth’s ability to impose its will on PENNVEST.
Measurement Focus and Basis of Accounting
PENNVEST’s activities are accounted for on a cost of services or “capital maintenance” approach under the economic resources measurement focus. This means that all assets and all liabilities (whether current or noncurrent) associated with its activities are included on its statement of net position. The operating statements present increases (revenues) and decreases (expenses) in total net position.
PENNVEST utilizes the accrual basis of accounting wherein revenues are recognized in the period earned and expenses are recognized when they are incurred.
Operating revenues and expenses consist of those revenues and expenses that result from the ongoing principal operations of PENNVEST. Operating revenues consist primarily of interest on loans receivable, and federal and state grants received for the purpose of providing grants or “principal forgiveness” to program participants. Nonoperating revenues and expenses consist of those revenues and expenses that are related to financing and investing types of activities, such as investment income/loss.

40
PENNSYLVANIA INFRASTRUCTURE INVESTMENT AUTHORITYNOTES TO FINANCIAL STATEMENTS, ContinuedFOR THE YEARS ENDED JUNE 30, 2019 and 2018
(In Thousands Except for Percentages)
17
1. SUMMARY OF SIGNIFICANT ACCOUNTING POLICIES, Continued
Measurement Focus and Basis of Accounting, Continued
When an expense is incurred for purposes for which there are both restricted and unrestricted resources available, it is PENNVEST’s policy to apply those expenses to restricted resources to the extent that they are available and then to unrestricted resources.
The accounting and reporting policies of PENNVEST conform to the accounting rules prescribed by the Governmental Accounting Standards Board (“GASB”).
Cash and Cash Equivalents
For purposes of the Statements of Cash Flows, PENNVEST considers all highly liquid investments with an initial maturity of three months or less at the time of purchase to be cash equivalents.
Investments
Investments are stated at fair value based on quoted market values.
Capital Contributions
Capitalcontributions represent contributions from the Commonwealth of Pennsylvania and the federal government for the loan programs.
Allowance for Loan Losses
The allowance for loan losses is used to report possible future losses on loans outstanding. Loan losses and recoveries of previously charged-off loans are charged or credited directly to the allowance for loan losses. The provision for loan losses, which is charged to current operations, reflects the amount, which in management’s judgment establishes an adequate allowance to report possible losses on loans. Management’s judgment is based upon a continuing review of the loan portfolio, past collection experience, and current economic conditions. While management uses available information to recognize losses on loans, future adjustments to the allowance may be necessary based on changes in economic conditions.
Investment/Interest Income
Interest income on investment securities is recorded when earned. Interest income on loans is accrued based on methods that result in a constant yield when related to the principal amounts outstanding.

41
PENNSYLVANIA INFRASTRUCTURE INVESTMENT AUTHORITYNOTES TO FINANCIAL STATEMENTS, ContinuedFOR THE YEARS ENDED JUNE 30, 2019 and 2018
(In Thousands Except for Percentages)
18
1. SUMMARY OF SIGNIFICANT ACCOUNTING POLICIES, Continued
Restricted Net Position
Restricted net position represents net position that is restricted for revolving loans in the Federal Revolving Clean Water and Drinking Water Programs.
Use of Estimates
The preparation of financial statements in conformity with U.S. generally accepted accounting principles requires management to make estimates and assumptions that affect certain reported amounts and disclosures. Accordingly, actual results could differ from those estimates.
Deferred Outflows/Inflows of Resources
The Statements of Net Position report a separate section for deferred outflows and inflows of resources. These separate financial statement elements represent consumption/acquisition of net position that applies to future periods, and so will not be recognized as an outflow/inflow of resources until then. PENNVEST has two items that qualifies for reporting in this category: deferred outflows/inflows related to pension and other post-employment benefits.
Postemployment Benefits Other Than Pensions (“OPEB”)
For purposes of measuring the PENNVEST 's OPEB liability, deferred outflows and inflows of resources related to OPEB, and OPEB expense, information about the fiduciary net position of the Commonwealth’s Retired Employees Health Plan (“REHP”) and additions to/deductions from the REHP 's fiduciary net position have been determined on the same basis as they are reported in the Commonwealth’s Comprehensive Annual Financial Report (“CAFR”). For this purpose, the REHP recognizes benefit payments when due and payable in accordance with the benefit terms. Investments are reported at fair value.
Prior Period Adjustment
Effective July 1, 2017, PENNVEST implemented the Governmental Accounting Standards Board (GASB) Statement No. 75, “Accounting, and Financial Reporting for Postemployment Benefits Other Than Pensions (OPEB)”. The implementation of GASB 75 established new standards for measuring and recognizing liabilities, deferred outflows of resources, deferred inflows of resources, and expenses related to OPEB. The implementation of GASB 75 resulted in a restatement of the previously reported GASB 45 OPEB liability, therefore, the Fund’s beginning Net Position has also been restated.
Changes as of June 30, 2018 were restated as follows:
Net Position, as previously reported at June 30, 2017 $ 3,656, 019Cumulative effect of GASB 75 implementation (7,041)Net Position, as restated, at July 1, 2017 $ 3,648,978
42
PENNSYLVANIA INFRASTRUCTURE INVESTMENT AUTHORITYNOTES TO FINANCIAL STATEMENTS, ContinuedFOR THE YEARS ENDED JUNE 30, 2019 and 2018
(In Thousands Except for Percentages)
19
1. SUMMARY OF SIGNIFICANT ACCOUNTING POLICIES, Continued
Pending Changes in Accounting Principles
GASB Statement No. 87, “Leases” was issued in June 2017, with an effective date for reporting periods beginning after December 15, 2019, earlier application is encouraged: This statement increases the usefulness of governments’ financial statements by requiring recognition of certain lease assets and liabilities for leases that previously were classified as operating leases and recognized as inflows of resources or outflows of resources based on the payment provisions of the contract. It establishes a single model for lease accounting based on the foundational principle that leases are financings of the right to use an underlying asset. PENNVEST’s management is evaluating the impact of this statement on the financial statements.
GASB Statement No. 89, “Accounting for Interest Cost Incurred Before the End of a Construction Period” was issued in June 2018, with an effective date for reporting periods beginning after December 15, 2019, earlier application is encouraged: This statement establishes accounting requirements for interest cost incurred before the end of a construction period. Such interest cost includes all interest that previously was accounted for in accordance with the requirements of paragraphs 5–22 of Statement No. 62, Codification of Accounting and Financial Reporting Guidance Contained in Pre-November 30, 1989 FASB and AICPA Pronouncements, which are superseded by this statement. This statement requires that interest cost incurred before the end of a construction period be recognized as an expense in the period in which the cost is incurred for financial statements prepared using the economic resources measurement focus. As a result, interest cost incurred before the end of a construction period will not be included in the historical cost of a capital asset reported in a business-type activity or Enterprise Fund. PENNVEST’s management is evaluating the impact of this statement on the financial statements.
Adopted Accounting Principle
GASB Statement No. 88, “Certain Disclosures Related to Debt, including Direct Borrowings and Direct Placements” was issued in April 2018, with an effective date for reporting periods beginning after June 15, 2018, earlier application is encouraged: This statement defines debt for purposes of disclosure in notes to financial statements as a liability that arises from a contractual obligation to pay cash (or other assets that may be used in lieu of cash) in one or more payments to settle an amount that is fixed at the date the contractual obligation is established. It requires additional essential information related to debt be disclosed in notes to financial statements, including unused lines of credit; assets pledged as collateral for the debt; and terms specified in debt agreements related to significant events of default with finance-related consequences,significant termination events with finance-related consequences, and significant subjective acceleration clauses. PENNVEST’s adoption of this statement had no significant impact on the financial statements.

43
PENNSYLVANIA INFRASTRUCTURE INVESTMENT AUTHORITYNOTES TO FINANCIAL STATEMENTS, ContinuedFOR THE YEARS ENDED JUNE 30, 2019 and 2018
(In Thousands Except for Percentages)
20
2. DEPOSIT AND INVESTMENT RISK
The trust indenture and the Commonwealth fiscal code, as amended, authorizes PENNVEST to invest in obligations of the U.S. government and government-sponsored agencies and instrumentalities; certificates of deposit, fully insured or collateralized; certain commercial paper and repurchase agreements; highly rated bank promissory notes or investment funds or trusts; and “prudent man” investments as determined by PENNVEST’s depository (i.e. Commonwealth Treasury Department).
The majority of PENNVEST’s investments are invested in the Common Investment Pool of the Commonwealth which is managed by the Commonwealth’s Treasury Department (the “Treasury Department”).
The deposit and investment policies of the Treasury Department are governed by Sections 301, 301.1 and 505 of the Pennsylvania Fiscal Code (Act of 1929 P.L. 343), and Section 321.1 of the Pennsylvania Administrative Code (Act of 1929 P.L. 177. No. 175).
Treasury deposits must be held in insured depositories approved by the Board of Finance and Revenue and must be fully collateralized. The Pennsylvania Fiscal Code grants the Treasury Department the authority to invest in any deposits and investments. This authority is subject,however, to the exercise of full judgment and care under the prevailing circumstances. Persons of prudence, discretion, and intelligence familiar with such matters in regard to the permanent disposition of the funds need to consider the probable income to be derived therefrom, as well asthe probable safety of the capital.
The Treasury Department manages the Commonwealth Investment Program (“CIP”). The Treasury Department is required to exercise careful judgment in determining those investments that are appropriate for each Commonwealth fund based upon distinct investment criteria such as income needs, cash flow requirements, investment time horizons, and risk tolerance. All investments are made in accordance with the statutory authority described in the preceding paragraph. The CIP investment pool structure invests in both equity securities and fixed income securities to achieve the investment objectives of the funds of the CIP. Asset allocation targets among cash, equity securities, fixed income securities and alternatives are established in order to meet these overall objectives.
The Treasury Department has created two separate pools within the CIP, each with its own distinct investment strategies, goals, and holdings that reflect the differing needs of Commonwealth fundsfor income, cash flows, and investment risk tolerance. A highly liquid vehicle, Pool 99, consists of short-term fixed income and cash and provides a high degree of liquidity and security but only modest returns. A less liquid vehicle, Pool 198, allows for investment in assets that offer potentially higher returns with commensurate risk.
44
PENNSYLVANIA INFRASTRUCTURE INVESTMENT AUTHORITYNOTES TO FINANCIAL STATEMENTS, ContinuedFOR THE YEARS ENDED JUNE 30, 2019 and 2018
(In Thousands Except for Percentages)
21
2. DEPOSIT AND INVESTMENT RISK, Continued
As of June 30, 2019 and 2018, PENNVEST’s investments, excluding securities lending balances (see below), held in the Commonwealth investment pools, were $1,457,063 and $1,443,216,respectively.
As of June 30, 2019 and 2018, PENNVEST also had bank balances of cash and cash equivalents in the amount of $184,052 and $133,880, respectively. These balances were uninsured and collateralized with securities held by the pledging financial institution’s trust department or agent but not in the PENNVEST’s name.
Securities Lending Program
The Treasury Department provides a securities lending program in which the various investments under custody of the Treasury Department participate. A contract between the Treasury Department and its custodian, acting as a lending agent, provides that the custodian lends securities owned by the participants to independent brokers, dealers and banks, acting as borrowers in exchange for collateral.
Lending agreements between the custodian and the borrowers require that the custodian receive collateral from the borrowers in exchange for the securities lent. Securities lent consist of both domestic and foreign equity securities and United States Treasury and foreign debt obligations. For securities lent which are not denominated in United States dollars or whose primary trading market is located outside the United States, the fair value of the collateral received must be at least 105 percent of the fair value of the securities lent. For all other securities lent, the fair value of the collateral received must be at least 102 percent. Practically all collateral received consists of cash. A small portion of collateral received consists of letters of credit, United States Treasury, and corporate and/or foreign debt obligations. Collateral is marked to market daily. Additional collateral from borrowers is required if the fair value of the collateral received declines below lending agreement requirements. The lending agent cannot pledge or sell collateral securities received unless the borrower defaults. Accordingly, neither collateral securities received from borrowers nor the related obligations to borrowers are reported.
To the extent collateral received consists of cash, the lending agent may use or invest the cash in accordance with reinvestment guidelines approved by the Treasury Department. Either the participant or the borrower may terminate lending agreements on demand. Lending agreements are typically of very short duration – usually overnight. Therefore, the duration of lending agreements do not generally match the maturities of the investments made with cash collateral.
The resulting rate risk is mitigated by the lending agent’s ability to reallocate lending agreements among program participants.
The program requires that the lending agent indemnify the Treasury Department for all claims, liabilities, and costs resulting from the lending agent’s negligence or intentional misconduct.

45
PENNSYLVANIA INFRASTRUCTURE INVESTMENT AUTHORITYNOTES TO FINANCIAL STATEMENTS, ContinuedFOR THE YEARS ENDED JUNE 30, 2019 and 2018
(In Thousands Except for Percentages)
22
2. DEPOSIT AND INVESTMENT RISK, Continued
Securities Lending Program, Continued
During the fiscal years ended June 30, 2019 and 2018, there were no failures by any borrower to return securities lent or pay distributions thereon. Also, there were no losses resulting from a lending agent or borrower default and there were no Treasury Department restrictions on the amounts of the loans that could be made.
As of June 30, 2019 and 2018 there was no Treasury Department or participant credit risk because the fair value of collateral received was not less than the fair value of the securities lent. As of June 30, 2019 and 2018, PENNVEST’s portion of securities lending collateral within the Commonwealth Investment Pool was $8,249 and $8,936, respectively.
3. FAIR VALUE MEASUREMENTS
PENNVEST categorizes its fair value measurements within the fair value hierarchy established by generally accepted accounting principles. The hierarchy is based on the valuation inputs used to measure the fair value of the asset. Level 1 inputs are quoted prices in active markets for identical assets; Level 2 inputs are significant other observable inputs; and Level 3 inputs are significant unobservable inputs. There were no Level 1 or Level 3 investments at June 30, 2019 and 2018.
PENNVEST has the following recurring fair value measurements:
• Level 2 - Commonwealth Investment Program Pool 99 (“Pool 99”) of $209,010 and $274,762 as of June 30, 2019 and 2018, respectively, are valued using a share-based valuation structure (net asset value). Pool 99 seeks to maintain a stable net asset value per share of $1. Pool 99 performance is benchmarked against the yield on Merrill Lynch three-month United States Treasury Bill Index.
• Level 2 – Commonwealth Investment Program Pool 198 (“Pool 198”) of $1,248,053 and $1,168,454 as of June 30, 2019 and 2018, respectively, are valued using a share-based valuation structure (net asset value). Pool 198 is benchmarked to a blend of Standards and Poor’s 500, Morgan Stanley Capital International All County World Index Ex-U.S., Barclays Capital U.S. Aggregate Bond, and Merrill Lynch 6-month U.S. Treasury Bill Indices.
4. LOANS RECEIVABLE
PENNVEST has loans outstanding throughout the Commonwealth. The eleven largest loans amount to 13% and 12%, of gross loans receivable at June 30, 2019 and 2018, respectively. The majority of loans are disbursed to municipal governments of the Commonwealth and arecollateralized by a pledge of the general taxing powers of the municipal governments or revenue streams generated by the municipal governments.
46
PENNSYLVANIA INFRASTRUCTURE INVESTMENT AUTHORITYNOTES TO FINANCIAL STATEMENTS, ContinuedFOR THE YEARS ENDED JUNE 30, 2019 and 2018
(In Thousands Except for Percentages)
23
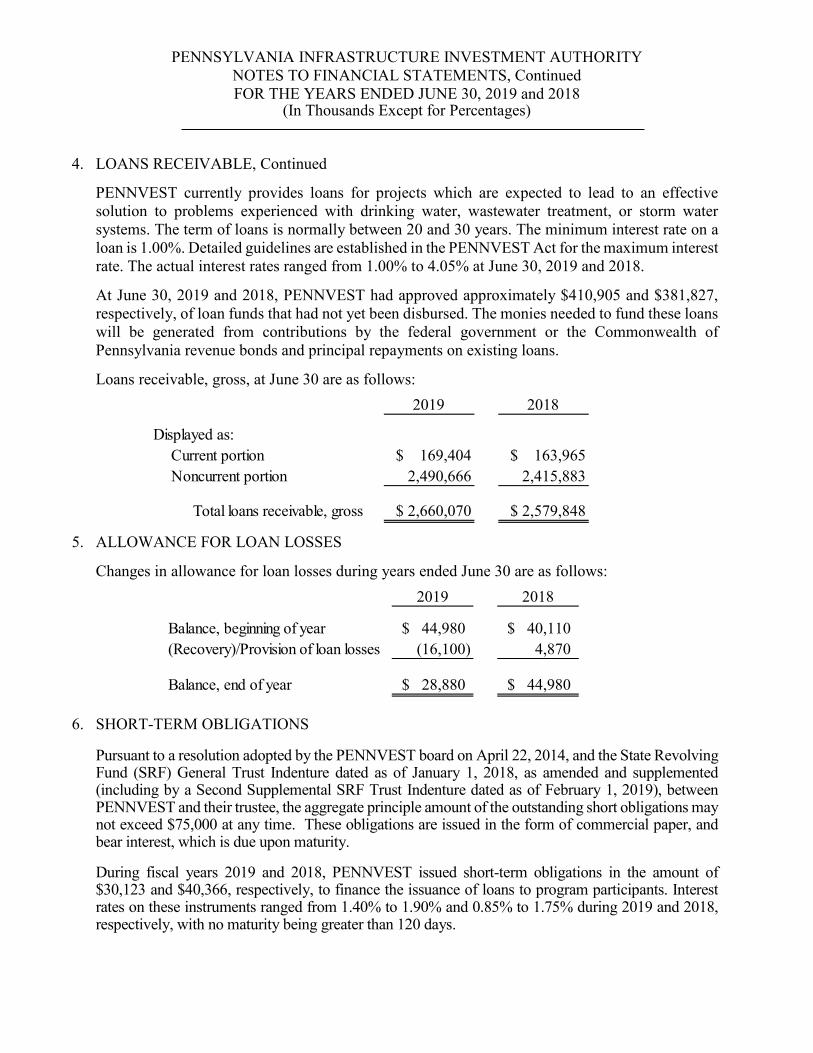
4. LOANS RECEIVABLE, Continued
PENNVEST currently provides loans for projects which are expected to lead to an effective solution to problems experienced with drinking water, wastewater treatment, or storm water systems. The term of loans is normally between 20 and 30 years. The minimum interest rate on a loan is 1.00%. Detailed guidelines are established in the PENNVEST Act for the maximum interest rate. The actual interest rates ranged from 1.00% to 4.05% at June 30, 2019 and 2018.
At June 30, 2019 and 2018, PENNVEST had approved approximately $410,905 and $381,827,respectively, of loan funds that had not yet been disbursed. The monies needed to fund these loans will be generated from contributions by the federal government or the Commonwealth of Pennsylvania revenue bonds and principal repayments on existing loans.
Loans receivable, gross, at June 30 are as follows:
5. ALLOWANCE FOR LOAN LOSSES
Changes in allowance for loan losses during years ended June 30 are as follows:
6. SHORT-TERM OBLIGATIONS
Pursuant to a resolution adopted by the PENNVEST board on April 22, 2014, and the State Revolving Fund (SRF) General Trust Indenture dated as of January 1, 2018, as amended and supplemented (including by a Second Supplemental SRF Trust Indenture dated as of February 1, 2019), between PENNVEST and their trustee, the aggregate principle amount of the outstanding short obligations may not exceed $75,000 at any time. These obligations are issued in the form of commercial paper, and bear interest, which is due upon maturity.
During fiscal years 2019 and 2018, PENNVEST issued short-term obligations in the amount of $30,123 and $40,366, respectively, to finance the issuance of loans to program participants. Interest rates on these instruments ranged from 1.40% to 1.90% and 0.85% to 1.75% during 2019 and 2018,respectively, with no maturity being greater than 120 days.
2019 2018
Balance, beginning of year 44,980$ 40,110$(Recovery)/Provision of loan losses (16,100) 4,870
Balance, end of year 28,880$ 44,980$
2019 2018
Displayed as: Current portion $ 169,404 $ 163,965 Noncurrent portion 2,490,666 2,415,883
Total loans receivable, gross $ 2,660,070 $ 2,579,848

47
PENNSYLVANIA INFRASTRUCTURE INVESTMENT AUTHORITYNOTES TO FINANCIAL STATEMENTS, ContinuedFOR THE YEARS ENDED JUNE 30, 2019 and 2018
(In Thousands Except for Percentages)
24
6. SHORT-TERM OBLIGATIONS, Continued
Changes in short-term obligations for the fiscal years ended June 30, 2019 and 2018 were:
7. REVENUE BONDS PAYABLE
In June 2015, PENNVEST issued Revenue Bonds Series 2015A in the amount of $65,000. The Bonds were issued at a premium of $8,257. The proceeds of the bonds were used to pay at maturity on July 1, 2015 the aggregate principal amount of PENNVEST’s Tax-Exempt Commercial Paper Revenue Notes, Series 2010A, plus accrued interest, and pay the costs of issuing the 2015 Bonds.
In January 2018, PENNVEST issued State Revolving Funds (“SRF”) Bond Series 2018A in the amount of $50,000. The Bonds were issued at a premium of $8,387. The proceeds of the 2018 RF bonds, together with other available funds, will be applied (i) to finance costs of certain wastewater and drinking water projects for governmental entities and other eligible borrowers pursuant to the PENNVEST Leveraged State Water Pollution Control Revolving Fund Program (Clean Water SRF Program) and the PENNVEST Leveraged State Drinking Water Revolving Fund Program (Drinking Water SRF Program), and (ii) to pay the costs of issuing the 2018 SRF Bonds.
Changes in revenue bonds payable for the fiscal years ended June 30, 2019 and 2018 are as follows:
at July 1, 2018 Additions Reductions June 30, 201950,371$ 30,123$ 50,371$ 30,123$
at July 1, 2017 Additions Reductions June 30, 201810,005$ 40,366$ -$ 50,371$
Beginning Balance Ending Balance at
Beginning Balance Ending Balance at
Amounts DueSeries at July 1, 2018 Additions Reductions June 30, 2019 within One Year
2015A Revenue Bonds 58,839$ -$ 2,350$ 56,489$ 2,470$2018A SRF Bonds 50,000 - 3,910 46,090 4,180Bond Premium 15,399 - 1,254 14,145 -
Total 124,238$ -$ 7,514$ 116,724$ 6,650$
Amounts DueSeries at July 1, 2017 Additions Reductions June 30, 2018 within One Year
2015A Revenue Bonds 61,079$ -$ 2,240$ 58,839$ 2,350$2018A SRF Bonds - 50,000 - 50,000 3,910Bond Premium 7,427 8,387 415 15,399 -
Total 68,506$ 58,387$ 2,655$ 124,238$ 6,260$
Beginning Balance Ending Balance at
Beginning Balance Ending Balance at

48
PENNSYLVANIA INFRASTRUCTURE INVESTMENT AUTHORITYNOTES TO FINANCIAL STATEMENTS, ContinuedFOR THE YEARS ENDED JUNE 30, 2019 and 2018
(In Thousands Except for Percentages)
25
7. REVENUE BONDS PAYABLE, Continued
Information regarding revenue bonds issued is presented below:
A summary of debt service requirements (payable semi-annually) at June 30, 2019, are as follows:
Under the terms of the debt issue described above, PENNVEST is required to maintain certain balances in restricted trust accounts, make timely payments to the trustee accounts, and pledge loans that provide cash flow necessary to service debt (short-term obligations and revenue bonds payable). The SRF trust indentures contain a provision that in an event of default of debt, outstanding amounts become immediately due if PENNVEST is unable to make payments.
Year of Amount ofIssue Original Issue Maturity Interest Rate2015 65,000$ 2018
through 2035
3.38% to 5.00%
2018 50,000$ 2019 through 2028
5.00%
PurposeTo pay at maturity on July 1, 2015 the Series 2010A Commercial Paper Revenue Notes, and to pay debt issuance costs.
To finance costs of certain wastewater and drinking water projects.
Ending Principal Interest Total2020 6,650$ 4,888$ 11,538$2021 6,980 4,556 11,5362022 7,330 4,207 11,5372023 7,695 3,840 11,5352024 8,080 3,456 11,536
2025-2029 40,185 10,806 50,9912030-2034 20,955 3,577 24,532
2035 4,704 188 4,892
102,579$ 35,518$ 138,097$
49
PENNSYLVANIA INFRASTRUCTURE INVESTMENT AUTHORITYNOTES TO FINANCIAL STATEMENTS, ContinuedFOR THE YEARS ENDED JUNE 30, 2019 and 2018
(In Thousands Except for Percentages)
26
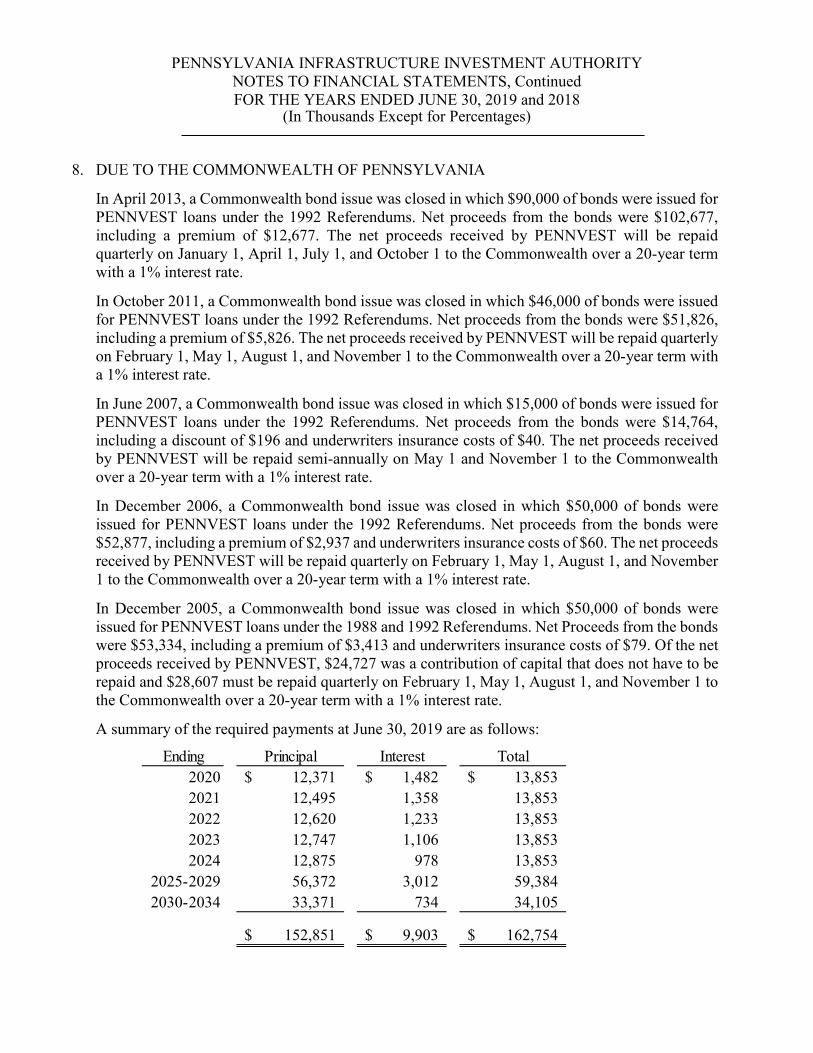
8. DUE TO THE COMMONWEALTH OF PENNSYLVANIA
In April 2013, a Commonwealth bond issue was closed in which $90,000 of bonds were issued for PENNVEST loans under the 1992 Referendums. Net proceeds from the bonds were $102,677, including a premium of $12,677. The net proceeds received by PENNVEST will be repaid quarterly on January 1, April 1, July 1, and October 1 to the Commonwealth over a 20-year term with a 1% interest rate.
In October 2011, a Commonwealth bond issue was closed in which $46,000 of bonds were issued for PENNVEST loans under the 1992 Referendums. Net proceeds from the bonds were $51,826, including a premium of $5,826. The net proceeds received by PENNVEST will be repaid quarterly on February 1, May 1, August 1, and November 1 to the Commonwealth over a 20-year term witha 1% interest rate.
In June 2007, a Commonwealth bond issue was closed in which $15,000 of bonds were issued for PENNVEST loans under the 1992 Referendums. Net proceeds from the bonds were $14,764, including a discount of $196 and underwriters insurance costs of $40. The net proceeds received by PENNVEST will be repaid semi-annually on May 1 and November 1 to the Commonwealth over a 20-year term with a 1% interest rate.
In December 2006, a Commonwealth bond issue was closed in which $50,000 of bonds wereissued for PENNVEST loans under the 1992 Referendums. Net proceeds from the bonds were $52,877, including a premium of $2,937 and underwriters insurance costs of $60. The net proceeds received by PENNVEST will be repaid quarterly on February 1, May 1, August 1, and November 1 to the Commonwealth over a 20-year term with a 1% interest rate.
In December 2005, a Commonwealth bond issue was closed in which $50,000 of bonds wereissued for PENNVEST loans under the 1988 and 1992 Referendums. Net Proceeds from the bonds were $53,334, including a premium of $3,413 and underwriters insurance costs of $79. Of the net proceeds received by PENNVEST, $24,727 was a contribution of capital that does not have to be repaid and $28,607 must be repaid quarterly on February 1, May 1, August 1, and November 1 to the Commonwealth over a 20-year term with a 1% interest rate.
A summary of the required payments at June 30, 2019 are as follows:
Ending Principal Interest Total2020 12,371$ 1,482$ 13,853$2021 12,495 1,358 13,8532022 12,620 1,233 13,8532023 12,747 1,106 13,8532024 12,875 978 13,853
2025-2029 56,372 3,012 59,3842030-2034 33,371 734 34,105
152,851$ 9,903$ 162,754$

50
PENNSYLVANIA INFRASTRUCTURE INVESTMENT AUTHORITYNOTES TO FINANCIAL STATEMENTS, ContinuedFOR THE YEARS ENDED JUNE 30, 2019 and 2018
(In Thousands Except for Percentages)
27
9. CAPITAL CONTRIBUTIONS
The Commonwealth of Pennsylvania has authorized the issuance of a total of $1,430,256 of general obligation bonds and appropriated the proceeds to PENNVEST for the improvement of water and sewer systems in the Commonwealth. Proceeds include $230,256 approved by the electorate in 1981, $300,000 approved by the electorate in 1988, $350,000 approved by the electorate in 1992, $150,000 under the provisions of P.L. 343 No. 176 as authorized by the PENNVEST Act of 1988, and $400,000 approved by the electorate in 2008. PENNVEST is authorized to utilize the proceeds for loans to borrowers. All but $300,000 of the proceeds is considered to be revolving, as such, the principal and interest received on the loans are not required to be repaid to the Commonwealth. The balance of the proceeds, also used for loans to borrowers, ultimately received from the bond issues will require repayment as described in Note 8.
PENNVEST has also received approval for $1,595,657 and $630,847 in Federal loan funds for water pollution control and drinking water, respectively, at June 30, 2019. Of the $1,595,657 and $630,655 approved, $1,595,657 and $623,259, respectively, have been received as of June 30, 2019. For the period July 1, 2018 through June 30, 2019, $63,579 and $32,865 of Federal funds were received for water pollution control and drinking water, respectively. The State match for water pollution control and drinking water programs for the period July 1, 2018 through June 30, 2019, was $12,716 and $6,840, respectively. These funds have or will be utilized to make loans and the proceeds from repayments can be utilized to make new loans in the future.
The required cumulative State match for the disbursed Federal loan funds for water pollution control and drinking water at June 30, 2019, was $318,882 and $125,961, respectively. As of June 30, 2019, $321,375 and $129,878 was the cumulative State match on disbursed loans for water pollution control and drinking water, respectively. All State match must be funded by the end of the award period.
The required cumulative State match for the disbursed Federal loan funds for water pollution control and drinking water at June 30, 2018, was $306,166 and $119,121, respectively. As of June 30, 2018, $308,659 and $123,037 was the cumulative State match on disbursed loans for water pollution control and drinking water, respectively. All State match must be funded by the end of the award period.
PENNVEST has been authorized by the PENNVEST Act to make grants to participants in the loan programs, if deemed necessary, to financially assist the community. As of June 30, 2019 and 2018,PENNVEST has authorized unfulfilled grant commitments of $44,664 and $37,827, respectively,remaining.
For the years ended June 30, 2019 and 2018, capital contributions were $86,884 and $84,508,respectively. State and federal funded grants and principal forgiveness to program participants of$54,874 and $51,938 are reported as operating expenses, for the years ended June 30, 2019 and 2018, respectively.

51
PENNSYLVANIA INFRASTRUCTURE INVESTMENT AUTHORITYNOTES TO FINANCIAL STATEMENTS, ContinuedFOR THE YEARS ENDED JUNE 30, 2019 and 2018
(In Thousands Except for Percentages)
28
10. RELATED PARTY TRANSACTIONS
PENNVEST contracts for services necessary to carry out its operations from various Commonwealth of Pennsylvania departments and agencies. PENNVEST paid the following departments and agencies for accounting services and loan project technical assistance during the fiscal year ended June 30:
11. LITIGATION
PENNVEST is involved in various claims and legal actions arising in the ordinary course of business. In the opinion of management, the ultimate disposition of these matters will not have a material adverse effect on PENNVEST’s financial position.
12. RETIREMENT BENEFITS
General Information about the Pension Plan
Plan Description
Substantially all employees of PENNVEST participate in the Pennsylvania State Employees’ Retirement System (“SERS”), a cost-sharing multiple-employer defined benefit pension plan established by the Commonwealth to provide pension benefits for employees of State government and certain independent agencies. Membership in SERS is mandatory for most PENNVEST (and other State) employees. Article II of the Commonwealth’s constitution assigns the authority to establish and amend the benefit provision of the plan to the General Assembly. SERS issues a publicly available financial report that can be obtained at www.sers.pa.gov.
Benefits Provided
SERS provides retirement, death, and disability benefits. Member retirement benefits are determined by taking years of credited service, multiplied by final average salary, multiplied by 2%, and multiplied by class of service multiplier. PENNVEST employees participate in one of the following classes of service categories: Class A, Class AA, Class A-3 or Class A-4. According to the State Employees’ Retirement Code (“SERC”), all obligations of SERS will be assumed by the Commonwealth should SERS terminate.
2019 2018Office of Comptroller Operations 194$ 181$Department of Environmental Protection 1,328 1,099
52
PENNSYLVANIA INFRASTRUCTURE INVESTMENT AUTHORITYNOTES TO FINANCIAL STATEMENTS, ContinuedFOR THE YEARS ENDED JUNE 30, 2019 and 2018
(In Thousands Except for Percentages)
29
12. RETIREMENT BENEFITS, Continued
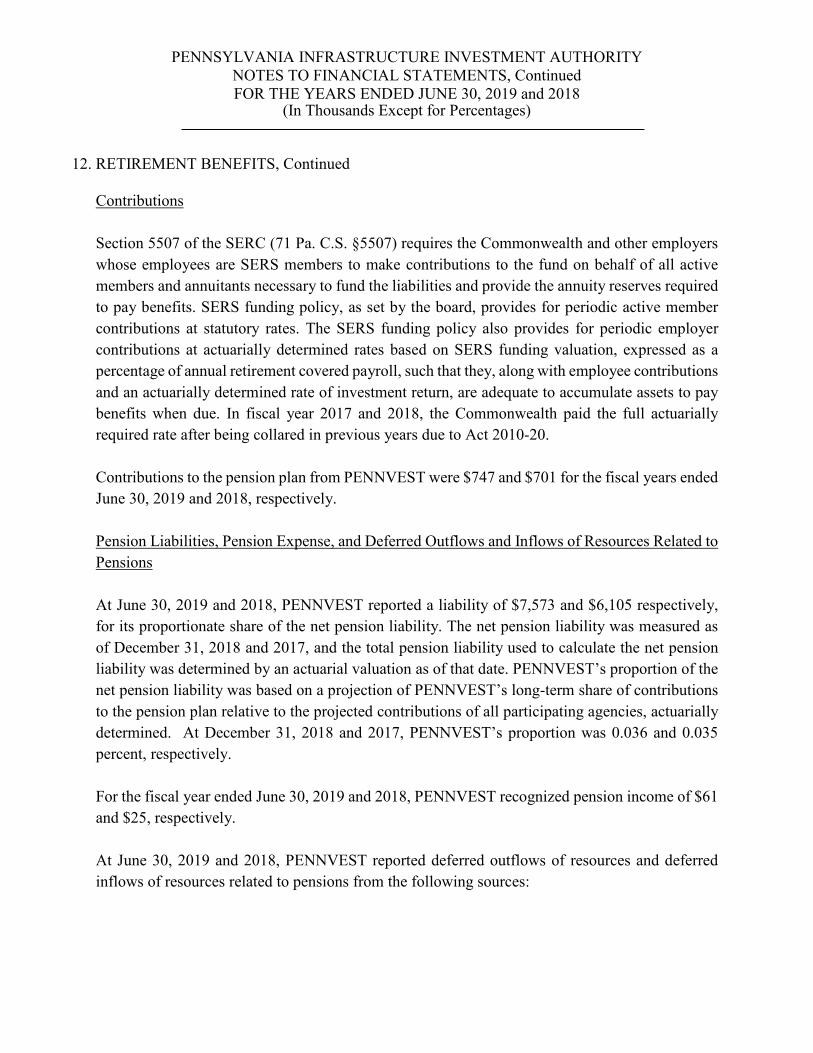
Contributions
Section 5507 of the SERC (71 Pa. C.S. §5507) requires the Commonwealth and other employers whose employees are SERS members to make contributions to the fund on behalf of all active members and annuitants necessary to fund the liabilities and provide the annuity reserves required to pay benefits. SERS funding policy, as set by the board, provides for periodic active member contributions at statutory rates. The SERS funding policy also provides for periodic employer contributions at actuarially determined rates based on SERS funding valuation, expressed as a percentage of annual retirement covered payroll, such that they, along with employee contributions and an actuarially determined rate of investment return, are adequate to accumulate assets to pay benefits when due. In fiscal year 2017 and 2018, the Commonwealth paid the full actuarially required rate after being collared in previous years due to Act 2010-20.
Contributions to the pension plan from PENNVEST were $747 and $701 for the fiscal years ended June 30, 2019 and 2018, respectively.
Pension Liabilities, Pension Expense, and Deferred Outflows and Inflows of Resources Related to Pensions
At June 30, 2019 and 2018, PENNVEST reported a liability of $7,573 and $6,105 respectively,for its proportionate share of the net pension liability. The net pension liability was measured as of December 31, 2018 and 2017, and the total pension liability used to calculate the net pension liability was determined by an actuarial valuation as of that date. PENNVEST’s proportion of the net pension liability was based on a projection of PENNVEST’s long-term share of contributions to the pension plan relative to the projected contributions of all participating agencies, actuarially determined. At December 31, 2018 and 2017, PENNVEST’s proportion was 0.036 and 0.035 percent, respectively.
For the fiscal year ended June 30, 2019 and 2018, PENNVEST recognized pension income of $61and $25, respectively.
At June 30, 2019 and 2018, PENNVEST reported deferred outflows of resources and deferred inflows of resources related to pensions from the following sources:

53
PENNSYLVANIA INFRASTRUCTURE INVESTMENT AUTHORITYNOTES TO FINANCIAL STATEMENTS, ContinuedFOR THE YEARS ENDED JUNE 30, 2019 and 2018
(In Thousands Except for Percentages)
30
12. RETIREMENT BENEFITS, ContinuedPension Liabilities, Pension Expense, and Deferred Outflows and Inflows of Resources Related to Pensions, Continued
The $377 and $368 reported as deferred outflows of resources related to pension resulting from PENNVEST contributions subsequent to the measurement date will be recognized as a reduction of the net pension liability in the years ended June 30, 2019 and 2018, respectively. Other amounts reported as deferred outflows/inflows of resources related to pensions will be recognized in pension expense as follows:
Year ending June 30:2020 $ 4672021 2102022 1462023 3032024 14
$ 1,140Actuarial Assumptions
The following methods and assumptions were used in the December 31, 2018 and 2017 actuarial valuations. These methods and assumptions did not change from prior year and were applied to all periods included in the measurement:
2018 and 2017Investment rate of return 7.25% net of manager fees including inflation.Projected salary increases Average of 5.60% with range of 3.70% - 8.90% including inflation.Inflation 2.60%Mortality rate Projected RP-2000 Mortality Tables adjusted per actual plan
experience and future improvement.Cost of living adjustments (COLAs)
Ad hoc and are not considered to be substantively automatic.
2019 2018 2019 2018 Differences between expected and actual experience 114$ 103$ 82$ 116$ Net difference between projected and actual investment
earnings on pension plan investments 737 - - 243 Changes in proportion 216 157 53 70 Changes in assumptions 202 305 - - Differences between PENNVEST contributions and
proportionate share of contribution 13 15 7 11 PENNVEST contributions subsequent to measurement date 377 368 - -
Total 1,659$ 948$ 142$ 440$
Deferred Outflowsof Resources
Deferred Inflowsof Resources
54
PENNSYLVANIA INFRASTRUCTURE INVESTMENT AUTHORITYNOTES TO FINANCIAL STATEMENTS, ContinuedFOR THE YEARS ENDED JUNE 30, 2019 and 2018
(In Thousands Except for Percentages)
31
12. RETIREMENT BENEFITS, Continued
Actuarial Assumptions, Continued
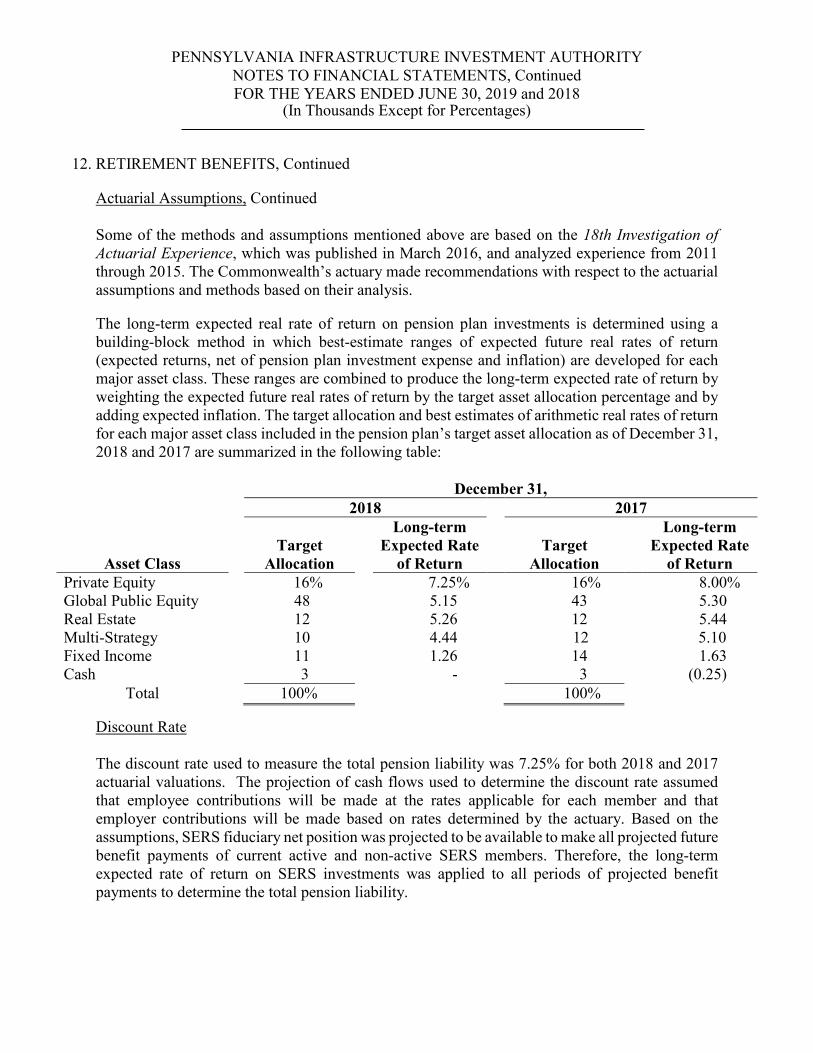
Some of the methods and assumptions mentioned above are based on the 18th Investigation of Actuarial Experience, which was published in March 2016, and analyzed experience from 2011through 2015. The Commonwealth’s actuary made recommendations with respect to the actuarial assumptions and methods based on their analysis.
The long-term expected real rate of return on pension plan investments is determined using a building-block method in which best-estimate ranges of expected future real rates of return (expected returns, net of pension plan investment expense and inflation) are developed for each major asset class. These ranges are combined to produce the long-term expected rate of return by weighting the expected future real rates of return by the target asset allocation percentage and by adding expected inflation. The target allocation and best estimates of arithmetic real rates of return for each major asset class included in the pension plan’s target asset allocation as of December 31, 2018 and 2017 are summarized in the following table:
December 31,2018 2017
Asset ClassTarget
Allocation
Long-termExpected Rate
of ReturnTarget
Allocation
Long-termExpected Rate
of ReturnPrivate Equity 16% 7.25% 16% 8.00% Global Public Equity 48 5.15 43% 5.30% Real Estate 12 5.26 12% 5.44% Multi-Strategy 10 4.44 12 5.10Fixed Income 11 1.26 14% 1.63% Cash 3 - 3% (0.25)%
Total 100% 100%
Discount Rate
The discount rate used to measure the total pension liability was 7.25% for both 2018 and 2017actuarial valuations. The projection of cash flows used to determine the discount rate assumed that employee contributions will be made at the rates applicable for each member and that employer contributions will be made based on rates determined by the actuary. Based on the assumptions, SERS fiduciary net position was projected to be available to make all projected future benefit payments of current active and non-active SERS members. Therefore, the long-term expected rate of return on SERS investments was applied to all periods of projected benefit payments to determine the total pension liability.

55
PENNSYLVANIA INFRASTRUCTURE INVESTMENT AUTHORITYNOTES TO FINANCIAL STATEMENTS, ContinuedFOR THE YEARS ENDED JUNE 30, 2019 and 2018
(In Thousands Except for Percentages)
32
12. RETIREMENT BENEFITS, Continued
Sensitivity of PENNVEST’s Proportionate Share of the Net Pension Liability to Changes in the Discount Rate
The following schedule presents PENNVEST’s proportionate share of the 2018 and 2017 net pension liability calculated using the discount rate of 7.25% for 2018 and 2017. It also shows what PENNVEST’s proportionate share of the net pension liability would be if it were calculated using a discount rate that is one percentage point lower or one percentage point higher than the current rate:
1%Decrease
6.25%
CurrentDiscount rate
7.25%
1%Increase8.25%
PENNVEST’S share of the net Pension liability as …of the 12-31-18 measurement date $ 9,300 $ 7,573 $ 6,094
1%Decrease
6.25%
CurrentDiscount rate
7.25%
1% Increase8.25%
PENNVEST’S share of the net Pension liability as …of the 12-31-17 measurement date $ 7,749 $ 6,105 $ 4,697
Pension Plan Fiduciary Net Position
Detailed information about the pension plan’s fiduciary net position is available in the separately issued SERS financial report.
13. POST EMPLOYMENT BENEFITS OTHER THAN PENSIONS (“OPEB”)
PENNVEST, through the Commonwealth’s Retired Employees Health Plan (“REHP”), provides healthcare as a post-employment benefit to its employees that qualify for this benefit when they retire. The REHP has been established under pertinent statutory authority.
General Information about the REHP
Plan Description and Administration
The REHP is a single employer defined benefit OPEB plan that includes Commonwealth agencies and some component units. The REHP is established as a trust equivalent arrangement for some Commonwealth agencies and component units. The REHP is administered by the Pennsylvania Employee Benefits Trust Fund (“PEBTF”), which acts as a third-party administrator under an administrative agreement with the Commonwealth. All policy decisions types and levels of benefits for the REHP fall under the purview of the Commonwealth’s Executive Board, and the Secretary of Administration. The REHP does not have a governing board.
56
PENNSYLVANIA INFRASTRUCTURE INVESTMENT AUTHORITYNOTES TO FINANCIAL STATEMENTS, ContinuedFOR THE YEARS ENDED JUNE 30, 2019 and 2018
(In Thousands Except for Percentages)
33
13. POST EMPLOYMENT BENEFITS OTHER THAN PENSIONS (“OPEB”), Continued
Plan Description and Administration, Continued
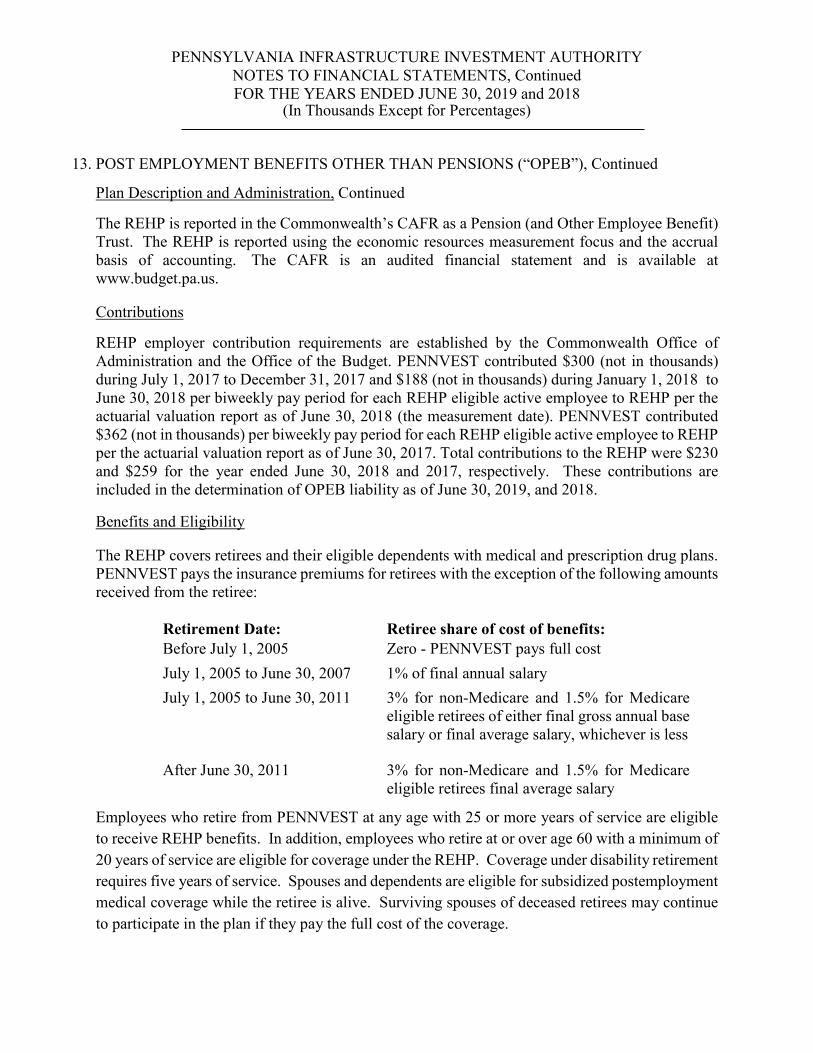
The REHP is reported in the Commonwealth’s CAFR as a Pension (and Other Employee Benefit) Trust. The REHP is reported using the economic resources measurement focus and the accrual basis of accounting. The CAFR is an audited financial statement and is available at www.budget.pa.us.
Contributions
REHP employer contribution requirements are established by the Commonwealth Office of Administration and the Office of the Budget. PENNVEST contributed $300 (not in thousands)during July 1, 2017 to December 31, 2017 and $188 (not in thousands) during January 1, 2018 to June 30, 2018 per biweekly pay period for each REHP eligible active employee to REHP per the actuarial valuation report as of June 30, 2018 (the measurement date). PENNVEST contributed $362 (not in thousands) per biweekly pay period for each REHP eligible active employee to REHP per the actuarial valuation report as of June 30, 2017. Total contributions to the REHP were $230 and $259 for the year ended June 30, 2018 and 2017, respectively. These contributions are included in the determination of OPEB liability as of June 30, 2019, and 2018.
Benefits and Eligibility
The REHP covers retirees and their eligible dependents with medical and prescription drug plans. PENNVEST pays the insurance premiums for retirees with the exception of the following amounts received from the retiree:
Retirement Date: Retiree share of cost of benefits:Before July 1, 2005 Zero - PENNVEST pays full costJuly 1, 2005 to June 30, 2007 1% of final annual salaryJuly 1, 2005 to June 30, 2011 3% for non-Medicare and 1.5% for Medicare
eligible retirees of either final gross annual base salary or final average salary, whichever is less
After June 30, 2011 3% for non-Medicare and 1.5% for Medicare eligible retirees final average salary
Employees who retire from PENNVEST at any age with 25 or more years of service are eligible to receive REHP benefits. In addition, employees who retire at or over age 60 with a minimum of 20 years of service are eligible for coverage under the REHP. Coverage under disability retirement requires five years of service. Spouses and dependents are eligible for subsidized postemployment medical coverage while the retiree is alive. Surviving spouses of deceased retirees may continue to participate in the plan if they pay the full cost of the coverage.
57
PENNSYLVANIA INFRASTRUCTURE INVESTMENT AUTHORITYNOTES TO FINANCIAL STATEMENTS, ContinuedFOR THE YEARS ENDED JUNE 30, 2019 and 2018
(In Thousands Except for Percentages)
34
13. POST EMPLOYMENT BENEFITS OTHER THAN PENSIONS (“OPEB”), Continued
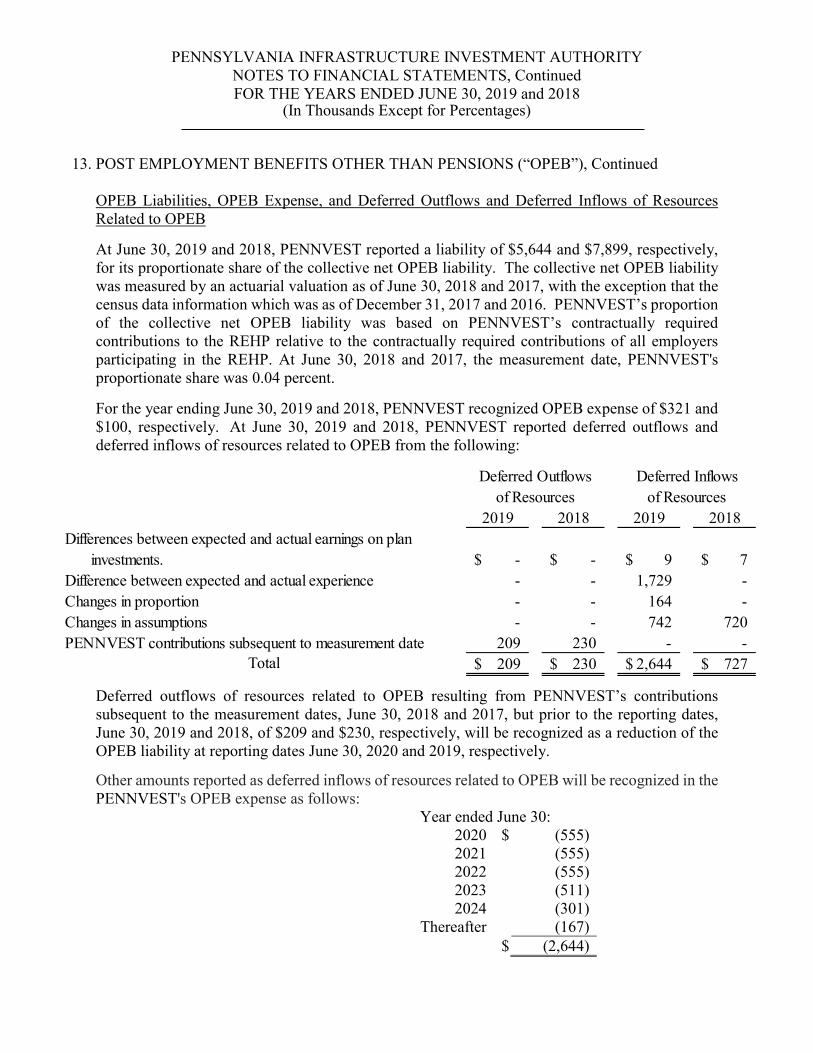
OPEB Liabilities, OPEB Expense, and Deferred Outflows and Deferred Inflows of Resources Related to OPEB
At June 30, 2019 and 2018, PENNVEST reported a liability of $5,644 and $7,899, respectively,for its proportionate share of the collective net OPEB liability. The collective net OPEB liability was measured by an actuarial valuation as of June 30, 2018 and 2017, with the exception that the census data information which was as of December 31, 2017 and 2016. PENNVEST’s proportion of the collective net OPEB liability was based on PENNVEST’s contractually required contributions to the REHP relative to the contractually required contributions of all employers participating in the REHP. At June 30, 2018 and 2017, the measurement date, PENNVEST's proportionate share was 0.04 percent.
For the year ending June 30, 2019 and 2018, PENNVEST recognized OPEB expense of $321 and $100, respectively. At June 30, 2019 and 2018, PENNVEST reported deferred outflows and deferred inflows of resources related to OPEB from the following:
Deferred outflows of resources related to OPEB resulting from PENNVEST’s contributions subsequent to the measurement dates, June 30, 2018 and 2017, but prior to the reporting dates,June 30, 2019 and 2018, of $209 and $230, respectively, will be recognized as a reduction of the OPEB liability at reporting dates June 30, 2020 and 2019, respectively.
Other amounts reported as deferred inflows of resources related to OPEB will be recognized in the PENNVEST's OPEB expense as follows:
Year ended June 30:2020 $ (555)2021 (555)2022 (555)2023 (511)2024 (301)
Thereafter (167)$ (2,644)
2019 2018 2019 2018Differences between expected and actual earnings on plan
investments. -$ -$ 9$ 7$Difference between expected and actual experience - - 1,729 -Changes in proportion - - 164 -Changes in assumptions - - 742 720PENNVEST contributions subsequent to measurement date 209 230 - -
Total 209$ 230$ 2,644$ 727$
Deferred Outflowsof Resources
Deferred Inflowsof Resources

58
PENNSYLVANIA INFRASTRUCTURE INVESTMENT AUTHORITYNOTES TO FINANCIAL STATEMENTS, ContinuedFOR THE YEARS ENDED JUNE 30, 2019 and 2018
(In Thousands Except for Percentages)
35
13. POST EMPLOYMENT BENEFITS OTHER THAN PENSIONS (“OPEB”), Continued
Actuarial Methods and Assumptions
The following methods and assumptions were used in the June 30, 2018 and 2017, actuarial valuation.
Actuarial cost method Entry age, normalDiscount rate
Investment rate of return 5.00%Initial medical trend rate 2018: 6.2/5.9% and 2017: 6.00%Ultimate medical trend rate 2018: 4.10% and 2017: 3.90%Inflation 2.60%Payroll growth 2.90%Year ultimate trend rate reached 2075Mortality rate Projected RP-2000 Mortality Tables
2018: 3.87%; 2017: 3.58% - Index rate for 20-year tax-exempt general obligation municipal bond index rate with an average rating of AA/Aa or higher as of the measurement date.
The above actuarial assumptions were determined, in-part, based on the SERS experience studies performed periodically to determine reasonable and appropriate economic and demographic assumptions for purposes of valuing the defined benefit pension plan. The most recent SERS experience study covered the years 2011 through 2015 and was presented to the State Employees’ Retirement Board in March 2016. The approved recommendations from that study were used to determine the assumptions for the REHP valuation, where applicable.
One significant assumption where the recommendation of the experience study is not applicable to the retiree health benefit valuation is the discount rate. Since REHP has insufficient assets to meet next year’s projected benefit payments, as prescribed by GASB Nos. 74 and 75, the discount rate is based on the index rate for 20-year tax exempt general obligation municipal bond index rate with an average rating of AA/Aa or higher as of the measurement date. The Commonwealth elected to determine the discount rate using the Bond Buyer 20-Bond General Obligation Index. The discount rate was 3.87% and 3.58% as of June 30, 2018 and 2017, respectively.
Long-term Expected Return on Plan Assets
The long-term expected rate of return on REHP plan investments is determined using a risk premium review. This review compares the current relationship between fixed income and equity and their relationship over long periods of time to come up with an expected rate of return. Other variables considered in the expected rates of return are a reversion to the mean for each asset class. Best estimates of arithmetic real rates of return for each major assets class included in the target asset allocation are summarized in the following table:

59
PENNSYLVANIA INFRASTRUCTURE INVESTMENT AUTHORITYNOTES TO FINANCIAL STATEMENTS, ContinuedFOR THE YEARS ENDED JUNE 30, 2019 and 2018
(In Thousands Except for Percentages)
36
13. POST EMPLOYMENT BENEFITS OTHER THAN PENSIONS (“OPEB”), Continued
Long-term Expected Return on Plan Assets, Continued
June 30,2018 2017
Asset ClassTarget
Allocation
Long-termExpected Rate
of ReturnTarget
Allocation
Long-termExpected Rate
of ReturnU.S. Equity 47% 6.6% 47% 7.5%International Equity 20 8.6 20 8.5Fixed Income 25 3.0 25 3.0Real Estate 8 6.9 8 3.0Cash - 1.0 - 1.0
Total 100% 100%
Sensitivity of PENNVEST’s Proportionate Share of the Net OPEB Liability to Changes in the Discount Rate
The following presents PENNVEST’s 2019 and 2018 OPEB liability calculated using the discount rate of 3.87 and 3.58 percent, respectively, as well as what PENNVEST’s OPEB liability would be if it were calculated using a discount rate that is one percentage point lower or one percentage point higher than the current rate:
20191% Decrease
2.87%Current Discount
Rate 3.87%1% Increase
4.87%Total OPEB liability $ 6,466 $ 5,644 $ 4,966
20181% Decrease
2.58%Current Discount
Rate 3.58%1% Increase
4.58%Total OPEB liability $ 9,255 $ 7,899 $ 7,000
Sensitivity of PENNVEST’s Proportionate Share of the Net OPEB Liability to Changes in the Healthcare Cost Trend Rate
The following presents the Authority’s 2019 OPEB liability calculated using the assumed trend rates of 6.2% / 5.9% grading down to 4.1%, as well as what PENNVEST’s OPEB liability would be if itwere calculated using a trend rate that is one percentage point lower or one percentage point higher than the current rate:

60
PENNSYLVANIA INFRASTRUCTURE INVESTMENT AUTHORITYNOTES TO FINANCIAL STATEMENTS, Concluded FOR THE YEARS ENDED JUNE 30, 2019 and 2018
(In Thousands Except for Percentages)
37
13. POST EMPLOYMENT BENEFITS OTHER THAN PENSIONS (“OPEB”), Continued
Sensitivity of PENNVEST’s Proportionate Share of the Net OPEB Liability to Changes in the Healthcare Cost Trend Rate, Continued
20191%
Decrease5.2% / 4.9%
down to 3.1%
Current Trend Rate 6.2% / 5.9%
down to 4.1%
1% Increase
7.2% / 6.9% down to
5.1%Total OPEB liability $ 4,845 $ 5,644 $ 6,637
The following presents PENNVEST’s 2018 OPEB liability calculated using the assumed trend rates of 6.0% grading down to 3.9%, as well as what PENNVEST’s OPEB liability would be if it were calculated using a trend rate that is one percentage point lower or one percentage point higher than the current rate:
20181% Decrease 5.0% down
to 2.9%
Current Trend Rate 6.0% down
to 3.9%
1% Increase 7.0% down to 4.9%
Total OPEB liability $ 6,855 $ 7,899 $ 9,462
14. SUBSEQUENT EVENTS
PENNVEST has evaluated subsequent events through October 29, 2019 the date which the financial report was available to be issued.
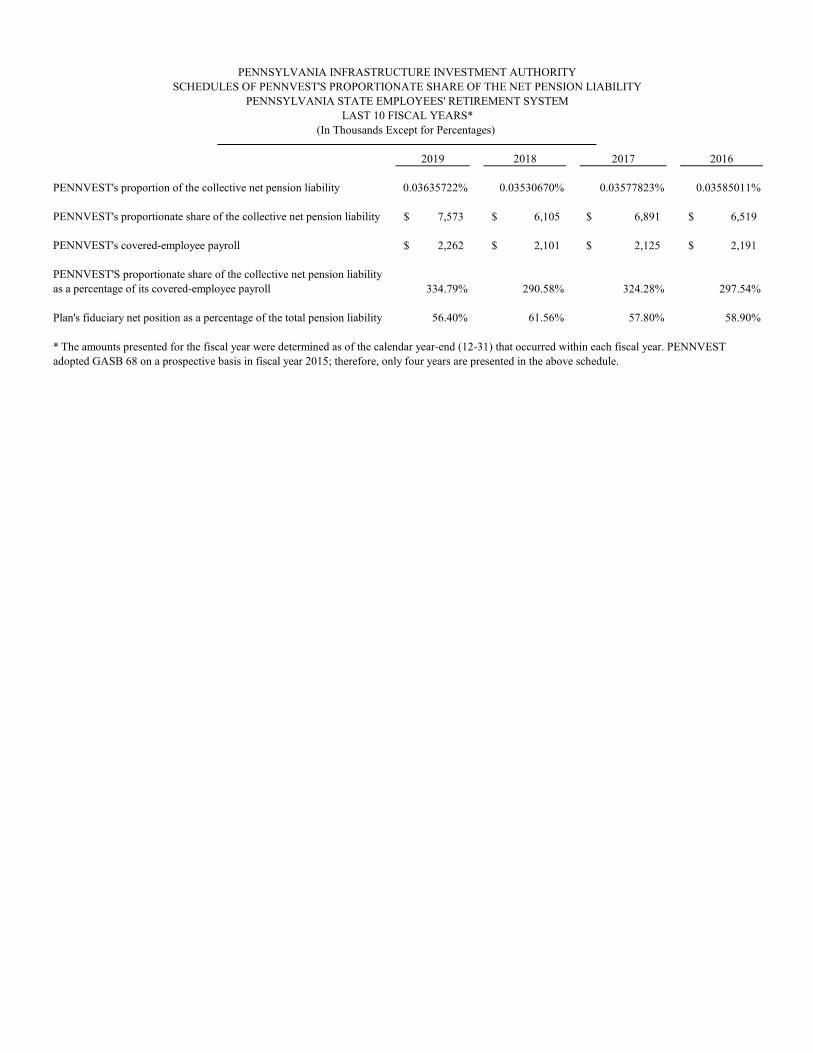
61
38
2019 2018 2017 2016
PENNVEST's proportion of the collective net pension liability 0.03635722% 0.03530670% 0.03577823% 0.03585011%
PENNVEST's proportionate share of the collective net pension liability 7,573$ 6,105$ 6,891$ 6,519$
PENNVEST's covered-employee payroll 2,262$ 2,101$ 2,125$ 2,191$
PENNVEST'S proportionate share of the collective net pension liability as a percentage of its covered-employee payroll 334.79% 290.58% 324.28% 297.54%
Plan's fiduciary net position as a percentage of the total pension liability 56.40% 61.56% 57.80% 58.90%
* The amounts presented for the fiscal year were determined as of the calendar year-end (12-31) that occurred within each fiscal year. PENNVEST adopted GASB 68 on a prospective basis in fiscal year 2015; therefore, only four years are presented in the above schedule.
PENNSYLVANIA INFRASTRUCTURE INVESTMENT AUTHORITYSCHEDULES OF PENNVEST'S PROPORTIONATE SHARE OF THE NET PENSION LIABILITY
PENNSYLVANIA STATE EMPLOYEES' RETIREMENT SYSTEMLAST 10 FISCAL YEARS*
(In Thousands Except for Percentages)
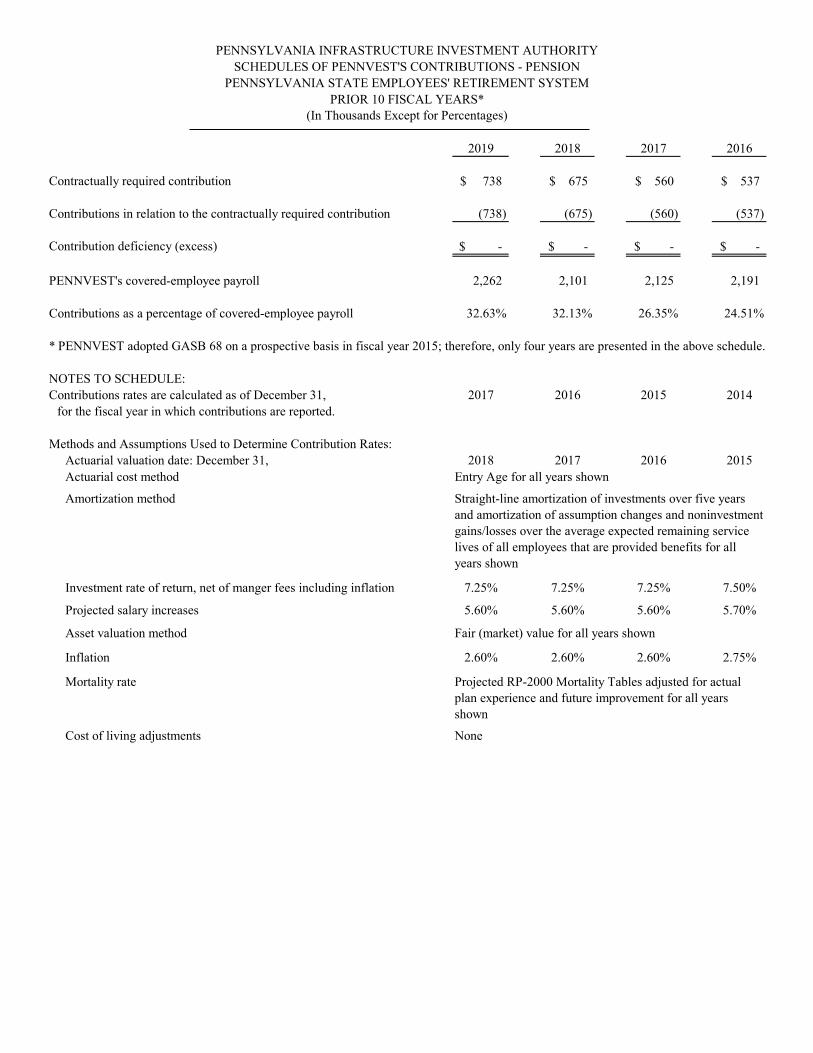
62
39
2019 2018 2017 2016
Contractually required contribution 738$ 675$ 560$ 537$
Contributions in relation to the contractually required contribution (738) (675) (560) (537)
Contribution deficiency (excess) -$ -$ -$ -$
PENNVEST's covered-employee payroll 2,262 2,101 2,125 2,191
Contributions as a percentage of covered-employee payroll 32.63% 32.13% 26.35% 24.51%
* PENNVEST adopted GASB 68 on a prospective basis in fiscal year 2015; therefore, only four years are presented in the above schedule.
NOTES TO SCHEDULE:Contributions rates are calculated as of December 31, 2017 2016 2015 2014
for the fiscal year in which contributions are reported.
Methods and Assumptions Used to Determine Contribution Rates:Actuarial valuation date: December 31, 2018 2017 2016 2015Actuarial cost method Entry Age for all years shown
Amortization method
Investment rate of return, net of manger fees including inflation 7.25% 7.25% 7.25% 7.50%
Projected salary increases 5.60% 5.60% 5.60% 5.70%
Asset valuation method Fair (market) value for all years shown
Inflation 2.60% 2.60% 2.60% 2.75%
Mortality rate
Cost of living adjustments None
Straight-line amortization of investments over five years and amortization of assumption changes and noninvestment gains/losses over the average expected remaining service lives of all employees that are provided benefits for all years shown
Projected RP-2000 Mortality Tables adjusted for actual plan experience and future improvement for all years shown
PENNSYLVANIA INFRASTRUCTURE INVESTMENT AUTHORITYSCHEDULES OF PENNVEST'S CONTRIBUTIONS - PENSION
PENNSYLVANIA STATE EMPLOYEES' RETIREMENT SYSTEMPRIOR 10 FISCAL YEARS*
(In Thousands Except for Percentages)
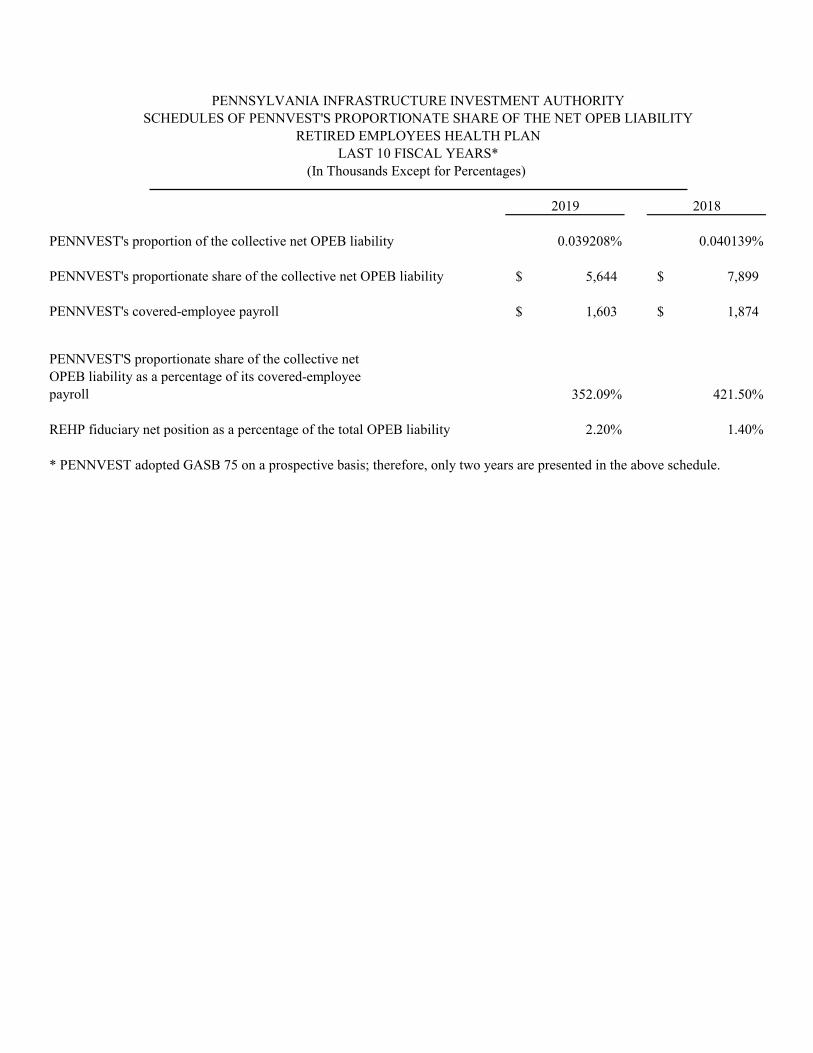
6340
2019 2018
PENNVEST's proportion of the collective net OPEB liability 0.039208% 0.040139%
PENNVEST's proportionate share of the collective net OPEB liability 5,644$ 7,899$
PENNVEST's covered-employee payroll 1,603$ 1,874$
PENNVEST'S proportionate share of the collective net OPEB liability as a percentage of its covered-employee payroll 352.09% 421.50%
REHP fiduciary net position as a percentage of the total OPEB liability 2.20% 1.40%
* PENNVEST adopted GASB 75 on a prospective basis; therefore, only two years are presented in the above schedule.
PENNSYLVANIA INFRASTRUCTURE INVESTMENT AUTHORITYSCHEDULES OF PENNVEST'S PROPORTIONATE SHARE OF THE NET OPEB LIABILITY
RETIRED EMPLOYEES HEALTH PLANLAST 10 FISCAL YEARS*
(In Thousands Except for Percentages)
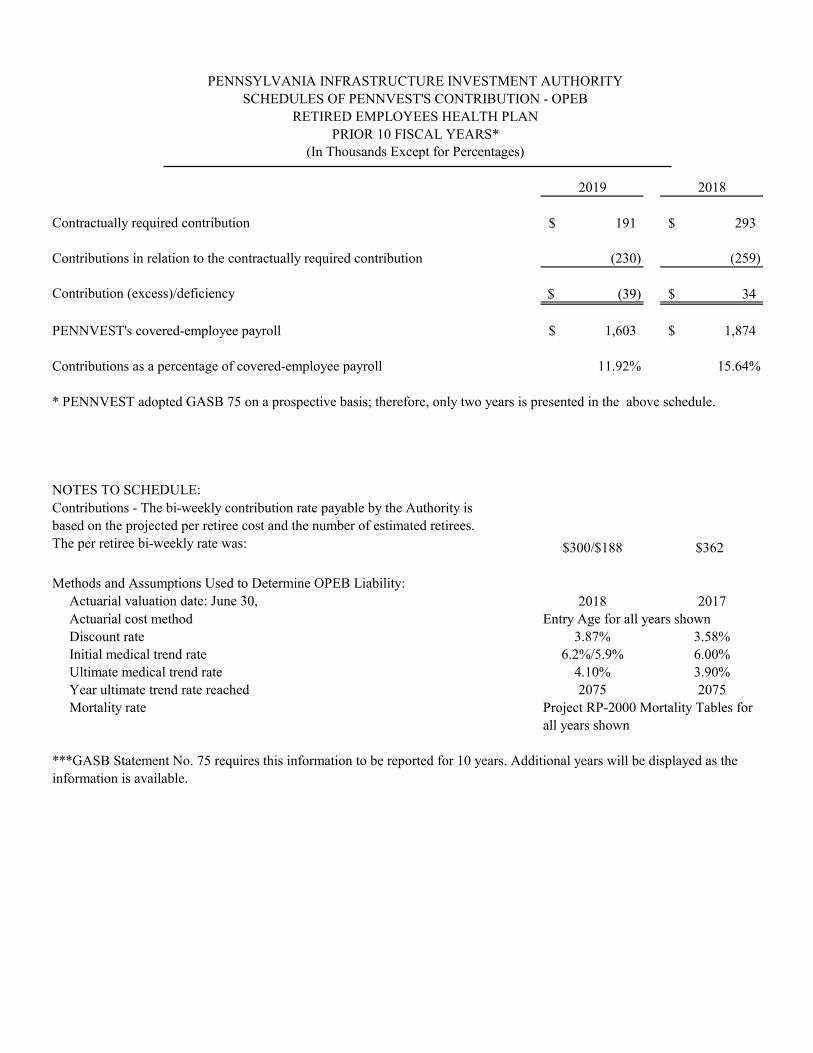
6441
2019 2018
Contractually required contribution 191$ 293$
Contributions in relation to the contractually required contribution (230) (259)
Contribution (excess)/deficiency (39)$ 34$
PENNVEST's covered-employee payroll 1,603$ 1,874$
Contributions as a percentage of covered-employee payroll 11.92% 15.64%
* PENNVEST adopted GASB 75 on a prospective basis; therefore, only two years is presented in the above schedule.
NOTES TO SCHEDULE:
$300/$188 $362
Methods and Assumptions Used to Determine OPEB Liability:Actuarial valuation date: June 30, 2018 2017Actuarial cost method Entry Age for all years shownDiscount rate 3.87% 3.58%Initial medical trend rate 6.2%/5.9% 6.00%Ultimate medical trend rate 4.10% 3.90%Year ultimate trend rate reached 2075 2075Mortality rate Project RP-2000 Mortality Tables for
all years shown
***GASB Statement No. 75 requires this information to be reported for 10 years. Additional years will be displayed as the information is available.
Contributions - The bi-weekly contribution rate payable by the Authority is based on the projected per retiree cost and the number of estimated retirees. The per retiree bi-weekly rate was:
PENNSYLVANIA INFRASTRUCTURE INVESTMENT AUTHORITYSCHEDULES OF PENNVEST'S CONTRIBUTION - OPEB
RETIRED EMPLOYEES HEALTH PLANPRIOR 10 FISCAL YEARS*
(In Thousands Except for Percentages)

See the accompanying notes to these loan fund financial statements.42
2019 2018Assets:
Cash and cash equivalents 103,183$ 50,269$ Restricted investment - securities lending collateral 4,862 5,259 Investments 861,279 862,042 Loans receivable, gross 1,494,635 1,390,822 Allowance for loan losses (17,103) (16,383)Accrued interest receivable 2,411 2,242 Other receivable - 1,848 Due from the Commonwealth of Pennsylvania 173 122
Total Assets 2,449,440 2,296,221
Liabilities:Accounts payable 1,040 1,859 Due to the Commonwealth of Pennsylvania 519 330 Due to the federal government 288 - Securities lending obligations 4,862 5,259 Short-term obligations 30,123 - Revenue bonds payable 34,329 37,368
Total Liabilities 71,161 44,816
Net Position:Restricted for federal clean water state revolving loan fund 2,378,279$ 2,251,405$
JUNE 30, 2019 AND 2018(In Thousands)
PENNSYLVANIA INFRASTRUCTURE INVESTMENT AUTHORITY
SCHEDULES OF NET POSITIONFEDERAL CLEAN WATER STATE REVOLVING LOAN FUND

See the accompanying notes to these loan fund financial statements.43
2019 2018Operating Revenues:
Interest on loans receivable 18,145$ 17,376$Other 11 4
Operating Revenues Before Provision for Loan Loss 18,156 17,380
Provision for loan losses (722) (5,131)
Net Operating Revenues 17,434 12,249
Operating Expenses:Administration 3,997 2,657Other state and federal "principal forgiveness" to program participants 17,991 15,611
Total Operating Expenses 21,988 18,268
Operating Loss (4,554) (6,019)
Nonoperating Revenues (Expense):Investment income 57,915 30,014Interest and amortization expense (1,934) -Bond issuance costs - (164)
Total Nonoperating Revenues 55,981 29,850
Income before Capital Contributions 51,427 23,831
Capital contributions:Other federal and state 75,447 62,592
Total Capital Contributions 75,447 62,592
Increase In Net Position 126,874 86,423
Net Position - Beginning of Year 2,251,405 2,164,982
Net Position - End of Year 2,378,279$ 2,251,405$
SCHEDULES OF REVENUES, EXPENSES, AND CHANGES IN NET POSITIONFOR THE YEARS ENDED JUNE 30, 2019 AND 2018
(In Thousands)
PENNSYLVANIA INFRASTRUCTURE INVESTMENT AUTHORITYFEDERAL CLEAN WATER STATE REVOLVING LOAN FUND

See the accompanying notes to these loan fund financial statements.44
2019 2018Cash Flows From Operating Activities:
Loan receipts from borrowers 109,164$ 125,356$Loan disbursements to borrowers (195,321) (154,194)Cash paid to vendors (2,920) (5,044)Other State and Federal "principal forgiveness" to program participants (17,991) (15,252)Other receipts 11 4Federal grant receipts 288 499
Net Cash Used In Operating Activities (106,769) (48,631)
Cash Flows From Capital Financing Activities:Proceeds from short-term borrowings/bond issuance 30,123 37,368Repayment on bonds payable (3,039) -Bond issuance costs - (164)Other federal and state grants received 75,447 62,592
Cash Provided By Capital Financing Activities 102,531 99,796
Cash Flows from Investing Activities:Receipts from depositories 57,915 30,014Net purchases of State Treasury Common Investment Pool (763) (31,456)
Cash Provided By/(Used In) Investing Activities 57,152 (1,442)
Increase In Cash And Cash Equivalents 52,914 49,723
Cash and Cash Equivalents, Beginning of Year 50,269 546
Cash and Cash Equivalents, End of Year 103,183$ 50,269$
Reconciliation of Operating Income to Net Cash Used InOperating Activities:
Operating loss (4,554)$ (6,019)$Changes in operating assets and liabilities:
Loan receivable, gross (104,223) (45,881)Recovery of loan losses 722 5,131Accrued interest (169) (333)Due from/to the Commonwealth of Pennsylvania 138 31Due to/from the federal government 288 499Other receivable 1,848 (1,847)Accounts payable and accrued liabilities (819) (212)
Total adjustments (102,215) (42,612)Net Cash Used In Operating Activities (106,769)$ (48,631)$
SCHEDULES OF CASH FLOWSFOR THE YEARS ENDED JUNE 30, 2019 AND 2018
(In Thousands)
PENNSYLVANIA INFRASTRUCTURE INVESTMENT AUTHORITYFEDERAL CLEAN WATER STATE REVOLVING LOAN FUND

See the accompanying notes to these loan fund financial statements.45
2019 2018
Cash and cash equivalents 51,247$ 35,014$Restricted investment - securities lending collateral 1,324 1,432Investments 243,543 219,841Loans receivable, gross 490,576 488,922Allowance for loan losses (1,707) (3,518)Accrued interest receivable 891 820Other receivable - 574Due from Commonwealth of Pennsylvania 16 -
Total Assets 785,890 743,085
Liabilities:Accounts payable 408 579Due to others 42 -Due to Commonwealth of Pennsylvania 865 773Due to federal government 1,646 1,725Securities lending obligations 1,324 1,432Revenue bonds payable 19,310 21,020
Total Liabilities 23,595 25,529
Net Position:Restricted for federal drinking water state revolving loan fund 762,295$ 717,556$
PENNSYLVANIA INFRASTRUCTURE INVESTMENT AUTHORITYFEDERAL DRINKING WATER STATE REVOLVING LOAN FUND
Assets:
SCHEDULES OF NET POSITIONJUNE 30, 2019 AND 2018
(In Thousands)
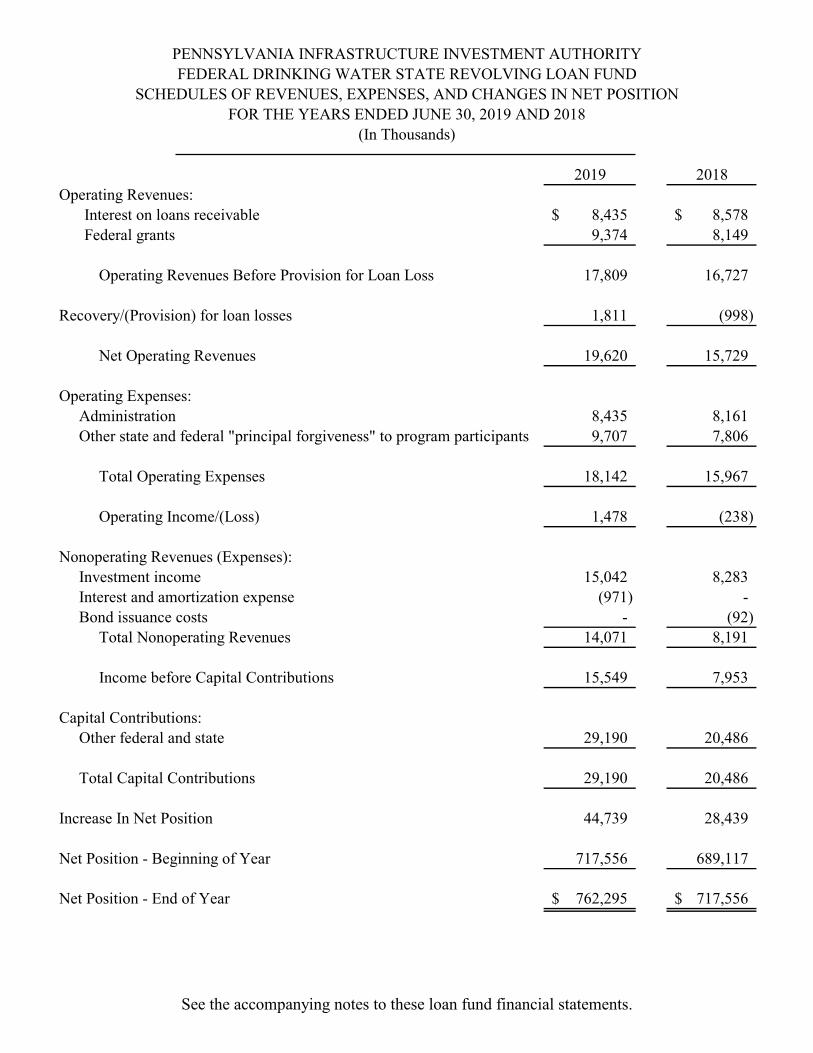
See the accompanying notes to these loan fund financial statements.46
2019 2018Operating Revenues:
Interest on loans receivable 8,435$ 8,578$ Federal grants 9,374 8,149
Operating Revenues Before Provision for Loan Loss 17,809 16,727
Recovery/(Provision) for loan losses 1,811 (998)
Net Operating Revenues 19,620 15,729
Operating Expenses:Administration 8,435 8,161 Other state and federal "principal forgiveness" to program participants 9,707 7,806
Total Operating Expenses 18,142 15,967
Operating Income/(Loss) 1,478 (238)
Nonoperating Revenues (Expenses): Investment income 15,042 8,283 Interest and amortization expense (971) - Bond issuance costs - (92)
Total Nonoperating Revenues 14,071 8,191
Income before Capital Contributions 15,549 7,953
Capital Contributions:Other federal and state 29,190 20,486
Total Capital Contributions 29,190 20,486
Increase In Net Position 44,739 28,439
Net Position - Beginning of Year 717,556 689,117
Net Position - End of Year 762,295$ 717,556$
PENNSYLVANIA INFRASTRUCTURE INVESTMENT AUTHORITYFEDERAL DRINKING WATER STATE REVOLVING LOAN FUND
SCHEDULES OF REVENUES, EXPENSES, AND CHANGES IN NET POSITIONFOR THE YEARS ENDED JUNE 30, 2019 AND 2018
(In Thousands)
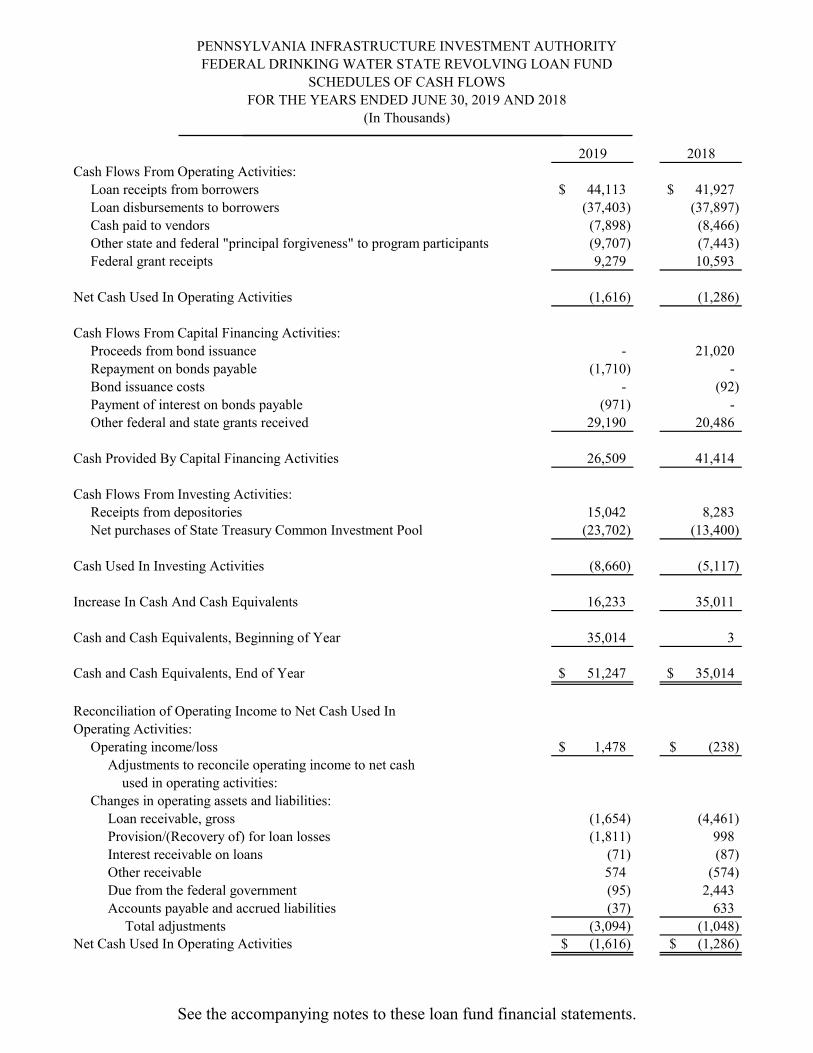
See the accompanying notes to these loan fund financial statements.47
2019 2018Cash Flows From Operating Activities:
Loan receipts from borrowers 44,113$ 41,927$ Loan disbursements to borrowers (37,403) (37,897) Cash paid to vendors (7,898) (8,466) Other state and federal "principal forgiveness" to program participants (9,707) (7,443) Federal grant receipts 9,279 10,593
Net Cash Used In Operating Activities (1,616) (1,286)
Cash Flows From Capital Financing Activities:Proceeds from bond issuance - 21,020 Repayment on bonds payable (1,710) - Bond issuance costs - (92) Payment of interest on bonds payable (971) - Other federal and state grants received 29,190 20,486
Cash Provided By Capital Financing Activities 26,509 41,414
Cash Flows From Investing Activities:Receipts from depositories 15,042 8,283 Net purchases of State Treasury Common Investment Pool (23,702) (13,400)
Cash Used In Investing Activities (8,660) (5,117)
Increase In Cash And Cash Equivalents 16,233 35,011
Cash and Cash Equivalents, Beginning of Year 35,014 3
Cash and Cash Equivalents, End of Year 51,247$ 35,014$
Reconciliation of Operating Income to Net Cash Used InOperating Activities:
Operating income/loss 1,478$ (238)$ Adjustments to reconcile operating income to net cash used in operating activities:
Changes in operating assets and liabilities:Loan receivable, gross (1,654) (4,461) Provision/(Recovery of) for loan losses (1,811) 998 Interest receivable on loans (71) (87) Other receivable 574 (574) Due from the federal government (95) 2,443 Accounts payable and accrued liabilities (37) 633
Total adjustments (3,094) (1,048) Net Cash Used In Operating Activities (1,616)$ (1,286)$
PENNSYLVANIA INFRASTRUCTURE INVESTMENT AUTHORITYFEDERAL DRINKING WATER STATE REVOLVING LOAN FUND
SCHEDULES OF CASH FLOWSFOR THE YEARS ENDED JUNE 30, 2019 AND 2018
(In Thousands)

71
48
PENNSYLVANIA INFRASTRUCTURE INVESTMENT AUTHORITYNOTES TO FUND SCHEDULES
FOR THE YEARS ENDED JUNE 30, 2019 and 2018(In Thousands)
1. GENERAL
The accompanying schedules present the activity for two of the five funds maintained by PENNVEST: the Federal Clean Water State Revolving Loan Fund, which accounts for the financial activity resulting from capitalization grants received from the federal government under the State Revolving Loan Funds Program; and the Federal Drinking Water State Revolving Loan Fund which accounts for the financial activity resulting from grants received from the federal government under the State Revolving Loan Funds Program. The activity resulting from the Commonwealth of Pennsylvania capital contributed to PENNVEST, and the 2010 and 1990 trust funds have not been presented in the schedules except for the transactions with these two funds. The schedules have been presented to comply with contractual arrangements with the funding sources.
2. BASIS OF ACCOUNTING
The accompanying schedules are presented using the accrual basis of accounting, which is described in Note 1 of PENNVEST’s financial statements.
3. TRANSFER OF LOANS BETWEEN FUNDS
When PENNVEST transfers a loan receivable between the funds identified above, the loan transfer is recorded in contributed capital and the provision for loan losses related to the transferred loans is reflected as an adjustment to net position.
4. ALLOWANCE FOR LOAN LOSSES
The allowance for loan losses was $17,103 and $1,707 for the Federal Clean Water State Revolving Loan Fund, and the Federal Drinking Water State Loan Fund, respectively, at June 30, 2019 and $16,383 and $3,518, respectively, at June 30, 2018.
5. COMMITMENTS & CONTINGENT LIABILITIES
At June 30, 2019, PENNVEST had approved approximately $283,331 and $127,574, respectively, of Federal Clean Water and Federal Drinking Water loans that had not yet been disbursed. The monies needed to fund these loans will be generated from contributions by the federal government or the Commonwealth of Pennsylvania, revenue bonds, and principal repayments on existing loans.
Amounts received or receivable from grant agencies are subject to audit and adjustments by grantor agencies, principally the federal governments. Any disallowed claims, including amounts already collected, may constitute a liability of the applicable funds. The amount, if any, of expenses that may be disallowed by the grantor cannot be determined at this time, although PENNVEST expects such amounts, if any, to be immaterial.

7249
Loan BalanceDelinquent Original Loan at
Loan Number Amount Balance June 30, 2019
1239839 99$ 17,393$ 6,997$3358678 113 22,850 22,371
212$ 40,243$ 29,368$
Loan BalanceDelinquent Original Loan at
Loan Number Amount Balance June 30, 2018
1239839 99$ 17,393$ 7,961$3281243 123 12,435 12,3053224698 371 25,000 24,294
593$ 54,828$ 44,560$
June 30, 2018Federal Clean Water Program On-Lot Loans
Federal Clean Water Program On-Lot Loans
PENNSYLVANIA INFRASTRUCTURE INVESTMENT AUTHORITYSCHEDULES OF DELINQUENT LOANS
CLEAN WATER PROGRAM ON-LOT LOANSFEDERAL CLEAN WATER PROGRAM
(UNAUDITED)
June 30, 2019
(In Thousands)