Tenth U.S. National Conference on Earthquake Engineering Frontiers of Earthquake Engineering July 21-25, 2014 Anchorage, Alaska 10NCEE FINITE ELEMENT SIMULATION OF BRICK MASONRY BUILDING UNDER SHOCK LOADING A. Joshua Daniel 1 and R.N. Dubey 2 ABSTRACT Modeling and analysis of a brick masonry building involves uncertainties like modeling assumptions and properties of local material. Therefore, it is necessary to perform a calibration to evaluate the dynamic properties of the structure. The response of the finite element model is improved by predicting the parameter by performing a linear dynamic analysis on experimental data by comparing the acceleration. Further, a nonlinear dynamic analysis was also performed comparing the roof acceleration and damage pattern of the structure obtained analytically with the test findings. The roof accelerations obtained analytically were in good agreement with experimental roof accelerations. The damage patterns observed analytically after every shock were almost similar to that of experimental observations. 1 Graduate Student, Department of Earthquake Engineering, IIT Roorkee, Roorkee, India, Uttarakhand 247667 2 Assistant Professor, Department of Earthquake Engineering, IIT Roorkee, Roorkee, India, Uttarakhand 247667 Joshua Daniel A, DubeyRN.Finite element simulation of brick masonry building under shock loading.Proceedings of the 10 th National Conference in Earthquake Engineering, Earthquake Engineering Research Institute, Anchorage, AK,2014.
Transcript
Tenth U.S. National Conference on Earthquake EngineeringFrontiers of Earthquake Engineering July 21-25, 2014 Anchorage, Alaska 10NCEE
FINITE ELEMENT SIMULATION OF BRICK MASONRY BUILDING UNDER SHOCK
LOADING
A. Joshua Daniel1and R.N. Dubey2
ABSTRACT Modeling and analysis of a brick masonry building involves uncertainties like modeling assumptions and properties of local material. Therefore, it is necessary to perform a calibration to evaluate the dynamic properties of the structure. The response of the finite element model is improved by predicting the parameter by performing a linear dynamic analysis on experimental data by comparing the acceleration. Further, a nonlinear dynamic analysis was also performed comparing the roof acceleration and damage pattern of the structure obtained analytically with the test findings. The roof accelerations obtained analytically were in good agreement with experimental roof accelerations. The damage patterns observed analytically after every shock were almost similar to that of experimental observations.
1Graduate Student, Department of Earthquake Engineering, IIT Roorkee, Roorkee, India, Uttarakhand 247667 2Assistant Professor, Department of Earthquake Engineering, IIT Roorkee, Roorkee, India, Uttarakhand 247667 Joshua Daniel A, DubeyRN.Finite element simulation of brick masonry building under shock loading.Proceedings of the 10th National Conference in Earthquake Engineering, Earthquake Engineering Research Institute, Anchorage, AK,2014.
Finite Element Simulation Of Brick Masonry Building Under Shock
Loading
A. Joshua Daniel1and R.N. Dubey2
ABSTRACT Modeling and analysis of a brick masonry building involves uncertainties like modeling
assumptions and properties of local material. Therefore, it is necessary to perform a calibration to evaluate the dynamic properties of the structure. The response of the finite element model is improved by predicting the parameter by performing a linear dynamic analysis on experimental data by comparing the acceleration. Further, a nonlinear dynamic analysis was also performed comparing the roof acceleration and damage pattern of the structure obtained analytically with the test findings. The roof accelerations obtained analytically were in good agreement with experimental roof accelerations. The damage patterns observed analytically after every shock were almost similar to that of experimental observations.
Introduction
Masonry is mainly a composite, anisotropic and a non-homogeneous material. The brickwork is a combination of bricks and mortar joints. The response of masonry subjected to loading depends on the properties of its brick, mortar and their interaction. Further, the response of masonry depends on the layout of bond and their interaction with other structural members. Modeling of masonry is a highly challenging process. Normally a high computation cost is associated with the intrinsic complexity of masonry (bricks connected by mortar joints) that requires a large number of degrees of freedom [6],which usually excludes simplifications like rigid diaphragms and ideal connections which is applied in modeling of other kind of structures. Another reason for the complexity is that the material constitutive models are not well defined, especially in the non-linear range. As of now, numerical models have mainly been validated for an individual structural component. However, the validation of the entire building is still not available. Development of adequate techniques, which authenticate the numerical models, can be a major contribution to provide a powerful tool to assess and predict the performance of brick masonry structures. Until now, only a few studies refer to the analysis of masonry structures [1, 15].Based on the previous literature reviews it was revealed that the modulus of elasticity plays a vital role in representing the actual experimental behavior of masonry. Further, the modulus of elasticity depends on other parameters like workmanship, quality of brick, quality of the mortar, thickness of the mortar 1Graduate Student, Department of Earthquake Engineering, IIT Roorkee, Roorkee, India, Uttarakhand 247667 2Assistant Professor, Department of Earthquake Engineering, IIT Roorkee, Roorkee, India, Uttarakhand 247667 Joshua Daniel A, DubeyRN.Finite element simulation of brick masonry building under shock loading.Proceedings of the 10th National Conference in Earthquake Engineering, Earthquake Engineering Research Institute, Anchorage, AK,2014.
joint, ambient condition and type of curing. So, for an effective analysis, parametric study on Young’s modulus will have to be carried out.During cyclic loading the masonry walls will be subjected to simultaneous in-plane and out-of-plane load [17]. Individual validation on in-plane behavior and out-of-plane behavior of the material constitutive law, concrete damage plasticity (CDP) shows that it will be extremely effective under combined loading scenario. The same concrete damage plasticity (CDP) used by Rai et al. [17] to study the non-linear behavior of un-reinforced masonry walls subjected to cyclic loading is used for this study. Further, a nonlinear dynamic analysis was also performed on the conventional brick masonry building. The problem statement of this study requires the explicit technique for analysis. This explicit technique does not require a fully assembled system’s stiffness matrix; rather it solves the problem using the theory of dynamic wave propagation in solids. As iterations are not performed, much smaller increments of the applied load are required for the explicit technique to provide acceptable results and thus can simulate highly nonlinear events [3]. Dubey. [5] performed an experiment on traditional brick masonry building on shock table facility available at the Department of Earthquake Engineering, IIT Roorkee. A total of five shocks with intensity varying from 0.53g to 1.93g were applied at the base of the model. The corresponding acceleration obtained at roof after every shock was also recorded. In this study the first shock and its corresponding roof acceleration are being considered to calibrate of the model. We expect that this study will contribute to the improvement of calibration for analysis of the brick masonry building. Further, the effectiveness of this calibration will be verified by performing a non-linear dynamic analysis on conventional brick masonry building by applying the base shock recorded during experimentation and by comparing the analytical roof acceleration and damage pattern with that of the test findings.
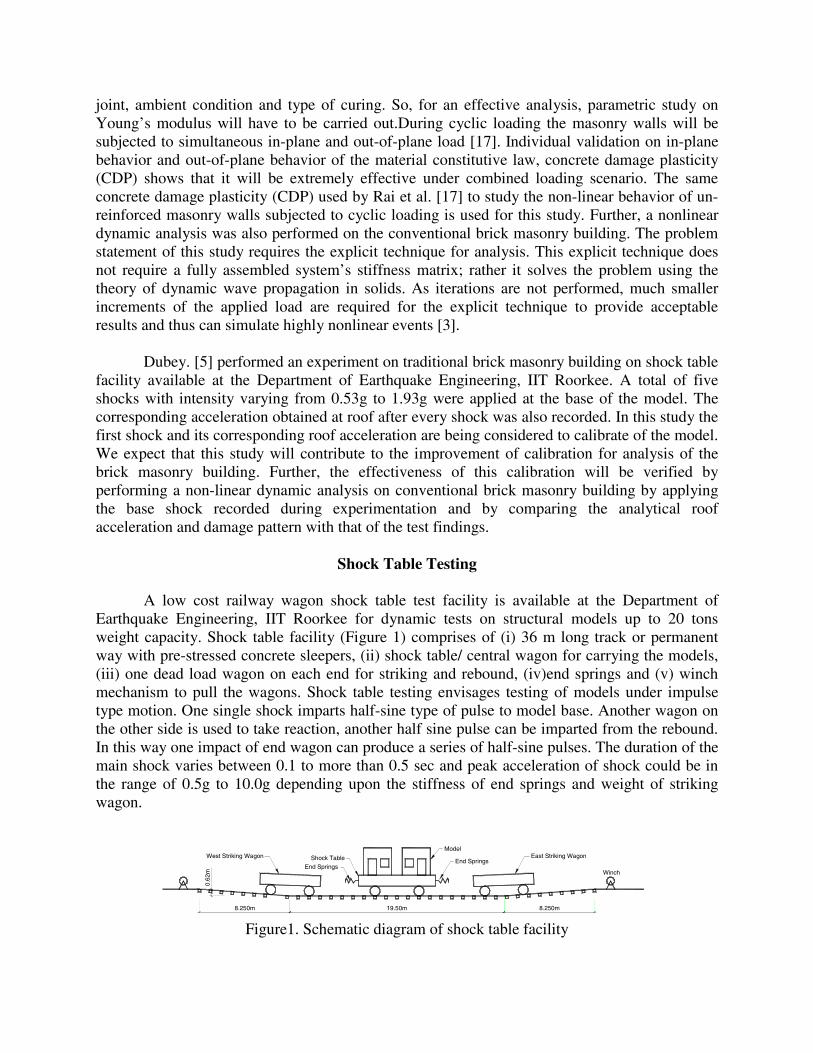
Shock Table Testing A low cost railway wagon shock table test facility is available at the Department of Earthquake Engineering, IIT Roorkee for dynamic tests on structural models up to 20 tons weight capacity. Shock table facility (Figure 1) comprises of (i) 36 m long track or permanent way with pre-stressed concrete sleepers, (ii) shock table/ central wagon for carrying the models, (iii) one dead load wagon on each end for striking and rebound, (iv)end springs and (v) winch mechanism to pull the wagons. Shock table testing envisages testing of models under impulse type motion. One single shock imparts half-sine type of pulse to model base. Another wagon on the other side is used to take reaction, another half sine pulse can be imparted from the rebound. In this way one impact of end wagon can produce a series of half-sine pulses. The duration of the main shock varies between 0.1 to more than 0.5 sec and peak acceleration of shock could be in the range of 0.5g to 10.0g depending upon the stiffness of end springs and weight of striking wagon.
8.250m 19.50m
Model
End SpringsEast Striking Wagon
Winch
Shock TableEnd Springs
West Striking Wagon
0.62
m
8.250m
Figure1. Schematic diagram of shock table facility
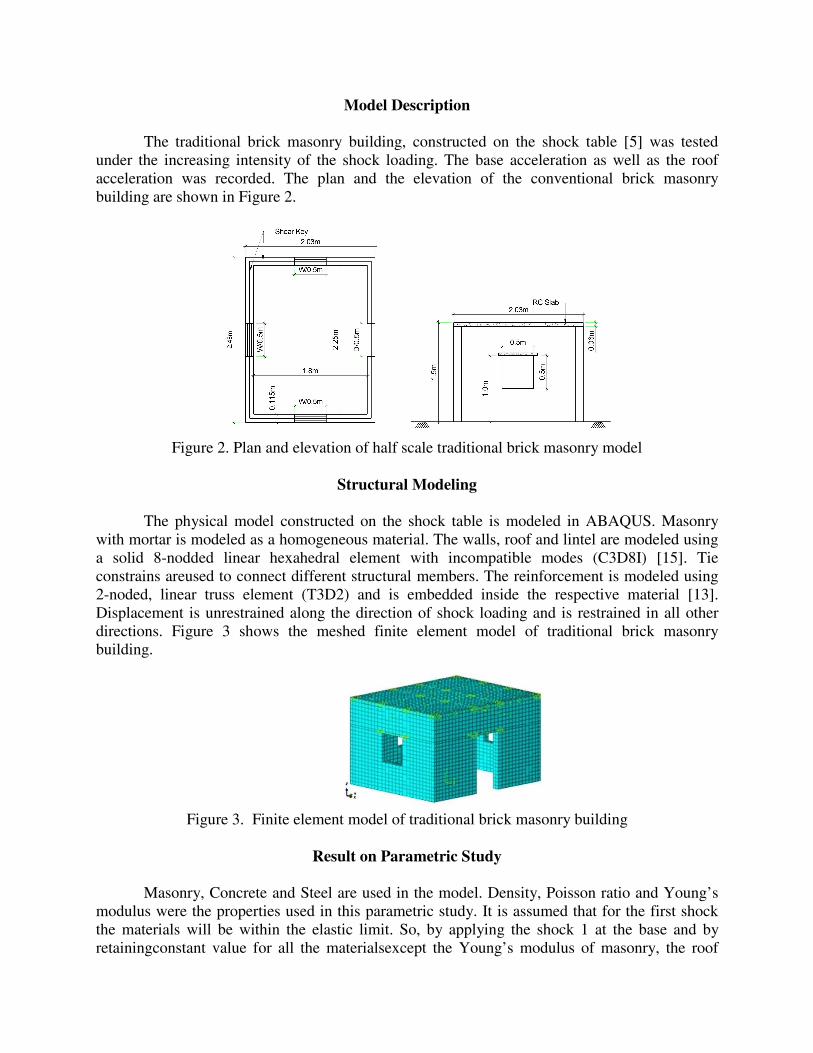
Model Description The traditional brick masonry building, constructed on the shock table [5] was tested under the increasing intensity of the shock loading. The base acceleration as well as the roof acceleration was recorded. The plan and the elevation of the conventional brick masonry building are shown in Figure 2.
Figure 2. Plan and elevation of half scale traditional brick masonry model
Structural Modeling
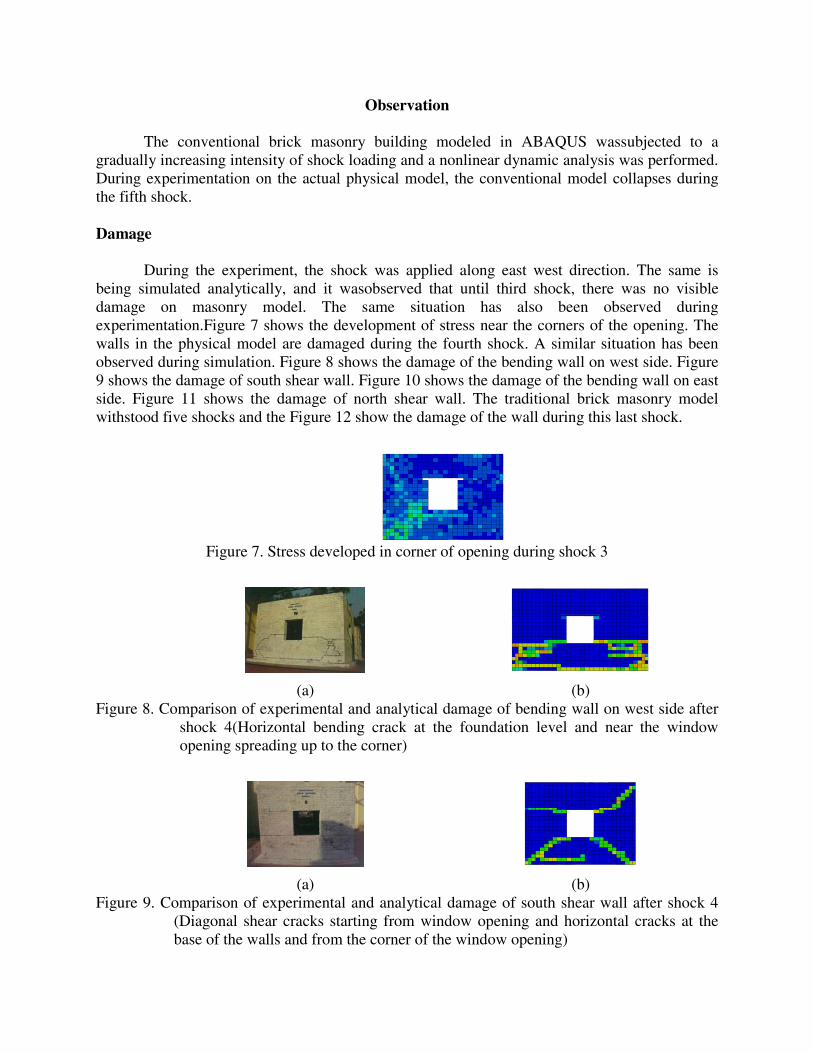
The physical model constructed on the shock table is modeled in ABAQUS. Masonry with mortar is modeled as a homogeneous material. The walls, roof and lintel are modeled using a solid 8-nodded linear hexahedral element with incompatible modes (C3D8I) [15]. Tie constrains areused to connect different structural members. The reinforcement is modeled using 2-noded, linear truss element (T3D2) and is embedded inside the respective material [13]. Displacement is unrestrained along the direction of shock loading and is restrained in all other directions. Figure 3 shows the meshed finite element model of traditional brick masonry building.
Figure 3. Finite element model of traditional brick masonry building
Result on Parametric Study Masonry, Concrete and Steel are used in the model. Density, Poisson ratio and Young’s modulus were the properties used in this parametric study. It is assumed that for the first shock the materials will be within the elastic limit. So, by applying the shock 1 at the base and by retainingconstant value for all the materialsexcept the Young’s modulus of masonry, the roof
acceleration obtained wascompared with the experimental roof acceleration.A linear dynamic analysis was performed and Table 1 shows the detail of parametric analysis.
Table 1. Detail of parametric analysis on traditional brick masonry building.
Material Trial Young’s Modulus (N/m2)
Base Acceleration
(in ‘g’)
Experimental roof
acceleration (in ‘g’)
Analytical roof
acceleration (in ‘g’)
Masonry
1 2.3×10⁹ 0.53 0.59 0.57
2 2.8×10⁹ 0.53 0.59 0.58
Note: Density of Concrete = 2400Kg/m3; Young’s modulus of Concrete = 1.94×10¹⁰ N/m2; Poisson’s ratio of Concrete = 0.2; Density of Steel = 7850 Kg/m3; Young’s modulus of Steel = 2.00×10¹¹ N/m2; Poisson’s ratio of Steel = 0.3; Density of Masonry = 1920 Kg/m3; Poisson’s ratio of Masonry = 0.2
Material Modeling
The seismic response is a cyclic process on all materials. The cyclic load has the influence on the material behavior. Masonry is a brittle material with very low tensile stress. During uni-axial compression or tension test, modulus of elasticity is constant up to the yield point. The non-linear material properties help in understanding the material behavior beyond the elastic range. Concrete, masonry and rebar are the materials used in the actual physical model. The metal plasticity in ABAQUS is used for recreating the nonlinear material response of rebar [4]. The CDP in ABAQUS is used for replicating the nonlinear behavior of concrete [4, 7,11]. Same as concrete, masonry is a brittle material with very low tensile strength. Therefore, CDP used for concrete is adopted for recreating the nonlinear behavior of masonry as well. Rebar
The steel of Fe250 grade is used for reinforcement. Figure 4 shows the stress-strain graph for rebar [16]. The other parameters used for steel are Density = 7850 Kg/m3, Modulus of Elasticity = 2×10¹¹ N/m2, Poisson’s ratio = 0.3 [9, 10, 16].
Figure 4. Stress-strain curve for steel
Masonry The compressive strength of masonry prism used in this study is 4.1 MPa [12]. The stress-strain curve for masonry in compression developed using tri-linear model [12] has been used in this study. The tensile strength of masonry used in this study is 0.28 MPa [14]. The stress-strain curve for masonry in tension used by Chen et al. [2] is adopted for this model. Figure 5 shows the stress strain curve for masonry in compression and tension. The other parameters are used for masonry by CDP are Density = 1920 Kg/m3, Modulus of Elasticity = 2.8×10⁹ N/m2, Poisson’s ratio = 0.2, Dilation angle = 30°, Flow potential eccentricity = 0.1, Ratio of initial equi-biaxial compressive yield stress to initial uni-axial compressive yield stress = 1.16, Ratio of second stress invariant = 0.667, Viscosity parameter = 0 [12].
Figure 5. Stress-strain curve for masonry in compression and tension Concrete The concrete used for lintel and RC slab is of grade M15. Therefore, the characteristic compressive strength [9] for M15 grade is 15MPa. The stress-strain curve for concrete in compression is developed from an empirical relation used by Hu et al. [8] is adopted for this study. The maximum stress will be reached at a strain approximately equal to 0.002. The strain at which the failure of concrete occurs is taken as 0.005 [16]. The stress-strain curve for concrete in tension developed from an empirical relation used by Vecchio. [18] is adopted for this study. Flexural strength of concrete is calculated based on the formula given in Indian code of practice IS: 456-2000 [9]. The limiting tensile strain of concrete is 0.0001 [16]. Figure 6 shows the stress-strain curve for concrete in compression and tension. The other parameters used for concrete by CDP are Density = 2400 Kg/m3, Modulus of Elasticity = 1.94×10¹⁰ N/m2, Poisson’s ratio = 0.2, Dilation angle = 38°, Flow potential eccentricity = 0.1, Ratio of initial equi-biaxial compressive yield stress to initial uni-axial compressive yield stress = 1.16, Ratio of second stress invariant = 0.667, Viscosity parameter = 0[11].
Figure 6. Stress-strain curve for concrete in compression and tension
Observation The conventional brick masonry building modeled in ABAQUS wassubjected to a gradually increasing intensity of shock loading and a nonlinear dynamic analysis was performed. During experimentation on the actual physical model, the conventional model collapses during the fifth shock. Damage During the experiment, the shock was applied along east west direction. The same is being simulated analytically, and it wasobserved that until third shock, there was no visible damage on masonry model. The same situation has also been observed during experimentation.Figure 7 shows the development of stress near the corners of the opening. The walls in the physical model are damaged during the fourth shock. A similar situation has been observed during simulation. Figure 8 shows the damage of the bending wall on west side. Figure 9 shows the damage of south shear wall. Figure 10 shows the damage of the bending wall on east side. Figure 11 shows the damage of north shear wall. The traditional brick masonry model withstood five shocks and the Figure 12 show the damage of the wall during this last shock.
Figure 7. Stress developed in corner of opening during shock 3
(a)
(b)
Figure 8. Comparison of experimental and analytical damage of bending wall on west side after shock 4(Horizontal bending crack at the foundation level and near the window opening spreading up to the corner)
(a)
(b) Figure 9. Comparison of experimental and analytical damage of south shear wall after shock 4
(Diagonal shear cracks starting from window opening and horizontal cracks at the base of the walls and from the corner of the window opening)
(a)
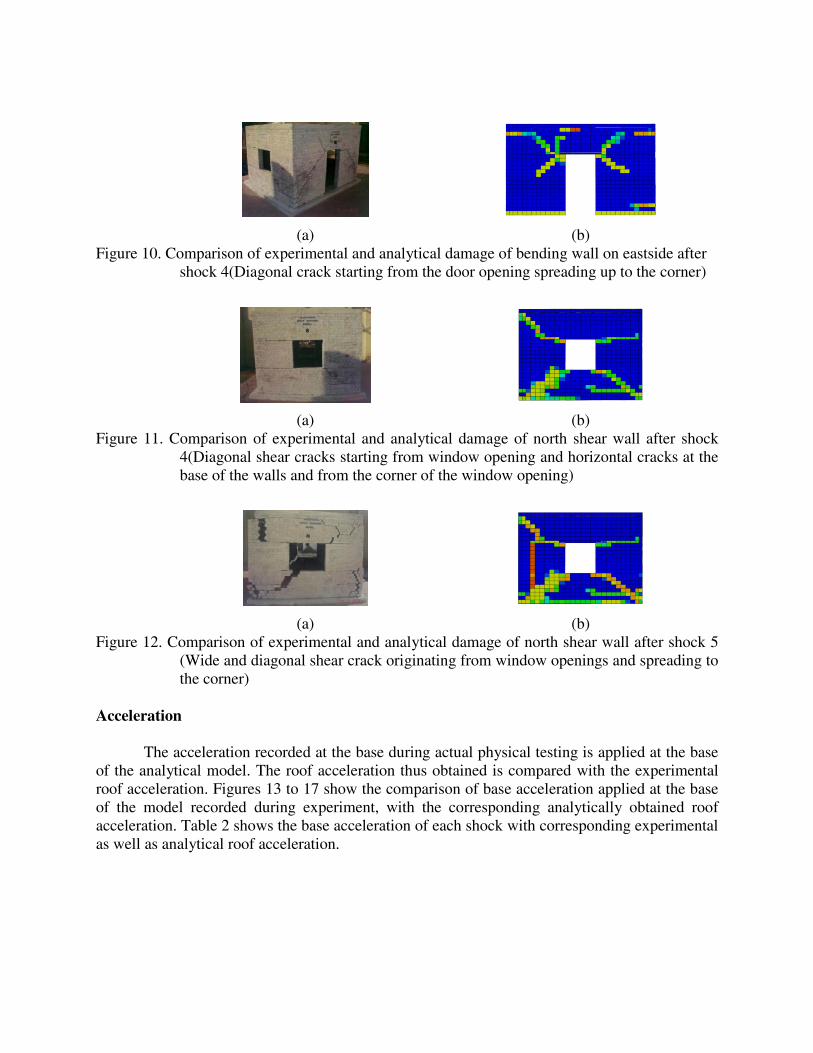
(b) Figure 10. Comparison of experimental and analytical damage of bending wall on eastside after
shock 4(Diagonal crack starting from the door opening spreading up to the corner)
(a)
(b) Figure 11. Comparison of experimental and analytical damage of north shear wall after shock
4(Diagonal shear cracks starting from window opening and horizontal cracks at the base of the walls and from the corner of the window opening)
(a)
(b) Figure 12. Comparison of experimental and analytical damage of north shear wall after shock 5
(Wide and diagonal shear crack originating from window openings and spreading to the corner)
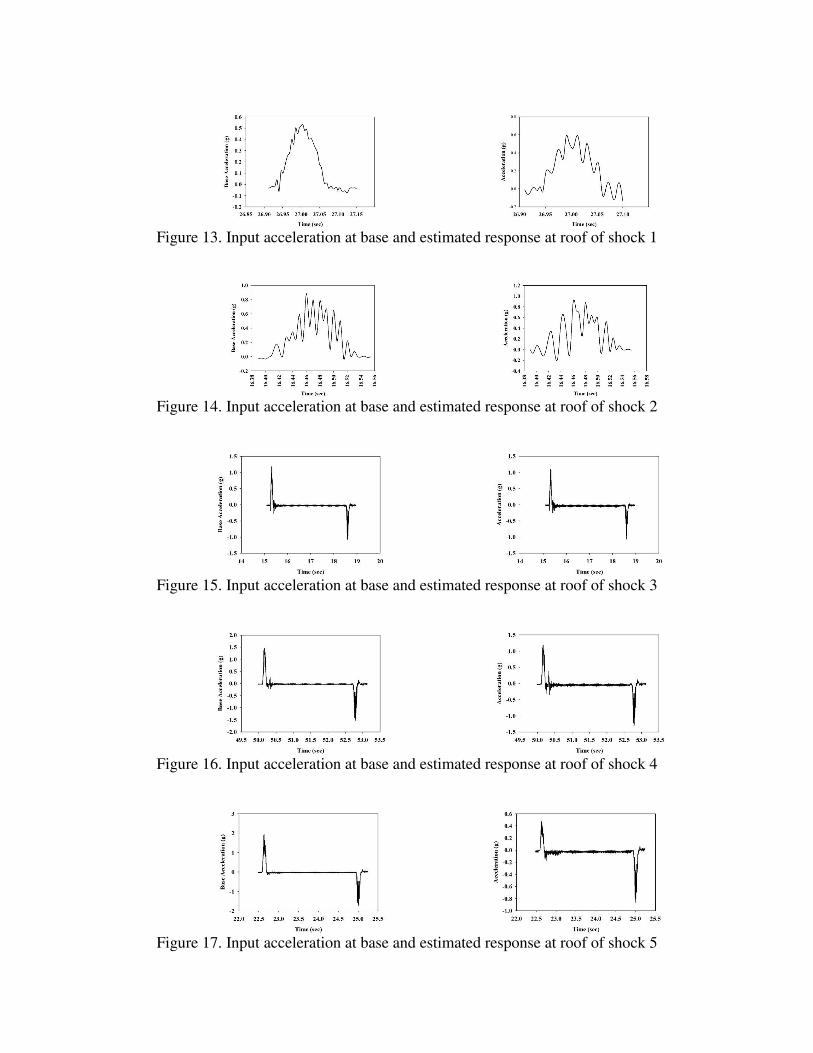
Acceleration The acceleration recorded at the base during actual physical testing is applied at the base of the analytical model. The roof acceleration thus obtained is compared with the experimental roof acceleration. Figures 13 to 17 show the comparison of base acceleration applied at the base of the model recorded during experiment, with the corresponding analytically obtained roof acceleration. Table 2 shows the base acceleration of each shock with corresponding experimental as well as analytical roof acceleration.
Figure 13. Input acceleration at base and estimated response at roof of shock 1
Figure 14. Input acceleration at base and estimated response at roof of shock 2
Figure 15. Input acceleration at base and estimated response at roof of shock 3
Figure 16. Input acceleration at base and estimated response at roof of shock 4
Figure 17. Input acceleration at base and estimated response at roof of shock 5
Table 2. Comparison of roof acceleration for conventional model
Shock Peak Absolute Base Acceleration
(in ‘g’)
Experimental Peak Absolute
Horizontal Roof Acceleration
(in ‘g’)
Analytical Peak Absolute
Horizontal Roof Acceleration
(in ‘g’)
Loading Pulse
Rebound Pulse
Loading Pulse
Rebound Pulse
Loading Pulse
Rebound Pulse
Shock 1 0.53 --- 0.59 --- 0.58 ---
Shock 2 0.88 --- 0.91 --- 0.88 ---
Shock 3 1.18 1.05 1.14 1.10 1.10 1.05
Shock 4 1.45 1.51 1.24 1.38 1.18 1.30
Shock 5 1.93 1.62 0.51 0.88 0.44 0.80
Conclusions
Modeling and analysis of brick masonry building involves uncertainties like modeling assumptions and the properties of local material. The properties of local material include numerous other parameters like workmanship, quality of brick, quality of the mortar, thickness of the mortar joint, ambient condition and type of curing. To overcome these uncertainties a parametric study was performed to estimate the dynamic propertycomparing the acceleration of the first shock. Further, a nonlinear dynamic analysis was also performed comparing the roof acceleration and damage pattern of the structure obtained analytically with that of the experimental observation. The conclusions drawn from the foregoing study are summarized below
i. The roof accelerations obtained analytically were in good agreement with experimental roof accelerations. The variation in the roof accelerations is nearly 16%.
ii. No damage was observed both in analytical model as well as during experimentation till third shock. But the development of stress near the corner of the opening is same as expected during the third shock.
iii. The crack propagation and the damage pattern observed analytically in traditional brick masonry model after every shock were almost similar to that of experimental observations.
iv. During experimental investigation it was observed that the traditional brick masonry model completely collapsed after the sixth shock. But for the same shock, during simulation, the conventional model withstood load higher than its capacity. This is due to the limitations of concrete damaged plasticity.
References
1. Chavez M, Meli R.Shaking table testing and numerical simulation of the seismic response of a typical Mexican
2. Chen Y, Ashour AF, Garrrity SW. Moment/thrust interaction diagrams for reinforced masonry sections.Construction and Building Material2008; 22: 763-770.
3. Dhanasekar M,Haider W. Explicit finite element analysis of lightly reinforced masonry shear wall.Computer & Structures 2007; 86: 15-26.
5. Dubey Ramanand.Experimental studies to verify the efficacy of earthquake resistance measure in masonry structures. Ph.D. thesis, Earthquake Engineering Department, Indian Institute of Technology Roorkee, Roorkee, India, 2011.
6. Giordano A, Mele E, De Luca A. Modelling of historical masonry structures: Comparison of different approaches through a case study.Engineering Structures2002; 24: 1057-1069.
7. Grecchi G. Material and structural behavior of masonry: simulation with a commercial code.Laurea Thesis, University of Pavia, Lombardy, Italy, 2010.
8. Hu TH, Lin FM,Jan YY. Nonlinear finite element analysis of reinforced concrete beams strengthened by fiber-reinforced plastics.Composite Structures2004; 63: 271-281.
9. IS: 456. Plain and reinforced concrete - Code of practice.Bureau of Indian Standard, New Delhi, India, 2000.
10. IS: 875 (Part 1).Code of practice for design loads (other than earthquake) for building and structures.Bureau of Indian Standard, New Delhi, India, 1987.
11. JankowiakT,Lodygowski T. Identification of parameters of concrete damage plasticity constitutive model.Foundation of Civil and Environmental Engineering2005; 6: 53-69.
12. Kaushik HB, Rai DC, JainSK. Stress-strain characteristics of clay brick masonry under uniaxial compression.Journal of Structural Engineering, ASCE2007; 19: 728-739.
13. Lee HK,KinBR, HaSK. Numerical evaluation of shear strengthening performance of CFRP sheets/strips and sprayed epoxy coating repair systems.Composite Part B: Engineering 2007; 39: 851-862.
14. Nateghi AF, Alemi F. Experimental study of seismic behavior of typical Iranian URM brick walls.The 14th World Conference on Earthquake Engineering 2008; Oct 12-17:Beijing, China.
15. Oyarzo-Vera C, Abdul Razak AK,Chouw N. Modal testing of an unreinforced masonry house.International Operational Modal Analysis Conference 2009;Portonovo, Ancona, Italy.
16. Pillai SU, MenonD. Reinforced concrete design.Tata McGraw-Hill Education Private Limited: New Delhi, 2010.
17. Rai DC,Agnihotri P,Singhal V. Out-of –plane strength of damaged unreinforced masonry walls.12th North American Masonry Conference 2011; Minneapolis, Minnesota, USA.
18. Vecchio FJ. Reinforced concrete membrane element formulation.Journal of Structural Engineering, ASCE 1990; 116: 730-750.