23
FIRST DEFENSE ® TESTING USING MAINE DEPARTMENT OF ENVIRONMENTAL PROTECTION PROTOCOL UTILIZING OK-110 FEED SAND NOVEMBER 2004

FIRST DEFENSE® TESTING USING MAINE DEPARTMENT OF ENVIRONMENTAL PROTECTION PROTOCOL UTILIZING OK-110 FEED SAND NOVEMBER 2004


CONTENTS
1. INTRODUCTION ............................................................................................ 1
2. LAB TEST FACILITY DESCRIPTION ............................................................ 1
3. LABORATORY TESTING PROTOCOL ......................................................... 2
3.1 FLOW CALIBRATION ....................................................................................... 2
3.2 SYSTEM EQUILIBRIUM .................................................................................... 3
3.3 SAMPLING ..................................................................................................... 3
4. LABORATORY TESTING PROCEDURE ...................................................... 4
4.1 TEST .......................................................................................................... 4
4.2 CALCULATION OF REMOVAL EFFICIENCY .......................................................... 5
5. RESULTS AND DISCUSSION ....................................................................... 5
6. ACKNOWLEDGEMENT .............................................................................. 5
APPENDICES APPENDIX A – LAB ARRANGEMENT DIAGRAM APPENDIX B – LAB PHOTOGRAPHS APPENDIX C – TEST DATA
Copyright 2004. This document and its contents are the property of Hydro International and may not be copied or modified in any way without prior written permission of Hydro International.


1
1. INTRODUCTION
Hydro International (Hydro) has a full-scale testing facility at its headquarters in Portland, Maine. This facility is comprehensive and allows testing of the First Defense® and other Dynamic Separators to be done under controlled conditions to comply with different laboratory testing protocols. Hydro has conducted testing of a 4-ft diameter First Defense® at its facility using the Maine DEP protocol for laboratory testing. This report presents the results of this testing which involved the use of U.S. Silica grade OK-110 foundry sand as the feed material. The results obtained confirm the ability of the 4-ft First Defense® to remove greater than or equal to 80% of the feed material at 320 gpm. The above performance conforms to the Maine DEP’s 60% Total Suspended Solids (TSS) removal rating criteria and this report is submitted to Maine DEP in advance of a request for witness testing and verification prior to formal approval of the 60% rating. 2. LAB TEST FACILITY DESCRIPTION
The Hydro test facility consists of a 23,300-gallon clean water storage reservoir equipped with a Flygt submersible pump to provide feed water. The test unit is a 4-ft diameter First Defense® with a 12-inch inlet. The First Defense® is connected to the pump delivery with 12-inch diameter PVC pipe-work that incorporates clear standpipes, as well as a valved bypass, which directs excess flows back to the reservoir. The delivery line is fitted with a Hershey VP-820 gearbox butterfly valve along with a variable frequency drive (VFD) for accurate flow control. The overflow from the First Defense® is sent back to the reservoir for re-circulation via a 12-inch PVC pipe. Water and sand are mixed in a 60-gallon barrel to create a sand-slurry, which is fed into the test unit via the inlet piping. The sand-slurry is injected into the 8-inch inlet pipe upstream of the First Defense® by a Watson-Marlow peristaltic pump. A grab sample valve is incorporated in the inlet piping of the First Defense® , and this consists of a simple 6-inch diameter gate valve with a T-handle. An automatic sampler is located upstream from the feed standpipe to sample background Total Suspended Solids concentrations in the feed from the clean water storage reservoir. The automatic sampler is a Sigma 900 portable sampler that takes about 700 ml per sample. An ISCO UniMag Magnetic Flowmeter is located in the 8-inch diameter inlet piping upstream from the inlet to the First Defense® test unit. The underflow from the First Defense® test unit is valved to an underflow

2
collection tank with a weir wall and two baffles for sediment collection after a test. A clean-out port at the base of the First Defense® allows for sediment collection and rinsing. Materials and equipment used in the TSS analysis included: • Distilled water, spray bottles, and containers • Calibrated scales • 47mm diameter glass fiber ProWeigh Filters with a 1.5 µm pore size • Welch-Thomas vacuum pump • Millipore Frit Glass base and stopper for 47mm filters • VWR Scientific Products 1370 forced air oven • A W.S. Tyler RX-29 ROTAP sieve shaker for the sieve analysis of sand An arrangement drawing of the test facility is included in Appendix A and photographs showing aspects of the test set-up and equipment are included in Appendix B.
3. LABORATORY TESTING PROTOCOL
3.1 Flow Calibration
The First Defense® was tested at the designed treatment flow rate. This flow rate was 320 gpm. Flow was measured using the ISCO UniMag Magnetic Flowmeter System which has an accuracy of plus/minus 0.5% of flow rate for mean velocities of 1 ft/s and greater. This equates to a minimum flow rate of 156 gpm for an 8-inch pipe. The flow rate was also verified by an alternative measurement technique using volumetric, time-to-fill calculations. The test sand slurry inflow was regulated through a peristaltic pump and was introduced into the inlet pipe via a tube into the feed standpipe. The slurry concentration was continuously stirred in the 60 gallon feed barrel with a rotating stir rod and propeller on a drill motor. The TSS concentrations from the influent samples were in a range of 136 to 299 mg/l and averaged 225 mg/l overall.

3
3.2 System Equilibrium
The 4-ft diameter First Defense® test unit has an effective treatment volume equal to: V=π·r2
·h; r = 2 ft, h = 4.4 ft V = 55.29 ft - where r = radius of treatment unit,
h = distance between the invert of the inlet and elevation of maximum storage capacity of the First Defense®.
The theoretical residence time is equal to the amount of time it takes one (1) unit volume to pass through the system at a given flow rate assuming plug flow conditions (no underflow). The residence times for our experiments were based on the volume between the sampling points. The residence time was calculated by dividing this volume by the flow rate through the system. To ensure that equilibrium conditions had been established, four (4) residence times passed before sampling commenced.
3.3 Sampling
Six (6) sets of samples were collected at 1-minute intervals from the inlet and outlet via grab sampling. Sample volumes were a minimum of 630 ml and averaged 715 ml. Automatic samples for determining background concentrations were also taken corresponding to the 6 inlet samples thus giving a total of 18 samples per test. For example, for a test at a flow rate of 320 gpm, 4 unit volumes were allowed to pass before sampling to ensure equilibrium conditions. This meant that the first influent was sampled at 5:13 min/sec and the first effluent at 6:31 min/sec, after the start of the test. This reflects the 78.28 seconds residence time for that flow rate. The second samples were taken 1 minute after the first at 6:13 and so on. To ensure there was no buildup at the gate valve and to ensure representative sampling, the valve was purged seconds before a sample was taken so that a more accurate and representative reflection of the influent stream was sampled.

4
4. LABORATORY TESTING PROCEDURE
The following is an outline description of the testing procedure.
4.1 Test
1. Start with a clean First Defense® and clean water in the reservoir. 2. Accurately weigh out 4 lbs. of OK-110 influent feed sand. Fill the slurry
feed tank with 45 gallons of clean water. 3. Take a sieve sample of the feed sand. The sieve analysis shows the
consistency of feed sand used for each micron category to minimize variability in test results.
4. Make sure the bypass valve and the control valve are fully opened for unrestricted flow. Make sure the clean-out port is closed on the First Defense® and the underflow valve is closed. Make sure the influent grab sample valve is closed.
5. Start the pump and watch for the First Defense® to overflow into the reservoir and the flow rate to stabilize.
6. Adjust the flow rate using the VFD to the target rate of 320 gpm. (This flow rate was verified with at least 3 time-to-fill volumetric tests.)
7. Start the stirring motor in the slurry feed barrel and then introduce the sand into the barrel.
8. Turn on the peristaltic pump and automatic sampler. 9. Once sand slurry flow enters the pipe, start the automatic sampler and
timer. The automatic sampler will take blank samples at 1-minute intervals corresponding with the influent sample times.
10. After 4 residence times have passed (i.e. 5:13 min/sec), take the first influent grab sample. Note: At 5:03 min/sec a purge or flush is performed by quickly opening and closing the valve immediately before taking the sample.
11. Take effluent sample 1 residence time (6:31) after influent sample (giving 5 residence times from sand introduction).
12. Take 6 sets of samples at 1-minute intervals. This yields a total of 18 samples.
13. Stop the sampling and test. Stop the pumps, stirring motor, and automatic sampler.
14. Drain the unit, flush it twice, clean and prepare for another test. 15. Analyze samples using an equivalent standard to the TSS Test Method 2
Filtration in ASTM, 1999, D 3977-97. Specifically, the Standard Methods 19th Ed 1995 for the Examination of Water and Wastewater prepared and published by the American Public Health Association (APHA), American Water Works Association (AWWA), and Water Environment Federation (WEF) chapter 2-2540 D Total Suspended Solids Dried at 103-105 deg C was used.

5
4.2 Calculation of Removal Efficiency The average removal efficiency was calculated using: (Mean inflow TSS concentration – Mean outflow TSS concentration) / Mean inflow TSS concentration
5. RESULTS AND DISCUSSION
After performing 3 tests at 320 gpm flow rate, the efficiency from the TSS analysis showed removal efficiencies equal to or greater than 80%. The observed removal efficiency range was 89.4 – 96.9 % with an average influent concentration of 225mg/l and an average effluent concentration of 14 mg/l. The results show that the 4-ft First Defense® achieves greater than 80% TSS removal efficiencies with OK-110 sand at a flow rate of 320 gpm using the recommended protocol. The effects of blanks on influent and effluent concentrations are negligible and are not reported. A simple Dixon Q Test was performed for every 6 sample-set to determine whether the data included any outliers within a 95% confidence interval. A statistical Dixon Q test was chosen to determine whether there is a determinate (systematic) or indeterminate (random) error in the data. This check showed that the influent and effluent data had no samples as outliers for a 95% confidence interval. The average influent sample was 224.688 mg/l and the average effluent sample was 14.346 mg/l, which shows an average removal efficiency of 93.66% within a 95% confidence interval.
See Appendix C for test data.
6. ACKNOWLEDGEMENT
Hydro International would like to acknowledge and thank the Maine Technology Institute (MTI) for providing some funding to assist in the development of the First Defense®. We also acknowledge the Maine DEP for providing us the opportunity to participate in the laboratory testing protocol and appreciate the ME DEP for establishing the protocols to provide a uniform basis for the evaluation of the performance of all proprietary stormwater treatment systems.

6

i
Appendix A Lab Arrangement Diagram

ii

iii

iv

v
Appendix B Lab Photographs

vi
TSS Lab, Scale, Vacuum Pump
First Defense
Volumetric Time-To-Fill Tank
Sand Seive Shaker Appendix B (pg 1)
FD Outlet Into Test Tank
Slurry feed set-up

vii
Forced Air Dryer and Scale
Watson-Marlow Peristaltic Pump
Flygt Submersible Pump Appendix B (pg 2)
UNIMAG Flow meter
Sigma Automatic Sampler
Control Valve
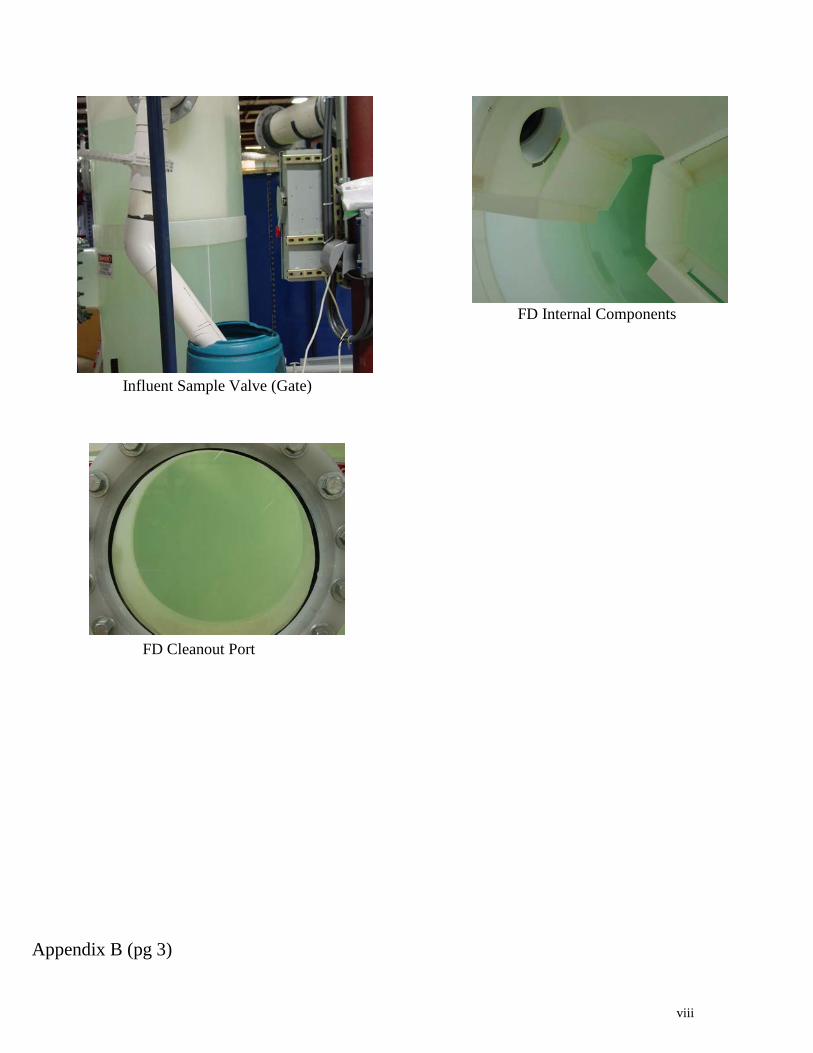
viii
Influent Sample Valve (Gate)
FD Internal Components
FD Cleanout Port
Appendix B (pg 3)

ix
Appendix C Test Data
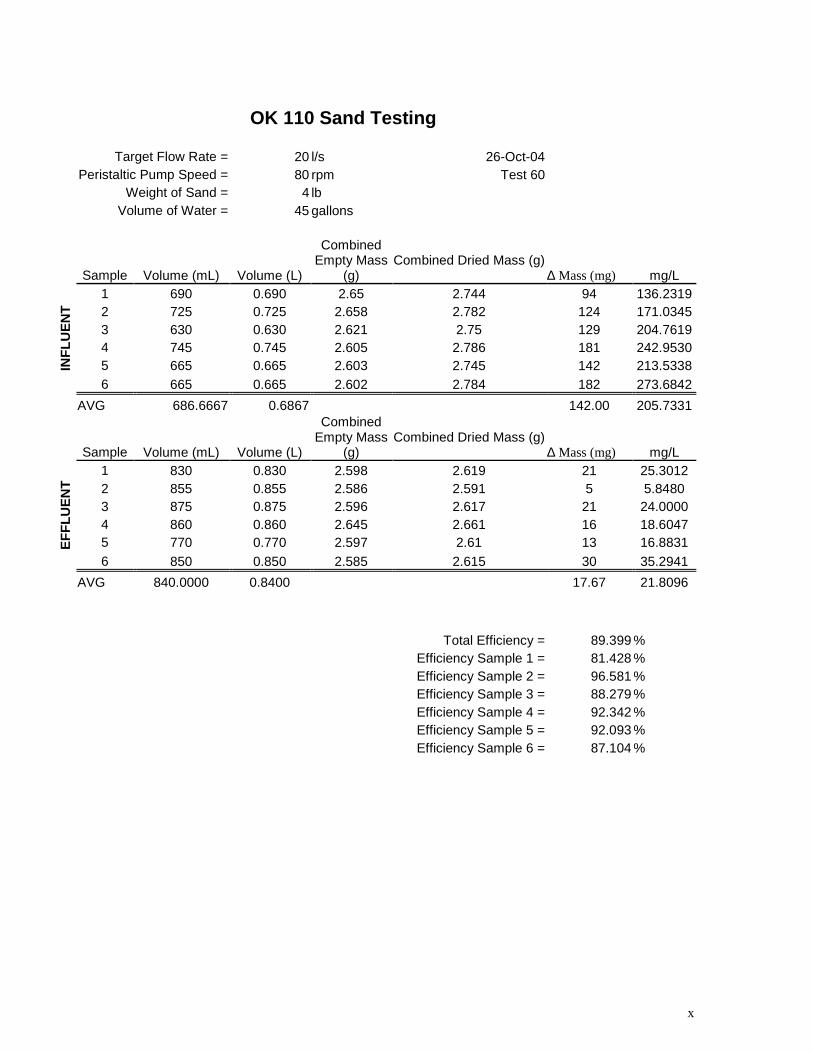
x
OK 110 Sand Testing Target Flow Rate = 20 l/s 26-Oct-04 Peristaltic Pump Speed = 80 rpm Test 60 Weight of Sand = 4 lb Volume of Water = 45 gallons Combined
Empty Mass (g)
Combined Dried Mass (g)
Sample Volume (mL) Volume (L) ∆ Mass (mg) mg/L
INF
LU
EN
T 1 690 0.690 2.65 2.744 94 136.2319
2 725 0.725 2.658 2.782 124 171.0345 3 630 0.630 2.621 2.75 129 204.7619 4 745 0.745 2.605 2.786 181 242.9530 5 665 0.665 2.603 2.745 142 213.5338 6 665 0.665 2.602 2.784 182 273.6842
AVG 686.6667 0.6867 142.00 205.7331
Combined Empty Mass
(g) Combined Dried Mass (g)
Sample Volume (mL) Volume (L) ∆ Mass (mg) mg/L
EF
FL
UE
NT
1 830 0.830 2.598 2.619 21 25.3012 2 855 0.855 2.586 2.591 5 5.8480 3 875 0.875 2.596 2.617 21 24.0000 4 860 0.860 2.645 2.661 16 18.6047 5 770 0.770 2.597 2.61 13 16.8831 6 850 0.850 2.585 2.615 30 35.2941
AVG 840.0000 0.8400 17.67 21.8096
Total Efficiency = 89.399 % Efficiency Sample 1 = 81.428 % Efficiency Sample 2 = 96.581 % Efficiency Sample 3 = 88.279 % Efficiency Sample 4 = 92.342 % Efficiency Sample 5 = 92.093 % Efficiency Sample 6 = 87.104 %

xi
OK 110 Sand Testing Target Flow Rate = 20 l/s 1-Nov-04 Peristaltic Pump Speed = 80 rpm Test 65 Weight of Sand = 4 lb Volume of Water = 45 gallons Combined
Empty Mass (g)
Combined Dried Mass (g)
Sample Volume (mL) Volume (L) ∆ Mass (mg) mg/L
INF
LU
EN
T 1 725 0.725 2.752 2.946 194 267.5862
2 790 0.790 2.747 2.927 180 227.8481 3 700 0.700 2.754 2.936 182 260.0000 4 645 0.645 2.741 2.872 131 203.1008 5 785 0.785 2.829 2.95 121 154.1401 6 705 0.705 2.849 2.977 128 181.5603
AVG 725.0000 0.7250 156.00 228.0191
Combined Empty Mass
(g) Combined Dried Mass (g)
Sample Volume (mL) Volume (L) ∆ Mass (mg) mg/L
EF
FL
UE
NT
1 820 0.820 2.838 2.846 8 9.7561 2 685 0.685 2.724 2.726 2 2.9197 3 775 0.775 2.709 2.715 6 7.7419 4 775 0.775 2.724 2.731 7 9.0323 5 815 0.815 2.758 2.77 12 14.7239 6 690 0.690 2.846 2.85 4 5.7971
AVG 760.0000 0.7600 6.50 7.0494
Total Efficiency = 96.908 %
Efficiency Sample 1 = 96.354 % Efficiency Sample 2 = 98.719 % Efficiency Sample 3 = 97.022 % Efficiency Sample 4 = 95.553 % Efficiency Sample 5 = 90.448 % Efficiency Sample 6 = 96.807 %

xii
OK 110 Sand Testing
Target Flow Rate = 20 l/s 1-Nov-04 Peristaltic Pump Speed = 80 rpm Test 66 Weight of Sand = 4 lb Volume of Water = 45 gallons Combined
Empty Mass (g)
Combined Dried Mass (g)
Sample Volume (mL) Volume (L) ∆ Mass (mg) mg/L
INF
LU
EN
T 1 710 0.710 2.756 2.968 212 298.5915
2 730 0.730 2.751 2.945 194 265.7534 3 785 0.785 2.755 2.99 235 299.3631 4 760 0.760 2.74 2.924 184 242.1053 5 655 0.655 2.825 2.933 108 164.8855 6 725 0.725 2.847 3.019 172 237.2414
AVG 727.5000 0.7275 184.17 268.6109
Combined Empty Mass
(g) Combined Dried Mass (g)
Sample Volume (mL) Volume (L) ∆ Mass (mg) mg/L
EF
FL
UE
NT
1 750 0.750 2.838 2.851 13 17.3333 2 710 0.710 2.718 2.727 9 12.6761 3 885 0.885 2.71 2.72 10 11.2994 4 855 0.855 2.723 2.732 9 10.5263 5 850 0.850 2.759 2.772 13 15.2941 6 790 0.790 2.844 2.856 12 15.1899
AVG 806.6667 0.8067 11.00 13.4050
Total Efficiency = 95.010 % Efficiency Sample 1 = 94.195 %
Efficiency Sample 2 = 95.230 % Efficiency Sample 3 = 96.226 % Efficiency Sample 4 = 95.652 % Efficiency Sample 5 = 90.724 % Efficiency Sample 6 = 93.597 %
xiii
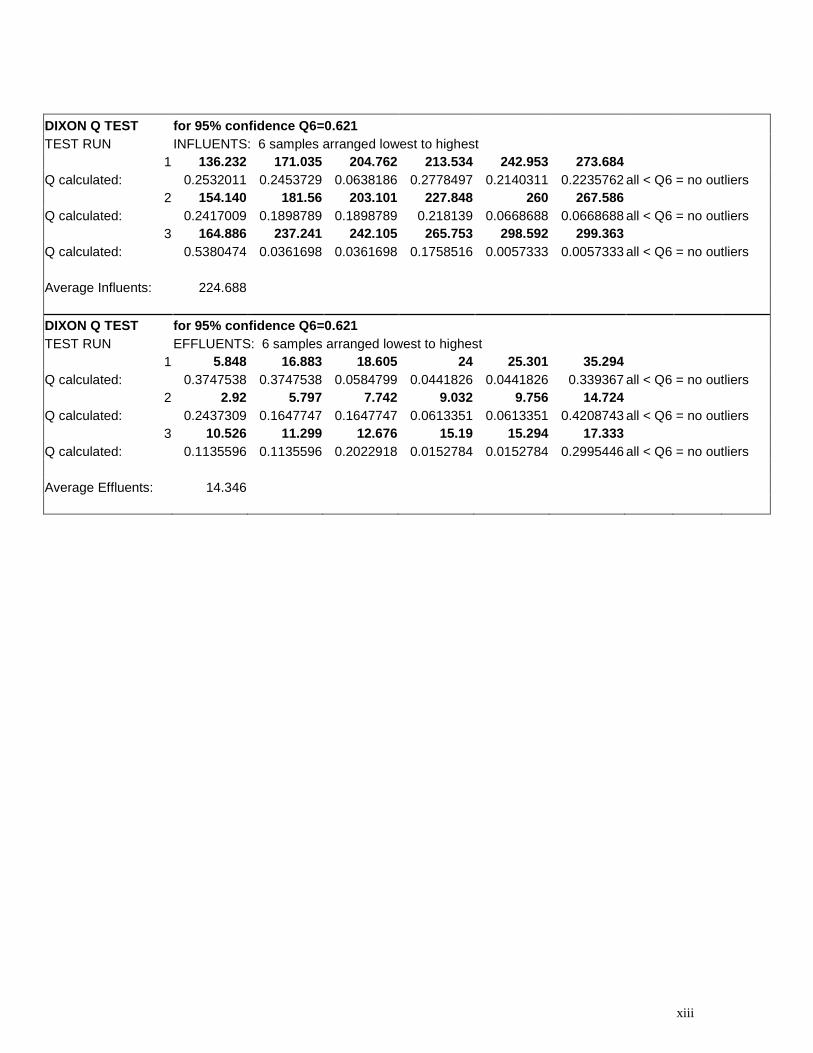
DIXON Q TEST for 95% confidence Q6=0.621 TEST RUN INFLUENTS: 6 samples arranged lowest to highest
1 136.232 171.035 204.762 213.534 242.953 273.684 Q calculated: 0.2532011 0.2453729 0.0638186 0.2778497 0.2140311 0.2235762 all < Q6 = no outliers
2 154.140 181.56 203.101 227.848 260 267.586 Q calculated: 0.2417009 0.1898789 0.1898789 0.218139 0.0668688 0.0668688 all < Q6 = no outliers
3 164.886 237.241 242.105 265.753 298.592 299.363 Q calculated: 0.5380474 0.0361698 0.0361698 0.1758516 0.0057333 0.0057333 all < Q6 = no outliers Average Influents: 224.688
DIXON Q TEST for 95% confidence Q6=0.621 TEST RUN EFFLUENTS: 6 samples arranged lowest to highest
1 5.848 16.883 18.605 24 25.301 35.294 Q calculated: 0.3747538 0.3747538 0.0584799 0.0441826 0.0441826 0.339367 all < Q6 = no outliers
2 2.92 5.797 7.742 9.032 9.756 14.724 Q calculated: 0.2437309 0.1647747 0.1647747 0.0613351 0.0613351 0.4208743 all < Q6 = no outliers
3 10.526 11.299 12.676 15.19 15.294 17.333 Q calculated: 0.1135596 0.1135596 0.2022918 0.0152784 0.0152784 0.2995446 all < Q6 = no outliers Average Effluents: 14.346


