34
Interim financial report First quarter 2021

Interim financial report First quarter 2021

2/33
Interim financial report First quarter 2021
Management’s review
Overview
CEO’s review 3
At a glance 6
Outlook 7
Results Q1 8
Business units’ results 11
Performance highlights 15
Quarterly overview 16
Financial statements
Consolidated financial statements
Income statement Q1 18
Statement of comprehensive income Q1 18
Balance sheet 19
Statement of change in equity 20
Statement of cash flows 21
Notes
1. Basis reporting 22
2. Business performance 22
3. Segment information 23
4. Revenue 25
5. Other operating income and expenses 26
6. Financial income and expenses 26
7. Gross and net investments 27
8. Reserves 27
9. Tax on profit (loss) for the year 28
10. Market risks 29
11. Fair value measurement 30
12. Interest-bearing debt and FFO 31
Management statement
Statement by the Executive Board and the Board of Directors
32
Forward-looking statements 33
Contents
Earnings call
In connection with the presentation of the interim
financial report an earnings call for investors and
analysts will be held on Thursday, 29 April 2021 at
14:00 CEST:
Denmark: +45 7872 3251
International: +44 333 300 9267
USA: +1 833 526 8384
The earnings call can be followed live at:
https://edge.media-server.com/mmc/p/79p2v9ea
Presentation slides will be available prior to the
earnings call at:
https://edge.media-server.com/mmc/p/33swwkbd
The interim financial report can be downloaded at: www.orsted.com/en/investors/ir-material/financial-reports-and-presentations#0
Further information
Group Communications
Martin Barlebo
Tel.: +45 99 55 95 52
Investor Relations
Allan Bødskov Andersen
Tel.: +45 99 55 79 96

3/33
Management’s review Interim financial report First quarter 2021
Our green share of heat and power generation
amounted to 87 % in Q1 2021, down three
percentage points relative to the same period
last year. The development compared to Q1
2020 was primarily due to higher power gener-
ation from our coal-fuelled units where we are
regulatorily obliged to offer our capacity to
the market in the most cost-efficient way.
Construction and operational progress
With COVID-19 infections picking up again in
late 2020 and into Q1, our Corporate Crisis
Management Organisation (CCMO) has contin-
ued to meet regularly, focusing on the health
and safety of our employees and ensuring
business continuity. In the first quarter, we
have not seen any material adverse effects of
COVID-19, and our asset base has been fully
operational with normal availability rates
across our offshore and onshore portfolios.
Furthermore, all our construction activities
have progressed according to plan.
During the period from 11 February and a week
ahead, Texas was subject to an unprecedent-
ed winter storm, which not only challenged
our business, but all communities affected. The
cold weather was accompanied by surging
power prices as generation capacity across
the state failed in the tough conditions. Keep-
ing our employees, contractors, and the com-
munities in which we operate safe was our
main priority during this event. Our trading
department managed to a great extent to
mitigate the potential losses on our so-called
fixed-shape contracts, which commit us to
deliver power independent of actual power
Financials
Our operating profit (EBITDA) for the first
quarter of the year amounted to DKK 4.9
billion, a DKK 1.9 billion decrease compared to
the same period last year. The decrease was
mainly due to high earnings from the construc-
tion agreement related to the Hornsea 1
transmission assets in Q1 2020 which were not
repeated in Q1 2021 and significantly lower
wind speeds across our offshore portfolio.
Furthermore, we made a DKK 0.8 billion war-
ranty provision in Q1 2021 related to cable
protection system issues at some of our off-
shore wind farms. The operational perfor-
mance of the Group was good during Q1 2021,
slightly exceeding our expectations. Our
availability rates have been solid, and we have
seen higher than expected performance from
our CHP plants as well as achieving additional
earnings from finalised construction projects.
Earnings from our offshore and onshore wind
farms in operation were in line with the same
period last year. More wind farms in operation
were offset by significantly lower wind speeds
across our offshore portfolio.
Our operations and financial performance
continued to remain solid despite the COVID-
19 pandemic, and we maintain our full-year
EBITDA guidance of DKK 15-16 billion.
We also reiterate our current full-year gross
investment expectation of DKK 32-34 billion.
However, once the Brookfield Renewable
Ireland acquisition closes, the purchase price
will be added to the current guidance.
CEO’s review
In the first quarter of 2021, we made great strategic progress,
reaching multiple milestones, including signing an agreement to
farm-down 50 % of Borssele 1 & 2, Baltica 2 & 3 receiving contracts
for difference (CfDs), an agreement to acquire a European onshore
platform, and signing multiple power purchase agreements (PPAs).
We also had a good operational quarter.
Highlights
Financials Operating profit (EBITDA) amounted to
DKK 4.9 billion, a DKK 1.9 billion decrease
compared to the same period last year.
EBITDA from offshore and onshore wind
farms amounted to DKK 5.2 billion, in line
with the same period last year.
Construction and operational progress Continued stable operations despite the
COVID-19 pandemic.
Green share of heat and power generation
amounted to 87 %.
Business development CfDs were awarded to the Polish projects
Baltica 2 & 3.
Signed an agreement with Norges Bank In-
vestment Management to farm-down 50 %
of the 752 MW offshore wind farm
Borssele 1 & 2.
Our Ocean Wind 1 project in New Jersey re-
ceived notice of intent (NoI).
Signed an agreement to acquire Brookfield
Renewable Ireland, a European onshore wind
platform.
Signed an MoU with Enefit to collaborate on
developing offshore wind energy in the Baltic
states.
Signed multiple PPAs; one for offshore and six
for onshore renewable energy generation.
Took FID on Helena Energy Center, a com-
bined solar PV (250 MWac) and wind (268 MW)
greenfield project in South Texas, US.

Management’s review
4/33
Interim financial report First quarter 2021
changed.
Business development
During Q1 2021, we reached significant strate-
gic milestones within our Offshore and On-
shore businesses.
Offshore
The Baltica 2 & 3 projects in the Baltic Sea
with a combined capacity of 2.5 GW have
been awarded contracts for difference (CfDs)
and are eligible to be included in Poland’s
offshore wind allocation round later this year.
The projects are part of a 50/50 joint venture
with PGE for development, construction, and
operation. We are still awaiting closing of the
agreement due to COVID-19-related delays.
When commissioned, the wind farms will
power 4 million Polish households with clean
electricity. Expanding our footprint to Poland,
which has set an ambitious renewable build-
out target for the coming years, is an im-
portant strategic milestone for our ambitions
in Continental Europe.
The offshore transmission assets at Hornsea 1
have been divested to Diamond Transmission
Partners (DTP) at a total asset value of GBP 1.2
billion (100 %). Hornsea 1 is located off the east
coast of the UK and is, to date, the largest
offshore wind farm in the world with a capaci-
ty of 1.2 GW. As part of the agreement, we will
provide long-term operations and mainte-
nance (O&M) services to DTP.
In April, we closed the agreement with New
Jersey’s Public Service Enterprise Group (PSEG)
to sell a 25 % ownership interest in our 1.1 GW
offshore wind development project Ocean
Wind 1. The project will be the first large-scale
offshore wind farm in New Jersey.
generation. Also, great efforts from our tech-
nical teams went in to keeping our assets
operational despite the extreme weather
conditions. Our ability to navigate the business
under these difficult circumstances is a testa-
ment to our agile operations set-up. We came
through the event with no significant impact
on our earnings.
We have discovered an array cable issue on
several offshore wind farms across the UK and
Continental Europe. The issue, which could
concern up to 10 of our wind farms, occurs
when the cable protection system (CPS) moves
across the scour protection (i.e. rocks placed on
the seabed around the foundations to avoid
seabed erosion), abrading the CPS and in the
worst-case scenario causing the cables to fail.
We are taking proactive measures to ensure
the long-term integrity of these assets by
engaging in a two-phased remediation ap-
proach, with phase one being stabilisation of
the CPS to prevent further degradation and
phase two being the repair or replacement of
damaged cables. Stabilisation will deliver the
optimal value risk management in the short
term to prevent further damage and can likely
eliminate the need to repair or replace most of
the less damaged cables in phase two. We
expect a limited production downtime related
to the stabilisation activities. Our early assess-
ment points to a total financial impact of
around DKK 3 billion across 2021 to 2023,
including a warranty provision of DKK 0.8
billion to cover potential costs towards part-
ners, with the largest cash outflows in 2022
and 2023, and with approx. one third expected
to be capitalised. Further investigations are
ongoing concerning the issue and the remedia-
tion measures needed, including the impact in
relation to suppliers, partners, and insurance.
All of our long-term guidance remains un-
Furthermore, we signed an agreement to farm
down 50 % of the 752 MW offshore wind farm
Borssele 1 & 2 to Norges Bank Investment
Management (NBIM) for approx. EUR 1.4 billion,
which is to be paid upon closing, expectedly
around summer 2021. We will continue to
provide O&M and balancing services for the
wind farm, generating clean power to the
equivalent of one million Dutch households.
We are very pleased with the farm-down that
underpins the attractiveness of our European
offshore wind assets.
Through the signing of a CPPA, Danfoss will
offtake part of the renewable power genera-
tion from our 209 MW offshore wind farm
Horns Rev 2 in Denmark. The CPPA is our first
for an offshore wind farm coming out of
subsidy and shows the potential of late-life
assets to secure stable revenue. We are happy
to support Danfoss in their efforts to become
carbon-neutral by 2030 and excited that an
increasing number of companies are taking
the conscious choice to purchase renewable
power.
In 2020, we made progress towards a greener
future based on renewable hydrogen, and we
continue to pursue opportunities within indus-
trial-scale production going into 2021. In
March, we joined forces with Yara, ArcelorMit-
tal, and North Sea Port to form the SeaH2land
project. The project entails a vision to decar-
bonise the production of ammonia and steel in
the Netherlands and Belgium and will be
carried out by building the world’s largest
renewable hydrogen plant powered by off-
shore wind.
We entered into a partnership with the Danish
pension fund ATP with the intention to partici-
pate in the upcoming auction for the Danish
energy island in the North Sea. Together with
ATP, we would like to build on our strong
industrial and financial competences and
contribute to the development of the green
transformation and renewable energy infra-
structure in Denmark.
Our portfolio of US offshore development
projects is moving forward. Late March, the US
Bureau of Ocean Energy Management (BOEM)
released its NoI which launched the formal
environmental review for our Ocean Wind 1
project. We are very pleased to have reached
this important permitting milestone for Ocean
Wind 1, as it represents the first offshore wind
project for New Jersey and is one of the largest
offshore wind contracts awarded in the US.
We are also pleased to have agreed with the
US National Oceanic and Atmospheric Admin-
istration (NOAA) to share physical and biologi-
cal data in Ørsted-leased waters subject to US
jurisdiction. The agreement is the first of its kind
between the offshore wind industry and the
The Baltica 2 & 3 projects in the Baltic Sea
with a combined capacity of 2.5 GW have
been awarded contracts for difference.
”

Management’s review
5/33
Interim financial report First quarter 2021
into an agreement to acquire a 100 % equity
interest in the Irish and UK onshore wind
business, Brookfield Renewable Ireland (BRI).
The agreement is based on an enterprise
valuation of BRI of EUR 571 million as of
31 December 2020. The final price will be
subject to customary adjustments. BRI is a
developer, owner, and operator of onshore
wind farms with an attractive portfolio of
389 MW in operation and under construction,
149 MW of advanced development projects,
and more than 1 GW of projects under devel-
opment in Ireland and the UK. The European
onshore market is expected to grow signifi-
cantly in the coming years, hence we see the
acquisition of BRI as the ideal next step, as it
offers a strong growth platform in Europe to
expand our onshore business.
To advance our build-out of renewable on-
shore capacity in the US, we have taken final
investment decision on constructing Helena
Energy Center, a combined solar PV
(250 MWac) and wind (268 MW) greenfield
project in South Texas, US. The project will
further strengthen our position in the ERCOT
market when commissioned, expectedly
during the summer of 2022. The solar PV
phase is qualified for 30 % ITC, and the wind
phase is qualified for 80 % PTC.
In the US, we signed PPAs with Target and
Hormel Foods to purchase renewable power
from our 298 MW onshore wind farm Haystack
in Nebraska. In addition, we also signed a PPA
with Nucor to purchase renewable power
from our 367 MW onshore wind farm Western
Trail in Texas. These companies are joining
PepsiCo with whom we signed several PPAs,
including both wind farms in January. The wind
farms are expected to be commissioned at the
end of the year. As part of the FID on Helena
Energy Center, we signed a PPA with Henkel
for a portion of the wind output and with
Target for a portion of the solar generation.
Finally, we signed a PPA with MSD for one of
our upcoming Texas solar PV projects. The
signed PPAs have a duration of around 10
years.
Bioenergy & Other
In March, we closed the divestment of the
majority of our UK B2B customers to Total
Gas & Power, thereby further streamlining
Bioenergy & Other.
Partnerships across sectors are key in the fight
against climate change, and together with
Norwegian Aker Carbon Capture and Mi-
crosoft, we have signed an MoU to explore the
potential for developing carbon capture at
our biomass-fired combined heat and power
plants. Carbon capture is expected to become
an important part of reaching net-zero emis-
sions, and carbon dioxide produced from a
sustainable source is expected to be a key
element in producing green Power-to-X fuels,
for example sustainable aviation fuels. Alter-
natively, the captured carbon emissions can
be stored underground to achieve negative
emissions, potentially as a stepping stone
towards full carbon capture and utilisation. In
the partnership with Aker Carbon Capture and
Microsoft, we will explore the technological,
regulatory, and commercial possibilities of
carbon capture, storage, and utilisation.
Other events
In February, we successfully issued two new
green hybrid capital securities comprised of a
EUR 500 million hybrid bond and a GBP 425
million hybrid bond. In addition to refinancing
older hybrid capital securities, the proceeds
will be deployed into our ambitious green
energy build-out plan.
On 2 June, Ørsted will host a Capital Markets
Day. We are in the final planning process and
expect to send out a detailed agenda shortly.
At the Capital Markets Day, we will present an
update of our long-term targets and strategy.
United States government, and it will provide
the country with weather, water, and climate
data as well as forecasts and warnings so
that we can best protect life and property
and enhance the national economy.
The Biden administration has committed the
US to being a leader in offshore wind with its
goal of deploying 30 GW by 2030. Addition-
ally, the Biden administration has announced
new offshore wind energy lease areas which
will offer the renewable industry an oppor-
tunity to continue to engage with stakehold-
ers and work together with local industries to
usher in an economy that works for everyone.
We remain confident that Ørsted will play a
significant part in the build-out of renewable
energy along the north-east coast.
We have signed a memorandum of under-
standing (MoU) with Enefit, a leading utility
company in the Baltics, to collaborate on
developing offshore wind energy in the Baltic
states. The collaboration offers a green path
forward for decarbonising the Baltic coun-
tries and the ambition is to deliver large-scale
offshore renewable energy before 2030. We
further intend to establish a joint venture
with Enefit for the development of up to
2 GW offshore wind opportunities, including
the Liivi offshore wind project in the Estonian
part of the Gulf of Riga.
Onshore
Following three years of successfully devel-
oping, constructing, and operating renewable
onshore assets in the US with 4 GW in opera-
tion and under construction, we have entered
Mads Nipper
Group President and CEO

6/33
Management’s review Interim financial report First quarter 2021
Ørsted
EBITDA
1 Last 12 months
Key figures Q1 2021
Revenue DKK 18.9 bn
Gross investments DKK 6.7 bn
Capital employed DKK 109.7 bn
TRIR 3.0
Number of employees 6,311
ROCE1 7.5 %
Offshore Onshore Bioenergy & Other
EBITDA
EBITDA
EBITDA
Key figures Q1 2021
Revenue DKK 13.3 bn
Gross investments DKK 4.6 bn
Capital employed DKK 91.9 bn
TRIR 2.5
Number of employees 3,172
Key figures Q1 2021
Revenue DKK 0.1 bn
Gross investments DKK 2.0 bn
Capital employed DKK 14.2 bn
TRIR 6.3
Number of employees 123
Key figures Q1 2021 Revenue DKK 7.0 bn
Gross investments DKK 0.1 bn
Capital employed DKK 2.8 bn
TRIR 5.2
Number of employees 1,003
Wind speed and availability, m/s, %
2020 2021
Wind speed and availability, m/s, %
2020 2021
Green share of heat and power
generation, %
Green share of heat and power
generation, %
7.5
95
7.7
93
Wind speed Availability
7774
2020 2021
DKK 0.2 bn
DKK 0.2 bn
2020
2021
DKK 0.6 bn
DKK 0.9 bn
2020
2021
At a glance
9087
2020 2021
2020
2021
DKK 6.8 bn
DKK 4.9 bn
12.1
93
10.5
95
Wind speed Availability
DKK 3.9 bn
DKK 5.6 bn
2020
2021
7/33
Management’s review Interim financial report First quarter 2021
EBITDA
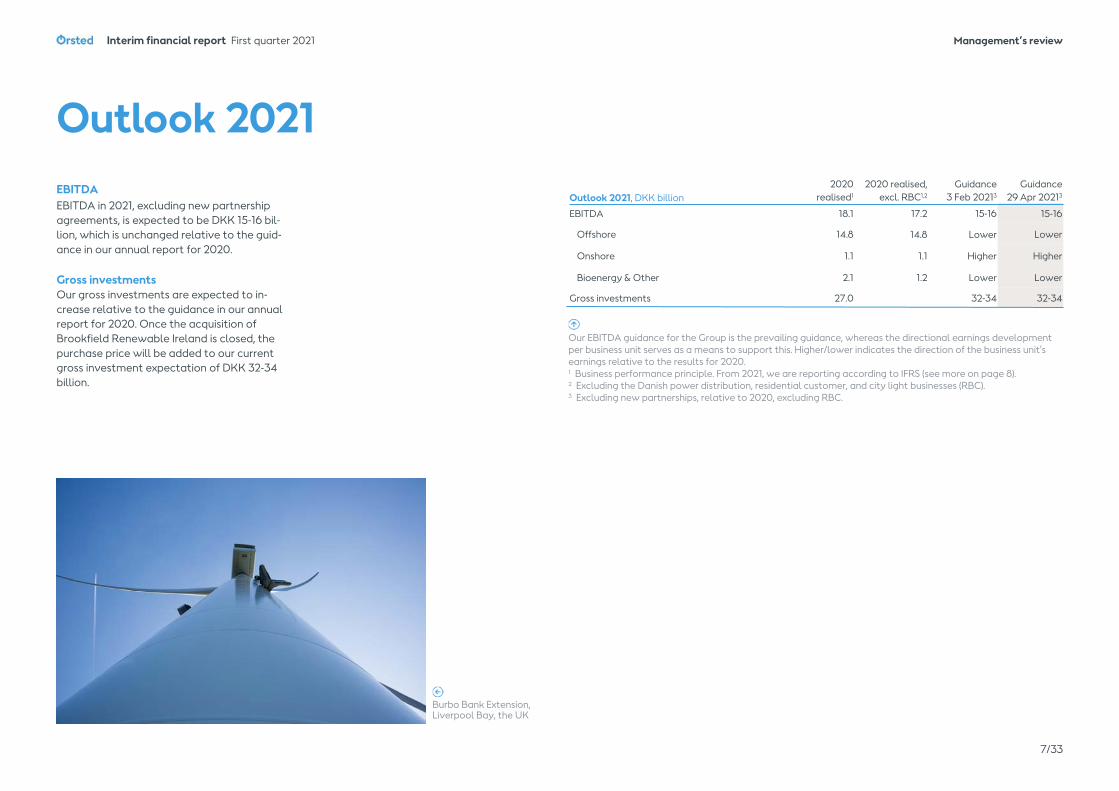
EBITDA in 2021, excluding new partnership
agreements, is expected to be DKK 15-16 bil-
lion, which is unchanged relative to the guid-
ance in our annual report for 2020.
Gross investments
Our gross investments are expected to in-
crease relative to the guidance in our annual
report for 2020. Once the acquisition of
Brookfield Renewable Ireland is closed, the
purchase price will be added to our current
gross investment expectation of DKK 32-34
billion.
Our EBITDA guidance for the Group is the prevailing guidance, whereas the directional earnings development
per business unit serves as a means to support this. Higher/lower indicates the direction of the business unit's
earnings relative to the results for 2020. 1 Business performance principle. From 2021, we are reporting according to IFRS (see more on page 8). 2 Excluding the Danish power distribution, residential customer, and city light businesses (RBC). 3 Excluding new partnerships, relative to 2020, excluding RBC.
Outlook 2021, DKK billion
2020 realised,
excl. RBC1,2
Guidance
3 Feb 20213
Guidance
29 Apr 20213
EBITDA 17.2 15-16 15-16
Offshore 14.8 Lower Lower
Onshore 1.1 Higher Higher
Bioenergy & Other 1.2 Lower Lower
Gross investments 32-34 32-34
2020
realised1
18.1
14.8
1.1
2.1
27.0
Outlook 2021
Burbo Bank Extension, Liverpool Bay, the UK

8/33
Management’s review Interim financial report First quarter 2021
Financial results
Revenue
Power generation from offshore and onshore
wind increased by 7 % and totalled 6.1 TWh in
Q1 2021. Ramp-up of generation from Borssele
1 & 2, Sage Draw, Plum Creek, and Willow
Creek was partly offset by very high wind
speeds across our European offshore portfolio
in Q1 2020, whereas wind speeds were below a
normal wind year in Q1 2021.
Our production-based availability for Offshore
amounted to 95 %, up two percentage points
compared to the same period last year. The
increase was mainly due to low availability in
Q1 2020, driven by Hornsea 1 and Borkum
Riffgrund 2 due to a cable replacement cam-
paign and outages, respectively.
Thermal power generation increased 44 % and
amounted to 2.3 TWh, driven by favourable
market conditions for power generation.
Heat generation amounted to 3.9 TWh, up 26
% compared to the same period last year,
mainly due to colder weather in the beginning
of the quarter.
As a result of the above-mentioned develop-
ment in power generation, the share of genera-
tion from offshore and onshore wind account-
ed for 73 % of our total power generation, a
decrease of 5 percentage points compared to
the same period last year. Similar, our renewa-
ble share of generation accounted for 87 % in
Q1 2021, compared to 90 % in Q1 2020.
Revenue amounted to DKK 18.9 billion. The
increase of 23 % relative to Q1 2020 was pri-
marily due to the divestment of the offshore
transmission assets at Hornsea 1 in Q1 2021 and
higher gas and power prices across all mar-
kets, partly offset by low winds speeds in Q1
2021 and the divestments of our LNG activities
and our distribution, residential customer, and
city light businesses in 2020.
EBITDA
Operating profit (EBITDA) totalled DKK 4.9
billion compared with DKK 6.8 billion in Q1
2020. The decrease of DKK 1.9 billion was
mainly due to earnings in Offshore where
EBITDA from partnerships decreased by DKK
1.7 billion due to high earnings from existing
partnerships in Q1 2020 not being repeated in
Q1 2021 and a warranty provision of DKK 0.8
billion related to cable protection system is-
sues at some of our offshore wind farms in
which we have provided construction agree-
ment for our partners. Furthermore, the divest-
ed distribution, residential customer, and city
light businesses contributed with DKK 0.5 bil-
lion to EBITDA in Q1 2020.
EBITDA, DKK billion
DKK 4.9 billion
Offshore Onshore
Bioenergy & Other
13 %
5 %
82 %
Results Q1
Ceasing the use of business performance
With the implementation of IFRS 9 in 2018, it has become significantly easier to apply IFRS hedge accounting to
our commodity hedges. We have concluded that IFRS 9 can replace our business performance principle, and
therefore, we are reporting based on IFRS only from 1 January 2021.
At the end of 2020, the value of our business performance hedges deferred to a future period amounted to DKK -
2.7 billion, of which DKK -1.1 billion relates to 2021. This net loss has already been recognised in the income state-
ment under IFRS in previous years, as we have not previously applied hedge accounting for these. Consequently,
for the period 2021-2025, EBITDA (according to IFRS) will be higher with a similar amount compared to what the
business performance EBITDA would have been in the same period if we had continued to report based on this
principle. For Q1 2021, EBITDA according to IFRS was DKK 0.5 billion higher than if we had kept reporting accord-
ing to the business performance principle. The main part of the amount was related to site EBITDA in Offshore
and the remaining part was related to our CHP plants and gas activities in Bioenergy & Other.
Throughout the management’s review, we will use business performance as comparable numbers for 2020 for a
better like-for-like comparison, while our consolidated financial statements will be reported after IFRS only. Read
more in note 2 ‘Business Performance’.
In addition, see more info in the annual report for 2020 in the financial outlook section on page 16, and in notes 1.4
and 1.6 on pages 88 and 90, respectively.
Financial results, DKKm Q1 2021 Q1 2020 %
Revenue 18,944 15,376 23 % EBITDA 4,863 6,805 (29 %) Depreciation and amortisation (1,930) (1,754) 10 % Operating profit (loss) (EBIT) 2,933 5,051 (42 %) Gain (loss) on divestment of enterprises 36 (14) n.a. Financial items, net (419) (776) (46 %) Profit before tax 2,547 4,264 (40 %) Tax on profit (loss) for the period (949) (918) 3 % Tax rate 37 % 22 % 15 %p Profit (loss) for the period 1,598 3,318 (52 %)

Management’s review
9/33
Interim financial report First quarter 2021
Earnings from offshore and onshore wind farms
in operation were in line with the same period
last year and amounted to DKK 5.2 billion.
Ramp-up of generation from Borssele 1 & 2,
Sage Draw, Plum Creek, and Willow Creek
combined with the addition of CfDs for another
400 MW of generation from Hornsea 1 and a
positive effect from ceasing to report accord-
ing to the business performance principle in
2021 contributed positively to our site earnings.
However, this was offset by significantly lower
wind speeds across our offshore portfolio, high-
er TNUoS tariffs following the divestment of
the offshore transmission assets at Walney
Extension in mid-2020, lower earnings from
Horns Rev 2 due to the subsidy period ending in
October 2020, and lastly lower ROC recycle
prices in Q1 2021 compared to the same period
last year.
Our onshore business was only impacted by
the winter storm in Texas in February 2021 to a
minor extent. Due to the extraordinary perfor-
mance by the entire Onshore team we were
left with only a minor loss from this unprece-
dented event.
EBITDA from our CHP plants amounted to DKK
0.7 billion, an increase of 30 % compared to
the same period last year. The increase was
mainly due to higher achieved power prices
together with higher sales of ancillary ser-
vices and increased heat generation.
EBIT
EBIT decreased by DKK 2.1 billion to DKK 2.9
billion in Q1 2021, primarily as a result of the
lower EBITDA and higher depreciation driven
by more wind farms in operation.
Financial income and expenses
Net financial income and expenses amounted
to DKK -0.4 billion compared to DKK -0.8 bil-
lion in Q1 2020. The lower net expenses were
mainly due to more positive effects from ex-
change rate adjustments, less capital losses
on the bond portfolio due to the increasing
interest rates, and generally lower net interest
expenses due to the lower net debt.
Tax and tax rate
Tax on profit for the period amounted to DKK
0.9 billion, which was in line with the same
period last year. The effective tax rate was 37
%, and it was impacted by the initial recogni-
tion of deferred taxes of DKK 0.4 billion relat-
ed the north-east cluster in our US offshore
portfolio, and taxable income in onshore enti-
ties without tax equity partners following the
winter storm in Texas.
Profit for the period
Profit for the period totalled DKK 1.6 billion,
DKK 1.7 billion lower than in Q1 2020. The de-
crease was primarily due to the lower EBIT.
Cash flows and net debt
Cash flows from operating activities
Cash flows from operating activities totalled
DKK 8.1 billion in Q1 2021 compared with DKK
-0.4 billion in Q1 2020. The increase of DKK 8.5
billion was mainly driven by the divestment of
the Hornsea 1 offshore transmission assets in
March 2021 (DKK 5.0 billion). In Q1 2021, we
had a net cash inflow from work in progress of
DKK 4.6 billion, mainly from the above-
mentioned divestment. In Q1 2020, we had a
net cash outflow of DKK 1.8 billion, mainly
from supplier payments related to the con-
struction of Hornsea 1 for partners and the
offshore transmission assets at Hornsea 2.
Furthermore, Q1 2021 saw lower funds tied
up in other net working capital following the
divestment of our distribution, residential
customer, and city light businesses, and low-
er volumes of gas at storage.
Investments and divestments
Gross investments amounted to DKK 6.7
billion against DKK 5.3 billion in Q1 2020. The
main investments in Q1 2021 were:
– offshore wind farms (DKK 4.6 billion),
including Greater Changhua 1 & 2a in
Taiwan, Hornsea 2 in the UK and our
portfolio of US projects
– onshore wind and solar PV farms (DKK 2.0
billion), including Permian Energy Center,
Old 300, Muscle Shoals, Western Trail,
Helena Energy Center, and Haystack. All
located in the US.
Interest-bearing net debt
Interest-bearing net debt totalled DKK 13.2
billion at the end of March 2021 against DKK
12.3 billion at the end of 2020. The DKK 0.9
billion increase was mainly due to dividend
and hybrid coupon payments of DKK 5.1 bil-
Cash flow and net debt, DKKm Q1 2021 Q1 2020 %
Cash flows from operating activities 8,087 (428) n.a.
EBITDA 4,863 6,805 (29 %)
Change in derivatives (811) (1,194) (32 %)
Change in provisions 630 (16) n.a.
Reversal of gain (loss) on divestments of assets (220) (1,217) (82 %)
Other items (61) 36 n.a.
Interest expense, net (254) (529) (52 %)
Paid tax (873) (1,267) (31 %)
Change in work in progress 4,611 (1,838) n.a.
Change in tax equity partner liabilities (247) (125) 98 %
Change in other working capital 449 (1,083) n.a.
Gross investments (6,665) (5,308) 26 %
Divestments (31) 7 n.a.
Free cash flow 1,391 (5,729) n.a.
Net debt, beginning of period 12,343 17,230 (28 %)
Free cash flow from continuing operations (1,391) 5,729 n.a.
Free cash flow from discontinued operations - 146 n.a.
Dividends and hybrid coupon paid 5,082 4,543 12 %
Addition of lease obligations 229 9 n.a.
Issuance of hybrid capital, net (4,356) - n.a.
Exchange rate adjustments, etc. 1,283 (573) n.a.
Net debt, end of period 13,190 27,084 (51 %)

Management’s review
10/33
Interim financial report First quarter 2021
to the market in the most cost-efficient way.
Greenhouse gas emissions
Greenhouse gas intensity from our heat and
power generation and other operating activi-
ties (scopes 1 and 2), increased to 59 g CO2 e/
kWh in Q1 2021 against 53 g CO2 e/kWh in Q1
2020. The emissions per kWh increased for the
same reasons as mentioned above.
Greenhouse gas emissions from our supply
chain and sales activities (scope 3) decreased
by 30 % to 5.3 million tonnes in Q1 2021, driven
by lower gas sales.
Safety
In Q1 2021, we have had 15 total recordable
injuries (TRIs), of which 9 injuries were related
to contractors’ employees. This was a de-
crease of 3 injuries compared to the same
quarter last year or a reduction of 17 %. The
number of hours worked was 5 million hours,
the same level as in Q1 2020. During Q1, the
total recordable injury rate (TRIR) decreased
from 3.6 in Q1 2020 to 3.0 in Q1 2021.
lion, partly offset by free cash flow of DKK 1.4
billion and the issuance of new hybrid capital.
Equity
Equity was DKK 96.5 billion at the end of
March 2021 against DKK 97.3 billion at the end
of 2020.
Capital employed
Capital employed was in line with the level
end of 2020 and amounted to DKK 109.7 bil-
lion at 31 March 2021.
Financial ratios
Return on capital employed (ROCE)
Return on capital employed (ROCE, last 12
months) was 7.5 % at the end of Q1 2021. The
decrease compared to the same period last
year was attributable to the lower EBIT over
the 12-month period.
Credit metric (FFO/adjusted net debt)
The funds from operations (FFO)/adjusted net
debt credit metric was 45 % at the end of
March 2021 against 21 % in the same period
last year. The low level in Q1 2020 was mainly
because it included the majority of our current
taxes regarding 2019.
Non-financial results
Green share of heat and power generation
The green share of heat and power generation
amounted to 87 % in Q1 2021, down 3 percent-
age points relative to the same period last
year. The increase in thermal generation and
use of fossil fuels was driven by higher power
prices on the spot market together with higher
production of combined heat and power gen-
eration (driven by higher heat demand due to
colder weather), as we are regulatory obliged
to make all of our energy capacities available
Key ratios, DKKm, % Q1 2021 Q1 2020 %
ROCE1 7.5 11.0 (4 %p)
Adjusted net debt 29,566 40,371 (27 %)
FFO/adjusted net debt1 44.9 21.3 24 %p 1) See page 89 in the annual report for 2020 for definitions.
Capital employed, %
Offshore Onshore
Bioenergy & Other
DKK 109.7 billion
3 %
13 %
84 %
Hornsea 1, off the Yorkshire coast, the UK

11/33
Management’s review Interim financial report First quarter 2021
Highlights
– CfDs awarded Baltica 2 & 3
– Agreement to divest 25 % of Ocean Wind 1
to PSEG closed in April
– Divestment of Hornsea 1 offshore transmis-
sion assets to DTP
– Signed an agreement with Norges Bank
Investment Management to farm-down 50
% of the 752 MW offshore wind farm Bors-
sele 1 & 2
– Positive development in the US offshore
industry and for our Ocean Wind 1 project
– Signed an MoU with Enefit to collaborate
on developing offshore wind energy in the
Baltic states
– Signed a CPPA with Danfoss to offtake
renewable energy from Horns Rev 2
– Established a partnership with ATP with the
intention to participate in the auction for
the North Sea energy island
Financial results Q1 2021
Power generation was in line with Q1 2020.
Ramp-up of generation from Borssele 1 & 2 (0.8
TWh) was offset by very high wind speeds in
Q1 2020 and low wind speeds in Q1 2021.
Wind speeds were significantly below Q1 2020
and amounted to a portfolio average of 10.5
m/s, which was below a normal wind year of
10.9 m/s with low wind speeds especially in
January. Availability ended at 95 %, up two
percentage points compared to the same peri-
od last year. The increase was mainly due to
low availability in Q1 2020, driven by Hornsea 1
and Borkum Riffgrund 2 due to a cable re-
placement campaign and outages, respective-
ly.
Revenue increased by 67 % to DKK 13.3 billion.
Revenue from construction agreements in-
creased by DKK 4.5 billion, primarily due to the
divestment of the offshore transmission assets
at Hornsea 1 in Q1 2021. In Q1 2020, revenue
from construction agreements primarily relat-
ed to the construction of Virginia Coastal
Wind.
Revenue from offshore wind farms in opera-
tion amounted to DKK 5.7 billion, in line with
the same period last year due to the above-
mentioned ramp-up from Borssele 1 & 2 which
was offset by lower wind speeds. Revenue
from power sales increased by DKK 0.8 billion
due to significantly higher power prices de-
spite lower volumes sold.
EBITDA decreased by 30 % relative to Q1
2020 and amounted to DKK 3.9 billion.
EBITDA from Sites, O&M, and PPAs amounted
to DKK 4.9 billion in Q1 2021, in line with the
same period last year. Ramp-up generation
from Borssele 1 & 2 and the addition of CfDs
for another 400 MW of generation from
Hornsea 1 together with a positive effect of
ceasing to report according to the business
performance principle in 2021 contributed to a
positive Q-on-Q development. However, these
positive effects were offset by the significantly
lower wind speeds (approx. DKK 0.9 billion),
higher TNUoS tariffs following the divestment
of the offshore transmission assets at Walney
Extension in mid-2020 as well as lower earn-
ings from Horns Rev 2 due to the subsidy peri-
od ending in October 2020. Furthermore, Q1
2021 saw lower ROC recycle prices than Q1
Financial results Q1 2021 Q1 2020 %
Business drivers
Decided (FID'ed) and installed capacity,
offshore wind GW 9.9 9.9 0 %
Installed capacity, offshore wind GW 7.6 6.8 12 %
Generation capacity, offshore wind GW 4.4 3.6 22 %
Wind speed m/s 10.5 12.1 (13 %)
Load factor % 50 60 (10 %p)
Availability % 95 93 2 %p
Power generation TWh 4.5 4.6 (2 %)
Denmark 0.5 0.7 (29 %)
United Kingdom 2.5 3.1 (19 %)
Germany 0.6 0.8 (25 %)
Other 0.1 0.0 n.a.
Power sales TWh 6.9 8.8 (22 %)
Power price, LEBA UK GBP/MWh 78.5 39.0 101 %
British pound DKK/GBP 8.5 8.7 (2 %)
Financial performance
Revenue DKKm 13,285 7,975 67 %
Sites, O&M and PPAs 5,685 5,725 (1 %)
Power sales 2,447 1,664 47 %
Construction agreements 5,101 564 804 %
Other 52 22 136 %
EBITDA DKKm 3,946 5,632 (30 %)
Sites, O&M and PPAs 4,886 4,936 (1 %)
Construction agreements and divestment gains (573) 1,099 n.a.
Other incl. project development (367) (403) (9 %)
Depreciation DKKm (1,547) (1,408) 10 %
EBIT DKKm 2,399 4,224 (43 %)
Cash flow from operating activities DKKm 5,206 (1,553) n.a.
Gross investments DKKm (4,567) (4,292) 6 %
Divestments DKKm (33) 9 n.a.
Free cash flow DKKm 606 (5,836) n.a.
Capital employed DKKm 91,883 87,957 4 %
The Netherlands 0.8 0.0 n.a.
O&M: Operation and maintenance agreements PPAs: Power purchase agreements
Offshore

Management’s review
12/33
Interim financial report First quarter 2021
2020.
EBITDA from partnerships decreased by DKK
1.7 billion and amounted to DKK -0.6 billion.
The decrease was due to high earnings from
existing partnerships in Q1 2020 not being re-
peated, and as Q1 2021 was negatively impact-
ed by a DKK 0.8 billion warranty provision to-
wards our partners related to cable protection
system issues at some of our offshore wind
farms. This was partly offset by additional
earnings from finalised construction projects.
EBITDA from other activities, including project
development amounted to DKK -0.4 billion, in
line with the same period last year, and was
mainly related to expensed project develop-
ment costs.
Depreciation increased by 10 % and amounted
to DKK 1.5 billion. The increase was mainly due
to the commissioning of Borssele 1 & 2.
Cash flow from operating activities amounted
to DKK 5.2 billion, which was DKK 6.8 billion
higher than in Q1 2020. The significant increase
was mainly driven by the divestment of the
Hornsea 1 offshore transmission assets in March
2021 (DKK 5.0 billion). In Q1 2021, we had a net
cash inflow from work in progress of DKK 4.6
billion, mainly from the above-mentioned di-
vestment. In Q1 2020, we had a net cash out-
flow of DKK 1.8 billion, mainly from supplier
payments related to the construction of
Hornsea 1 for partners and the offshore trans-
mission assets at Hornsea 2.
Gross investments amounted to DKK 4.6 billion
and was mainly related to Greater Changhua 1
& 2a, Hornsea 2, and our US portfolio.
12.1
8.0 8.2
10.49.7
10.59.6*
Q1 Q2 Q3 Q4 FY
2020 2021 "Normal wind year"
Wind speed, (m/s) for our offshore wind farms
The wind speed indicates how many metres per second the wind has blown in the areas where we have offshore wind farms. The weighting is based on our generation capacity.
* Indicates m/s for full year
2021 (if Q2, Q3 and Q4 follows
the normal wind year)
Burbo Bank Extension, Liverpool Bay, the UK

13/33
Management’s review Interim financial report First quarter 2021
Highlights – Signed an agreement to acquire the Euro-
pean onshore wind platform Brookfield
Renewable Ireland
– Signed six PPAs to offtake renewable ener-
gy generation in the US
– Took FID on Helena Energy Center, a com-
bined solar PV (250 MWac) and wind (268
MW) greenfield project in South Texas, US
Financial results Q1 2021
In Q1 2021, power generation from our operat-
ing onshore assets, including wind and solar PV
farms across the US, increased by 45 % com-
pared to Q1 2020, amounting to 1.6 TWh. The
increase was driven by the commissioning of
three new wind farms Sage Draw, Plum Creek,
and Willow Creek combined with early ramp-
up of power generation from our Permian Ener-
gy Center. Wind speeds across the portfolio
amounted to 7.7 m/s, which was higher than in
the same period last year (7.5 m/s), but slightly
lower than a normal wind year (7.8 m/s). Avail-
ability ended at 93 %, down two percentage
points compared to the same period last year.
The decrease was driven by the unprecedent-
ed winter storm in February in Texas.
Revenue from wind farms in operation was 12
% lower relative to Q1 2021. The lower revenue
was mainly due to lower prices for the part of
the portfolio not covered by PPAs, only partly
offset by higher prices during the winter storm
period.
EBITDA for Q1 2021 amounted to DKK 0.2 bil-
lion, a 22 % increase relative to the same peri-
od last year. Higher earnings from ramp-up of
new wind farms were partly offset by a nega-
tive effect from the winter storm. Due to the
extraordinary performance by our US market
trading team, we were left with only a minor
loss from this unprecedented event.
Cash flow from operating activities decreased
by DKK -0.4 billion compared to the same
period last year. The decrease was driven by
funds tied up in net working capital following
the winter storm.
Gross investments amounted to DKK 2.0 bil-
lion in Q1 2021 and related to the construction
of Permian Energy Center, Old 300, Muscle
Shoals, Western Trail, Helena Energy Center,
and Haystack.
Financial results Q1 2021 Q1 2020 %
Business drivers
Decided (FID'ed) and installed capacity GW 3.9 2.1 86 %
Installed capacity GW 1.7 1.3 31 %
Wind speed m/s 7.7 7.5 3 %
Load factor % 45 44 1 %p
Availability % 93 95 (2 %p)
Power generation TWh 1.6 1.1 45 %
US dollar DKK/USD 6.2 6.8 (9 %)
Financial performance
Revenue DKKm 120 137 (12 %)
EBITDA DKKm 228 187 22 %
Sites 44 73 (40 %)
Production tax credits and tax attributes 283 209 35 %
Other incl. project development (99) (95) 4 %
Depreciation DKKm (128) (98) 31 %
EBIT DKKm 100 89 12 %
Cash flow from operating activities DKKm (446) (47) 849 %
Gross investments DKKm (2,005) (748) 168 %
Divestments DKKm 1 - n.a.
Free cash flow DKKm (2,450) (795) 208 %
Capital employed DKKm 14,210 12,381 15 %
Onshore
Wind speed, (m/s) for our onshore wind farms
The wind speed indicates how many metres per second the wind has blown in the areas where we have onshore wind farms. The weighting is based on our generation capacity.
* Indicates m/s for full year
2021 (if Q2, Q3 and Q4 fol-
lows the normal wind year)
7.58.0
6.78.0 7.67.7 7.6*
Q1 Q2 Q3 Q4 FY
2020 2021 "Normal wind year"

14/33
Management’s review Interim financial report First quarter 2021
Highlights – Signed MoU to explore carbon capture pos-
sibilities at our biomass-fired combined heat
and power plants.
– Closed the divestment of the majority of
our UK B2B customers to Total Gas & Pow-
er, thereby further streamlining Bioenergy &
Other.
Financial results Q1 2021
Power generation was 44 % higher than in Q1
2020, primarily driven by higher achieved pric-
es. Heat generation increased by 26 % in Q1
2021, mainly due to colder weather.
Revenue decreased by 7 % compared to Q1
2020 and amounted to DKK 7.0 billion. The
decrease was driven by lower gas volumes
sold, mainly due to the divestment of our LNG
activities, only partly offset by a significant
increase in the average gas price, leading to
higher revenue in our gas business. The divest-
ment of our distribution, residential customer,
and city light businesses in August 2020 and
part of our B2B business on 1 March 2021 also
contributed to the lower revenue. This was
partly offset by higher revenue from our CHP
plants.
EBITDA amounted to DKK 0.6 billion com-
pared to DKK 0.9 billion in Q1 2020.
EBITDA from CHP plants was DKK 0.2 billion
higher than the same period last year, totalling
DKK 0.7 billion in Q1 2021. The increase was
mainly due to higher power prices in Denmark
combined with higher earnings from ancillary
services and a positive effect from ceasing to
report according to the business performance
principle in 2021.
EBITDA from Gas Markets & Infrastructure
contributed marginally to EBITDA and was in
line with the same period last year. In Q1 2021,
we saw lower earnings from our gas business
compared to the same period last year. How-
ever, this was offset by a provision for bad
debt in our B2B business in Q1 2020 to cover
the COVID-19 related default risk among our
customers as well as a positive effect from
ceasing to report according to the business
performance principle in 2021.
EBITDA from our distribution, residential cus-
tomer, and city light businesses amounted to
DKK 0.5 billion in 2020, which has not been
repeated due to the divestment in August
2020 to Andel.
Cash flow from operating activities amounted
to DKK 3.0 billion in Q1 2021. The increase of
DKK 1.5 billion was mainly due to lower funds
tied up in net working capital following the
divestment of our distribution, residential cus-
tomer, and city light businesses, changes in the
value of derivatives, and lower volumes of gas
at storage. This was partly offset by the lower
EBITDA and on-account taxes paid in Q1 2021
versus receipt of on-account taxes in Q1 2020.
Gross investments amounted to DKK 0.1 billion
in Q1 2021 and mainly related to reinvest-
ments at our CHP plants.
Financial results Q1 2021 Q1 2020 %
Business drivers Degree days Number 1,325 1,065 24 %
Heat generation TWh 3.9 3.1 26 %
Power generation TWh 2.3 1.6 44 %
Gas sales TWh 18.9 26.7 (29 %)
Power sales TWh 2.3 3.6 (36 %)
Gas price, TTF EUR/MWh 18.5 9.7 91 %
Power price, DK EUR/MWh 49.1 21.2 132 %
Green dark spread, DK EUR/MWh (4.2) (15.1) (72 %)
Green spark spread, DK EUR/MWh (1.7) (7.7) (78 %)
Financial performance
Revenue DKKm 7,020 7,509 (7 %)
EBITDA DKKm 622 933 (33 %)
CHP plants 676 520 30 %
Gas Markets & Infrastructure 19 11 73 %
Distribution, B2C and city light - 476 n.a.
Other, incl. project development (73) (74) (1 %)
Depreciation DKKm (200) (192) 4 %
EBIT DKKm 422 741 (43 %)
Cash flow from operating activities DKKm 3,018 1,557 94 %
Gross investments DKKm (59) (244) (76 %)
Divestments DKKm (29) (1) 2,800 %
Free cash flow DKKm 2,930 1,312 123 %
Capital employed DKKm 2,779 14,452 (81 %)
Bioenergy & Other
15/33
Management’s review Interim financial report First quarter 2021
Financials, DKKm Q1 2021 Q1 2020 2020
Income statement (BP1 comparables)
Revenue 18,944 15,376 52,601
EBITDA 4,863 6,805 18,124
Offshore 3,946 5,632 14,750
Sites, O&M and PPAs 4,886 4,936 15,476
Construction agreements and divestment gains (573) 1,099 1,593
Other, incl. project development (367) (403) (2,319)
Onshore 228 187 1,131
Bioenergy & Other 622 933 2,136
Other activities 67 53 107
Operating profit (loss) (EBIT) 2,933 5,051 10,536
Profit (loss) for the period 1,598 3,318 16,716
Income statement (IFRS comparables)
Revenue 18,944 18,232 50,151
EBITDA 4,863 9,449 16,599
Depreciation and amortisation (1,930) (1,754) (7,588)
Operating profit (loss) (EBIT) 2,933 7,695 9,010
Gain (loss) on divestment of enterprises 36 (14) 10,831
Net financial income and expenses (419) (776) (2,524)
Profit (loss) before tax 2,547 6,908 17,325
Tax (949) (1,501) (1,777)
Profit (loss) for the period 1,598 5,379 15,537
Balance sheet
Assets 210,972 193,636 196,719
Equity 96,541 89,015 97,329
Shareholders in Ørsted A/S 75,835 72,728 81,376
Non-controlling interests 2,722 3,055 2,721
Hybrid capital 17,984 13,232 13,232
Interest-bearing net debt 13,190 27,084 12,343
Capital employed 109,731 116,098 109,672
Additions to property, plant, and equipment 6,469 4,833 28,442
Cash flow
Cash flow from operating activities 8,087 (428) 16,466
Gross investments (6,665) (5,308) (26,967)
Divestments (31) 7 19,039
Free cash flow 1,391 (5,729) 8,538
Financial ratios
Return on capital employed (ROCE)2, % 7.5 11.0 9.7
FFO/adjusted net debt3, % 44.9 21.3 48.3
Number of outstanding shares, end of period, '000 420,068 419,985 420,068
Share price, end of period, DKK 1,025 666 1,244
Market capitalisation, end of period, DKK billion 430 280 522
Earnings per share (EPS) (BP), DKK 2.8 8.0 38.8
Dividend yield, % - - 0.9
Business drivers Q1 2021 Q1 2020 2020
Offshore
Decided (FID'ed) and installed capacity, offshore wind, GW 9.9 9.9 9.9
Installed capacity, offshore wind, GW 7.6 6.8 7.6
Generation capacity, offshore wind, GW 4.4 3.6 4.4
Wind speed, m/s 10.5 12.1 9.7
Load factor, % 50 60 45
Availability, % 95 93 94
Power generation, TWh 4.5 4.6 15.2
Power sales, TWh 6.9 8.8 29.2
Onshore
Decided (FID'ed) and installed capacity, GW 3.9 2.1 3.4
Installed capacity, GW 1.7 1.3 1.7
Wind speed, m/s 7.7 7.5 7.6
Load factor, % 45 44 45
Availability, % 93 95 96
Power generation4, TWh 1.6 1.1 5.7
Bioenergy & Other
Degree days, number 1,325 1,065 2,432
Heat generation, TWh 3.9 3.1 6.7
Power generation, TWh 2.3 1.6 4.4
Power sales, TWh 2.3 3.6 11.6
Gas sales, TWh 18.9 26.7 90.3
People and environment
Employees (FTE), end of period number 6,311 6,608 6,179
Total recordable injury rate (TRIR)4 3.0 3.6 3.6
Fatalities, number 0 0 0
Green share of heat and power generation, % 87 90 90
Carbon emissions, g CO2e/kWh (scopes 1 & 2) 59 53 58
Carbon emissions, Mtonnes (scope 3) 5.3 7.6 25.3
Performance highlights
1) Business performance. 2) EBIT (last 12 months)/average capital
employed. 3) FFO last 12 months. Net debt including
50% of hybrid capital, cash and securities
not available for use (with the exception of
repo transactions), and decommissioning
obligations less deferred tax. 4) YTD.
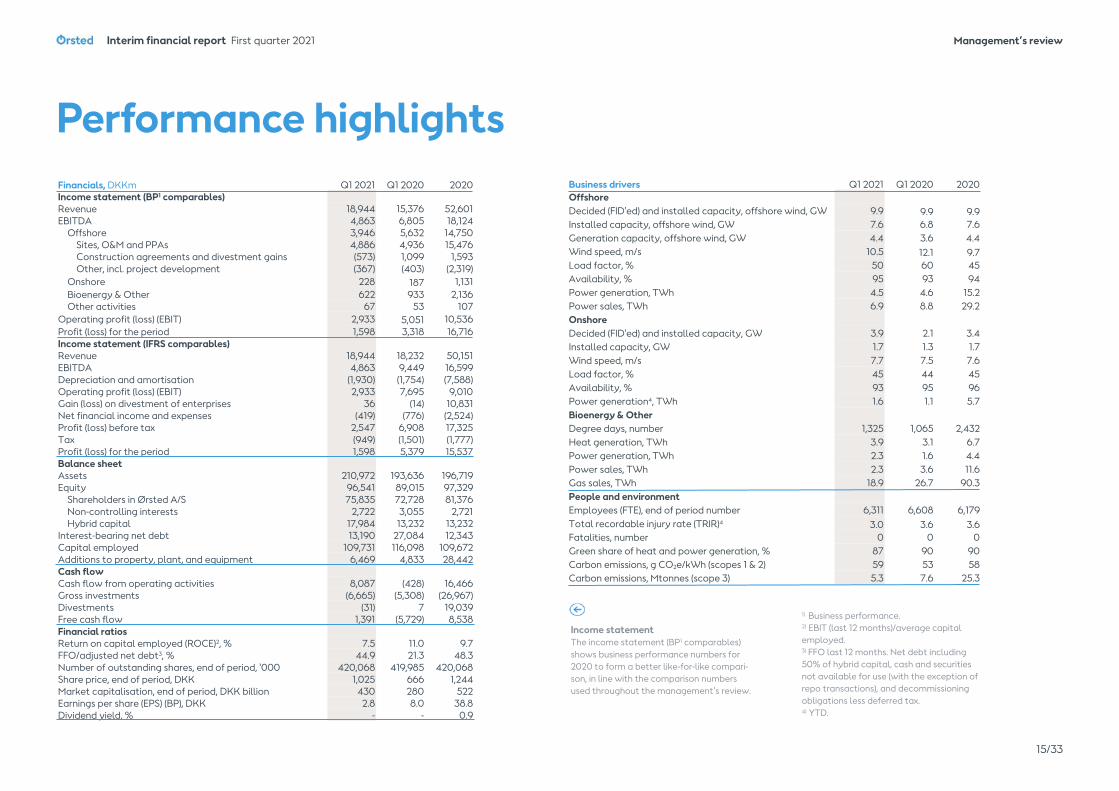
Income statement
The income statement (BP1 comparables)
shows business performance numbers for
2020 to form a better like-for-like compari-
son, in line with the comparison numbers
used throughout the management’s review.

16/33
Management’s review Interim financial report First quarter 2021
Quarterly overview
Income statement
The income statement (BP1 comparables)
shows business performance numbers for
2020 to form a better like-for-like compari-
son, in line with the comparison numbers
used throughout the management’s review.
1) Business performance. 2) EBIT (last 12 months)/average capital employed. 3) FFO last 12 months. Net debt including 50% of hybrid
capital, cash and securities not available for use (with
the exception of repo transactions), and decommission-
ing obligations less deferred tax. 4) YTD.
Financial results, DKKm Q1
2021 Q4
2020 Q3
2020 Q2
2020 Q1
2020 Q4
2019 Q3
2019 Q2
2019
Income statement (BP1 comparables) Revenue 18,944 15,559 10,041 11,625 15,376 18,679 15,481 16,443
EBITDA 4,863 5,003 3,360 2,956 6,805 4,613 4,116 3,625
Offshore 3,946 4,128 2,629 2,361 5,632 4,048 3,223 3,572
Sites, O&M and PPAs 4,886 4,950 3,012 2,578 4,936 4,626 2,612 2,552
Construction agreements and divestment gains (573) (149) 247 396 1,099 51 1,188 1,638
Other incl. project development (367) (673) (630) (613) (403) (629) (577) (618)
Onshore 228 324 308 312 187 165 308 162
Bioenergy & Other 622 643 375 185 933 490 436 (115)
Other activities 67 (92) 48 98 53 (90) 149 6
Operating profit (loss) (EBIT) 2,933 3,091 1,265 1,129 5,051 2,169 2,435 1,936
Profit (loss) for the period 1,598 2,189 12,034 (825) 3,318 896 1,477 1,075
Income statement (IFRS comparables) Revenue 18,944 13,195 8,762 9,962 18,232 19,815 14,543 17,277
EBITDA 4,863 3,102 2,455 1,592 9,449 5,260 3,328 4,425
Depreciation and amortisation (1,930) (1,912) (2,095) (1,827) (1,754) (1,876) (1,681) (1,689)
Impairment losses - - - - - (568) - -
Operating profit (loss) (EBIT) 2,933 1,190 360 (235) 7,695 2,816 1,647 2,736
Gain (loss) on divestment of enterprises 36 (291) 11,139 (3) (14) (13) (15) (18)
Net financial income and expenses (419) (456) (282) (1,010) (776) (644) (47) (545)
Profit (loss) before tax 2,547 442 11,219 (1,245) 6,908 2,162 1,580 2,176
Tax (949) 258 92 (625) (1,501) (733) (758) (458)
Profit (loss) for the period 1,598 715 11,329 (1,886) 5,379 1,400 856 1,700
Balance sheet Assets 210,972 196,719 194,567 193,124 193,636 192,860 194,521 185,949
Equity 96,541 97,329 96,472 85,930 89,015 89,562 87,369 86,446
Shareholders in Ørsted A/S 75,835 81,376 80,450 69,789 72,728 73,082 70,977 69,960
Non-controlling interests 2,722 2,721 2,790 2,909 3,055 3,248 3,153 3,247
Hybrid capital 17,984 13,232 13,232 13,232 13,232 13,232 13,239 13,239
Interest-bearing net debt 13,190 12,343 8,216 22,272 27,084 17,230 12,082 4,980
Capital employed 109,731 109,672 104,688 108,203 116,098 106,792 99,451 91,426
Additions to property, plant, equipment 6,469 8,121 5,477 10,011 4,833 6,560 8,449 3,755
Cash flow Cash flow from operating activities 8,087 6,756 1,941 8,197 (428) 4,816 871 7,510
Gross investments (6,665) (8,639) (9,263) (3,757) (5,308) (8,816) (7,222) (3,368)
Divestments (31) (1,519) 20,506 45 7 402 260 (11)
Free cash flow 1,391 (3,402) 13,184 4,485 (5,729) (3,598) (6,091) 4,131
Financial ratios Return on capital employed (ROCE)2, % 7.5 9.7 9.4 10.8 11.0 10.6 29.3 29.3
FFO/adjusted net debt3, % 44.9 48.3 35.6 23.1 21.3 31.0 47.4 57.5
Number of outstanding shares, end of period, '000 420,068 420,068 420,066 420,066 419,985 419,985 419,985 419,985
Share price, end of period, DKK 1,025 1,244 875 765 666 689 637 533
Market capitalisation, end of period, DKK billion 430 522 368 321 280 290 267 224
Earnings per share (EPS) (BP), DKK 2.8 4.9 28.6 (2.7) 8.0 1.1 3.5 1.9
Business drivers Q1 2021
Q4 2020
Q3 2020
Q2 2020
Q1 2020
Q4 2019
Q3 2019
Q2 2019
Offshore Decided (FID'ed) and installed capacity, offshore wind, GW 9.9 9.9 9.9 9.9 9.9 9.9 9.9 9.9
Installed capacity, offshore wind, GW 7.6 7.6 6.8 6.8 6.8 6.8 5.6 5.6
Generation capacity, offshore wind, GW 4.4 4.4 4.1 3.8 3.6 3.6 3.6 3.3
Wind speed, m/s 10.5 10.4 8.2 8.0 12.1 10.0 8.5 8.0
Load factor, % 50 53 35 32 60 50 37 31
Availability, % 95 94 94 95 93 93 93 87
Power generation, TWh 4.5 4.8 3.2 2.6 4.6 3.9 2.8 2.2
Power sales, TWh 6.9 8.6 6.3 5.5 8.8 7.7 7.0 5.7
Onshore Decided (FID'ed) and installed capacity, GW 3.9 3.4 2.7 2.1 2.1 2.1 1.7 1.4
Installed capacity, GW 1.7 1.7 1.7 1.6 1.3 1.0 1.0 0.8
Wind speed, m/s 7.7 8.0 6.7 8.0 7.5 7.3 6.6 7.7
Load factor, % 45 50 36 49 44 46 39.1 46.7
Availability, % 93 95 97 96 95 98 98.2 97.1
Power generation, TWh 1.6 1.8 1.2 1.6 1.1 1.0 0.9 0.8
Bioenergy & Other Degree days, number 1,325 825 106 436 1,065 882 108 269
Heat generation, TWh 3.9 2.3 0.3 1.0 3.1 3.0 0.5 1.1
Power generation, TWh 2.3 1.3 0.6 0.9 1.6 1.6 0.4 0.7
Power sales, TWh 2.3 2.6 2.4 3.0 3.6 4.1 3.3 3.3
Gas sales, TWh 18.9 20.3 23.2 20.1 26.7 36.7 30.8 31.7
People and environment Employees (FTE) end of period, number 6,311 6,179 6,120 6,731 6,608 6,526 6,454 6,312
Total recordable injury rate (TRIR)4 3.0 3.6 3.8 3.7 3.6 4.9 4.7 4.0
Fatalities, number 0 0 0 0 0 0 0 1
Green share of heat and power generation, % 87 93 90 86 90 90 87 85
Carbon emissions, g CO2e/kWh (scopes 1 & 2) 59 34 83 84 53 44 62 71
Carbon emissions, Mtonnes (scope 3) 5.3 5.9 6.3 5.5 7.6 10.7 8.2 8.4
17/33
Management’s review Interim financial report First quarter 2021
Consolidated financial statements First quarter 2021 1 January – 31 March

18/33
Consolidated financial statementsInterim financial report First quarter 2021
Discontinued operations related to our Oil & Gasbusiness which was sold to INEOS in 2017. We ended the reporting on discontinued operations as of 31
by DKK 507 million from hedge values that would have been recognised as a loss under businessperformance. However, as this loss has already been recognised in prior periods under IFRS, Q1 2021 was not impacted.
See note 2 ’Business performance’ for moreinformation.
1 January – 31 March
Accounting policies
Cease the use of business performance as of1 January 2021From 1 January 2021 we will only be reporting IFRS numbers. Thus, the business performance andadjustment columns are no longer included in our financial reporting.
Compared with the business performance principle, the Q1 2021 IFRS EBITDA was positively impacted
Income statementStatement ofcomprehensive income1 January – 31 March
December 2020. Provisions regarding tax indemni-fications and payments related to the Fredericia stabilisation plant (DKK 705 million) were transferred to continuing operations at 31 December 2020.
Note Income statement, DKKm Q1 2021 Q1 2020
4 Revenue 18,944 18,232
Cost of sales (12,911) (8,019)
Other external expenses (931) (1,259)
Employee costs (1,039) (1,023)
Share of profit (loss) in associates and joint ventures 38 4
5 Other operating income 823 1,587
5 Other operating expenses (61) (73)Operating profit (loss) before depreciation,amortisation, and impairment losses (EBITDA) 4,863 9,449
Amortisation, depreciation, and impairment losses onintangible assets, and property, plant, and equipment (1,930) (1,754)Operating profit (loss) (EBIT) 2,933 7,695Gain (loss) on divestment of enterprises 36 (14)
Share of profit (loss) in associates and joint ventures (3) 3
6 Financial income 485 805
6 Financial expenses (904) (1,581)
Profit (loss) before tax 2,547 6,9089 Tax on profit (loss) for the period (949) (1,501)
Profit (loss) for the period from continuing operations 1,598 5,407Profit (loss) for the period from discontinued operations - (28)Profit (loss) for the period 1,598 5,379Profit (loss) for the period is attributable to:
Shareholders in Ørsted A/S 1,174 5,379
Interests and costs, hybrid capital owners of Ørsted A/S 415 -
Non-controlling interests 9 -
Profit (loss) per share1, DKK:From continuing operations 2.8 12.9
From discontinued operations - (0.1)
Total profit (loss) per share 2.8 12.81 Diluted profit (loss) per share corresponds to profit (loss) per share, as the dilutive effect of the share incentive programme is less than 0.1 % of the share capital.
Statement of comprehensive income, DKKm Q1 2021 Q1 2020
Profit (loss) for the period 1,598 5,379
Other comprehensive income:
Cash flow hedging:
Value adjustments for the period (5,856) (610)
Value adjustments transferred to income statement 2,018 66
Value adjustments trasnsferred to balance sheet (44) -
Exchange rate adjustments:
Exchange rate adjustments relating to net investments in foreign enterprises 3,774 (2,269)
Value adjustment of net investment hedges (2,136) 1,148
Tax:
Tax on hedging instruments 624 12
Tax on exchange rate adjustments (145) 273
Other:
Share of other comprehensive income of associated companies, after tax 9 (10)
Other comprehensive income (1,756) (1,390)
Total comprehensive income (158) 3,989
Comprehensive income for the period is attributable to:
Shareholders in Ørsted A/S (717) 4,050
Interest payments and costs, hybrid capital owners of Ørsted A/S 415 -
Non-controlling interests 144 (61)
Total comprehensive income (158) 3,989

19/33
Consolidated financial statementsInterim financial report First quarter 2021
Assets and liabilities classified as held for saleAssets classified as held for sale at 31 March 2021 comprised our oil pipe system in Denmark.
Balance sheet
Note Assets, DKKm31 March
202131 December
202031 March
2020Intangible assets 787 639 657
Land and buildings 5,930 5,574 5,029
Production assets 86,730 86,184 76,940
Fixtures and fittings, tools, and equipment 528 507 590
Property, plant, and equipment under construction 37,033 29,345 25,165
Property, plant, and equipment 130,221 121,610 107,724
Investments in associates and joint ventures 611 555 558
Other securities and equity investments 212 209 229
Deferred tax 7,031 6,784 7,058
Other receivables 2,049 1,925 2,891
Other non-current assets 9,903 9,473 10,736
Non-current assets 140,911 131,722 119,117
Inventories 11,579 14,739 14,960
11 Derivatives 6,338 6,109 12,041
Contract assets 2 30 1,006
Trade receivables 5,936 6,732 7,517
Other receivables 4,876 3,720 4,235
Income tax 1,815 852 19
11 Securities 30,154 25,173 12,941
Cash 7,830 6,178 4,899
Current assets 68,530 63,533 57,618
Assets classified as held for sale 1,531 1,464 16,901
Assets 210,972 196,719 193,636
Note Equity and liabilities, DKKm31 March
202131 December
202031 March
2020Share capital 4,204 4,204 4,204
8 Reserves (3,856) (1,956) (906)
Retained earnings 75,487 74,294 69,430
Proposed dividends - 4,834 -
Equity attributable to shareholders in Ørsted A/S 75,835 81,376 72,728
Hybrid capital 17,984 13,232 13,232
Non-controlling interests 2,722 2,721 3,055
Equity 96,541 97,329 89,015
Deferred tax 2,217 2,187 2,508
Provisions 13,662 12,475 12,238
Lease liabilities 4,798 4,455 4,533
12 Bond and bank debt 35,421 34,374 35,262
Contract liabilities 3,355 3,650 3,721
Tax equity liabilities 7,060 6,780 4,608
Other payables 743 374 493
Non-current liabilities 67,256 64,295 63,363
Provisions 1,291 1,388 529
Lease liabilities 633 599 638
12 Bond and bank debt 10,064 2,392 3,847
11 Derivatives 10,606 6,318 7,626
Contract liabilities 505 480 923
Trade payables 10,328 9,742 8,846
Tax equity liabilities 1,250 1,187 646
Other payables 4,803 6,082 4,738
Income tax 6,804 6,220 4,640
Current liabilities 46,284 34,408 32,433
Liabilities 113,540 98,703 95,796Liabilities relating to assets classifiedas held for sale 891 687 8,825Equity and liabilities 210,972 196,719 193,636

20/33
Consolidated financial statementsInterim financial report First quarter 2021
* See note 8 ‘Reserves’ for more information about reserves.
Statement of changes in equity
In February 2021, we issued two new hybrid capital bonds with a nominal amount of EUR 500 million and GBP 425 million with a fixed annual coupon of 1.50% (until 2031) and 2.50% (until 2033) respective-ly. Both maturing in 3021.
In addition, we redeemed EUR 350 million of our 3013 Hybrid capital bond in February 2021.
2021 2020
DKKmShare
capital Reserves*Retainedearnings
Proposeddividends
Share- holders in
Ørsted A/SHybridcapital
Non-con- trolling
interestsTotal
GroupShare
capital Reserves*Retainedearnings
Proposeddividends
Share- holders in
Ørsted A/SHybridcapital
Non-con- trolling
interestsTotal
GroupEquity at 1 January 4,204 (1,956) 74,294 4,834 81,376 13,232 2,721 97,329 4,204 413 64,051 4,414 73,082 13,232 3,248 89,562Comprehensive incomefor the period:Profit (loss) for the period - - 1,174 - 1,174 415 9 1,598 - - 5,379 - 5,379 - - 5,379
Other comprehensive income:
Cash-flow hedging - (3,882) - - (3,882) - - (3,882) - (544) - - (544) - - (544)
Exchange rate adjustments - 1,503 - - 1,503 - 135 1,638 - (1,060) - - (1,060) - (61) (1,121)
Tax on other comprehensiveincome - 479 - - 479 - - 479 - 285 - - 285 - - 285Share of other comprehensiveincome of associatedcompanies, after tax - - 9 - 9 - - 9 - - (10) - (10) - - (10)Total comprehensive income - (1,900) 1,183 - (717) 415 144 (158) - (1,319) 5,369 - 4,050 - (61) 3,989Coupon payments, hybridcapital - - - - - (106) - (106) - - - - - - - - Tax, hybrid capital - - - - - 87 - 87 - - - - - - - -
Additions, hybrid capital - - - - - 7,327 - 7,327 - - - - - - - -
Disposals, hybrid capital - - - - - (2,971) - (2,971) - - - - - - - -
Dividends paid - - 4 (4,834) (4,830) - (145) (4,975) - - 4 (4,414) (4,410) - (133) (4,543)
Other changes - - 6 - 6 - 2 8 - - 6 - 6 - 1 7
Equity at 31 March 4,204 (3,856) 75,487 - 75,835 17,984 2,722 96,541 4,204 (906) 69,430 - 72,728 13,232 3,055 89,015

21/33
Consolidated financial statementsInterim financial report First quarter 2021
Change in work in progress‘Change in work in progress’ consists of elements in contract assets, contract liabilities, and construction management agreements related to construction of offshore wind farms and construction of offshore transmission assets as well as the related trade payables.
Statement of cash flowsOur supplementary statement of gross and net investments appears from note 7 ’Gross and net investments’ and free cash flows (FCF) from note 3 ’Segment information’.
’Cash’ according to the balance sheet as at31 March 2021 includes ’Cash, not available for use’, amounting to DKK 342 million and ’Bank overdrafts that are part of the ongoing cash managemnet’ amounting to DKK 10 million.
Statement of cash flowsNote Statement of cash flows, DKKm Q1 2021 Q1 2020
Proceeds from raising of loans 7,817 3,639
Instalments on loans 384 (570)
Instalments on leases (73) (114)
Coupon payments on hybrid capital (106) -
Repurchase of hybrid capital (2,971) -
Proceeds from issuance of hybrid capital 7,327 -
Dividends paid to shareholders in Ørsted A/S (4,830) (4,410)
Transactions with non-controlling interests (141) (139)
Net proceeds from tax equity partners 120 (20)
Change in collateral related to derivaties (1,769) 1,790Cash flows from financing activities 5,758 176
Cash flows from continuing operations 2,092 (2,217)
Cash flows from discontinued operations - (146)
Total net change in cash and cash equivalents for the period 2,092 (2,363)
Cash and cash equivalents at the beginning of the period 5,210 6,459
Total net change in cash and cash equivalents 2,092 (2,363)
Exchange rate adjustments of cash and cash equivalents 176 127
Cash and cash equivalents at 31 March 7,478 4,223
Note Statement of cash flows, DKKm Q1 2021 Q1 2020Operating profit (loss) before depreciation, amortisation, andimpairment losses (EBITDA), IFRS 4,863 9,449
2 Change in derivatives, business performance adjustments - (2,644)
Change in derivatives, other adjustments (811) (1,194)
Change in provisions 630 (16)Reversal of gain (loss) on divestment of assets (220) (1,217)Other items (61) 36Change in work in progress 4,611 (1,838)
Change in tax equity partner liabilities (247) (125)
Change in other working capital 449 (1,083)
Interest received and similar items 323 1,632
Interest paid and similar items (577) (2,161)
Income tax paid (873) (1,267)
Cash flows from operating activities 8,087 (428)
Purchase of intangible assets, and property, plant, and equipment (6,648) (5,238)
Sale of intangible assets, and property, plant, and equipment (25) 23Acquisition of enterprises (11) 4Divestment of enterprises (31) (17)Divestment of other equity investments (4) (9)Purchase of securities (6,040) (3,540)Sale/maturation of securities 983 6,877Change in other non-current assets 23 - Transactions with associates and joint ventures - (65)Cash flows from investing activities (11,753) (1,965)

22/33
Consolidated financial statementsInterim financial report First quarter 2021
measures can be found on page 89 of theannual report for 2020.
This interim financial report contains selected accounting policies and should therefore be read in conjunction with the annual report for 2020.
Cease the use of business performance as of 1 January 2021
From 1 January 2021, we will only be reporting IFRS numbers. Thus, the business performance and adjustment columns will no longer be included in our financial reporting. This will simplify our reporting and avoid potentialconflicts with future reporting requirements for alternative performance measures.
See note 2 ‘Business performance’ for more information.
Implementation of new or changedaccounting standards and interpretations
Effective from 1 January 2021, we haveimplemented the following new or changed accounting standards (IAS and IFRS) andinterpretations: Amendments to IFRS 9 and IFRS 7: Interest
Rate Benchmark Reform — phase 2.
The adoption of the new and changedaccounting standards has not impacted our interim financial report and is not expected to impact the consolidated financial statements for 2021.
This section provides an overall description of our accounting policies as well as an overview of our implementation of new and amended accounting standards and interpretations.
Accounting policies
Ørsted is a listed public company, headquar-tered in Denmark.
This interim financial report for the first three months of 2021 comprises the interim financial statements of Ørsted A/S (the parentcompany) and any subsidiaries controlled by Ørsted A/S.
The interim financial report has been prepared in accordance with the International Financial Reporting Standards (IFRS), IAS 34 ’InterimFinancial Reporting’ as adopted by the EU, and further requirements in the Danish FinancialStatements Act (Årsregnskabsloven) for the presentation of quarterly interim reports by listed companies.
The interim financial report for the first three months of 2021 follows the same accounting policies as the annual report for 2020, except for any new, amended, or revised accounting standards and interpretations (IFRSs) endorsed by the EU, effective for the accounting period beginning on 1 January 2021.
In the sections below, the most relevant new or amended standards and interpretations are presented.
Definitions of alternative performance
1. Basis of reporting 2. Business performanceQ1 2020
DKKmBusiness
performance Adjustments IFRSRevenue 15,376 2,856 18,232
Cost of sales (7,807) (212) (8,019)
Operating profit (loss) before depreciation, amortisation,and impairment losses (EBITDA) 6,805 2,644 9,449EBIT 5,051 2,644 7,695Tax on profit (loss) for the period (918) (583) (1,501)
Profit for the year 3,318 2,061 5,379
With the implementation of IFRS 9 in 2018, it has become significantly easier to apply IFRS hedge accounting to our commodity hedges. We have concluded that IFRS 9 can replace our business performance principle, and there-fore we are reporting based on IFRS only from 1 January 2021.
Among other things, IFRS 9 has made it easier to apply hedge accounting by the removal of the 80-125 % effectiveness requirement which can be difficult to always comply with when engaging in proxy hedging. For example, we use proxy hedging to hedge our powerexposure 4-5 years into the future with gas hedges due to illiquidity in the market for power hedges with this time horizon.
Since we did not apply IFRS hedge accounting in 2020, the IFRS 2021 numbers are not fully comparable to the IFRS 2020 numbers. There-fore, we use EBITDA according to the business performance principle in 2020 as comparable
for EBITDA in the Management’s review for 2021.
At the end of 2020, the value of our business performance hedges deferred to a future period amounted to DKK -2.7 billion, of which DKK -1.1 billion is related to 2021. This net loss was recognised in the income statementunder IFRS in previous years, as we have not previously applied hedge accounting for these. Consequently for the period 2021-2025, EBITDA (according to IFRS) will be higher by a similar amount compared to what thebusiness performance EBITDA would have been if we had continued to report based on this principle. For Q1 2021, EBITDA according to IFRS was DKK 0.5 billion higher than if we had kept reporting according to the businessperformance principle. This amount wasprimarily related to site EBITDA in Offshore, and the remaining part was related to our CHP plants and gas activities in Bioenergy &Other.

23/33
Consolidated financial statementsInterim financial report First quarter 2021
The column ’Other activities/eliminations’ primarily covers the elimination of inter-segment transactions. It also includes income and costs, assets and liabiliti-es, investment activity, taxes, etc., handled at Group level.
1 Including the elimination of other activities, the total elimination of intra-group revenue amounts toDKK 1,932 million, which primarily relates to ourShared Functions services as well as our B2Bbusinesses.
3. Segment information New corporate structure
On 28 January, we announced a change to our organisational structure with effect from 4 February. The change entails moving from a business unit structure to a more functional structure where the commercially focused functions from the former business unitsOffshore and Markets & Bioenergy will be brought together. Onshore will remain aseparate business unit. We are making these changes in our organisation to establish an even stronger customer and market focus, to further strengthen the focus on EPC andoperations, and to support the scaling of ourorganisation as we continue our strong growth trajectory.
Externally, we will continue to reportOffshore and Onshore financials as we have done previously. Our former Markets &Bioenergy will be named ‘Bioenergy & Other’ going forward and will, as previously, include our legacy gas activities, including B2B andRenescience.
Q1 2021Income statement, DKKm Offshore Onshore
Bioenergy& Other
Reportable segments
Otheractivities/
eliminations TotalExternal revenue 11,719 134 7,283 19,136 (192) 18,944
Intra-group revenue 1,566 (14) (263) 1,289 (1,289)1 -
Revenue 13,285 120 7,020 20,425 (1,481) 18,944
Cost of sales (8,495) (5) (5,882) (14,382) 1,471 (12,911)
Employee costs and other external expenses (1,360) (173) (514) (2,047) 77 (1,970)
Gain (loss) on disposal of non-current assets 220 - - 220 - 220
Additional other operating income and expenses 258 286 (2) 542 - 542
Share of profit (loss) in associates and joint ventures 38 - - 38 - 38
EBITDA 3,946 228 622 4,796 67 4,863
Depreciation and amortisation (1,547) (128) (200) (1,875) (55) (1,930)
Impairment losses - - - - - -
Operating profit (loss) (EBIT) 2,399 100 422 2,921 12 2,933
Key ratios
Intangible assets, and property, plant, and equipment 94,613 26,710 8,239 129,562 1,446 131,008
Equity investments and non-current receivables 507 1 176 684 154 838
Net working capital, work in progress 5,648 - - 5,648 - 5,648
Net working capital, tax equity - (7,403) - (7,403) - (7,403)
Net working capital, capital expenditures (3,010) (672) (9) (3,691) - (3,691)
Net working capital, other items 4,801 204 (2,956) 2,049 (127) 1,922
Derivatives, net (3,712) (1,539) (710) (5,961) 1,693 (4,268)
Assets classified as held for sale, net - - 657 657 - 657
Decommissioning obligations (5,301) (818) (1,273) (7,392) - (7,392)
Other provisions (4,622) (119) (2,052) (6,793) (768) (7,561)
Tax, net 1,999 (2,154) 702 547 (722) (175)
Other receivables and other payables, net 960 - 5 965 (817) 148
Capital employed at 31 March 91,883 14,210 2,779 108,872 859 109,731
Return on capital employed (ROCE), % - - - - - 7.5
Cash flow from operating activities 5,206 (446) 3,018 7,778 309 8,087
Gross investments (4,567) (2,005) (59) (6,631) (34) (6,665)
Divestments (33) 1 (29) (61) 30 (31)
Free cash flow (FCF) 606 (2,450) 2,930 1,086 305 1,391
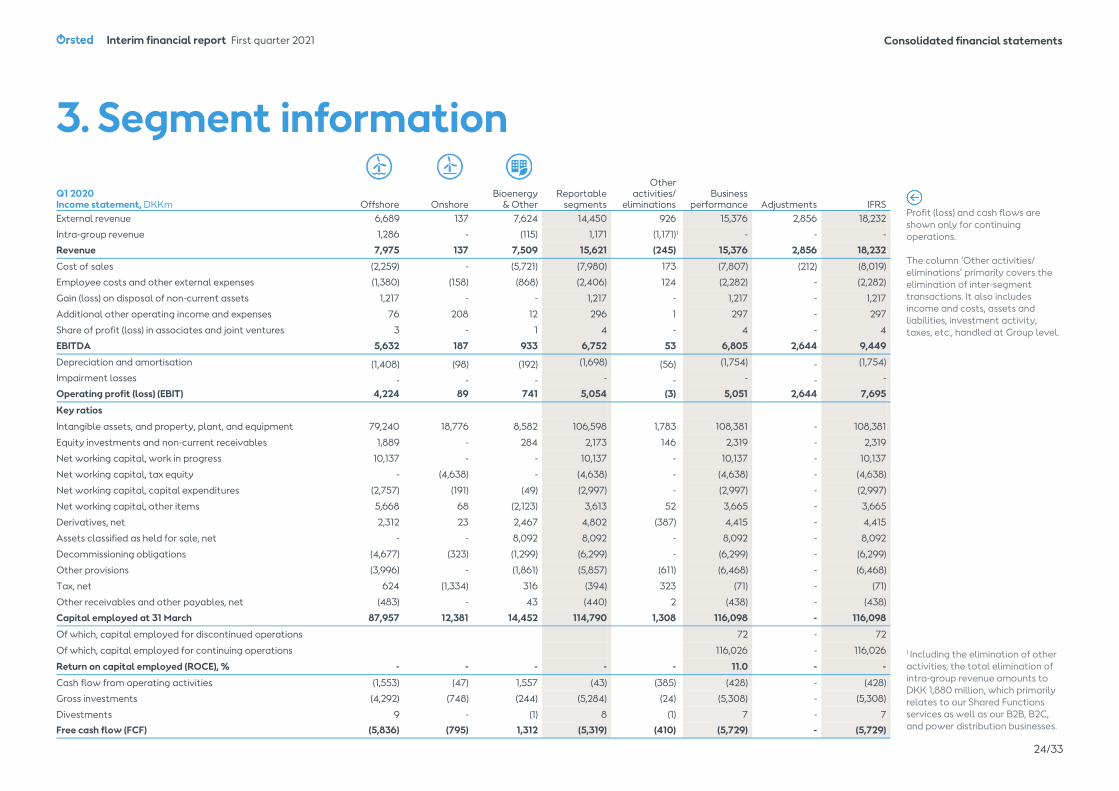
24/33
Consolidated financial statementsInterim financial report First quarter 2021
Profit (loss) and cash flows are shown only for continuingoperations.
The column ‘Other activities/eliminations’ primarily covers the elimination of inter-segment transactions. It also includesincome and costs, assets andliabilities, investment activity, taxes, etc., handled at Group level.
1 Including the elimination of other activities, the total elimination of intra-group revenue amounts to DKK 1,880 million, which primarily relates to our Shared Functions services as well as our B2B, B2C, and power distribution businesses.
3. Segment information Q1 2020Income statement, DKKm Offshore Onshore
Bioenergy& Other
Reportable segments
Otheractivities/
eliminationsBusiness
performance Adjustments IFRSExternal revenue 6,689 137 7,624 14,450 926 15,376 2,856 18,232
Intra-group revenue 1,286 - (115) 1,171 (1,171)1 - - -
Revenue 7,975 137 7,509 15,621 (245) 15,376 2,856 18,232
Cost of sales (2,259) - (5,721) (7,980) 173 (7,807) (212) (8,019)
Employee costs and other external expenses (1,380) (158) (868) (2,406) 124 (2,282) - (2,282)
Gain (loss) on disposal of non-current assets 1,217 - - 1,217 - 1,217 - 1,217
Additional other operating income and expenses 76 208 12 296 1 297 - 297
Share of profit (loss) in associates and joint ventures 3 - 1 4 - 4 - 4
EBITDA 5,632 187 933 6,752 53 6,805 2,644 9,449
Depreciation and amortisation (1,408) (98) (192) (1,698) (56) (1,754) - (1,754)
Impairment losses - - - - - - - -
Operating profit (loss) (EBIT) 4,224 89 741 5,054 (3) 5,051 2,644 7,695
Key ratios
Intangible assets, and property, plant, and equipment 79,240 18,776 8,582 106,598 1,783 108,381 - 108,381
Equity investments and non-current receivables 1,889 - 284 2,173 146 2,319 - 2,319
Net working capital, work in progress 10,137 - - 10,137 - 10,137 - 10,137
Net working capital, tax equity - (4,638) - (4,638) - (4,638) - (4,638)
Net working capital, capital expenditures (2,757) (191) (49) (2,997) - (2,997) - (2,997)
Net working capital, other items 5,668 68 (2,123) 3,613 52 3,665 - 3,665
Derivatives, net 2,312 23 2,467 4,802 (387) 4,415 - 4,415
Assets classified as held for sale, net - - 8,092 8,092 - 8,092 - 8,092
Decommissioning obligations (4,677) (323) (1,299) (6,299) - (6,299) - (6,299)
Other provisions (3,996) - (1,861) (5,857) (611) (6,468) - (6,468)
Tax, net 624 (1,334) 316 (394) 323 (71) - (71)
Other receivables and other payables, net (483) - 43 (440) 2 (438) - (438)
Capital employed at 31 March 87,957 12,381 14,452 114,790 1,308 116,098 - 116,098
Of which, capital employed for discontinued operations 72 - 72
Of which, capital employed for continuing operations 116,026 - 116,026
Return on capital employed (ROCE), % - - - - - 11.0 - -
Cash flow from operating activities (1,553) (47) 1,557 (43) (385) (428) - (428)
Gross investments (4,292) (748) (244) (5,284) (24) (5,308) - (5,308)
Divestments 9 - (1) 8 (1) 7 - 7
Free cash flow (FCF) (5,836) (795) 1,312 (5,319) (410) (5,729) - (5,729)

25/33
Consolidated financial statementsInterim financial report First quarter 2021
Revenue increased by 4 % relative to Q1 2020 and amounted to DKK 18,944 million in Q1 2020. The increase was mainly due to the divestment of the offshore transmission asset at Hornsea 1 in Q1 2021 and higher gas and power prices across all markets. This was
The timing of transfer of goods or services tocustomers is categorised as follows:
‘At a point in time’ mainly comprises:
sale of gas or power in the market, e.g. North Pool, TTF, and NBP
transmission assets for offshore wind farms.
‘Over time’ mainly comprises:
construction agreements for offshore wind farms and transmission assets
long-term contracts with customers to deliver gas, heat, or power.
partly offset by lower wind speeds in Q1 2021 and the divestments of the LNG business and the Danish distribution, residential customer, and city light business (RBC) in 2020.
4. Revenue
From 1 January 2021, we have implemented hedge accounting on our commodity and related currency hedges. Accordingly our hedges are presented in the same line item as the hedged exposure. For example, when we hedge generation of power, any gain (loss) related to the hedges is presented in the line item ‘Generation of power’.
Revenue, DKKm Offshore OnshoreBioenergy &
Other
Otheractivities/
eliminations2021total Offshore Onshore
Bioenergy &Other
Otheractivities/
eliminations2020total
Sale of gas - - 2,968 (93) 2,875 - - 2,670 7 2,677
Generation of power 2,169 245 1,134 - 3,548 1,336 99 517 - 1,952
Sale of power 2,354 - 1,417 (1,349) 2,422 1,538 - 1,694 (222) 3,010
Revenue from construction of offshore wind farms 5,101 - - - 5,101 563 - - - 563
Generation and sale of heat and steam - - 1,193 - 1,193 - - 1,148 - 1,148
Distribution and transmission - - 81 (1) 80 - - 660 (1) 659
Other revenue 570 - 37 (7) 600 420 13 289 (8) 714
Total revenue from customers, IFRS 10,194 245 6,830 (1,450) 15,819 3,857 112 6,978 (224) 10,723
Government grants 2,998 2 227 - 3,227 3,825 11 164 - 4,000
Economic hedging - - - - - 2,943 24 49 (273) 2,743
Miscellaneous revenue 93 (127) (37) (31) (102) 7 (8) 739 28 766
Total revenue, IFRS 13,285 120 7,020 (1,481) 18,944 10,632 139 7,930 (469) 18,232
Adjustments (2,657) (2) (421) 224 (2,856)
Total revenue, business performance 7,975 137 7,509 (245) 15,376
Timing of revenue recognition from customers, IFRS
At a point in time 9,789 245 2,067 (1,450) 10,651 2,880 112 2,164 (224) 4,932
Over time 405 - 4,763 - 5,168 977 - 4,814 - 5,791
Total revenue from customers, IFRS 10,194 245 6,830 (1,450) 15,819 3,857 112 6,978 (224) 10,723
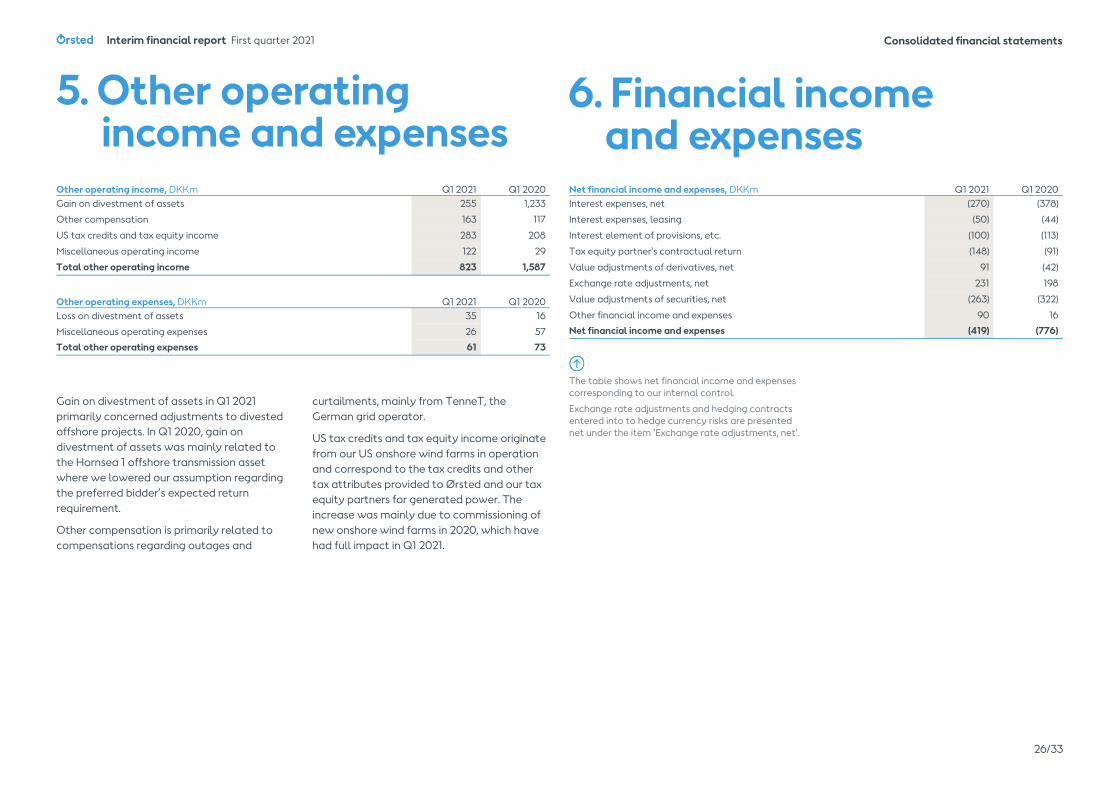
26/33
Consolidated financial statementsInterim financial report First quarter 2021
5. Other operating income and expenses
Gain on divestment of assets in Q1 2021primarily concerned adjustments to divested offshore projects. In Q1 2020, gain ondivestment of assets was mainly related to the Hornsea 1 offshore transmission asset where we lowered our assumption regarding the preferred bidder’s expected returnrequirement.
Other compensation is primarily related to compensations regarding outages and
curtailments, mainly from TenneT, theGerman grid operator.
US tax credits and tax equity income originate from our US onshore wind farms in operation and correspond to the tax credits and other tax attributes provided to Ørsted and our tax equity partners for generated power. The increase was mainly due to commissioning of new onshore wind farms in 2020, which have had full impact in Q1 2021.
6. Financial income and expenses
The table shows net financial income and expenses corresponding to our internal control.
Exchange rate adjustments and hedging contracts entered into to hedge currency risks are presented net under the item ’Exchange rate adjustments, net’.
Other operating income, DKKm Q1 2021 Q1 2020Gain on divestment of assets 255 1,233
Other compensation 163 117
US tax credits and tax equity income 283 208
Miscellaneous operating income 122 29
Total other operating income 823 1,587
Other operating expenses, DKKm Q1 2021 Q1 2020Loss on divestment of assets 35 16
Miscellaneous operating expenses 26 57
Total other operating expenses 61 73
Net financial income and expenses, DKKm Q1 2021 Q1 2020Interest expenses, net (270) (378)
Interest expenses, leasing (50) (44)
Interest element of provisions, etc. (100) (113)
Tax equity partner's contractual return (148) (91)
Value adjustments of derivatives, net 91 (42)
Exchange rate adjustments, net 231 198
Value adjustments of securities, net (263) (322)
Other financial income and expenses 90 16
Net financial income and expenses (419) (776)

27/33
Consolidated financial statementsInterim financial report First quarter 2021
8. Reserves7. Gross and net investments
The table shows gross and net investments based on cash flows from investing activities.
Gross and net investments, DKKm Q1 2021 Q1 2020Cash flow from investing activities (11,753) (1,965)
Purchase and sale of securities, reversed 5,057 (3,337)
Sale of non-current assets, reversed 31 (6)
Gross investments (6,665) (5,308)
Transactions with non-controlling interests in connection with divestments - 1
Sale of non-current assets (31) 6
Divestments (31) 7
Net investments (6,696) (5,301)
Reserves 2021, DKKm
Foreigncurrency
translationreserve
Hedgingreserve
Totalreserves
Reserves at 1 January 2021 (3,829) 1,873 (1,956)
Exchange rate adjustments 3,639 - 3,639
Value adjustments of hedging - (7,992) (7,992)
Value adjustments transferred to:
Revenue - 2,016 2,016
Financial income and expenses - 2 2
Property, plant, and equipment - (44) (44)
Tax:
Tax on hedging and currency adjustments (615) 1,094 479
Movement in comprehensive income for the period 3,024 (4,924) (1,900)
Total reserves at 31 March (805) (3,051) (3,856)
Reserves 2020, DKKm
Foreigncurrency
translationreserve
Hedgingreserve
Totalreserves
Reserves at 1 January 2020 168 245 413
Exchange rate adjustments (2,208) - (2,208)
Value adjustments of hedging - 538 538
Value adjustments transferred to:
Revenue - 24 24
Financial income and expenses - 42 42
Tax:
Tax on hedging and currency adjustments 526 (241) 285
Movement in comprehensive income for the period (1,682) 363 (1,319)
Total reserves at 31 March (1,514) 608 (906)
Willow Creek,Butte County,South Dakota, the US.

28/33
Consolidated financial statementsInterim financial report First quarter 2021
Tax on profit (loss) for the periodTax on profit (loss) was DKK 949 million in the first three months of 2021 compared toDKK 1,501 million in the first three months of 2020. The effective tax rate for the first three months of 2021 was 37 %.
The effective tax rate was affected byrecognition of deferred tax liabilities related to tax equity partnerships for offshore wind farms in our north-east cluster. The deferred tax liabilities will increase until COD.
Also, the effective tax rate was affected by the winter storm in Texas in February as weincurred hedge income in entities with no tax equity partnership agreements in place.
Tax controversiesOn 28 April 2021, Ørsted received a draftadministrative decision from the Danish Tax Agency in relation to the development of the offshore wind farm Race Bank. In line with its administrative decision from 1 December 2020 on the Walney Extension and Hornsea 1offshore wind farms, the Danish Tax Agency claims that Ørsted Wind Power A/S has not acted at arm’s length terms when charging
Effective tax rateThe estimated average annual tax rate for the ’Remaining Ørsted business’ is 27 % compared to22 % for the full-year of 2020.
The effective tax is calculated on the basis of the profit (loss) before tax from continuing operations.
‘Other adjustments’ include changes in tax rates, movements in uncertain tax positions, tax concerning previous years, and other non-taxable income and non-deductible costs.
Accounting policies
Effective tax rateThe estimated average annual tax rate isseparated based on regions and into two different categories: a) ordinary business activities andb) gain (loss) on divestments and impacts from tax equity contributions.
9. Tax on profit (loss) for the period
Plum Creek, Wayne County,Texas, the US.
fees for technical development servicesprovided to the Race Bank project company. If the draft decision is finalised, it entails an additional Danish tax payment of DKK 2.5 billion plus interest for the income year 2015. As part of the process, Ørsted is given time and the opportunity to make submissions before the Danish Tax Agency makes a final decision in the matter.
In response to the tax risks connected tocross-border activities, including the currentcontroversy regarding the pricing of technical development service fees, we have madetax-related provisions in accordance with IAS 12, IAS 37, and relevant interpretation, such as IFRIC 23. The provisions have been calculated on the basis of differences in tax rates and statistical risks of suffering economic or legal double taxation.
Q1 2021 Q1 2020
Tax for the period, DKKProfit (loss)before tax Tax Tax in %
Profit (loss)before tax Tax Tax in %
Deferred tax liability, new tax equity contributions (250) n.a. - n.a.
Other adjustments (138) n.a. 12 n.a.
Remaining Ørsted business 2,547 (561) 22% 6,908 (1,513) 22%
Effective tax for the year 2,547 (949) 37% 6,908 (1,501) 22%

29/33
Consolidated financial statementsInterim financial report First quarter 2021
For USD and NTD, we manage our risk to a natural time spread bet-ween front-end capital expenditures and long-end revenue. In the 5 year horizon, we are therefore seeing that our hedges increase our net exposure to USD, but in the longer horizon our hedges reduce the USD risk.
We do not deem EUR to constitute a risk, as we expect Denmark to maintain its fixed exchange-rate policy.
The graph shows our energyexposure for the next five years.
Our energy exposures aresignificantly reduced due to hedging.
Energy exposure 1 April 2021 - 31 March 2026, DKKbnCurrency exposure 1 April 2021 - 31 March 2026, DKKbn
10. Market risks
The table shows the time of the transfer of the market value ofhedging contracts to EBITDA.
Expected value for recognition in EBITDA, DKKbn

30/33
Consolidated financial statementsInterim financial report First quarter 2021
Accounting policy
’Quoted prices’ comprise gas and derivatives that are traded in active markets. Where derivatives are traded in an active market, we generally have daily settle-ments, for which reason the market value is zero.‘Observable input’ comprises securities and derivatives, for which valuation models with observable inputs are used to measure fair value. The majority of our securi-ties are quoted Danish mortgage or government bonds. Since these are not always traded on a daily basis, we are valuing these based on market interest rates for similar bonds. ‘Non-observable input’ primarily comprise long-term contracts on the purchase or sale of power and gas. The fair values are based on assumptionsconcerning the long-term prices of power and gas as well as risk premiums in respect of liquidity and market risks. Since there are no active markets for long-term prices, the fair value has been determined through an estimate of future prices.Normally, the energy price can be observed for a maxi-mum of five years in the power market, after which an active market no longer exists. Beyond the five-year horizon, the energy price is thus projected on the basis of the observable forward prices for years one to five.All assets and liabilities measured at fair value are measured on a recurring basis.
Valuation principles and key assumptions
In order to minimise the use of subjectiveestimates or modifications of parametersand calculation models, it is our policy todetermine fair values based on the external information that most accurately reflects the market values. We use pricing services and benchmark services to increase data quality.
Market values are determined by theTreasury & Risk Management function which reports to the CFO. The market valuedevelopmentss are monitored on a continuous basis and reported to theExecutive Committee.
The table shows the move-ments during the year in the total market value (assets and liabilities) of derivatives valued on the basis of non-observable inputs.
The main non-observable input is German power prices in the period 2025-2034. The avarage power price for the period is estimated at EUR 55.43 per MWh, based on an inflation-adjusted extrapolation of the observable price. An increase or decrease in theGerman power prices of 10 % would impact the fair value by +/- DKK 405 million.
11. Fair value measurementDerivatives valued on the basis ofnon-observable input, DKKm 2021 2020Market value at 1 January (82) 236
Value adjustments through profit or loss (165) 287
Value adjustments through othercomprehensive income (119) - Sales/redemptions 2 (134)
Purchases/issues (15) 23
Transferred to observable input (13) -
Market value at 31 March (392) 412
Non-observable inputs per commodityprice input, DKKm 2021 2020German power prices (348) -
Other power prices (49) 122
Gas prices 5 290
Total (392) 412
Assets Liabilities
Fair value hierarchyDKKm Inventories Securities Derivatives Derivatives2021
Quoted prices 315 - 1,120 1,733
Observable input - 30,154 5,102 8,365
Non-observable input - - 116 508
Total 31 March 2021 315 30,154 6,338 10,606
2020
Quoted prices 271 - 11 14
Observable input - 12,941 11,572 7,566
Non-observable input - - 458 46
Total 31 March 2020 271 12,941 12,041 7,626
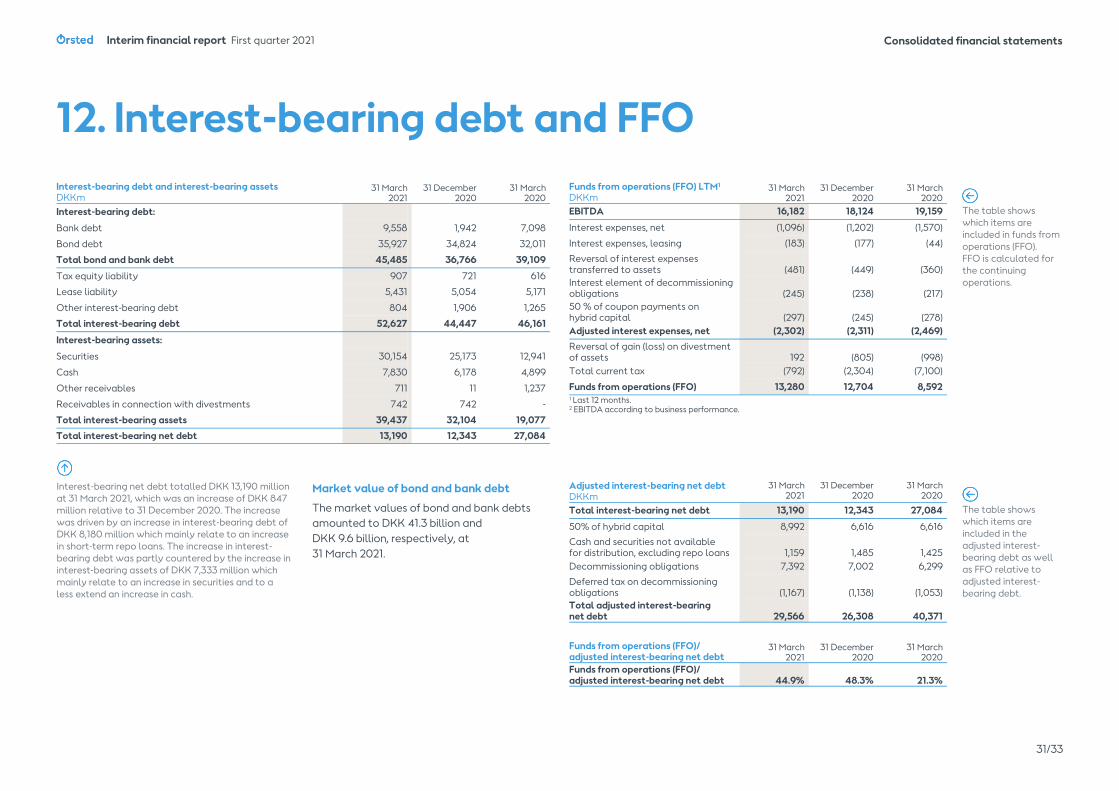
31/33
Consolidated financial statementsInterim financial report First quarter 2021
The table shows which items areincluded in funds from operations (FFO).FFO is calculated for the continuingoperations.
Market value of bond and bank debt
The market values of bond and bank debts amounted to DKK 41.3 billion andDKK 9.6 billion, respectively, at 31 March 2021.
Interest-bearing net debt totalled DKK 13,190 million at 31 March 2021, which was an increase of DKK 847 million relative to 31 December 2020. The increase was driven by an increase in interest-bearing debt of DKK 8,180 million which mainly relate to an increase in short-term repo loans. The increase in interest-bearing debt was partly countered by the increase in interest-bearing assets of DKK 7,333 million which mainly relate to an increase in securities and to a less extend an increase in cash.
The table shows which items areincluded in theadjusted interest-bearing debt as well as FFO relative to adjusted interest-bearing debt.
12. Interest-bearing debt and FFOInterest-bearing debt and interest-bearing assetsDKKm
31 March2021
31 December2020
31 March2020
Interest-bearing debt:
Bank debt 9,558 1,942 7,098
Bond debt 35,927 34,824 32,011
Total bond and bank debt 45,485 36,766 39,109
Tax equity liability 907 721 616
Lease liability 5,431 5,054 5,171
Other interest-bearing debt 804 1,906 1,265
Total interest-bearing debt 52,627 44,447 46,161
Interest-bearing assets:
Securities 30,154 25,173 12,941
Cash 7,830 6,178 4,899
Other receivables 711 11 1,237
Receivables in connection with divestments 742 742 -
Total interest-bearing assets 39,437 32,104 19,077
Total interest-bearing net debt 13,190 12,343 27,084
Funds from operations (FFO) LTM1
DKKm31 March
202131 December
202031 March
2020EBITDA 16,182 18,124 19,159
Interest expenses, net (1,096) (1,202) (1,570)
Interest expenses, leasing (183) (177) (44)
Reversal of interest expensestransferred to assets (481) (449) (360)Interest element of decommissioningobligations (245) (238) (217)50 % of coupon payments onhybrid capital (297) (245) (278)Adjusted interest expenses, net (2,302) (2,311) (2,469)Reversal of gain (loss) on divestmentof assets 192 (805) (998)Total current tax (792) (2,304) (7,100)
Funds from operations (FFO) 13,280 12,704 8,5921 Last 12 months.2 EBITDA according to business performance.
Adjusted interest-bearing net debtDKKm
31 March2021
31 December2020
31 March2020
Total interest-bearing net debt 13,190 12,343 27,084
50% of hybrid capital 8,992 6,616 6,616Cash and securities not availablefor distribution, excluding repo loans 1,159 1,485 1,425Decommissioning obligations 7,392 7,002 6,299
Deferred tax on decommissioningobligations (1,167) (1,138) (1,053)Total adjusted interest-bearingnet debt 29,566 26,308 40,371
Funds from operations (FFO)/adjusted interest-bearing net debt
31 March2021
31 December2020
31 March2020
Funds from operations (FFO)/adjusted interest-bearing net debt 44.9% 48.3% 21.3%

32/33
Consolidated financial statementsInterim financial report First quarter 2021
The Board of Directors and the Executive Board have today considered and approved the interim financial report of Ørsted A/S for the period 1 January - 31 March 2021.
The interim financial report, which has not been audited or reviewed by the company’sindependent auditors, has been prepared in accordance with IAS 34 'Interim FinancialReporting' as adopted by the EU and addition-al requirements in the Danish Financial State-ments Act. The accounting policies remain unchanged from the annual report for 2020.
In our opinion, the interim financial report gives a true and fair view of the Group'sassets, liabilities, and financial position at31 March 2021 and of the results of the Group's operations and cash flows for the period1 January - 31 March 2021.
Furthermore, in our opinion, the manage-ment's review gives a fair presentation of thedevelopment in the Group's operations and financial circumstances, of the results for the period, and of the overall financial position of the Group as well as a description of the most significant risks and elements of uncertainty facing the Group.
Over and above the disclosures in the interim financial report, no changes in the Group's most significant risks and uncertainties have occurred relative to the disclosures in the annual report for 2020.
Skærbæk, 29 April 2021
Mads Nipper
Group President and CEO
Marianne Wiinholt
CFO
Thomas Thune Andersen
Chairman
Jørgen Kildahl
Henrik Poulsen
Ole Henriksen*
Lene Skole
Deputy Chairman
Julia Elizabeth King
Dieter Wemmer
Daniel Tas Sandermann*
Lynda Armstrong
Peter Korsholm
Benny Gøbel*
*Employee representative
Executive Board
Board of Directors
Statement by the Executive Board and the Board of Directors
Martin Neubert
CCO and Deputy Group CEO

33/33
Consolidated financial statementsInterim financial report First quarter 2021
Forward-lookingstatementsForward-looking statements
This report contains certain forward-looking statements, including but not limited to, the statements and expectations contained in the ‘Outlook’ section of this report (p. 7).
Statements herein, other than statements of historical facts, regarding our future results related to operations, financial condition, cash flows, business strategy, plans, and futureobjectives are forward-looking statements.
Words such as ‘targets’, ‘believe’, ‘expect’, ‘aim’, ‘intend’, ‘plan’, ‘seek’, ‘will’, ‘may’, ‘should’ ‘anticipate’, ‘continue’, ‘predict’ or variations of these words as well as other statementsregarding matters that are not historical facts or regarding future events or prospects,constitute forward-looking statements.
We have based these forward-lookingstatements on our current views with respect to future events and financial performance. These views involve a number of risks anduncertainties which could cause actual results to differ materially from those predicted in the forward-looking statements and from our past performance.
Although we believe that the estimates and projections reflected in the forward-looking statements are reasonable, they may prove materially incorrect, and actual results may materially differ due to a variety of factors. These factors include, but are not limited to, market risks, development and construction of assets, changes in temperature, windconditions, wake and blockage effects,precipitation levels, the development in power, coal, carbon, gas, oil, currency, and interest rate markets, changes in legislation,regulations, or standards, the renegotiation of contracts, changes in the competitiveenvironment in our markets, security of supply, cable break-downs, or other disruptions.
Read more about the risks in the chapter ‘Risk and risk management’ and in note 7 of the annual report 2020 available at www.orsted.com.
Unless required by law, we are under no duty and undertake no obligation to update orrevise any forward-looking statement after the distribution of this report, whether as a result of new information, future events, or otherwise.
Coastal Virginia Wind,Off the coast of Virginia Beach, the US.

18/33
Management’s review Interim financial report First quarter 2021
Ørsted A/S
CVR no. 36213728
Kraftværksvej 53
DK-7000 Fredericia
Tel.: +45 9955 1111
orsted.com
Group Communication
Martin Barlebo
Tel.: +45 9955 9552
Investor Relations
Allan Bødskov Andersen
Tel.: +45 9955 7996
Front page image Borssele 1 & 2 near Vlissingen,
the Netherlands
Publication 29 April 2021


