35
First Quarter 2021 Investor Presentation March 2021
First Quarter 2021Investor Presentation
March 2021
Copyright © 2021 Griffon Corporation. All rights reserved.
Cautionary Note Regarding Forward-Looking Statements
This presentation contains “forward-looking statements” – statements that address future, not past events. In this context, forward-looking statements often address our expected future business and financial performance and financial condition, and often contain words such as “expect,” “anticipate,” “intend,” “plan,” “believe,” “seek,” or “will.” Forward looking statements by their nature address matters that are, to different degrees, uncertain. These statements are based on assumptions of future events that may not proveaccurate. They are also based on our current plans and strategy and such plans and strategy could change in the future. Actual results may differ materially from those projected or implied in any forward-looking statements. Please refer to our most recent SEC filings, including our 2020 Annual Report on Form 10-K, subsequently filed Quarterly reports on Form 10-Q, as well as our other filings with the SEC, for detailed information regarding factors that could cause actual results to differ materially from those expressed or implied in such forward-looking statements. We do not undertake to update our forward-looking statements.
Use of Non-GAAP Financial Measures
The Company provides financial measures and terms not calculated in accordance with accounting principles generally accepted in the United States (GAAP). Presentation of non-GAAP measures such as, but not limited to, “free cash flow” and “adjusted EBITDA” provide investors with an alternative method for assessing our operating results in a manner that enables them to more thoroughly evaluate our performance. The non-GAAP measures included in this presentation are provided to give investors access to the types of measures that we use in analyzing our results.
The Company’s calculation of non-GAAP financial measures is not necessarily comparable to similarly titled measures reported by other companies. These non-GAAP measures may be considered in addition to results prepared in accordance with GAAP, but should not be considered a substitute for or superior to GAAP results.
A copy of this presentation, including the reconciliation of GAAP to non-GAAP measures, is available on our website www.griffon.com.

Introduction
Copyright © 2021 Griffon Corporation. All rights reserved. 3
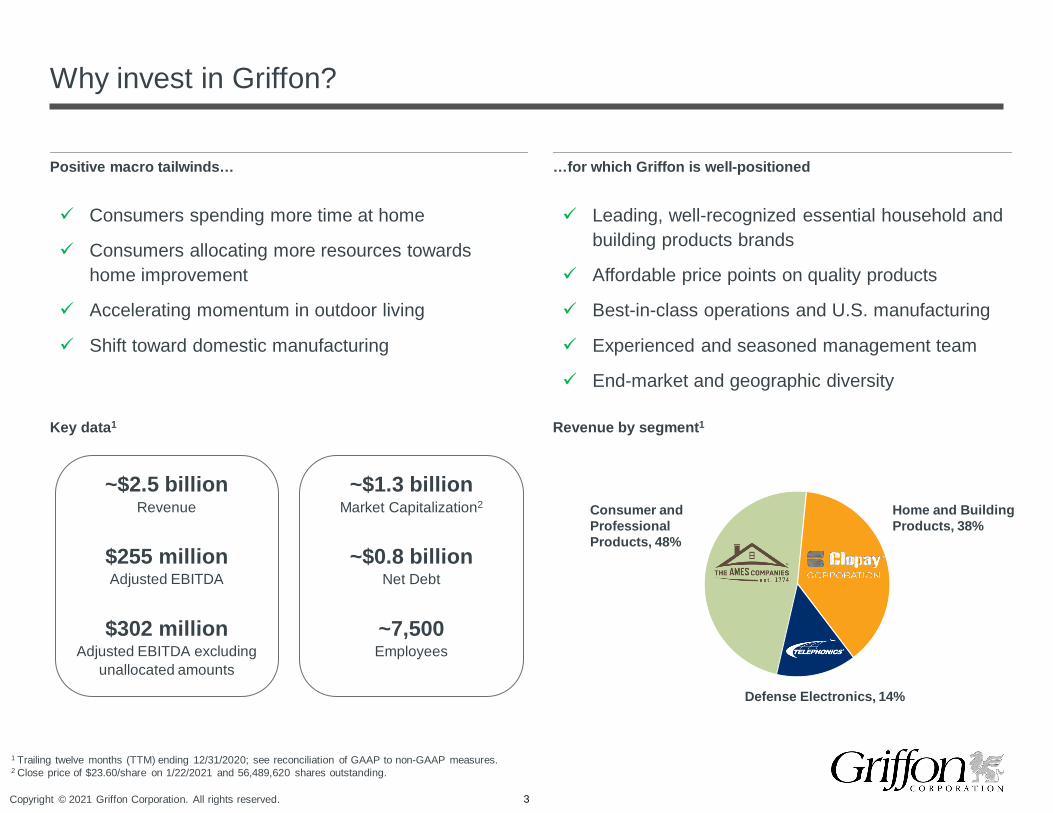
Why invest in Griffon?
Key data1
Positive macro tailwinds…
~$2.5 billionRevenue
$255 millionAdjusted EBITDA
$302 millionAdjusted EBITDA excluding
unallocated amounts
~$1.3 billionMarket Capitalization2
~$0.8 billionNet Debt
~7,500Employees
…for which Griffon is well-positioned
1 Trailing twelve months (TTM) ending 12/31/2020; see reconciliation of GAAP to non-GAAP measures.2 Close price of $23.60/share on 1/22/2021 and 56,489,620 shares outstanding.
Revenue by segment1
Consumer and Professional Products, 48%
Home and Building Products, 38%
Defense Electronics, 14%
Consumers spending more time at home
Consumers allocating more resources towards home improvement
Accelerating momentum in outdoor living
Shift toward domestic manufacturing
Leading, well-recognized essential household and building products brands
Affordable price points on quality products
Best-in-class operations and U.S. manufacturing
Experienced and seasoned management team
End-market and geographic diversity
Copyright © 2021 Griffon Corporation. All rights reserved. 4
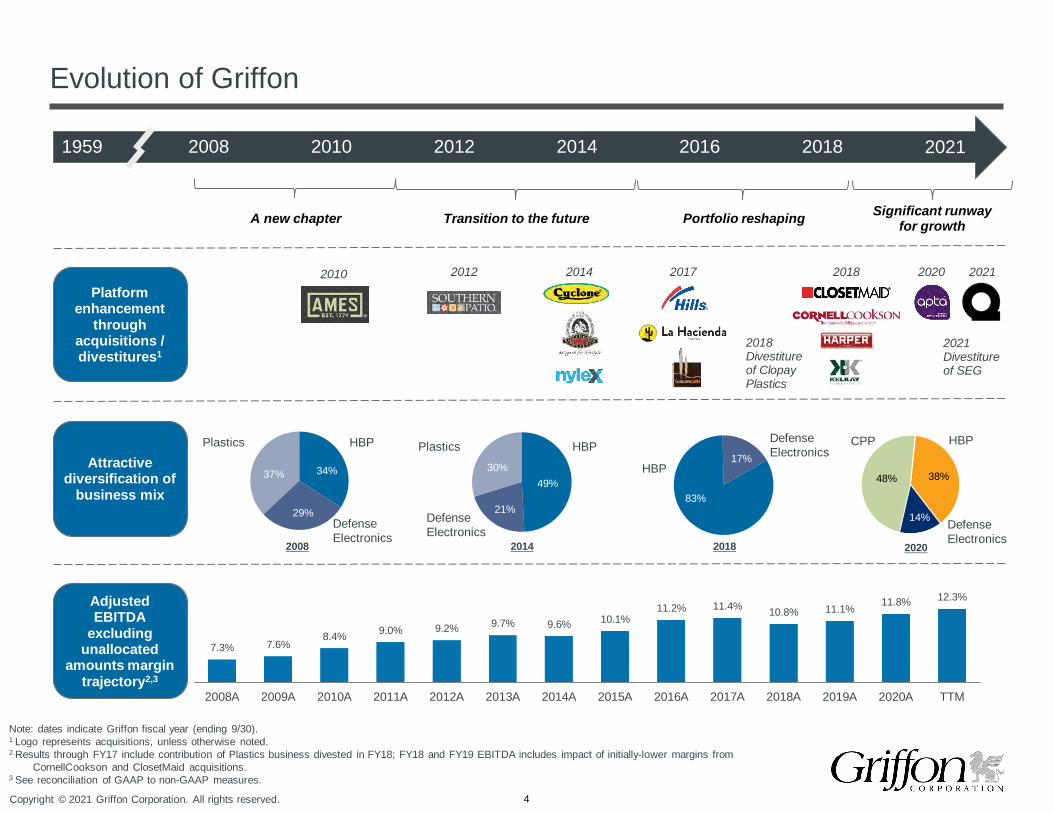
Evolution of Griffon
20081959 2010 2012 2014 2016 2018
A new chapter Transition to the future Portfolio reshaping
Adjusted EBITDA
excluding unallocated
amounts margin trajectory2,3
7.3% 7.6%8.4% 9.0% 9.2% 9.7% 9.6% 10.1%
11.2% 11.4% 10.8% 11.1% 11.8% 12.3%
2008A 2009A 2010A 2011A 2012A 2013A 2014A 2015A 2016A 2017A 2018A 2019A 2020A TTM
Note: dates indicate Griffon fiscal year (ending 9/30).1 Logo represents acquisitions, unless otherwise noted.2 Results through FY17 include contribution of Plastics business divested in FY18; FY18 and FY19 EBITDA includes impact of initially-lower margins from
CornellCookson and ClosetMaid acquisitions.3 See reconciliation of GAAP to non-GAAP measures.
2021
Platform enhancement
through acquisitions / divestitures1
20182012 20172010 2014
2018 Divestiture of Clopay Plastics
2020
Attractive diversification of
business mix 83%
17% HBP
DefenseElectronics
2018
HBP
DefenseElectronics
Plastics
2008
29%
34%37%
HBP
DefenseElectronics
Plastics
2014
21%
49%30%
2020
48% 38%
14% DefenseElectronics
CPP HBP
Significant runwayfor growth
2021 Divestiture of SEG
2021
Copyright © 2021 Griffon Corporation. All rights reserved.
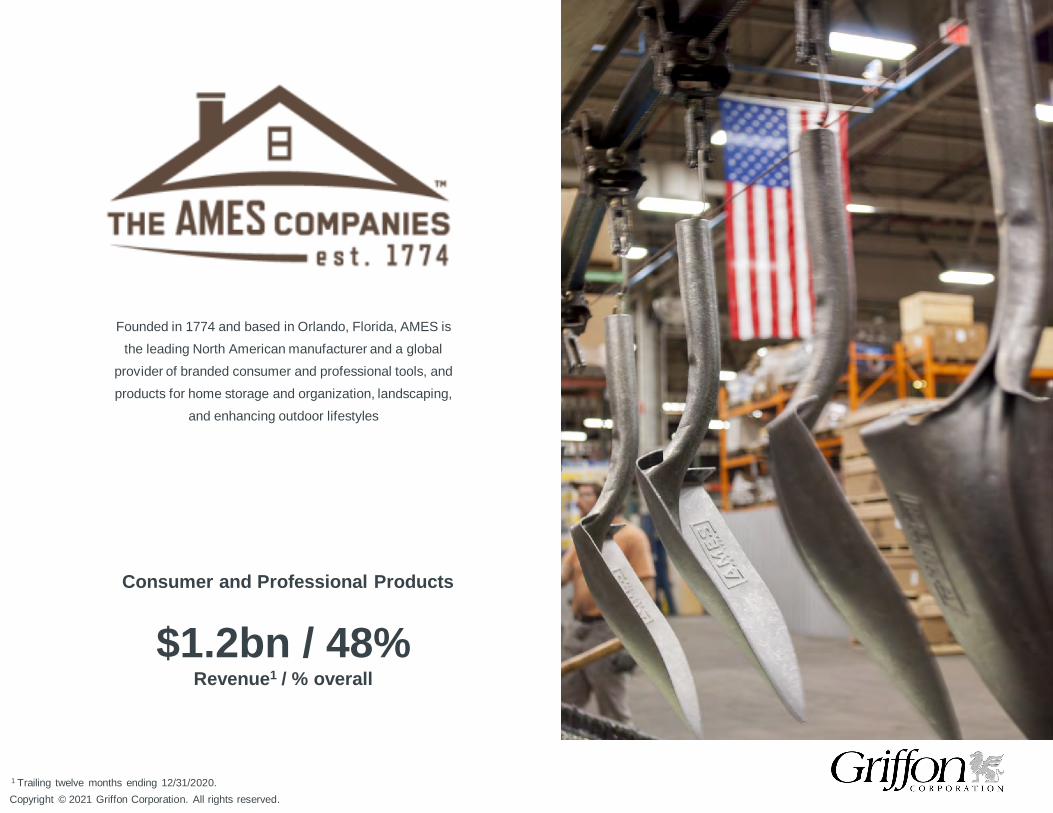
Consumer and Professional Products
$1.2bn / 48%Revenue1 / % overall
1 Trailing twelve months ending 12/31/2020.
Founded in 1774 and based in Orlando, Florida, AMES is the leading North American manufacturer and a global
provider of branded consumer and professional tools, and products for home storage and organization, landscaping,
and enhancing outdoor lifestyles
Copyright © 2021 Griffon Corporation. All rights reserved. 6
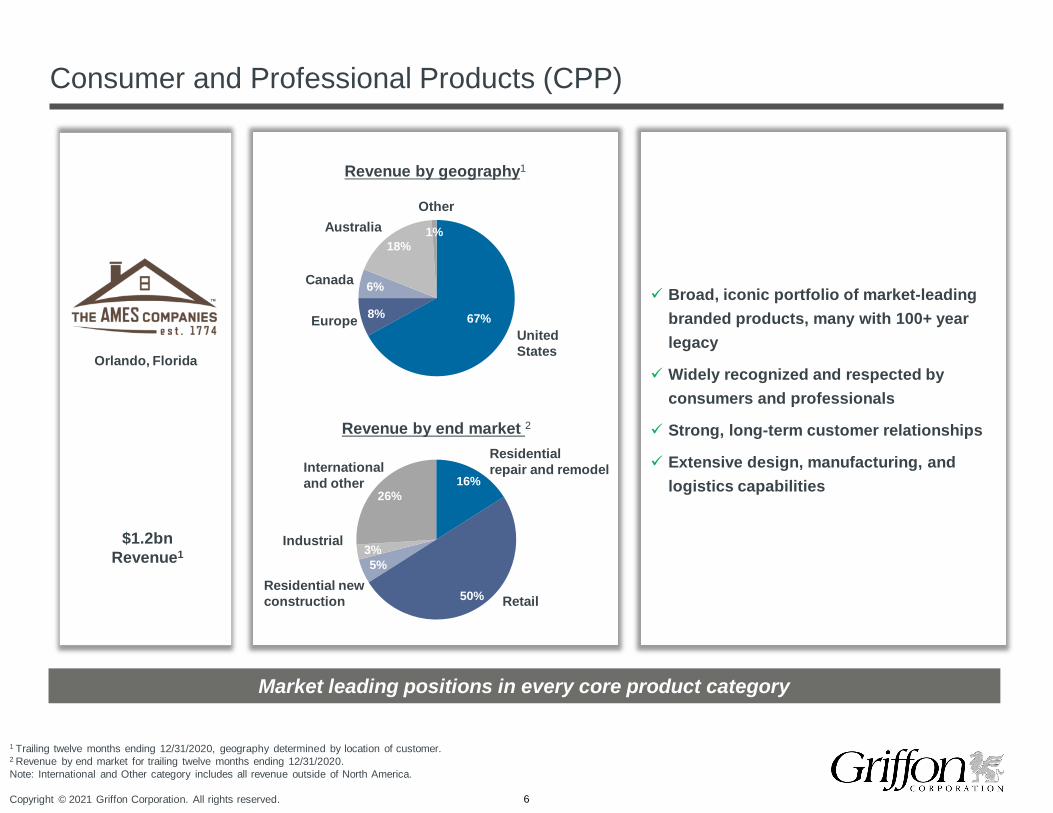
1 Trailing twelve months ending 12/31/2020, geography determined by location of customer.2 Revenue by end market for trailing twelve months ending 12/31/2020. Note: International and Other category includes all revenue outside of North America.
Consumer and Professional Products (CPP)
Broad, iconic portfolio of market-leading branded products, many with 100+ year legacy
Widely recognized and respected by consumers and professionals
Strong, long-term customer relationships
Extensive design, manufacturing, and logistics capabilities
Market leading positions in every core product category
67% 8%
6%
18% 1%
UnitedStates
16%
50%
5% 3%
26%
Residentialrepair and remodel
Revenue by end market 2
Residential new construction Retail
Internationaland other
Revenue by geography1
Australia
Industrial
Europe
Canada
Orlando, Florida
$1.2bnRevenue1
Other
Copyright © 2021 Griffon Corporation. All rights reserved. 7
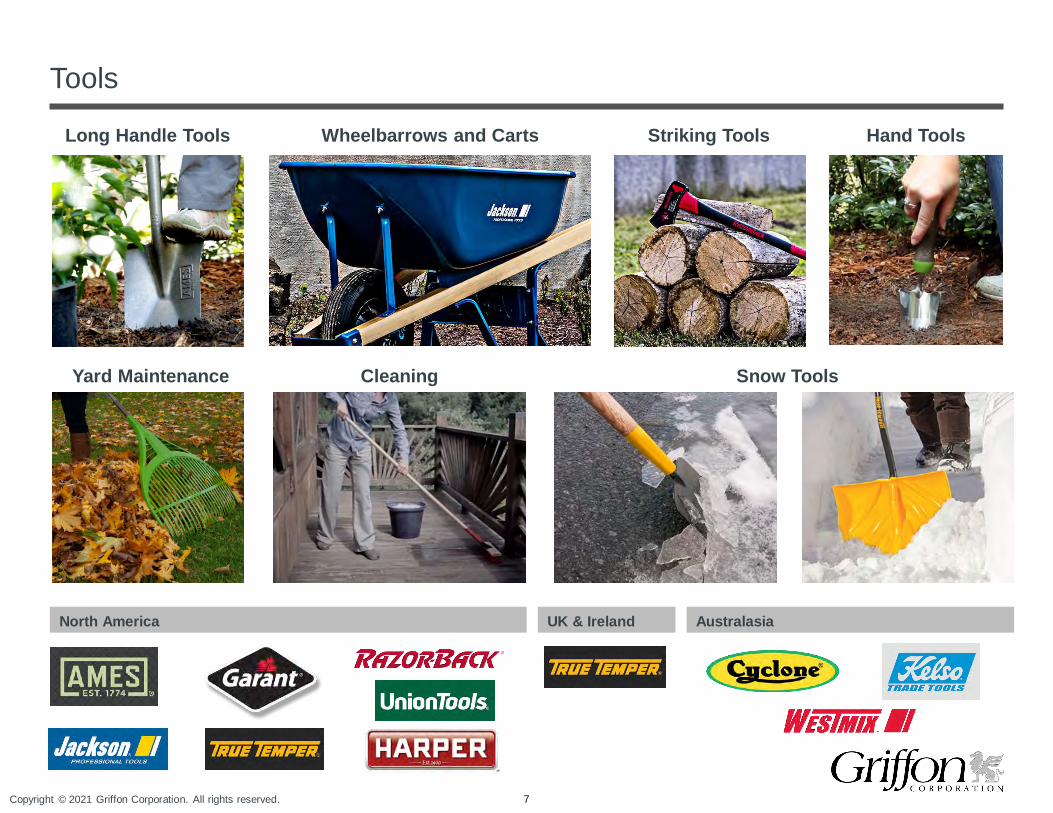
North America
Tools
UK & Ireland Australasia
Long Handle Tools
Snow Tools
Striking Tools
Cleaning
Wheelbarrows and Carts Hand Tools
Yard Maintenance
Copyright © 2021 Griffon Corporation. All rights reserved. 8
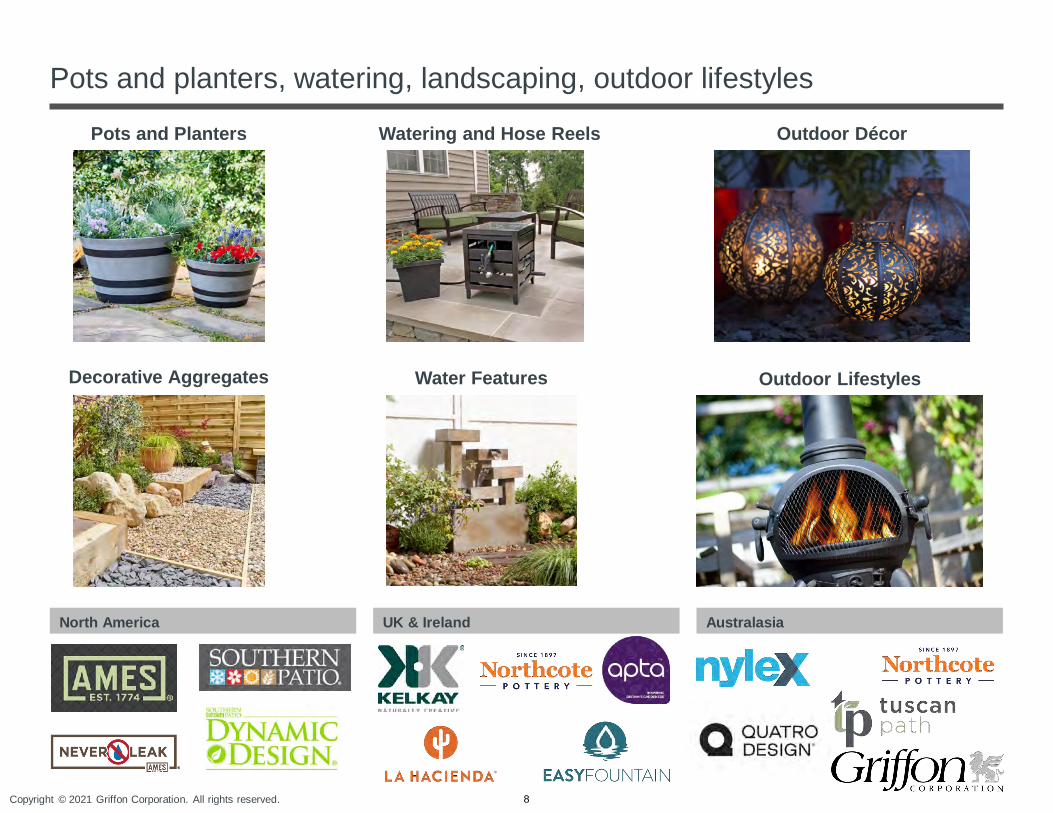
Pots and planters, watering, landscaping, outdoor lifestyles
North America UK & Ireland Australasia
Watering and Hose Reels
Water FeaturesDecorative Aggregates
Pots and Planters Outdoor Décor
Outdoor Lifestyles
Copyright © 2021 Griffon Corporation. All rights reserved. 9
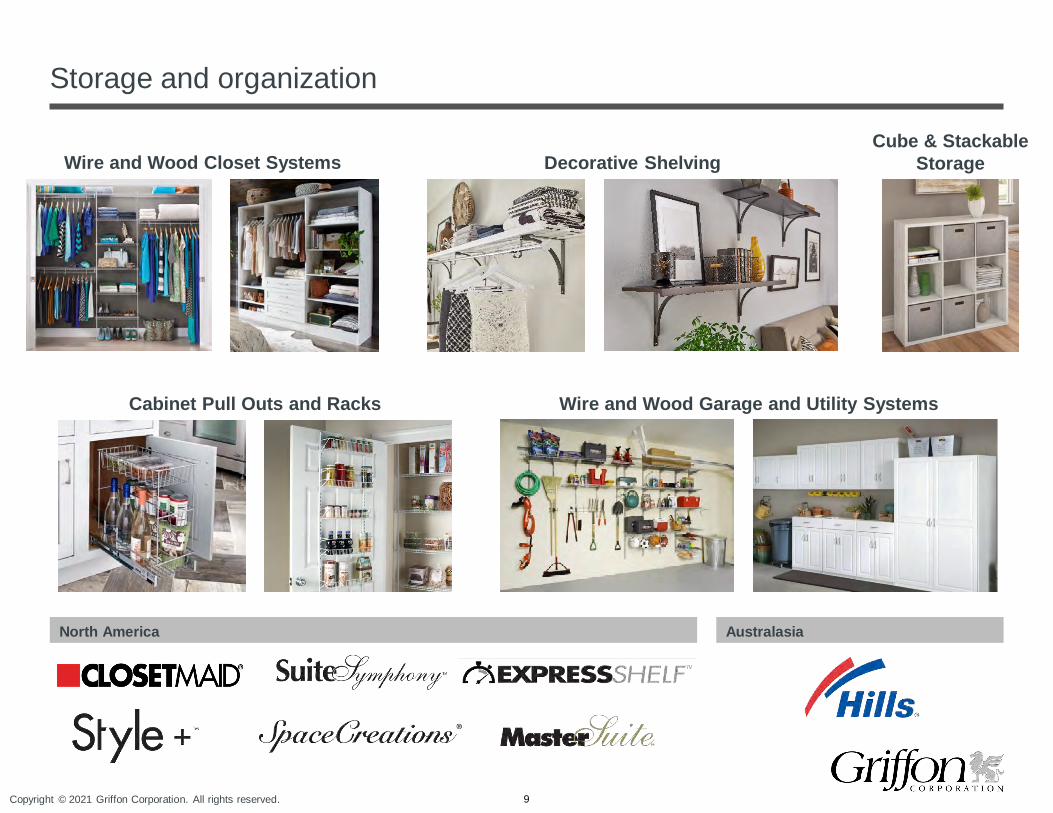
Storage and organization
North America Australasia
Wire and Wood Closet Systems Decorative Shelving
Cabinet Pull Outs and Racks
Cube & Stackable Storage
Wire and Wood Garage and Utility Systems
Copyright © 2021 Griffon Corporation. All rights reserved.
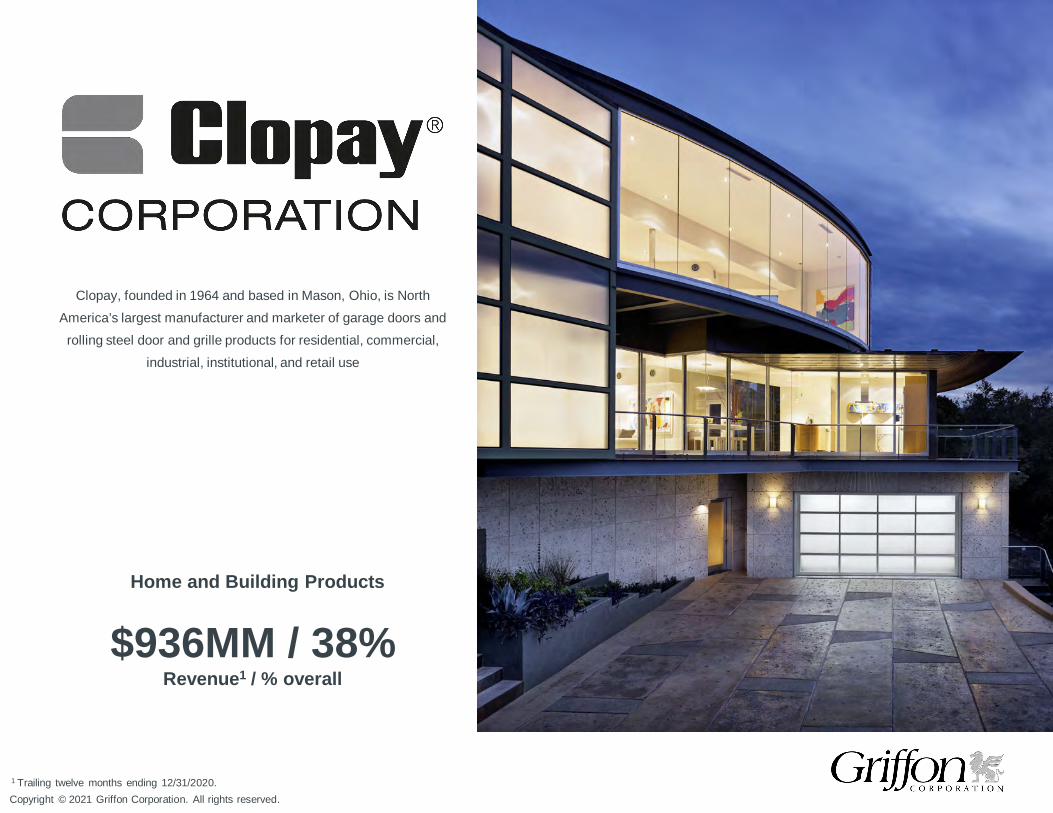
$936MM / 38%Revenue1 / % overall
1 Trailing twelve months ending 12/31/2020.
Home and Building Products
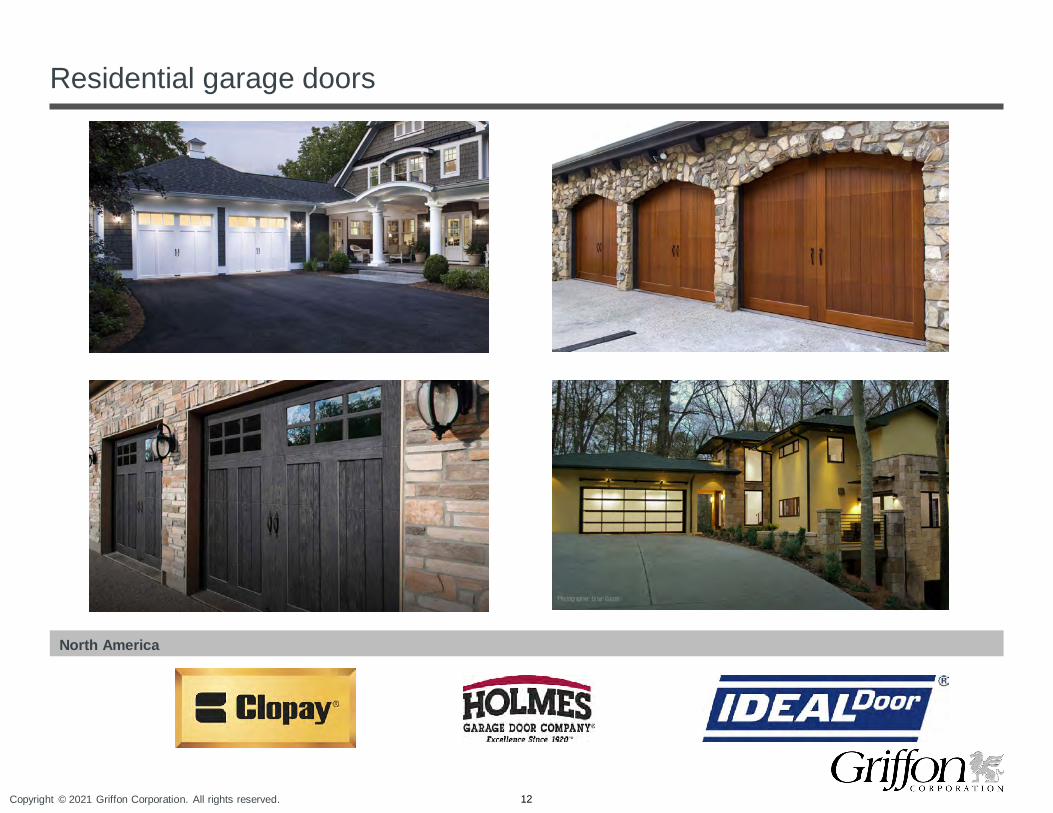
Clopay, founded in 1964 and based in Mason, Ohio, is North America’s largest manufacturer and marketer of garage doors and
rolling steel door and grille products for residential, commercial, industrial, institutional, and retail use
Copyright © 2021 Griffon Corporation. All rights reserved. 11
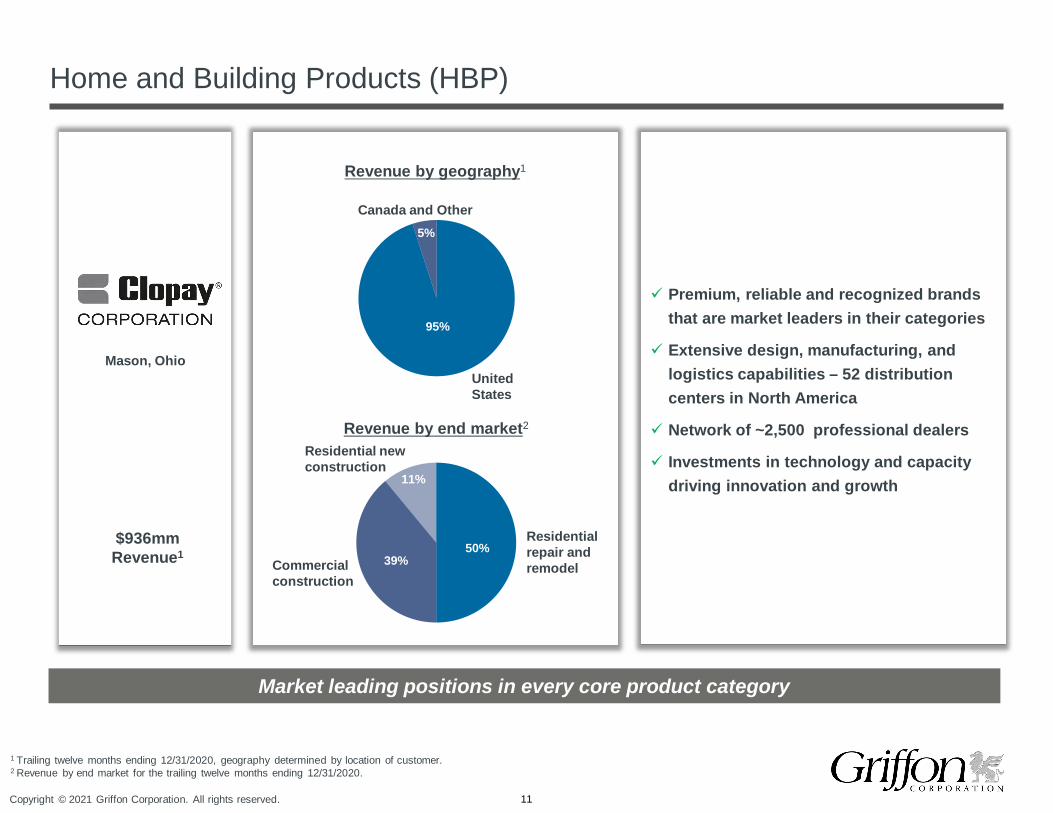
1 Trailing twelve months ending 12/31/2020, geography determined by location of customer.2 Revenue by end market for the trailing twelve months ending 12/31/2020.
Home and Building Products (HBP)
Premium, reliable and recognized brands that are market leaders in their categories
Extensive design, manufacturing, and logistics capabilities – 52 distribution centers in North America
Network of ~2,500 professional dealers
Investments in technology and capacity driving innovation and growth
Market leading positions in every core product category
50%39%
11%
Residentialrepair andremodel
Revenue by end market2
Residential newconstruction
Commercialconstruction
Revenue by geography1
95%
5%
UnitedStates
Canada and Other
Mason, Ohio
$936mmRevenue1
Copyright © 2021 Griffon Corporation. All rights reserved. 12
Residential garage doors
North America

Copyright © 2021 Griffon Corporation. All rights reserved. 13
Commercial sectional and commercial rolling steel
North America
Sectional Doors Grilles Shutters
Service Doors
Copyright © 2021 Griffon Corporation. All rights reserved.
1 Trailing twelve months ending 12/31/2020.
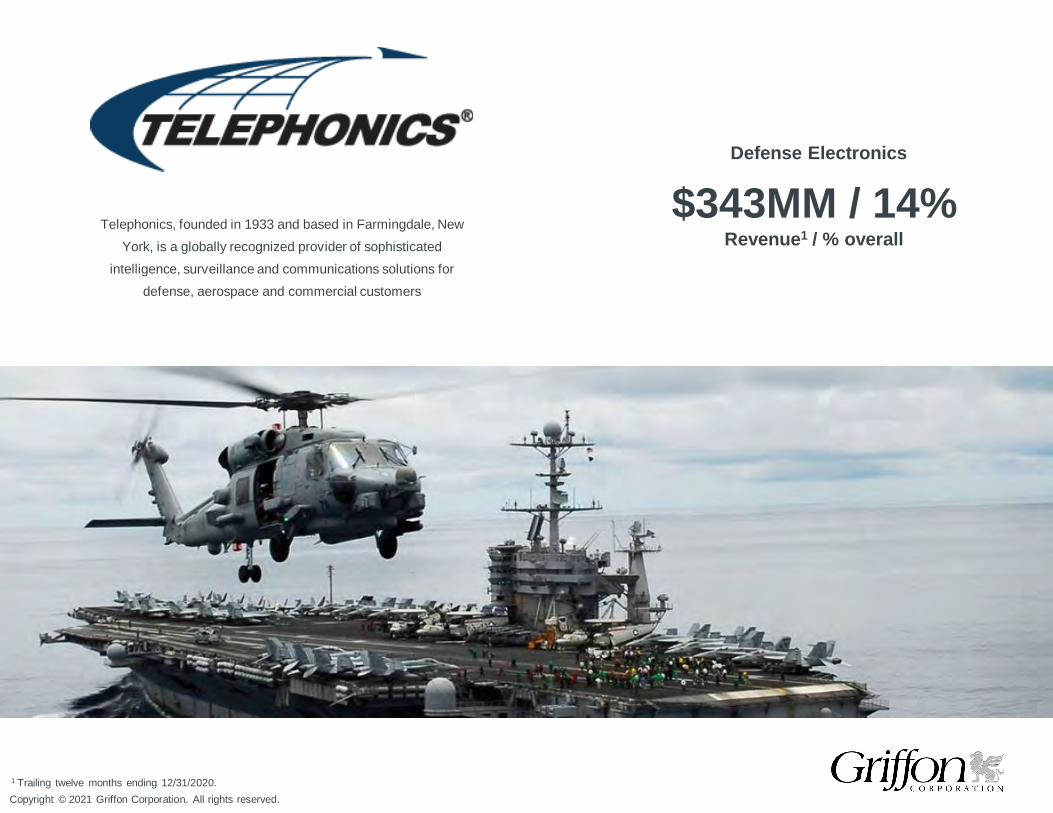
$343MM / 14%Revenue1 / % overall
Defense Electronics
Telephonics, founded in 1933 and based in Farmingdale, New York, is a globally recognized provider of sophisticated
intelligence, surveillance and communications solutions for defense, aerospace and commercial customers
Copyright © 2021 Griffon Corporation. All rights reserved. 15
1 For trailing twelve months ending 12/31/2020.
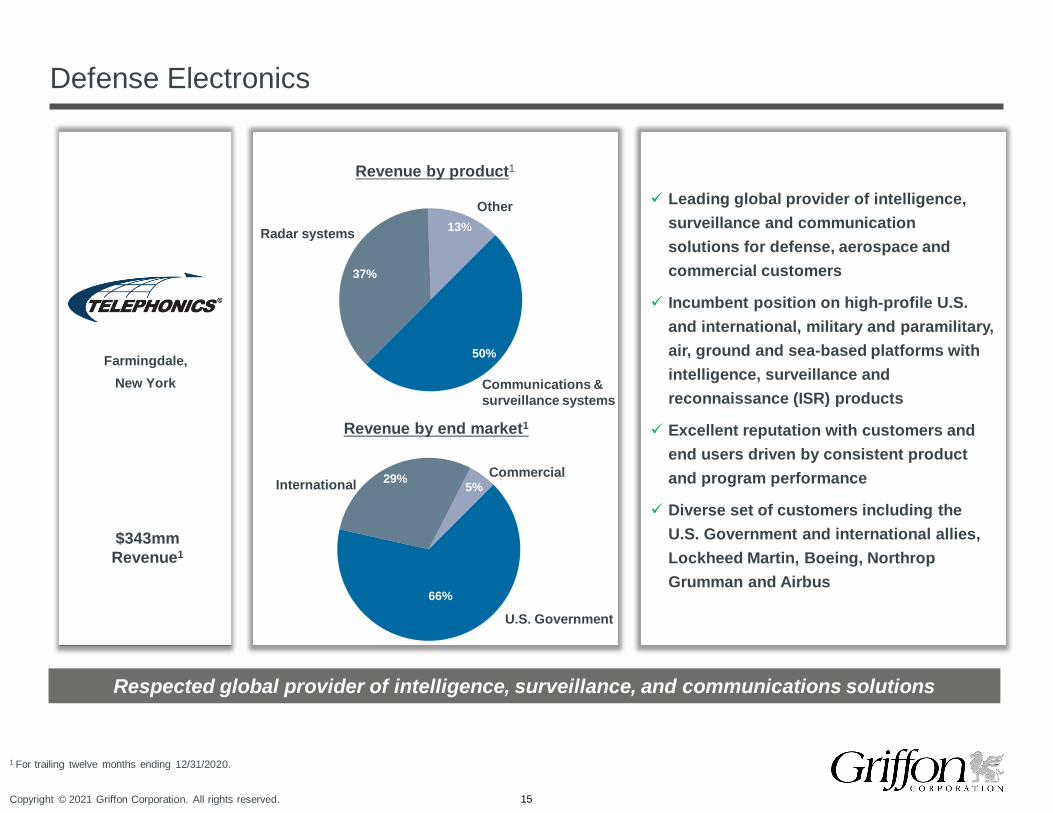
Defense Electronics
Leading global provider of intelligence, surveillance and communication solutions for defense, aerospace and commercial customers
Incumbent position on high-profile U.S. and international, military and paramilitary, air, ground and sea-based platforms with intelligence, surveillance and reconnaissance (ISR) products
Excellent reputation with customers and end users driven by consistent product and program performance
Diverse set of customers including the U.S. Government and international allies, Lockheed Martin, Boeing, Northrop Grumman and Airbus
Respected global provider of intelligence, surveillance, and communications solutions
$343mmRevenue1
Revenue by end market1
Revenue by product1
50%
37%
13%
Communications & surveillance systems
Radar systems
Other
66%
29% 5%
U.S. Government
International Commercial
Farmingdale,New York
Copyright © 2021 Griffon Corporation. All rights reserved. 16
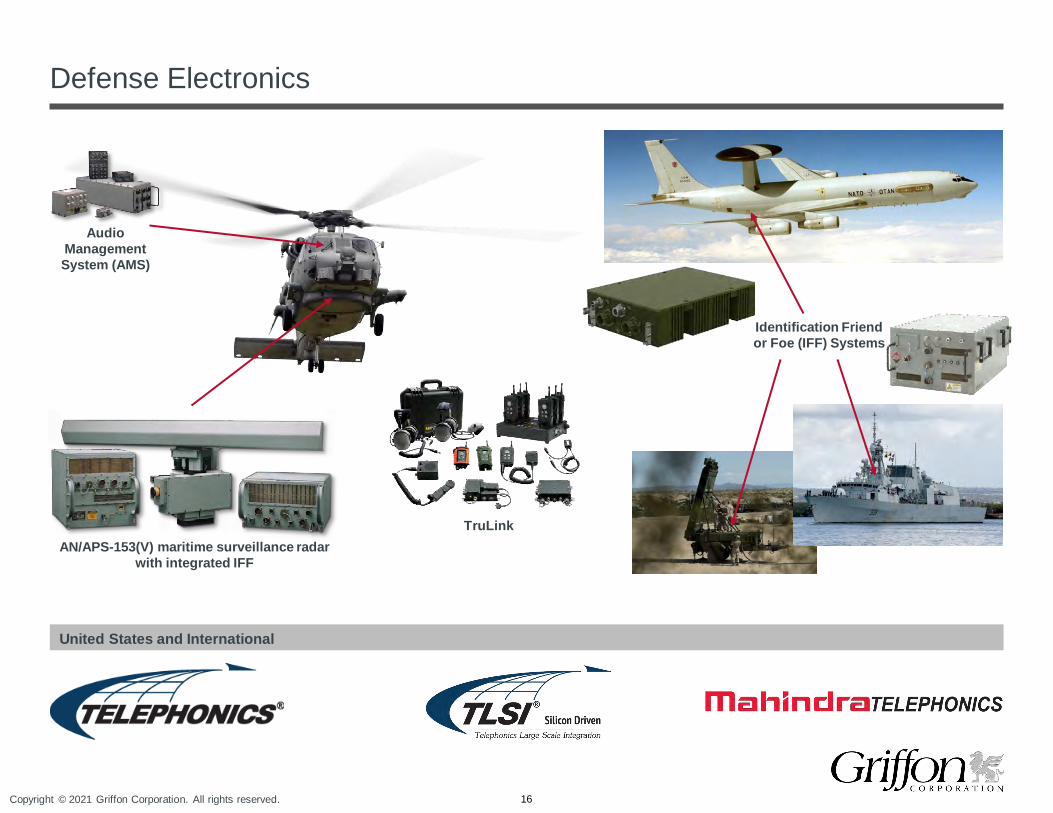
Defense Electronics
United States and International
Audio Management System (AMS)
AN/APS-153(V) maritime surveillance radar with integrated IFF
TruLink
Identification Friend or Foe (IFF) Systems

Investment Highlights
Copyright © 2021 Griffon Corporation. All rights reserved. 18
Investment highlights
1Attractive market
dynamics
2Long-term, sustainable competitive advantages
3Proven deal makers and
operators growing both top and bottom lines
4Strong free cash flow
generation
5Platform poised for continued growth
Copyright © 2021 Griffon Corporation. All rights reserved. 19
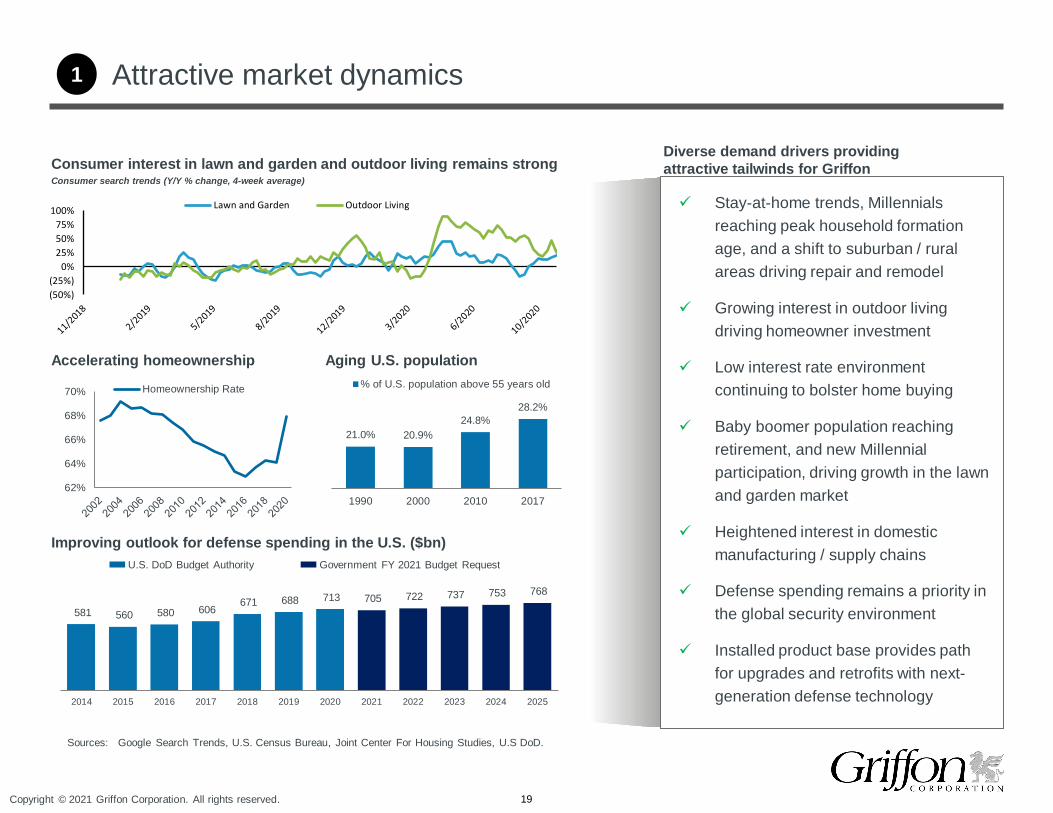
Improving outlook for defense spending in the U.S. ($bn)
62%
64%
66%
68%
70% Homeownership Rate
Attractive market dynamics
Sources: Google Search Trends, U.S. Census Bureau, Joint Center For Housing Studies, U.S DoD.
581 560 580 606 671 688 713 705 722 737 753 768
2014 2015 2016 2017 2018 2019 2020 2021 2022 2023 2024 2025
Consumer interest in lawn and garden and outdoor living remains strong
U.S. DoD Budget Authority Government FY 2021 Budget Request
1
Aging U.S. population
21.0% 20.9%24.8%
28.2%
1990 2000 2010 2017
% of U.S. population above 55 years old
Accelerating homeownership
Diverse demand drivers providing attractive tailwinds for Griffon
Stay-at-home trends, Millennials reaching peak household formation age, and a shift to suburban / rural areas driving repair and remodel
Growing interest in outdoor living driving homeowner investment
Low interest rate environment continuing to bolster home buying
Baby boomer population reaching retirement, and new Millennial participation, driving growth in the lawn and garden market
Heightened interest in domestic manufacturing / supply chains
Defense spending remains a priority in the global security environment
Installed product base provides path for upgrades and retrofits with next-generation defense technology
(50%)(25%)
0%25%50%75%
100% Lawn and Garden Outdoor Living
Consumer search trends (Y/Y % change, 4-week average)
Copyright © 2021 Griffon Corporation. All rights reserved. 20
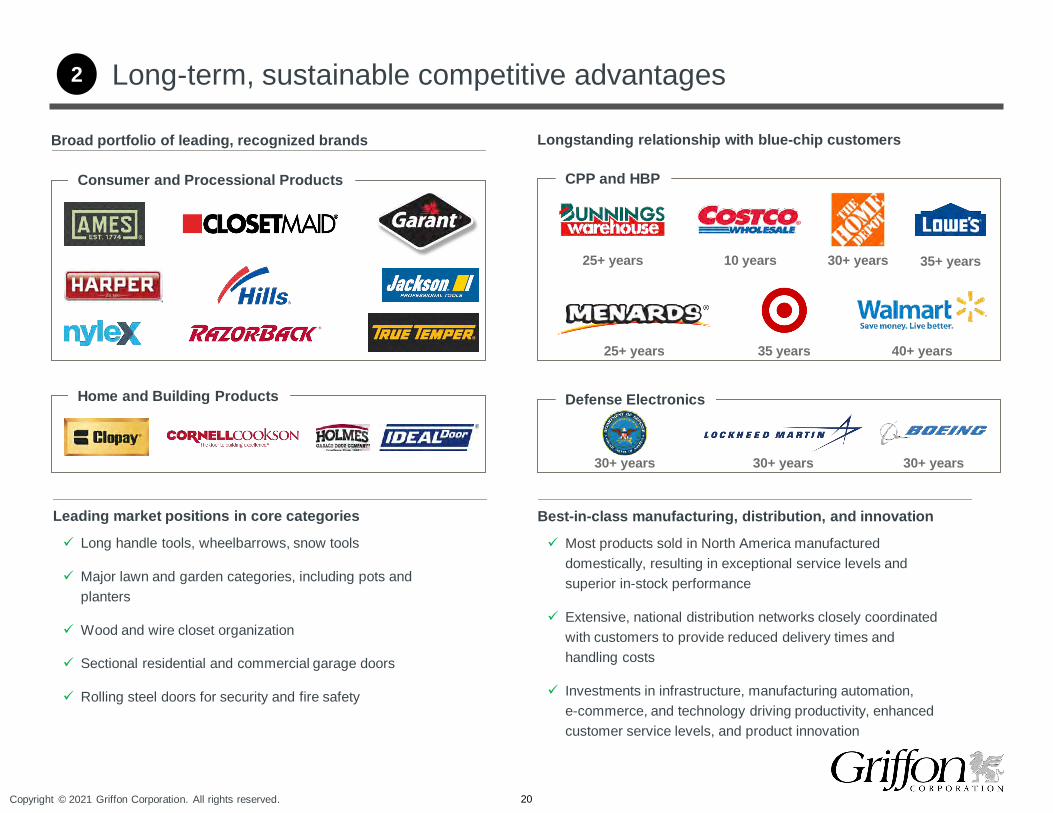
Long-term, sustainable competitive advantages
Longstanding relationship with blue-chip customersBroad portfolio of leading, recognized brands
30+ years
25+ years
35+ years
40+ years35 years
10 years
30+ years 30+ years 30+ years
25+ years
Long handle tools, wheelbarrows, snow tools
Major lawn and garden categories, including pots and planters
Wood and wire closet organization
Sectional residential and commercial garage doors
Rolling steel doors for security and fire safety
Leading market positions in core categories
Most products sold in North America manufactured domestically, resulting in exceptional service levels and superior in-stock performance
Extensive, national distribution networks closely coordinated with customers to provide reduced delivery times and handling costs
Investments in infrastructure, manufacturing automation,e-commerce, and technology driving productivity, enhanced customer service levels, and product innovation
Best-in-class manufacturing, distribution, and innovation
2
Home and Building Products
Consumer and Processional Products
Defense Electronics
CPP and HBP
Copyright © 2021 Griffon Corporation. All rights reserved. 21
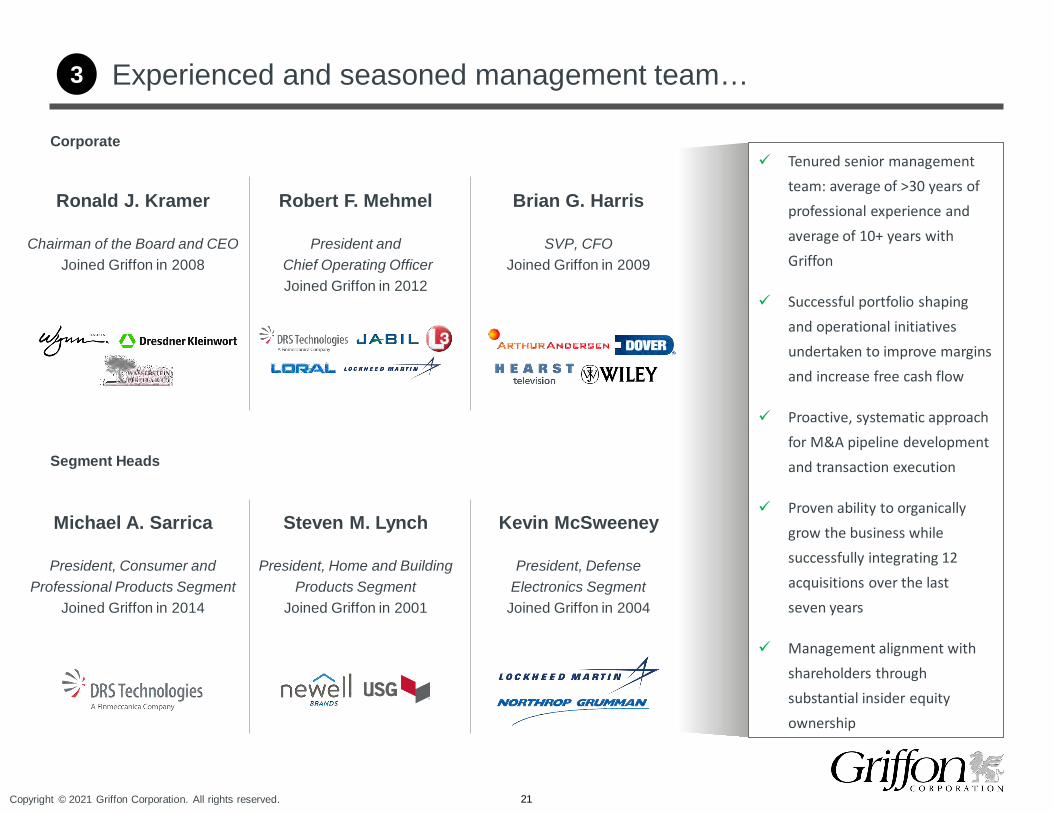
3 Experienced and seasoned management team…
Michael A. Sarrica
President, Consumer and Professional Products Segment
Joined Griffon in 2014
Ronald J. Kramer
Chairman of the Board and CEOJoined Griffon in 2008
Robert F. Mehmel
President andChief Operating OfficerJoined Griffon in 2012
Steven M. Lynch
President, Home and Building Products Segment
Joined Griffon in 2001
Brian G. Harris
SVP, CFOJoined Griffon in 2009
Kevin McSweeney
President, Defense Electronics Segment
Joined Griffon in 2004
Tenured senior management team: average of >30 years of professional experience and average of 10+ years with Griffon
Successful portfolio shaping and operational initiatives undertaken to improve margins and increase free cash flow
Proactive, systematic approach for M&A pipeline development and transaction execution
Proven ability to organically grow the business while successfully integrating 12 acquisitions over the last seven years
Management alignment with shareholders through substantial insider equity ownership
Corporate
Segment Heads
Copyright © 2021 Griffon Corporation. All rights reserved. 22
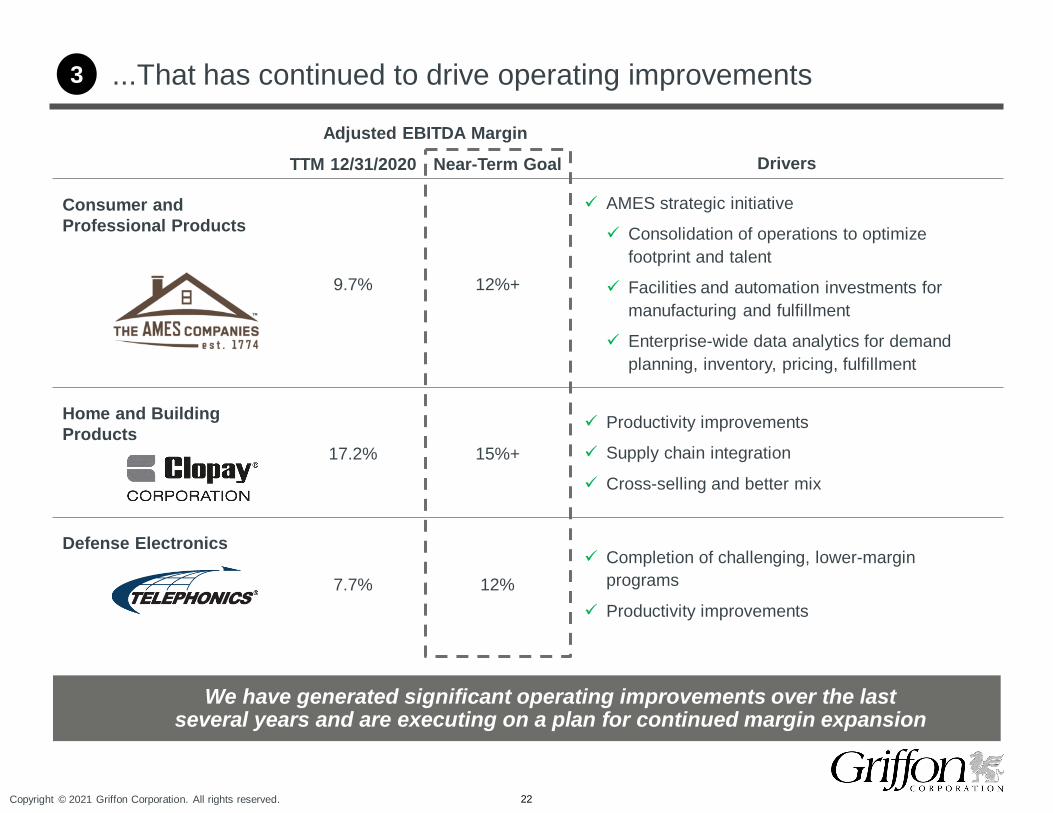
...That has continued to drive operating improvements3
Adjusted EBITDA Margin
TTM 12/31/2020 Near-Term Goal Drivers
Consumer and Professional Products
9.7% 12%+
AMES strategic initiative
Consolidation of operations to optimize footprint and talent
Facilities and automation investments for manufacturing and fulfillment
Enterprise-wide data analytics for demand planning, inventory, pricing, fulfillment
Home and Building Products
17.2% 15%+
Productivity improvements
Supply chain integration
Cross-selling and better mix
Defense Electronics
7.7% 12% Completion of challenging, lower-margin
programs
Productivity improvements
We have generated significant operating improvements over the last several years and are executing on a plan for continued margin expansion
Copyright © 2021 Griffon Corporation. All rights reserved. 23
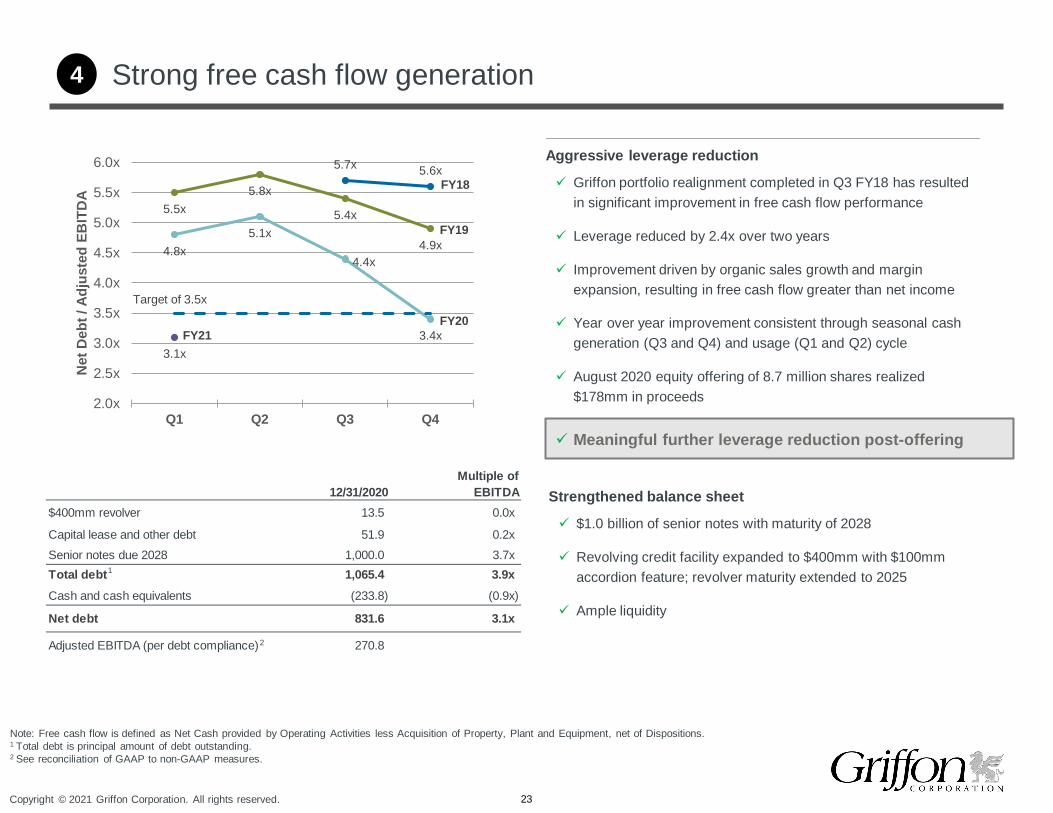
Multiple of12/31/2020 EBITDA
$400mm revolver 13.5 0.0x
Capital lease and other debt 51.9 0.2xSenior notes due 2028 1,000.0 3.7xTotal debt 1,065.4 3.9xCash and cash equivalents (233.8) (0.9x)
Net debt 831.6 3.1x
Adjusted EBITDA (per debt compliance) 270.8
Strong free cash flow generation4
5.7x 5.6x
5.5x5.8x
5.4x
4.9x4.8x5.1x
4.4x
3.4x3.1x
2.0x
2.5x
3.0x
3.5x
4.0x
4.5x
5.0x
5.5x
6.0x
Q1 Q2 Q3 Q4
Net
Deb
t / A
djus
ted
EBIT
DA
Griffon portfolio realignment completed in Q3 FY18 has resulted in significant improvement in free cash flow performance
Leverage reduced by 2.4x over two years
Improvement driven by organic sales growth and margin expansion, resulting in free cash flow greater than net income
Year over year improvement consistent through seasonal cash generation (Q3 and Q4) and usage (Q1 and Q2) cycle
August 2020 equity offering of 8.7 million shares realized $178mm in proceeds
Aggressive leverage reduction
FY18
FY19
FY20Target of 3.5x
$1.0 billion of senior notes with maturity of 2028
Revolving credit facility expanded to $400mm with $100mm accordion feature; revolver maturity extended to 2025
Ample liquidity
Strengthened balance sheet
Meaningful further leverage reduction post-offering
Note: Free cash flow is defined as Net Cash provided by Operating Activities less Acquisition of Property, Plant and Equipment, net of Dispositions.1 Total debt is principal amount of debt outstanding.2 See reconciliation of GAAP to non-GAAP measures.
2
1
FY21
Copyright © 2021 Griffon Corporation. All rights reserved. 24
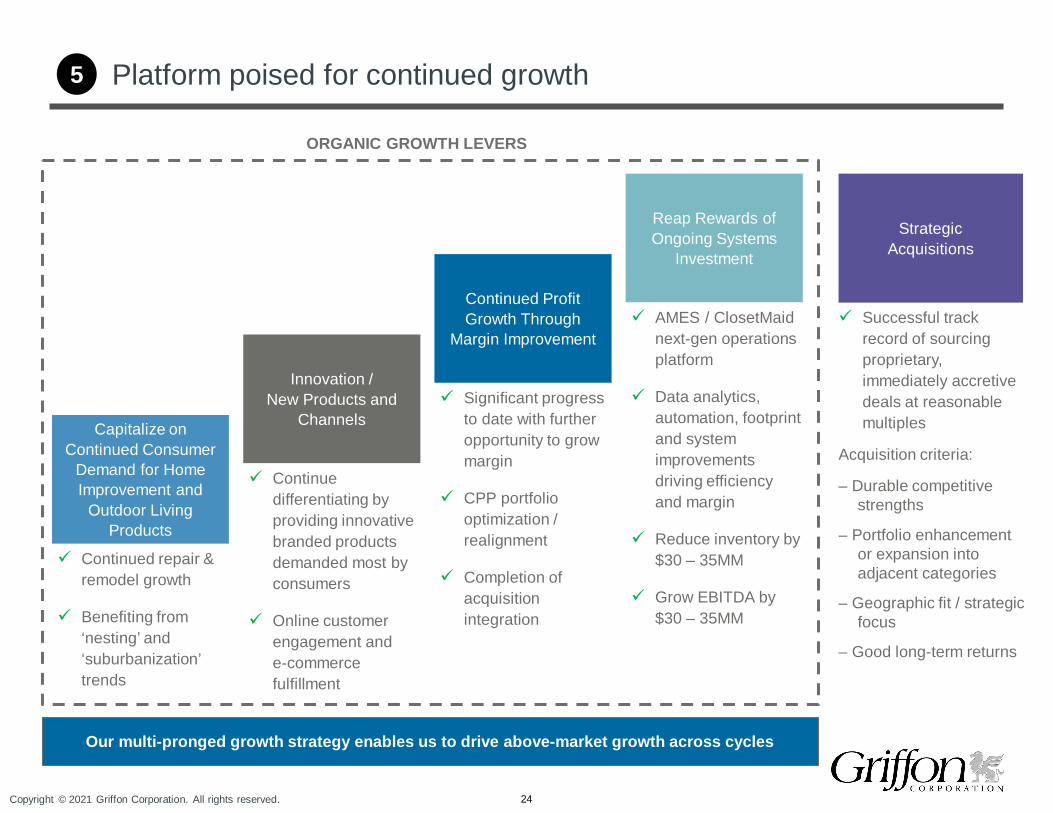
Platform poised for continued growth5
Capitalize on Continued Consumer
Demand for Home Improvement and
Outdoor Living Products
Continued repair & remodel growth
Benefiting from ‘nesting’ and ‘suburbanization’ trends
Innovation / New Products and
Channels
Continue differentiating by providing innovative branded products demanded most by consumers
Online customer engagement ande-commerce fulfillment
Continued Profit Growth Through
Margin Improvement
Significant progress to date with further opportunity to grow margin
CPP portfolio optimization / realignment
Completion of acquisition integration
Reap Rewards of Ongoing Systems
Investment
AMES / ClosetMaid next-gen operations platform
Data analytics, automation, footprint and system improvements driving efficiency and margin
Reduce inventory by $30 – 35MM
Grow EBITDA by $30 – 35MM
Strategic Acquisitions
ORGANIC GROWTH LEVERS
Our multi-pronged growth strategy enables us to drive above-market growth across cycles
Successful track record of sourcing proprietary, immediately accretive deals at reasonable multiples
Acquisition criteria:
– Durable competitive strengths
– Portfolio enhancement or expansion into adjacent categories
– Geographic fit / strategic focus
– Good long-term returns
Q1 2021 Update
26
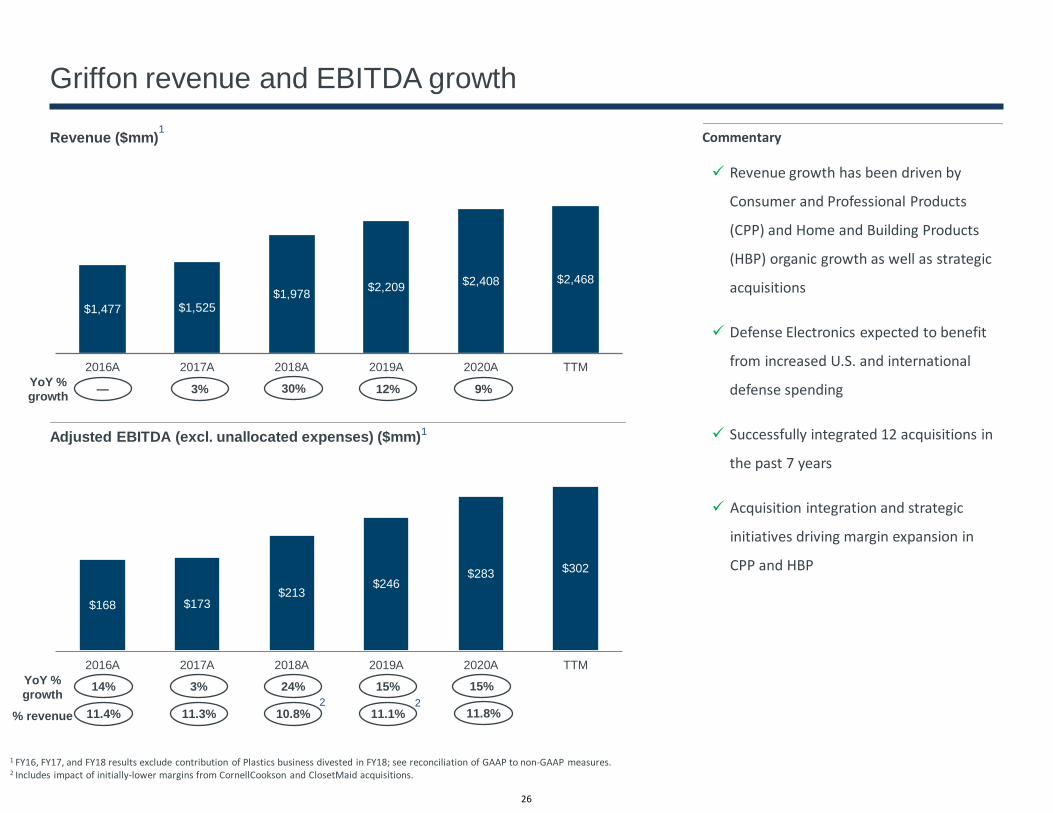
$1,477 $1,525$1,978 $2,209 $2,408 $2,468
2016A 2017A 2018A 2019A 2020A TTM
$168 $173 $213
$246 $283 $302
2016A 2017A 2018A 2019A 2020A TTM
Griffon revenue and EBITDA growth
Revenue ($mm)
Adjusted EBITDA (excl. unallocated expenses) ($mm)
Commentary
YoY % growth 3%14% 24%
% revenue 11.3%11.4% 10.8%
YoY % growth 3%— 30%
11.1%
Revenue growth has been driven by
Consumer and Professional Products
(CPP) and Home and Building Products
(HBP) organic growth as well as strategic
acquisitions
Defense Electronics expected to benefit
from increased U.S. and international
defense spending
Successfully integrated 12 acquisitions in
the past 7 years
Acquisition integration and strategic
initiatives driving margin expansion in
CPP and HBP
12%
15%
11.8%
1 FY16, FY17, and FY18 results exclude contribution of Plastics business divested in FY18; see reconciliation of GAAP to non-GAAP measures.2 Includes impact of initially-lower margins from CornellCookson and ClosetMaid acquisitions.
22
1
1
9%
15%

Copyright © 2021 Griffon Corporation. All rights reserved. 27
$548$609
$241 $291
$241$250
$66$68
Q1 FY20 Q1 FY21
CPP HBP Defense Electronics
Q1 FY 2021 financial update
Commentary
Revenue increased 11% and Adjusted EBITDA before unallocated expenses increased 29% in Q1 2021 vs. prior year
Consumer and Professional Products (CPP) revenue increased 21% driven by continued consumer demand for home improvement initiatives across all geographies, early U.S. spring orders, contribution from the Apta acquisition, and favorable foreign exchange; Adjusted EBITDA increased 49% driven by increased revenue and partially offset by COVID-19 related inefficiencies
Home and Building Products (HBP) revenue increased 4% from increased volume partially offset by unfavorable mix; Adjusted EBITDA improved 19%due to increased revenue, partially offset by COVID-19 related inefficiencies
Defense Electronics revenue increased 3% driven by increased volume for multi-mode airborne maritime surveillance systems, partially offset by the timing of work in certain other programs; Adjusted EBITDA increased 25% driven by increased revenue and reduced headcount, partially offset by the timing of research and development expenditures; backlog was $388 million at quarter end with trailing 12-month book to bill of 1.1x
$67
$87
$22$33
$41
$48$4
$6
Q1 FY20 Q1 FY21
CPP HBP Defense Electronics
Revenue ($mm)
Adjusted EBITDA (excl. unallocated expenses) ($mm)1
% sales 14.2%12.2%
+4%
+21%
+25%
+49%
+3%
+19%
1 See reconciliation of GAAP to non-GAAP measures.Note sum of segment data may not match total due to rounding.
Copyright © 2021 Griffon Corporation. All rights reserved. 28
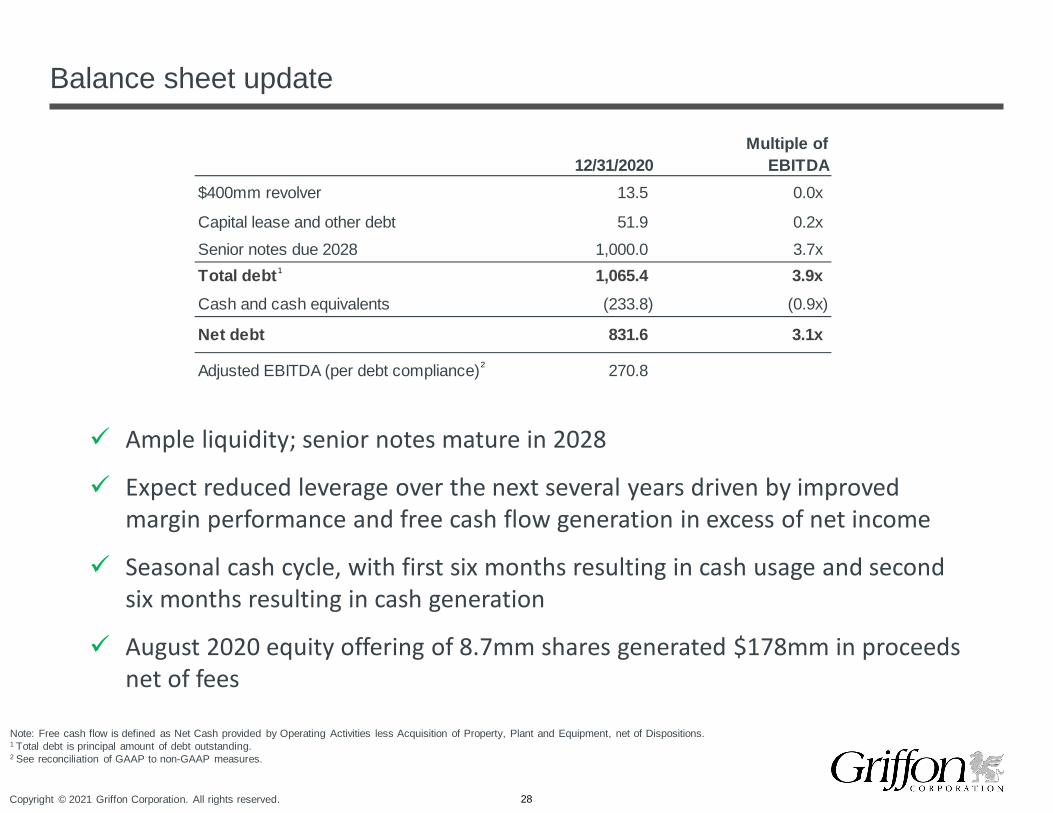
Balance sheet update
Ample liquidity; senior notes mature in 2028
Expect reduced leverage over the next several years driven by improved margin performance and free cash flow generation in excess of net income
Seasonal cash cycle, with first six months resulting in cash usage and second six months resulting in cash generation
August 2020 equity offering of 8.7mm shares generated $178mm in proceeds net of fees
Note: Free cash flow is defined as Net Cash provided by Operating Activities less Acquisition of Property, Plant and Equipment, net of Dispositions.1 Total debt is principal amount of debt outstanding.2 See reconciliation of GAAP to non-GAAP measures.
1
2
Multiple of12/31/2020 EBITDA
$400mm revolver 13.5 0.0x
Capital lease and other debt 51.9 0.2xSenior notes due 2028 1,000.0 3.7xTotal debt 1,065.4 3.9xCash and cash equivalents (233.8) (0.9x)
Net debt 831.6 3.1x
Adjusted EBITDA (per debt compliance) 270.8
Copyright © 2021 Griffon Corporation. All rights reserved. 29
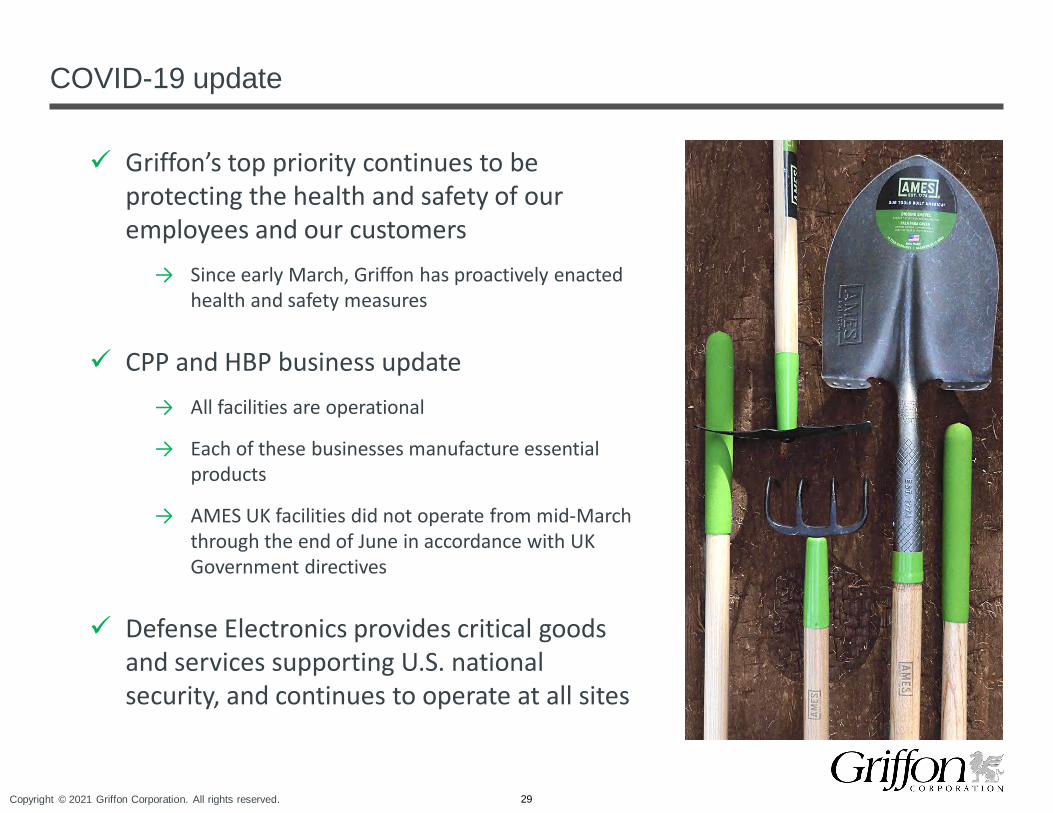
COVID-19 update
Griffon’s top priority continues to be protecting the health and safety of our employees and our customers
→ Since early March, Griffon has proactively enacted health and safety measures
CPP and HBP business update→ All facilities are operational
→ Each of these businesses manufacture essential products
→ AMES UK facilities did not operate from mid-March through the end of June in accordance with UK Government directives
Defense Electronics provides critical goods and services supporting U.S. national security, and continues to operate at all sites

Reconciliations
Copyright © 2021 Griffon Corporation. All rights reserved. 31
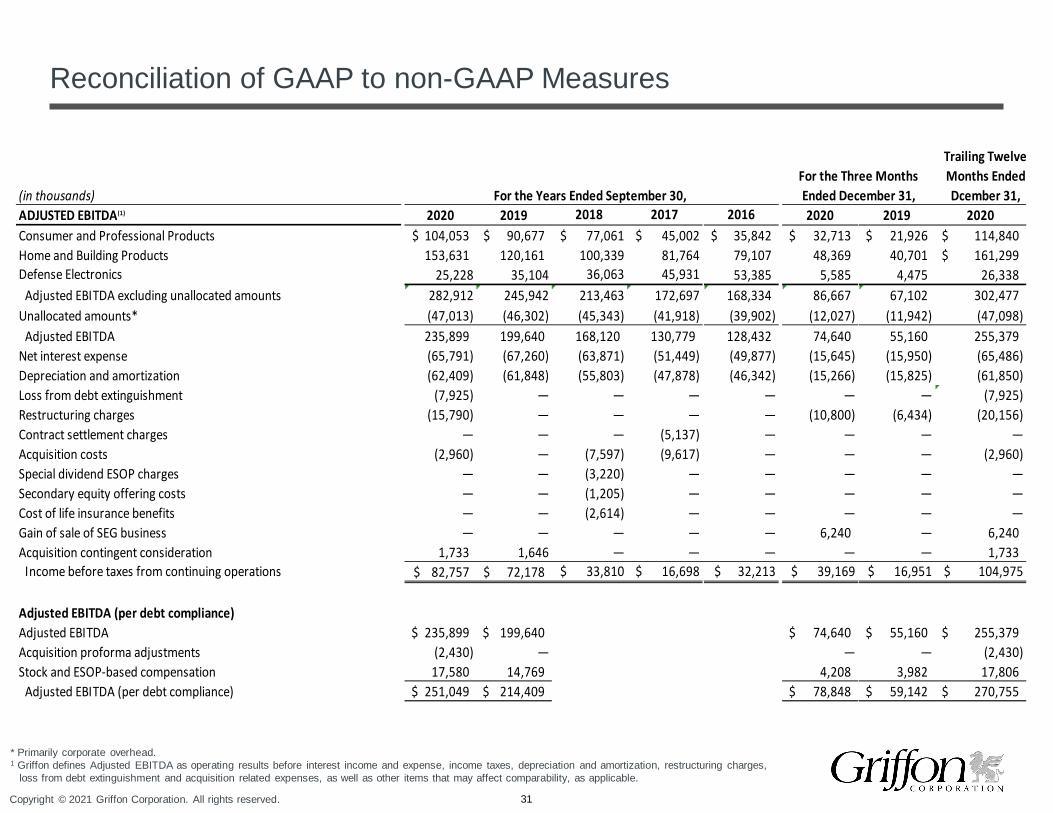
Reconciliation of GAAP to non-GAAP Measures
* Primarily corporate overhead.1 Griffon defines Adjusted EBITDA as operating results before interest income and expense, income taxes, depreciation and amortization, restructuring charges,
loss from debt extinguishment and acquisition related expenses, as well as other items that may affect comparability, as applicable.
(in thousands) For the Years Ended September 30, For the Three Months Ended December 31,
Trailing Twelve Months Ended Dcember 31,
ADJUSTED EBITDA(1) 2020 2019 2018 2017 2016 2020 2019 2020Consumer and Professional Products 104,053$ 90,677$ $ 77,061 $ 45,002 35,842$ 32,713$ 21,926$ 114,840$ Home and Building Products 153,631 120,161 100,339 81,764 79,107 48,369 40,701 161,299$ Defense Electronics 25,228 35,104 36,063 45,931 53,385 5,585 4,475 26,338
Adjusted EBITDA excluding unallocated amounts 282,912 245,942 213,463 172,697 168,334 86,667 67,102 302,477 Unallocated amounts* (47,013) (46,302) (45,343) (41,918) (39,902) (12,027) (11,942) (47,098)
Adjusted EBITDA 235,899 199,640 168,120 130,779 128,432 74,640 55,160 255,379 Net interest expense (65,791) (67,260) (63,871) (51,449) (49,877) (15,645) (15,950) (65,486) Depreciation and amortization (62,409) (61,848) (55,803) (47,878) (46,342) (15,266) (15,825) (61,850) Loss from debt extinguishment (7,925) — — — — — — (7,925) Restructuring charges (15,790) — — — — (10,800) (6,434) (20,156) Contract settlement charges — — — (5,137) — — — —Acquisition costs (2,960) — (7,597) (9,617) — — — (2,960) Special dividend ESOP charges — — (3,220) — — — — —Secondary equity offering costs — — (1,205) — — — — —Cost of life insurance benefits — — (2,614) — — — — —Gain of sale of SEG business — — — — — 6,240 — 6,240 Acquisition contingent consideration 1,733 1,646 — — — — — 1,733
Income before taxes from continuing operations 82,757$ 72,178$ $ 33,810 $ 16,698 $ 32,213 $ 39,169 $ 16,951 $ 104,975
Adjusted EBITDA (per debt compliance)Adjusted EBITDA 235,899$ 199,640$ 74,640$ 55,160$ 255,379$ Acquisition proforma adjustments (2,430) — — — (2,430) Stock and ESOP-based compensation 17,580 14,769 4,208 3,982 17,806
Adjusted EBITDA (per debt compliance) 251,049$ 214,409$ 78,848$ 59,142$ 270,755$

Copyright © 2021 Griffon Corporation. All rights reserved. 32
Reconciliation of GAAP to non-GAAP Measures - Continued
Trailing Twelve(in thousands) Months EndedFREE CASH FLOW December 31,
2020 2019 2018 2017 2016 2020 2019 2020
Net cash provided by operating activities - continuing operations 137,029$ 113,958$ 58,192$ 49,151$ 80,118$ 20,829$ (18,169)$ 176,027$ Acquistion of property, plant and equipment (48,998) (45,361) (50,138) (34,937) (59,276) (11,926) (13,172) (47,752) Proceeds from the sale of property, plant and equipment 352 280 663 143 770 53 184 221
Free cash flow 88,383$ 68,877$ 8,717$ 14,357$ 21,612$ 8,956$ (31,157)$ 128,496$
Three Months Ended December 31,For the Years Ended September 30,

Copyright © 2021 Griffon Corporation. All rights reserved.