35
ERICSSON FIRST QUARTER REPORT 2013
ERICSSON FIRST QUARTER REPORT 2013

Ericsson First Quarter Report 2013 1
Ericsson first quarter report 2013
APRIL 24, 2013
FIRST QUARTER HIGHLIGHTS
Sales in the quarter were SEK 52.0 b. For comparable
units and adjusted for FX and hedging, sales increased
7% YoY and declined -19% QoQ.
Operating income incl. JV was SEK 2.1 b. with an
operating margin of 4.0%. Excluding the restructuring
charges related to the reduction of operations in Sweden
of SEK 1.4 b. the margin amounted to 6.7%. Last year’s
margin of 17.8% was positively impacted by a gain of
SEK 7.7 b. from the divestment of Sony Ericsson.
Net income was SEK 1.2 (8.8) b.
EPS diluted was SEK 0.37 (2.76). EPS Non-IFRS was
SEK 0.99 (3.14).
Cash flow from operating activities was SEK -3.0 b. primarily driven by higher working capital.
Net cash decreased by SEK -6.3 b. QoQ to SEK 32.2 b. mainly due to negative operating cash flow and
reclassification of Swedish special payroll taxes of SEK 1.8 b. from Other current liabilities to Pension liabilities.
CONTENTS
3 Financial highlights
5 Segment results
9 Regional sales overview
11 Parent Company information
12 Other information
13 Assessment of risk environment
14 Editor’s note
15 Safe harbor statement
16 Financial statements and
additional information
SEK b.
Q1
2013
Q1
20122)
YoY
Change
Q4
2012
QoQ
Change
Net sales 52.0 51.0 2% 66.9 -22%
Of which Networks 28.1 27.3 3% 35.3 -20%
Of which Global Services 21.5 20.6 4% 28.0 -24%
Of which Support Solutions 2.4 3.0 -19% 3.6 -33%
Gross margin 32.0% 33.3% - 31.1% -
Operating income excl JV 2.1 10.5 -80% 4.8 -55%
Operating margin excl JV 4.1% 20.6% - 7.1% -
Of which Networks 6% 6% - 8% -
Of which Global Services 3% 6% - 6% -
Of which Support Solutions -1% -1% - 8% -
Operating income incl JV 2.1 9.1 -77% -3.8 -
Operating margin incl JV 4.0% 17.8% - -5.7% -
Net income 1.2 8.8 -86% -6.3 -
EPS diluted, SEK 0.37 2.76 -87% -1.99 -
EPS (Non-IFRS), SEK1) 0.99 3.14 -68% -1.40 -
Cash flow from operating activities -3.0 0.7 - 15.7 -
Net cash, end of period 32.2 37.1 -13% 38.5 -16% 1)
EPS, diluted, excl. amortizations, write-downs of acquired intangible assets, and restructuring 2)
Q1 2012 includes a gain from the divestment of Sony Ericsson of SEK 7.7 b.
Ericsson First Quarter Report 2013 2
Comments from Hans vestberg, president and ceo
“Sales showed positive development in the quarter
with a growth of 2% YoY, despite currency headwind.
Sales for comparable units, adjusted for FX and
hedging, grew 7%,” said Hans Vestberg, President
and CEO of Ericsson (NASDAQ:ERIC).
“The sales increase was primarily driven by Networks
and rollout services, following high project activities
primarily in Europe and North America. North America
remained the strongest region and showed a growth
of 23% despite the decline in CDMA. North East Asia
had a challenging quarter with lower sales in South
Korea, which remains one of the most advanced LTE
markets but without parallel 3G deployments as in
Q112, continued structural decline in GSM
investments in China and FX effects in Japan.
Looking at the areas of portfolio momentum, we see
continued good development in Managed Services
with 21 new contracts signed during the quarter.
Within the Mobile Broadband area, the vendor
selection processes for 4G/LTE in Russia and
China have been initiated. We also see continued
momentum for our SSR routing platform with 12
new contracts in the quarter. Within OSS and BSS
demand continued to be strong.
At the Mobile World Congress (MWC) in Barcelona
the trends in focus verify our belief that the
Networked Society is coming to life. The growth in
data traffic and video in the networks drives demand
for mobile broadband and OSS and BSS. Other key
topics at the MWC were software defined networks,
cloud and machine-to-machine communications that
will all be part of shaping the industry for the coming
years.
Profitability improved YoY, adjusted for the
restructuring charges related to the reduction of
operations in Sweden concluded in Q1 and last year’s
gain from the divestment of Sony Ericsson.
The improvement is mainly due to higher sales in
Networks and a continued reduction in operating
expenses, offset by negative operating income in
Network Rollout and negative FX effects.
The underlying business mix, with a higher share of
coverage projects than capacity projects, continued
as anticipated during the quarter. With present
visibility of customer demand, and current global
economic development, we continue to believe that
the underlying business mix will start to gradually shift
towards more capacity projects during the second
half of 2013.
We continue to execute on our strategy. During the
quarter we announced the way forward for our JV
ST-Ericsson and in April 2013 we announced our
intention to acquire Microsoft’s Mediaroom to
strengthen our media position.
While macroeconomic and political uncertainty
continues in certain regions, the long-term
fundamentals in the industry remain attractive and
we are well positioned to continue to support our
customers in a transforming ICT market,” concludes
Vestberg.
Ericsson First Quarter Report 2013 3
Financial highlights – first quarter
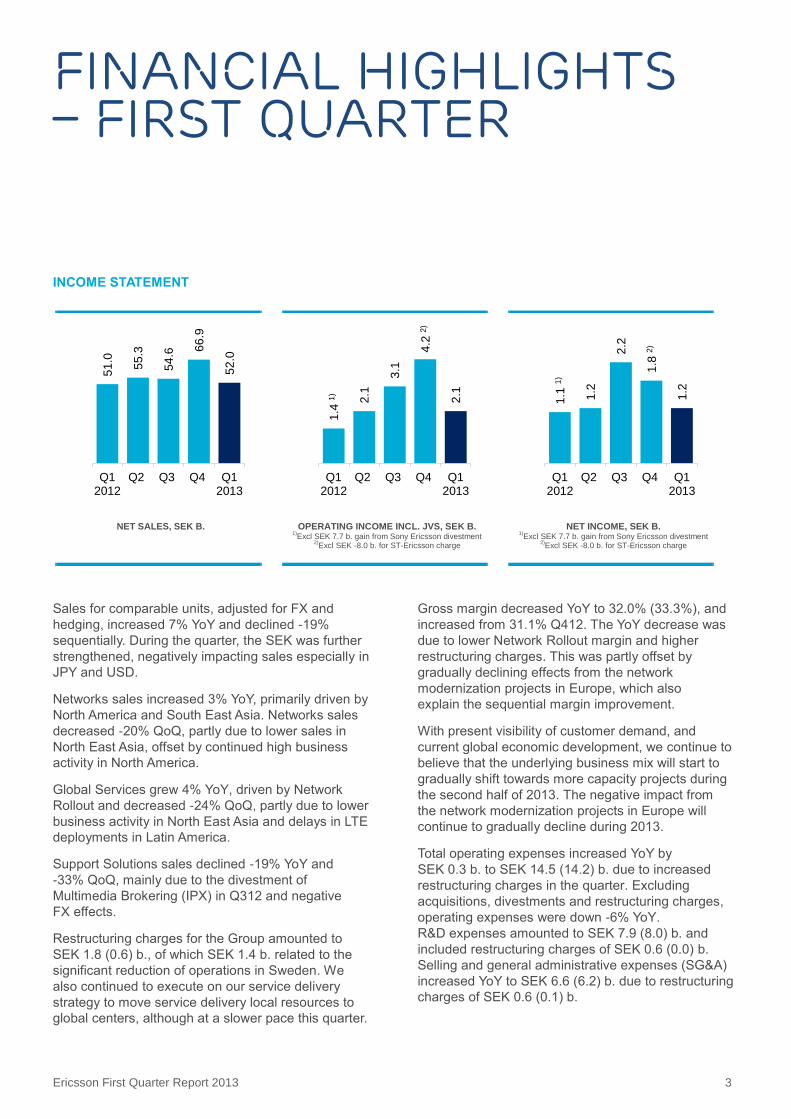
INCOME STATEMENT
NET SALES, SEK B.
OPERATING INCOME INCL. JVS, SEK B. 1)
Excl SEK 7.7 b. gain from Sony Ericsson divestment 2)
Excl SEK -8.0 b. for ST-Ericsson charge
NET INCOME, SEK B. 1)
Excl SEK 7.7 b. gain from Sony Ericsson divestment 2)
Excl SEK -8.0 b. for ST-Ericsson charge
Sales for comparable units, adjusted for FX and
hedging, increased 7% YoY and declined -19%
sequentially. During the quarter, the SEK was further
strengthened, negatively impacting sales especially in
JPY and USD.
Networks sales increased 3% YoY, primarily driven by
North America and South East Asia. Networks sales
decreased -20% QoQ, partly due to lower sales in
North East Asia, offset by continued high business
activity in North America.
Global Services grew 4% YoY, driven by Network
Rollout and decreased -24% QoQ, partly due to lower
business activity in North East Asia and delays in LTE
deployments in Latin America.
Support Solutions sales declined -19% YoY and
-33% QoQ, mainly due to the divestment of
Multimedia Brokering (IPX) in Q312 and negative
FX effects.
Restructuring charges for the Group amounted to
SEK 1.8 (0.6) b., of which SEK 1.4 b. related to the
significant reduction of operations in Sweden. We
also continued to execute on our service delivery
strategy to move service delivery local resources to
global centers, although at a slower pace this quarter.
Gross margin decreased YoY to 32.0% (33.3%), and
increased from 31.1% Q412. The YoY decrease was
due to lower Network Rollout margin and higher
restructuring charges. This was partly offset by
gradually declining effects from the network
modernization projects in Europe, which also
explain the sequential margin improvement.
With present visibility of customer demand, and
current global economic development, we continue to
believe that the underlying business mix will start to
gradually shift towards more capacity projects during
the second half of 2013. The negative impact from
the network modernization projects in Europe will
continue to gradually decline during 2013.
Total operating expenses increased YoY by
SEK 0.3 b. to SEK 14.5 (14.2) b. due to increased
restructuring charges in the quarter. Excluding
acquisitions, divestments and restructuring charges,
operating expenses were down -6% YoY.
R&D expenses amounted to SEK 7.9 (8.0) b. and
included restructuring charges of SEK 0.6 (0.0) b.
Selling and general administrative expenses (SG&A)
increased YoY to SEK 6.6 (6.2) b. due to restructuring
charges of SEK 0.6 (0.1) b.
51
.0
55
.3
54
.6 66
.9
52
.0
Q12012
Q2 Q3 Q4 Q12013
1.4
1)
2.1
3.1
4.2
2)
2.1
Q12012
Q2 Q3 Q4 Q12013
1.1
1)
1.2
2.2
1.8
2)
1.2
Q12012
Q2 Q3 Q4 Q12013
Ericsson First Quarter Report 2013 4
Other operating income and expenses amounted to
SEK 0.0 (7.7) b. Last year’s divestment of Sony
Ericsson resulted in a gain of SEK 7.7 b. In the
quarter we changed the hedge accounting for new
hedges made 2013 and onwards (see Accounting
Policies). The hedge effect on other operating income
was SEK -0.1 b.
Ericsson’s share in ST-Ericsson’s income before tax
was SEK 0.0 (-1.4) b.
Operating income, including JV, decreased to
SEK 2.1 (9.1) b. mainly due to restructuring charges
relating to the reduction of operations in Sweden and
high 2012 comparison due to the gain related to the
divestment of Sony Ericsson. Operating income was
also negatively impacted by FX effects both YoY and
QoQ. Operating margin including JV was 4.0%
(17.8%).
Financial net amounted to SEK -0.4 (0.0) b. and
decreased QoQ from SEK -0.1 b. mainly due to lower
interest income and currency revaluation effects
including impact from devaluation in Venezuela. Tax
costs were SEK -0.5 (-0.3) b.
Net income decreased to SEK 1.2 (8.8) b. following
the decline in operating income.
EPS diluted was SEK 0.37 (2.76). EPS Non-IFRS
excluding the gain from divestment of Sony Ericsson
in Q112 was SEK 0.99 (0.77).
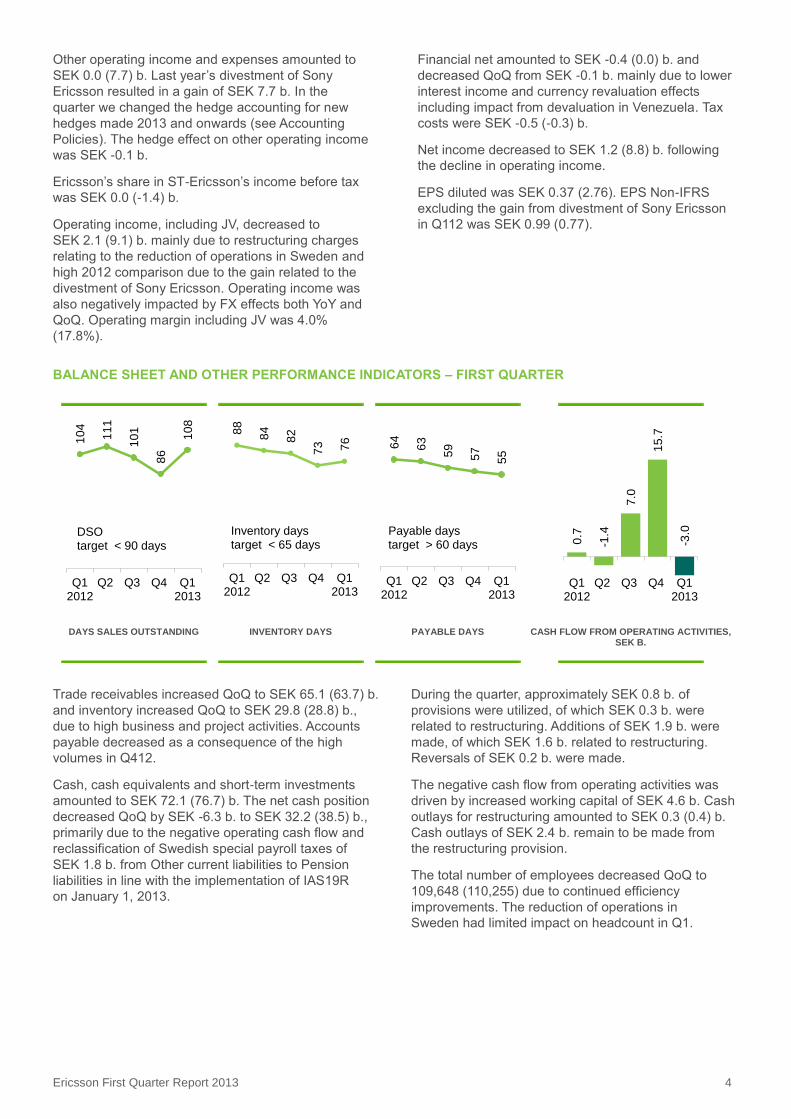
BALANCE SHEET AND OTHER PERFORMANCE INDICATORS – FIRST QUARTER
DAYS SALES OUTSTANDING INVENTORY DAYS PAYABLE DAYS CASH FLOW FROM OPERATING ACTIVITIES, SEK B.
Trade receivables increased QoQ to SEK 65.1 (63.7) b.
and inventory increased QoQ to SEK 29.8 (28.8) b.,
due to high business and project activities. Accounts
payable decreased as a consequence of the high
volumes in Q412.
Cash, cash equivalents and short-term investments
amounted to SEK 72.1 (76.7) b. The net cash position
decreased QoQ by SEK -6.3 b. to SEK 32.2 (38.5) b.,
primarily due to the negative operating cash flow and
reclassification of Swedish special payroll taxes of
SEK 1.8 b. from Other current liabilities to Pension
liabilities in line with the implementation of IAS19R
on January 1, 2013.
During the quarter, approximately SEK 0.8 b. of
provisions were utilized, of which SEK 0.3 b. were
related to restructuring. Additions of SEK 1.9 b. were
made, of which SEK 1.6 b. related to restructuring.
Reversals of SEK 0.2 b. were made.
The negative cash flow from operating activities was
driven by increased working capital of SEK 4.6 b. Cash
outlays for restructuring amounted to SEK 0.3 (0.4) b.
Cash outlays of SEK 2.4 b. remain to be made from
the restructuring provision.
The total number of employees decreased QoQ to
109,648 (110,255) due to continued efficiency
improvements. The reduction of operations in
Sweden had limited impact on headcount in Q1.
10
4
11
1
10
1
86
10
8
Q12012
Q2 Q3 Q4 Q12013
DSO target < 90 days
88
84
82
73
76
Q12012
Q2 Q3 Q4 Q12013
Inventory days target < 65 days
64
63
59
57
55
Q12012
Q2 Q3 Q4 Q12013
Payable days target > 60 days 0
.7
-1.4
7.0
15
.7
-3.0
Q12012
Q2 Q3 Q4 Q12013

Ericsson First Quarter Report 2013 5
Segment results
NETWORKS
SEGMENT SALES, SEK B. QUARTERLY SALES, SEK B. OPERATING INCOME, SEK B., AND OPERATING MARGIN, PERCENT
SEK b.
Q1
2013
Q1
2012
YoY
Change
Q4
2012
QoQ
Change
Network sales 28.1 27.3 3% 35.3 -20%
Operating income 1.6 1.6 -5% 2.8 -44%
Operating margin 6% 6% - 8% -
Sales for comparable units, adjusted for FX and
hedging, increased 7% YoY supported by high mobile
broadband deployment levels in the US and
Indonesia. The structural decline in CDMA continued
with -42% in the quarter to SEK 1.3 b. Sales declined
QoQ due to the continued structural decline of GSM
sales in China as well as declining sales in Japan,
mainly due to FX effects. The business activity in
North America remained high in the quarter.
The operator focus on monetizing their increasing
data traffic is driving demand for mobile broadband
including our 4th Generation IP solutions. There is
good momentum for the SSR routing platform with
51 contracts signed since launch in December 2011,
of which 12 new contracts were signed in Q1 2013.
The worldwide LTE radio access deployments
continue to drive demand also for HSPA, packet core
networks and VoLTE. In early February, Ericsson
signed its 100th Evolved Packet Core (EPC) contract.
We see a trend of higher adoption rate for software
features as operators aim for differentiated services,
higher network performance and increase their focus
on cost effectiveness.
Operating margin was flat YoY, negatively impacted
by restructuring charges related to reductions of
operations in Sweden. Total restructuring charges in
the quarter were SEK 1.3 (0.1) b. The operating
margin decline QoQ was due to lower sales volumes.
This was partly offset by reduced underlying
operating expenses and the gradually decreasing
negative effect from the network modernization
projects in Europe.
28.1
21.5
2.4
Networks
Global Services
Support Solutions
27
.3
27
.8
26
.9 35
.3
28
.1
Q12012
Q2 Q3 Q4 Q12013
1.6
1.3
1.3
2.8
1.6
6%
5%
5%
8%
6%
Q12012
Q2 Q3 Q4 Q12013
Ericsson First Quarter Report 2013 6
GLOBAL SERVICES
SEGMENT SALES, SEK B. QUARTERLY SALES, SEK B. OPERATING INCOME, SEK B., AND OPERATING MARGIN, PERCENT
SEK b.
Q1
2013
Q1
2012
YoY
Change
Q4
2012
QoQ
Change
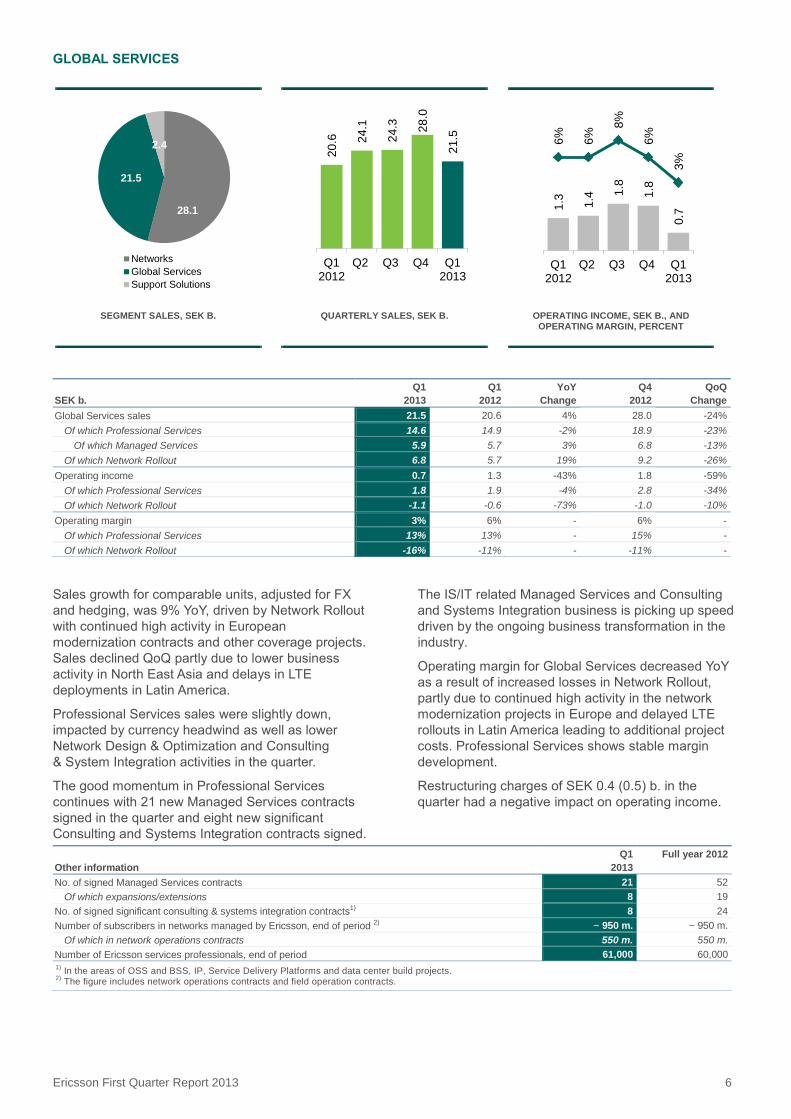
Global Services sales 21.5 20.6 4% 28.0 -24%
Of which Professional Services 14.6 14.9 -2% 18.9 -23%
Of which Managed Services 5.9 5.7 3% 6.8 -13%
Of which Network Rollout 6.8 5.7 19% 9.2 -26%
Operating income 0.7 1.3 -43% 1.8 -59%
Of which Professional Services 1.8 1.9 -4% 2.8 -34%
Of which Network Rollout -1.1 -0.6 -73% -1.0 -10%
Operating margin 3% 6% - 6% -
Of which Professional Services 13% 13% - 15% -
Of which Network Rollout -16% -11% - -11% -
Sales growth for comparable units, adjusted for FX
and hedging, was 9% YoY, driven by Network Rollout
with continued high activity in European
modernization contracts and other coverage projects.
Sales declined QoQ partly due to lower business
activity in North East Asia and delays in LTE
deployments in Latin America.
Professional Services sales were slightly down,
impacted by currency headwind as well as lower
Network Design & Optimization and Consulting
& System Integration activities in the quarter.
The good momentum in Professional Services
continues with 21 new Managed Services contracts
signed in the quarter and eight new significant
Consulting and Systems Integration contracts signed.
The IS/IT related Managed Services and Consulting
and Systems Integration business is picking up speed
driven by the ongoing business transformation in the
industry.
Operating margin for Global Services decreased YoY
as a result of increased losses in Network Rollout,
partly due to continued high activity in the network
modernization projects in Europe and delayed LTE
rollouts in Latin America leading to additional project
costs. Professional Services shows stable margin
development.
Restructuring charges of SEK 0.4 (0.5) b. in the
quarter had a negative impact on operating income.
Other information
Q1
2013
Full year 2012
No. of signed Managed Services contracts 21 52
Of which expansions/extensions 8 19
No. of signed significant consulting & systems integration contracts1) 8 24
Number of subscribers in networks managed by Ericsson, end of period 2) ~ 950 m. ~ 950 m.
Of which in network operations contracts 550 m. 550 m.
Number of Ericsson services professionals, end of period 61,000 60,000 1)
In the areas of OSS and BSS, IP, Service Delivery Platforms and data center build projects. 2)
The figure includes network operations contracts and field operation contracts.
28.1
21.5
2.4
Networks
Global Services
Support Solutions
20
.6
24
.1
24
.3
28
.0
21
.5
Q12012
Q2 Q3 Q4 Q12013
1.3
1.4
1.8
1.8
0.7
6%
6%
8%
6%
3%
Q12012
Q2 Q3 Q4 Q12013

Ericsson First Quarter Report 2013 7
SUPPORT SOLUTIONS
SEGMENT SALES, SEK B. QUARTERLY SALES, SEK B. OPERATING INCOME, SEK B., AND OPERATING MARGIN, PERCENT
SEK b.
Q1
2013
Q1
2012
YoY
Change
Q4
2012
QoQ
Change
Support Solutions sales 2.4 3.0 -19% 3.6 -33%
Operating income 0.0 0.0 -4% 0.3 -
Operating margin -1% -1% - 8% -
Sales growth for comparable units, adjusted for FX
and hedging, was -3% YoY. Multimedia brokering
(IPX) was divested in Q312, which impacted sales
negatively YoY. IPX sales amounted to SEK 0.4 b in
Q112. Demand for OSS and BSS continued to be
strong, driven by operators’ focus on improving
efficiency and adapting to mobile broadband business
requirements. Media management sales declined
YoY following a strong Q112 and a technology shift of
our video compression portfolio.
We continue to implement our Support Solutions
strategy communicated during Q112 with a more
focused and concentrated portfolio. During the past
year we have executed significant portfolio changes.
On April 8, 2013, we announced our intention to
acquire Microsoft’s TV solution business Mediaroom,
further strengthening our position in the growing
media management market.
Operating margin was negatively impacted by
restructuring charges and lower sales volumes.
Efficiency improvements and portfolio streamlining
contributed positively. Restructuring charges in the
quarter were SEK 0.1 (0.0) b. which means that the
underlying operating margin was positive.
The number of subscriptions served by Ericsson’s
charging and billing solutions was 2.0 billion at end of
period.
28.1
21.5
2.4
Networks
Global Services
Support Solutions
3.0
3.5
3.3
3.6
2.4
Q12012
Q2 Q3 Q4 Q12013
0.0
0.4
0.5
0.3
0.0
-1%
12
%
14
%
8%
-1%
Q12012
Q2 Q3 Q4 Q12013
Ericsson First Quarter Report 2013 8
ST-ERICSSON
USD m.
Q1
2013
Q1
2012
YoY
Change
Q4
2012
QoQ
Change
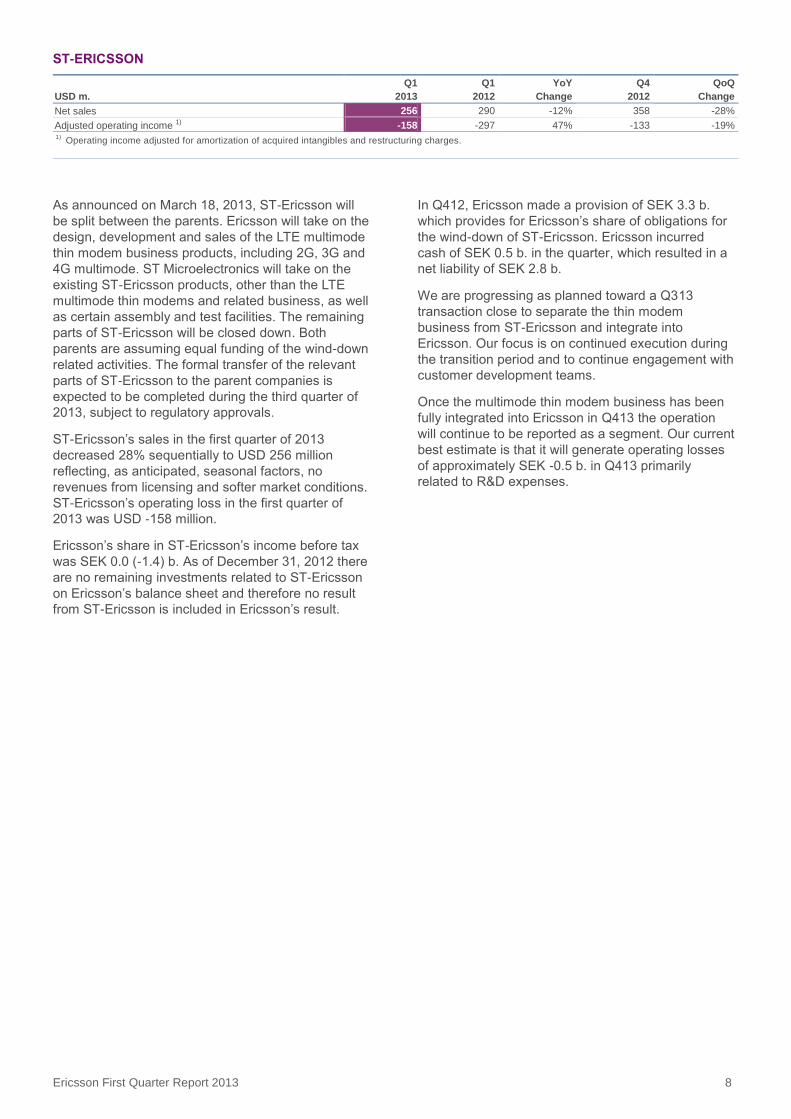
Net sales 256 290 -12% 358 -28%
Adjusted operating income 1) -158 -297 47% -133 -19% 1)
Operating income adjusted for amortization of acquired intangibles and restructuring charges.
As announced on March 18, 2013, ST-Ericsson will
be split between the parents. Ericsson will take on the
design, development and sales of the LTE multimode
thin modem business products, including 2G, 3G and
4G multimode. ST Microelectronics will take on the
existing ST-Ericsson products, other than the LTE
multimode thin modems and related business, as well
as certain assembly and test facilities. The remaining
parts of ST-Ericsson will be closed down. Both
parents are assuming equal funding of the wind-down
related activities. The formal transfer of the relevant
parts of ST-Ericsson to the parent companies is
expected to be completed during the third quarter of
2013, subject to regulatory approvals.
ST-Ericsson’s sales in the first quarter of 2013
decreased 28% sequentially to USD 256 million
reflecting, as anticipated, seasonal factors, no
revenues from licensing and softer market conditions.
ST-Ericsson’s operating loss in the first quarter of
2013 was USD -158 million.
Ericsson’s share in ST-Ericsson’s income before tax
was SEK 0.0 (-1.4) b. As of December 31, 2012 there
are no remaining investments related to ST-Ericsson
on Ericsson’s balance sheet and therefore no result
from ST-Ericsson is included in Ericsson’s result.
In Q412, Ericsson made a provision of SEK 3.3 b.
which provides for Ericsson’s share of obligations for
the wind-down of ST-Ericsson. Ericsson incurred
cash of SEK 0.5 b. in the quarter, which resulted in a
net liability of SEK 2.8 b.
We are progressing as planned toward a Q313
transaction close to separate the thin modem
business from ST-Ericsson and integrate into
Ericsson. Our focus is on continued execution during
the transition period and to continue engagement with
customer development teams.
Once the multimode thin modem business has been
fully integrated into Ericsson in Q413 the operation
will continue to be reported as a segment. Our current
best estimate is that it will generate operating losses
of approximately SEK -0.5 b. in Q413 primarily
related to R&D expenses.
Ericsson First Quarter Report 2013 9
Regional sales overview
REGIONAL SALES
First quarter 2013 Growth
SEK b. Networks Global
Services Support
Solutions Total YoY QoQ
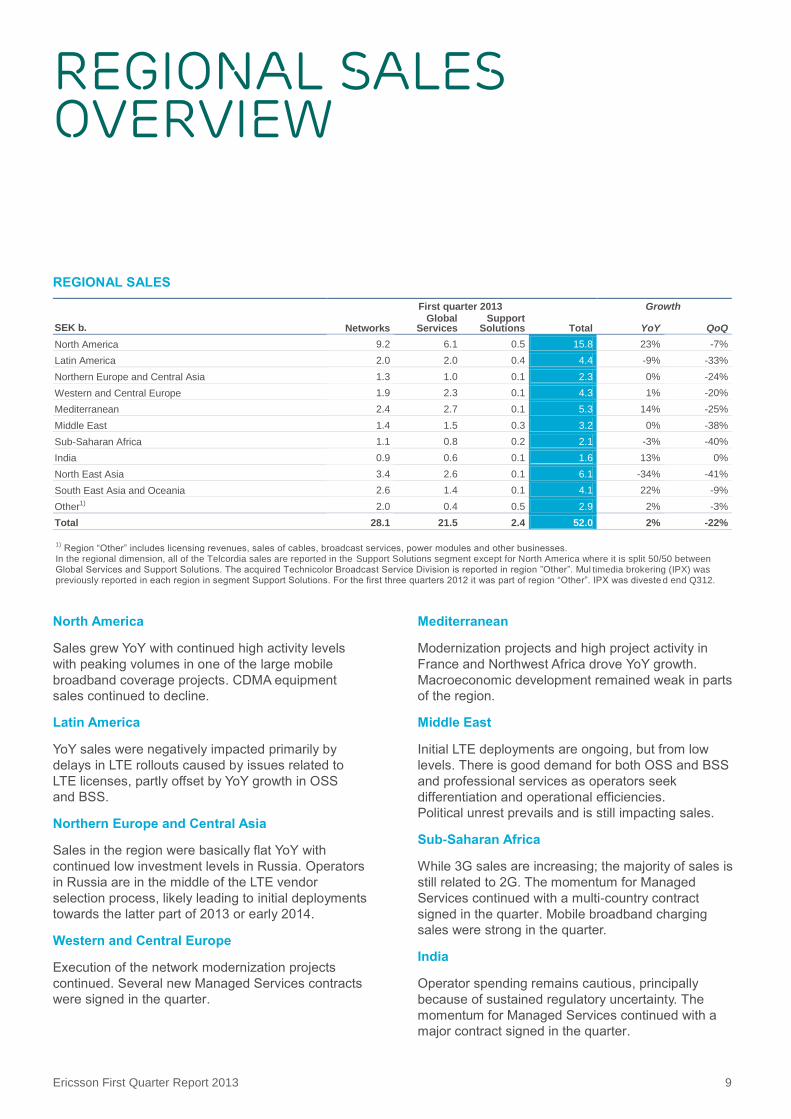
North America 9.2 6.1 0.5 15.8 23% -7%
Latin America 2.0 2.0 0.4 4.4 -9% -33%
Northern Europe and Central Asia 1.3 1.0 0.1 2.3 0% -24%
Western and Central Europe 1.9 2.3 0.1 4.3 1% -20%
Mediterranean 2.4 2.7 0.1 5.3 14% -25%
Middle East 1.4 1.5 0.3 3.2 0% -38%
Sub-Saharan Africa 1.1 0.8 0.2 2.1 -3% -40%
India 0.9 0.6 0.1 1.6 13% 0%
North East Asia 3.4 2.6 0.1 6.1 -34% -41%
South East Asia and Oceania 2.6 1.4 0.1 4.1 22% -9%
Other1) 2.0 0.4 0.5 2.9 2% -3%
Total 28.1 21.5 2.4 52.0 2% -22%
1) Region “Other” includes licensing revenues, sales of cables, broadcast services, power modules and other businesses.
In the regional dimension, all of the Telcordia sales are reported in the Support Solutions segment except for North America where it is split 50/50 between Global Services and Support Solutions. The acquired Technicolor Broadcast Service Division is reported in region ”Other”. Mul timedia brokering (IPX) was previously reported in each region in segment Support Solutions. For the first three quarters 2012 it was part of region “Other”. IPX was diveste d end Q312.
North America
Sales grew YoY with continued high activity levels
with peaking volumes in one of the large mobile
broadband coverage projects. CDMA equipment
sales continued to decline.
Latin America
YoY sales were negatively impacted primarily by
delays in LTE rollouts caused by issues related to
LTE licenses, partly offset by YoY growth in OSS
and BSS.
Northern Europe and Central Asia
Sales in the region were basically flat YoY with
continued low investment levels in Russia. Operators
in Russia are in the middle of the LTE vendor
selection process, likely leading to initial deployments
towards the latter part of 2013 or early 2014.
Western and Central Europe
Execution of the network modernization projects
continued. Several new Managed Services contracts
were signed in the quarter.
Mediterranean
Modernization projects and high project activity in
France and Northwest Africa drove YoY growth.
Macroeconomic development remained weak in parts
of the region.
Middle East
Initial LTE deployments are ongoing, but from low
levels. There is good demand for both OSS and BSS
and professional services as operators seek
differentiation and operational efficiencies.
Political unrest prevails and is still impacting sales.
Sub-Saharan Africa
While 3G sales are increasing; the majority of sales is
still related to 2G. The momentum for Managed
Services continued with a multi-country contract
signed in the quarter. Mobile broadband charging
sales were strong in the quarter.
India
Operator spending remains cautious, principally
because of sustained regulatory uncertainty. The
momentum for Managed Services continued with a
major contract signed in the quarter.
Ericsson First Quarter Report 2013 10
North East Asia
Business activity declined YoY mainly due to lower
sales in South Korea, continued structural decline in
GSM investments in China and FX effects in Japan.
South Korea remains one of the most advanced LTE
markets, but the YoY comparison is impacted by the
parallel 3G deployments in Q112. Sales were also
impacted by delayed LTE spectrum auctions in South
Korea.
South East Asia and Oceania
The business volume continued on a high level with
simultaneous mobile broadband deployments in
Indonesia, Australia and Thailand.
Other
IPX was divested at the end of Q312 impacting
Support Solutions sales YoY comparison. Licensing
revenues continued to show stable development YoY.
Sales of broadcast services, cables, power modules
and other businesses are also included in “Other”.

Ericsson First Quarter Report 2013 11
Parent company information
Income after financial items was SEK 1.2 (5.1) b.
The Parent Company’s financial position had the
following major changes during the quarter;
decreased cash, cash equivalents and short-term
investments of SEK -4.7 b. and decreased current
and non-current receivables from subsidiaries of SEK
6.7 b. At the end of the quarter, cash, cash
equivalents and short-term investments amounted to
SEK 52.7 (57.4) b.
By the end of the quarter ST-Ericsson had utilized
USD 77 million (SEK 0.5 b.) of a short-term credit
facility. In Q4 2012, Ericsson made a provision of SEK
3.3 b. which provides for Ericsson’s share of obligations
for the wind-down of ST-Ericsson. Ericsson incurred
cash of SEK 0.5 b. in the quarter, which resulted in a net
liability of SEK 2.8 b.
In accordance with the conditions of the long-term
variable remuneration program (LTV) for Ericsson
employees, 2,588 932 shares from treasury stock
were sold or distributed to employees during the first
quarter. The holding of treasury stock at March 31,
2013, was 82,209,163 Class B shares.
Ericsson First Quarter Report 2013 12
Other information
Samsung litigation
On November 27, 2012, Ericsson filed two patent
infringement lawsuits in the US District Court for the
Eastern District of Texas against Samsung. Ericsson
seeks damages and an injunction. Ericsson also
asked the Court to adjudge that Samsung breached
its commitment to license any standard-essential
patents it owns on fair, reasonable, and non-
discriminatory terms and to declare Samsung’s
allegedly standard essential patents to be
unenforceable. On November 30, 2012, Ericsson filed
a complaint with the US International Trade
Commission (ITC) seeking an exclusion order
blocking Samsung from importing certain products
into the US. On December 21, 2012, Samsung filed a
complaint with the ITC seeking an exclusion order
blocking Ericsson from import of certain products into
the US
On March 18, 2013, Samsung filed its answers and
counterclaims in the Ericsson suits (above) in Texas,
USA.
Airvana litigation
In February 2012, Airvana Networks Solutions Inc
(Airvana) filed a complaint against Ericsson in the
Supreme Court of the State of New York, USA,
alleging that Ericsson has violated key contract terms
and misappropriated Airvana trade secrets and
proprietary information. Airvana is seeking damages
of USD 330 million and to enjoin Ericsson from
developing, deploying or commercializing Ericsson
products allegedly based on Airvana’s proprietary
technology.
On March 19, 2013 the Court issued a preliminary
injunction barring Ericsson or any party in privity with
Ericsson from using, operating, testing or deploying
certain Airvana-based EV-DO hardware unless it is
executing software that is licensed from Airvana.
The Court also confirmed that it will conduct a
separate, related hearing starting in April on a second
preliminary injunction motion filed by Airvana seeking
to prevent deployment of the Digital Baseband
Advanced ("DBA") hardware with any EV-DO
software other than Airvana’s.
Reduction of number of employees in Sweden
On March 27, 2013 the company announced the
reductions of operations in Sweden. In total 1,399
positions were impacted with 919 employees notified.
All sites in Sweden were affected except Falun,
Hudiksvall, Kalmar and Katrineholm. Restructuring
charges associated with these actions were SEK 1.4
b. impacting Group results in Q1, 2013.
Acquisition of Devoteam Telecom & Media
operations
On January 21, 2013, Ericsson announced its
intention to acquire Devoteam Telecom & Media
operations in France. The completion of the
acquisition is subject to consultation and customary
closing conditions and is expected to take place by
the beginning of Q2, 2013.
On new positions
As of April 1, 2013, Jan Signell is appointed Head of
Region North East Asia and a member of Ericsson's
Global Leadership Team, reporting to Chairman of
Asia-Pacific, Mats H Olsson. Jan Signell is currently
Head of Customer Unit Japan within Region North
East Asia, and will remain in this role until a
successor is appointed.
As of June 3, 2013, Chris Houghton is appointed
Head of Region India and a member of Ericsson’s
Global Leadership Team, reporting to Chairman of
Asia-Pacific, Mats H Olsson. Chris Houghton is
currently Head of Customer Unit UK & Ireland.
POST-CLOSING EVENTS
Ericsson to acquire Microsoft Mediaroom
On April 8, 2013, Ericsson announced that the
company has reached an agreement with Microsoft to
acquire its TV solution Mediaroom business. This will
make Ericsson the leading provider of IPTV and
multi-screen solutions with a market share of over
25%. The agreement is subject to customary
regulatory approvals and other conditions.
Ericsson First Quarter Report 2013 13
Assessment of risk environment
Ericsson’s operational and financial risk factors and
uncertainties along with our strategies and tactics to
mitigate risk exposures or limit unfavorable outcomes
are described in our Annual Report 2012. Compared
to the risks described in the Annual Report 2012, no
material, new or changed risk factors or uncertainties
have been identified in the quarter.
Risk factors and uncertainties in focus short-term for
the Parent Company and the Ericsson Group include:
Potential negative effects on operators’ willingness
to invest in network development due to uncertainty
in the financial markets and a weak economic
business environment, or reduced consumer
telecom spending, or increased pressure on us to
provide financing;
Uncertainty regarding the financial stability of
suppliers, for example due to lack of financing;
Effects on gross margins and/or working capital of
the product mix in the Networks segment between
sales of upgrades and expansions (mainly
software) and new build-outs of coverage (mainly
hardware);
Effects on gross margins of the product mix in the
Global Services segment including proportion of
new network build-outs and share of new managed
services deals with initial transition costs;
A continued volatile sales pattern in the Support
Solutions segment or variability in our overall sales
seasonality could make it more difficult to forecast
future sales;
Effects of the ongoing industry consolidation among
our customers as well as between our largest
competitors, e.g. with postponed investments and
intensified price competition as a consequence;
Implementation of the strategic option for our joint
venture ST-Ericsson and related capital need;
Changes in foreign exchange rates, in particular
USD, JPY and EUR;
Political unrest or instability in certain markets;
Effects on production and sales from restrictions
with respect to timely and adequate supply of
materials, components and production capacity and
other vital services on competitive terms;
Natural disasters and other events, affecting
business, production, supply and transportation.
Ericsson stringently monitors the compliance with all
relevant trade regulations and trade embargos
applicable to dealings with customers operating in
countries where there are trade restrictions or trade
restrictions are discussed. Moreover, Ericsson
operates globally in accordance with Group policies
and directives for business ethics and conduct.
Stockholm, April 24, 2013
Telefonaktiebolaget LM Ericsson (publ)
Hans Vestberg, President and CEO
Org. Nr. 556016-0680
This report has not been reviewed by
Telefonaktiebolaget LM Ericsson’s auditors.
Date for next report: July 18, 2013
Ericsson First Quarter Report 2013 14
Editor’s note
Ericsson invites media, investors and analysts to a
press conference at the Ericsson Studio,
Grönlandsgången 4, Stockholm, at 09.00 (CET),
April 24, 2013. An analysts, investors and media
conference call will begin at 14.00 (CET).
Live webcast of the press conference and conference
call as well as supporting slides will be available at
www.ericsson.com/press and
www.ericsson.com/investors
Video material will be published during the day on
www.ericsson.com/press
For further information, please contact:
Helena Norrman, Senior Vice President,
Communications
Phone: +46 10 719 34 72
E-mail: [email protected] or
Telefonaktiebolaget LM Ericsson (publ)
Org. number: 556016-0680
Torshamnsgatan 23
SE-164 83 Stockholm
Phone: +46 10 719 00 00
www.ericsson.com
Investors
Stefan Jelvin, Director,
Investor Relations
Phone: +46 10 714 20 39, +46 70 986 02 27
E-mail: [email protected]
Åsa Konnbjer, Director,
Investor Relations
Phone: +46 10 713 39 28, +46 73 082 59 28
E-mail: [email protected]
Rikard Tunedal, Director,
Investor Relations
Phone: +46 10 714 54 00, +46 761 005 400
E-mail: [email protected]
Media
Ola Rembe, Vice President,
Head of External Communications
Phone: +46 10 719 97 27, +46 73 024 48 73
E-mail: [email protected]
Corporate Communications
Phone: +46 10 719 69 92
E-mail: [email protected]
Ericsson First Quarter Report 2013 15
Safe harbor statement
All statements made or incorporated by reference in
this release, other than statements or
characterizations of historical facts, are forward-
looking statements. These forward-looking
statements are based on our current expectations,
estimates and projections about our industry,
management’s beliefs and certain assumptions made
by us. Forward-looking statements can often be
identified by words such as “anticipates”, “expects”,
“intends”, “plans”, “predicts”, “believes”, “seeks”,
“estimates”, “may”, “will”, “should”, “would”,
“potential”, “continue”, and variations or negatives of
these words, and include, among others, statements
regarding: (i) strategies, outlook and growth
prospects; (ii) positioning to deliver future plans and
to realize potential for future growth; (iii) liquidity and
capital resources and expenditure, and our credit
ratings; (iv) growth in demand for our products and
services; (v) our joint venture activities; (vi) economic
outlook and industry trends; (vii) developments of our
markets; (viii) the impact of regulatory initiatives; (ix)
research and development expenditures; (x) the
strength of our competitors; (xi) future cost savings;
(xii) plans to launch new products and services; (xiii)
assessments of risks; (xiv) integration of acquired
businesses; (xv) compliance with rules and
regulations and (xvi) infringements of intellectual
property rights of others.
In addition, any statements that refer to expectations,
projections or other characterizations of future events
or circumstances, including any underlying
assumptions, are forward-looking statements. These
forward-looking statements speak only as of the date
hereof and are based upon the information available
to us at this time. Such information is subject to
change, and we will not necessarily inform you of
such changes. These statements are not guarantees
of future performance and are subject to risks,
uncertainties and assumptions that are difficult to
predict. Therefore, our actual results could differ
materially and adversely from those expressed in any
forward-looking statements as a result of various
factors. Important factors that may cause such a
difference for Ericsson include, but are not limited to:
(i) material adverse changes in the markets in which
we operate or in global economic conditions; (ii)
increased product and price competition; (iii)
reductions in capital expenditure by network
operators; (iv) the cost of technological innovation
and increased expenditure to improve quality of
service; (v) significant changes in market share for
our principal products and services; (vi) foreign
exchange rate or interest rate fluctuations; and (vii)
the successful implementation of our business and
operational initiatives.
Ericsson First Quarter Report 2013 16
Financial statements and additional information
Financial statements
17 Consolidated income statement
17 Statement of comprehensive income
18 Consolidated balance sheet
19 Consolidated statement of cash flows
20 Consolidated statement of changes in equity
21 Consolidated income statement - isolated
quarters
22 Consolidated statement of cash flows - isolated
quarters
23 Parent Company income statement
23 Parent Company balance sheet
Additional information
24 Accounting policies
25 Accounting policies (continued)
26 Net sales by segment by quarter
26 Sales growth for comparable units, adjusted for
currency effects and hedging
27 Operating income by segment by quarter
27 Operating margin by segment by quarter
28 EBITA by segment by quarter
28 EBITA margin by segment by quarter
29 Net sales by region by quarter
30 Net sales by region by quarter (cont.)
30 Top 5 countries in sales
31 Net sales by region by segment
32 Provisions
32 Information on investments in assets subject to
depreciation, amortizations, impairment and
write-downs
32 Reconciliation table, non-IFRS measurements
33 Other information
33 Number of employees
34 Restructuring charges by function
34 Restructuring charges by segment
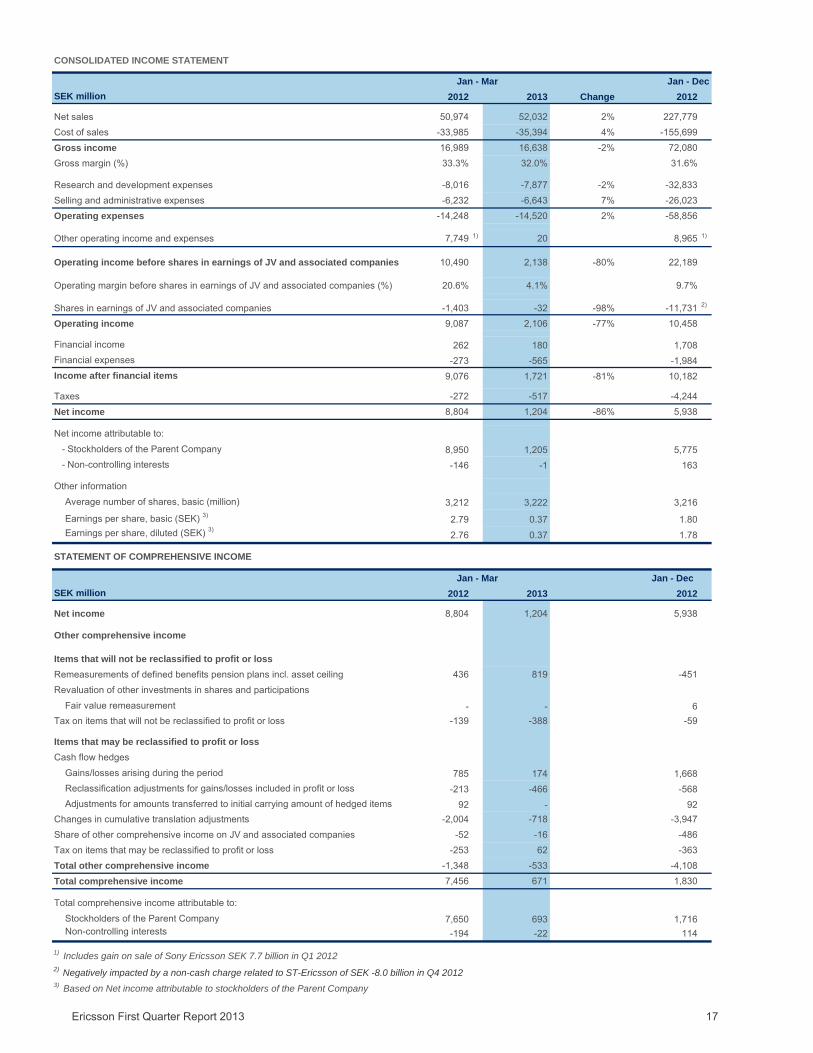
Ericsson First Quarter Report 2013 17
SEK million 2012 2013 Change 2012
Net sales 50,974 52,032 2% 227,779Cost of sales -33,985 -35,394 4% -155,699Gross income 16,989 16,638 -2% 72,080Gross margin (%) 33.3% 32.0% 31.6%
Research and development expenses -8,016 -7,877 -2% -32,833Selling and administrative expenses -6,232 -6,643 7% -26,023Operating expenses -14,248 -14,520 2% -58,856
Other operating income and expenses 7,749 1) 20 8,965 1)
Operating income before shares in earnings of JV and associated companies 10,490 2,138 -80% 22,189
Operating margin before shares in earnings of JV and associated companies (%) 20.6% 4.1% 9.7%
Shares in earnings of JV and associated companies -1,403 -32 -98% -11,731 2)
Operating income 9,087 2,106 -77% 10,458
Financial income 262 180 1,708Financial expenses -273 -565 -1,984Income after financial items 9,076 1,721 -81% 10,182
Taxes -272 -517 -4,244Net income 8,804 1,204 -86% 5,938
Net income attributable to: - Stockholders of the Parent Company 8,950 1,205 5,775 - Non-controlling interests -146 -1 163
Other informationAverage number of shares, basic (million) 3,212 3,222 3,216
Earnings per share, basic (SEK) 3) 2.79 0.37 1.80Earnings per share, diluted (SEK) 3)
2.76 0.37 1.78
STATEMENT OF COMPREHENSIVE INCOME
SEK million 2012 2013 2012
Net income 8,804 1,204 5,938
Other comprehensive income
Items that will not be reclassified to profit or lossRemeasurements of defined benefits pension plans incl. asset ceiling 436 819 -451Revaluation of other investments in shares and participations
Fair value remeasurement - - 6Tax on items that will not be reclassified to profit or loss -139 -388 -59
Items that may be reclassified to profit or lossCash flow hedges
Gains/losses arising during the period 785 174 1,668Reclassification adjustments for gains/losses included in profit or loss -213 -466 -568Adjustments for amounts transferred to initial carrying amount of hedged items 92 - 92
Changes in cumulative translation adjustments -2,004 -718 -3,947Share of other comprehensive income on JV and associated companies -52 -16 -486Tax on items that may be reclassified to profit or loss -253 62 -363Total other comprehensive income -1,348 -533 -4,108Total comprehensive income 7,456 671 1,830
Total comprehensive income attributable to:Stockholders of the Parent Company 7,650 693 1,716Non-controlling interests -194 -22 114
1) Includes gain on sale of Sony Ericsson SEK 7.7 billion in Q1 2012
3) Based on Net income attributable to stockholders of the Parent Company
CONSOLIDATED INCOME STATEMENT
Jan - Mar
Jan - Mar Jan - Dec
2) Negatively impacted by a non-cash charge related to ST-Ericsson of SEK -8.0 billion in Q4 2012
Jan - Dec
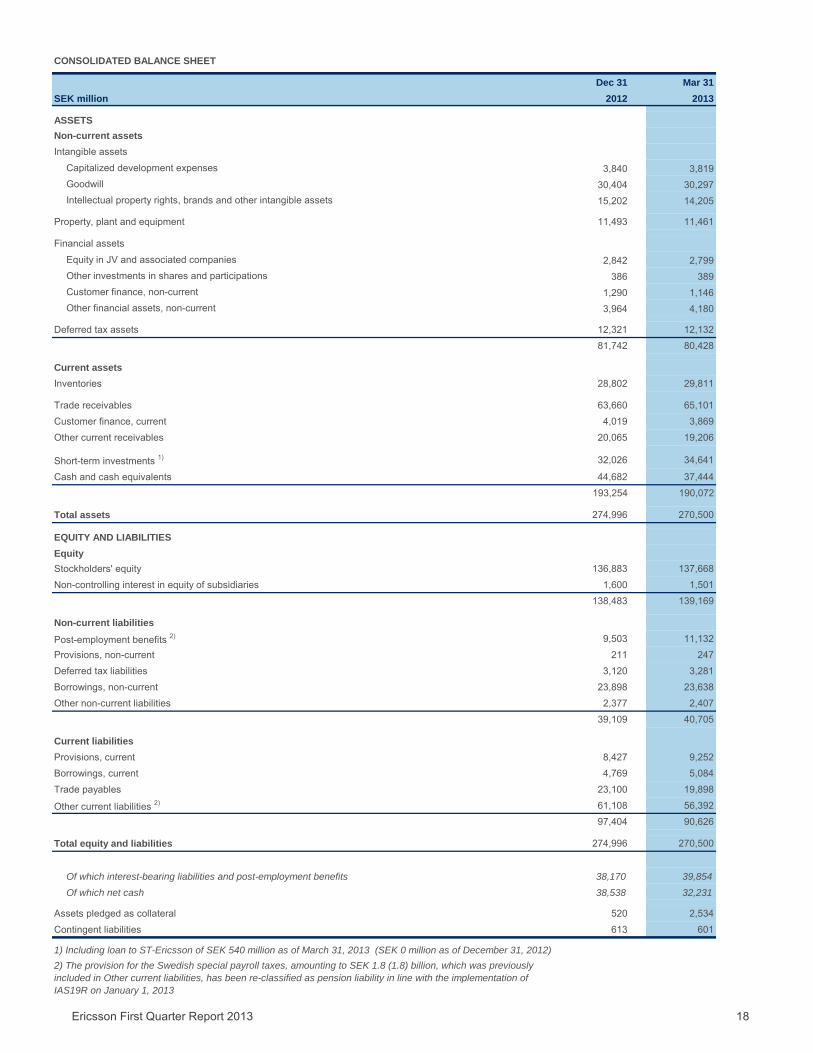
Ericsson First Quarter Report 2013 18
CONSOLIDATED BALANCE SHEET
Dec 31 Mar 31SEK million 2012 2013
ASSETSNon-current assets Intangible assets
Capitalized development expenses 3,840 3,819Goodwill 30,404 30,297Intellectual property rights, brands and other intangible assets 15,202 14,205
Property, plant and equipment 11,493 11,461
Financial assets
Equity in JV and associated companies 2,842 2,799Other investments in shares and participations 386 389Customer finance, non-current 1,290 1,146Other financial assets, non-current 3,964 4,180
Deferred tax assets 12,321 12,13281,742 80,428
Current assets Inventories 28,802 29,811
Trade receivables 63,660 65,101Customer finance, current 4,019 3,869Other current receivables 20,065 19,206
Short-term investments 1) 32,026 34,641
Cash and cash equivalents 44,682 37,444193,254 190,072
Total assets 274,996 270,500
EQUITY AND LIABILITIESEquityStockholders' equity 136,883 137,668Non-controlling interest in equity of subsidiaries 1,600 1,501
138,483 139,169
Non-current liabilities Post-employment benefits 2) 9,503 11,132Provisions, non-current 211 247Deferred tax liabilities 3,120 3,281Borrowings, non-current 23,898 23,638Other non-current liabilities 2,377 2,407
39,109 40,705
Current liabilitiesProvisions, current 8,427 9,252Borrowings, current 4,769 5,084Trade payables 23,100 19,898
Other current liabilities 2) 61,108 56,39297,404 90,626
Total equity and liabilities 274,996 270,500
Of which interest-bearing liabilities and post-employment benefits 38,170 39,854
Of which net cash 38,538 32,231
Assets pledged as collateral 520 2,534Contingent liabilities 613 601
1) Including loan to ST-Ericsson of SEK 540 million as of March 31, 2013 (SEK 0 million as of December 31, 2012)2) The provision for the Swedish special payroll taxes, amounting to SEK 1.8 (1.8) billion, which was previously included in Other current liabilities, has been re-classified as pension liability in line with the implementation of IAS19R on January 1, 2013
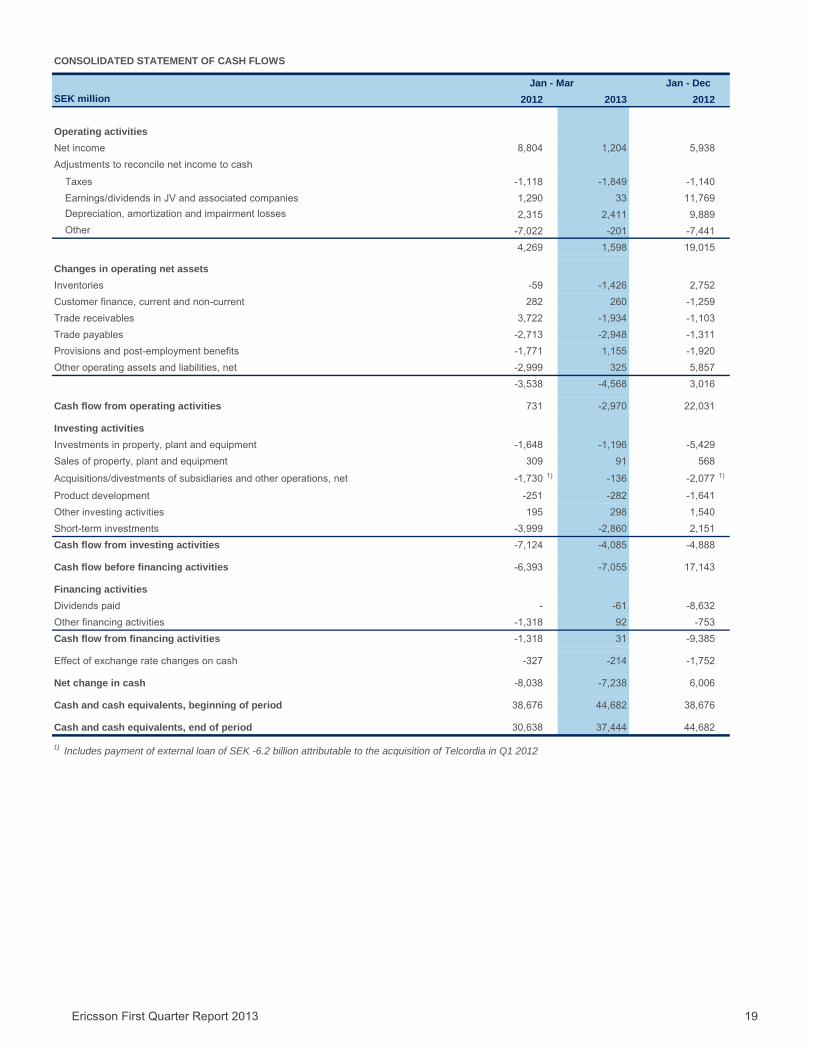
Ericsson First Quarter Report 2013 19
SEK million 2012 2013 2012
Operating activitiesNet income 8,804 1,204 5,938Adjustments to reconcile net income to cash
Taxes -1,118 -1,849 -1,140Earnings/dividends in JV and associated companies 1,290 33 11,769Depreciation, amortization and impairment losses 2,315 2,411 9,889Other -7,022 -201 -7,441
4,269 1,598 19,015
Changes in operating net assetsInventories -59 -1,426 2,752Customer finance, current and non-current 282 260 -1,259Trade receivables 3,722 -1,934 -1,103Trade payables -2,713 -2,948 -1,311Provisions and post-employment benefits -1,771 1,155 -1,920Other operating assets and liabilities, net -2,999 325 5,857
-3,538 -4,568 3,016
Cash flow from operating activities 731 -2,970 22,031
Investing activitiesInvestments in property, plant and equipment -1,648 -1,196 -5,429Sales of property, plant and equipment 309 91 568
Acquisitions/divestments of subsidiaries and other operations, net -1,730 1) -136 -2,077 1)
Product development -251 -282 -1,641Other investing activities 195 298 1,540Short-term investments -3,999 -2,860 2,151Cash flow from investing activities -7,124 -4,085 -4,888
Cash flow before financing activities -6,393 -7,055 17,143
Financing activitiesDividends paid - -61 -8,632Other financing activities -1,318 92 -753Cash flow from financing activities -1,318 31 -9,385
Effect of exchange rate changes on cash -327 -214 -1,752
Net change in cash -8,038 -7,238 6,006
Cash and cash equivalents, beginning of period 38,676 44,682 38,676
Cash and cash equivalents, end of period 30,638 37,444 44,682
1) Includes payment of external loan of SEK -6.2 billion attributable to the acquisition of Telcordia in Q1 2012
CONSOLIDATED STATEMENT OF CASH FLOWS
Jan - DecJan - Mar
Ericsson First Quarter Report 2013 20
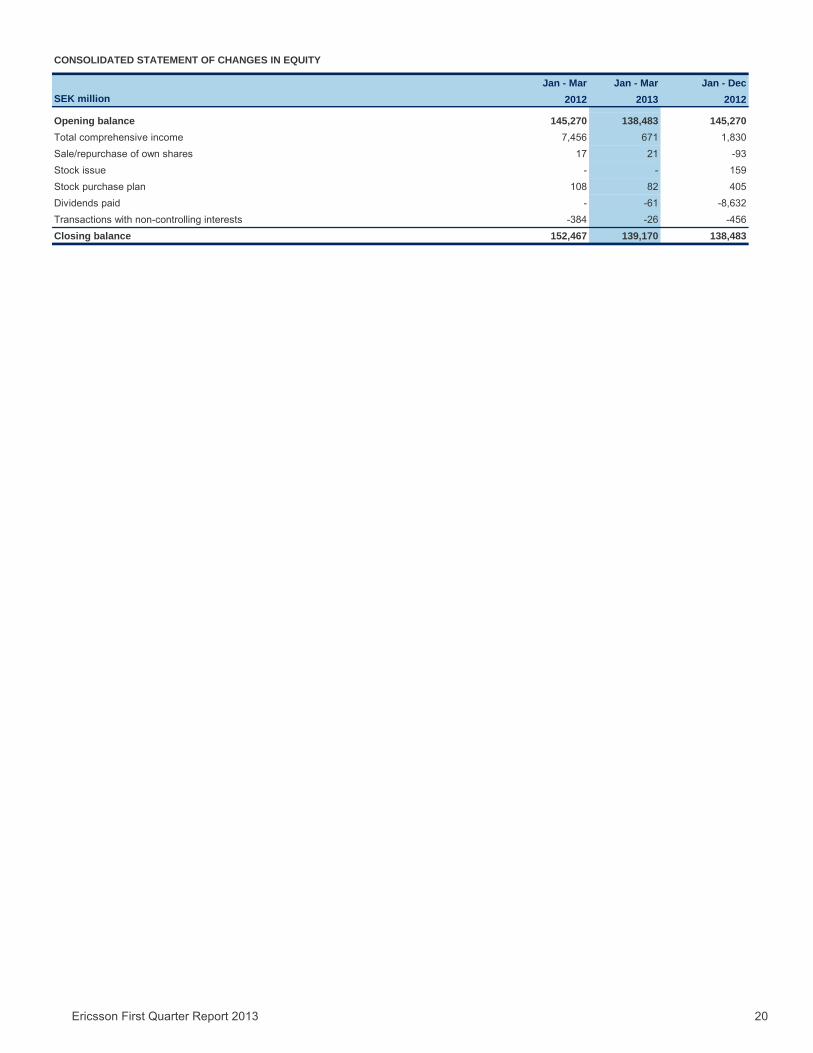
CONSOLIDATED STATEMENT OF CHANGES IN EQUITY
Jan - Mar Jan - Mar Jan - DecSEK million 2012 2013 2012
Opening balance 145,270 138,483 145,270Total comprehensive income 7,456 671 1,830Sale/repurchase of own shares 17 21 -93Stock issue - - 159Stock purchase plan 108 82 405Dividends paid - -61 -8,632Transactions with non-controlling interests -384 -26 -456Closing balance 152,467 139,170 138,483

Ericsson First Quarter Report 2013 21
2013Isolated quarters, SEK million Q1 Q2 Q3 Q4 Q1
Net sales 50,974 55,319 54,550 66,936 52,032Cost of sales -33,985 -37,611 -37,970 -46,133 -35,394Gross income 16,989 17,708 16,580 20,803 16,638Gross margin (%) 33.3% 32.0% 30.4% 31.1% 32.0%
Research and development expenses -8,016 -8,097 -7,473 -9,247 -7,877Selling and administrative expenses -6,232 -6,855 -5,797 -7,139 -6,643Operating expenses -14,248 -14,952 -13,270 -16,386 -14,520
Other operating income and expenses 7,749 1) 530 341 345 20
Operating income before shares in earnings of JV and associated companies 10,490 3,286 3,651 4,762 2,138
Operating margin before shares in earnings of JV and associated companies (%) 20.6% 5.9% 6.7% 7.1% 4.1%
Shares in earnings of JV and associated companies -1,403 -1,208 -555 -8,565 2) -32Operating income 9,087 2,078 3,096 -3,803 2,106
Financial income 262 618 390 438 180Financial expenses -273 -924 -275 -512 -565Income after financial items 9,076 1,772 3,211 -3,877 1,721
Taxes -272 -567 -1,027 -2,378 -517Net income 8,804 1,205 2,184 -6,255 1,204
Net income attributable to: - Stockholders of the Parent Company 8,950 1,110 2,177 -6,462 1,205 - Non-controlling interests -146 95 7 207 -1
Other informationAverage number of shares, basic (million) 3,212 3,215 3,217 3,219 3,222
Earnings per share, basic (SEK) 3) 2.79 0.35 0.68 -2.01 0.37Earnings per share, diluted (SEK) 3)
2.76 0.34 0.67 -1.99 0.37
1) Includes gain on sale of Sony Ericsson SEK 7.7 billion in Q1 20122) Negatively impacted by a non-cash charge related to ST-Ericsson of SEK -8.0 billion in Q4 2012
CONSOLIDATED INCOME STATEMENT – ISOLATED QUARTERS
3) Based on Net income attributable to stockholders of the Parent Company
2012
Ericsson First Quarter Report 2013 22
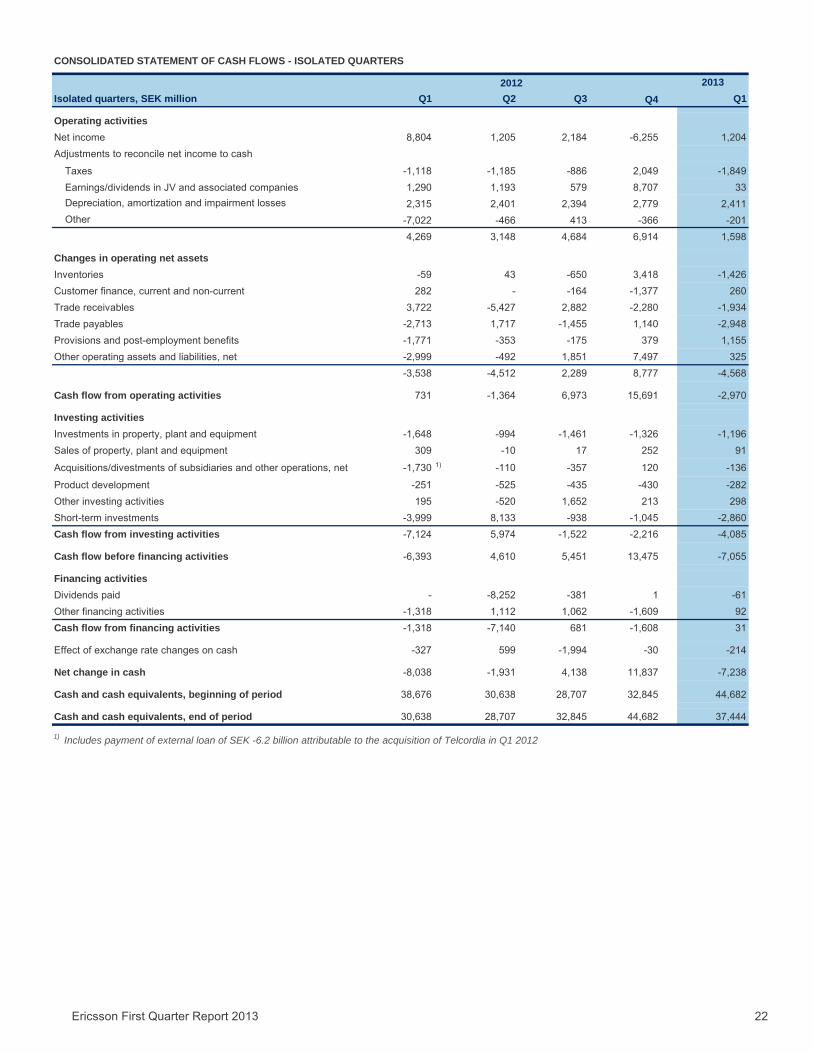
2013Isolated quarters, SEK million Q1 Q2 Q3 Q4 Q1
Operating activitiesNet income 8,804 1,205 2,184 -6,255 1,204Adjustments to reconcile net income to cash
Taxes -1,118 -1,185 -886 2,049 -1,849Earnings/dividends in JV and associated companies 1,290 1,193 579 8,707 33Depreciation, amortization and impairment losses 2,315 2,401 2,394 2,779 2,411Other -7,022 -466 413 -366 -201
4,269 3,148 4,684 6,914 1,598
Changes in operating net assetsInventories -59 43 -650 3,418 -1,426Customer finance, current and non-current 282 - -164 -1,377 260Trade receivables 3,722 -5,427 2,882 -2,280 -1,934Trade payables -2,713 1,717 -1,455 1,140 -2,948Provisions and post-employment benefits -1,771 -353 -175 379 1,155Other operating assets and liabilities, net -2,999 -492 1,851 7,497 325
-3,538 -4,512 2,289 8,777 -4,568
Cash flow from operating activities 731 -1,364 6,973 15,691 -2,970
Investing activitiesInvestments in property, plant and equipment -1,648 -994 -1,461 -1,326 -1,196Sales of property, plant and equipment 309 -10 17 252 91
Acquisitions/divestments of subsidiaries and other operations, net -1,730 1) -110 -357 120 -136
Product development -251 -525 -435 -430 -282Other investing activities 195 -520 1,652 213 298Short-term investments -3,999 8,133 -938 -1,045 -2,860Cash flow from investing activities -7,124 5,974 -1,522 -2,216 -4,085
Cash flow before financing activities -6,393 4,610 5,451 13,475 -7,055
Financing activitiesDividends paid - -8,252 -381 1 -61Other financing activities -1,318 1,112 1,062 -1,609 92Cash flow from financing activities -1,318 -7,140 681 -1,608 31
Effect of exchange rate changes on cash -327 599 -1,994 -30 -214
Net change in cash -8,038 -1,931 4,138 11,837 -7,238
Cash and cash equivalents, beginning of period 38,676 30,638 28,707 32,845 44,682
Cash and cash equivalents, end of period 30,638 28,707 32,845 44,682 37,444
1) Includes payment of external loan of SEK -6.2 billion attributable to the acquisition of Telcordia in Q1 2012
CONSOLIDATED STATEMENT OF CASH FLOWS - ISOLATED QUARTERS
2012
Ericsson First Quarter Report 2013 23
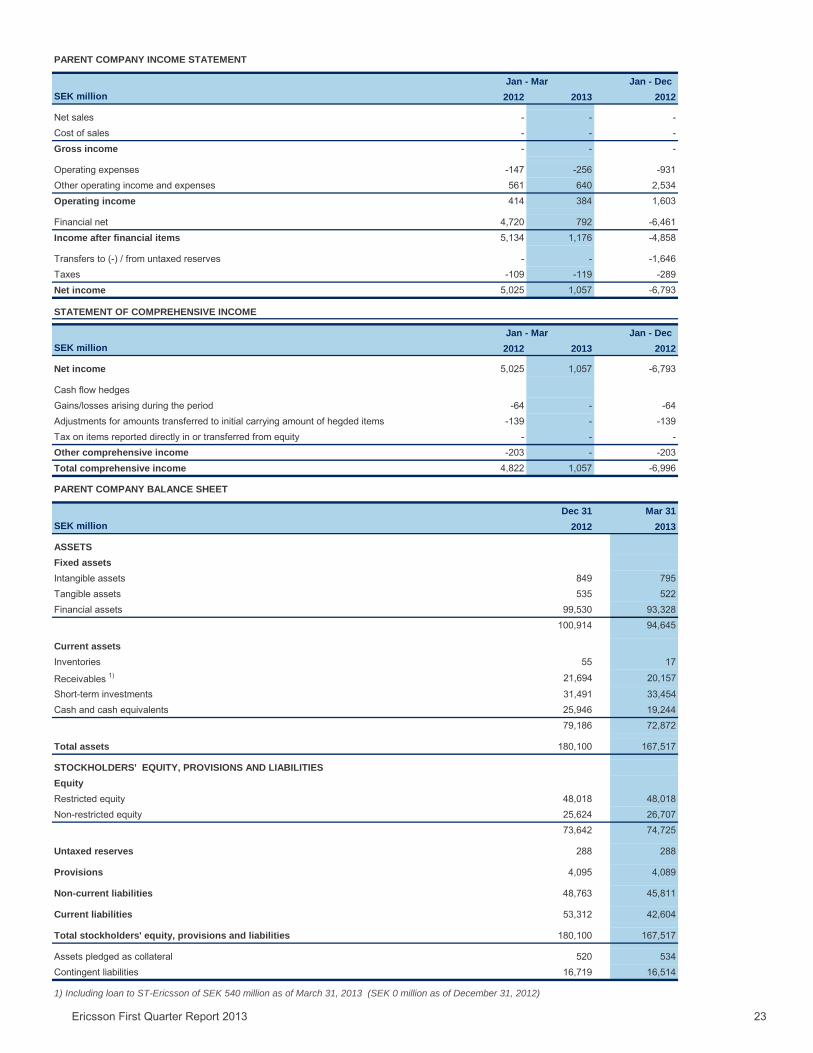
PARENT COMPANY INCOME STATEMENT
SEK million 2012 2013 2012
Net sales - - -Cost of sales - - -Gross income - - -
Operating expenses -147 -256 -931Other operating income and expenses 561 640 2,534Operating income 414 384 1,603
Financial net 4,720 792 -6,461Income after financial items 5,134 1,176 -4,858
Transfers to (-) / from untaxed reserves - - -1,646Taxes -109 -119 -289Net income 5,025 1,057 -6,793
SEK million 2012 2013 2012
Net income 5,025 1,057 -6,793
Cash flow hedges Gains/losses arising during the period -64 - -64Adjustments for amounts transferred to initial carrying amount of hegded items -139 - -139Tax on items reported directly in or transferred from equity - - -Other comprehensive income -203 - -203Total comprehensive income 4,822 1,057 -6,996
PARENT COMPANY BALANCE SHEET
Dec 31 Mar 31SEK million 2012 2013
ASSETSFixed assetsIntangible assets 849 795Tangible assets 535 522Financial assets 99,530 93,328
100,914 94,645
Current assets Inventories 55 17
Receivables 1) 21,694 20,157
Short-term investments 31,491 33,454Cash and cash equivalents 25,946 19,244
79,186 72,872
Total assets 180,100 167,517
STOCKHOLDERS' EQUITY, PROVISIONS AND LIABILITIESEquityRestricted equity 48,018 48,018Non-restricted equity 25,624 26,707
73,642 74,725
Untaxed reserves 288 288
Provisions 4,095 4,089
Non-current liabilities 48,763 45,811
Current liabilities 53,312 42,604
Total stockholders' equity, provisions and liabilities 180,100 167,517
Assets pledged as collateral 520 534Contingent liabilities 16,719 16,514
1) Including loan to ST-Ericsson of SEK 540 million as of March 31, 2013 (SEK 0 million as of December 31, 2012)
Jan - Mar
STATEMENT OF COMPREHENSIVE INCOME
Jan - Mar
Jan - Dec
Jan - Dec

Ericsson First Quarter Report 2013 24
Accounting policies The Group This interim report is prepared in accordance with IAS 34. The term “IFRS” used in this document refers to the application of IAS and IFRS as well as interpretations of these standards as issued by IASB’s Standards Interpretation Committee (SIC) and IFRS Interpretations Committee (IFRIC). The accounting policies adopted are consistent with those of the annual report for the year ended December 31, 2012, and should be read in conjunction with that annual report. Change of hedge accounting Due to cost efficiency reasons Ericsson has changed the hedge accounting. Ericsson hedges highly probable forecast transactions related to sales and purchases with the purpose to limit the impact related to currency fluctuations on these forecasted transactions. This will not be changed. Ericsson has, however, decided to discontinue hedge accounting for this type of hedges. Until 2012 Ericsson applied cash flow hedge accounting for highly probable forecast transactions. Revaluation of these hedges (incepted prior to January 1, 2013) are prior to release reported under “Other comprehensive income“ (OCI) and is at release recycled to sales, cost of sales and R&D expenses respectively. As from 2013, revaluation of new hedges (inception as from January 1, 2013) are reported under “Other operating income and expenses” in the Income statement. As from January 1, 2013, the Company has applied the following new or amended IFRSs and IFRICs: Amendment to IAS 1, “Financial statement presentation“ regarding Other comprehensive income. The main change resulting from this amendment is a requirement for entities to group items presented in “other comprehensive income“ (OCI) on the basis of whether they are potentially recycle to profit or loss subsequently (reclassification adjustments). The amendment does not address which items are presented in OCI. Amendment to IAS 19, “Employee benefits“ eliminates the corridor approach and calculates finance costs on a net funding basis. The Company implemented the immediate and full recognition of actuarial gains/losses in other “Other comprehensive income“ (OCI) in 2006, meaning that the corridor method has not been applied by the Company as from that date and therefore the transition to the revised IAS 19 has not had an effect on the present obligation. The main issue to address is the implementation of the net interest cost/gain, which integrates the interest cost and expected return on assets to be based on a common discount rate. An analysis of fiscal year 2012 in relation to this amendment indicated an impact on pension costs for 2012 with an increase of approximately SEK 0.4 (–0.1) billion. The Company also needs to address the taxes to be incorporated into the defined benefit obligation. This amendment relates to the Swedish special payroll taxes to be reclassified from “Other current liabilities“ to “Post-employment benefits“ with an estimated amount of SEK 1.8 (1.8) billion as per December 31, 2012 *. The amendment also includes additional disclosure requirements on yearly financial and demographic assumptions, sensitivity analysis, duration and multi-employer plans. Amendment to IFRS 7, “Financial instruments: Disclosures’ on asset and liability offsetting”. This amendment requires disclosure of gross amounts related to financial instruments for which offset has been made. * See also footnote under the balance sheet.
Ericsson First Quarter Report 2013 25
Accounting policies (continued) IFRS 10, “Consolidated financial statements“. The objective of IFRS 10 is to establish principles for the presentation and preparation of consolidated financial statements when an entity controls one or more other entities to present consolidated financial statements. It defines the principle of control, and establishes control as the basis for consolidation. It sets out how to apply the principle of control to identify whether an investor controls an investee and therefore must consolidate the investee. An entity controls an investee if the entity has power over the investee, has the ability to use the power and is exposed to variable returns. It also sets out the accounting requirements for the preparation of consolidated financial statements. IFRS 11, “Joint arrangements“ is a more realistic reflection of joint arrangements by focusing on the rights and obligations of the arrangement rather than its legal form. There are two types of joint arrangement: joint operations and joint ventures. Proportional consolidation of joint ventures is no longer allowed. The Company did not apply the proportionate consolidation method prior to 2013. IFRS 12, “Disclosures of interests in other entities“ includes the disclosure requirements for all forms of interests in other entities, including joint arrangements, associates, structured entities and other off balance sheet vehicles. IFRS 13, “Fair value measurement” does not extend the use of fair value accounting but provide guidance on how it should be applied where its use is already required or permitted by other standards within IFRS. This standard has also added disclosure requirements in IAS 34, Interim Financial Reporting regarding the disclosure for financial instruments. IAS 27 (revised 2011), “Separate financial statements” includes the provisions on separate financial statements that are left after the control provisions of IAS 27 have been included in the new IFRS 10. IAS 28 (revised 2011), “Associates and joint ventures” includes the requirements for joint ventures, as well as associates, to be equity accounted following the issue of IFRS 11. None of the new or amended standards and interpretations has had any significant impact on the financial result or position of the Company. There is no difference between IFRS effective as per March 31, 2013 and IFRS as endorsed by the EU. Disclosures required by the IASB on an interim basis as from 2013 Fair valuation of financial instruments The fair value of the Company’s financial instruments, recognized at fair value, is determined based on quoted market prices or rates. Financial instruments, measured according to the category “Fair value through profit or loss” showed a net fair value measurement positive effect of SEK 1.1 billion. The amount is recognized in the balance sheet as per March 31, 2013. Book value for “Notes and bond loans“ amount to SEK 16.2 billion and fair value to SEK 16.7 billion. Fair values of “Current part of non-current borrowings“, “Other borrowings non-current“ as well as “Other financial instruments“ are not estimated to materially differ from book values. For further information about valuation principles, please see Note C1, “Significant accounting policies” in the Annual Report of 2012.
Ericsson First Quarter Report 2013 26
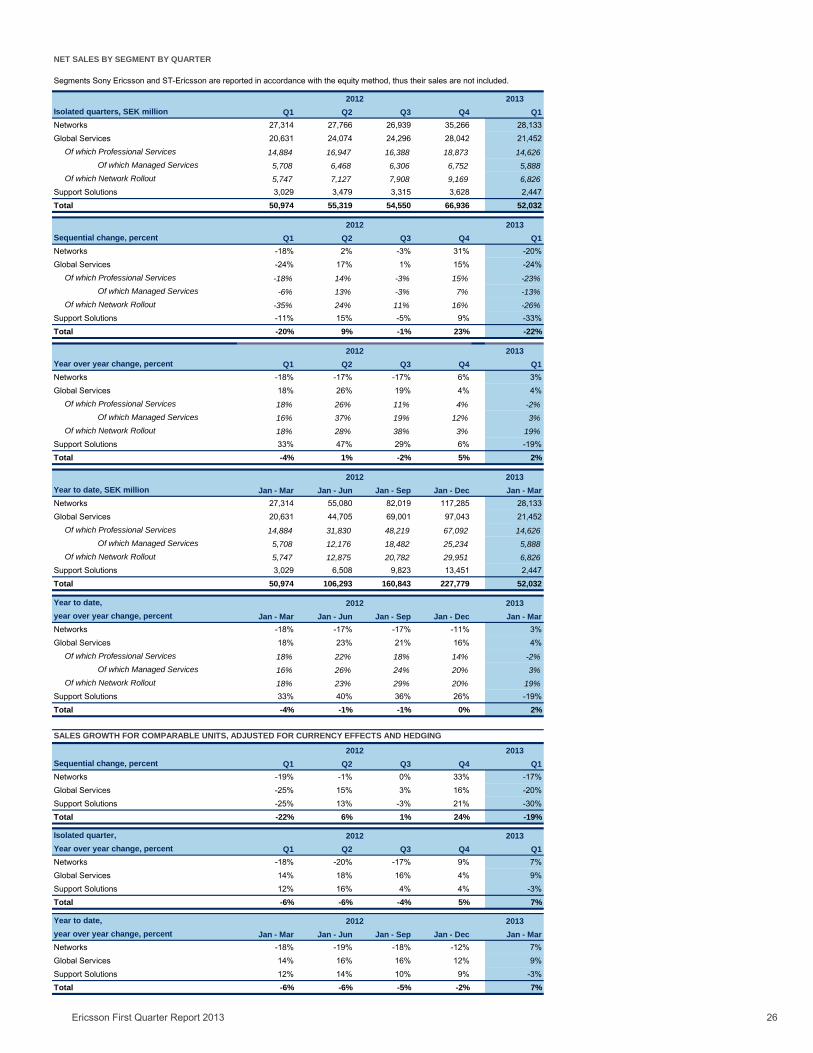
2013Isolated quarters, SEK million Q1 Q2 Q3 Q4 Q1Networks 27,314 27,766 26,939 35,266 28,133Global Services 20,631 24,074 24,296 28,042 21,452
Of which Professional Services 14,884 16,947 16,388 18,873 14,626Of which Managed Services 5,708 6,468 6,306 6,752 5,888
Of which Network Rollout 5,747 7,127 7,908 9,169 6,826Support Solutions 3,029 3,479 3,315 3,628 2,447Total 50,974 55,319 54,550 66,936 52,032
2013Sequential change, percent Q1 Q2 Q3 Q4 Q1Networks -18% 2% -3% 31% -20%Global Services -24% 17% 1% 15% -24%
Of which Professional Services -18% 14% -3% 15% -23%Of which Managed Services -6% 13% -3% 7% -13%
Of which Network Rollout -35% 24% 11% 16% -26%Support Solutions -11% 15% -5% 9% -33%Total -20% 9% -1% 23% -22%
2013Year over year change, percent Q1 Q2 Q3 Q4 Q1Networks -18% -17% -17% 6% 3%Global Services 18% 26% 19% 4% 4%
Of which Professional Services 18% 26% 11% 4% -2%Of which Managed Services 16% 37% 19% 12% 3%
Of which Network Rollout 18% 28% 38% 3% 19%Support Solutions 33% 47% 29% 6% -19%Total -4% 1% -2% 5% 2%
2013Year to date, SEK million Jan - Mar Jan - Jun Jan - Sep Jan - Dec Jan - MarNetworks 27,314 55,080 82,019 117,285 28,133Global Services 20,631 44,705 69,001 97,043 21,452
Of which Professional Services 14,884 31,830 48,219 67,092 14,626Of which Managed Services 5,708 12,176 18,482 25,234 5,888
Of which Network Rollout 5,747 12,875 20,782 29,951 6,826Support Solutions 3,029 6,508 9,823 13,451 2,447Total 50,974 106,293 160,843 227,779 52,032
Year to date, 2013year over year change, percent Jan - Mar Jan - Jun Jan - Sep Jan - Dec Jan - MarNetworks -18% -17% -17% -11% 3%Global Services 18% 23% 21% 16% 4%
Of which Professional Services 18% 22% 18% 14% -2%Of which Managed Services 16% 26% 24% 20% 3%
Of which Network Rollout 18% 23% 29% 20% 19%Support Solutions 33% 40% 36% 26% -19%Total -4% -1% -1% 0% 2%
2013Sequential change, percent Q1 Q2 Q3 Q4 Q1Networks -19% -1% 0% 33% -17%Global Services -25% 15% 3% 16% -20%Support Solutions -25% 13% -3% 21% -30%Total -22% 6% 1% 24% -19%
Isolated quarter, 2013Year over year change, percent Q1 Q2 Q3 Q4 Q1Networks -18% -20% -17% 9% 7%Global Services 14% 18% 16% 4% 9%Support Solutions 12% 16% 4% 4% -3%Total -6% -6% -4% 5% 7%
Year to date, 2013year over year change, percent Jan - Mar Jan - Jun Jan - Sep Jan - Dec Jan - MarNetworks -18% -19% -18% -12% 7%Global Services 14% 16% 16% 12% 9%Support Solutions 12% 14% 10% 9% -3%Total -6% -6% -5% -2% 7%
NET SALES BY SEGMENT BY QUARTER
Segments Sony Ericsson and ST-Ericsson are reported in accordance with the equity method, thus their sales are not included.
2012
2012
2012
SALES GROWTH FOR COMPARABLE UNITS, ADJUSTED FOR CURRENCY EFFECTS AND HEDGING
2012
2012
2012
2012
2012
Ericsson First Quarter Report 2013 27
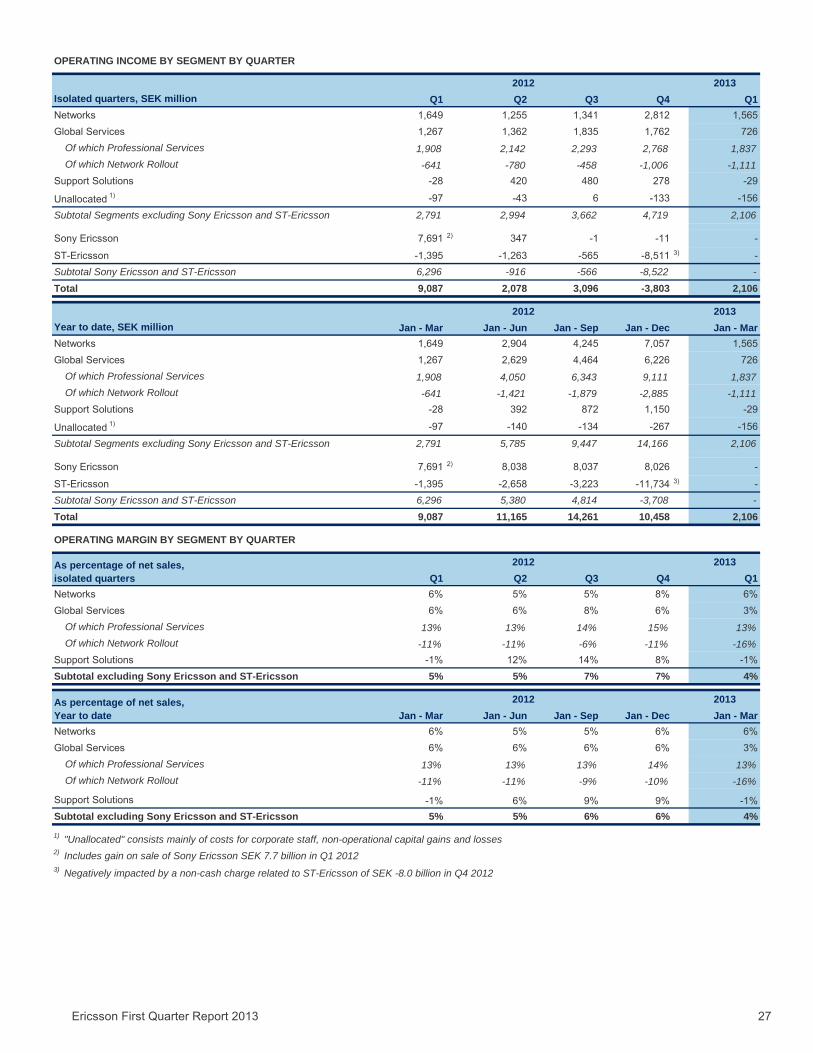
2013Isolated quarters, SEK million Q1 Q2 Q3 Q4 Q1Networks 1,649 1,255 1,341 2,812 1,565Global Services 1,267 1,362 1,835 1,762 726
Of which Professional Services 1,908 2,142 2,293 2,768 1,837Of which Network Rollout -641 -780 -458 -1,006 -1,111
Support Solutions -28 420 480 278 -29
Unallocated 1) -97 -43 6 -133 -156
Subtotal Segments excluding Sony Ericsson and ST-Ericsson 2,791 2,994 3,662 4,719 2,106
Sony Ericsson 7,691 2) 347 -1 -11 -
ST-Ericsson -1,395 -1,263 -565 -8,511 3) -Subtotal Sony Ericsson and ST-Ericsson 6,296 -916 -566 -8,522 -Total 9,087 2,078 3,096 -3,803 2,106
2013Year to date, SEK million Jan - Mar Jan - Jun Jan - Sep Jan - Dec Jan - MarNetworks 1,649 2,904 4,245 7,057 1,565Global Services 1,267 2,629 4,464 6,226 726
Of which Professional Services 1,908 4,050 6,343 9,111 1,837Of which Network Rollout -641 -1,421 -1,879 -2,885 -1,111
Support Solutions -28 392 872 1,150 -29
Unallocated 1) -97 -140 -134 -267 -156
Subtotal Segments excluding Sony Ericsson and ST-Ericsson 2,791 5,785 9,447 14,166 2,106
Sony Ericsson 7,691 2) 8,038 8,037 8,026 -
ST-Ericsson -1,395 -2,658 -3,223 -11,734 3) -Subtotal Sony Ericsson and ST-Ericsson 6,296 5,380 4,814 -3,708 -Total 9,087 11,165 14,261 10,458 2,106
2013Q1 Q2 Q3 Q4 Q1
Networks 6% 5% 5% 8% 6%Global Services 6% 6% 8% 6% 3%
Of which Professional Services 13% 13% 14% 15% 13%Of which Network Rollout -11% -11% -6% -11% -16%
Support Solutions -1% 12% 14% 8% -1%Subtotal excluding Sony Ericsson and ST-Ericsson 5% 5% 7% 7% 4%
2013Jan - Mar Jan - Jun Jan - Sep Jan - Dec Jan - Mar
Networks 6% 5% 5% 6% 6%Global Services 6% 6% 6% 6% 3%
Of which Professional Services 13% 13% 13% 14% 13%Of which Network Rollout -11% -11% -9% -10% -16%
Support Solutions -1% 6% 9% 9% -1%Subtotal excluding Sony Ericsson and ST-Ericsson 5% 5% 6% 6% 4%
3) Negatively impacted by a non-cash charge related to ST-Ericsson of SEK -8.0 billion in Q4 2012
OPERATING INCOME BY SEGMENT BY QUARTER
2012
2012
2) Includes gain on sale of Sony Ericsson SEK 7.7 billion in Q1 2012
OPERATING MARGIN BY SEGMENT BY QUARTER
2012
2012
As percentage of net sales, isolated quarters
As percentage of net sales, Year to date
1) "Unallocated" consists mainly of costs for corporate staff, non-operational capital gains and losses
Ericsson First Quarter Report 2013 28
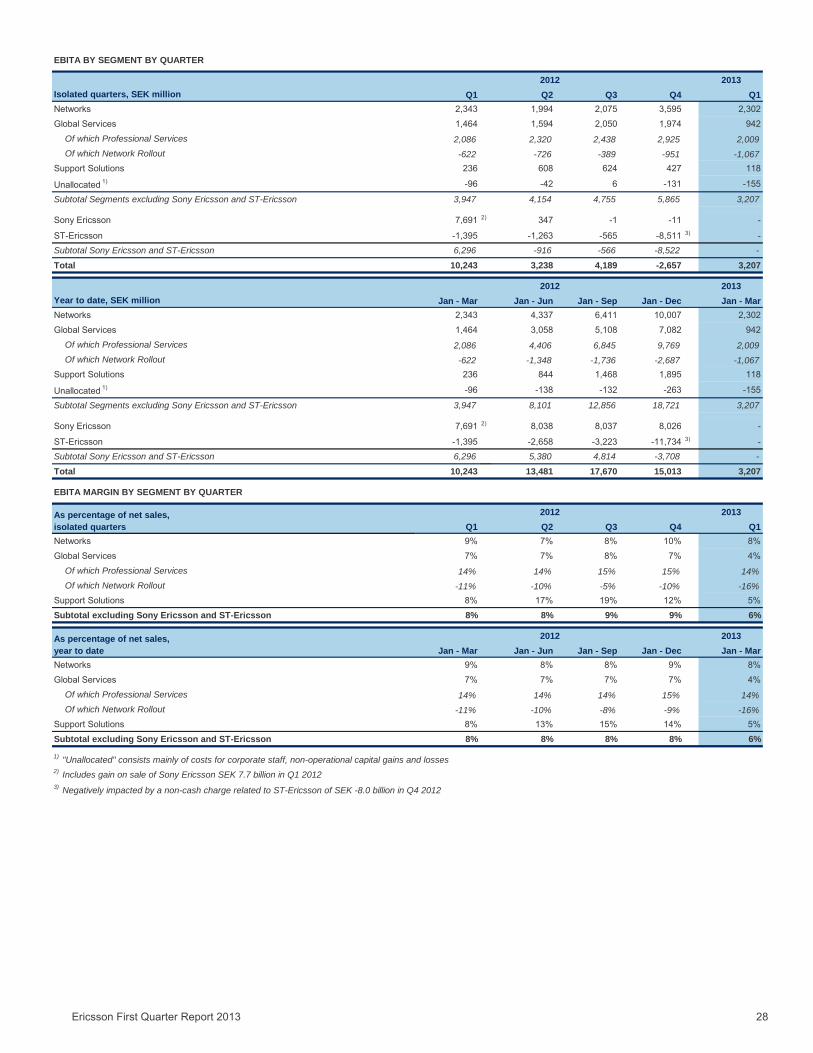
2013Isolated quarters, SEK million Q1 Q2 Q3 Q4 Q1Networks 2,343 1,994 2,075 3,595 2,302Global Services 1,464 1,594 2,050 1,974 942
Of which Professional Services 2,086 2,320 2,438 2,925 2,009Of which Network Rollout -622 -726 -389 -951 -1,067
Support Solutions 236 608 624 427 118
Unallocated 1) -96 -42 6 -131 -155
Subtotal Segments excluding Sony Ericsson and ST-Ericsson 3,947 4,154 4,755 5,865 3,207
Sony Ericsson 7,691 2) 347 -1 -11 -
ST-Ericsson -1,395 -1,263 -565 -8,511 3) -Subtotal Sony Ericsson and ST-Ericsson 6,296 -916 -566 -8,522 -
Total 10,243 3,238 4,189 -2,657 3,207
2013Year to date, SEK million Jan - Mar Jan - Jun Jan - Sep Jan - Dec Jan - MarNetworks 2,343 4,337 6,411 10,007 2,302Global Services 1,464 3,058 5,108 7,082 942
Of which Professional Services 2,086 4,406 6,845 9,769 2,009Of which Network Rollout -622 -1,348 -1,736 -2,687 -1,067
Support Solutions 236 844 1,468 1,895 118
Unallocated 1) -96 -138 -132 -263 -155
Subtotal Segments excluding Sony Ericsson and ST-Ericsson 3,947 8,101 12,856 18,721 3,207
Sony Ericsson 7,691 2) 8,038 8,037 8,026 -
ST-Ericsson -1,395 -2,658 -3,223 -11,734 3) -Subtotal Sony Ericsson and ST-Ericsson 6,296 5,380 4,814 -3,708 -
Total 10,243 13,481 17,670 15,013 3,207
2013Q1 Q2 Q3 Q4 Q1
Networks 9% 7% 8% 10% 8%Global Services 7% 7% 8% 7% 4%
Of which Professional Services 14% 14% 15% 15% 14%Of which Network Rollout -11% -10% -5% -10% -16%
Support Solutions 8% 17% 19% 12% 5%Subtotal excluding Sony Ericsson and ST-Ericsson 8% 8% 9% 9% 6%
2013Jan - Mar Jan - Jun Jan - Sep Jan - Dec Jan - Mar
Networks 9% 8% 8% 9% 8%Global Services 7% 7% 7% 7% 4%
Of which Professional Services 14% 14% 14% 15% 14%Of which Network Rollout -11% -10% -8% -9% -16%
Support Solutions 8% 13% 15% 14% 5%Subtotal excluding Sony Ericsson and ST-Ericsson 8% 8% 8% 8% 6%
EBITA BY SEGMENT BY QUARTER
2012
2012
EBITA MARGIN BY SEGMENT BY QUARTER
3) Negatively impacted by a non-cash charge related to ST-Ericsson of SEK -8.0 billion in Q4 2012
As percentage of net sales, isolated quarters
2012
2012
2) Includes gain on sale of Sony Ericsson SEK 7.7 billion in Q1 2012
As percentage of net sales, year to date
1) "Unallocated" consists mainly of costs for corporate staff, non-operational capital gains and losses
Ericsson First Quarter Report 2013 29
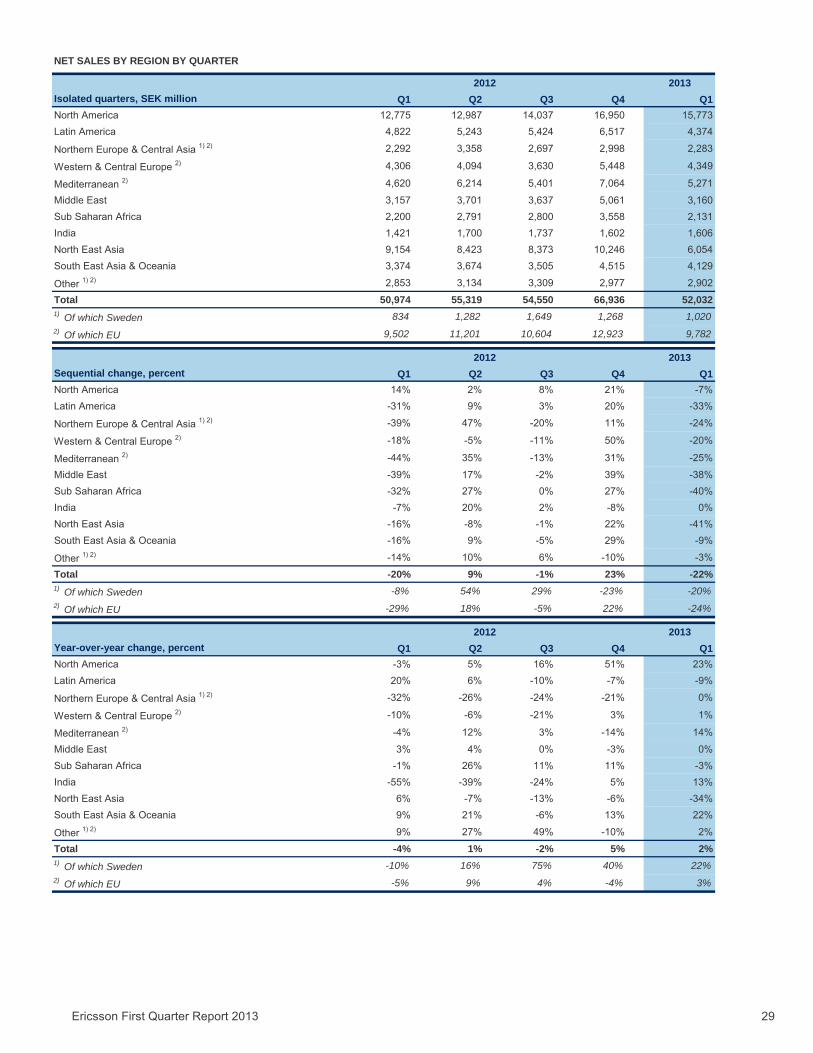
2013Isolated quarters, SEK million Q1 Q2 Q3 Q4 Q1North America 12,775 12,987 14,037 16,950 15,773Latin America 4,822 5,243 5,424 6,517 4,374
Northern Europe & Central Asia 1) 2) 2,292 3,358 2,697 2,998 2,283
Western & Central Europe 2) 4,306 4,094 3,630 5,448 4,349
Mediterranean 2) 4,620 6,214 5,401 7,064 5,271
Middle East 3,157 3,701 3,637 5,061 3,160Sub Saharan Africa 2,200 2,791 2,800 3,558 2,131India 1,421 1,700 1,737 1,602 1,606North East Asia 9,154 8,423 8,373 10,246 6,054South East Asia & Oceania 3,374 3,674 3,505 4,515 4,129
Other 1) 2) 2,853 3,134 3,309 2,977 2,902
Total 50,974 55,319 54,550 66,936 52,0321) Of which Sweden 834 1,282 1,649 1,268 1,0202) Of which EU 9,502 11,201 10,604 12,923 9,782
2013Sequential change, percent Q1 Q2 Q3 Q4 Q1North America 14% 2% 8% 21% -7%Latin America -31% 9% 3% 20% -33%
Northern Europe & Central Asia 1) 2) -39% 47% -20% 11% -24%
Western & Central Europe 2) -18% -5% -11% 50% -20%
Mediterranean 2) -44% 35% -13% 31% -25%
Middle East -39% 17% -2% 39% -38%Sub Saharan Africa -32% 27% 0% 27% -40%India -7% 20% 2% -8% 0%North East Asia -16% -8% -1% 22% -41%South East Asia & Oceania -16% 9% -5% 29% -9%
Other 1) 2) -14% 10% 6% -10% -3%
Total -20% 9% -1% 23% -22%1) Of which Sweden -8% 54% 29% -23% -20%2) Of which EU -29% 18% -5% 22% -24%
2013Year-over-year change, percent Q1 Q2 Q3 Q4 Q1North America -3% 5% 16% 51% 23%Latin America 20% 6% -10% -7% -9%
Northern Europe & Central Asia 1) 2) -32% -26% -24% -21% 0%
Western & Central Europe 2) -10% -6% -21% 3% 1%
Mediterranean 2) -4% 12% 3% -14% 14%
Middle East 3% 4% 0% -3% 0%Sub Saharan Africa -1% 26% 11% 11% -3%India -55% -39% -24% 5% 13%North East Asia 6% -7% -13% -6% -34%South East Asia & Oceania 9% 21% -6% 13% 22%
Other 1) 2) 9% 27% 49% -10% 2%
Total -4% 1% -2% 5% 2%1) Of which Sweden -10% 16% 75% 40% 22%2) Of which EU -5% 9% 4% -4% 3%
NET SALES BY REGION BY QUARTER
2012
2012
2012
Ericsson First Quarter Report 2013 30
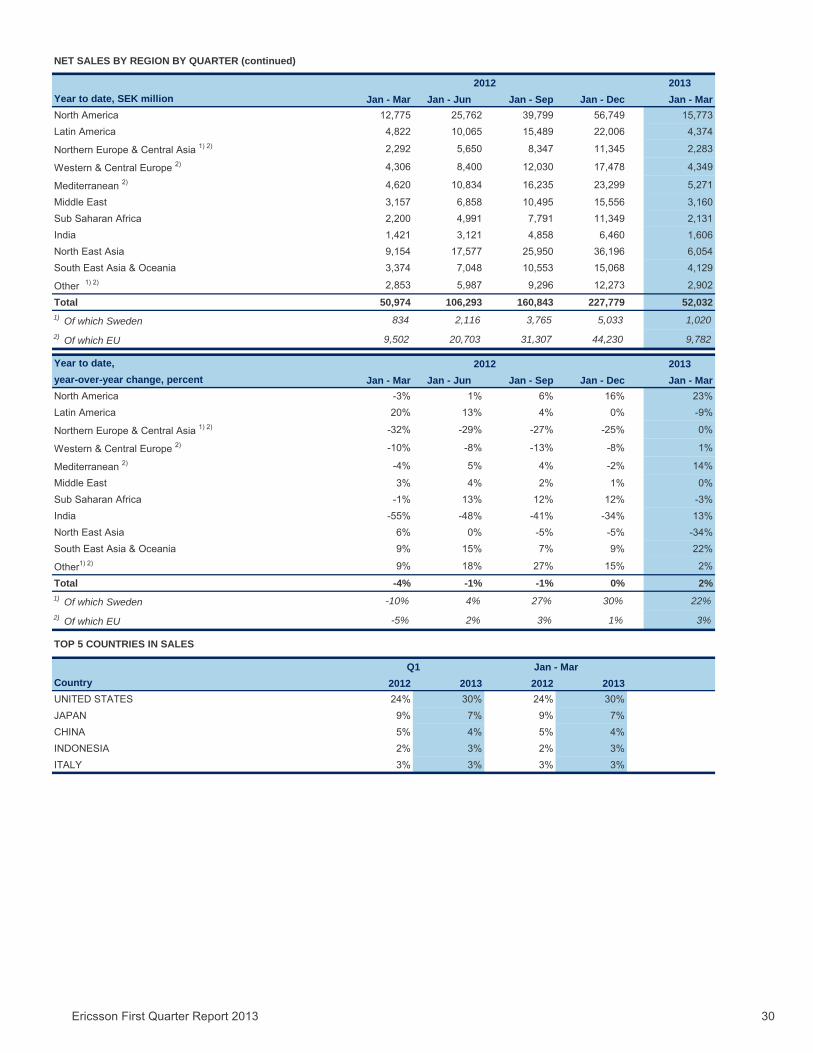
2013Year to date, SEK million Jan - Mar Jan - Jun Jan - Sep Jan - Dec Jan - MarNorth America 12,775 25,762 39,799 56,749 15,773Latin America 4,822 10,065 15,489 22,006 4,374
Northern Europe & Central Asia 1) 2) 2,292 5,650 8,347 11,345 2,283
Western & Central Europe 2) 4,306 8,400 12,030 17,478 4,349
Mediterranean 2) 4,620 10,834 16,235 23,299 5,271
Middle East 3,157 6,858 10,495 15,556 3,160Sub Saharan Africa 2,200 4,991 7,791 11,349 2,131India 1,421 3,121 4,858 6,460 1,606North East Asia 9,154 17,577 25,950 36,196 6,054South East Asia & Oceania 3,374 7,048 10,553 15,068 4,129
Other 1) 2) 2,853 5,987 9,296 12,273 2,902
Total 50,974 106,293 160,843 227,779 52,0321) Of which Sweden 834 2,116 3,765 5,033 1,0202) Of which EU 9,502 20,703 31,307 44,230 9,782
Year to date, 2013year-over-year change, percent Jan - Mar Jan - Jun Jan - Sep Jan - Dec Jan - MarNorth America -3% 1% 6% 16% 23%Latin America 20% 13% 4% 0% -9%
Northern Europe & Central Asia 1) 2) -32% -29% -27% -25% 0%
Western & Central Europe 2) -10% -8% -13% -8% 1%
Mediterranean 2) -4% 5% 4% -2% 14%
Middle East 3% 4% 2% 1% 0%Sub Saharan Africa -1% 13% 12% 12% -3%India -55% -48% -41% -34% 13%North East Asia 6% 0% -5% -5% -34%South East Asia & Oceania 9% 15% 7% 9% 22%
Other1) 2) 9% 18% 27% 15% 2%
Total -4% -1% -1% 0% 2%1) Of which Sweden -10% 4% 27% 30% 22%2) Of which EU -5% 2% 3% 1% 3%
TOP 5 COUNTRIES IN SALES
Country 2012 2013 2012 2013UNITED STATES 24% 30% 24% 30%JAPAN 9% 7% 9% 7%CHINA 5% 4% 5% 4%INDONESIA 2% 3% 2% 3%ITALY 3% 3% 3% 3%
NET SALES BY REGION BY QUARTER (continued)
2012
Jan - Mar
2012
Q1

Ericsson First Quarter Report 2013 31
Net-works
Global Services
Support Solutions Total
Net-works
Global Services
Support Solutions Total
North America 9,178 6,109 486 15,773 9,178 6,109 486 15,773Latin America 2,003 2,017 354 4,374 2,003 2,017 354 4,374Northern Europe & Central Asia 1,265 954 64 2,283 1,265 954 64 2,283Western & Central Europe 1,891 2,341 117 4,349 1,891 2,341 117 4,349Mediterranean 2,442 2,688 141 5,271 2,442 2,688 141 5,271Middle East 1,417 1,472 271 3,160 1,417 1,472 271 3,160Sub Saharan Africa 1,100 822 209 2,131 1,100 822 209 2,131India 858 627 121 1,606 858 627 121 1,606North East Asia 3,377 2,590 87 6,054 3,377 2,590 87 6,054South East Asia & Oceania 2,600 1,421 108 4,129 2,600 1,421 108 4,129Other 2,002 411 489 2,902 2,002 411 489 2,902Total 28,133 21,452 2,447 52,032 28,133 21,452 2,447 52,032Share of Total 54% 41% 5% 100% 54% 41% 5% 100%
North America -2% -10% -40% -7%Latin America -30% -38% -11% -33%Northern Europe & Central Asia -19% -22% -69% -24%Western & Central Europe -19% -20% -34% -20%Mediterranean -11% -34% -45% -25%Middle East -43% -29% -49% -38%Sub Saharan Africa -46% -33% -26% -40%India -4% 8% -5% 0%North East Asia -48% -29% -31% -41%South East Asia & Oceania 2% -24% 15% -9%Other 2% 5% -22% -3%Total -20% -24% -33% -22%
North America 23% 30% -17% 23%Latin America -3% -20% 51% -9%Northern Europe & Central Asia 6% -6% -20% 0%Western & Central Europe 23% -9% -40% 1%Mediterranean 21% 11% -17% 14%Middle East 8% -11% 44% 0%Sub Saharan Africa -12% 4% 39% -3%India 30% 1% -12% 13%North East Asia -46% -6% -29% -34%South East Asia & Oceania 43% 0% -21% 22%Other 19% 180% -52% 2%Total 3% 4% -19% 2%
North America 23% 30% -17% 23%Latin America -3% -20% 51% -9%Northern Europe & Central Asia 6% -6% -20% 0%Western & Central Europe 23% -9% -40% 1%Mediterranean 21% 11% -17% 14%Middle East 8% -11% 44% 0%Sub Saharan Africa -12% 4% 39% -3%India 30% 1% -12% 13%North East Asia -46% -6% -29% -34%South East Asia & Oceania 43% 0% -21% 22%Other 19% 180% -52% 2%Total 3% 4% -19% 2%
Support Solutions Total
Year over year change, percent
Year over year change, percentNet-
worksGlobal
Services
NET SALES BY REGION BY SEGMENT
Revenue from Telcordia is reported 50/50 between segments Global Services and Support Solutions. In the regional dimension, all of Telcordia sales is reported in Support Solutions, except for North America where it is split 50/50. IPX was divested Q3 2012. For the first nine months of 2012, IPX was included in Support Solutions and region Other.
Sequential change, percentNet-
worksGlobal
ServicesSupport
Solutions
Q1 2013
Jan - Mar 2013
Q1 2013, SEK million Jan - Mar 2013, SEK million
Q1 2013
Total
Net-works
Global Services
Support Solutions Total
Ericsson First Quarter Report 2013 32
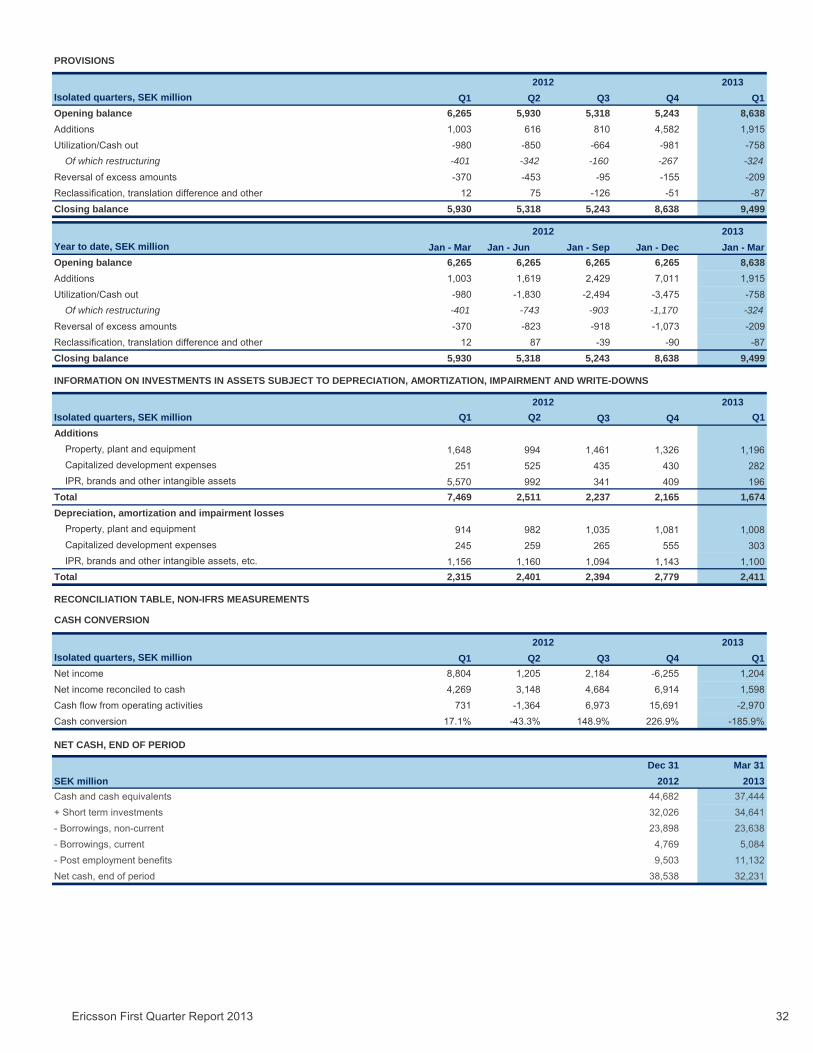
2013Isolated quarters, SEK million Q1 Q2 Q3 Q4 Q1Opening balance 6,265 5,930 5,318 5,243 8,638Additions 1,003 616 810 4,582 1,915Utilization/Cash out -980 -850 -664 -981 -758
Of which restructuring -401 -342 -160 -267 -324
Reversal of excess amounts -370 -453 -95 -155 -209Reclassification, translation difference and other 12 75 -126 -51 -87Closing balance 5,930 5,318 5,243 8,638 9,499
2013Year to date, SEK million Jan - Mar Jan - Jun Jan - Sep Jan - Dec Jan - MarOpening balance 6,265 6,265 6,265 6,265 8,638Additions 1,003 1,619 2,429 7,011 1,915Utilization/Cash out -980 -1,830 -2,494 -3,475 -758
Of which restructuring -401 -743 -903 -1,170 -324
Reversal of excess amounts -370 -823 -918 -1,073 -209Reclassification, translation difference and other 12 87 -39 -90 -87Closing balance 5,930 5,318 5,243 8,638 9,499
2013Isolated quarters, SEK million Q1 Q2 Q3 Q4 Q1Additions
Property, plant and equipment 1,648 994 1,461 1,326 1,196Capitalized development expenses 251 525 435 430 282IPR, brands and other intangible assets 5,570 992 341 409 196
Total 7,469 2,511 2,237 2,165 1,674Depreciation, amortization and impairment losses
Property, plant and equipment 914 982 1,035 1,081 1,008Capitalized development expenses 245 259 265 555 303IPR, brands and other intangible assets, etc. 1,156 1,160 1,094 1,143 1,100
Total 2,315 2,401 2,394 2,779 2,411
CASH CONVERSION
2013Isolated quarters, SEK million Q1 Q2 Q3 Q4 Q1Net income 8,804 1,205 2,184 -6,255 1,204Net income reconciled to cash 4,269 3,148 4,684 6,914 1,598Cash flow from operating activities 731 -1,364 6,973 15,691 -2,970Cash conversion 17.1% -43.3% 148.9% 226.9% -185.9%
NET CASH, END OF PERIOD
Dec 31 Mar 31SEK million 2012 2013Cash and cash equivalents 44,682 37,444+ Short term investments 32,026 34,641- Borrowings, non-current 23,898 23,638- Borrowings, current 4,769 5,084- Post employment benefits 9,503 11,132Net cash, end of period 38,538 32,231
PROVISIONS
2012
RECONCILIATION TABLE, NON-IFRS MEASUREMENTS
2012
2012
2012
INFORMATION ON INVESTMENTS IN ASSETS SUBJECT TO DEPRECIATION, AMORTIZATION, IMPAIRMENT AND WRITE-DOWNS
Ericsson First Quarter Report 2013 33
OTHER INFORMATION
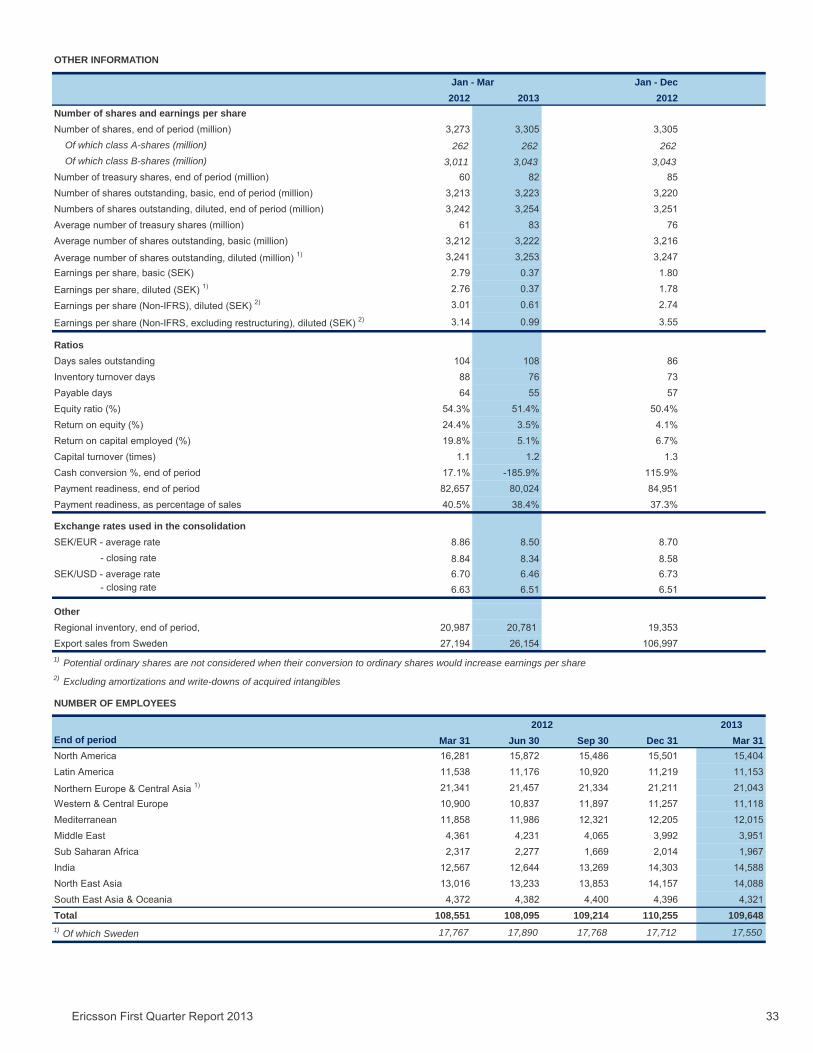
Jan - Dec2012 2013 2012
Number of shares and earnings per shareNumber of shares, end of period (million) 3,273 3,305 3,305
Of which class A-shares (million) 262 262 262Of which class B-shares (million) 3,011 3,043 3,043
Number of treasury shares, end of period (million) 60 82 85Number of shares outstanding, basic, end of period (million) 3,213 3,223 3,220Numbers of shares outstanding, diluted, end of period (million) 3,242 3,254 3,251Average number of treasury shares (million) 61 83 76Average number of shares outstanding, basic (million) 3,212 3,222 3,216
Average number of shares outstanding, diluted (million) 1) 3,241 3,253 3,247Earnings per share, basic (SEK) 2.79 0.37 1.80
Earnings per share, diluted (SEK) 1) 2.76 0.37 1.78
Earnings per share (Non-IFRS), diluted (SEK) 2) 3.01 0.61 2.74
Earnings per share (Non-IFRS, excluding restructuring), diluted (SEK) 2) 3.14 0.99 3.55
RatiosDays sales outstanding 104 108 86Inventory turnover days 88 76 73Payable days 64 55 57Equity ratio (%) 54.3% 51.4% 50.4%Return on equity (%) 24.4% 3.5% 4.1%Return on capital employed (%) 19.8% 5.1% 6.7%Capital turnover (times) 1.1 1.2 1.3Cash conversion %, end of period 17.1% -185.9% 115.9%Payment readiness, end of period 82,657 80,024 84,951Payment readiness, as percentage of sales 40.5% 38.4% 37.3%
Exchange rates used in the consolidationSEK/EUR - average rate 8.86 8.50 8.70
- closing rate 8.84 8.34 8.58SEK/USD - average rate 6.70 6.46 6.73
- closing rate 6.63 6.51 6.51
OtherRegional inventory, end of period, 20,987 20,781 19,353Export sales from Sweden 27,194 26,154 106,997
2013End of period Mar 31 Jun 30 Sep 30 Dec 31 Mar 31North America 16,281 15,872 15,486 15,501 15,404Latin America 11,538 11,176 10,920 11,219 11,153
Northern Europe & Central Asia 1) 21,341 21,457 21,334 21,211 21,043Western & Central Europe 10,900 10,837 11,897 11,257 11,118Mediterranean 11,858 11,986 12,321 12,205 12,015Middle East 4,361 4,231 4,065 3,992 3,951Sub Saharan Africa 2,317 2,277 1,669 2,014 1,967India 12,567 12,644 13,269 14,303 14,588North East Asia 13,016 13,233 13,853 14,157 14,088South East Asia & Oceania 4,372 4,382 4,400 4,396 4,321Total 108,551 108,095 109,214 110,255 109,6481) Of which Sweden 17,767 17,890 17,768 17,712 17,550
Jan - Mar
2) Excluding amortizations and write-downs of acquired intangibles
1) Potential ordinary shares are not considered when their conversion to ordinary shares would increase earnings per share
NUMBER OF EMPLOYEES
2012
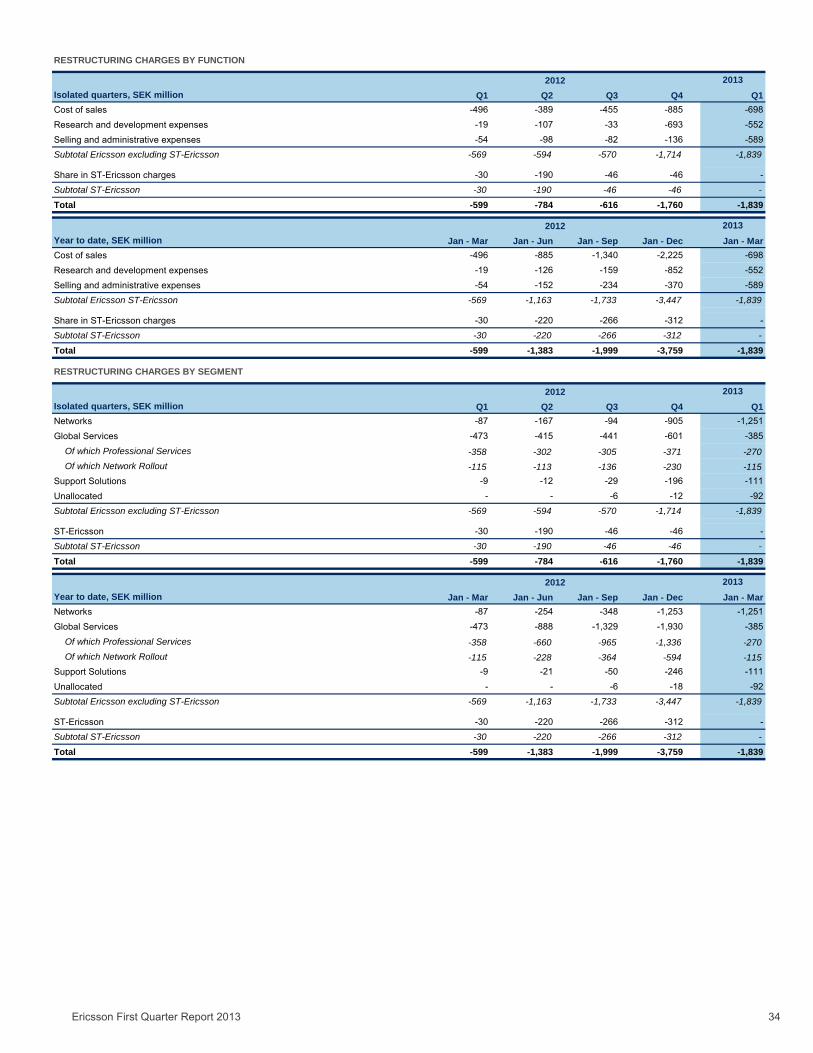
Ericsson First Quarter Report 2013 34
2013Isolated quarters, SEK million Q1 Q2 Q3 Q4 Q1Cost of sales -496 -389 -455 -885 -698
Research and development expenses -19 -107 -33 -693 -552
Selling and administrative expenses -54 -98 -82 -136 -589Subtotal Ericsson excluding ST-Ericsson -569 -594 -570 -1,714 -1,839
Share in ST-Ericsson charges -30 -190 -46 -46 -Subtotal ST-Ericsson -30 -190 -46 -46 -
Total -599 -784 -616 -1,760 -1,839
2013Year to date, SEK million Jan - Mar Jan - Jun Jan - Sep Jan - Dec Jan - MarCost of sales -496 -885 -1,340 -2,225 -698
Research and development expenses -19 -126 -159 -852 -552
Selling and administrative expenses -54 -152 -234 -370 -589Subtotal Ericsson ST-Ericsson -569 -1,163 -1,733 -3,447 -1,839
Share in ST-Ericsson charges -30 -220 -266 -312 -Subtotal ST-Ericsson -30 -220 -266 -312 -
Total -599 -1,383 -1,999 -3,759 -1,839
2013Isolated quarters, SEK million Q1 Q2 Q3 Q4 Q1Networks -87 -167 -94 -905 -1,251
Global Services -473 -415 -441 -601 -385
Of which Professional Services -358 -302 -305 -371 -270Of which Network Rollout -115 -113 -136 -230 -115
Support Solutions -9 -12 -29 -196 -111
Unallocated - - -6 -12 -92Subtotal Ericsson excluding ST-Ericsson -569 -594 -570 -1,714 -1,839
ST-Ericsson -30 -190 -46 -46 -Subtotal ST-Ericsson -30 -190 -46 -46 -
Total -599 -784 -616 -1,760 -1,839
2013Year to date, SEK million Jan - Mar Jan - Jun Jan - Sep Jan - Dec Jan - MarNetworks -87 -254 -348 -1,253 -1,251
Global Services -473 -888 -1,329 -1,930 -385
Of which Professional Services -358 -660 -965 -1,336 -270Of which Network Rollout -115 -228 -364 -594 -115
Support Solutions -9 -21 -50 -246 -111
Unallocated - - -6 -18 -92Subtotal Ericsson excluding ST-Ericsson -569 -1,163 -1,733 -3,447 -1,839
ST-Ericsson -30 -220 -266 -312 -Subtotal ST-Ericsson -30 -220 -266 -312 -
Total -599 -1,383 -1,999 -3,759 -1,839
2012
RESTRUCTURING CHARGES BY FUNCTION
2012
2012
2012
RESTRUCTURING CHARGES BY SEGMENT


