Five - Year Saltwater Intrusion Mapping Update Palm Beach County Water Resources Task Force January 30, 2020 Jonathan E. Shaw, PG Principal Hydrogeologist Water Supply Bureau, Water Resources Division
Transcript
Five-Year Saltwater Intrusion Mapping Update
Palm Beach County
Water Resources Task ForceJanuary 30, 2020
Jonathan E. Shaw, PGPrincipal Hydrogeologist
Water Supply Bureau, Water Resources Division
Agenda
Overview of Saltwater Intrusion and Aquifers
Importance to Wellfields and Infrastructure
Project Approach
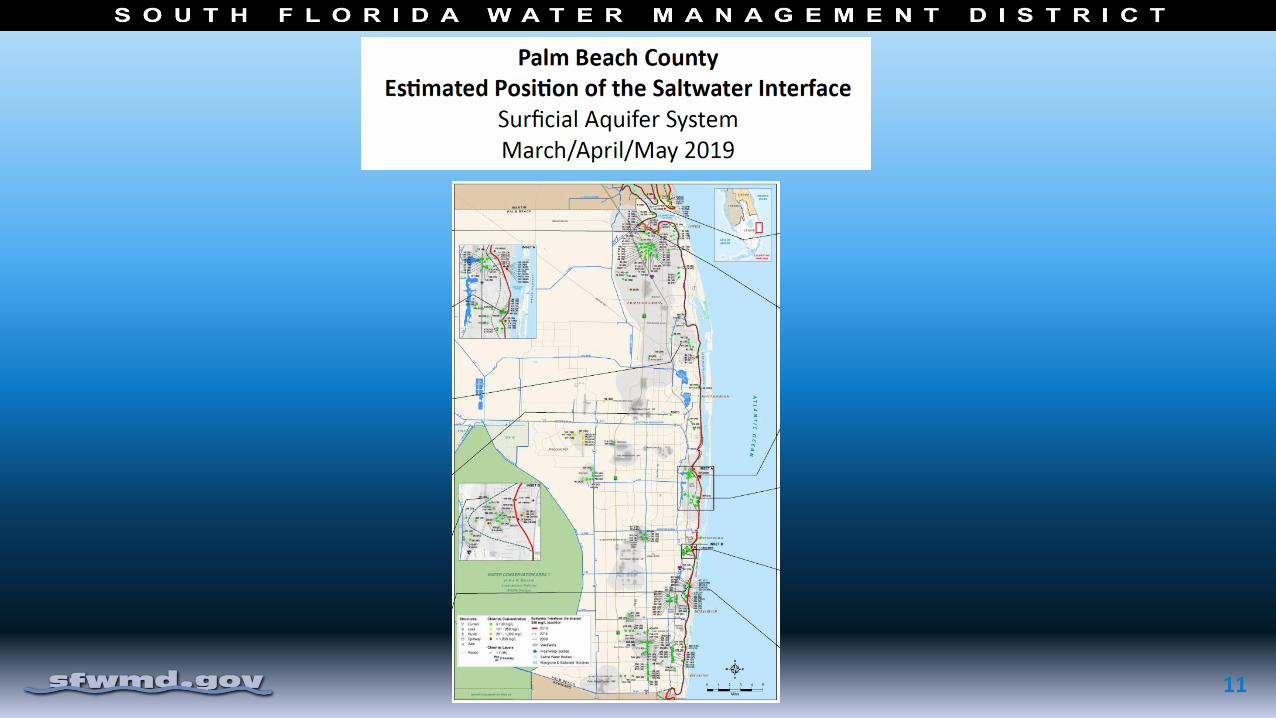
Results – Surficial Aquifer System – Palm Beach County
Conclusions
Next Steps
2
SFWMD Staff Acknowledgements
3
Manual “Felipe” Zamorano, Senior Scientist
Alexandra “Lexi” Hoffart, Geographer
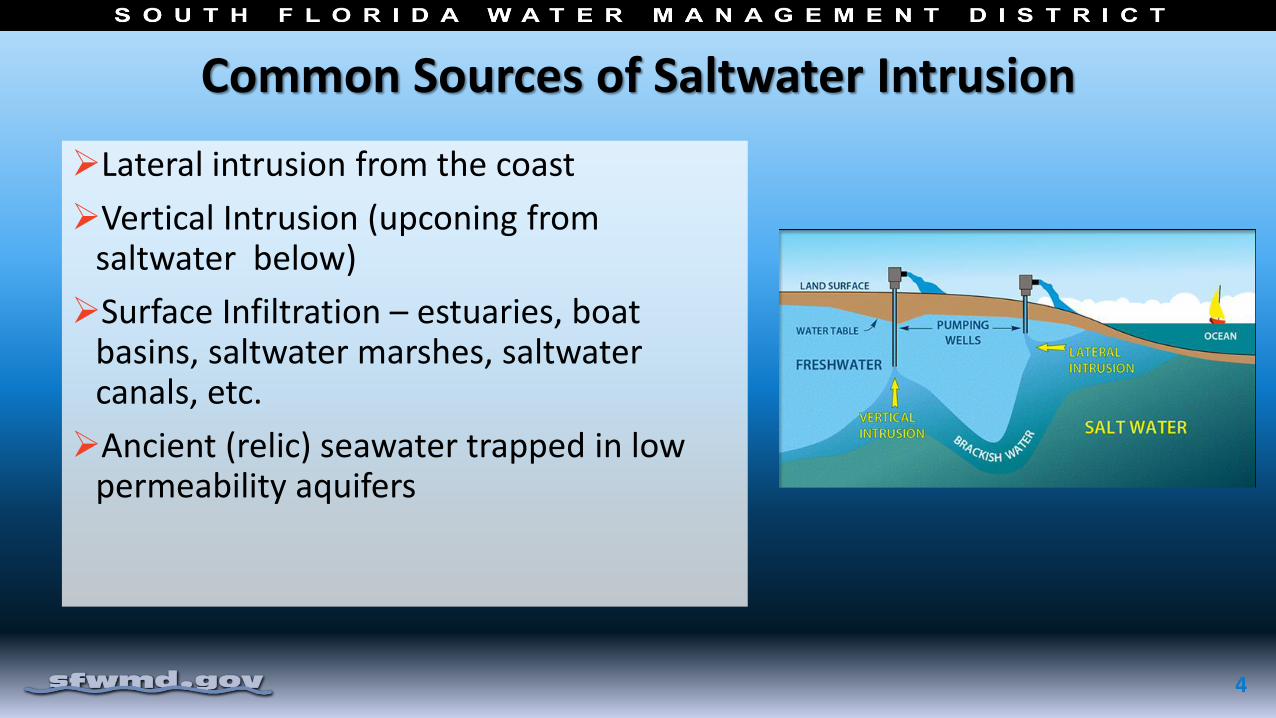
Common Sources of Saltwater Intrusion
4
Lateral intrusion from the coast
Vertical Intrusion (upconing from saltwater below)
Ancient (relic) seawater trapped in low permeability aquifers
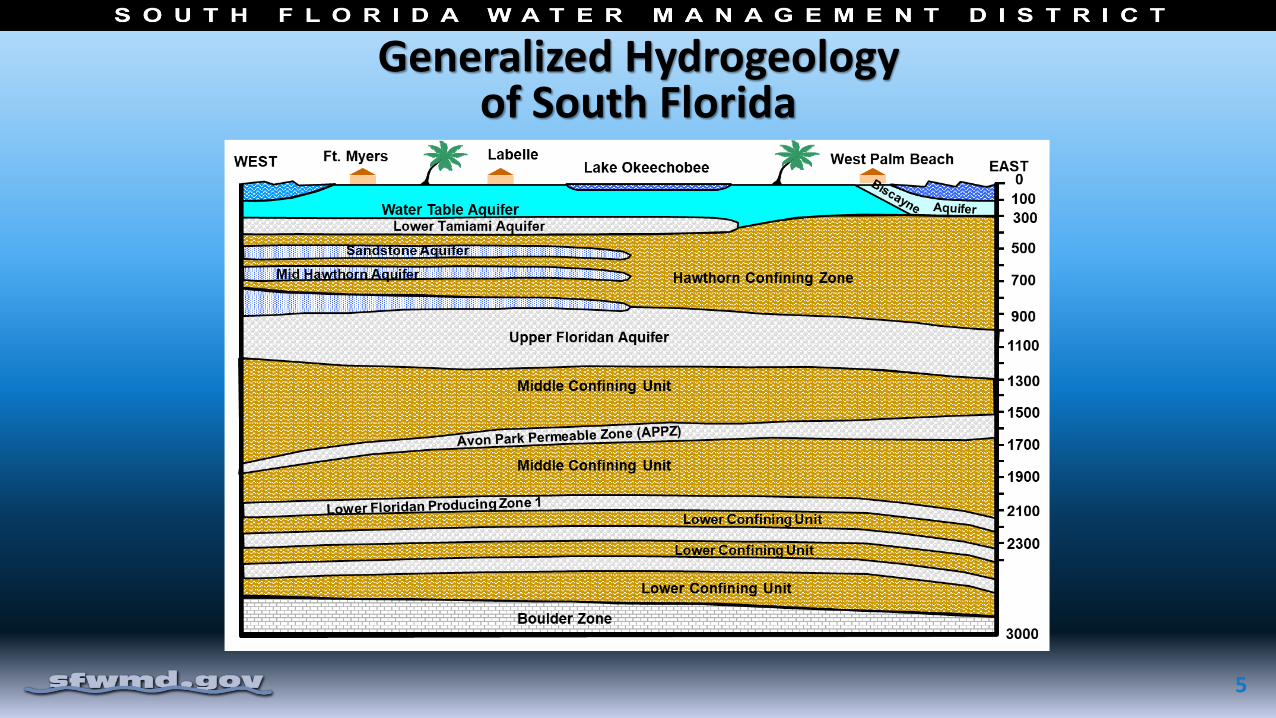
Generalized Hydrogeologyof South Florida
5
Why is this Important?
6
Wellfields are a major water supply source – protect investment
Once saltwater enters wells, very difficult – if not impossible -- to reverse
Very expensive to relocate wellfields and associated infrastructure (pipelines, treatment plants and processes, etc.)
Other sources of water more expensive to treat (e.g., Floridan aquifer – reverse osmosis)
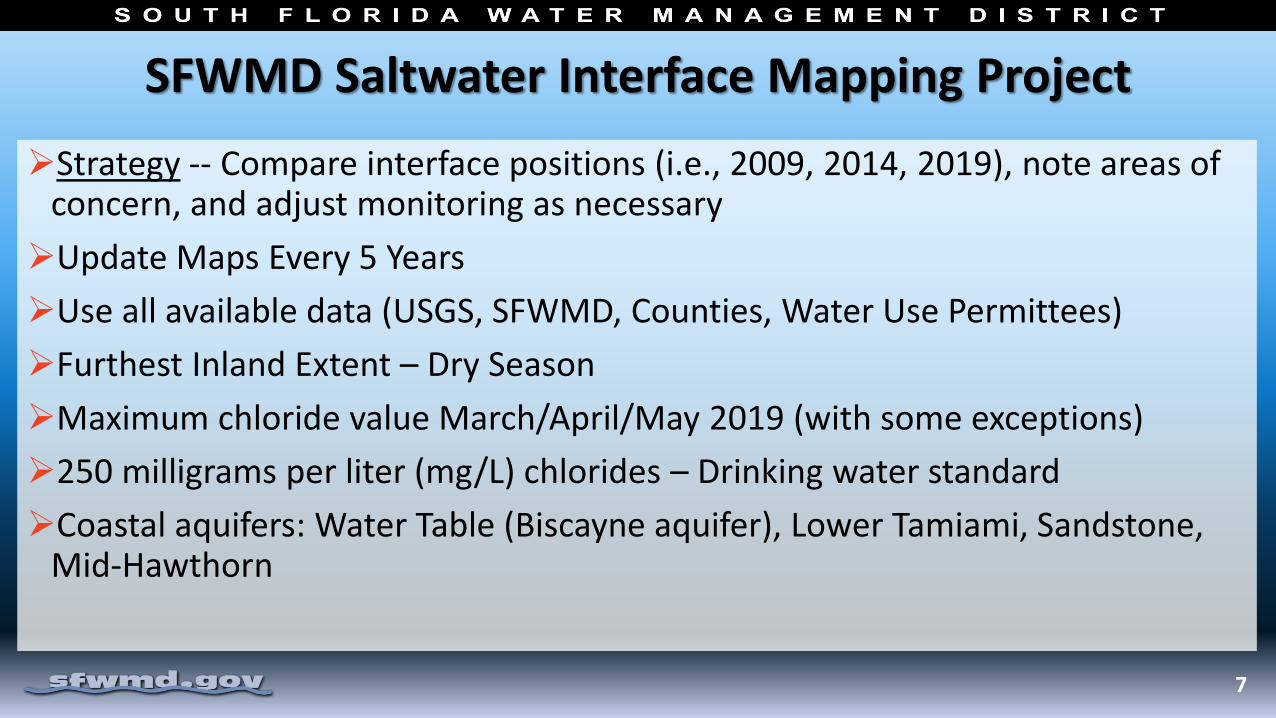
SFWMD Saltwater Interface Mapping Project
Strategy -- Compare interface positions (i.e., 2009, 2014, 2019), note areas of concern, and adjust monitoring as necessary
Update Maps Every 5 Years
Use all available data (USGS, SFWMD, Counties, Water Use Permittees)
Furthest Inland Extent – Dry Season
Maximum chloride value March/April/May 2019 (with some exceptions)
250 milligrams per liter (mg/L) chlorides – Drinking water standard
Coastal aquifers: Water Table (Biscayne aquifer), Lower Tamiami, Sandstone, Mid-Hawthorn
7
Mapping ChallengesRepresenting a 3-D feature on a 2-D map
Representing a dynamic interface with fixed-time snapshots
Representing a diffuse front with a single line
Mapping from data that may represent one of several saltwater intrusion pathways
Some wells used in 2009 and 2014 may not be available in 2019 (abandoned, destroyed, no longer monitored, etc.)
New wells added to 2019 may alter interpretation of isochlor line.
Existing monitor well spacing, well depth, construction
8
Other Considerations
Standardized well construction (i.e. short screen vs long)
Open interval position – base of aquifer
Standardized sampling techniques
Standardized parameters (chloride vs conductivity)
Sampling frequency
Analytical methodology (field and laboratory)
9
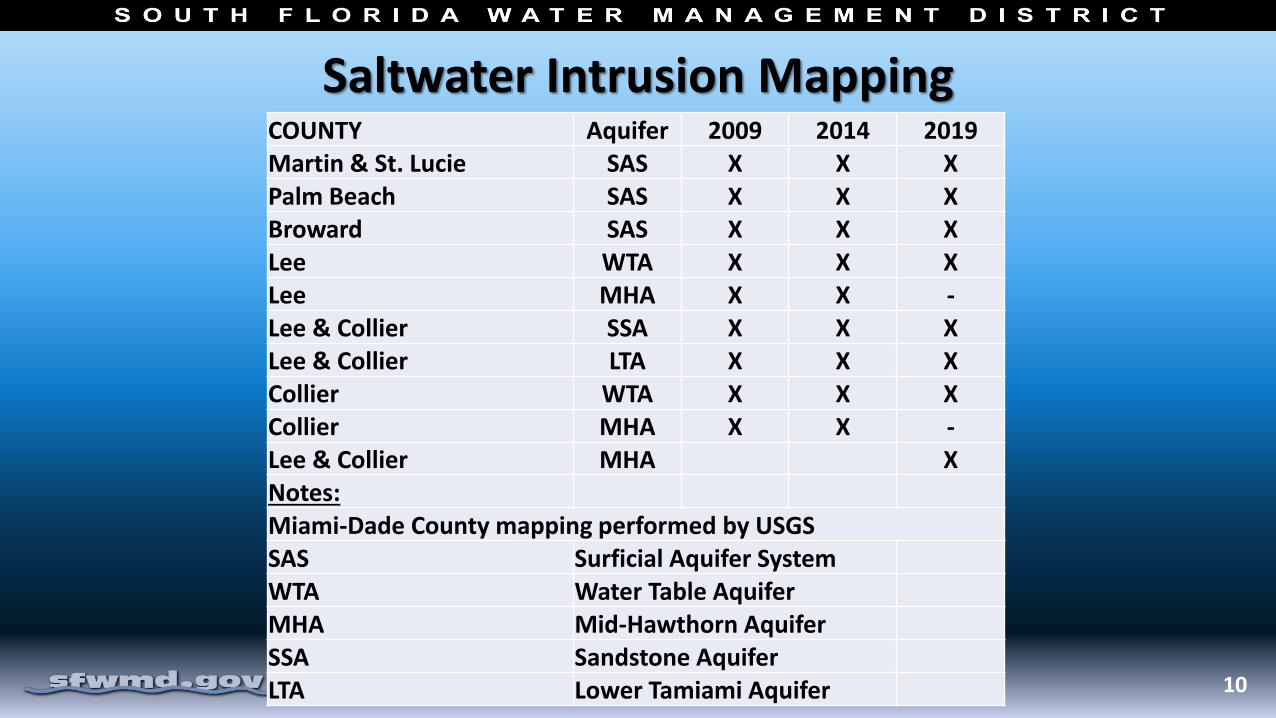
Saltwater Intrusion Mapping
10
COUNTY Aquifer 2009 2014 2019
Martin & St. Lucie SAS X X X
Palm Beach SAS X X X
Broward SAS X X X
Lee WTA X X X
Lee MHA X X -
Lee & Collier SSA X X X
Lee & Collier LTA X X X
Collier WTA X X X
Collier MHA X X -
Lee & Collier MHA X
Notes:
Miami-Dade County mapping performed by USGS
SAS Surficial Aquifer System
WTA Water Table Aquifer
COUNTY Aquifer 2009 2014 2019Martin & St. Lucie SAS X X XPalm Beach SAS X X XBroward SAS X X XLee WTA X X XLee MHA X X -Lee & Collier SSA X X XLee & Collier LTA X X XCollier WTA X X XCollier MHA X X -Lee & Collier MHA XNotes:Miami-Dade County mapping performed by USGSSAS Surficial Aquifer SystemWTA Water Table AquiferMHA Mid-Hawthorn AquiferSSA Sandstone AquiferLTA Lower Tamiami Aquifer
11
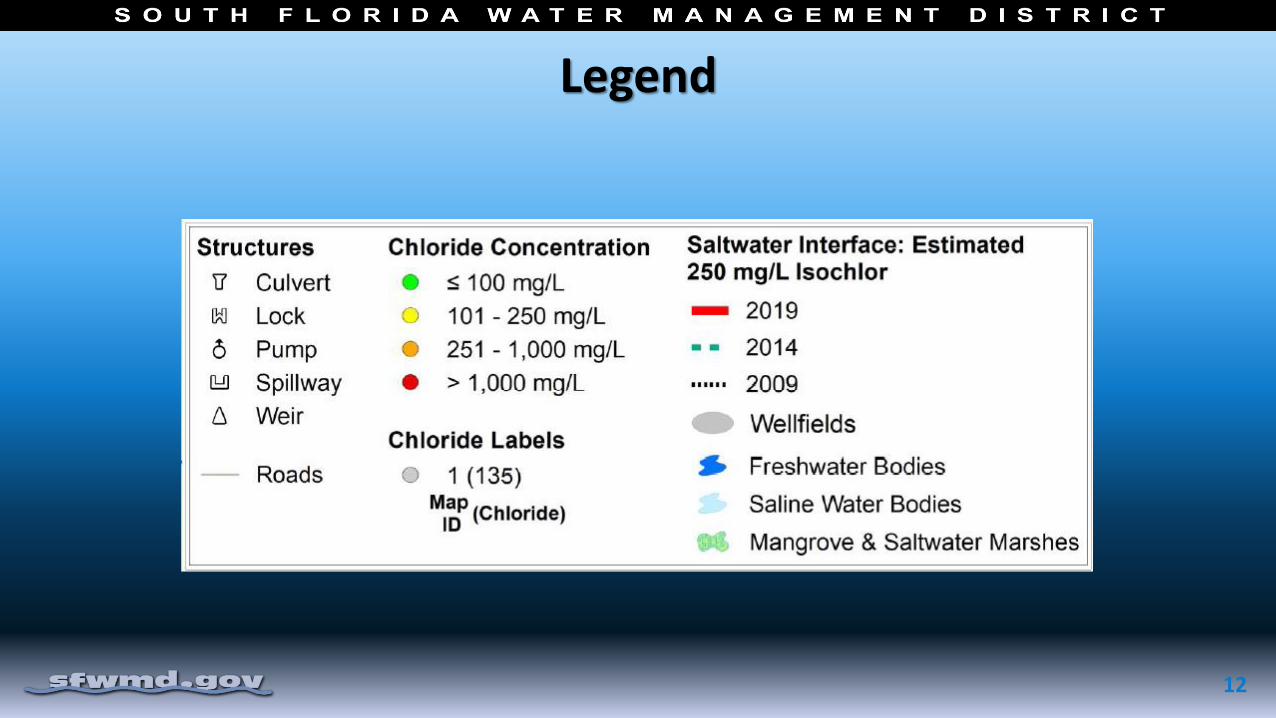
Legend
12
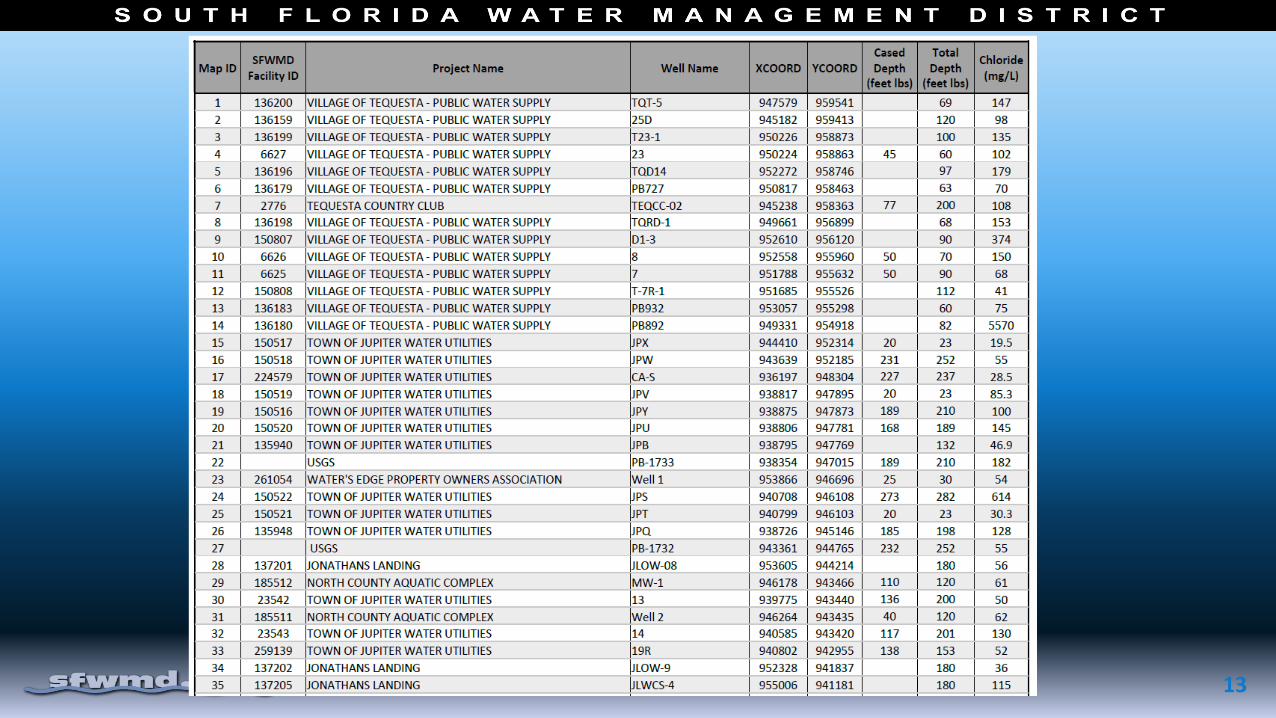
13
Chloride Time-Series Plots
14
West East
Seaward Movement of SWI – Palm Beach County
15
Example of Well Depth Impact
16
Potential Upconing of Connate Water
17
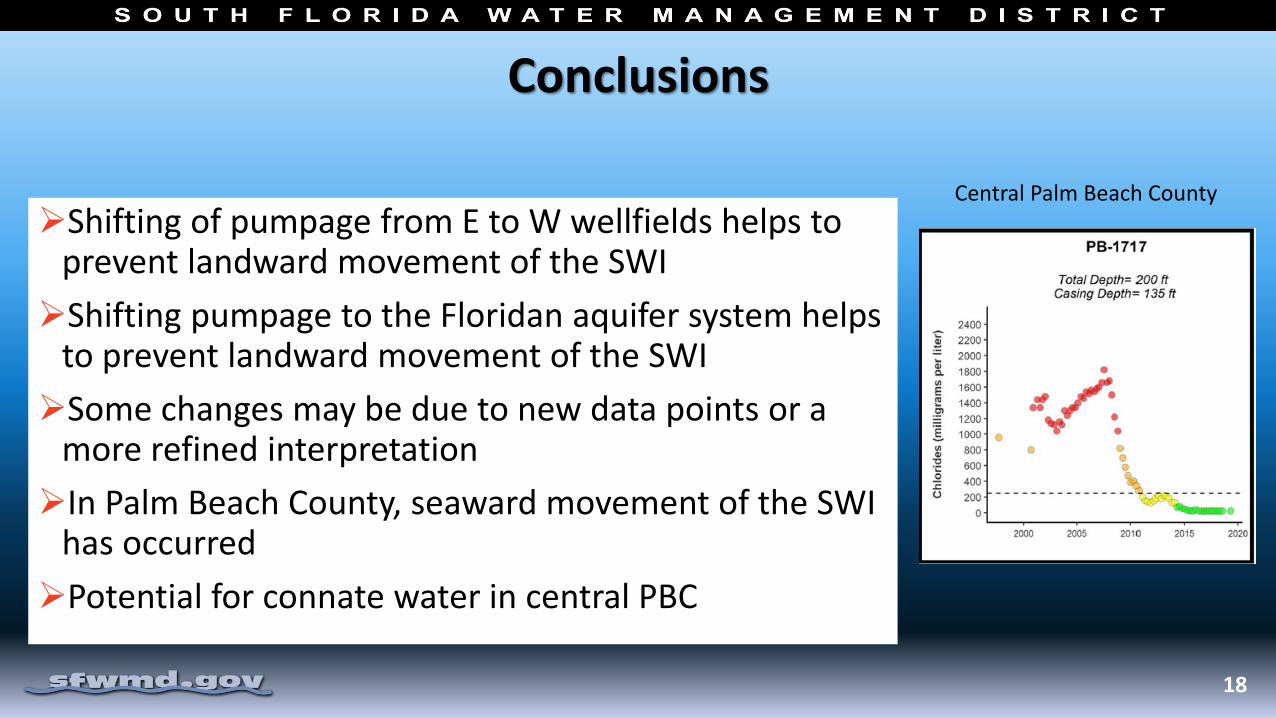
Conclusions
Shifting of pumpage from E to W wellfields helps to prevent landward movement of the SWI
Shifting pumpage to the Floridan aquifer system helps to prevent landward movement of the SWI
Some changes may be due to new data points or a more refined interpretation
In Palm Beach County, seaward movement of the SWI has occurred
Potential for connate water in central PBC
18
Central Palm Beach County
Next Steps
Work with local governments, USGS, permittees and others to:
Identify other existing wells to increase mapping accuracy for future maps
Consider sampling frequency
Identify funding to facilitate well replacement, as needed
Evaluate needs and identify funding for new wells (critical data gaps or areas of concern)
Prevent saltwater encroachment of wellfields
19
Questions and Discussion
2009 & 2014 maps available now2019 – to be postedhttps://www.sfwmd.gov/documents-by-tag/saltwaterinterface