30
Corporate Update – November 2016 • • • FOCUS DISCIPLINE GROWTH

Corporate Update – November 2016
• • •
FOCUS DISCIPLINE GROWTH

FOCUS DISCIPLINE GROWTH
• • •Forward-Looking Statements
Certain information presented in these remarks and in this presentation that is not historical factual
information may constitute forward-looking information within the meaning of securities laws. Actual
results could differ materially from a conclusion, forecast or projection contained in such forward-
looking information. Forward-looking information may relate to our future outlook and anticipated
events or results and may include statements about Total Energy Services Inc. or its subsidiaries
(“Total Energy” or “Total”), including business operations, strategy and expected financial
performance and condition. Forward-looking statements include statements that are predictive in
nature, depend upon or refer to future events or conditions, or include words such as “expects”,
“anticipates”, “intends”, “plans”, “believes”, or negative versions thereof and similar expressions. In
addition, any statement that may be made concerning future financial performance, ongoing business
strategies or prospects, and possible future action on our part, is also a forward-looking statement.
Certain material factors or assumptions were also applied in drawing a conclusion or making a
forecast or projection as reflected in such forward-looking information. Additional information about
the material factors that could cause actual results to differ materially from the conclusions, forecasts
or projections in the forward looking information, details regarding the material factors or assumptions
that were applied in drawing such conclusions or making such forecasts or projections, and more
exhaustive information on the risks and uncertainties can be found in Total’s most recent Annual
Information Form which is available on www.sedar.com

FOCUS DISCIPLINE GROWTH
• • •
EBITDA means earnings before interest, taxes, depreciation and amortization
and is equal to net income before income taxes plus finance costs plus
depreciation. Cashflow means cash provided by operations before changes in
non-cash working capital items. EBITDA is not a recognized measure under
International Financial Reporting Standards (“IFRS”). Management believes that
in addition to net income, EBITDA is a useful supplemental measure as it
provides an indication of the results generated by Total’s primary business
activities prior to consideration of how those activities are financed, amortized or
how the results are taxed in various jurisdictions. Readers should be cautioned,
however, that EBITDA should not be construed as an alternative to net income
determined in accordance with IFRS as an indicator of Total Energy’s
performance. Total Energy’s method of calculating EBITDA may differ from other
organizations and, accordingly, EBITDA may not be comparable to measures
used by other organizations.
Non-IFRS Measures

FOCUS DISCIPLINE GROWTH
• • •Corporate Information
• Common Shares Outstanding (TSX: TOT) 30.9 million
• Options Outstanding ($14.13 average exercise price) 2.70 million
• Market Capitalization (basic, at $12.60 share price) $389.8 million
• Working Capital $80.1 million (at 09/30/16)
• Long Term Debt (excluding current portion) $45.5 million (at 09/30/16)
• Bank Debt ($65 million revolving credit facility) nil (at 09/30/16)
• Director/Officer Ownership (basic) 8%
• Common Share Dividend (per share) $0.06/quarter ($0.24/annum)

FOCUS DISCIPLINE GROWTH
• • •Operations
Three business segments:
Contract Drilling Services (Chinook Drilling)
• 8th largest Canadian drilling rig fleet (3% of Canadian rig fleet)
• 18 drilling rigs (16 doubles, 2 extended reach singles)
Rentals and Transportation Services (Total Oilfield Rentals)
• Leading provider of oilfield surface equipment rentals and transportation services
• 10,000 major rental pieces and 120 heavy trucks in 22 branch locations throughout
WCSB and Northwestern USA
Compression & Process Services (Bidell Compression & Spectrum Process Systems)
• Leading Canadian natural gas compression packager with parts and services field
support throughout WCSB and Northwestern US
• Established market presence in the oil and natural gas process equipment
fabrication industry following significant acquisition in 2013
FOCUS DISCIPLINE GROWTH
• • •
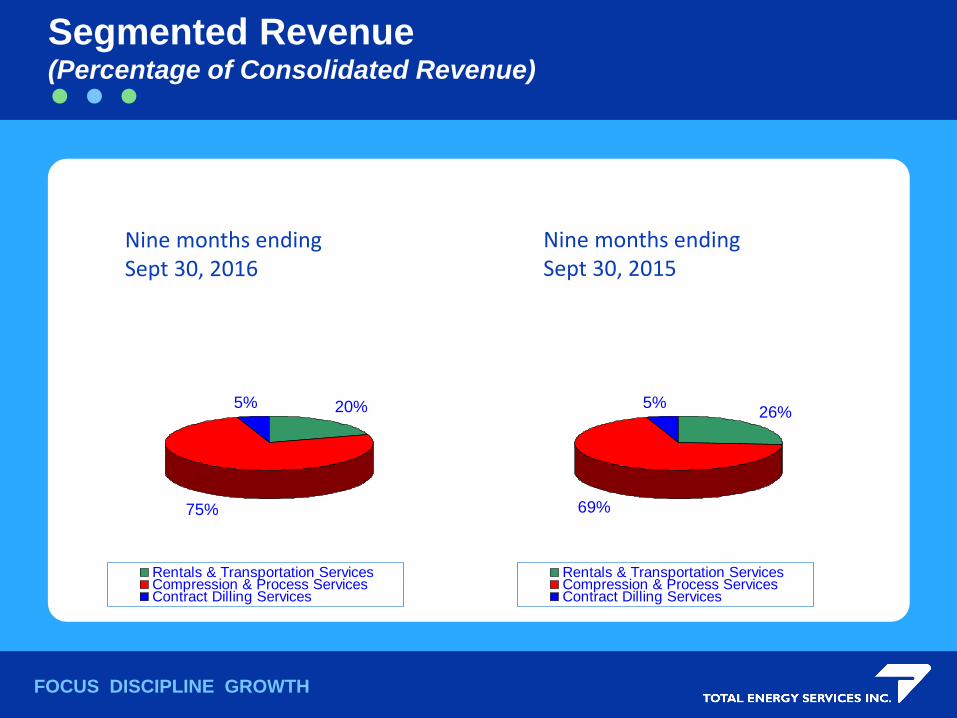
Segmented Revenue (Percentage of Consolidated Revenue)
20%
75%
5%
Rentals & Transportation ServicesCompression & Process ServicesContract Dilling Services
Nine months ending Sept 30, 2016
Nine months ending Sept 30, 2015
26%
69%
5%
Rentals & Transportation ServicesCompression & Process ServicesContract Dilling Services

FOCUS DISCIPLINE GROWTH
• • •
Operations InfrastructureExposure to Significant WCSB Resource Plays
Horn River
Montney
Cardium
Duvernay
Bakken
Rentals and Transportation Services locationCompression and Process Services locationBoth
Niobrara

FOCUS DISCIPLINE GROWTH
• • •
Contract Drilling Services
Chinook Drilling
• Focused on deeper basins in Western Canada
• 18 rig fleet: 16 telescopic doubles and two extended
reach singles
• Telescopic doubles include 14 mechanical and two AC
electric rigs
• Mechanical doubles have drilled up to 6,000 meter
Duvernay horizontal wells
• Significant owned top-drive fleet - 70% of rig fleet
• Efficient cost structure allows division to remain profitable
despite severe price pressure and very low utilization –
look to “ride out the storm”

FOCUS DISCIPLINE GROWTH
• • •
Contract Drilling – Chinook Drilling(dollar amounts in thousands)
Three months ended Sept 30 2016 2015 % Change
Operating Days (spud
to release) 230 291 (21)%
# of Rigs (period end) 18 18 -
Revenue $ 3,151 $ 4,598 (31)%
EBITDA $ 552 $ 1,224 (55)%
Assets (period end) $111,811 $114,230 (2)%

FOCUS DISCIPLINE GROWTH
• • •
Contract Drilling – Chinook Drilling(dollar amounts in thousands)
Nine months ended Sept 30 2016 2015 % Change
Operating Days (spud
to release) 478 679 (30)%
# of Rigs (period end) 18 18 -
Revenue $ 7,013 $ 11,953 (41)%
EBITDA $ 960 $ 3,328 (71)%
Assets (period end) $111,811 $114,230 (2)%

FOCUS DISCIPLINE GROWTH
• • •
Contract Drilling Services Revenue/Rig
0%
10%
20%
30%
40%
50%
60%
70%
2006 2007 2008 2009 2010 2011 2012 2013 2014 2015
$500,000
$1,000,000
$1,500,000
$2,000,000
$2,500,000
$3,000,000
$3,500,000
$4,000,000
$4,500,000
Rig Utilization (%) Revenue/Rig ($)
FOCUS DISCIPLINE GROWTH
• • •
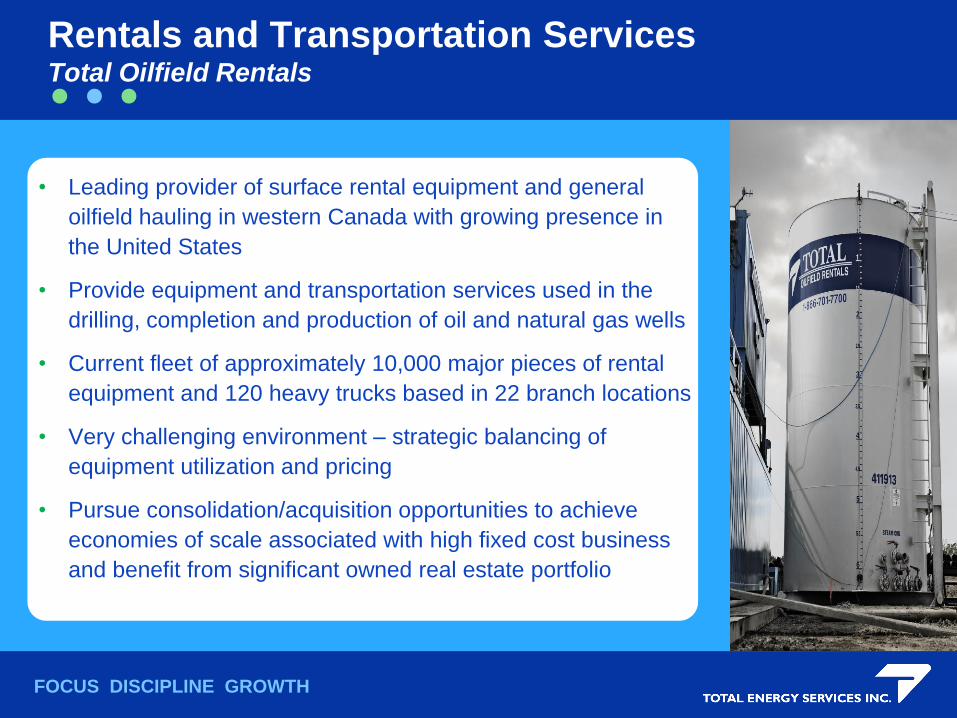
Rentals and Transportation ServicesTotal Oilfield Rentals
• Leading provider of surface rental equipment and general
oilfield hauling in western Canada with growing presence in
the United States
• Provide equipment and transportation services used in the
drilling, completion and production of oil and natural gas wells
• Current fleet of approximately 10,000 major pieces of rental
equipment and 120 heavy trucks based in 22 branch locations
• Very challenging environment – strategic balancing of
equipment utilization and pricing
• Pursue consolidation/acquisition opportunities to achieve
economies of scale associated with high fixed cost business
and benefit from significant owned real estate portfolio

FOCUS DISCIPLINE GROWTH
• • •
Rentals and Transportation Services(dollar amounts in thousands)
Three months ended Sept 30 2016 2015 % Change
Rental Pieces
(period end) 10,000 10,000 -
Heavy Trucks
(period end) 112 120 (7)%
Average Utilization
(rental equipment) 15% 22% (32)%
Revenue $ 10,611 $ 15,861 (33)%
EBITDA $ 1,255 $ 4,219 (70)%
Assets $225,436 $238,322 (5)%

FOCUS DISCIPLINE GROWTH
• • •
Rentals and Transportation Services(dollar amounts in thousands)
Nine months ended Sept 30 2016 2015 % Change
Rental Pieces
(period end) 10,000 10,000 -
Heavy Trucks
(period end) 112 120 (7)%
Average Utilization
(rental equipment) 13% 26% (50)%
Revenue $ 27,846 $ 59,285 (53)%
EBITDA $ 1,572 $ 17,576 (91)%
Assets (period end) $225,436 $238,322 (5)%

FOCUS DISCIPLINE GROWTH
• • •
Rentals and Transportation Services Historical Revenue Analysis
0%
10%
20%
30%
40%
50%
60%
70%
2006 2007 2008 2009 2010 2011 2012 2013 2014 2015
$5,000
$7,500
$10,000
$12,500
$15,000
$17,500
$20,000
$22,500
$25,000
Rental Fleet Utilization (%)
Divisional Revenue/Rental Piece ($)

FOCUS DISCIPLINE GROWTH
• • •
• In business since 1988, Bidell is a leading provider of gas
compression fabrication, sales, rental and service in Canada and
select international markets
• Manufacture 25 to 10,000 hp compression packages
• Carry all major engine lines (natural gas and electric) and
compressors (reciprocating and screw)
• Patented NOMADTM line of large hp mobile compressors –
maximize compression capital and operating efficiencies for steep
decline wells
• Growing parts and service infrastructure throughout Western
Canada and Northwestern US - offer an extensive parts inventory,
exchange programs, overhaul and retrofit services
Compression and Process ServicesBidell Gas Compression

FOCUS DISCIPLINE GROWTH
• • •
• Established Spectrum in late 2012 to provide additional
exposure to North American energy infrastructure build,
including LNG development
• Acquisition of Opsco Manufacturing in Q1 2013 materially
increased market presence
• Offer full service project management, engineering,
design and procurement services
• Specialize in design and fabrication of large capacity
dehydration, regeneration, separation, line heaters, free
water knock outs and custom manufactured process
equipment
Compression and Process ServicesSpectrum Process Services

FOCUS DISCIPLINE GROWTH
• • •
Compression and Process Services(dollar amounts in thousands)
Three Months ended Sept 30 2016 2015 % Change
Compression Horsepower
on Lease (period end) 11,400 18,900 (40)%
Fabrication Sales Backlog
(period end) $ 62,000 $ 51,100 21%
Revenue $ 32,774 $ 46,254 (29)%
EBITDA $ 3,858 $ 7,374 (48)%
Assets (period end) $157,328 $175,456 (10)%

FOCUS DISCIPLINE GROWTH
• • •
Compression and Process Services(dollar amounts in thousands)
Nine Months ended Sept 30 2016 2015 % Change
Horsepower on Lease
(period end) 11,400 18,900 (40)%
Fabrication Sales Backlog
(period end) $ 62,000 $ 51,100 21%
Revenue $105,526 $159,873 (34)%
EBITDA $ 11,290 $ 29,620 (62)%
Assets (period end) $157,328 $175,456 (10)%
FOCUS DISCIPLINE GROWTH
• • •
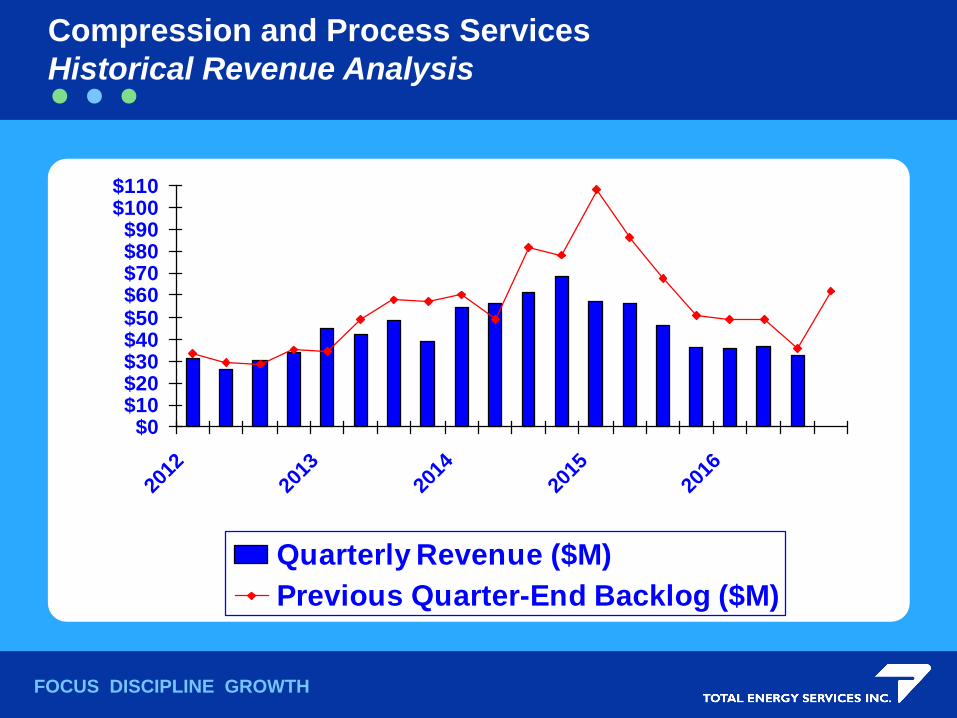
Compression and Process Services
Historical Revenue Analysis
$0$10$20$30$40$50$60$70$80$90
$100$110
2012
2013
2014
2015
2016
Quarterly Revenue ($M)
Previous Quarter-End Backlog ($M)

FOCUS DISCIPLINE GROWTH
• • •
Consolidated Financial Performance(in thousands of dollars, except per share amounts)
Three Months ended Sept 30 2016 2015 % Change
Revenue $ 46,536 $ 66,713 (30)%
EBITDA 4,816 11,137 (57)%
Cashflow 6,076 (580) 1,148%
Net Income (1,912) 1,570 (222)%
Per Share, Diluted
EBITDA $0.16 $0.36 (56)%
Cashflow $0.20 $(0.02) 1,100%
Net Earnings $(0.06) $0.05 (220)%

FOCUS DISCIPLINE GROWTH
• • •
Consolidated Financial Performance(in thousands of dollars, except per share amounts)
Nine Months ended Sept 30 2016 2015 % Change
Revenue $ 140,385 $ 231,111 (39)%
EBITDA 10,487 46,288 (77)%
Cashflow 12,890 13,402 (4)%
Net Income (8,247) 11,674 (171)%
Per Share, Diluted
EBITDA $0.34 $1.49 (77)%
Cashflow $0.42 $0.43 (2)%
Net Earnings $(0.27) $0.38 (171)%

FOCUS DISCIPLINE GROWTH
• • •
Long Term Performance – Annual Revenue(in millions of dollars)
$0
$50
$100
$150
$200
$250
$300
$350
$400
$450
2006 2007 2008 2009 2010 2011 2012 2013 2014 2015

FOCUS DISCIPLINE GROWTH
• • •
Long Term Performance – Income Statement (dollars per share, diluted)
$0.00
$0.50
$1.00
$1.50
$2.00
$2.50
$3.00
$3.50
$4.00
2006 2007 2008 2009 2010 2011 2012 2013 2014 2015
EBITDA Cashflow Net Income

FOCUS DISCIPLINE GROWTH
• • •
Long Term Performance – Balance Sheet(in millions of dollars)
$0
$100
$200
$300
$400
$500
$600
$700
2006 2007 2008 2009 2010 2011 2012 2013 2014 2015
Total Assets Shareholders' Equity LTD

FOCUS DISCIPLINE GROWTH
• • •
$25.5 million 2016 capital expenditure budget:
• $9.0 million – 3 United States RTS acquisitions
• $8.3 million – RTS Canadian acquisition and US/CDN
organic growth
• $3.0 million – expansion of the natural gas compression
rental fleet
• $2.2 million – CPS organic growth
• $3.0 million – maintenance capital expenditures
2016 Capital Expenditure Budget (in millions of dollars)

FOCUS DISCIPLINE GROWTH
• • •
Established long-term track record of building sustainable
shareholder value:
• 10 year annual total asset growth rate of 11%
• 10 year annual EBITDA/share (diluted) growth rate of 13%
• 10 year annual pre-tax return on total assets of 14%
• 10 year annual pre-tax return on equity of 22%
• No capital asset or goodwill impairment write-downs ever
recorded after completing approx. 30 acquisitions since 1997
• Returns achieved with moderate use of debt
Annual growth rates are 10 year simple averages (2006-2015). ROA and ROE are calculated using
the simple average of opening and closing total assets and equity, respectively.
Strong Track Record

FOCUS DISCIPLINE GROWTH
• • •
Well positioned for continued accretive growth that rewards our owners:
Operational strength: stable, experienced management and a well
established market position in each business division provides a solid
base for continued growth.
Financial strength: $47.4 million LTD secured by 60% (based on value) of
owned real estate; remaining capital assets available to support additional
debt if required. Unused $65 million operating line secured by current
assets only.
Rewarding our Owners: from Jan 1, 2010 to Sept 30, 2016 returned $81.3
million to Shareholders ($41.0 million of dividends and $40.3 million of
share buybacks).
Leverage to Increased Activity: from Jan 1, 2010 to Sept 30, 2016: $329.3
million (191%) increase to PPE (net of proceeds from dispositions but
excluding depreciation) against a 1.1 million (4%) increase in shares
outstanding.
Well Positioned For the Future

FOCUS DISCIPLINE GROWTH
• • •
• Achieve maximum cost efficiencies without compromising
safety or quality of products and services
• Decline unprofitable work and carefully manage credit risk
(both customer and supplier)
• Look to retain and add quality people
• Preserve and protect asset base – will not cannibalize fleet to
minimize repair and maintenance costs so as to ensure
assets can go to work with minimal cost and delay
• Look to add quality assets that allow for efficiencies of scale
and significant cost synergies
• Maintain balance sheet strength
• Overall, minimize the damage until industry recovers and add
to corporate earnings power (as measured on a fully diluted
per share basis)
Strategy for Current Environment

FOCUS DISCIPLINE GROWTH
• • •
Contact Information
For further information about Total Energy Services Inc., contact:
Daniel Halyk, President & CEO,phone: (403) 216-3921, email: [email protected]
or
Yuliya Gorbach, VP Finance & CFOphone: (403) 216-3920, email: [email protected]
www.totalenergy.ca
TOTAL ENERGY, BIDELL, BIDELL EQUIPMENT, CHINOOK, CHINOOK DRILLING, NOMAD, SPECTRUM PROCESS SYSTEMS and the Total Energy, Bidell, Spectrum and Chinook Drilling logos are registered trademarks of Total Energy Services Inc.


