ISSN 1835-9728 Environmental Economics Research Hub Research Reports Using focus groups to design a choice modelling questionnaire for estimating natural resource management benefits in NSW Kasia Mazur and Jeff Bennett Research Report No. 2 March 2008 About the authors Kasia Mazur is PhD student in the Crawford School of Economics and Government at the Australian National University and Research Economist at the Australian Bureau of Agricultural and Resource Economics. Jeff Bennett is Professor at the Crawford School of Economics and Government at the Australian National University.
Transcript
ISSN 1835-9728 Environmental Economics Research Hub
Research Reports
Using focus groups to design a choice modelling questionnaire for estimating
natural resource management benefits in NSW
Kasia Mazur and Jeff Bennett
Research Report No. 2
March 2008
About the authors Kasia Mazur is PhD student in the Crawford School of Economics and Government at the Australian National University and Research Economist at the Australian Bureau of Agricultural and Resource Economics. Jeff Bennett is Professor at the Crawford School of Economics and Government at the Australian National University.
Environmental Economics Research Hub Research Reports are published by the The Crawford School of Economics and Government, Australian National University, Canberra 0200 Australia. These Reports present work in progress being undertaken by project teams within the Environmental Economics Research Hub (EERH). The EERH is funded by the Department of Environment and Water Heritage and the Arts under the Commonwealth Environment Research Facility. The views and interpretations expressed in these Reports are those of the author(s) and should not be attributed to any organisation associated with the EERH. Because these reports present the results of work in progress, they should not be reproduced in part or in whole without the authorisation of the EERH Director, Professor Jeff Bennett ([email protected])
Crawford School of Economics and Government THE AUSTRALIAN NATIONAL UNIVERSITY
Focus group discussions were used to design a choice modelling (CM) questionnaire
for the estimation of population - wide values for the environmental and social
benefits provided by natural resource management changes in the Namoi, Lachlan
and Hawkesbury-Nepean catchments. This report describes the technical aspects of
the focus groups and outlines the main conclusions drawn from the discussions. Eight
focus groups were conducted in the main urban areas of the regions where the CM
survey will be conducted (Tamworth, Cowra, Goulburn and Sydney). The CM
questionnaire development process based on the input of the focus group participants
is also discussed in this report. As a result of the focus group meetings a final draft of
the questionnaire was developed ready for further refinement in consultation with
stakeholders, managers and policy makers.
The research detailed in this Report is a component of the EERH funded project “An
Optimisation Framework to Support Catchment Management Authorities Investment
Decisions at a Catchment Scale”. Support for the Project is also being provided by the
NSW Departments of Environment and Climate Change, Primary Industries and
Water and Energy, the Namoi, Lachlan and Hawkesbury-Nepean Catchment
Management Authorities and the Australian Bureau of Agricultural and Resources
Economics.
iv
1. Introduction
An important part of any Choice Modelling (CM) study is the design of the
questionnaire in which people are asked to state their preferred choices between
predefined alternatives for resource allocation including the status quo. Each choice
alternative is presented in terms of a common set of attributes with those attributes
taking on different levels across the alternatives (Blamey et al., 2000). Based on the
information about the attributes that describe the options, respondents make their
choices, and environmental values can be estimated from those choices.
A CM questionnaire includes the following components:
A description of the issue;
A description of the status quo;
Details of the proposed changes;
A sequence of the choice sets made up of resource use alternatives with
varying combinations of levels of a constant set of site attributes;
Follow up questions regarding the choices made; and
A series of socioeconomic and attitudinal questions
CM questionnaires are developed based on consultations with relevant technical and
policy specialists and during focus group discussions. Hence, focus group meetings
are an important part of CM questionnaire design. They help to determine what type
of information should be included in the questionnaire, the presentation of the
questionnaire, the language used and the format.
A focus group is an open planned discussion with approximately eight to ten
participants guided by an experienced facilitator. This number of participants gives all
participants the opportunity to share their opinions and to provide a diversity of
perceptions. Moreover, in order to obtain contrasting opinions and to obtain a
representative sample of the population, the focus group composition should be
heterogenous in terms of occupation, background, age and gender (Jungho, 2002).
1
It usually takes about an hour and a half to two hours to run a focus group (Morrison
et al., 1997). The discussion is conducted in a neutral, non-judgmental and non-
threatening atmosphere which allows participants to reveal the motives they have and
processes used when making decisions (Jungho, 2002). The groups help to define the
issue, appropriate attributes and their levels, the status quo situation and alternative
options to be included in the CM choice sets (Rolfe et al., 2004). Focus groups can
also be used to test a draft of the questionnaire to check whether the information
presented is appropriate and to observe whether the issue is communicated clearly
enough to allow the CM choice sets to be answered by respondents (Jungho, 2002).
An advantage of focus groups is that they allow the detailed observation of a range of
opinions about the issue examined. Hence, the main goals of the focus group
discussion can be summarised as:
Assess the extent of knowledge that people have about the environmental
problems in their catchments and beyond in order to set an appropriate frame
for the issue presented in the questionnaire;
Determine the relevant attributes and their levels;
Establish appropriate bounds of willingness to pay (WTP) for the mooted
environmental improvement;
Determine the number of choices that should be included in a choice set; and
Determine the appropriate presentation of the questionnaire.
2. Focus groups logistics
Eight focus groups (two in each region) were carried out to help to design the CM
questionnaire that will be used to estimate the values generated by natural resource
management changes in the Namoi, Lachlan and Hawkesbury–Nepean catchments.
The focus groups were carried out in Tamworth for the Namoi catchment, in
Goulburn for the Hawkesbury-Nepean catchment and in Cowra for the Lachlan
catchment. The CM questionnaire will also be distributed in Sydney in order to assess
the values held by a large, urbanised population and to test the distance effect on
2
peoples’ choices. Hence two focus groups were also held in Sydney using the Namoi
and Hawkesbury-Nepean case studies.
The first two focus groups were held in Tamworth on 13 November 2007, the next
two were held a week later on 20 November in Goulburn. Two Sydney focus groups
were held on 26 November and the last two focus groups were held on 29 November
in Cowra. A few days break between the focus groups allowed changes to be made to
the draft questionnaire based on the conclusions drawn from the previous focus
groups.
All the focus groups were audio-recorded with the permission of each participant.
Comments made by participants were also written on a whiteboard. This gave
participants a greater sense of their contribution and encouraged them to suggest new
ideas.
Recruitment
To recruit participants for the focus groups, the local contact points in the Catchment
Management Authorities (CMA) and NSW Government Departments were consulted.
Recruitment was conducted based on informal networks. CMA, university and
government agencies staff involved in the research project nominated people external
to these organisations. For some focus groups, local community groups helped to
recruit participants. Participants were paid $40 to participate in the 1.5 hour focus
group session.
People approached as potential participants of the focus group were told that the
discussion would focus on natural resource management issues. A sample of 7 – 12
people was chosen for each of the focus groups. A diversity of people in terms of age,
gender, educational level and profession was sought for each group (see section 4).
3. Structure of the focus groups
The focus group meetings primarily involved four major phases: introduction, the
main discussion, testing the questionnaire and closure. During the introduction the
3
facilitator introduced the focus group coordinators, explained the general purpose of
the meeting and its structure. The main discussion focused on the decision problem
and the selection of attributes. Following the main discussion, participants were given
a draft of the questionnaire to go through in order to provide their comments. The end
phase allowed participants to express their final reflections, to clarify some points that
needed more explanation and to synthesise the main points. The facilitator ended the
focus group session by explaining in more detail the purpose of the survey and the
project.
The first four focus groups conducted in Tamworth and Goulburn followed the above
structure. After conducting these four focus groups the main issues were identified
and attributes selected. There was consistency in peoples’ opinions about the
environmental issues and the way that they should be addressed. Having the attributes
identified and the general frame of the issues established, the focus groups in Cowra
and Sydney concentrated on testing the draft of the questionnaire that was refined
after the first four focus groups. The aim of this exercise was to obtain a better
appreciation of the clarity of the presented task. The approach allowed valuable
feedback to be collected on the validity of the attributes selected and the presentation
of the information. The focus group input to the questionnaire development was
crucial to ensure that issue was adequately and clearly presented.
The main discussion
The first stage of the focus group discussions concentrated on identifying the key
problems facing the catchment in order to frame the issue and to select the relevant
attributes. The focus group discussion was based on a structured set of questions. The
questions were open-ended to simulate individual contribution as well as group
discussion. Questions were delivered in a way that would not suggest any answers or
create biased responses. Discussion was started by inviting participants to share their
thoughts on general policy issues that were occupying their minds at the moment.
Following this, participants were asked to think about general environmental issues of
concern. This was then narrowed down to specific environmental and natural resource
management issues in their region. They were also asked about the way these issues
could be addressed. Discussion was then directed toward catchment management
concerns.
4
Participants were asked to put themselves in the position of a decision maker who has
a number of alternative catchment management options from which to choose. They
were asked what they would like to know about these different options in order to
decide which one is best. Participants were also requested to provide information
about their preferred method of payment for any changes in catchment management
e.g. who should pay, how much and in what form it should be paid?
Testing the draft of the questionnaire
Securing feedback on the draft questionnaire was a very important part of the focus
groups. It showed how effectively the issue was communicated and whether the
information presented was appropriate. Moreover, the focus group feedback revealed
the strategies used by participants when they were selecting their preferred
alternatives from the CM choice sets.
During the focus group discussions, participants were asked to fill out the draft the
questionnaire and provide their comments about the following aspects of the
questionnaire.
clarity;
appropriateness of the information presented;
the amount of the information;
biases;
format of the questions;
presentation of the information; and
payment for the environmental improvement.
One purpose of the discussions about the draft questionnaire was to test the perceived
realism of the attributes used. The status quo situation presented in the questionnaire
was also checked for realism as were the alternative options. Discussion also allowed
the development of the best way to present the attributes and their levels (e.g. in
words, numbers, percentage, via pictures, charts, etc.).
5
The complexity of the choice set, particularly the number of attributes and options
was also addressed during the focus group discussion. This is important because if
there are too many attributes or options respondents may focus on only one or two
(Morrison et al., 1997) and this could bias the results of the study. It is also important
to determine the number of choices that respondents are able to handle. As stated by
(Hanley and Spash, 1993), a large number of choices can be confusing to respondents.
However, a small number of choices may not provide adequate information to enable
the estimation of the non-market values. A larger sample size is required to secure
sufficient information on preferences when smaller choice sets are used.
The focus groups can also help to identify the levels taken on by the attributes. Too
small a range of levels for an attribute may result in an underestimation of their
values. Too wide a range however, may make it difficult to estimate a precise value
across the range (Jungho, 2002).
Another goal of the focus groups was to solicit comments about the payment vehicle
that was suggested in the draft of the questionnaire and the range of payments used.
The payment vehicle needs to be believable without causing excessive levels of
protest from respondents. Furthermore, if the amount of money sought is too low,
people may ignore the cost attribute and focus only on the environmental attributes
when choosing between choice set alternatives. If it is too high the trade-offs sought
may not be made (Jungho, 2002).
The draft of the questionnaire
The format of the draft of the questionnaire was similar to the questionnaires used in
previous similar choice modelling studies (For example, see the study of Victorian
Rivers by Bennett, Dumsday et al forthcoming and the River Red Gum Forests by
Bennett, forthcoming). The information regarding the catchment and its
environmental issues (see Appendix B) was obtained through literature searches and
from specialists in the catchment areas including policy advisers, planers, scientists
and researchers.
The introduction page of the questionnaire explained the goal of the survey, how
respondents were selected, provided assurance of the confidentiality of the
6
questionnaire and displayed the credentials of the study team. The time required to fill
out the questionnaire was also noted.
Information presented on a separate poster sheet included a description of the
catchment and an explanation of the environmental issues in the area. This included a
description of the current conditions and the potential long term (20 years)
consequences of the continuation of the current and alternative natural resource
management practices. The information on the poster was supported by photographs
and maps. These helped participants to visualise the issue and greatly simplified the
presentation of the complex subject.
The questionnaire included five choice sets. Each choice set contained three different
options. One of these three options (Option A: The Status Quo) remained the same in
all choice sets. This option represents the continuation of the current situation where
no new actions were undertaken to address the natural resource management
issues/problems. The other two options in each choice set involved combinations of
new actions including: tree planting, fencing to protect vegetation, controlling weeds
and feral animals, and buying land for re-vegetation. The options were described by
four attributes and their predicted outcomes in 20 years time. The attributes were: area
of native vegetation, number of species protected, length of healthy waterways and
number of people working in rural areas. The last attribute was added after the first
four focus group discussions. Participants in the Tamworth and Goulburn focus
groups pointed out that the movement of people from rural to urban centres was an
issue of concern to them. The environmental attributes were specifically chosen to
reflect the outputs of the biophysical modelling programme - MOSAIC - so that
integration across the two elements of the proposed decision support tool could be
achieved.
The levels of the attributes were expressed quantitatively: area (km2) of native
vegetation, number of native species, number of kilometres of healthy waterways and
number of people working in rural areas. The ranges of the attribute levels were
established in consultation with experts and confirmed by the focus group.
7
It was explained in the questionnaire that money to pay for environmental
improvements would come from the people of NSW, through increased taxes, higher
council rates, recreation charges, higher prices for goods and services or some
combination of these. Payment for environmental improvements ranged from $0 to
$500 per year over five years.
Follow up-questions were also included in the questionnaire in order to identify any
anomaly in the responses such as payment vehicle protests (respondents always
choose the status quo option because they object to the way in which the costs are to
be imposed), lexicographic preferences (respondents always choose the alternative
with the highest level of one attribute or the lowest cost), and perfect embedding
(respondents always agree to pay the highest amount without considering the trade-
offs involved) (Bennett and Adamowicz, 2001) .Respondents were also asked to
provide socio-economic data (see section 4). The final stage of the questionnaire
included questions asking respondents’ opinions about the questionnaire and the
survey process.
4. Outcomes of the focus group discussions
4.1 Tamworth
The first two focus groups were conducted in Tamworth. Ten participants attended
the first session at 6pm and seven participants attended the second session at 8pm.
Both focus groups had similar numbers of females and males. The participants’ ages
ranged from 20s to 60s (see Appendix A). The educational level of participants was
relatively uniform. Most of the participants had tertiary educations and the majority
worked in the public sector.
Peoples’ perceptions about the environmental issues
The main outcome of the general discussion was that environmental issues were
recognised to be important global and regional problems that need to be addressed.
The main global environmental issues listed by the participants included: climate
change, pollution, loss of biodiversity, drought and reduced water availability and
quality, and unsustainable land use. The main local environmental issues recognised
8
by respondents included: water availability and quality issues, climate change, waste
problems, biodiversity losses, soil erosion and tree clearing.
Participants of the focus groups indicated that, if they had a choice between different
alternative natural resources options, they would like to know more about the Namoi
catchment, its environmental problems and how these problems affect people both
inside the catchment and outside the catchment. They also stated that they would like
to know what type of actions were needed to be taken to address those issues and
what would be the long term consequences of these actions, their cost and how this
would affect the community wellbeing and farming profitability. Participants wanted
to know who would administer these actions and how it would be monitored.
Selection of the appropriate payment vehicle:
The focus groups expressed various opinions on how the improvement in
environmental quality should be funded. Almost all participants in both groups agreed
that all taxpayers should pay for natural resource management change as “it is going
to benefit Australia as a whole”. They suggested that improvements could be financed
through increased taxes or higher prices for food that is grown in more
environmentally friendly ways. Participants perceived that the payment of $500 per
annum is too high: “I am not prepared to pay $500”.
Reactions to the draft questionnaire
The general impression of the poster was that the information it provided was well
balanced, presented in a consistent manner and appropriately structured.
Some participants found the choice sets confusing, primarily because it was not
clearly stated that each choice set should be considered independently. Participants
assumed that some attributes should be correlated. Therefore, changes in the
attributes’ levels between options seemed counter intuitive to them: it [the options]
seems ridiculous”; “some of the options are illogical, irrational”. Participants felt that
there was not enough explanation to convince them that the options reflected real life
possibilities. Their comments suggested a lack of information: “how it is going to
affect people outside the area?”; “why are these things important?” They also wanted
to know more about how problems raised could be addressed. While expressing a
desire for more information, participants agreed that “too much information would be
9
dangerous” as it could bias responses and could be overwhelming resulting in a
reluctance to do the questionnaire. Some participants however, found the
questionnaire: “I found this simple to fill out”.
Participants agreed that the choice of the attributes for the questionnaire was
appropriate and that all of the environmental issues raised are important in their
catchment. However, they also suggested the inclusion of an additional attribute that
would describe how natural resource management actions could affect rural
communities. They felt that the questionnaire was mostly focusing too narrowly on
environmental issues: “there is nothing about supporting agricultural industries”.
Some of the participants felt that the questionnaire was pro-environmental and one
person expressed the opinion that “many farmers could find this threatening”.
Participants suggested that some social consideration would help to balance the issue
presented in the questionnaire more appropriately. The levels of the attributes
presented in the questionnaire seemed reasonable to participants.
The large amount of explanatory information about the choice sets stopped some of
the participants from reading it. Therefore, there was confusion regarding when the
outcomes of the options would be obtained, why the outcomes varied between options
and how the payment would be made.
Outcomes
A number of changes to the questionnaire were made after the Tamworth focus
groups. These mostly related to the emphasis given to each choice set being
independent, that the outcomes presented for the options were after 20 years time, and
how the payment will be made. The description of the problem was also changed to
avoid expressions that could be considered as threatening or subjective.
4.2 Goulburn
Two focus groups were conducted in Goulburn. Eleven participants attended the first
session at 6pm and ten participants attended the second session at 8pm. The focus
group participants were heterogenous in age, educational level and gender. The age of
participants varied from 17 to over 60. Educational level varied across both focus
10
groups (see Appendix A). However, the occupation of the majority of participants was
related to agriculture.
Peoples’ perceptions about the environmental issues
During the focus group in Goulburn, environmental problems were also recognised
as important policy issues. Climate change, water issues, pollution and whale hunting
were identified as the main global environmental problems occupying peoples’ minds
at the moment. The main local issues included: tree clearing, soil erosion, weeds and
pest invasion, waste problems and water issues. Participants recognised that education
about alternative ways of managing natural resources can help to address some of
these problems. They believed that planting trees and efficient use of water can
improve current environmental conditions.
Participants indicated that, if they had a choice between different natural resources
management strategies, they would like to know more about the potential long term
consequences of different management actions. They stated that not undertaking
actions to address these environmental issues could cause many problems including:
more soil erosion, a reduction in farm productivity, a reduction of wildlife, increased
salinity, increased weed problems and a deterioration of water quality. Before making
any natural resource management decisions, participants also wanted to know how the
improvement could be maintained and monitored and ‘who is going to manage it’.
Importantly, they indicated that the social impacts of management changes should
also be defined.
Selection of an appropriate payment vehicle:
As in the Tamworth focus groups, Goulburn participants suggested that taxpayers
should pay for environmental improvements: “the beneficiaries should pay”; “every
Australian” should contribute. The amount of $300 annually over five years for
environmental improvement seemed to be too low for most of the participants.
Participants weren’t sure whether only the people living in the Hawkesbury-Nepean
catchment or the whole of NSW would pay for environmental improvements.
11
Reactions to the draft questionnaire
The general impression of the questionnaire for most participants was that it was not
biased: information presented was sufficiently brief but could be better presented e.g.
using dot point form, graphs, better maps and more pictures. However, some
participants felt that there was not enough information about the options and as a
result the options were confusing. On the other hand, participants recognised that
more information could bias responses and discourage people from answering the
questionnaire. One or two people suggested that the information on why protecting
the environment is important to them and how it can affect their life should be added.
However, they thought that this could make the questionnaire less objective.
Participants also suggested that the aim of the study should be more apparent and, for
example, be presented on the front page. Participants still found the choice set
confusing.
All participants agreed that the set of attributes presented in the draft of the
questionnaire was appropriate and important for the region. The levels of the
attributes were considered to be believable.
Explanatory information about the choice sets included greater emphasis on
independent consideration of each choice set resulting in less confusion. However,
confusion did still occur because participants did not see enough benefits from
undertaking the proposed natural resource management actions They noticed that,
even if they pay for management actions, environmental conditions may still
deteriorate, albeit at a slower rate: I am going to pay $200 and we are still going to
lose so many km2 of native vegetation in the catchment”.
Outcomes
The main change to the questionnaire made after the Goulburn focus groups was to
add more explanation about the way the environmental improvements could be made.
More pictures presenting the environmental problems and the way they could be
managed were added to the information poster. One additional attribute, “people
working in rural areas” was added to the choice sets to reflect the concern that social
impacts of change were being ignored as also suggested by the previous focus group
12
meeting in Tamworth. The information on “who” is going to pay for the
environmental improvements was better highlighted.
4.3 Sydney
Two focus groups were conducted in Sydney. Ten participants attended the first
session at 6pm and 8 participants attended the second session at 8pm. The focus
groups’ participants varied in terms of gender, age, profession and income. Most of
the participants had tertiary qualifications (see Appendix A).
Reactions to the draft questionnaire
General impressions of the questionnaire were that it was not biased and that the
information presented was largely clear. Some participants felt that the questionnaire
was pro-environmental, but others stated that “it is giving you the facts”. It was
suggested that the levels of the attributes could be expressed more clearly.
Participants also suggested that the information on the poster could be presented
better by using dot point form, graphs, better maps and colour pictures. The
information that some natural resource management actions could increase the
number of people leaving rural areas while others could reduce this movement was
found to be somewhat confusing. Participants considered that the aim of the study was
not sufficiently clearly stated in the questionnaire. They suggested including a
separate letter with the questionnaire to explain the purpose of the study.
There was less confusion about the choice sets than in previous groups; however, the
few participants who did not look at the choice sets independently experienced some
confusion.
Some participants felt that there was too little improvement in environmental quality
in the prospective options. Participants said they would like to have more explanation
of why they should care about the environment in an area where they do not live.
However, they recognised that “protecting the environment is important” and they
should care about the environment as “it is my backyard”.
13
Selection of the appropriate payment vehicle
The payment of $300 per annum over five years was considered to be too high,
especially as other areas in Australia may need support as well: “$300 for all of the
areas would be too much”. It was clear that the payment would be made through
taxes, recreational charges, higher council rates and higher prices for goods and
services. The number of attributes was thought to be adequate. About 90 per cent of
participants felt that the explanatory page was too wordy and some did not read it.
They suggested presenting this information in a summary dot point form.
Outcomes
Following the comments from the Sydney and previous focus group discussions,
numerous changes were made to the draft of the questionnaire. The main changes
were in regard to the presentation of the issues. The information was presented in dot
point form. More pictures presenting the problem and potential ways of dealing with
environmental issues were added to the information poster. The information page on
how to fill out the choice sets was also changed and presented in dot point form. The
information previously included in the questionnaire about the purpose of the survey,
the details of the project and contact details of the researchers was taken out of the
questionnaire and presented in a separate letter of invitation to accompany the
questionnaire.
4.4 Cowra
Two focus groups were conducted in Cowra. Ten participants attended the first
session at 6pm and 12 participants attended the second session at 8pm. The focus
groups participants were highly heterogenous in educational level and age. The first
focus group was dominated by males (see Appendix A) the second focus group
included almost equal numbers of males and females.
Reactions to the draft questionnaire
After making all the changes to the questionnaire based on the previous focus groups,
the Cowra focus group meetings concentrated on the draft of the questionnaire. The
format of the draft of the questionnaire differed significantly from the previous
versions. The general impression about the questionnaire was that it was clear,
interesting and easy to understand.
14
Most of the participants felt that the questionnaire was unbiased and reflected the
facts but a few said “it makes you feel guilty” and “it is leading towards
conservation”. About 50 percent of participants considered each choice separately.
The choice set was clearer than experienced in the previous focus group meetings but
still some participants found the choice set confusing. The choice and number of
attributes were viewed as adequate. Respondents agreed that all the selected attributes
were important. The levels of the attributes were considered to be reasonable.
Participants suggested adding river details and the area of native vegetation on the
map. Some participants required more information on the objective of the study, why
protecting the environment is important to them and how it can affect their life. Some
participants wanted to see more information about possible actions. Nevertheless,
other participants recognised that more information could bias the questionnaire and
make it too long. There was some confusion about the meaning of the term “people
working in rural areas”. Participants indicated that they would like to have a better
explanation of who are the people working in rural areas. Participants also wanted to
have the aim of the study set out at the beginning of the letter.
Selection of the appropriate payment vehicle:
There was no confusion about the payment vehicle. The amount of payment was
deemed reasonable; however, participants expressed their opinion that $300 per year
over five years was the maximum they would consider. For a few participants, $300
per annum was too much.
Outcomes
The attribute “people working in rural areas” was changed to “people working in
agriculture”. The attribute “area of native vegetation” was changed to “area of native
vegetation in good condition”. This provides more clarity regarding how Natural
Resource Management (NRM) actions can improve the current status of native
vegetation conditions. Better satellite maps with rivers and cities were included in the
poster. A pie chart describing the area of native vegetation and the major land uses in
the catchment was also added to each questionnaire.
15
5. Conclusion
The focus group discussions played an important role in the CM questionnaire design.
They helped to determine the relevant attributes that should be included in choice sets,
the number of options presented to the respondents and the information required to
appropriately frame the issue. Each focus group built on the information obtained
from the previous sessions.
The importance of the focus group comments in developing this questionnaire is
apparent. For example, the first draft of the questionnaire suffered from a number of
problems: most importantly a lack of clarity in the presentation of the issue and the
omission of one attribute.
The information provided by focus group participants provided a better understanding
of people’s knowledge about the environmental issues. This allowed making
appropriate adjustments to the frame of the issue presented in the draft questionnaire
and to the attributes. As a result, numerous changes were made to the draft
questionnaire over the course of the focus group. These included simplification and
clarification of the most complicated parts of the questionnaire. The amount of
information was reduced and some information was presented in dot point and
graphical form. An additional attribute was included in the choice set (“number of
people working in agriculture”).
Using information and feedback from the focus group sessions, a final draft of the
questionnaire was developed. The final set of attributes chosen was: area of native
vegetation in good condition, number of native species, length of healthy waterways,
and number of people working in agriculture. The range of payment for
environmental improvement was chosen to be from $0 to $300. The final
questionnaire is included as Appendix C.
16
References BENNETT, J. (forthcoming) Defining and Managing Environmental Flows: Inputs
from Society. Australian Economic Papers BENNETT, J., DUMSDAY R., HOWELL, G., LLOYD C., STURGESS, N. and
VAN RAALTE, L. forthcoming. The Economic Value of Improved Environmental Health in Victorian Rivers. Australasian Journal of Environmental Management
BENNETT, J. & ADAMOWICZ, V. (2001) Some Fundamentals of Environmental
Choice Modelling. IN BENNETT, J. & BLAMEY, R. (Eds.) The Choice Modelling Approach to Environmental Valuation. Massachusetts, Edward Elgar Publishing Limited.
BLAMEY, R. K., BENNETT, J. W., LOUVIERE, J. J., MORRISON, M. D. & ROLFE, J. (2000) A test of policy labels in environmental choice modelling studies. Ecological Economics, 32, 269-286.
HANLEY, N. & SPASH, C. (1993) Benefit Cost Analysis and the Environment, Bodmin, Cornwall, Edward Elgar Publishing Limited.
JUNGHO, S. (2002) Estimation of Non-market Forest Benefits Using Choice Modelling. IN HARRISON, S. R. A. H., JOHN L. AND MANGAOANG, EDUARDO O. (Ed.) Socio-Economic Research Methods in Forestry: A Training Manual. Baybay, The Philippines, Leyte State University, ViSCA.
MORRISON, M. D., BENNETT, J. W. & BLAMEY, R. K. (1997) Choice modelling research report No. 5 Designing choice modelling surveys using focus groups: Results from the Macquarie Marshes and Gwydir Wetlands studies. The University of New South Wales.
ROLFE, J., ALAM, K., WINDLE, J. & WHITTEN, S. (2004) Designing the Choice Modelling Survey Instrument for Establishing Riparian Buffers in the Fitzroy Basin. Establishing the potential for offset trading in the Lower Fitzroy River, Research Report
17
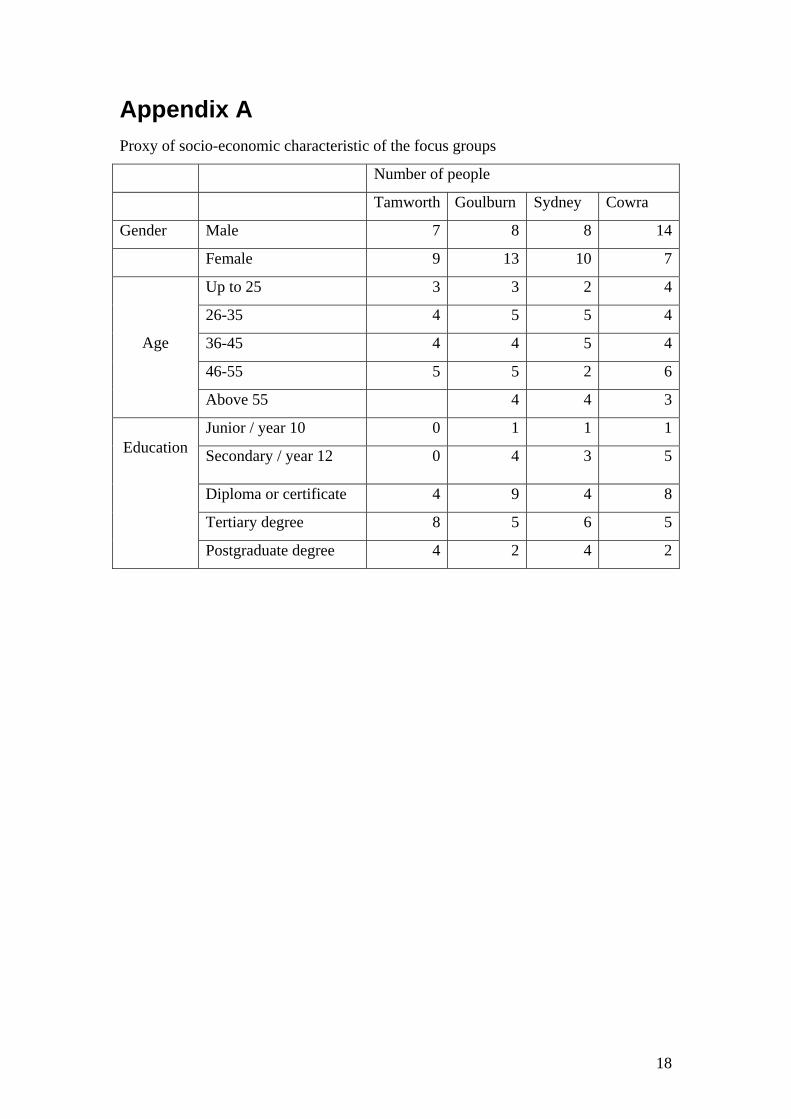
Appendix A Proxy of socio-economic characteristic of the focus groups
Number of people
Tamworth Goulburn Sydney Cowra
Gender Male 7 8 8 14
Female 9 13 10 7
Up to 25 3 3 2 4
26-35 4 5 5 4
36-45 4 4 5 4
46-55 5 5 2 6
Age
Above 55 4 4 3
Junior / year 10 0 1 1 1
Secondary / year 12 0 4 3 5
Diploma or certificate 4 9 4 8
Tertiary degree 8 5 6 5
Education
Postgraduate degree 4 2 4 2
18
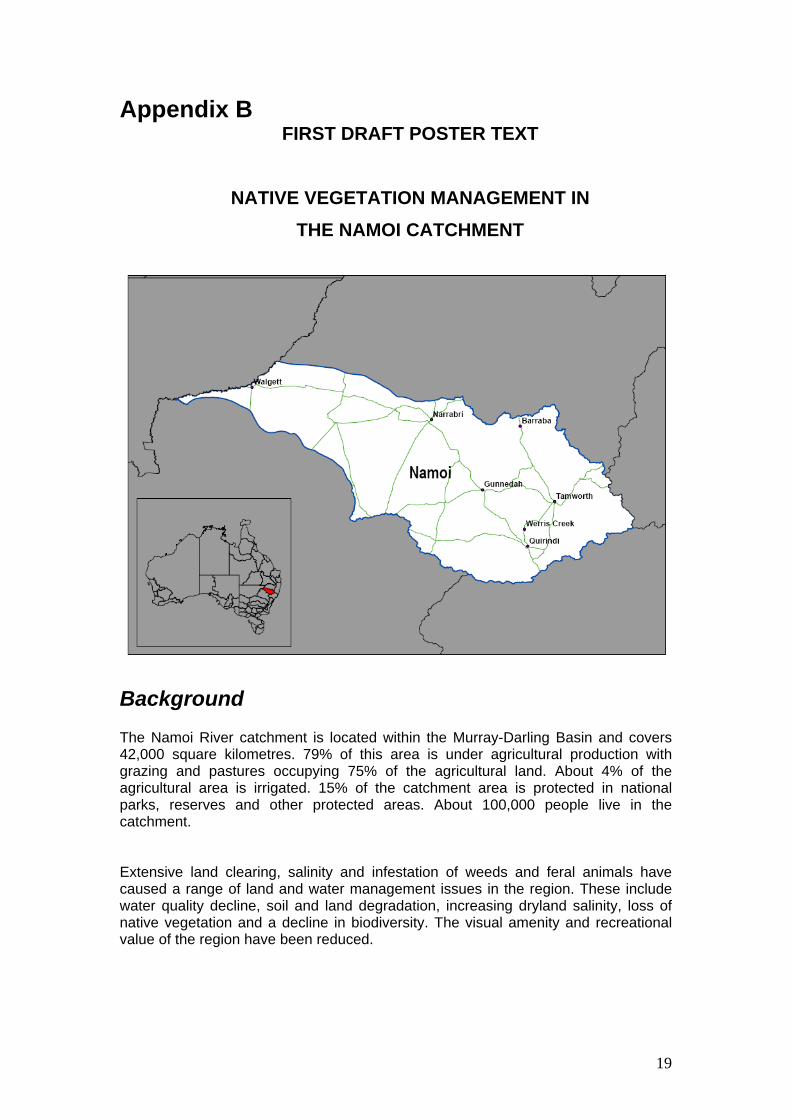
Appendix B FIRST DRAFT POSTER TEXT
NATIVE VEGETATION MANAGEMENT IN
THE NAMOI CATCHMENT
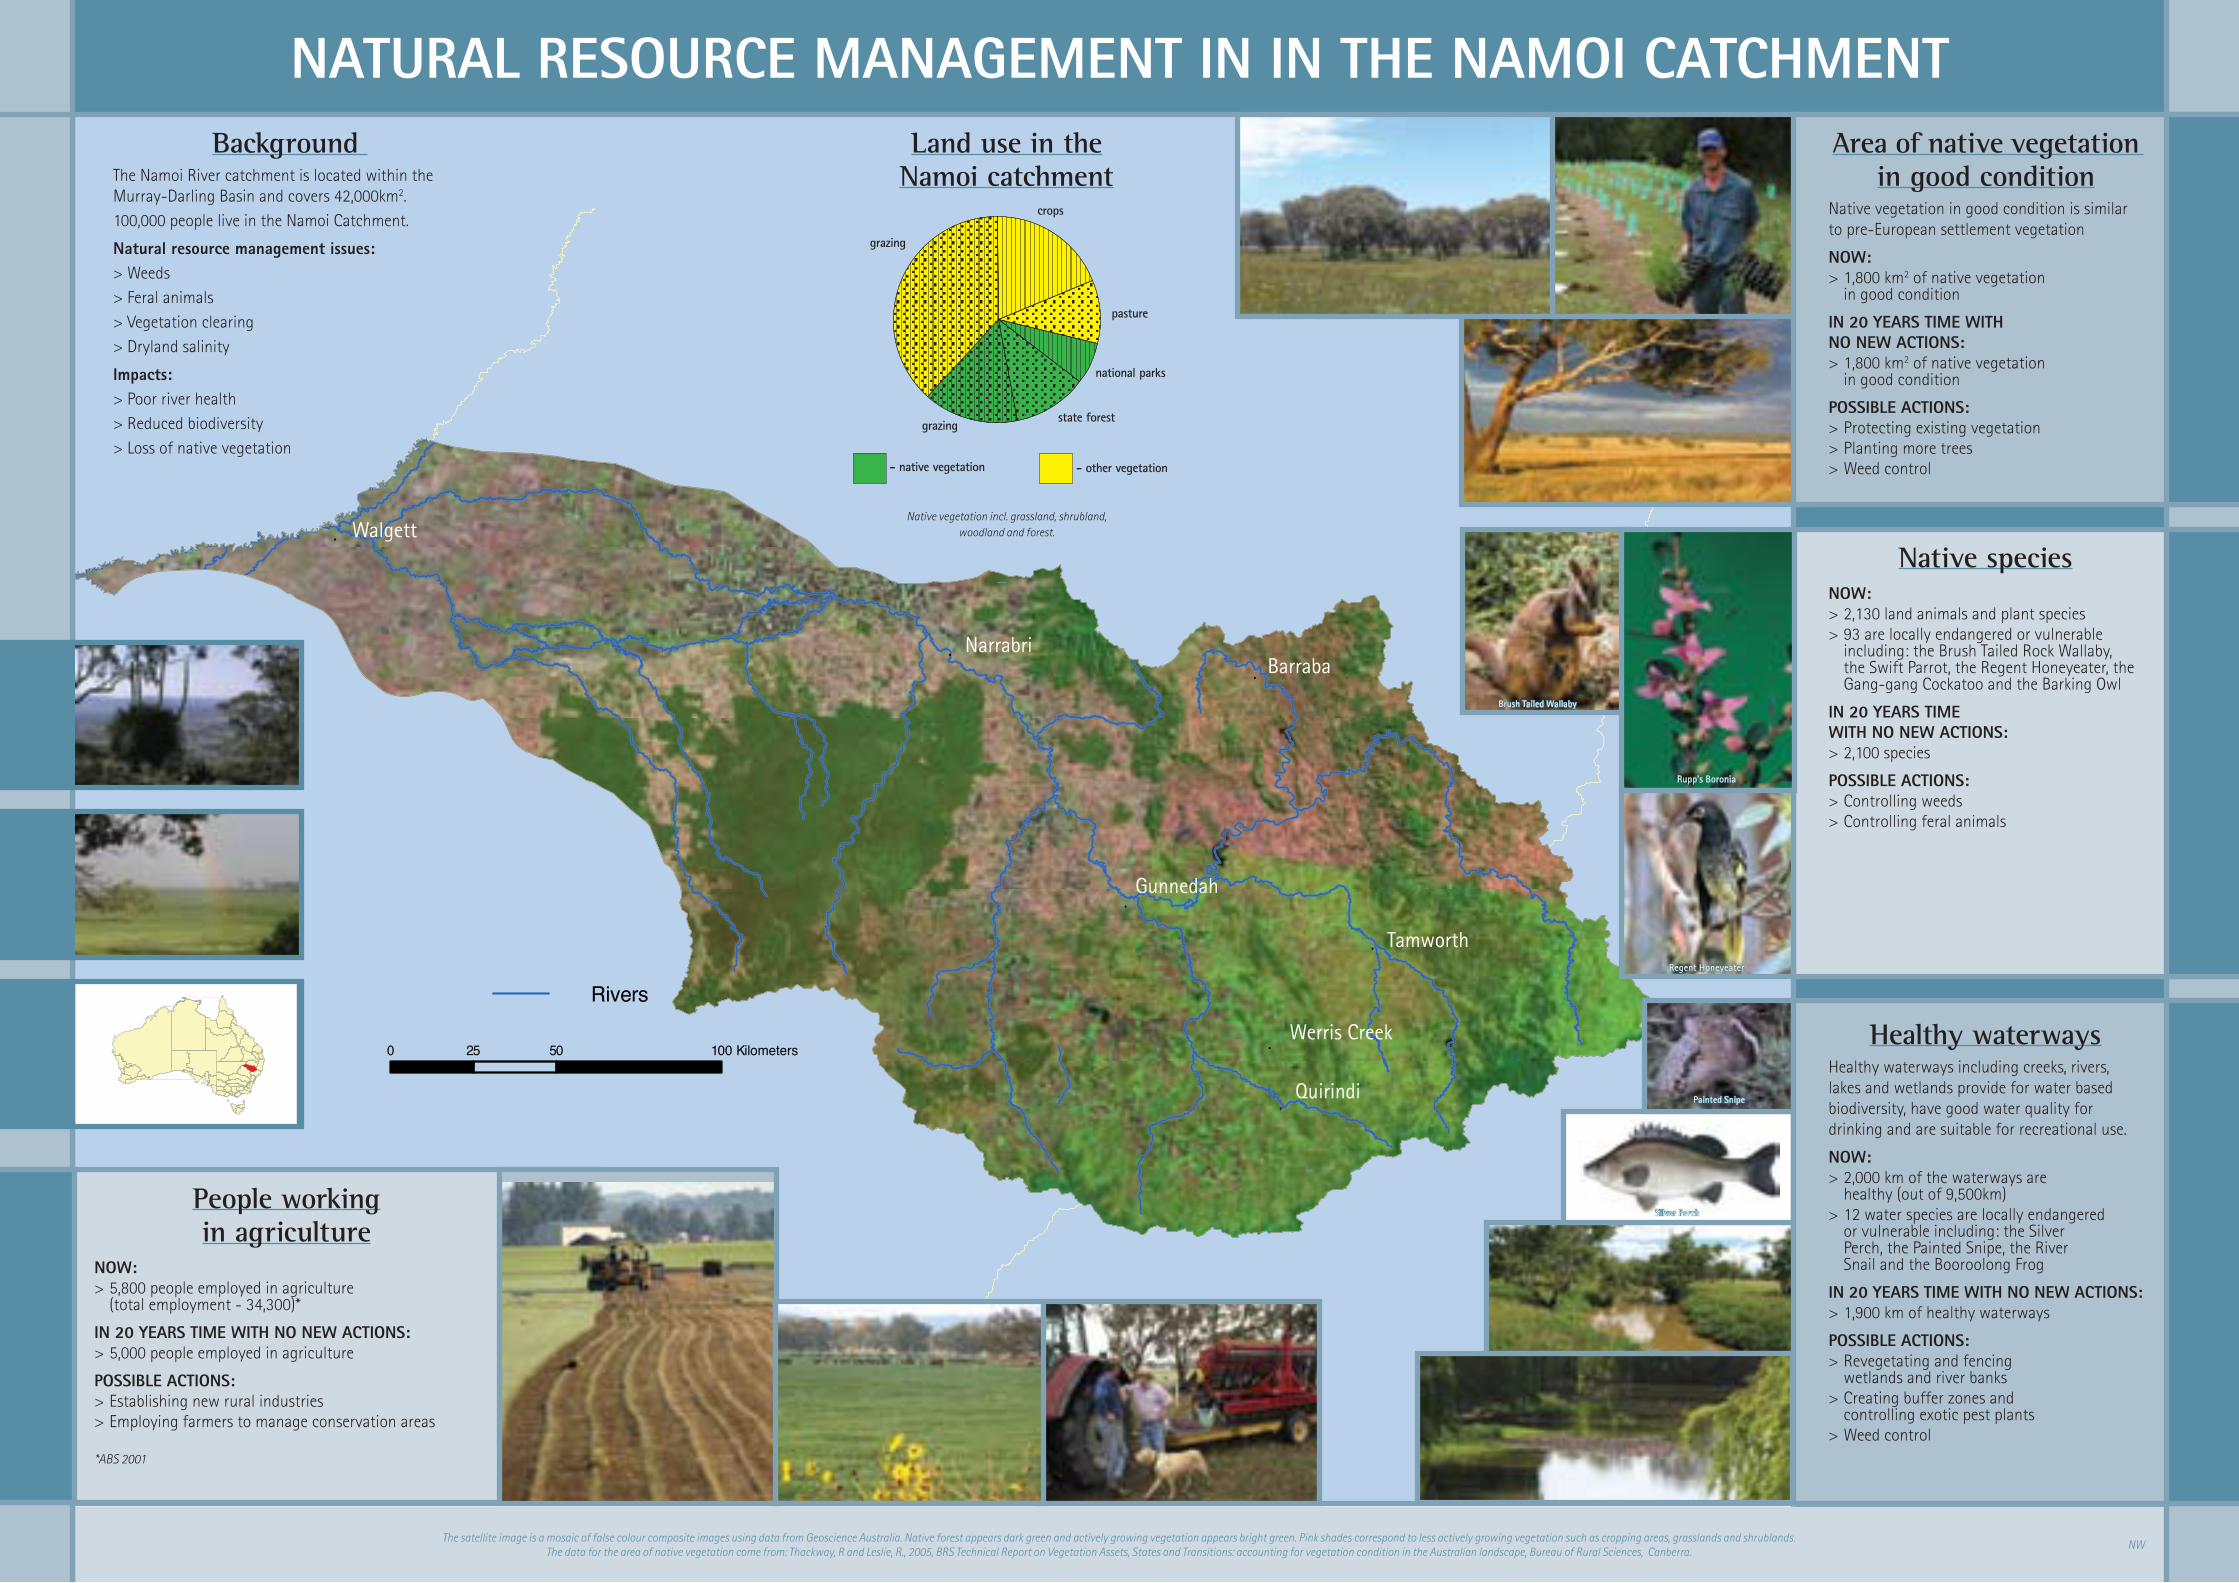
Background The Namoi River catchment is located within the Murray-Darling Basin and covers 42,000 square kilometres. 79% of this area is under agricultural production with grazing and pastures occupying 75% of the agricultural land. About 4% of the agricultural area is irrigated. 15% of the catchment area is protected in national parks, reserves and other protected areas. About 100,000 people live in the catchment. Extensive land clearing, salinity and infestation of weeds and feral animals have caused a range of land and water management issues in the region. These include water quality decline, soil and land degradation, increasing dryland salinity, loss of native vegetation and a decline in biodiversity. The visual amenity and recreational value of the region have been reduced.
19
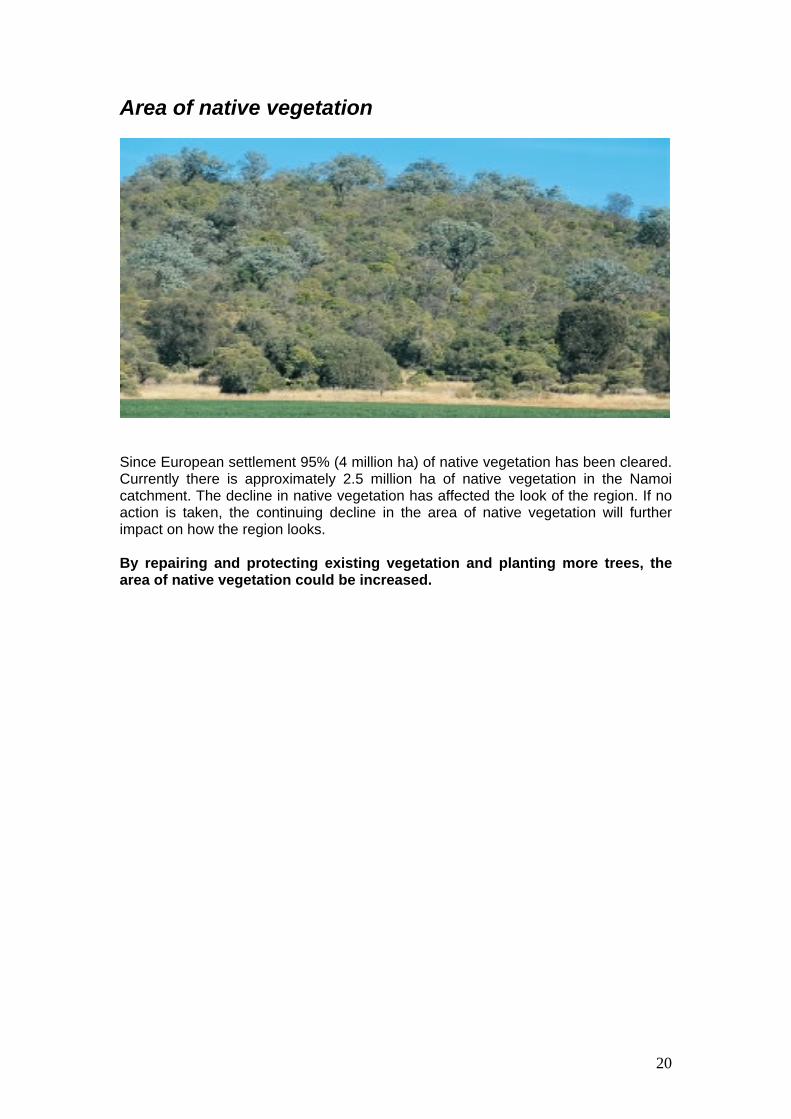
Area of native vegetation
Since European settlement 95% (4 million ha) of native vegetation has been cleared. Currently there is approximately 2.5 million ha of native vegetation in the Namoi catchment. The decline in native vegetation has affected the look of the region. If no action is taken, the continuing decline in the area of native vegetation will further impact on how the region looks. By repairing and protecting existing vegetation and planting more trees, the area of native vegetation could be increased.
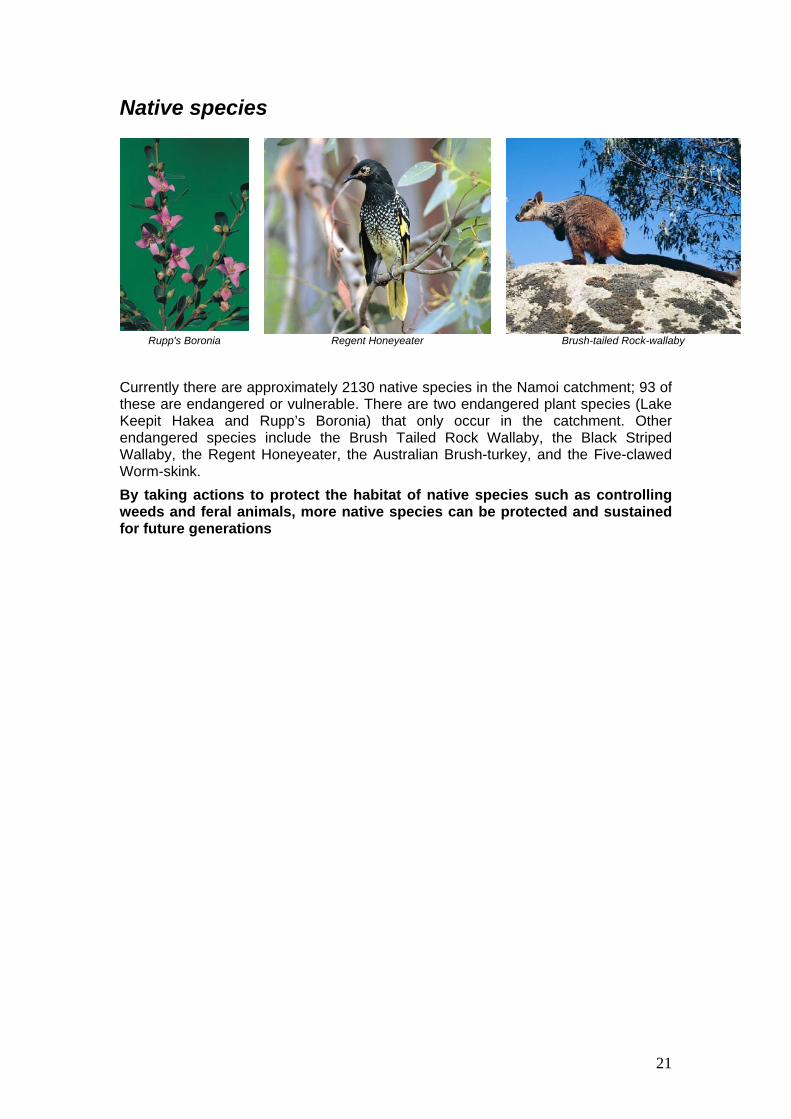
Currently there are approximately 2130 native species in the Namoi catchment; 93 of these are endangered or vulnerable. There are two endangered plant species (Lake Keepit Hakea and Rupp’s Boronia) that only occur in the catchment. Other endangered species include the Brush Tailed Rock Wallaby, the Black Striped Wallaby, the Regent Honeyeater, the Australian Brush-turkey, and the Five-clawed Worm-skink. By taking actions to protect the habitat of native species such as controlling weeds and feral animals, more native species can be protected and sustained for future generations
21
Healthy waterways
Painted Snipe
River snail
Silver perch
Booroolong Frog
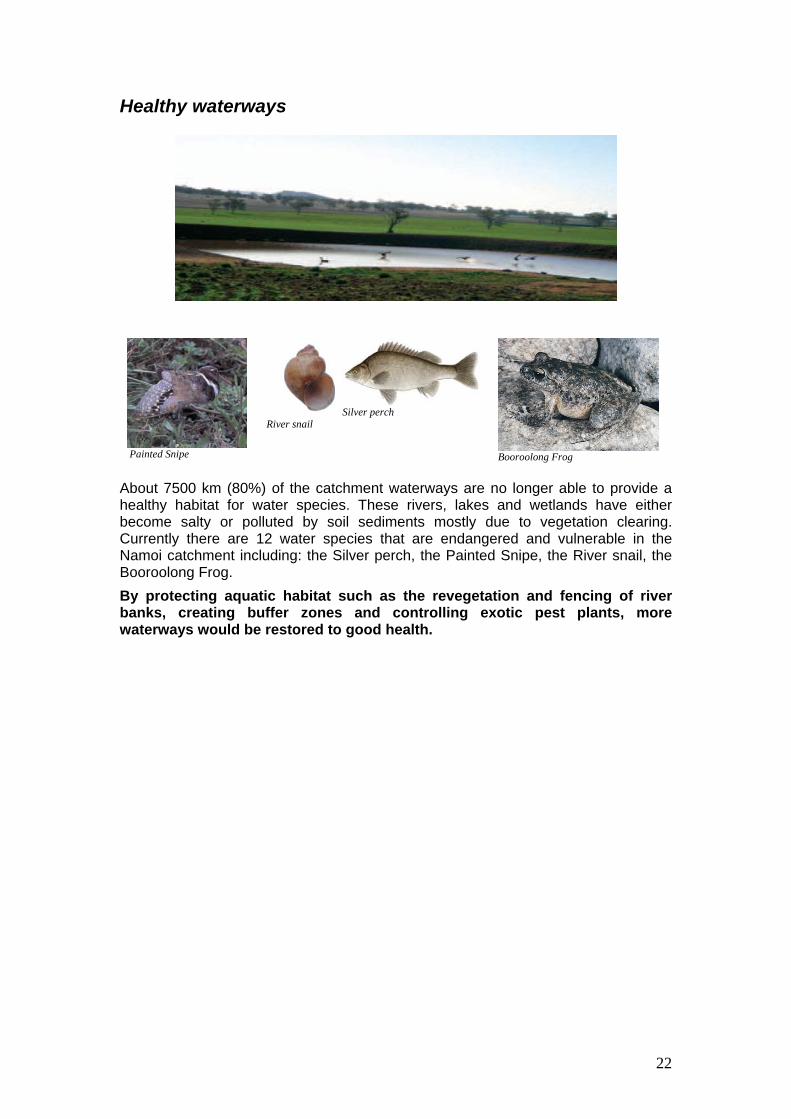
About 7500 km (80%) of the catchment waterways are no longer able to provide a healthy habitat for water species. These rivers, lakes and wetlands have either become salty or polluted by soil sediments mostly due to vegetation clearing. Currently there are 12 water species that are endangered and vulnerable in the Namoi catchment including: the Silver perch, the Painted Snipe, the River snail, the Booroolong Frog. By protecting aquatic habitat such as the revegetation and fencing of river banks, creating buffer zones and controlling exotic pest plants, more waterways would be restored to good health.
22
FIRST DRAFT QUESTIONNAIRE NATIVE VEGETATION MANAGEMENT IN
THE NAMOI CATCHMENT
A SURVEY OF COMMUNITY ATTITUDES
WHAT THIS SURVEY IS ABOUT
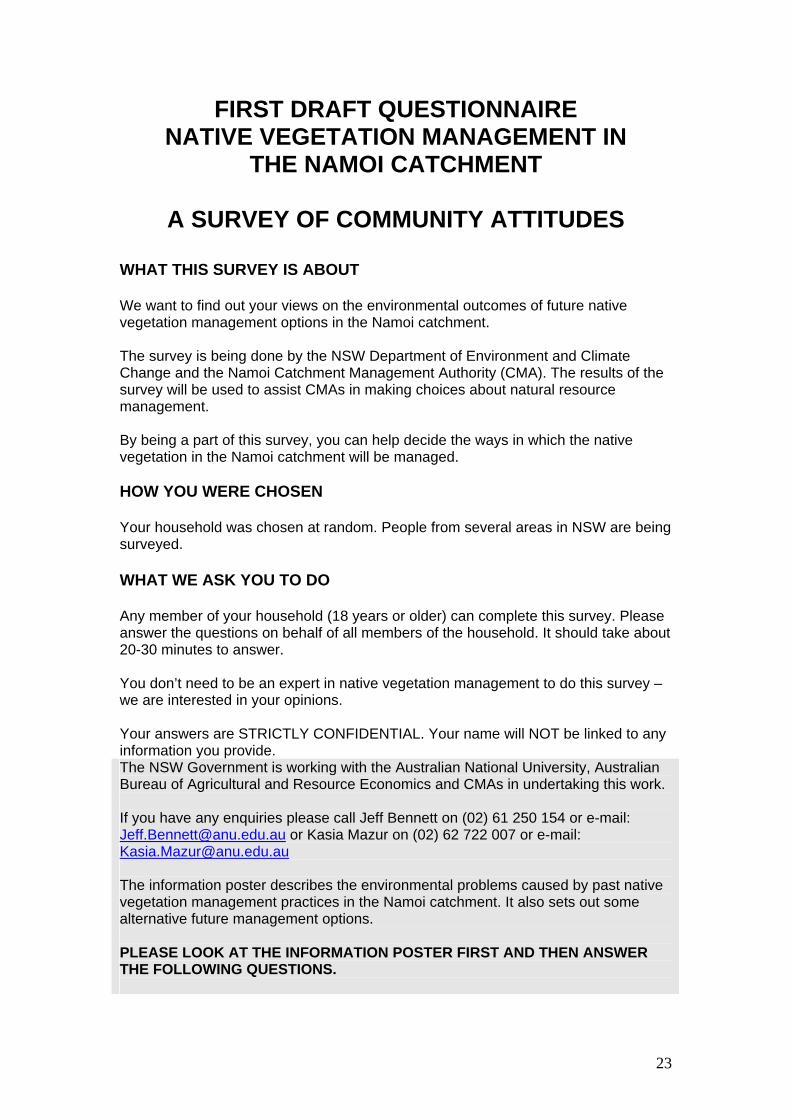
We want to find out your views on the environmental outcomes of future native vegetation management options in the Namoi catchment. The survey is being done by the NSW Department of Environment and Climate Change and the Namoi Catchment Management Authority (CMA). The results of the survey will be used to assist CMAs in making choices about natural resource management. By being a part of this survey, you can help decide the ways in which the native vegetation in the Namoi catchment will be managed. HOW YOU WERE CHOSEN Your household was chosen at random. People from several areas in NSW are being surveyed. WHAT WE ASK YOU TO DO Any member of your household (18 years or older) can complete this survey. Please answer the questions on behalf of all members of the household. It should take about 20-30 minutes to answer. You don’t need to be an expert in native vegetation management to do this survey – we are interested in your opinions. Your answers are STRICTLY CONFIDENTIAL. Your name will NOT be linked to any information you provide. The NSW Government is working with the Australian National University, Australian Bureau of Agricultural and Resource Economics and CMAs in undertaking this work. If you have any enquiries please call Jeff Bennett on (02) 61 250 154 or e-mail: [email protected] or Kasia Mazur on (02) 62 722 007 or e-mail: [email protected] The information poster describes the environmental problems caused by past native vegetation management practices in the Namoi catchment. It also sets out some alternative future management options. PLEASE LOOK AT THE INFORMATION POSTER FIRST AND THEN ANSWER THE FOLLOWING QUESTIONS.
Question 3 How interested are you in native vegetation management in the Namoi catchment?
Not interested at all
Slightly interested
Moderately interested
Very interested
25
WHAT DO YOU THINK? Options & Attributes In Questions 4 to 8 we want you to make some choices between alternative future options for managing native vegetation in the Namoi catchment. In all the questions, one option (Option A) stays the same. It’s a continuation of current management practices and involves no new initiatives. All of the other options (Options B to K) involve vegetation management changes. They would lead to improvements in the environmental condition of the catchment. The outcomes of each option are described in terms of three environmental attributes: hectares of native vegetation, number of species protected, kilometres of healthy waterways. Costs Changes to vegetation management will cost money. For example, new fences will be built, trees will be planted and some land will be bought and allowed to re-vegetate. In addition, payments may be made to people made worst-off by the changes. For example, if there is less area devoted to agriculture but more to vegetation, some of the 2,546 people employed in the Namoi catchment’s agricultural industries may be affected. Payments The money to pay for vegetation management changes will come from the people of NSW (Australian taxpayers) through increased taxes, higher council rates, recreation charges, higher prices for goods and services, or some combination of these. Choices We want you to choose between the options described in each question. Please consider:
• the different outcomes that specialist are predicting for the options in 20 years time; and
• what we estimate the options will cost you in higher taxes and prices. Then make your choice. When making your choices please consider that:
• payments for the options would be made annually for 5 years; • your income is limited and you have other expenses; and • other areas of NSW may also need funding for environmental improvement
Note: Even though the choices are hypothetical, they are based on current scientific knowledge. Your answers are important to deciding the way the native vegetation in the Namoi catchment is managed. Please make your choices as if they were real. Each question should be considered independently of each other. Some of the option outcomes may seem strange to you. However, each outcome depends on the combination of native vegetation management strategies used. Some of these strategies are referred to in the poster.
26
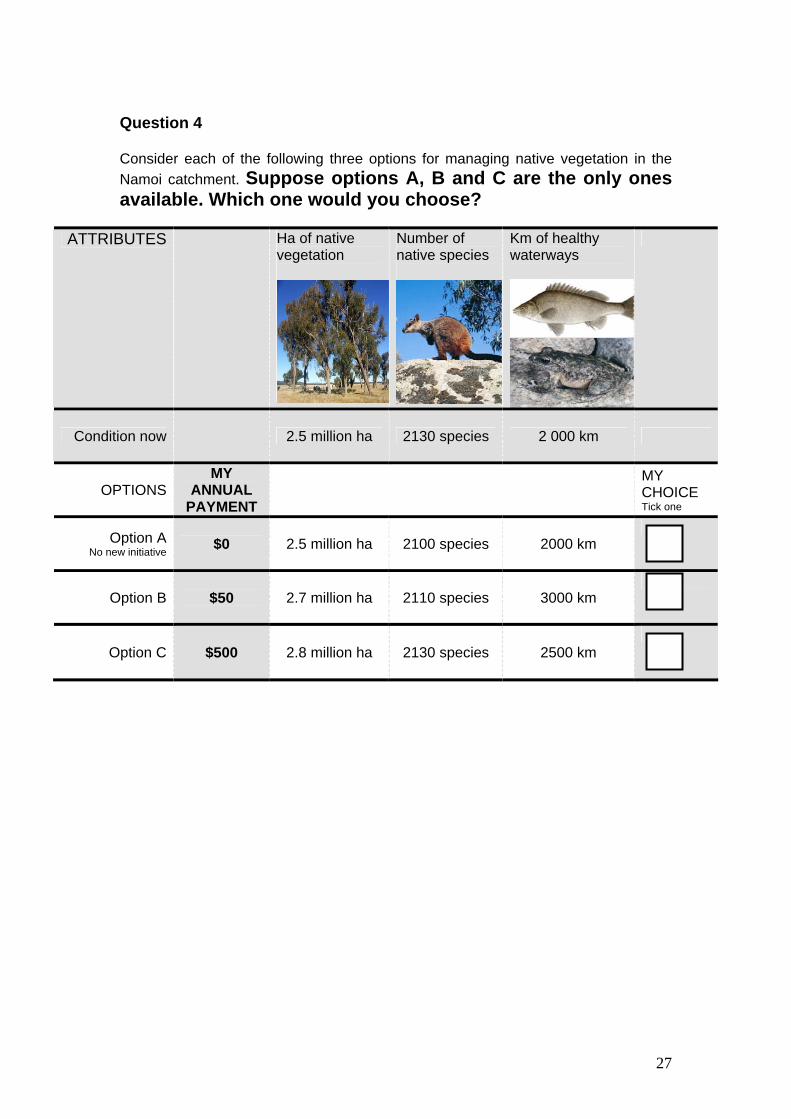
Question 4 Consider each of the following three options for managing native vegetation in the Namoi catchment. Suppose options A, B and C are the only ones available. Which one would you choose?
ATTRIBUTES Ha of native vegetation
Number of native species
Km of healthy waterways
Condition now
2.5 million ha 2130 species 2 000 km
OPTIONS MY
ANNUAL PAYMENT
MY CHOICE Tick one
Option A No new initiative $0 2.5 million ha 2100 species 2000 km
Option B $50 2.7 million ha 2110 species 3000 km
Option C $500 2.8 million ha 2130 species 2500 km
27
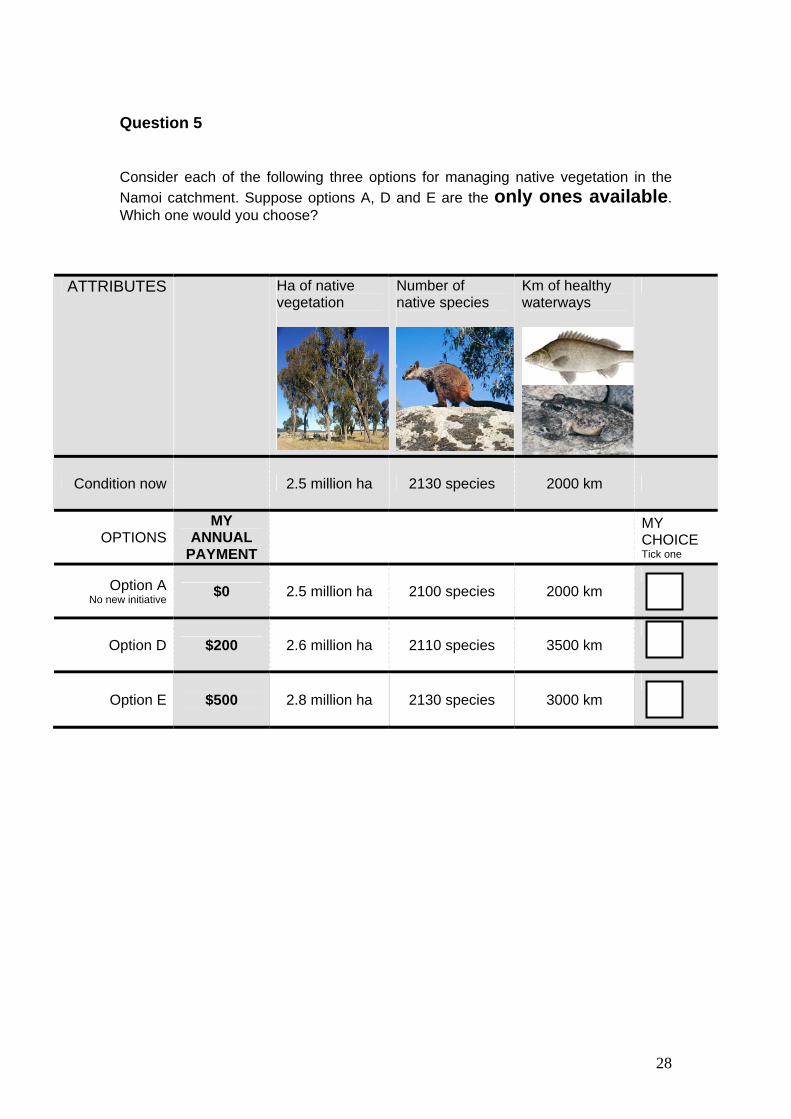
Question 5 Consider each of the following three options for managing native vegetation in the Namoi catchment. Suppose options A, D and E are the only ones available. Which one would you choose?
ATTRIBUTES Ha of native vegetation
Number of native species
Km of healthy waterways
Condition now
2.5 million ha 2130 species 2000 km
OPTIONS MY
ANNUAL PAYMENT
MY CHOICE Tick one
Option A No new initiative $0 2.5 million ha 2100 species 2000 km
Option D $200 2.6 million ha 2110 species 3500 km
Option E $500 2.8 million ha 2130 species 3000 km
28
Question 6 Consider each of the following three options for managing native vegetation in the Namoi catchment. Suppose options A, F and G are the only ones available. Which one would you choose?
ATTRIBUTES Ha of native vegetation
Number of native species
Km of healthy waterways
Condition now
2.5 million ha 2130 species 2000 km
OPTIONS MY
ANNUAL PAYMENT
MY CHOICE Tick one
Option A No new initiative $0 2.5 million ha 2100 species 2000 km
Option F $50 2.8 million ha 2130 species 2500 km
Option G $200 2.7 million ha 2120 species 3500 km
29
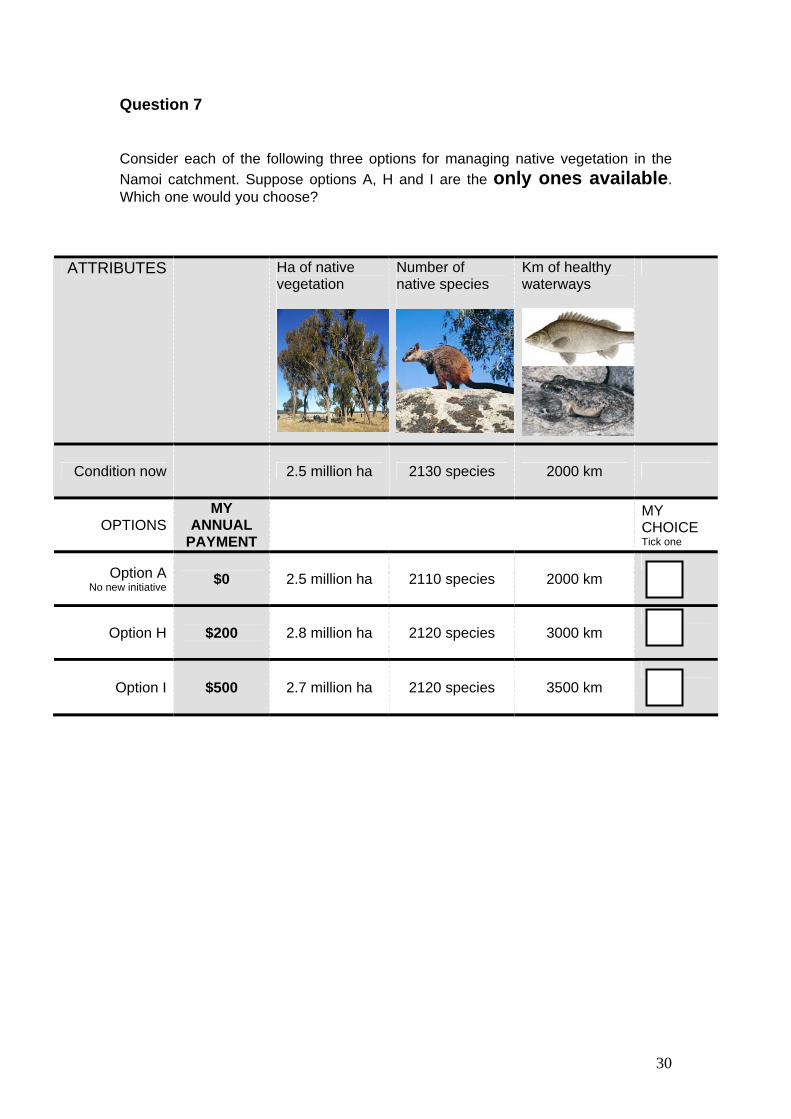
Question 7 Consider each of the following three options for managing native vegetation in the Namoi catchment. Suppose options A, H and I are the only ones available. Which one would you choose?
ATTRIBUTES Ha of native vegetation
Number of native species
Km of healthy waterways
Condition now
2.5 million ha 2130 species 2000 km
OPTIONS MY
ANNUAL PAYMENT
MY CHOICE Tick one
Option A No new initiative $0 2.5 million ha 2110 species 2000 km
Option H $200 2.8 million ha 2120 species 3000 km
Option I $500 2.7 million ha 2120 species 3500 km
30
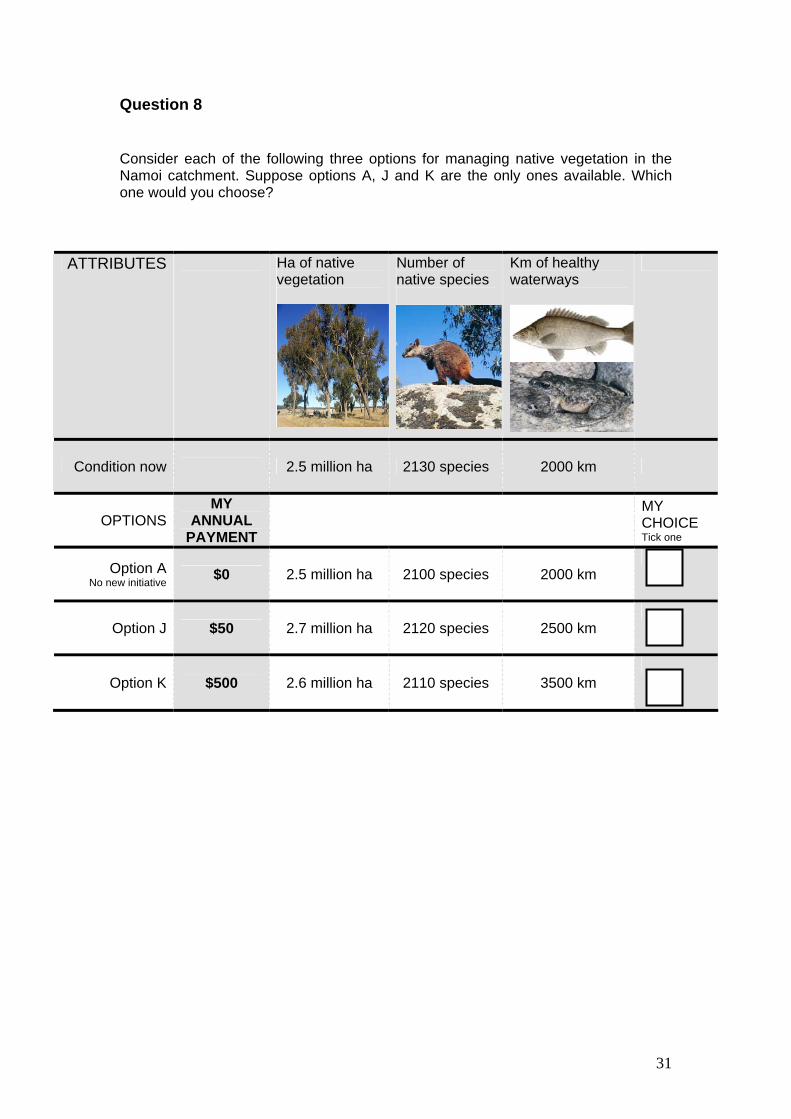
Question 8 Consider each of the following three options for managing native vegetation in the Namoi catchment. Suppose options A, J and K are the only ones available. Which one would you choose?
ATTRIBUTES Ha of native vegetation
Number of native species
Km of healthy waterways
Condition now
2.5 million ha 2130 species 2000 km
OPTIONS MY
ANNUAL PAYMENT
MY CHOICE Tick one
Option A No new initiative $0 2.5 million ha 2100 species 2000 km
Option J $50 2.7 million ha 2120 species 2500 km
Option K $500 2.6 million ha 2110 species 3500 km
31
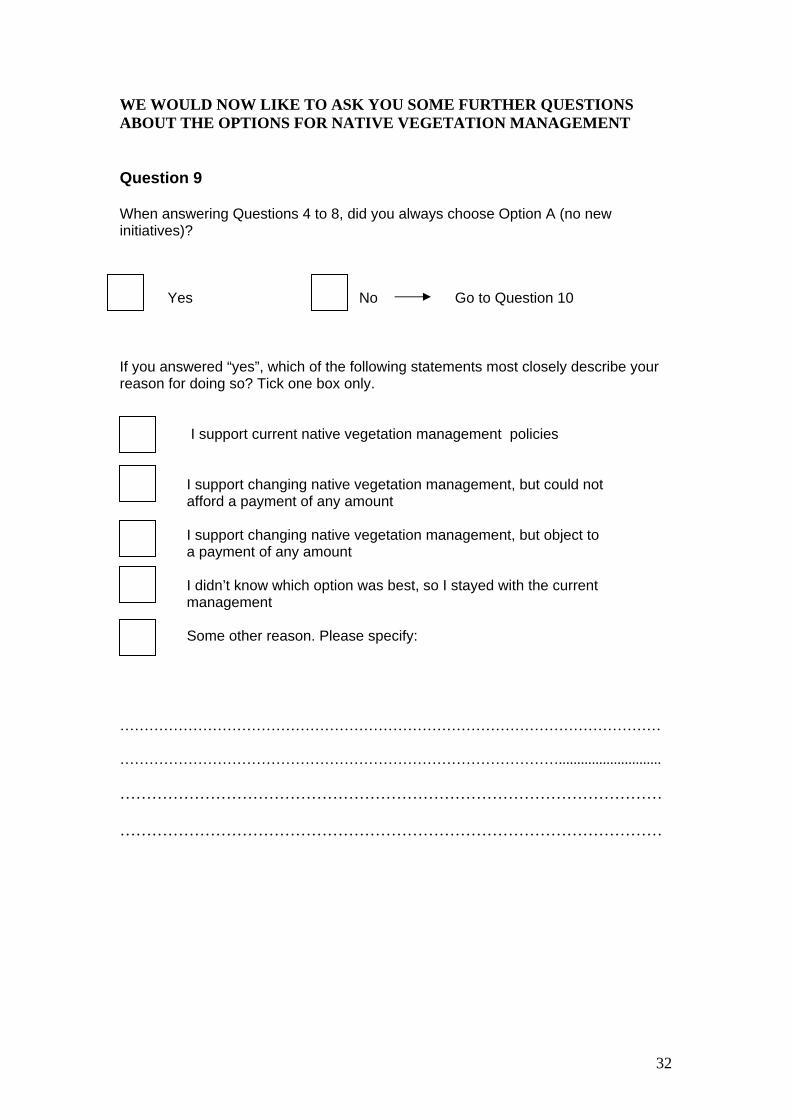
WE WOULD NOW LIKE TO ASK YOU SOME FURTHER QUESTIONS ABOUT THE OPTIONS FOR NATIVE VEGETATION MANAGEMENT Question 9 When answering Questions 4 to 8, did you always choose Option A (no new initiatives)? Yes No Go to Question 10 If you answered “yes”, which of the following statements most closely describe your reason for doing so? Tick one box only.
I support current native vegetation management policies
I support changing native vegetation management, but could not afford a payment of any amount
I support changing native vegetation management, but object to a payment of any amount
I didn’t know which option was best, so I stayed with the current management
Question 10 Thinking about the information presented on the poster, please indicate how strongly you agree or disagree with EACH of the following statements. Tick the option that is closest to your view. I understood all the information on the poster
Strongly Disagree
Disagree Neither Agree nor Disagree
Agree
Strongly Agree
I needed more information that was provided
Strongly Disagree
Disagree Neither Agree nor Disagree
Agree
Strongly Agree
I found answering Questions 4 to 8 confusing
Strongly Disagree
Disagree Neither Agree nor Disagree
Agree
Strongly Agree
33
In this last section, we would like to ask you a few questions to help us understand why respondents’ opinions may differ.
WE REALISE THAT SOME OF THESE QUESTIONS MAY BE SENSITIVE TO YOU BUT PLEASE BE ASSURED THAT THE INFORMAION IS CONFIDENTIAL
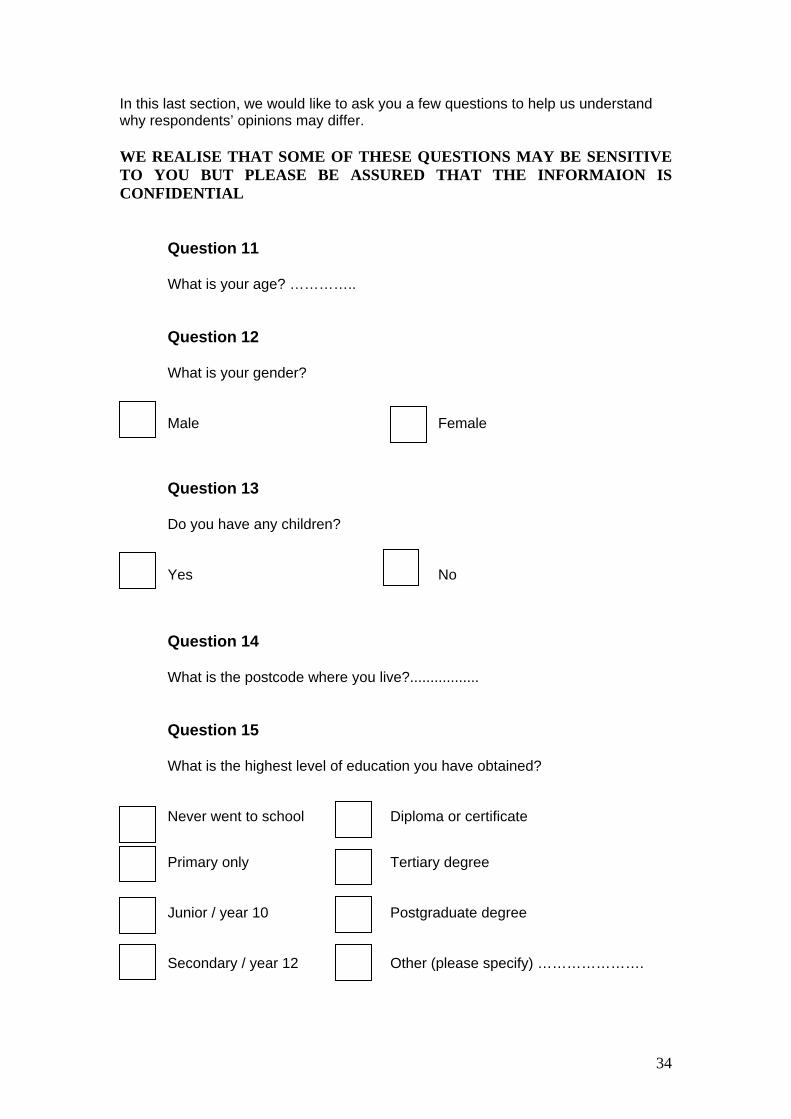
Question 11 What is your age? ………….. Question 12 What is your gender?
Male
Female
Question 13 Do you have any children?
Yes
No
Question 14 What is the postcode where you live?................. Question 15 What is the highest level of education you have obtained?
Never went to school
Diploma or certificate
Primary only
Tertiary degree
Junior / year 10
Postgraduate degree
Secondary / year 12
Other (please specify) ………………….
34
Question 16 How many people live in your household?........................................ Question 17
How many people in your household are under 18 years of age? ……..
Question 18
Annual Household Income - Please indicate the approximate total household income (before taxes) earned last year. The ranges shown are consistent with those used in the 2006 Census. As for all your answers, information provided here is STRICTLY CONFIDENTIAL.
Under $7,800
$52,000 – 67,599
$7,800 – 12,999
$67,600 -83,199
$13,000 – 20,799
$83,200 – 103,999
$20,800 – 31,199
$104,000 or more
$31,200 – 41,599
Don’t know
$$41,600 – 51,999
Question 19
When you have heard about proposed projects where there is a conflict between development and the environment, have you tended to:
Favour protection of the environment
Favour development and environmental protection about equally
Favour development
35
Question 20
If people living in small rural communities and/or working in agriculture are made worse-off by changing native vegetation management practices, the State Government may provide some assistance, at a cost to taxpayers. Would you:
Strongly Agree with providing assistance
Agree with providing assistance
Neither Agree nor Disagree with providing assistance
Disagree with providing assistance
Strongly Disagree with providing assistance
Question 21
Are you, or a member of your close family, a member of an organisation that is associated with environmental conservation?
Yes
No
Question 22
Are you, or a member of your close family, associated with the agriculture industry?
Yes
No
36
IF YOU WOULD LIKE TO MAKE ANY OTHER COMMENTS ABOUT OPTIONS FOR THE NATIVE VEGETATION MANAGEMENT OR ABOUT THIS QUESTIONNAIRE PLEASE MAKE THEM IN THE FOLLOWING SPACE. …………………………………………………………………………………………
…………………………………………………………………………………………
…………………………………………………………………………………………
…………………………………………………………………………………………
…………………………………………………………………………………………
…………………………………………………………………………………………
…………………………………………………………………………………………
…………………………………………………………………………………………
…………………………………………………………………………………………
…………………………………………………………………………………………
Thank you for completing this questionnaire. We hope that you enjoyed taking
part in the survey.
37
Appendix C
38
.
.
.
.
.
.
.
Walgett
NarrabriBarraba
Gunnedah
Tamworth
Werris Creek
Quirindi
0 50 10025 Kilometers
Rivers
Brush Tailed Wallaby
Background The Namoi River catchment is located within the Murray-Darling Basin and covers 42,000km2. 100,000 people live in the Namoi Catchment.
Impacts:> Poor river health> Reduced biodiversity> Loss of native vegetation
Land use in the Namoi catchment- native vegetation
- cleared for agriculture
- other vegetation
crops
pasture
national parks
state forest
grazing
grazing
- native vegetation - other vegetation
crops
pasture
national parks
state forest
grazing
grazing
urban
agriculture/plantations
nationalparks
outsidenational parks
with some grazing
- native vegetation- other vegetation
- urban
Native vegetation incl. grassland, shrubland, woodland and forest.
NATURAL RESOURCE MANAGEMENT IN IN THE NAMOI CATCHMENTArea of native vegetation
in good conditionNative vegetation in good condition is similar to pre-European settlement vegetation
NOW: 1,800 km > 2 of native vegetation in good condition
IN 20 YEARS TIME WITH NO NEW ACTIONS:
1,800 km > 2 of native vegetation in good condition
POSSIBLE ACTIONS:Protecting existing vegetation >Planting more trees >Weed control >
Native speciesNOW:
2,130 land animals and plant species >93 are locally endangered or vulnerable >including: the Brush Tailed Rock Wallaby, the Swift Parrot, the Regent Honeyeater, the Gang-gang Cockatoo and the Barking Owl
IN 20 YEARS TIME WITH NO NEW ACTIONS:
2,100 species >
POSSIBLE ACTIONS: Controlling weeds >Controlling feral animals >
Rupp’s Boronia
Silver Perch
Painted Snipe
People working in agriculture
NOW:5,800 people employed in agriculture >(total employment - 34,300)*
IN 20 YEARS TIME WITH NO NEW ACTIONS: 5,000 people employed in agriculture >
POSSIBLE ACTIONS:Establishing new rural industries >Employing farmers to manage conservation areas >
*ABS 2001
Regent Honeyeater
The satellite image is a mosaic of false colour composite images using data from Geoscience Australia. Native forest appears dark green and actively growing vegetation appears bright green. Pink shades correspond to less actively growing vegetation such as cropping areas, grasslands and shrublands. The data for the area of native vegetation come from: Thackway, R and Leslie, R., 2005, BRS Technical Report on Vegetation Assets, States and Transitions: accounting for vegetation condition in the Australian landscape, Bureau of Rural Sciences, Canberra.
Healthy waterwaysHealthy waterways including creeks, rivers, lakes and wetlands provide for water based biodiversity, have good water quality for drinking and are suitable for recreational use.
NOW: 2,000 km of the waterways are >healthy (out of 9,500km)12 water species are locally endangered >or vulnerable including: the Silver Perch, the Painted Snipe, the River Snail and the Booroolong Frog
IN 20 YEARS TIME WITH NO NEW ACTIONS: 1,900 km of healthy waterways >
POSSIBLE ACTIONS:Revegetating and fencing >wetlands and river banksCreating buffer zones and >controlling exotic pest plantsWeed control >
NW
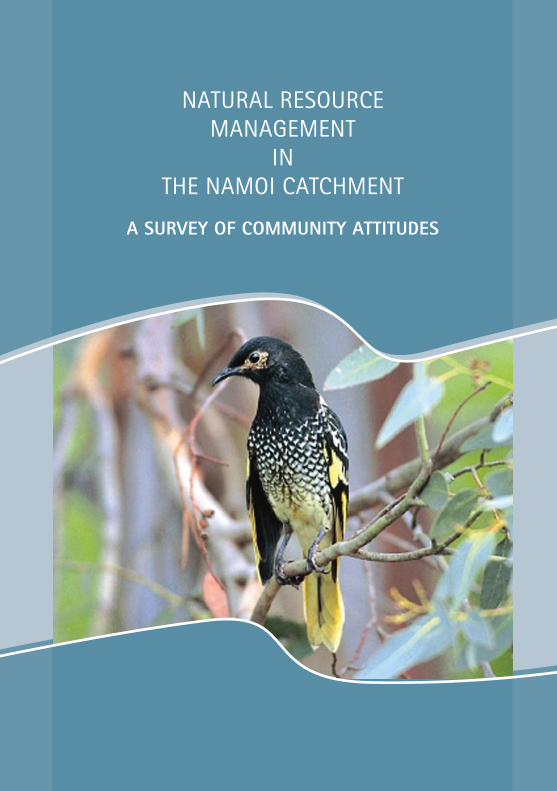
NATURAL RESOURCE MANAGEMENT
IN THE NAMOI CATCHMENT
A SURVEY OF COMMUNITY ATTITUDES
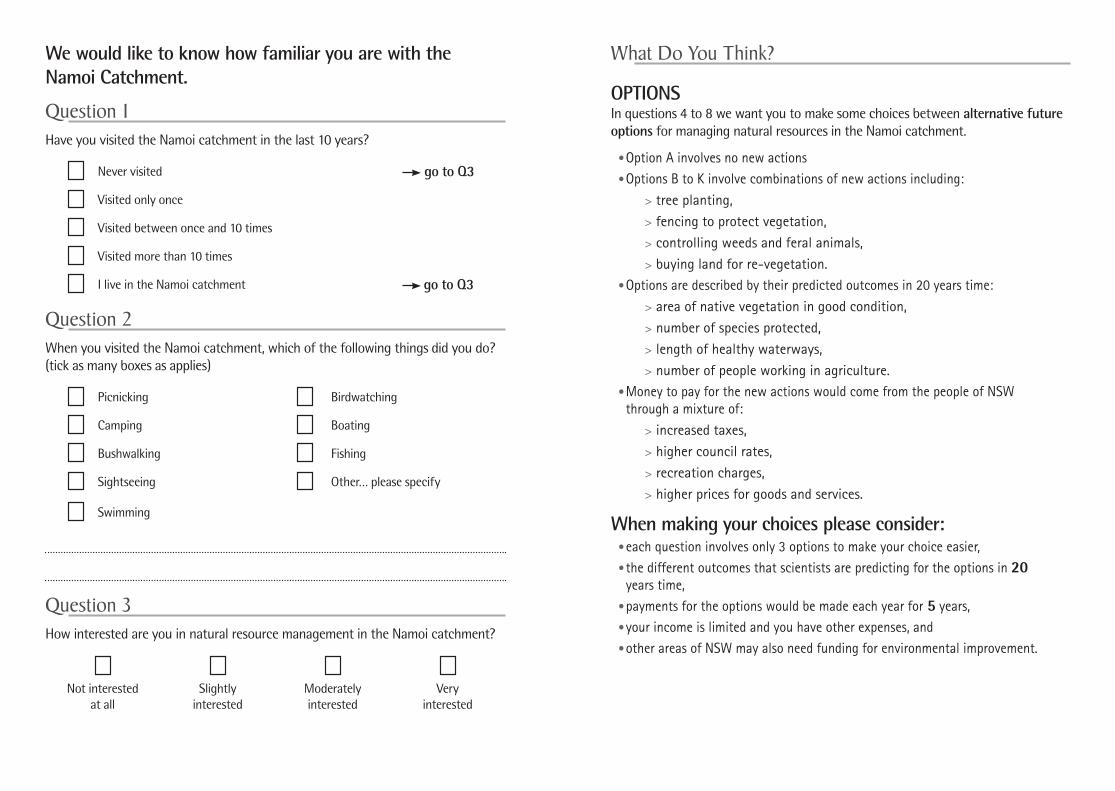
What Do You Think?
OPTIONSIn questions 4 to 8 we want you to make some choices between alternative future options for managing natural resources in the Namoi catchment.
Option A involves no new actions •
Options B to K involve combinations of new actions including:•
tree planting, >
fencing to protect vegetation, >
controlling weeds and feral animals, >
buying land for re-vegetation. >
Options are described by their predicted outcomes in 20 years time:•
area of native vegetation in good condition, >
number of species protected, >
length of healthy waterways, >
number of people working in agriculture. >
Money to pay for the new actions would come from the people of NSW •through a mixture of:
increased taxes, >
higher council rates, >
recreation charges, >
higher prices for goods and services. >
When making your choices please consider:each question involves only 3 options to make your choice easier,•
the different outcomes that scientists are predicting for the options in • 20 years time,payments for the options would be made each year for• 5 years,your income is limited and you have other expenses, and•
other areas of NSW may also need funding for environmental improvement.•
We would like to know how familiar you are with the Namoi Catchment.
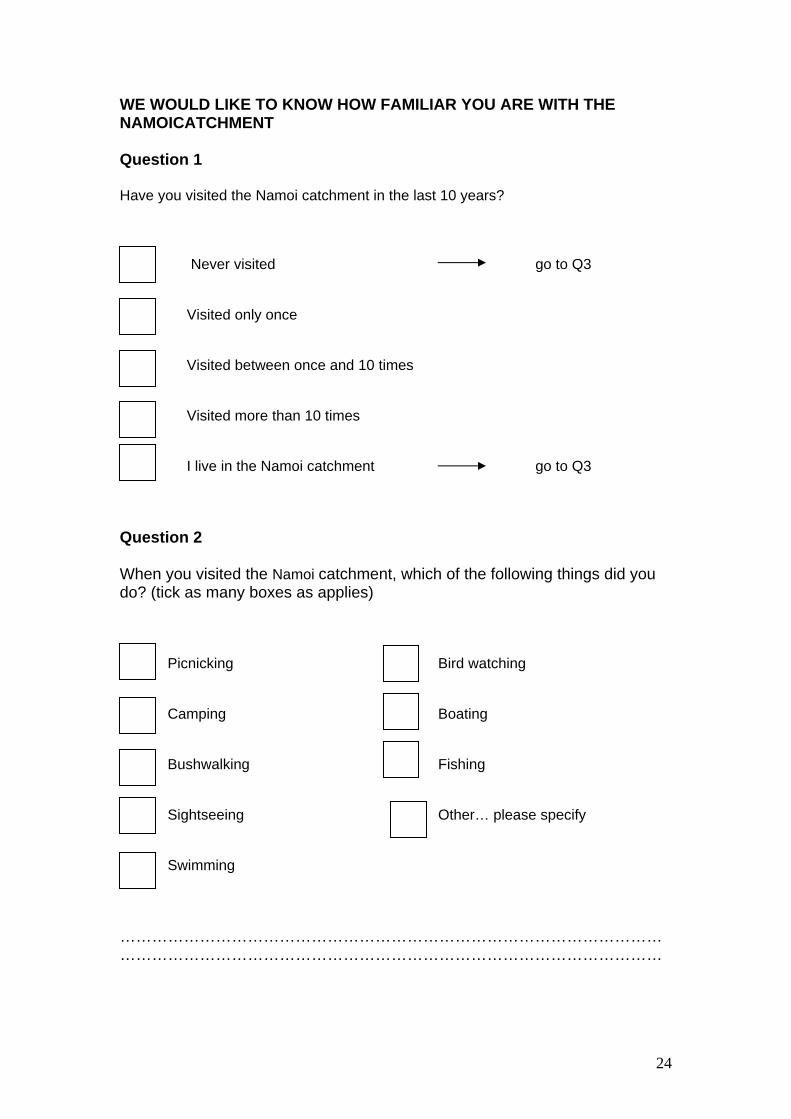
Question 1Have you visited the Namoi catchment in the last 10 years?
Never visited go to Q3
Visited only once
Visited between once and 10 times
Visited more than 10 times
I live in the Namoi catchment go to Q3
Question 2When you visited the Namoi catchment, which of the following things did you do? (tick as many boxes as applies)
Picnicking Birdwatching
Camping Boating
Bushwalking Fishing
Sightseeing Other… please specify
Swimming
Question 3How interested are you in natural resource management in the Namoi catchment?
Not interested at all
Slightly interested
Moderately interested
Very interested
Note:The choices are hypothetical but are based on current scientific knowledge.•
Your answers are important to deciding the way that the natural resources of •the Namoi catchment are managed. Please make your choices as if they were real. •
Some of the option outcomes may seem strange to you. This is because each •outcome depends on a different combination of actions that can lead to different outcomes.Each question should be considered • independently.
For more information please see: http://www.cma.nsw.gov.au/•
http://www.environment.nsw.gov.au/•
http://www.namoi.cma.nsw.gov.au/•
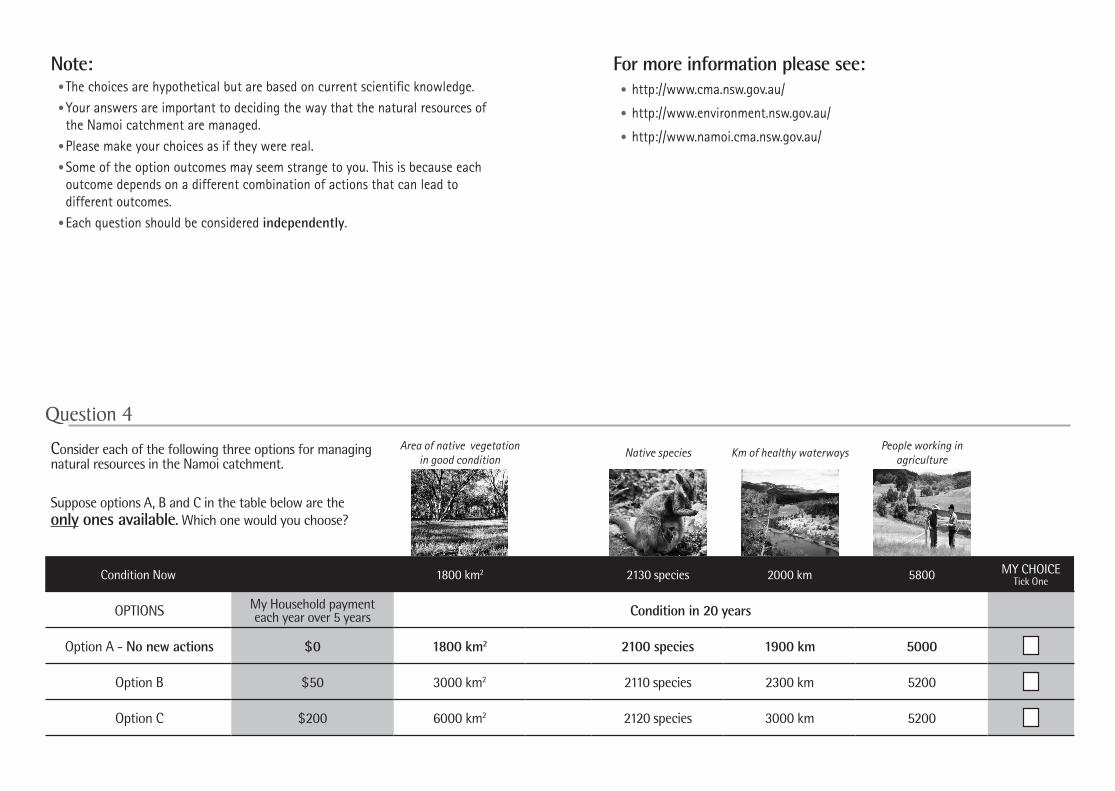
Question 4
Consider each of the following three options for managing natural resources in the Namoi catchment.
Suppose options A, B and C in the table below are the only ones available. Which one would you choose?
Area of native vegetation in good condition
Native species Km of healthy waterways People working in agriculture
Condition Now 1800 km2 2130 species 2000 km 5800 MY CHOICETick One
OPTIONS My Household payment each year over 5 years Condition in 20 years
Option A - No new actions $0 1800 km2 2100 species 1900 km 5000
Option B $50 3000 km2 2110 species 2300 km 5200
Option C $200 6000 km2 2120 species 3000 km 5200
Question 5
Consider each of the following three options for managing natural resources in the Namoi catchment.
Suppose options A, D and E in the table below are the only ones available. Which one would you choose?
Area of native vegetation in good condition
Native species Km of healthy waterwaysPeople working in
agriculture
Condition Now 1800 km2 2130 species 2000 km 5800 MY CHOICETick One
OPTIONS My Household payment each year over 5 years Condition in 20 years
Option A - No new actions $0 1800 km2 2100 species 1900 km 5000
Option D $50 3000 km2 2110 species 2300 km 5300
Option E $300 5000 km2 2130 species 2700 km 5300
Question 6
Consider each of the following three options for managing natural resources in the Namoi catchment.
Suppose options A, F and G in the table below are the only ones available. Which one would you choose?
Area of native vegetation in good condition
Native species Km of healthy waterways People working in agriculture
Condition Now 1800 km2 2130 species 2000 km 5800 MY CHOICETick One
OPTIONS My Household payment each year over 5 years Condition in 20 years
Option A - No new actions $0 1800 km2 2100 species 1900 km 5000
Option F $50 5000 km2 2120 species 3000 km 5100
Option G $50 3000 km2 2120 species 2700 km 5200
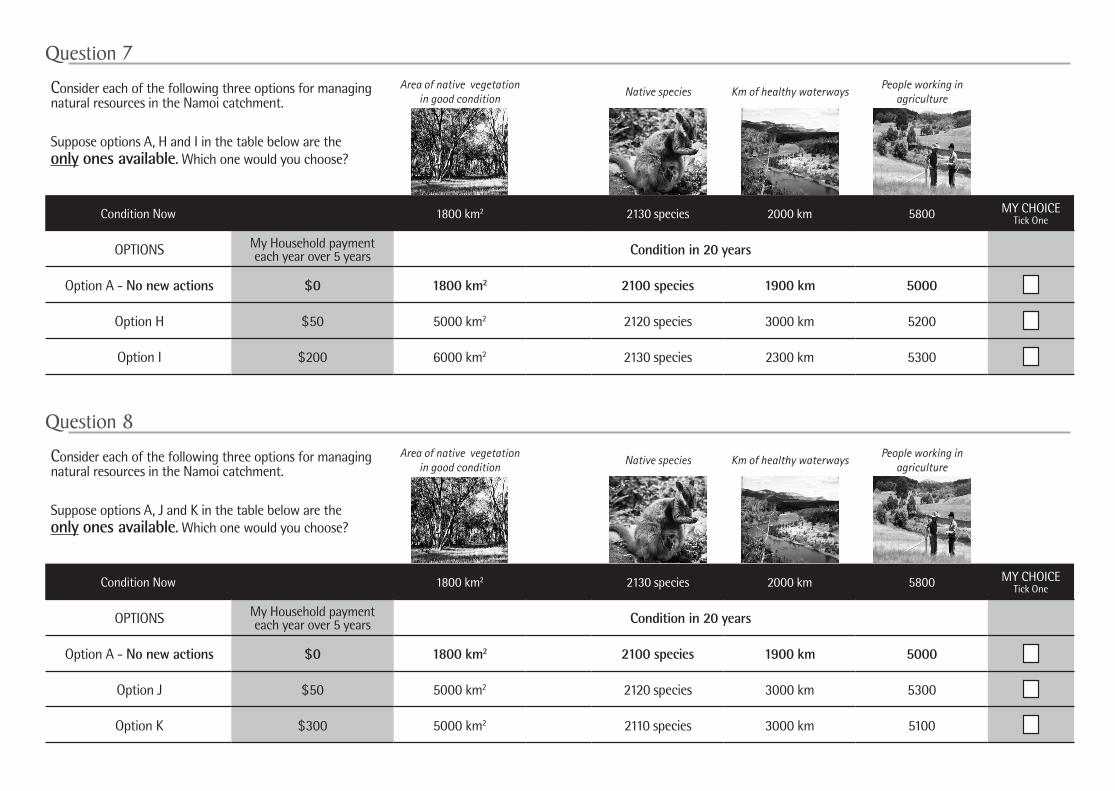
Question 7
Consider each of the following three options for managing natural resources in the Namoi catchment.
Suppose options A, H and I in the table below are the only ones available. Which one would you choose?
Area of native vegetation in good condition
Native species Km of healthy waterwaysPeople working in
agriculture
Condition Now 1800 km2 2130 species 2000 km 5800 MY CHOICETick One
OPTIONS My Household payment each year over 5 years Condition in 20 years
Option A - No new actions $0 1800 km2 2100 species 1900 km 5000
Option H $50 5000 km2 2120 species 3000 km 5200
Option I $200 6000 km2 2130 species 2300 km 5300
Question 8
Consider each of the following three options for managing natural resources in the Namoi catchment.
Suppose options A, J and K in the table below are the only ones available. Which one would you choose?
Area of native vegetation in good condition
Native species Km of healthy waterways People working in agriculture
Condition Now 1800 km2 2130 species 2000 km 5800 MY CHOICETick One
OPTIONS My Household payment each year over 5 years Condition in 20 years
Option A - No new actions $0 1800 km2 2100 species 1900 km 5000
Option J $50 5000 km2 2120 species 3000 km 5300
Option K $300 5000 km2 2110 species 3000 km 5100
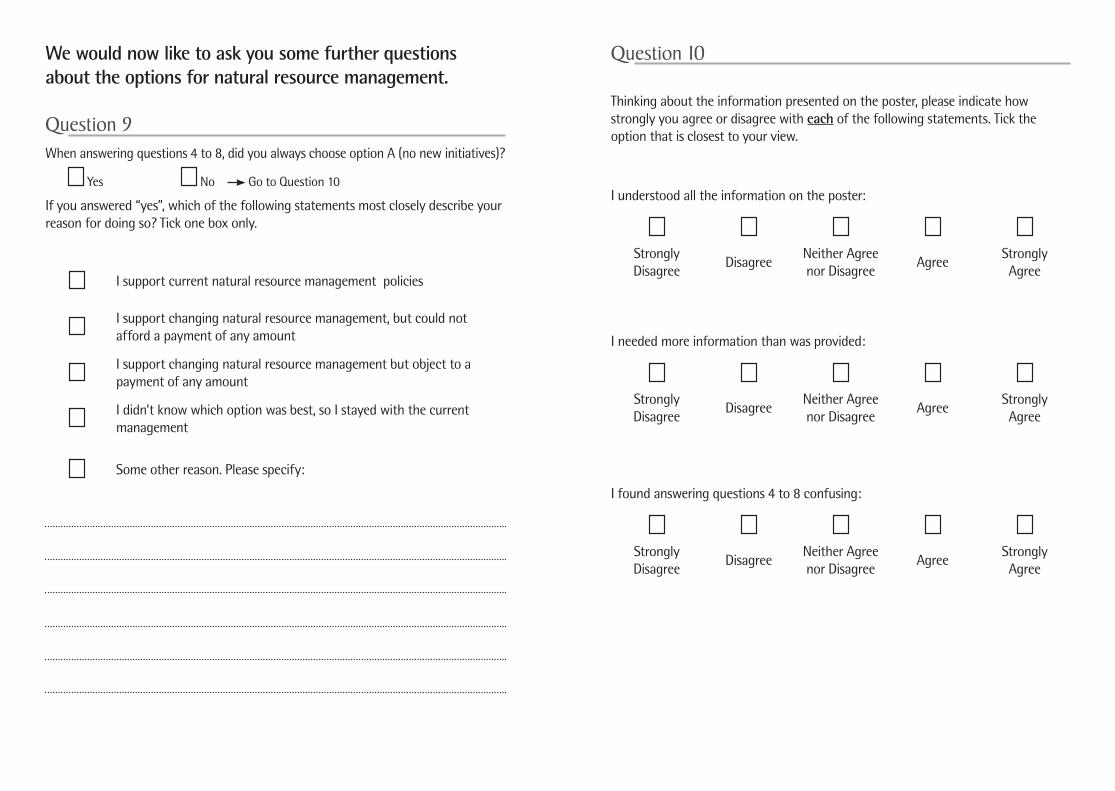
Question 10
Thinking about the information presented on the poster, please indicate how strongly you agree or disagree with each of the following statements. Tick the option that is closest to your view.
I understood all the information on the poster:
Strongly Disagree
DisagreeNeither Agree nor Disagree
AgreeStrongly Agree
I needed more information than was provided:
Strongly Disagree
DisagreeNeither Agree nor Disagree
AgreeStrongly Agree
I found answering questions 4 to 8 confusing:
Strongly Disagree
DisagreeNeither Agree nor Disagree
AgreeStrongly Agree
We would now like to ask you some further questions about the options for natural resource management.
Question 9When answering questions 4 to 8, did you always choose option A (no new initiatives)?
Yes No Go to Question 10
If you answered “yes”, which of the following statements most closely describe your reason for doing so? Tick one box only.
I support current natural resource management policies
I support changing natural resource management, but could not afford a payment of any amount
I support changing natural resource management but object to a payment of any amount
I didn’t know which option was best, so I stayed with the current management
Some other reason. Please specify:
Question 15What is the highest level of education you have obtained?
Never went to school Diploma or certificate
Primary only Tertiary degree
Junior / year 10 Postgraduate degree
Secondary / year 12 Other (please specify)
Question 16
How many people live in your household?
Question 17
How many people in your household are under 18 years of age?
In this last section, we would like to ask you a few questions to help us understand why respondents’ opinions may differ.
We realise that some of these questions may be sensitive to you but please be assured that the information is confidential.
Question 11
What is your age?
Question 12What is your gender?
Male Female
Question 13Do you have any children?
Yes No
Question 14
What is the postcode where you live?
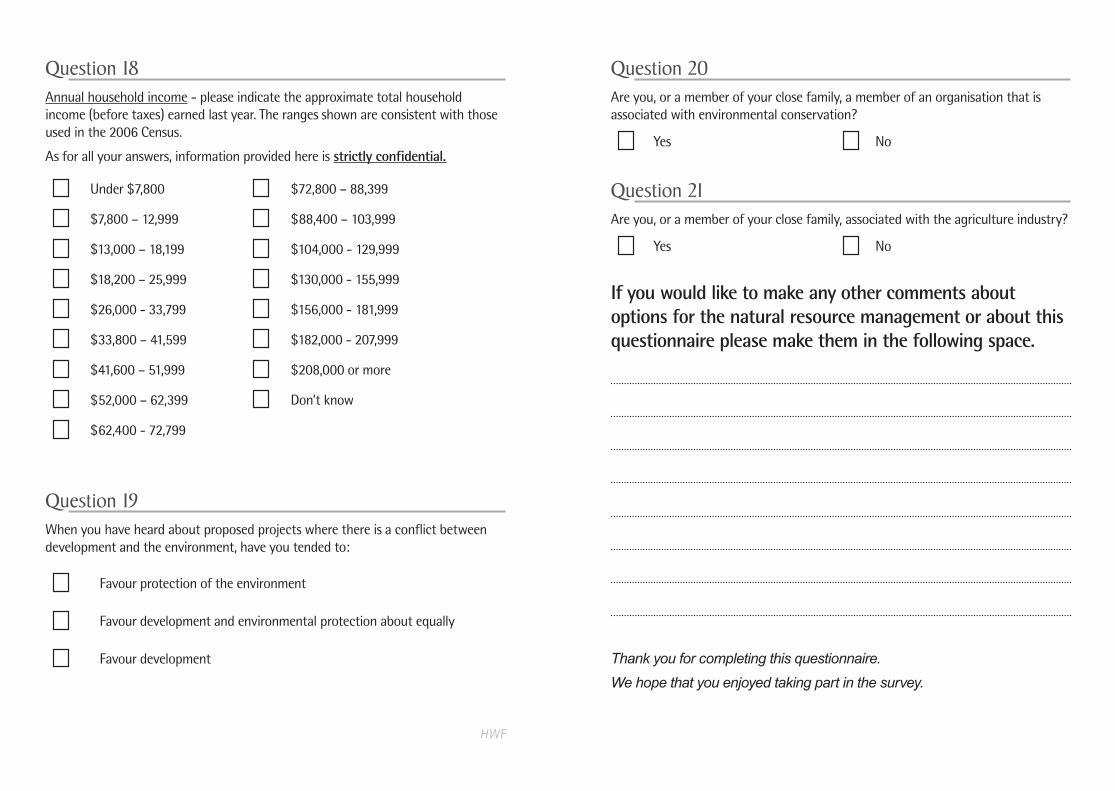
Question 20Are you, or a member of your close family, a member of an organisation that is associated with environmental conservation?
Yes No
Question 21Are you, or a member of your close family, associated with the agriculture industry?
Yes No
If you would like to make any other comments about options for the natural resource management or about this questionnaire please make them in the following space.
Thank you for completing this questionnaire.
We hope that you enjoyed taking part in the survey.
Question 18Annual household income - please indicate the approximate total household income (before taxes) earned last year. The ranges shown are consistent with those used in the 2006 Census.
As for all your answers, information provided here is strictly confidential.
Under $7,800 $72,800 – 88,399
$7,800 – 12,999 $88,400 – 103,999
$13,000 – 18,199 $104,000 - 129,999
$18,200 – 25,999 $130,000 - 155,999
$26,000 - 33,799 $156,000 - 181,999
$33,800 – 41,599 $182,000 - 207,999
$41,600 – 51,999 $208,000 or more
$52,000 – 62,399 Don’t know
$62,400 - 72,799
Question 19When you have heard about proposed projects where there is a conflict between development and the environment, have you tended to:
Favour protection of the environment
Favour development and environmental protection about equally


![Stef Spronck* and Tatiana Nikitina* Reported speech forms a … · Tatiana Nikitina [tatʲˈjanə nʲiˈkitʲinə], CNRS, LLACAN, 7, rue Guy Môquet - BP 8, 94801 Villejuif, France,](https://static.documents.pub/doc/80x56/5f26795257641229ba7d9702/stef-spronck-and-tatiana-nikitina-reported-speech-forms-a-tatiana-nikitina-tatjan.jpg)


