29
Food losses in food value chains – analysing causes and identifying solutions
Food losses in food value
chains – analysing causes
and identifying solutions
Methodology
Food Loss Analysis: Causes and Solutions – Case studies in the Small-scale Agriculture and Fisheries Subsector
How to assess the causes, impacts
and solutions?
✔
✔
✘
✘
✘
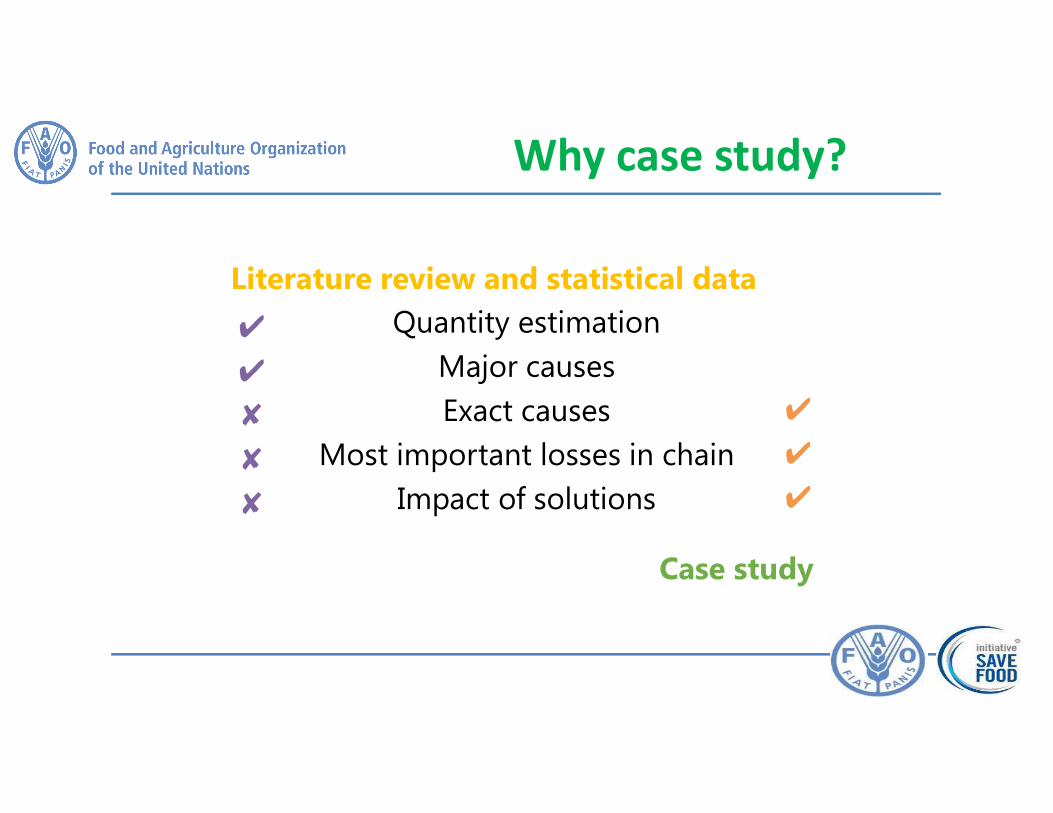
Why case study?
Quantity estimation
Major causes
Exact causes
Most important losses in chain
Impact of solutions
✔
✔
✔
Case study
Literature review and statistical data
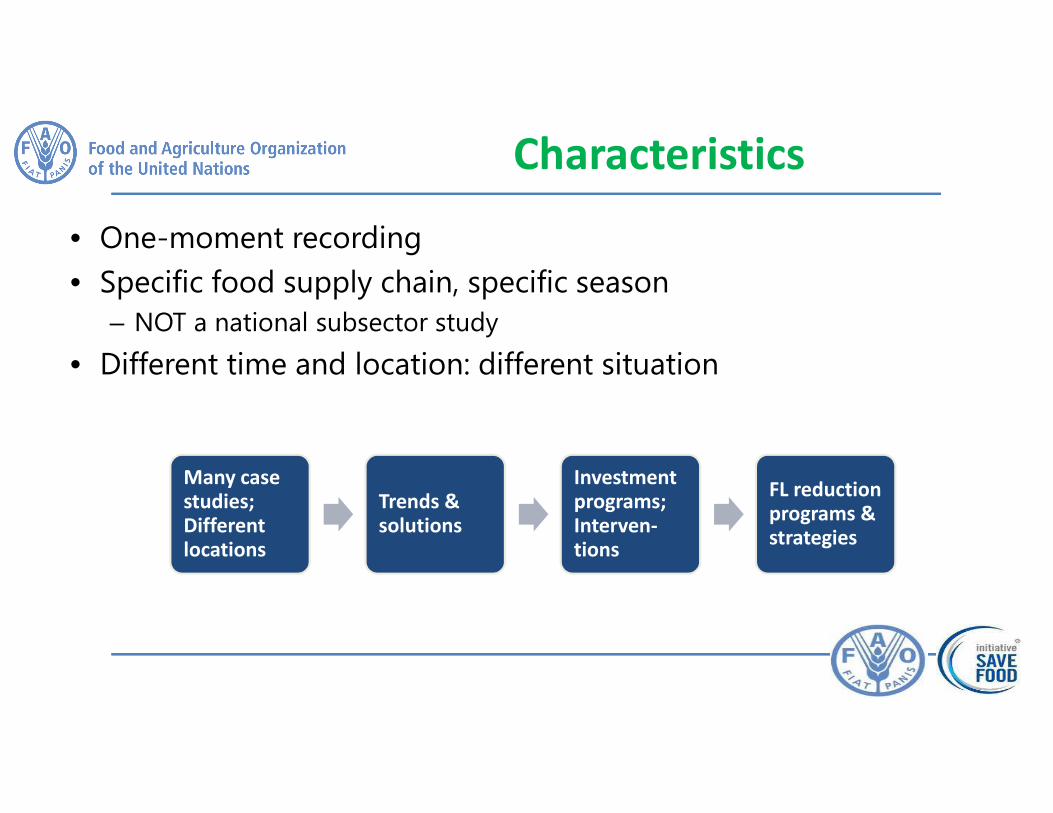
• One-moment recording
• Specific food supply chain, specific season
– NOT a national subsector study
• Different time and location: different situation
Characteristics
Many case studies;Different locations
Trends & solutions
Investment programs; Interven-tions
FL reduction programs & strategies
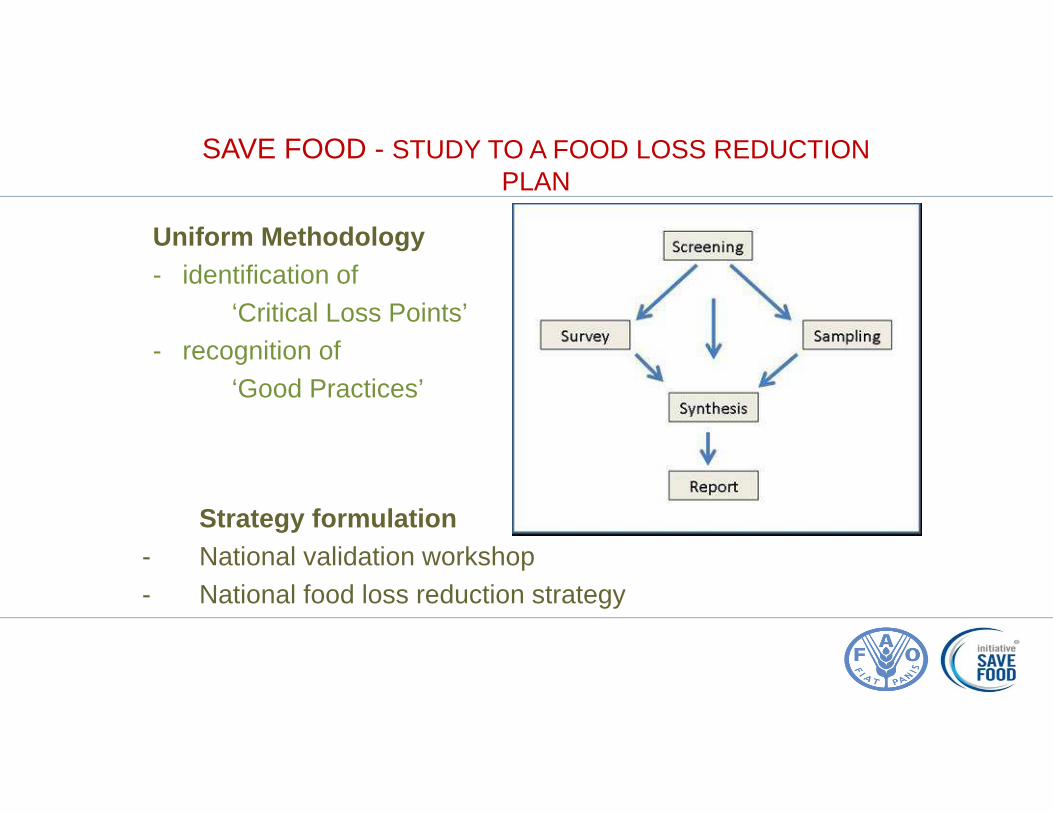
SAVE FOOD - STUDY TO A FOOD LOSS REDUCTION PLAN
Uniform Methodology- identification of
‘Critical Loss Points’- recognition of
‘Good Practices’
Strategy formulation- National validation workshop - National food loss reduction strategy

• Understanding the FVCs in the subsector– Qualitative understanding of the range of losses– Indicative, quantitative data for loss assessment
• Selection of FVCs for Surveying and Sampling
• Secondary data – sourced from reports, docs..• Key informant interviews – experts
�Mapping the FVCs in the subsector and actorsRanking the FVC – economic impact, food security, national development objectives
Screening
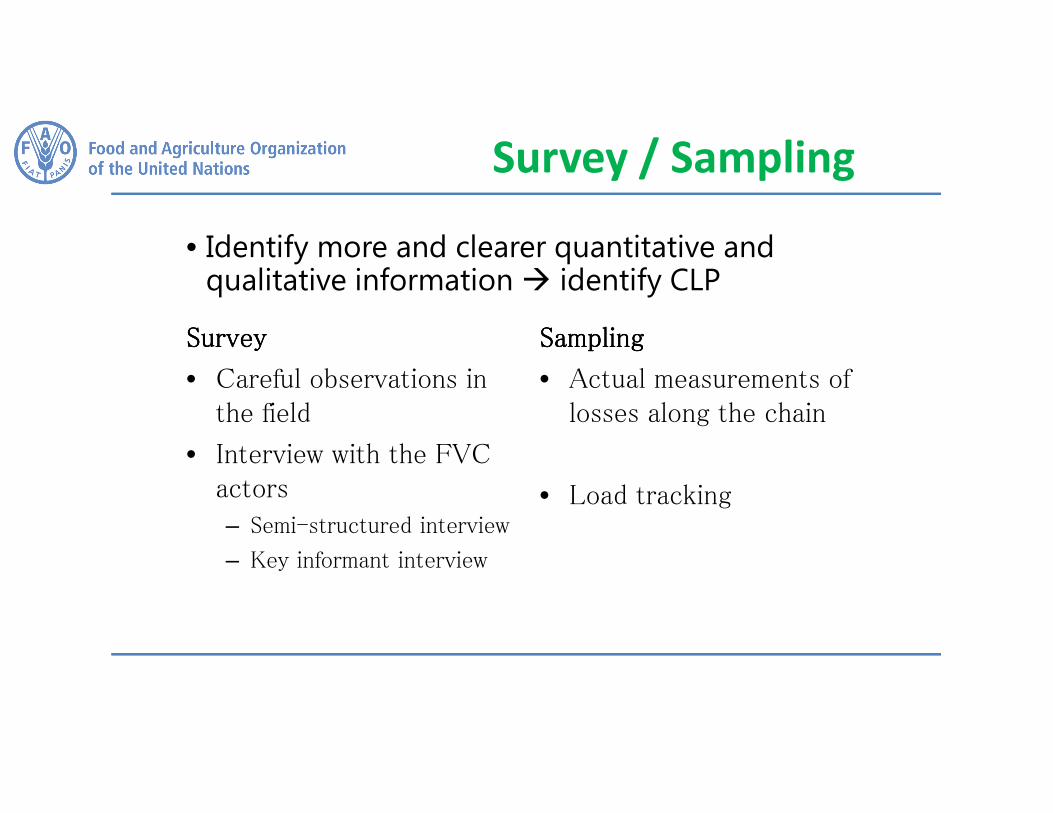
Survey / Sampling
SurveySurveySurveySurvey
• Careful observations in
the field
• Interview with the FVC
actors
– Semi-structured interview
– Key informant interview
SamplingSamplingSamplingSampling
• Actual measurements of
losses along the chain
• Load tracking
• Identify more and clearer quantitative and qualitative information � identify CLP
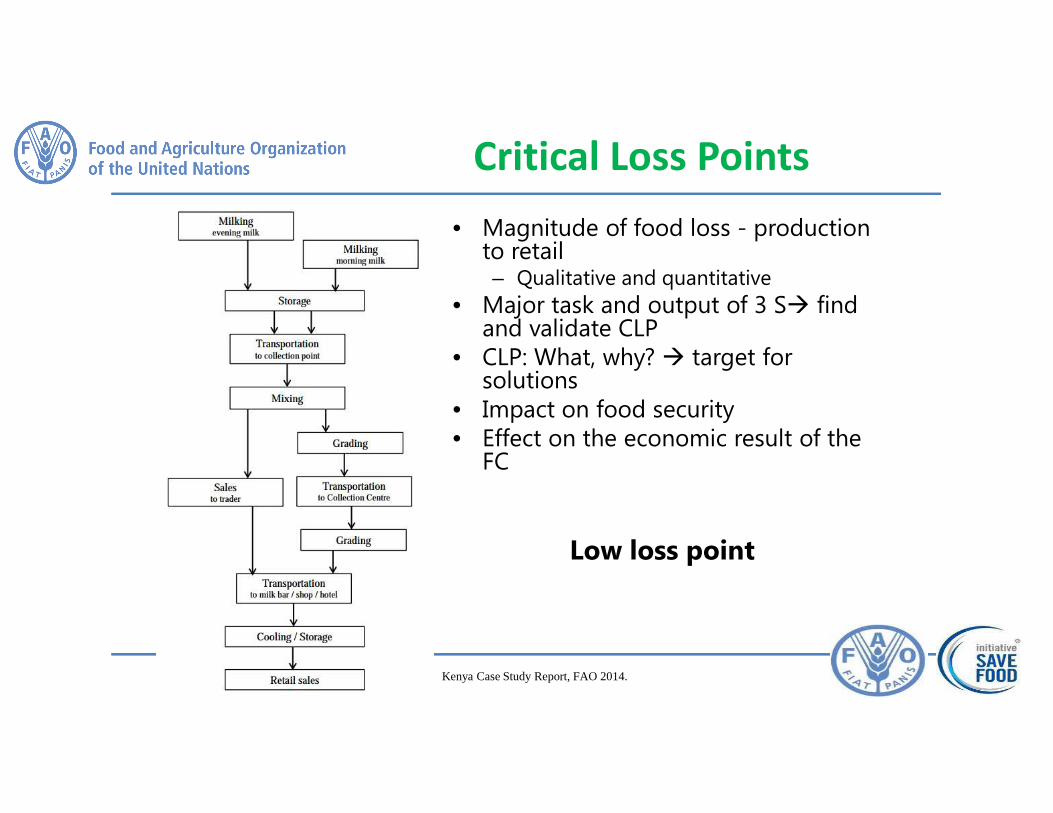
• Magnitude of food loss - production to retail– Qualitative and quantitative
• Major task and output of 3 S� find and validate CLP
• CLP: What, why? � target for solutions
• Impact on food security• Effect on the economic result of the
FC
Low loss point
Critical Loss Points
Kenya Case Study Report, FAO 2014.
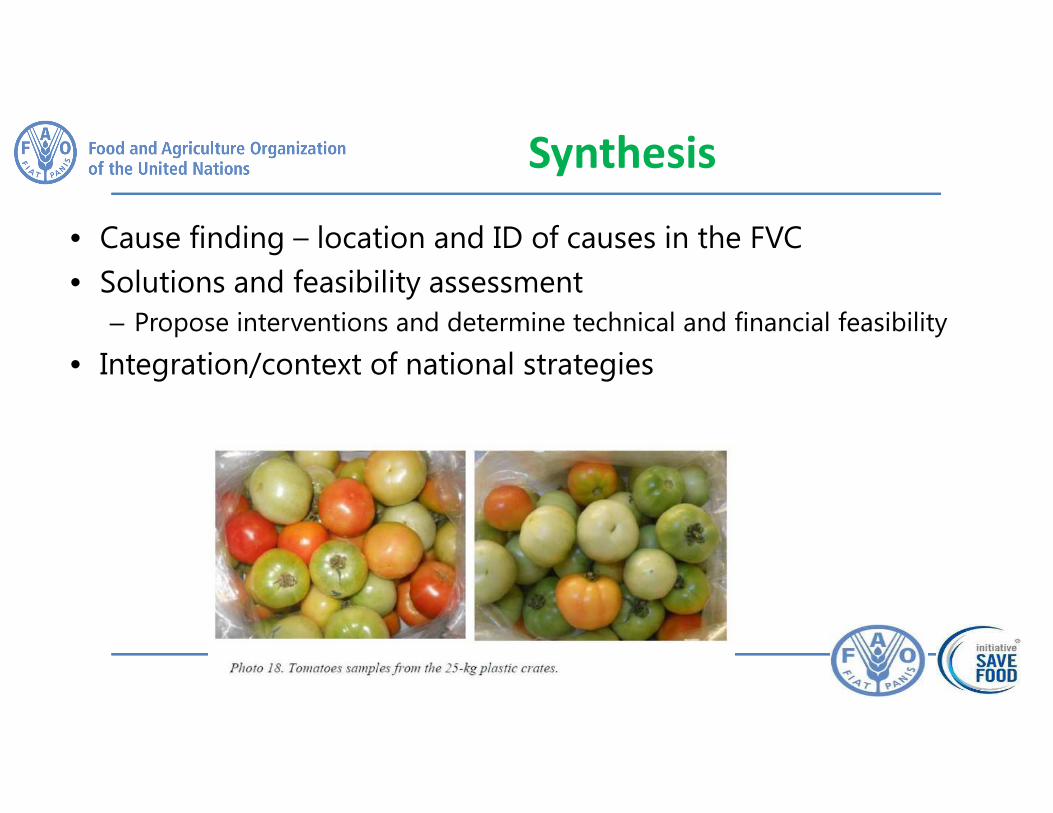
• Cause finding – location and ID of causes in the FVC
• Solutions and feasibility assessment
– Propose interventions and determine technical and financial feasibility
• Integration/context of national strategies
Synthesis
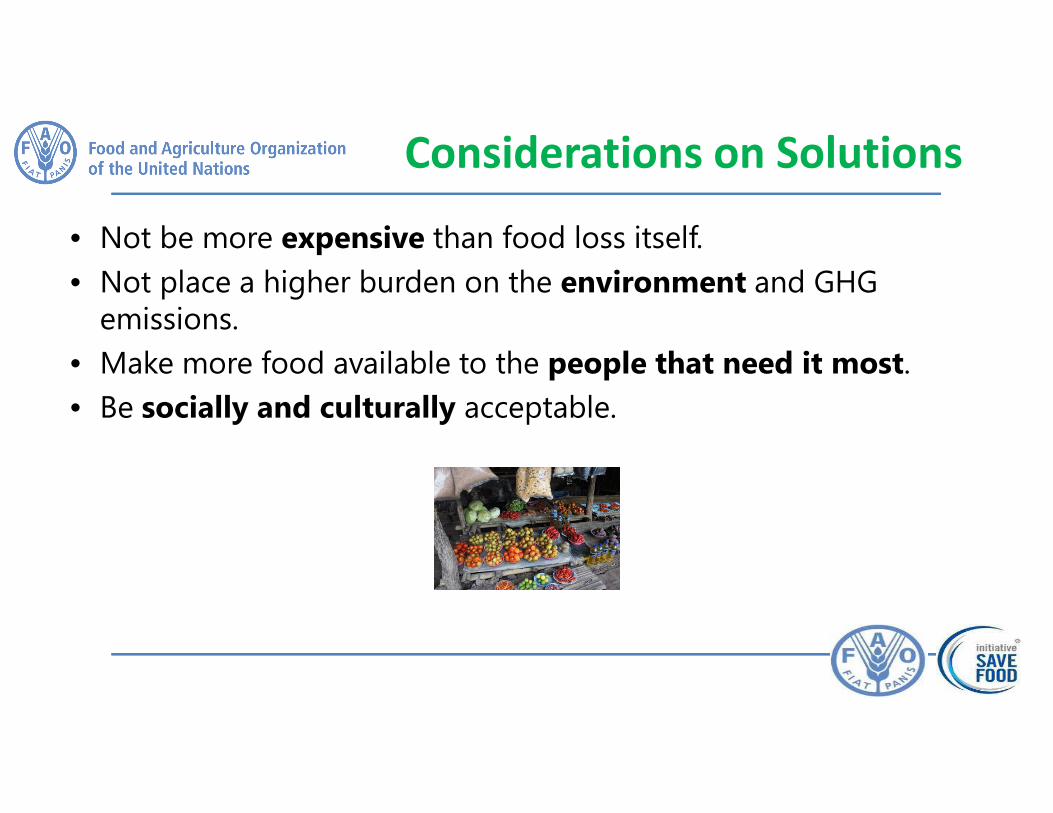
• Not be more expensive than food loss itself.
• Not place a higher burden on the environment and GHG emissions.
• Make more food available to the people that need it most.
• Be socially and culturally acceptable.
Considerations on Solutions
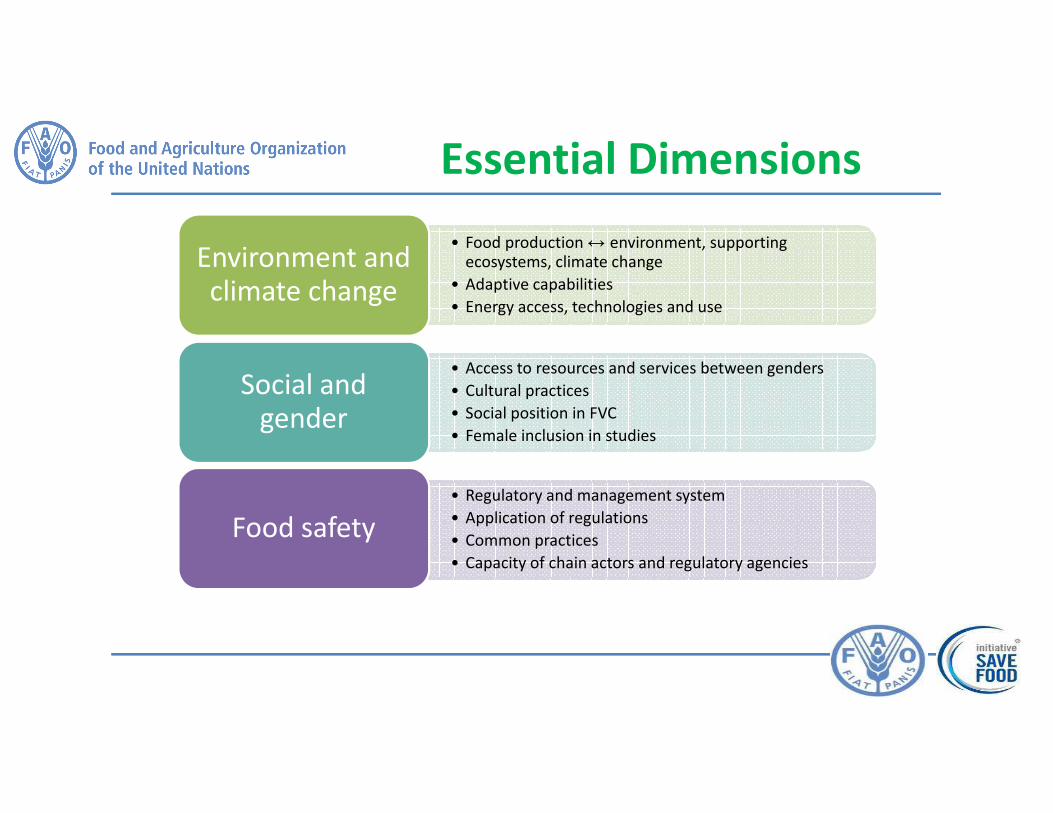
• Food production ↔ environment, supporting ecosystems, climate change
• Adaptive capabilities
• Energy access, technologies and use
Environment and climate change
• Access to resources and services between genders
• Cultural practices
• Social position in FVC
• Female inclusion in studies
Social and gender
• Regulatory and management system
• Application of regulations
• Common practices
• Capacity of chain actors and regulatory agencies
Food safety
Essential Dimensions
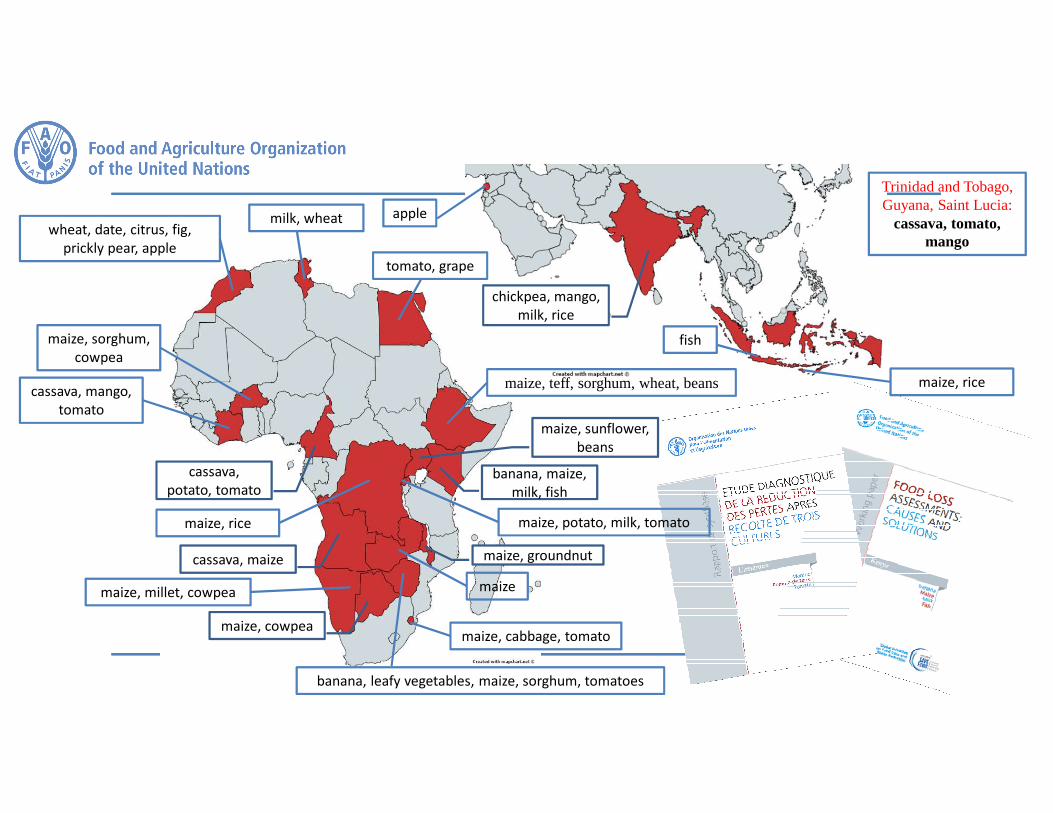
banana, maize,
milk, fish
cassava,
potato, tomato
maize, sunflower,
beans
chickpea, mango,
milk, rice
cassava, maize
maize, cowpea
maize, sorghum,
cowpea
cassava, mango,
tomato
maize, rice
maize, rice
maize, groundnut
maize, teff, sorghum, wheat, beans
wheat, date, citrus, fig,
prickly pear, apple
maize, millet, cowpea
maize, potato, milk, tomato
maize, cabbage, tomato
maize
banana, leafy vegetables, maize, sorghum, tomatoes
Trinidad and Tobago, Guyana, Saint Lucia:
cassava, tomato, mango
fish
apple
tomato, grape
milk, wheat
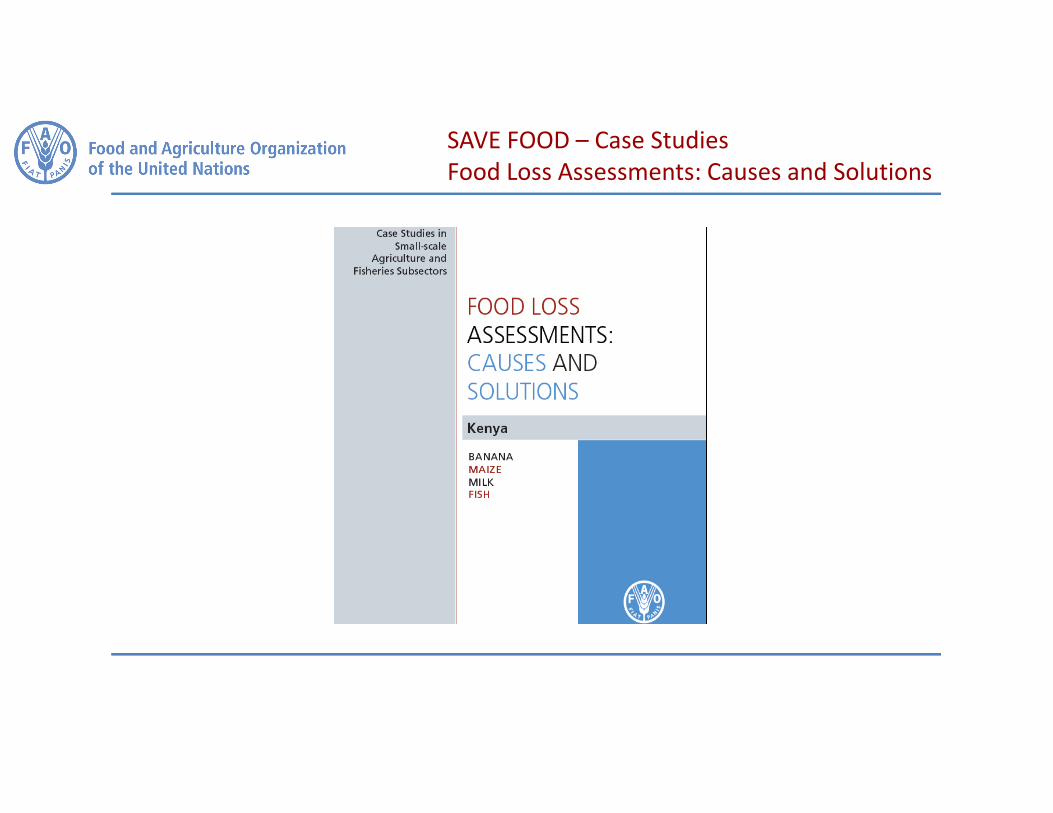
SAVE FOOD – Case Studies
Food Loss Assessments: Causes and Solutions
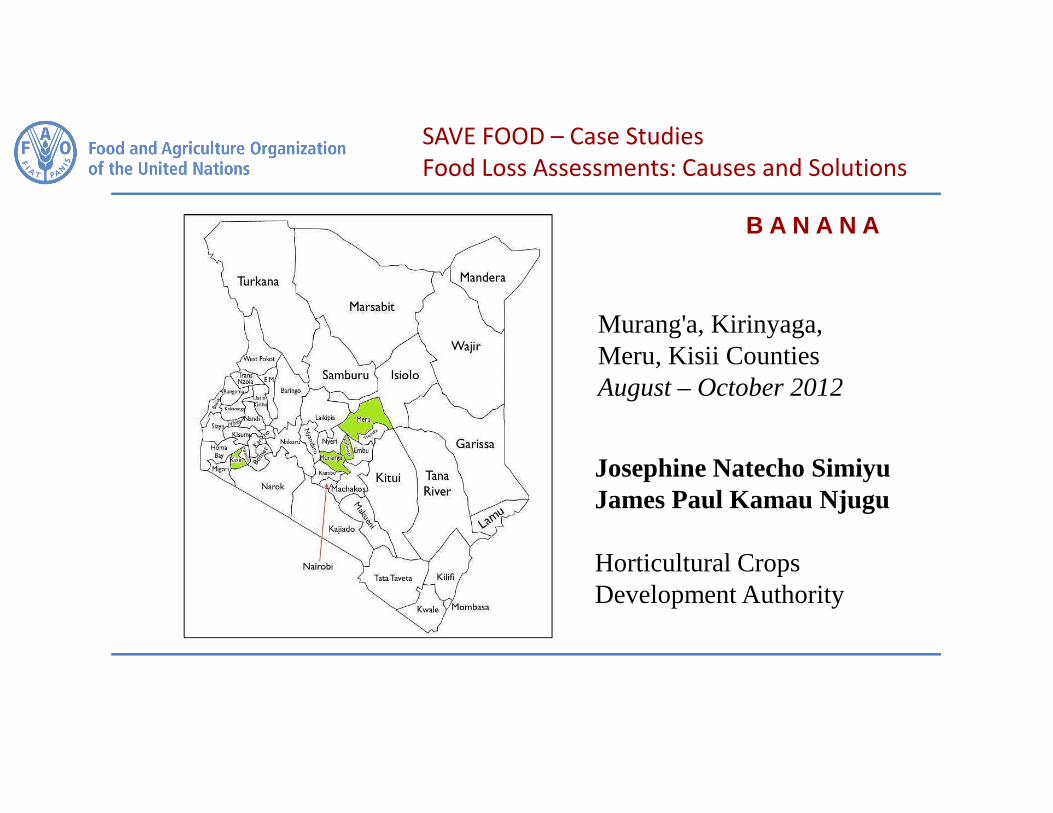
B A N A N A
Murang'a, Kirinyaga, Meru, Kisii CountiesAugust – October 2012
Josephine Natecho SimiyuJames Paul Kamau Njugu
Horticultural Crops Development Authority
SAVE FOOD – Case Studies
Food Loss Assessments: Causes and Solutions
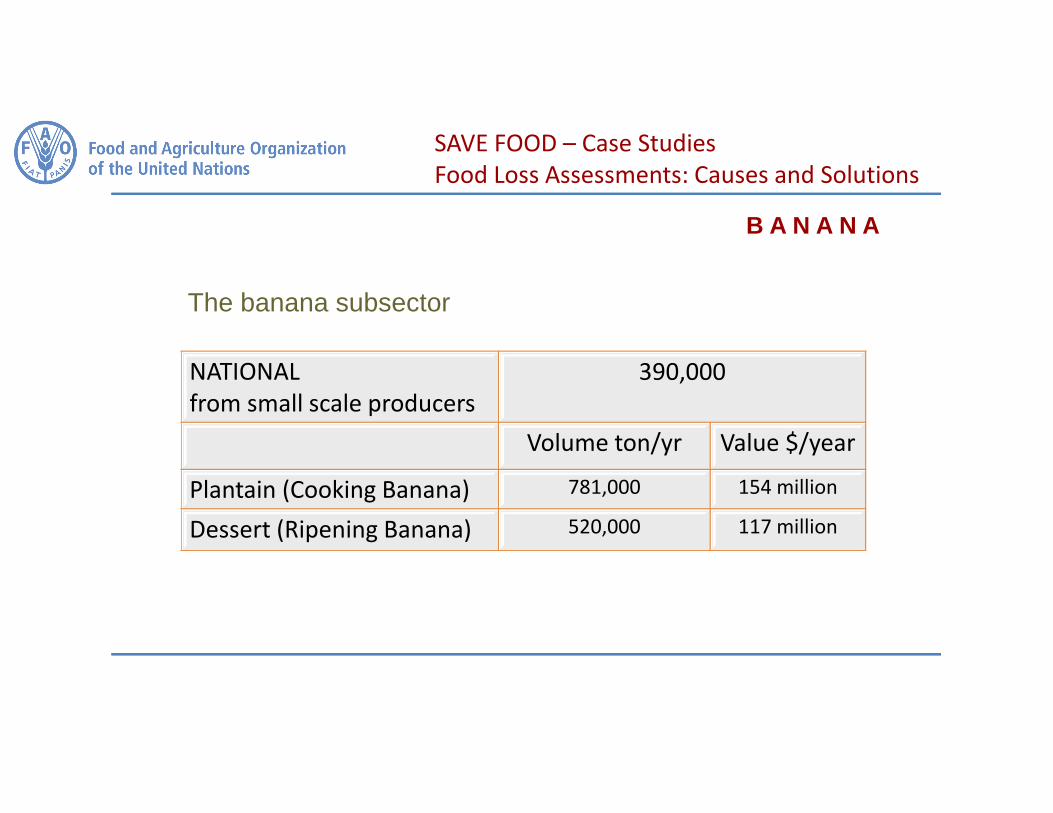
The banana subsector
NATIONAL
from small scale producers
390,000
Volume ton/yr Value $/year
Plantain (Cooking Banana) 781,000 154 million
Dessert (Ripening Banana) 520,000 117 million
SAVE FOOD – Case Studies
Food Loss Assessments: Causes and Solutions
B A N A N A
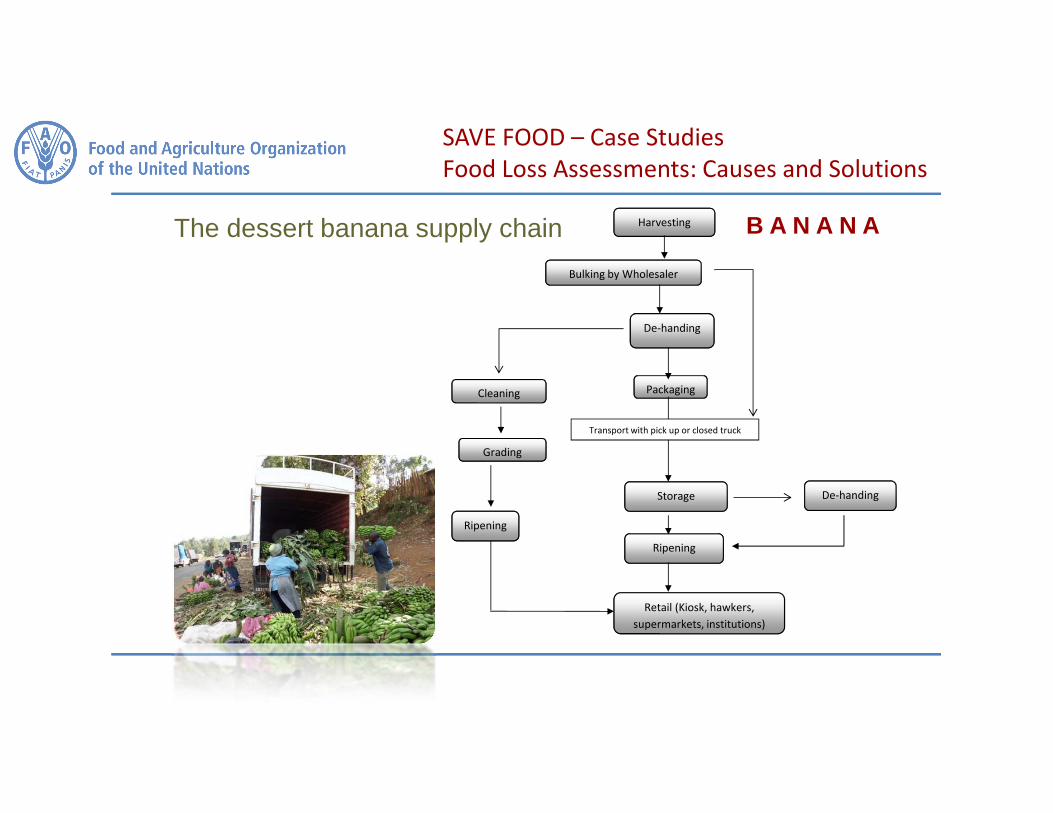
The dessert banana supply chain Harvesting
Bulking by Wholesaler
De-handing
Grading
Packaging
Ripening
De-handing
Ripening
Storage
Retail (Kiosk, hawkers,
supermarkets, institutions)
Cleaning
Transport with pick up or closed truck
SAVE FOOD – Case Studies
Food Loss Assessments: Causes and Solutions
B A N A N A
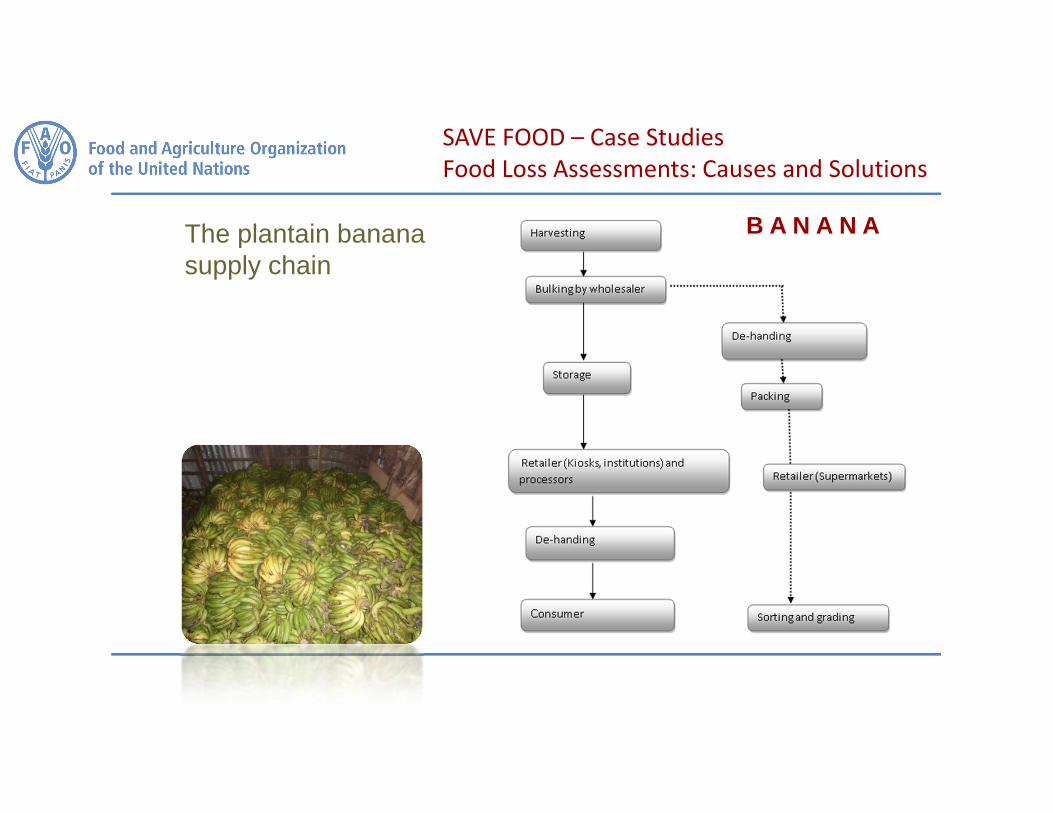
The plantain banana supply chain
B A N A N A
SAVE FOOD – Case Studies
Food Loss Assessments: Causes and Solutions
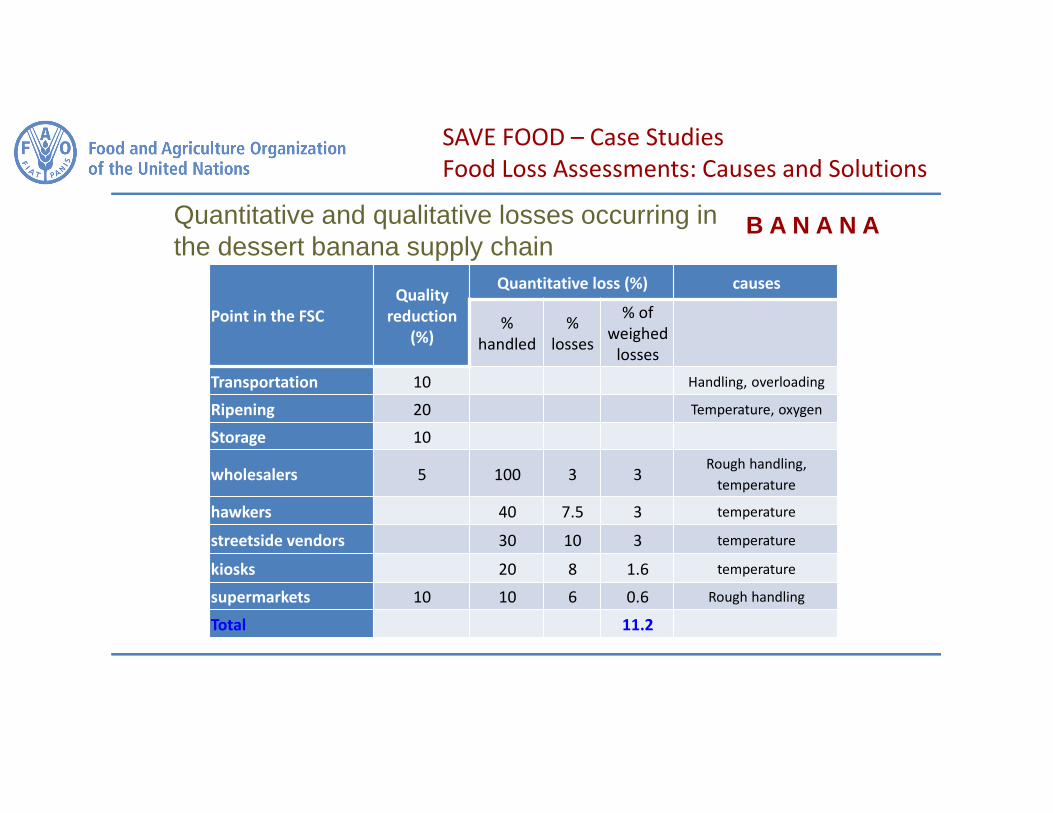
Point in the FSC
Quality
reduction
(%)
Quantitative loss (%) causes
%
handled
%
losses
% of
weighed
losses
Transportation 10 Handling, overloading
Ripening 20 Temperature, oxygen
Storage 10
wholesalers 5 100 3 3Rough handling,
temperature
hawkers 40 7.5 3 temperature
streetside vendors 30 10 3 temperature
kiosks 20 8 1.6 temperature
supermarkets 10 10 6 0.6 Rough handling
Total 11.2
Quantitative and qualitative losses occurring in the dessert banana supply chain
B A N A N A
SAVE FOOD – Case Studies
Food Loss Assessments: Causes and Solutions
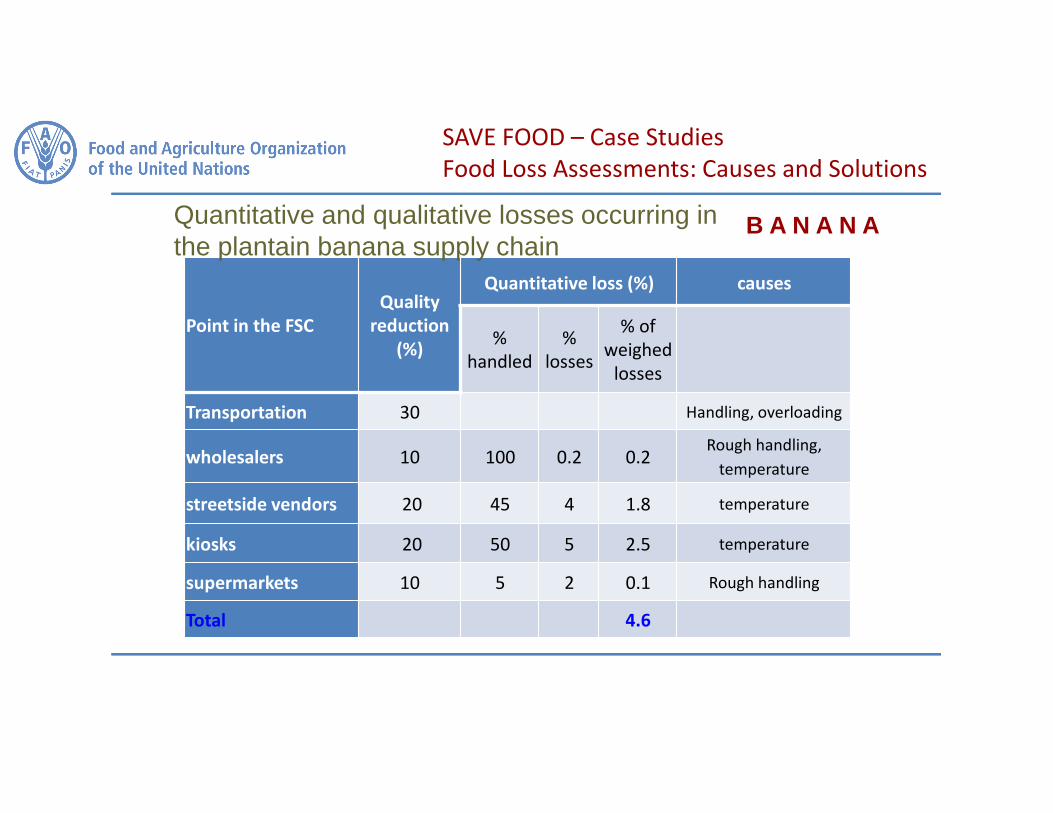
Point in the FSC
Quality
reduction
(%)
Quantitative loss (%) causes
%
handled
%
losses
% of
weighed
losses
Transportation 30 Handling, overloading
wholesalers 10 100 0.2 0.2Rough handling,
temperature
streetside vendors 20 45 4 1.8 temperature
kiosks 20 50 5 2.5 temperature
supermarkets 10 5 2 0.1 Rough handling
Total 4.6
Quantitative and qualitative losses occurring in the plantain banana supply chain
B A N A N A
SAVE FOOD – Case Studies
Food Loss Assessments: Causes and Solutions
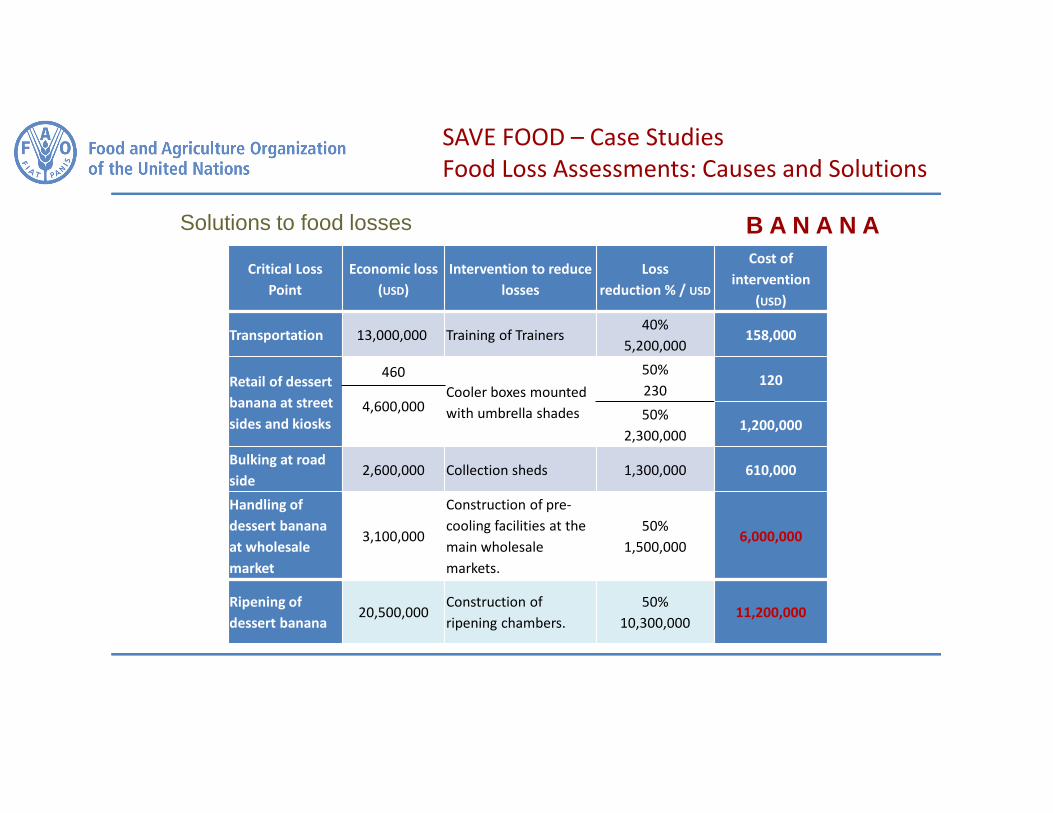
Solutions to food losses
Critical Loss
Point
Economic loss
(USD)
Intervention to reduce
losses
Loss
reduction % / USD
Cost of
intervention
(USD)
Transportation 13,000,000 Training of Trainers40%
5,200,000158,000
Retail of dessert
banana at street
sides and kiosks
460
Cooler boxes mounted
with umbrella shades
50%
230120
4,600,000 50%
2,300,0001,200,000
Bulking at road
side2,600,000 Collection sheds 1,300,000 610,000
Handling of
dessert banana
at wholesale
market
3,100,000
Construction of pre-
cooling facilities at the
main wholesale
markets.
50%
1,500,0006,000,000
Ripening of
dessert banana20,500,000
Construction of
ripening chambers.
50%
10,300,00011,200,000
B A N A N A
SAVE FOOD – Case Studies
Food Loss Assessments: Causes and Solutions
Food loss reduction strategy
1. Training / capacity building, to add on social capital, especially for traders, processors, wholesalers, retailers. Strengthen the supply chains downstream (post-farm)
2. Shorter supply chains. Minimise handling of produce in storage and distribution systems,, Mobilisation of farmers to form marketing organisations through which traders can directly access their produce.
3. Value-added processing by specialized processing enterprises, and market development, for diversified and value-added banana products
B A N A N A
SAVE FOOD – Case Studies
Food Loss Assessments: Causes and Solutions
Food loss reduction strategy
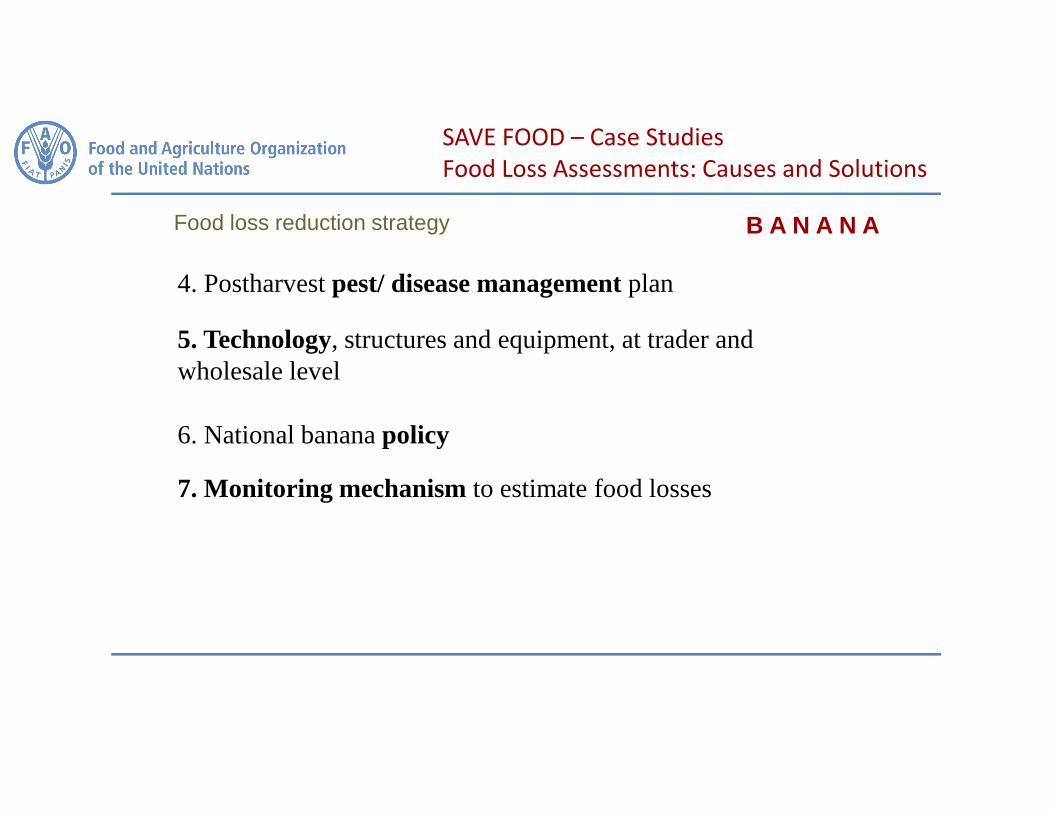
4. Postharvest pest/ disease management plan
5. Technology, structures and equipment, at trader and wholesale level
6. National banana policy
7. Monitoring mechanism to estimate food losses
B A N A N A
SAVE FOOD – Case Studies
Food Loss Assessments: Causes and Solutions
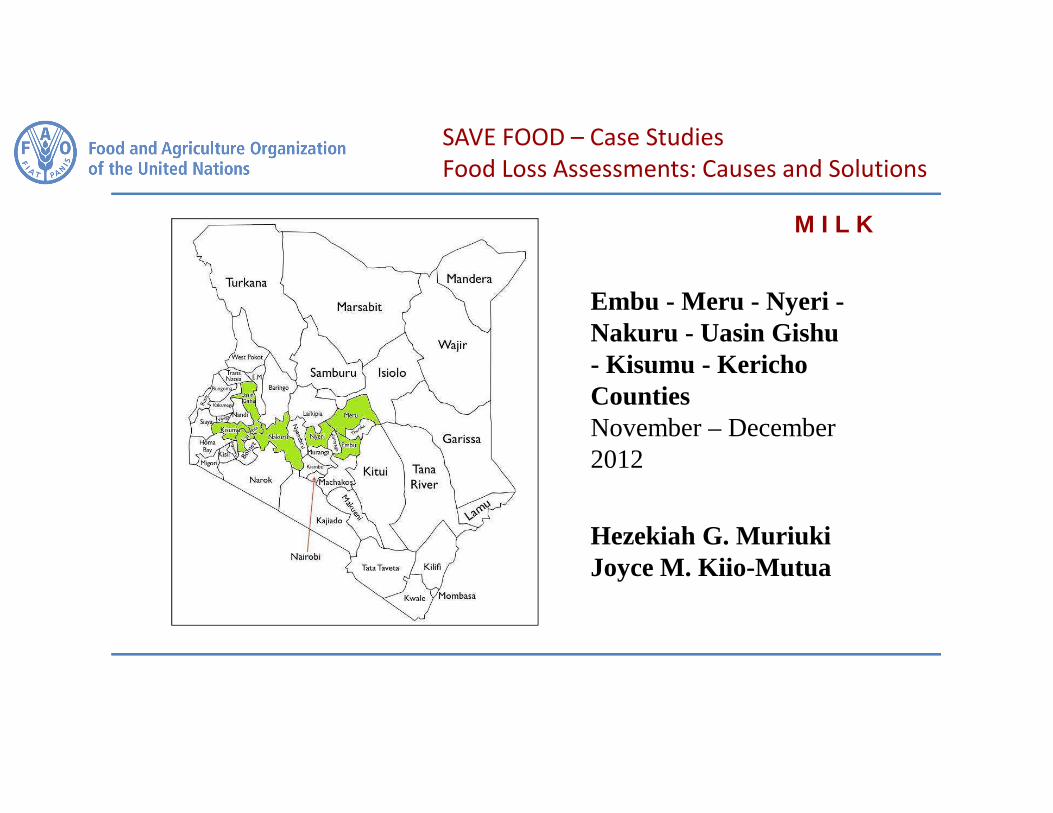
Embu - Meru - Nyeri -Nakuru - Uasin Gishu- Kisumu - KerichoCountiesNovember – December 2012
Hezekiah G. MuriukiJoyce M. Kiio-Mutua
M I L K
SAVE FOOD – Case Studies
Food Loss Assessments: Causes and Solutions
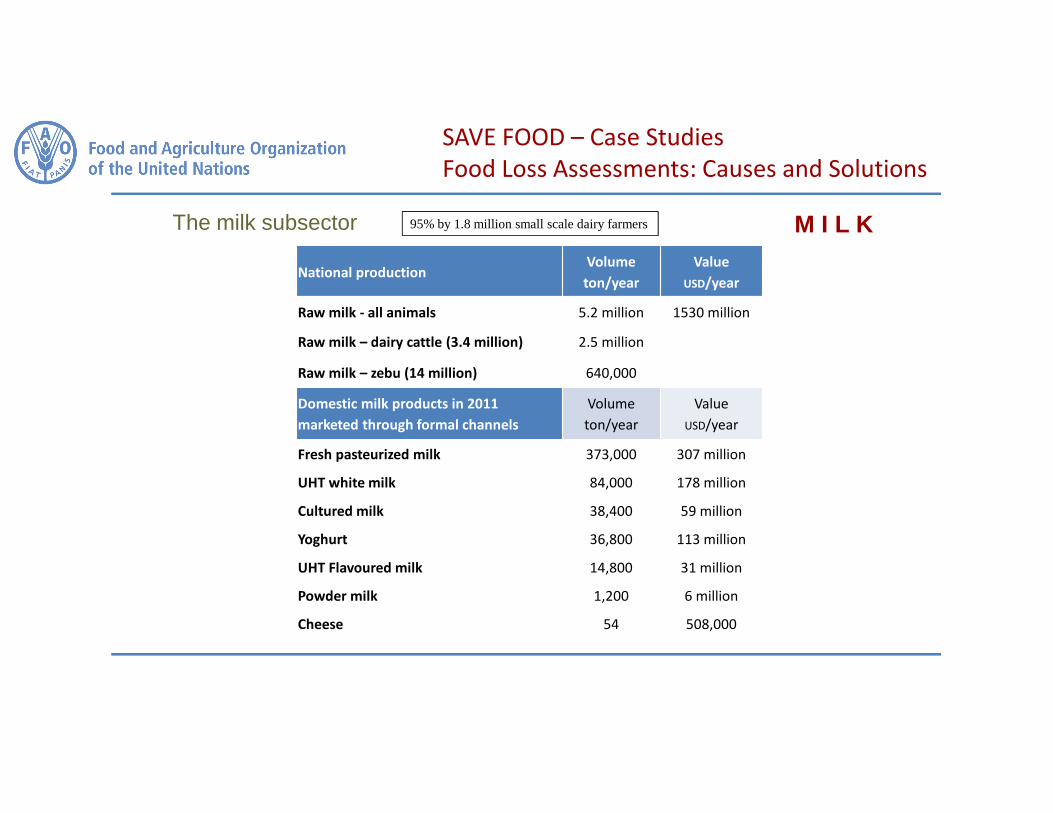
National productionVolume
ton/year
Value
USD/year
Raw milk - all animals 5.2 million 1530 million
Raw milk – dairy cattle (3.4 million) 2.5 million
Raw milk – zebu (14 million) 640,000
Domestic milk products in 2011
marketed through formal channels
Volume
ton/year
Value
USD/year
Fresh pasteurized milk 373,000 307 million
UHT white milk 84,000 178 million
Cultured milk 38,400 59 million
Yoghurt 36,800 113 million
UHT Flavoured milk 14,800 31 million
Powder milk 1,200 6 million
Cheese 54 508,000
95% by 1.8 million small scale dairy farmersThe milk subsector M I L K
SAVE FOOD – Case Studies
Food Loss Assessments: Causes and Solutions
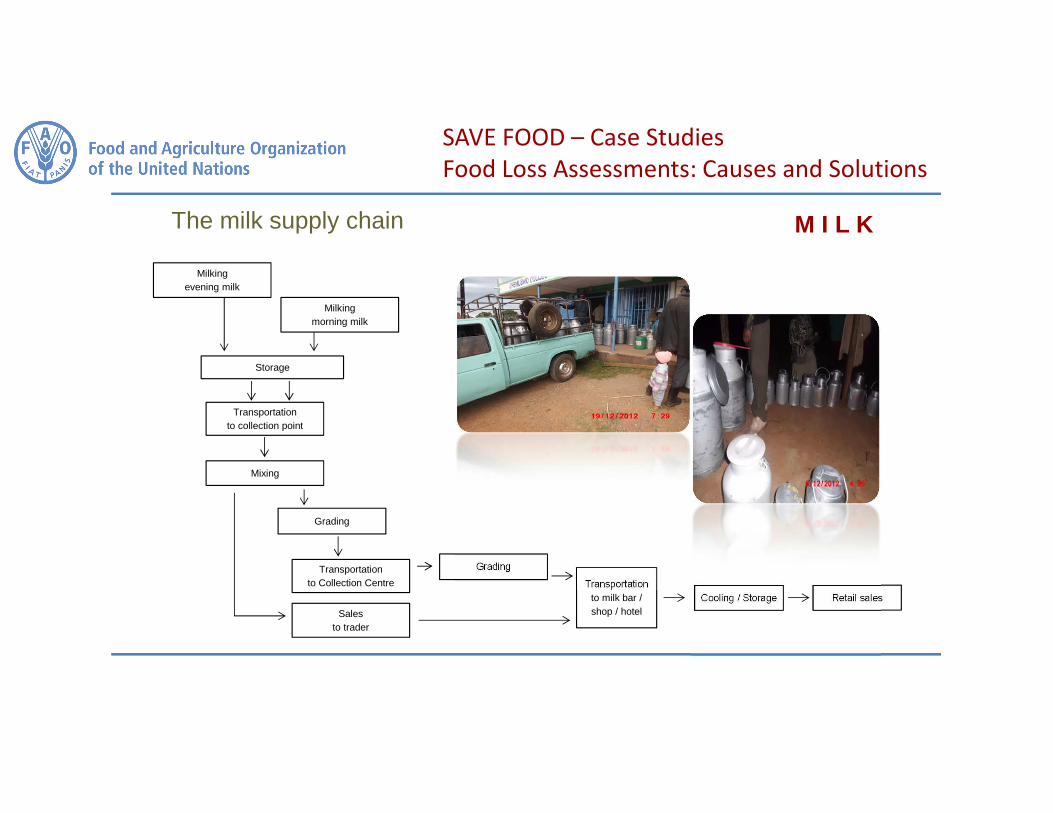
Milkingevening milk
Storage
Transportationto collection point
Mixing
Milkingmorning milk
Grading
Salesto trader
Grading
Transportationto milk bar / shop / hotel
Cooling / Storage Retail sales
The milk supply chain
Transportationto Collection Centre
M I L K
SAVE FOOD – Case Studies
Food Loss Assessments: Causes and Solutions
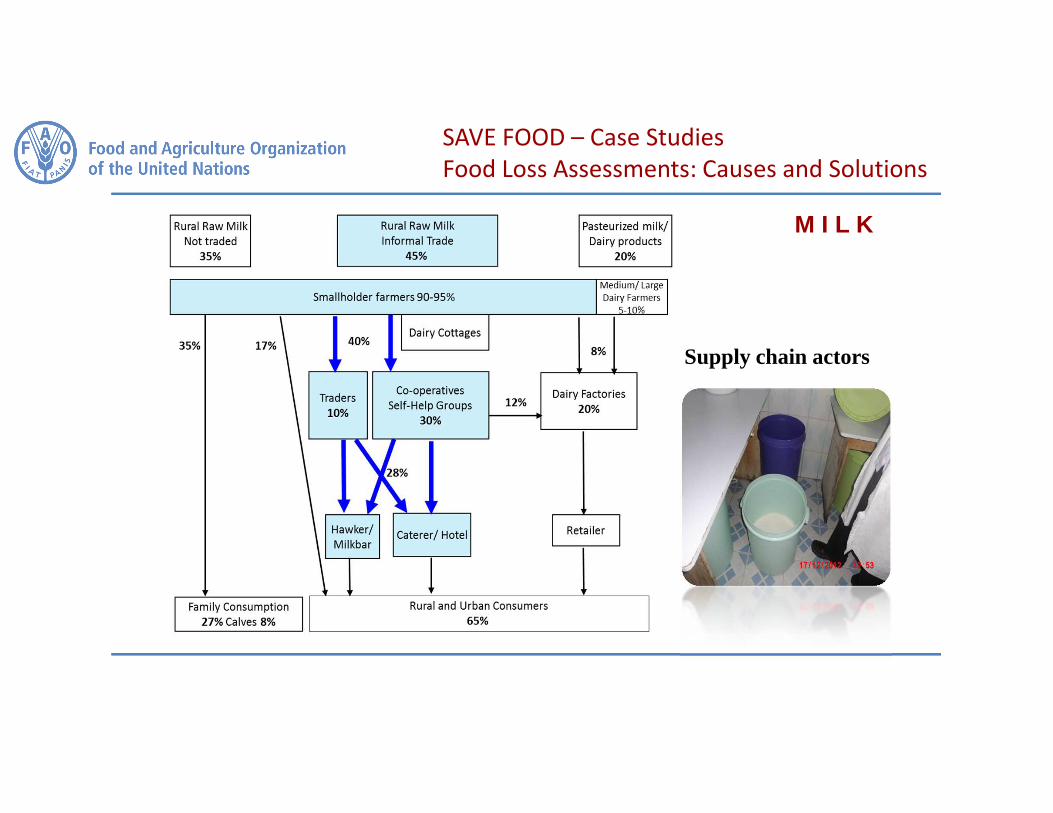
Supply chain actors
M I L K
SAVE FOOD – Case Studies
Food Loss Assessments: Causes and Solutions
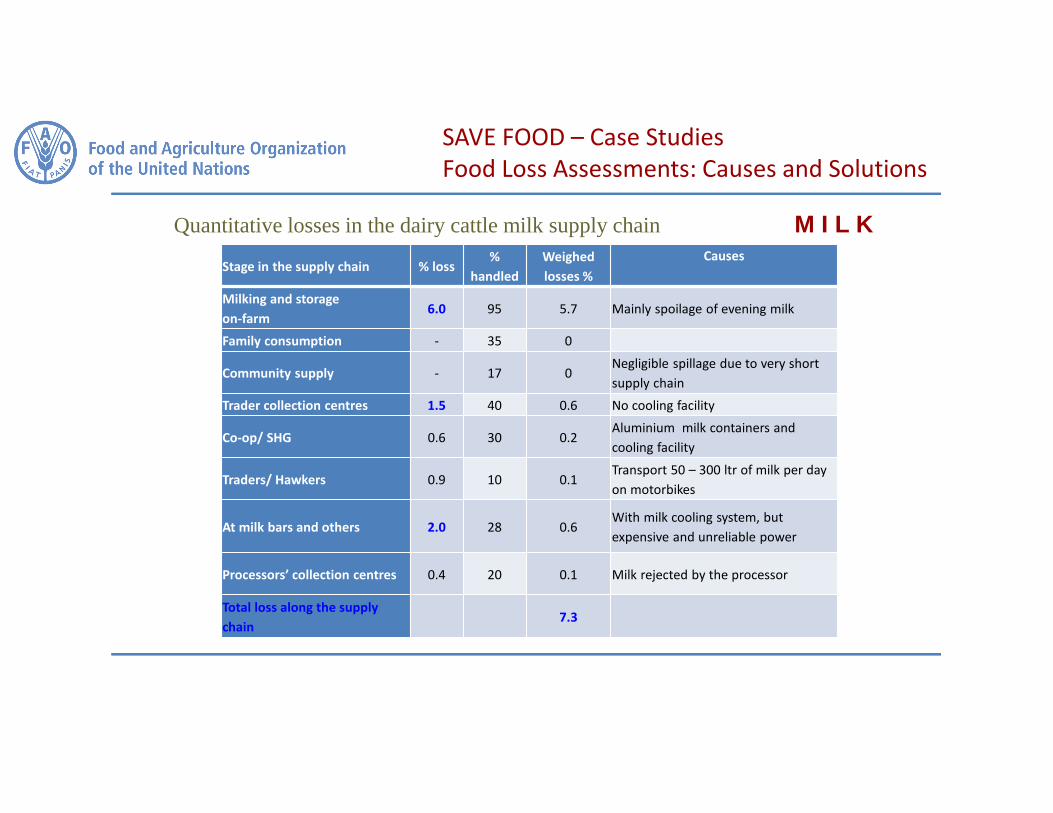
Quantitative losses in the dairy cattle milk supply chain
Stage in the supply chain % loss%
handled
Weighed
losses %
Causes
Milking and storage
on-farm6.0 95 5.7 Mainly spoilage of evening milk
Family consumption - 35 0
Community supply - 17 0Negligible spillage due to very short
supply chain
Trader collection centres 1.5 40 0.6 No cooling facility
Co-op/ SHG 0.6 30 0.2Aluminium milk containers and
cooling facility
Traders/ Hawkers 0.9 10 0.1Transport 50 – 300 ltr of milk per day
on motorbikes
At milk bars and others 2.0 28 0.6With milk cooling system, but
expensive and unreliable power
Processors’ collection centres 0.4 20 0.1 Milk rejected by the processor
Total loss along the supply
chain7.3
M I L K
SAVE FOOD – Case Studies
Food Loss Assessments: Causes and Solutions
Food loss reduction strategy
Capacity building along the milk supply chain, promoting collective milk marketing and raising awareness on ethical practices:
1. Quality-based milk payment system.
2. Training of farmers on farm management practices.
3. Training dairy industry players on hygienic milk handling and quality testing
4. Industry regulation to carry out quality surveillance of milk
M I L K
SAVE FOOD – Case Studies
Food Loss Assessments: Causes and Solutions
Food loss reduction strategy
5. Promotion of cold chain throughout.
6. Commercialization of traditional and value-added dairy products.
7. Increased investments in rural infrastructure: all-weather roads and electricity
8. National Dairy Development Policy as internalized by the 2010 Dairy Master Plan.
M I L K
SAVE FOOD – Case Studies
Food Loss Assessments: Causes and Solutions

![Food Hubs Feasibility Study [DRAFT] - in Food Hubs Feasibility Study 2015 4 Table of Contents Executive Summary 5 Project Overview ...](https://static.documents.pub/doc/80x56/5abe7a6c7f8b9add5f8c933b/food-hubs-feasibility-study-draft-in-food-hubs-feasibility-study-2015-4-table.jpg)


![Food Hubs Feasibility Study [DRAFT] - IN.gov](https://static.documents.pub/doc/80x56/61eff6ed2dbf87069f3c87d9/food-hubs-feasibility-study-draft-ingov.jpg)


