The Impact of Soft Resource Allocation on n-Tier Application Scalability Qingyang Wang, Simon Malkowski, Deepal Jayasinghe, Pengcheng Xiong, Calton Pu College of Computing Georgia Institute of Technology Atlanta, USA {qywang, zmon, deepal, pxiong3, calton}@cc.gatech.edu Yasuhiko Kanemasa, Motoyuki Kawaba, Lilian Harada Research Center for Cloud Computing Fujitsu Laboratories Ltd Kawasaki, Japan {kanemasa, kawaba, harada.lilian}@jp.fujitsu.com Abstract—Good performance and efficiency, in terms of high quality of service and resource utilization for example, are important goals in a cloud environment. Through extensive measurements of an n-tier application benchmark (RUBBoS), we show that overall system performance is surprisingly sensitive to appropriate allocation of soft resources (e.g., server thread pool size). Inappropriate soft resource allocation can quickly degrade overall application performance significantly. Concretely, both under-allocation and over-allocation of thread pool can lead to bottlenecks in other resources because of non-trivial dependencies. We have observed some non-obvious phenomena due to these correlated bottlenecks. For instance, the number of threads in the Apache web server can limit the total useful throughput, causing the CPU utilization of the C-JDBC clustering middleware to decrease as the workload increases. We provide a practical iterative solution approach to this challenge through an algorithmic combination of operational queuing laws and measurement data. Our results show that soft resource allocation plays a central role in the performance scalability of complex systems such as n-tier applications in cloud environments. Keywords-bottleneck, configuration, n-tier, parallel processing, scalability, and soft resource I. INTRODUCTION One of the major advantages of consolidated data centers and cloud environments is scalability: the ability to allocate more resources to an application if needed. For occasional users that run an application only a few times, scalability often compensates for lack of efficiency since achieving high utilization rates is unimportant for them. However, for long term users who run their applications often or continuously (e.g., in electronic commerce), a high level of utilization and low operational costs are important requirements. Otherwise, high operational costs due to inefficiencies in a cloud quickly outweigh the savings from avoiding the capital expenditure of setting up a dedicated cluster. Therefore, a shared cloud environment needs both scalability and efficient utilization. Efficient utilization of cloud resources requires intelligent mapping of system resources to applications that need them. This is a significant challenge since internet-scale applications often have elastic workloads with peak load several times the steady state. In addition, such applications also have Quality of Service (QoS) requirements, often stated in terms of Service Level Agreement (SLA) guarantees such as bounded response time. At the hardware level, intelligent mappings of resources have been previously studied as offline configuration plans [1] and dynamic adaptation policies for run-time adjustments [2]. In this paper, we show that achieving efficient utilization of cloud resources when running large scale n-tier applications requires a unified exploration of each system layer, including both hardware and software. This is primarily due to the com- plex dependencies among software and hardware resources from each tier. Concretely, we developed tools to monitor the usage of soft resources such as application server thread pool and its database (DB) connection pool. Then we analyzed the relationship among throughput, response time, hardware resource usage (CPU, memory, I/O), and soft resource usage (thread/DB connection pool) by changing the size of each thread/DB connection pool in web and application servers. The first contribution of the paper is a quantitative evalua- tion (based on measurements of the RUBBoS benchmark [3]) analyzing the impact of soft resource allocation on application performance for given hardware configurations. For instance, we show that sub-optimal allocation of soft resources such as application server thread pool and its database connection pool can easily degrade the application performance between 28% and 90%, depending on the SLA specifications (see Figure 2). The second contribution of the paper is an impact analysis of two naive soft resource allocation strategies. On one side, a conservative (low) allocation of soft resources (e.g., too small thread pool) often creates software bottlenecks that limit overall system throughput, even though no hardware resources are saturated. On the other side, a liberal (high) allocation of soft resources often wastes hardware resources such as CPU and memory. This degrades application performance at high utilization levels. For example, in our experiments Java Virtual Machine (JVM) garbage collection can consume up to 9% of CPU when the number of threads reaches several hundreds, reducing the achievable throughput (and lengthening the response time) when CPU is near saturation. The third contribution of the paper is a practical algo- rithm for the allocation of soft resources. Our measurements show that an optimal allocation (within our data set) for one hardware configuration is often sub-optimal for other hardware configurations. Consequently, static rule-of-thumb
Transcript
The Impact of Soft Resource Allocation onn-Tier Application Scalability
Qingyang Wang, Simon Malkowski, Deepal Jayasinghe,Pengcheng Xiong, Calton Pu
College of ComputingGeorgia Institute of Technology
Yasuhiko Kanemasa, Motoyuki Kawaba, Lilian HaradaResearch Center for Cloud Computing
Fujitsu Laboratories LtdKawasaki, Japan
{kanemasa, kawaba, harada.lilian}@jp.fujitsu.com
Abstract—Good performance and efficiency, in terms of highquality of service and resource utilization for example, areimportant goals in a cloud environment. Through extensivemeasurements of an n-tier application benchmark (RUBBoS), weshow that overall system performance is surprisingly sensitiveto appropriate allocation of soft resources (e.g., server threadpool size). Inappropriate soft resource allocation can quicklydegrade overall application performance significantly. Concretely,both under-allocation and over-allocation of thread pool canlead to bottlenecks in other resources because of non-trivialdependencies. We have observed some non-obvious phenomenadue to these correlated bottlenecks. For instance, the numberof threads in the Apache web server can limit the total usefulthroughput, causing the CPU utilization of the C-JDBC clusteringmiddleware to decrease as the workload increases. We provide apractical iterative solution approach to this challenge throughan algorithmic combination of operational queuing laws andmeasurement data. Our results show that soft resource allocationplays a central role in the performance scalability of complexsystems such as n-tier applications in cloud environments.
Keywords-bottleneck, configuration, n-tier, parallel processing,scalability, and soft resource
I. INTRODUCTION
One of the major advantages of consolidated data centersand cloud environments is scalability: the ability to allocatemore resources to an application if needed. For occasionalusers that run an application only a few times, scalabilityoften compensates for lack of efficiency since achieving highutilization rates is unimportant for them. However, for longterm users who run their applications often or continuously(e.g., in electronic commerce), a high level of utilizationandlow operational costs are important requirements. Otherwise,high operational costs due to inefficiencies in a cloud quicklyoutweigh the savings from avoiding the capital expenditureof setting up a dedicated cluster. Therefore, a shared cloudenvironment needs both scalability and efficient utilization.
Efficient utilization of cloud resources requires intelligentmapping of system resources to applications that need them.This is a significant challenge since internet-scale applicationsoften have elastic workloads with peak load several times thesteady state. In addition, such applications also have Quality ofService (QoS) requirements, often stated in terms of ServiceLevel Agreement (SLA) guarantees such as bounded response
time. At the hardware level, intelligent mappings of resourceshave been previously studied as offline configuration plans [1]and dynamic adaptation policies for run-time adjustments [2].
In this paper, we show that achieving efficient utilization ofcloud resources when running large scale n-tier applicationsrequires a unified exploration of each system layer, includingboth hardware and software. This is primarily due to the com-plex dependencies among software and hardware resourcesfrom each tier. Concretely, we developed tools to monitor theusage of soft resources such as application server thread pooland its database (DB) connection pool. Then we analyzedthe relationship among throughput, response time, hardwareresource usage (CPU, memory, I/O), and soft resource usage(thread/DB connection pool) by changing the size of eachthread/DB connection pool in web and application servers.
The first contribution of the paper is a quantitative evalua-tion (based on measurements of the RUBBoS benchmark [3])analyzing the impact of soft resource allocation on applicationperformance for given hardware configurations. For instance,we show that sub-optimal allocation of soft resources such asapplication server thread pool and its database connectionpoolcan easily degrade the application performance between 28%and 90%, depending on the SLA specifications (see Figure 2).
The second contribution of the paper is an impact analysisof two naive soft resource allocation strategies. On one side,a conservative (low) allocation of soft resources (e.g., toosmall thread pool) often creates software bottlenecks thatlimitoverall system throughput, even though no hardware resourcesare saturated. On the other side, a liberal (high) allocationof soft resources often wastes hardware resources such asCPU and memory. This degrades application performance athigh utilization levels. For example, in our experiments JavaVirtual Machine (JVM) garbage collection can consume upto 9% of CPU when the number of threads reaches severalhundreds, reducing the achievable throughput (and lengtheningthe response time) when CPU is near saturation.
The third contribution of the paper is a practical algo-rithm for the allocation of soft resources. Our measurementsshow that an optimal allocation (within our data set) forone hardware configuration is often sub-optimal for otherhardware configurations. Consequently, static rule-of-thumb
allocations will be almost always sub-optimal in the presenceof volatile workloads. Our adaptive algorithm for the propersoft resource allocation is analogous and complementary toadaptive hardware resource configuration algorithms [4] [5].
In general, our results strongly suggest that in studies onthe efficient utilization of clouds, soft resources should beconsidered integral components in determining overall appli-cation performance due to the dependencies linking hardwareand software resources. In fact, complex applications can onlybecome truly scalable if soft resources are treated as first classcitizens (analogous to hardware resources) during the principalcomponent analysis of the overall system performance.
The rest of the paper is organized as follows. Section IIdescribes the impact of soft resource allocation on applicationperformance. Section III summarizes the utilization achievedby various allocation strategies through measured resultswithexplanations. Section IV describes our proposed allocationalgorithm in detail. Section V summarizes related work andSection VI concludes the paper.
II. BACKGROUND AND MOTIVATION
A. Background Information
1) Soft Resources in n-Tier Systems:Hardware resourcessuch as CPU, memory, disk, and network are well definedcomponents in performance evaluation studies. We use theterm soft resourcesto refer to system software componentsthat use hardware or synchronize the use of hardware. Forexample,threadsuse CPU andTCP connectionsuse networkI/O. Expanding this definition, we also use the term softresources to refer to components that use (or synchronize theuse of) soft resources as well as a combination of hardwareand soft resources. For example, various locks synchronizethe access to shared data structures or resources. Usually,soft resources are created to facilitate the sharing of hardwareresources in order to increase hardware utilization. For exam-ple, threads facilitate multiprogramming to achieve a higherutilization of the CPU. Consequently, soft resources are criticalpath components that contribute to determining the level ofhardware resource utilization achievable in the system.
In this paper, we study the role of soft resources in determin-ing n-tier application performance. The identification of softresources as explicit components in the critical path of systemexecution is due to the long invocation chain of requestsin an n-tier system. Requests that originate from a clientmachine arrive at the web server, which distributes it amongthe application servers, which in turn ask the database serversto carry out the query. The dependencies among the serversare in the critical path and maintained by soft resources.
2) Experimental Environment:We run an n-tier benchmark(RUBBoS) on our private cluster testbed. We summarize thebenchmark and experimental testbed in this section.
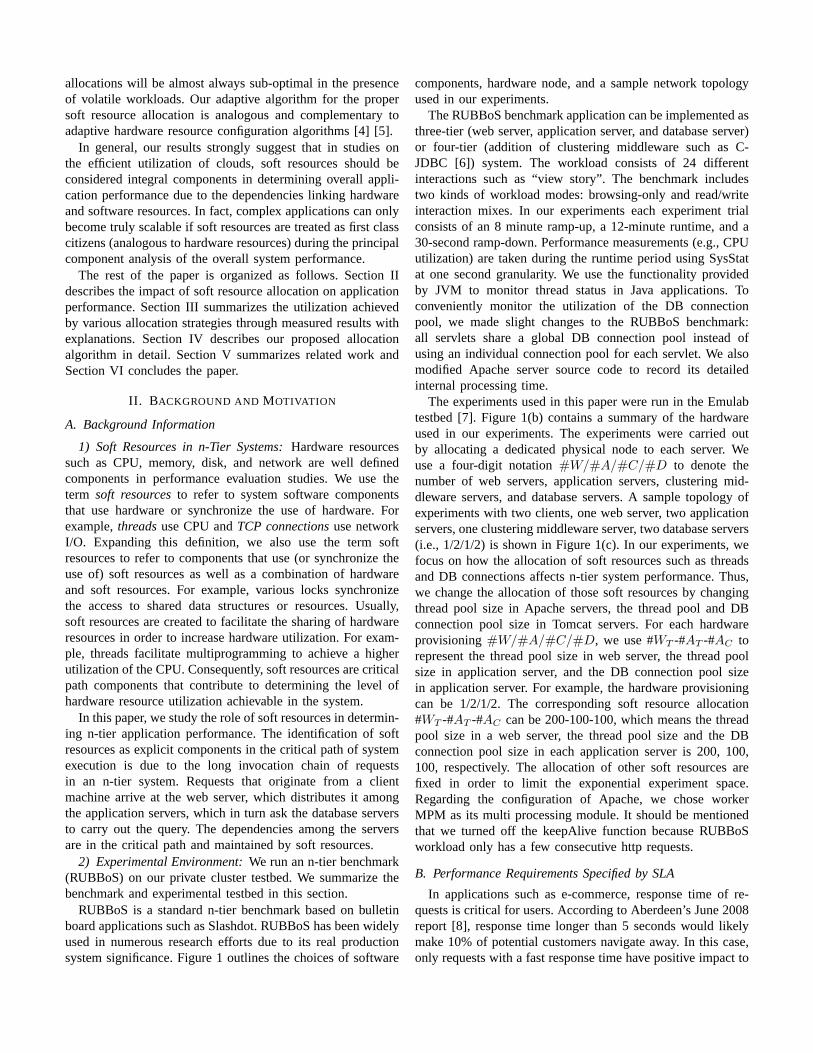
RUBBoS is a standard n-tier benchmark based on bulletinboard applications such as Slashdot. RUBBoS has been widelyused in numerous research efforts due to its real productionsystem significance. Figure 1 outlines the choices of software
components, hardware node, and a sample network topologyused in our experiments.
The RUBBoS benchmark application can be implemented asthree-tier (web server, application server, and database server)or four-tier (addition of clustering middleware such as C-JDBC [6]) system. The workload consists of 24 differentinteractions such as “view story”. The benchmark includestwo kinds of workload modes: browsing-only and read/writeinteraction mixes. In our experiments each experiment trialconsists of an 8 minute ramp-up, a 12-minute runtime, and a30-second ramp-down. Performance measurements (e.g., CPUutilization) are taken during the runtime period using SysStatat one second granularity. We use the functionality providedby JVM to monitor thread status in Java applications. Toconveniently monitor the utilization of the DB connectionpool, we made slight changes to the RUBBoS benchmark:all servlets share a global DB connection pool instead ofusing an individual connection pool for each servlet. We alsomodified Apache server source code to record its detailedinternal processing time.
The experiments used in this paper were run in the Emulabtestbed [7]. Figure 1(b) contains a summary of the hardwareused in our experiments. The experiments were carried outby allocating a dedicated physical node to each server. Weuse a four-digit notation#W/#A/#C/#D to denote thenumber of web servers, application servers, clustering mid-dleware servers, and database servers. A sample topology ofexperiments with two clients, one web server, two applicationservers, one clustering middleware server, two database servers(i.e., 1/2/1/2) is shown in Figure 1(c). In our experiments,wefocus on how the allocation of soft resources such as threadsand DB connections affects n-tier system performance. Thus,we change the allocation of those soft resources by changingthread pool size in Apache servers, the thread pool and DBconnection pool size in Tomcat servers. For each hardwareprovisioning#W/#A/#C/#D, we use #WT -#AT -#AC torepresent the thread pool size in web server, the thread poolsize in application server, and the DB connection pool sizein application server. For example, the hardware provisioningcan be 1/2/1/2. The corresponding soft resource allocation#WT -#AT -#AC can be 200-100-100, which means the threadpool size in a web server, the thread pool size and the DBconnection pool size in each application server is 200, 100,100, respectively. The allocation of other soft resources arefixed in order to limit the exponential experiment space.Regarding the configuration of Apache, we chose workerMPM as its multi processing module. It should be mentionedthat we turned off the keepAlive function because RUBBoSworkload only has a few consecutive http requests.
B. Performance Requirements Specified by SLA
In applications such as e-commerce, response time of re-quests is critical for users. According to Aberdeen’s June 2008report [8], response time longer than 5 seconds would likelymake 10% of potential customers navigate away. In this case,only requests with a fast response time have positive impactto
Function
Web Server
Application Server
Cluster middleware
Software
Apache 2.0.54
Apache Tomcat 5.5.17
C-JDBC 2.0.2
System monitor Systat 7.0.2
Database server MySQL 5.0.51a
Sun JDK jdk1.6.0_14
Operating systemRedhat FC4
Kernel 2.6.12
(a) Software setup
Hardware
Processor
Memory
Network
Components
Xeon 3GHz 64-bit
2GB
1Gbps
Disk 2×146GB 10,000rpm
Server type PC3000 in Emulab
(b) Hardware node setup
Server
Server
Clients
Web
Server
App
Servers
Cluster-
middleware
DB
Servers
(c) Sample topology
Fig. 1: Details of the experimental setup on the Emulab cluster
service providers’ business. In shared infrastructures such ascloud environments, service level agreements (SLAs) are com-monly used for specifying desirable response times, typicallyin the one to two seconds range. The SLA document usuallycontains the service provider’s revenue model, determining theearnings of the provider for SLA compliance (when requestresponse times are within the limit) as well as the penaltiesin case of failure (when response times exceed the limit).The provider’s revenue is the sum of all earnings minus allpenalties.
Different service providers may have different SLA models,which would result in different conclusions from a perfor-mance evaluation based on the system resource monitoringdata. A generic SLA model has been studied in our previouswork [1]. In this paper we use a simplified SLA modelto illustrate the revenue tradeoffs between throughput andresponse time (i.e., the system performance). Even with thissimplified model, our results clearly show that increasingthroughput (and utilization) without other considerations leadsto significant drops in provider revenue through high responsetimes. A detailed study of the influence of different revenue-based SLA models is beyond the scope of this paper and athe subject of our future research.
For our simplified SLA model we set a single threshold forthe response time of requests (e.g., 1 second). Requests withresponse time equal or below the threshold satisfy the SLA.We call the throughput of these requestsgoodput. Requestswith response time higher than the threshold violate the SLA,and the throughput of these requests is called badput. We notethat the sum of goodput and badput amounts to the traditionaldefinition of throughput.
A classic performance model that only considers thethroughput as a whole may be appropriate for a batch-orientedworkloads. However, for interactive applications such as e-commerce the situation is more complex because the responsetime increases significantly when a system resource reachesfull utilization. By refining our throughput model to considerboth goodput and badput, we are able to quantify user-perceived response time, which yields a more realistic providerrevenue analysis.
C. Degradation with Simplified SLA Model
In this section, we apply the simplified SLA model to showthe magnitude of performance variations when soft resourceallocations are inappropriate. The goal of this section is to
illustrate the importance of the problem. The explanationswillbe described in Section III.
1) Impact of Under-Allocation:Figures 2(a), 2(b), and 2(c)compare the goodput of the same hardware configuration(1/2/1/2) and two different soft resource allocations (400-150-60 and 400-6-6). The range of workload chosen (5000 to 6800)captures the knee when the overall throughput curve stopsgrowing. All three figures show that the goodput of 400-6-6starts to decrease (before 5000) much earlier than the case400-150-60 (after 5600). An analysis of hardware resourceutilization (omitted due to space constraints) shows that nohardware resources are saturated in the 400-6-6 case. Thisconfirms that the soft resource allocation of application servercause the bottleneck (6-6 thread pool and DB connectionpool).
An experienced reader may immediately question the wis-dom of attempting the 400-6-6 allocation, which appears tobe an “obviously low” number compared to the 400-150-60“intuitive” choice of practitioners. As it happens, the situationis more complex than it appears. Section II-C2 will show that400-6-6 allocation is near optimal for hardware configuration(1/4/1/4). The reasons for these differences will be explainedin Section III.
Applying the simplified SLA model, the three graphs showthe magnitude of the goodput difference between the twosoft resource allocations. At the workload of 6000 users, thegoodput of 400-150-60 allocation is about 28% higher thanthe 400-6-6 allocation under the threshold of 2 seconds, 44%higher under the 1-second threshold, and 93% higher underthe half-second threshold. Therefore, for the same overallthroughput there may be a significant difference in goodput,depending on the SLA requirements.
2) Impact of Over-Allocation:Figures 3(a) and 3(b) showthe performance degradation of the same thread pool alloca-tions of Section II-C1 for the 1/4/1/4 hardware configuration.The figures show a crossover point. Before the crossover, 400-150-60 has better performance due to better hardware resourceutilization achieved. After the crossover, 400-6-6 is better dueto smaller CPU consumption of the smaller thread pool. Thiswill be explained better in Section III. It may be unexpectedthat Figure 3 shows the non-intuitive choice of 400-6-6 isbetter when nearing saturation, which is just the opposite ofFigure 2.
In fact the performance difference between 400-6-6 and400-150-60 showed in Figures 3(a) and 3(b) can be much
Fig. 2: The goodput comparison of the same software source allocations.In these figures, each line represents the performanceof a specific combination of hardware configuration and soft resource allocation. The first set of four numbers separated by dash,denotes hardware configuration. For example, 1/2/1/2 means one web server (apache), two application servers (tomcat), one databaseclustering middleware (C-JDBC), and two database servers (MySQL). The following set of 3 numbers, separated by hyphens, denotessoftware configuration. For example, 400-150-60 refers to thesize of thread pool (400) in one web server, the size of thread pool(150) in one application server, and the size of DB connection pool (60) in the same application server. This setting (400-150-60) isconsidered a good choice by practitioners from industry
Fig. 3: Performance degradation due to over-allocation of thread pool with 1/4/1/4 hardware configuration
more significant when a detailed response time analysis isapplied. For example, as shown in 3(c), the 400-6-6 allocationhas 130% higher goodput than the case 400-150-60 using 0.2seconds as a threshold.
In general, SLA models correlate economic goals withtechnical performance data to derive intuitive domain insightsat the real quality of services provided by service providers. Inorder to facilitate our discussion with our experimental results,unless stated otherwise, we apply the simplified SLA modelwith 2-second threshold (a commonly used value for manyweb applications) in the application performance evaluation.
In the following Section III we will explain the reasons forthe different performance results shown so far.
III. SENSITIVITY ANALYSIS OF SOFT RESOURCE
ALLOCATION STRATEGIES
In this section we analyze the influence of soft resourceallocation on the overall application performance in termsof measured goodput. We observe some similarities anddifferences between soft resources and hardware resources.Section III-A describes an example of similarities, when scarcesoft resources become the system bottleneck. This is a problemsolvable by adding more soft resource capacity, analogousto scarce hardware resources. Section III-B describes an ex-
ample of differences, when unused soft resources consumetoo much of another critical resource (e.g., CPU), causingthe overall performance to decay. This is a problem solvableby reducing the unused soft resource capacity, which reducesthe consumption of the critical resource and improves overallgoodput. Section III-C shows another interesting example ofsimilarities; hardware resources can be under-utilized bynon-obvious low soft resource allocation in front tiers. In fact, weshow that high allocation of soft resources in front tiers actsas a buffer that stabilizes bursty request flows and providesamore even workload distribution to the back-end.
A. Analysis of Soft Resource Under-Allocation
The first naive soft resource allocation strategy we consideris straight-forward resource minimization, i.e., choose asmallcapacity to not overload the system. Although this strategyminimizes the overhead incurred by soft resources, it maysignificantly hamper workload propagation. When there aretoo few units of a soft resource, they become a bottleneckand the situation is analogous to the saturation of hardwareresources. A soft resource bottleneck may cause the rest of thesystem (e.g., all hardware resources) to become under-utilized.Consequently, adding more hardware does not improve overallperformance (e.g., throughput).
Fig. 4: Performance degradation due to under-allocation of thread poolwith 1/2/1/2 hardware configuration
We use the thread pool in Tomcat to illustrate the problem ofunder-allocation of soft resources. The experiments describedhere have fixed numbers of threads in the Apache server(400), and the number of DB connections is fixed to 200 inTomcat servers. Therefore, these soft resources never becomethe system bottlenecks. The only degree of freedom in theexperiments is the size of the Tomcat thread pool, rangingbetween 6 to 200 threads. The hardware configuration ischosen as 1/2/1/2. Figure 4(a) shows the goodput of increasingallocations of threads in Tomcat. The goodput increases asthe size of the thread pool increases from 6 to 20. Forexample, at a workload of 6000, the goodput of the 400-20-200 configuration is about 40% higher than the goodput ofthe 400-6-200 configuration. This is due to the better overallhardware resource utilization achieved by 20 threads.
Figure 4(d) shows the average CPU usage of the firstTomcat server. Note that given the load balancing providedby the Apache web server, all the Tomcat servers have similarbehavior. Thus, it suffices to show a single representative graphfor this tier. The small thread pool size shows a correspondinglower CPU utilization. For example, at workload 6000, theTomcat CPU utilization of configuration 400-6-200 is about82% while the utilization exceeds 95% for configurations 400-20-200 and 400-200-200. It is clear that in small thread poolallocations all available threads in Tomcat are either busypro-cessing the existing requests or busy waiting for response fromthe lower tier (i.e., C-JDBC server). Consequently, the Tomcatservers become idle and the throughput cannot increase evenwhen all hardware resources are idle.
We use a resource utilization density graph to analyze this
resource utilization scenario more precisely [9]. Figures4(b),4(c), 4(e), and 4(f) show for which thread pool sizes thissoft resource becomes the system bottleneck. The analysisof the figures shows that thread pool size 6 saturates beforethe workload of 5000. In contrast, pool size 10 saturates atabout 5600, and pool size 20 saturates at about 6000. We notethat the system performance symptoms of thread pool under-allocation are similar to the symptoms of hardware resourcesaturation. Hence, it is necessary to monitor the thread poolutilization along with hardware resource utilization in orderto find this particular bottleneck. If only hardware utilizationswere monitored, this bottleneck would remain hidden beneaththe underutilized hardware resources.
Figure 4(a) and 4(d) show another interesting phenomenon:the highest goodput achieved by the thread pool size of 200 islower than the goodput achieved by thread pool size 20. Thisobservation shows that monotonically increasing the threadpool size eventually leads to sub-optimal allocations. This isan example of differences between soft resources and hardwareresources, which are the subject of the next section.
B. Over-Allocation of Soft Resources
The second naive soft resource allocation strategy we con-sider is straight-forward resource maximization, i.e., choose alarge capacity to enable full hardware utilization system.Thisstrategy clearly illustrates some of the differences between softand hardware resources. Unlike hardware resources, whichcannot consume other resources when idle, soft resourcesactually may consume other system resources (e.g., CPU andmemory), regardless of whether they are being used or not.Usually, the maintenance costs of soft resources are considered
Fig. 5: Performance degradation due to over-allocation of DB connectionpool with 1/4/1/4 hardware configuration
small, so the maximization strategy is considered reasonableas long as there are no hardware bottlenecks in the system.
Our measurements show that when the system approachessaturation, over-allocation of soft resources can degradesys-tem performance significantly. For a thread pool size of200, Figures 4(a) and 4(d) illustrate an example of such adegradation. We keep the other parameters fixed and solelyvary the size of the database connection pool in the Tomcatserver (from 6 to 200) to illustrate the phenomenon. Wenote that in these experiments, each time the Tomcat serverestablishes a connection to the C-JDBC server, which balancesthe load among the database servers, a thread is created by C-JDBC to route the SQL query to a MySQL database server.The MySQL server also creates a thread for actual processing.Consequently, one database connection implies one thread inthe C-JDBC and one thread in MySQL server.
Figure 5(a) shows the system goodput for database connec-tion pool sizes of 10, 50, 100, and 200 for a workload between6000 to 7800. This figure show that the lowest allocation 400-200-6 achieves the best performance. Under workload 7800,the goodput of the 400-200-6 configuration is about 34%higher than the throughput of the 400-200-200 configuration.Figure 5(b) shows the average CPU utilization of the C-JDBCserver from workload 6000 to 7800. The highest goodputachieved by each configuration is shown in Figure 5(a). Thegoodput corresponds to about 95% of C-JDBC server CPUutilization in Figure 5(b), which suggest that C-JDBC serverCPU is the system bottleneck.
A careful analysis of C-JDBC server CPU utilization showsa super-linear increase for higher numbers of DB connectionsin Tomcat as workload increases from 6000 to 7800. Atworkload 7800, the C-JDBC server CPU utilization of the400-200-6 configuration is the lowest while its goodput isthe highest. After a wide range search of candidate systemsoftware components, we found that JVM garbage collectionplayed a major role degrading the C-JDBC server efficiencyas the number of DB connections in Tomcat servers increased.
The JVM garbage collection process may affect the sys-tem goodput in two ways. First, since the C-JDBC serverCPU is the primary bottleneck, the CPU time used by thegarbage collector cannot be used for request processing. Wemeasured the time used by the JVM garbage collector directly.
Figure 5(c) shows the total time for JVM garbage collectionon the C-JDBC server. During a 12-minute experiment, atworkload 7800, the C-JDBC server’s JVM garbage collectorconsumes nearly 70 seconds (9% of total) for the 400-200-200 configuration, compared to less than 10 seconds (about1% of total) for the 400-200-6 configuration. Second, theJVM uses a synchronous garbage collector and it waits duringthe garbage collection period, only starting the processingrequests after the garbage collection is finished [10]. Thisdelaysignificantly lengthens the pending query response time—animportant component of the goodput.
C. Buffering Effect of Soft Resource
In this subsection we show that high allocation of softresources in front tiers of an n-tier system sometimes isnecessary to achieve good performance. Unlike the over-utilization case as introduced in Section III-B, high allocationof soft resources in front tiers (e.g., Apache server) mayfunction as a request buffer, which stabilizes the requestssentto the back-end tiers under high workload and improves thesystem performance.
We use the thread pool in Apache server to illustrate thebuffering effect phenomenon. The experiments described herehave a fixed number of threads (6) and DB connections (200)in Tomcat server. The size of the Apache thread pool is in-creased from 30 to 400. The hardware configuration is 1/4/1/4.Figure 6(a) shows the system goodput for Apache thread poolsizes of 30, 50, 100, 400 for a workload between 6000 and7800. The goodput increases as the allocation of threads in theApache server increases. Under workload 7800, the goodput ofthe 400-6-100 configuration is 76% higher than the goodput ofthe 30-6-100 configuration. Intuitively, one may be misled tobelieve that the latter example is an under-allocation scenarioanalogous to the scenario in Section III-A. In other words, itappears that a small thread pool in the Apache server limitsthe number of concurrent requests going through the back-end tiers, which leads to hardware resource under-utilization.However, the following two phenomena show that this scenariois, in fact, significantly more complex.
First, Figure 6(b) shows that the C-JDBC CPU utilizationcontinuously decreases, in both the 30-6-100 and the 50-6-100 configurations after the workload exceeds a certain
Fig. 6: Performance degradation due to small buffer of threads in Apache server with 1/4/1/4 hardware configuration
240 250 260 270 280 290 3000
500
1000
1500
2000
2500
3000
3500
Timeline [s]
Nu
mb
er o
f req
ues
ts
# of processed requests
(a) Processed requests in one second
240 250 260 270 280 290 3000
5
10
15
20
25
30
35
Timeline [s]
Tim
e [m
s]
PT_totalPT_connectingTomcat
(b) Response time
240 250 260 270 280 290 3000
5
10
15
20
25
30
35
Timeline [s]
Thre
ads
[#]
Threads_activeThreads_connectingTomcat
(c) Parallelism
240 250 260 270 280 290 3000
500
1000
1500
2000
2500
3000
3500
Timeline [s]
Nu
mb
er o
f req
ues
ts
# of processed requests
(d) Processed requests in one second
240 250 260 270 280 290 3000
5
10
15
20
25
30
35
Timeline [s]
Tim
e [m
s]
PT_totalPT_connectingTomcat
(e) Response time
240 250 260 270 280 290 3000
5
10
15
20
25
30
35
Timeline [s]
Thre
ads
[#]
Threads_activeThreads_connectingTomcat
(f) Parallelism
Fig. 7: Performance degradation under high workload due to small buffer of threads in Apache server in 30-6-100 allocation.Subfigures (a)–(c) show the results under workload 6000 while Subfigures (d)–(f) under workload 7400.
point. In the case of 30-6-100, the CPU utilization of theC-JDBC server under workload 7800 is about 10% lowerthan under workload 6000. This observation does not matchthe intuitively expected characteristic that growing workloadimplies monotonic growth of hardware resource utilization.
Second, Figure 6(a) shows that 30 threads in the Apacheserver cause worse performance than 400 threads. We have topoint out that the size of the thread pool in a Tomcat server isfixed to 6 in all configurations, which means that the Apacheserver solely requires 24 threads for sending concurrent re-quests to the four Tomcat servers. Although each request sentto a RUBBoS Servlet is followed by two consecutive requestsfor static content (e.g., image file RUBBoSlogo.jpg), suchrequests can be handled by a small number of threads becauseall small files with static content are cached in memory.Therefore, it is hard to believe that the thread pool in Apache
server is too small, even in the 30-6-100 configuration.
A careful analysis of the Apache server runtime statusshows that both aforementioned phenomena are the resultof a too small request buffer (i.e., too low allocation ofsoft resources in the Apache server). Figure 7 shows thecharacteristics of the Apache server with 30 threads underworkload 6000 and 7400 during one minute of the experimentruntime. Figures 7(a) and 7(d) show the timeline graphs of thenumber of requests that the Apache server processed duringeach second. Figures 7(b) and 7(e) show the average busy timeof a worker thread in Apache, and the average processing timeof HTTP contents. During processing time an Apache workerthread is either occupying a Tomcat connection or waitingto obtain a Tomcat connection from the connection pool inorder to interact with the lower tier. Figures 7(c) and 7(f)show the total number of active worker threads and the number
240 250 260 270 280 290 3000
500
1000
1500
2000
2500
3000
3500
Timeline [s]
Nu
mb
er o
f req
ues
ts
# of processed requests
(a) Processed requests in one second
240 250 260 270 280 290 3000
20
40
60
80
100
120
140
160
180
Timeline [s]
Tim
e [m
s]
PT_totalPT_connectingTomcat
(b) Response time
240 250 260 270 280 290 3000
50
100
150
200
250
300
350
400
450
Timeline [s]
Thre
ads
[#]
Threads_activeThreads_connectingTomcat
(c) Parallelism
Fig. 8: Performance improvement due to large thread buffer in Apache server in 400-6-100 allocation under workload 7400
of worker threads interacting or waiting to interact with theTomcat tier. The cause of the performance difference betweenthe two workloads becomes evident through the comparisonof Figures 7(b) and 7(e). Under workload 7400, the averageprocessing time of a worker thread has many significant peakseven though the actual average time spend in an interactionstate that requires a Tomcat connection is largely similar tothe 6000 workload scenario. Although an Apache workerthread needs to perform some additional tasks apart fromprocessing HTTP contents (e.g., maintain TCP connections),these additional task generally only take a short time underlow workload. Under workload 7400, the main contributor ofthe high busy time peaks is the wait time for a FIN reply froma client closing a TCP connection. Under high workload, thiswait time is much larger, which reduces the throughput of theApache server dramatically. This is shown in Figure 7(d). Inaddition, long wait times for FIN replies result in the numberof active worker threads almost reaching the upper boundaryof30 while the number of worker threads that actually interactwith the Tomcat tier is far less than 30. This is shown inFigure 7(f). The drop in the worker threads interacting withtheTomcat tier results in the reduced number of requests pushedto the lower tiers; therefore the CPU utilization of the C-JDBCserver reduces under higher workload.
In order to explain why a similar characteristic does notappear in the 400-6-100 configuration scenario, the graphs inFigure 8 show a similar analysis as in Figure 7 for the 400-6-100 configuration under workload 7400. While the previouslyintroduced increase of wait time for a FIN reply also occurs inthis scenario (see Figure 8(b)), the average processing time inthis case is much larger than in the 30-6-100 case. This is dueto the high number of active threads, which results in longwaiting times for obtaining one of 24 Tomcat connections.Therefore, the relative waiting time for a FIN reply is muchlower compared to the previous scenario. This results in arelatively stable high number of worker threads interacting(i.e., occupying or waiting a connection) with the Tomcattier. As shown in Figure 8(c), the number of worker threadsinteracting with the Tomcat tier is always much higher than 24.Therefore, the Apache server can push a much larger amountof workload to lower tiers, which leads to high throughput asshown in Figure 8(a).
IV. D ETERMINING SOFT RESOURCEALLOCATIONS
In the previous section, we showed that both under-allocation and over-allocation of soft-resources may causeperformance degradation. In this section we will outline apractical algorithm to choose a “Goldilocks” soft resourceallocation for each hardware configuration.
A. Challenges of Soft Resource Allocation
The discussion so far can be summarized as following.Too-low soft resource allocations may cause under-utilizationof other resources. Too-high soft resource allocations maywaste critical system resources. Therefore, a proper allocationrange needs to be found that maximizes the utilization of thesystem resources in the critical application execution path.However, finding a good allocation range is non-trivial dueto the following three challenges:
1) The good soft resource allocation depends on locationof the critical hardware resource, which can be quitedifferent under different hardware configurations. Thecritical system resources are the Tomcat CPU in 1/2/1/2configuration (Section III-A) and the C-JDBC CPU in1/4/1/4 configuration (Section III-B), for example.
2) Typically, the system performance is not sensitive toover-allocation of soft resources until some critical hard-ware resource is close to saturation.
3) The state space for a soft resource allocation is usuallyvery large (often unlimited). Thus, finding a good alloca-tion by running experiments exhaustively is impractical.
B. Soft Resource Allocation Algorithm
Our algorithm is based on the following three assumptions:• The system has a single hardware resource bottleneck.• Our monitoring tools are able to monitor the bottlenecked
hardware resource when the system is saturated.• Each individual server response time for every request is
logged.The first assumption excludes the complex multi-bottleneck
cases. In a multi-bottleneck scenario the saturation of hardwareresources may oscillate among multiple servers locating indifferent tiers [9]. In these complex cases, our algorithmmay fail to determine the critical hardware resource since nosingle hardware resource is fully utilized when the system
is saturated. The algorithmic resource allocation in multi-bottleneck cases is highly challenging and will require addi-tional research. The second and third assumptions assume thatwe have properly instrumented the system with monitoringtools such as SysStat and Log4j.
The algorithm consists of the following three steps:1) Exposing the critical hardware resource in the system.
This step examines the hardware resource that willsaturate earliest in the system. Such hardware resourcesare critical because their saturation limits the entiresystem performance.
2) Inferring a good allocation of local soft resources.Thisstep allocates soft resources in the server that utilize thecritical hardware resource directly. The critical hardwareresource will be heavily utilized based on the associatedsoft resources if they are over-allocated.
3) Calculating a good allocation of other soft resources.This step allocates soft resources to tiers other than thetier where the critical hardware resource resides. Thefront tiers (e.g., Apache server) should provide enoughsoft resources to act as a buffer that stabilizes the requestflow to the critical tier (see Section III-C). The back-end tiers need to provide enough soft resources to avoidrequest congestion in the critical tier.
Algorithm 1 shows the pseudo-code for the three steps, whichare explained in more detail in the following.
1) Exposing the critical hardware resource:This partof the algorithm exposes the critical hardware resourceby increasing the workload step by step until through-put saturates. The initial soft resource allocation and hard-ware provisioning areS0 and H0, respectively. Func-tion RunExperiment(H,S,workload) initiates an experi-ment with input hardware/software configuration at specificworkload, and at the same time, all hardware resource andsoft resource utilizations are monitored. During this processsaturated hardware and soft resources are recorded inBh andSh, respectively. IfBh is not empty, the critical hardwareresource has been successfully exposed and returned. IfSh isnot empty, the system hardware resources are under-utilizeddue to the scarcity of some soft resource(s). In this case, thesoft resource allocations are double, and the experiment isrepeated. If bothBh andSh are empty, the workload offeredto the system is insufficient and needs to be increased by oneworkload step before a new iteration of the experiment.
It is possible that none of the hardware resources weobserved are fully utilized when system is saturated. Thiscomplex case may be due to multi-bottlenecks [9] in thesystem or limitation of our monitoring tools. Dealing withsuch complex case is one of our on-going research.
2) Inferring a good allocation of local soft resources:TheInferMinConncurentJobs procedure infers a good allocationof soft resources in the critical server ( the server with thecritical hardware resource) based on the minimum number ofconcurrent jobs inside the server that can saturate the criticalhardware resource. Intuitively, all hardware resources have
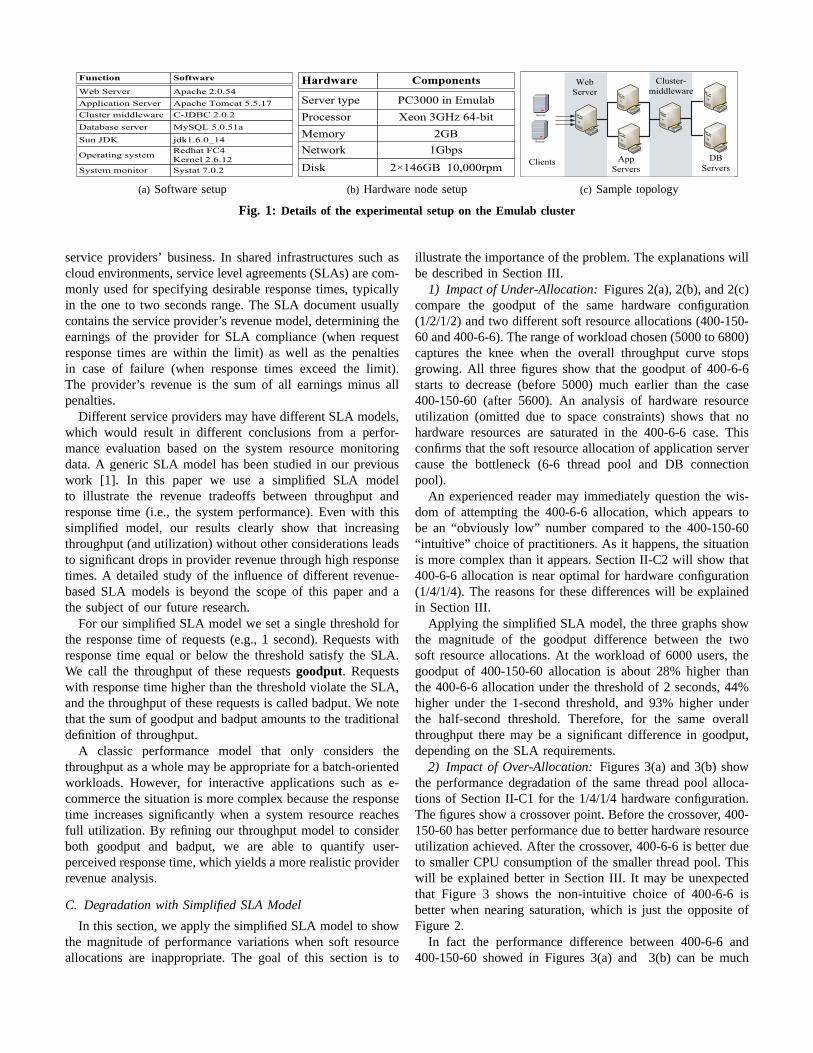
Algorithm 1: Pseudo-code for the allocation algorithm1 procedure FindCriticalResource2 workload = step, TPcurr = 0, TPmax = -1;3 S = S0, H = H0;4 while TPcurr > TPmax do5 TPmax = TPcurr ;6 (Bh,Bs, TP ) = RunExperiment(H, S, workload);7 if (Bh 6= φ) then8 / ∗ hardware resource saturation ∗ /9 Sreserve = S;
33 procedure CalculateMinAllocation34 for server in front tiersdo35 server.threadpool= minJobs * RTTratio/Reqratio;36 server.Connpool = minJobs * RTTratio/Reqratio;37 end38 for server in end tiersdo39 server.threadpool= minJobs;40 server.Connpool = minJobs;41 end
their limitation; the critical hardware resource will saturate theearliest if the number of the concurrent jobs inside the serveris too high. Each job inside a server needs to consume certainhardware resources such as CPU, memory, or disk I/O. Inpractice each job in the server is delegated to one processingthread. The optimal number of threads in the critical servershould be equal to the minimum number of concurrent jobsthat can saturate the critical hardware resource. In this case,the critical hardware resource will neither be under-utilizednor over-utilized.
The average number of jobs inside a server can be inferredfrom the average throughput and response time of the server byapplying Little’s law. Throughput and response time of a severcan be obtained by checking the server log. Therefore, solelythe minimum workload saturating the system (caused by thecritical hardware resource saturation) needs to be determined.
In order to approximate the exact workload that can saturatethe critical hardware resource, the procedure uses a statisticalintervention analysis [11] on the SLO-satisfaction of a system.The main idea of such analysis is to evaluate the stability
Tomcat Server CJDBC Server
t1
t2
t3
T
HTTP
request
HTTP
response
t1'
t2'
Interaction with
MySQL serverD
BC
onn
busy
perio
d
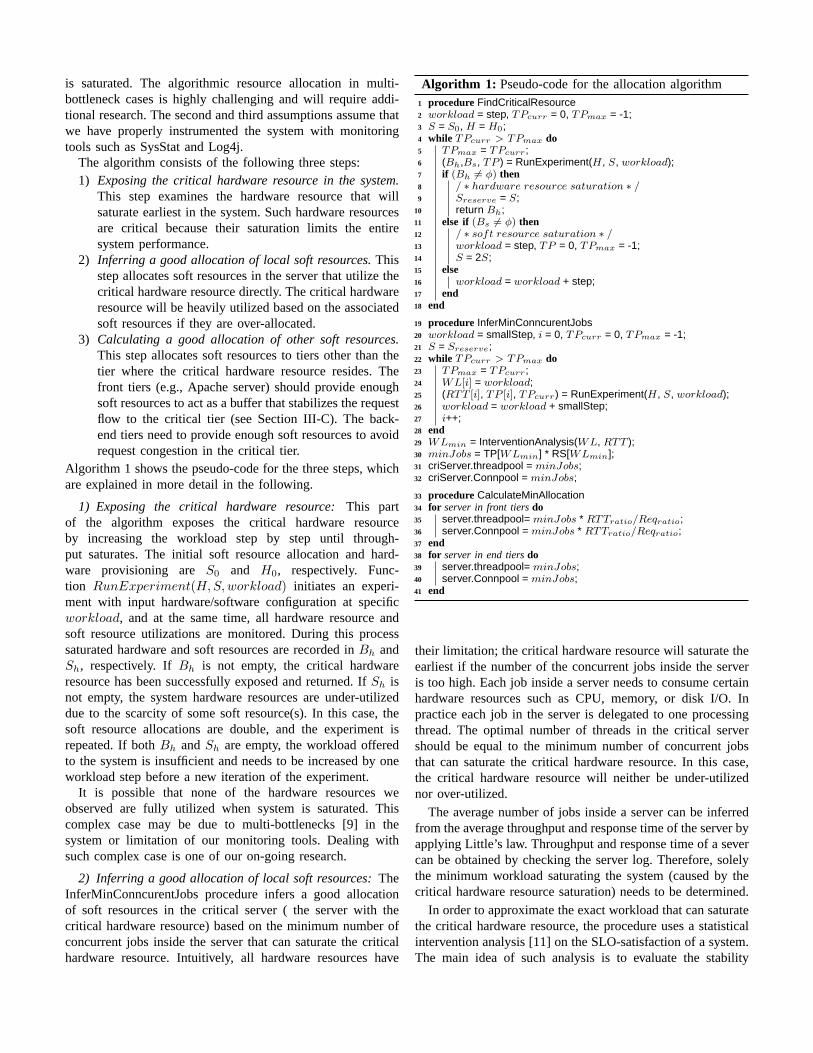
Fig. 9: A sample request process between a Tomcat server anda C-JDBC server
of the SLO-satisfaction of the system as workload increases;the SLO-satisfaction should be nearly constant under lowworkload and start to deteriorate significantly once the work-load saturates the critical hardware resource. Readers whoareinterested in more details can refer to our previous paper [11].
After figuring out the minimum number of concurrent jobs(minJobs) that saturate the critical hardware resource, line 31and 32 of the pseudo-code assign the value to the soft resourcepools of the critical server.
3) Calculating a good allocation of other soft resources:Soft resource pools in each tier of an n-tier system control themaximum concurrent requests flow through the system. Evenif the optimal soft resource allocation is set in the critical tier,the system performance may still be sub-optimal due to theimproper soft resource allocation in other tiers. Too smallsoftresources in front of the critical tier may limit the number ofconcurrent requests flowing through the critical resource toomuch. Too small soft resources in tiers behind the critical tiermay cause request congestion in front tiers. Both cases leadto critical hardware resource under-utilization.
The CalculateMinAllocation procedure calculates a good al-location of soft resources in other tiers based on the allocationof soft resources in the critical server.
Figure 9 shows a sample HTTP request processing betweena Tomcat server and a C-JDBC server. TheRTT of the HTTPrequest in the Tomcat server isT while the RTT of thefollowing two interactions between the Tomcat server and C-JDBC server aret′
1andt′
2. Thus, there is a job in the Tomcat
server during the entire periodT while a job only resides inthe C-JDBC server during periodst′
1and t′
2. Because each
job in the Tomcat server needs to occupy one DB connectionto communicate with the C-JDBC server, the Tomcat serverneeds to obtain at leastN0 ∗ T/(t
′
1+ t′
2) DB connections in
order to keepN0 jobs active the C-JDBC server.In fact, the ratio of soft resource allocation between different
tiers can be calculated by combining Little’s law and theForced Flow Law [12].
L = TP ∗RTT (1)
TPtomcat = TPcjdbc/Reqratio (2)
The Reqratio denotes the average number of SQL queriesissued by one servlet request for each Tomcat server. Such a ra-
tio between different tiers depends on the characteristicsof theworkload. SupposeRTTratio meansRTTtomcat/RTTcjdbc,by combining Formula(1) and Formula (2), one can obtainthe following Formula:
Ltomcat = Lcjdbc ∗ (RTTratio/Reqratio) (3)
Formula 3 shows that the soft resource allocation in theTomcat tier should be no less thanLtomcat. The soft resourceallocation in tiers behind the C-JDBC server should be noless thanminJobs. The reason is to avoid request congestionin front tiers, which leads to the critical hardware resourceunder-utilization.
C. Validation of Algorithm
So far we have discussed our algorithm primarily in quali-tative terms. Here we will show two case studies of applyingthe algorithm to find a good allocation of soft resources forall tiers in the system.
Table I shows the result of applying the algorithm to ourprevious two cases 1/2/1/2 and 1/4/1/4. We can see that thecritical hardware resource is Tomcat CPU under configuration1/2/1/2 while it is C-JDBC CPU under 1/4/1/4 configuration.In the second procedure of the algorithm, we get the responsetime, throughput, average # of jobs for each individual serverunder the saturation workload. The third procedure of thealgorithm calculates the minimum size of thread/conn poolsfor tiers other than the critical tier, which is shown in the lasttwo rows of the table. We have to point out that we turnedon the logging function of each server in order to get thecorresponding average response time and throughput, whichdegrades the system maximum throughput to about 10%-20%.
1) Validation of 1/2/1/2 case:Table I shows that the optimalsize of one Tomcat thread pool under 1/2/1/2 configurationis 13. This value matches the result in Figure 10(a), whichshows the maximum throughput the system can achieve withincreasing Tomcat thread pool size from 6 to 200. In this setof experiments we fixed the size of Apache thread pool andTomcat DB connecting pool to a relatively large value. Thepurpose is to keep enough concurrent requests flowing throughthe Tomcat tier when the size of Tomcat thread pool increases.
2) Validation of 1/4/1/4 case:Table I shows that the optimalsize of one C-JDBC thread pool under 1/2/1/2 configurationis 8. However, there is no explicit thread pool in the C-JDBCserver in practice; the one-to-one mapping between Tomcatdatabase connection pool and C-JDBC request handling threadmeans that we control the maximum number of C-JDBCthreads by setting the Tomcat database connection pool size.
Table I shows that the minimum size of each Tomcat DBconnection pool is 8 (the total size is 32 since there are 4 Tom-cat servers). In fact 8 should be the optimal allocation becausewe don’t want to over-utilize C-JDBC CPU. Figure 10(b)shows the maximum throughput the system can achieve withincreasing size of each Tomcat DB connection pool from 1to 200. We can see that the system can achieve the highestthroughput when the Tomcat DB pool size is 8, which matchesthe output of our algorithm.
Hardware Configuration1/2/1/2 1/4/1/4
Apache Tomcat CJDBC MySQL Apache Tomcat CJDBC MySQL
Critical hardware resource CPU CPUSaturation WL [# Users] 5,800 6,200RTT [s] 0.137 0.0351 0.147 0.0378 0.0082TP [Reqs/s] 740 740 847 847 2728Average # of jobs inside 101.3 26 124.5 32 22.4Reqratio 1 1 3.22 3.22 1 1 3.22 3.22Size of total threads/conns 101 26 26 26 125 32 22 22Size of individual thread/conn pool 101 13 (×2) 26 13 (×2) 125 8 (×4) 22 6 (×4)
TABLE I: Output of the algorithm for hardware configuration 1/2/1/2 and 1/4/1/4
6 8 10 13 20 30 60 100 150 200730
740
750
760
770
780
790
800
810
820
830
Thread pool size in one Tomcat [#]
Max
thro
ughp
ut [R
eqs/s
]
1/2/1/2(400−#−200)
(a) Max TP vs. size of thread pool in Tomcat
1 2 4 8 10 20 30 60 100 200550
600
650
700
750
800
850
900
950
1000
1050
DB conn pool size in one Tomcat [#]
Max
thro
ughp
ut [R
eqs/
s]
1/4/1/4(400−200−#)
(b) Max TP vs. size of DBconn pool in Tomcat
Fig. 10: Validation of the optimal soft resource allocation for hardware configuration 1/2/1/2 and 1/4/1/4
V. RELATED WORK
Multi-threaded architecture is widely adopted as standarddesign for internet servers such as Apache, Tomcat, andKnot [13] due to its simple and natural programming style.Some other works [14]–[16] advocate that a good designfor high concurrency servers should follow a Staged Event-Driven Architecture (SEDA), which integrates both threadsand events. No matter which design an internet server adopts,the allocation of soft resources such as threads plays animportant role for the control of concurrency in the requestprocessing and has a significant impact on overall perfor-mance [13], [16], [17]. To the best of our knowledge, previousworks mainly focus on the performance impact of threadallocation for a single web server, which serves requests onlyfor static content. More complex web applications such asn-tier applications, which involve web servers, applicationservers, and DB servers are not discussed. As shown in ourpaper, soft resource allocation impacts the performance ofcomplex n-tier systems in a more intricate and subtle way.
Previous work on soft resource allocation can be classi-fied based on three main approaches—analytical model-basedapproach, feedback control-based approach, and experimental-based approach.
Analytical model based approacheshave been used to findthe optimal soft resource allocation for Internet servers [4],[18]. These approaches employ an analytical queuing modelto simulate different scenarios. The model is meant to capturesignificant performance differences based on the variationofworkload, concurrency limits, or QoS requirements. Thoughthese analytical models have been shown to work well forparticular domains, they are typically hard to generalize.More-over, analytical models are constrained by rigid assumptions
such as normal service times and disregard of multi-threadingoverhead such as context switching or JVM GC.
Feedback-control approaches[19]–[21] have been appliedto optimize soft resource allocation or hardware provisioningduring run-time. The feedback is generated based on a givenSLA specification such as response time limit or resourceutilization boundaries. However, feedback-control approachesare crucially dependent on system operators choosing correctcontrol parameters and defining correct reconciliation actions.As shown in our paper, determining suitable parameters ofcontrol is a highly challenging task. Applying correct actionswhen system performance starts to deteriorate is similarlycomplicated due to the threat of over-allocation and under-allocation of soft resources.
Experimental based approachesfor optimal soft resourceallocation are evidently closest to our study. Sopitkamol etal. provide an ad-hoc experimental methodology to identifykey configuration parameters that impact application serverperformance [22]. Raghavachari et al. present an experimentalmethodology, which explores the configuration space of anapplication server and finds the optimal configuration of theapplication server based on linear regression techniques [23].Osogami et al. present an algorithm to reduce the measurementtime for exploring a large configuration space and find anear optimal configuration of a web server [24]. Zheng et al.introduce an interesting framework to automate the generationof configurations of clusters of web servers based on aparameter dependency graph [25]. However, most of theseexperimental based approaches lack a deep understanding ofthe dependencies among soft and hardware resources and theirimplications for system performance. In contrast, our workclearly shows that optimal soft resource allocation is closelyrelated to the weakest hardware resource in the system.
VI. CONCLUSIONS
We studied the performance impact as a function of soft re-sources allocation. Impact was measured and quantified usingthe n-tier benchmark RUBBoS. We found several situationswhere an inappropriate allocation of soft resources can leadto significant degradation in goodput (requests within SLAbound) at high concurrency levels. Close to system saturation,choosing an appropriate soft resource allocation to achievegood performance is a non-trivial problem. Too low and toohigh allocations may both cause performance degradation.On the one side, if the thread pool allocation is too low,goodput may drop by several tens of percent (Section III-Aand Section III-C). On the other side, too high allocationsalso cause the goodput to drop by several tens of percent(Section III-B). To avoid such performance penalties, wedescribed a soft resource allocation algorithm.
In this study, we found similarities and differences betweensoft resources and hardware resources when the system ap-proaches saturation. Similar to hardware resources, the systemneeds sufficient soft resources to reach top performance. Ifasoft resource allocation is too low, it may become a bottleneckdue to scarcity. This kind of soft resource saturation can bedetected analogously to hardware resource saturation. In otherwords, the soft resource bottleneck reaches full utilizationwhile other resources are only partially utilized.
Unlike hardware resources, which do not consume otherresources when idle, soft resources may compete for shared re-sources such as CPU whether they are being used or not. In ourexperiments, when the size of thread pool reaches hundreds,itincreases JVM garbage collection overhead significantly (upto 9% of total CPU). This overhead reduces the total CPUavailable for application processing, and too-high threadpoolsize reduces the maximum achievable goodput as mentionedabove when the CPU approaches full utilization. More gener-ally, for complex application scale-up soft resources havetobecome first class citizens (analogous to hardware) during theperformance evaluation phase.
ACKNOWLEDGMENT
This research has been partially funded by National ScienceFoundation by IUCRC, CyberTrust, CISE/CRI, and NetSEprograms, National Institutes of Health grant U54 RR 024380-01, PHS Grant (UL1 RR025008, KL2 RR025009 or TL1RR025010) from the Clinical and Translational Science Awardprogram, National Center for Research Resources, and gifts,grants, or contracts from Wipro Technologies, Fujitsu Labs,Amazon Web Services in Education program, and GeorgiaTech Foundation through the John P. Imlay, Jr. Chair endow-ment. Any opinions, findings, and conclusions or recommen-dations expressed in this material are those of the author(s)and do not necessarily reflect the views of the NationalScience Foundation or other funding agencies and companiesmentioned above.
REFERENCES
[1] S. Malkowski, M. Hedwig, D. Jayasinghe, C. Pu, and D. Neumann,“Cloudxplor: a tool for configuration planning in clouds based onempirical data,” inSAC ’10: Proc. of the 2010 ACM Symposium onApplied Computing, New York, USA, 2010.
[2] G. Jung, K. R. Joshi, M. A. Hiltunen, R. D. Schlichting, and C. Pu,“A cost-sensitive adaptation engine for server consolidation of multitierapplications,” inMiddleware ’09, New York, USA, 2009.
[3] RUBBoS: Bulletin board benchmark. http://jmob.ow2.org/rubbos.html.[4] K. Aberer, T. Risse, and A. Wombacher, “Configuration of distributed
message converter systems using performance modeling,” inIPCCC ’01:Proc. of 20th International Performance, Computation and Communi-cation Conference, 2001.
[5] A. Deshmeh, J. Machina, and A. Sodan, “Adept scalability predictor insupport of adaptive resource allocation,” inIPDPS ’10: IEEE Interna-tional Parallel and Distributed Processing Symposium, apr. 2010.
[6] E. C. Julie, J. Marguerite, and W. Zwaenepoel, “C-jdbc: Flexibledatabase clustering middleware,” inIn Proc. of the USENIX 2004 AnnualTechnical Conference, 2004.
[7] Emulab–Network Emulation Testbed. http://www.emulab.net/.[8] A. R. Library, The Performance of Web Applications: Customers are
Won or Lost in One Second. http://www.aberdeen.com/.[9] S. Malkowski, M. Hedwig, and C. Pu, “Experimental evaluation of n-
tier systems: Observation and analysis of multi-bottlenecks,” in IISWC’09, Washington, DC, USA, 2009.
[10] Tuning Garbage Collection with the Java[tm] Virtual Machine.http://java.sun.com/docs/hotspot/gc5.0/gctun-ing 5.
[11] S. Malkowski, M. Hedwig, J. Parekh, C. Pu, and A. Sahai, “Bottleneckdetection using statistical intervention analysis,” inDSOM’07: Proc. ofthe Distributed systems: operations and management, Berlin, Heidel-berg, 2007.
[12] P. J. Denning and J. P. Buzen, “The operational analysisof queueingnetwork models,”ACM Comput. Surv., vol. 10, no. 3, 1978.
[13] R. von Behren, J. Condit, F. Zhou, G. C. Necula, and E. Brewer,“Capriccio: scalable threads for internet services,” inSOSP ’03, NewYork, USA, 2003.
[14] M. Welsh, D. Culler, and E. Brewer, “SEDA: an architecture for well-conditioned, scalable internet services,”SOSP ’01, pp. 230–243, 2001.
[15] D. Pariag, T. Brecht, A. Harji, P. Buhr, A. Shukla, and D.R. Cheriton,“Comparing the performance of web server architectures,”In Proc.EuroSys ’07, 2007.
[16] V. Beltran, J. Torres, and E. Ayguade, “Understanding tuning complexityin multithreaded and hybrid web servers,” inIPDPS’08: IEEE Interna-tional Parallel and Distributed Processing Symposium, 2008.
[17] H. Jamjoom, C.-T. Chou, and K. Shin, “The impact of concurrencygains on the analysis and control of multi-threaded internetservices,” inINFOCOM ’04, 2004.
[18] G. Franks, D. Petriu, M. Woodside, J. Xu, and P. Tregunno, “Layeredbottlenecks and their mitigation,” inQEST ’06: Proc. of the 3rdinternational conference on the Quantitative Evaluation of Systems,Washington, DC, USA, 2006.
[19] Y. Diao, J. Hellerstein, A. Storm, M. Surendra, S. Lightstone, S. Parekh,and C. Garcia-Arellano, “Using mimo linear control for load balancingin computing systems,” inAmerican Control Conference ’04, 2004.
[20] X. Liu, L. Sha, Y. Diao, S. Froehlich, J. L. Hellerstein,and S. Parekh,“Online response time optimization of apache web server,” inIWQoS’03:Proc. of the 11th international conference on Quality of service, Berlin,Heidelberg, 2003.
[21] D. Olshefski and J. Nieh, “Understanding the management of clientperceived response time,” inSIGMETRICS ’06/Performance ’06, NewYork, NY, USA, 2006.
[22] M. Sopitkamol and D. Menasce, “A method for evaluating the impactof software configuration parameters on e-commerce sites,” inProc. ofthe 5th international workshop on Software and performance, 2005.
[23] M. Raghavachari, D. Reimer, and R. Johnson, “The Deployer’s Problem:Configuring Application Servers for Performance and Reliability,” 2003.
[24] T. Osogami and S. Kato, “Optimizing system configurationsquickly byguessing at the performance,” inSIGMETRICS ’07, NY, USA, 2007.
[25] W. Zheng, R. Bianchini, and T. D. Nguyen, “Automatic configurationof internet services,” inEuroSys ’07, Lisbon, Portugal, 2007.