Page 1
Annals of the „Constantin Brâncuşi” University of Târgu Jiu, Economy Series, Issue 3/2018
„ACADEMICA BRÂNCUŞI” PUBLISHER, ISSN 2344 – 3685/ISSN-L 1844 - 7007
FORMS OF WORK ORGANIZATION AND
REGIONAL PERFORMANCE IN EU-28 AND NORWAY
ERDEI RAUL
PHD STUDENT
FACULTY OF ECONOMICS AND BUSINESS ADMINISTRATION, WEST UNIVERSITY OF
TIMIȘOARA, ROMANIA
[email protected] , phone: 004 0720 52 7909
BĂRNUŢIU OCTAVIAN
PHD STUDENT
FACULTY OF ECONOMICS AND BUSINESS ADMINISTRATION,
WEST UNIVERSITY OF TIMIȘOARA, ROMANIA
Abstract
Knowledge, intellectual assets, technology transfer or innovation activities, in general, are sources of growth in
companies' competitiveness on markets, for labor productivity or for creation of quality jobs, essential for a sustainable
and smart development. The analysis is based on the revised measurement framework for innovation activity and its
regional results, on the one hand, and the Eurofound survey on working conditions, on the other. Identifying the
direction and degree of interdependence between innovative work organization and innovation performance in 187 EU-
28 and Norway territorial units consists of a detailed analysis through which economic and social factors trends
favoring innovation can be broken down. This facilitates an appropriate assessment of the areas where the European
Commission (or other Community or national institutions) can focus their efforts to improve innovation performance.
The estimated results reveal that innovative work organization forms have potentially partial non-homogeneous effects.
Thus, the estimation for the most intensive work organization form (discretionary learning) suggests that, above all, a
higher level of its presence in companies leads to a higher level of innovation performance at regional level, while
"lean" production has negative consequences on performance. For the classical forms of work organization, Taylorism
has a positive impact and traditional organizations have a negative one, both on the growth of employment in
medium‑high/high tech manufacturing and knowledge‑intensive services, respectively in sales of new-to-market and
new-to-firm innovations.
JEL codes: J81, F66, O31
Keywords: Forms of work organization, workplace innovation, regional innovation
Introduction
Numerous endogenous and exogenous factors are responsible for the results of the innovation
process: contextual determinants, modern research systems, financial support and firm investments
or R & D concerns, including the creation and development of collaborative networks and the
strengthening of intellectual assets, all of which are very important in achieving the expected higher
economic and social outcomes. Both organizational structures, through the creation of innovative
jobs and opportunities for employee participation and involvement, as well as employment policies
that facilitate such effective organizational change are sine-qua-non conditions for a the defining
impact of human capital on innovation and productivity (OECD, 2010). Overall, the performances
of national innovation systems are central to driving economic processes, increasing employment or
improving quality of life.
The aim of the research is to evaluate, in an interdisciplinary approach, the influences and
implications of potential, general and specific determinants of innovation (investments in research
and development, level of education and experience, intellectual assets, collaboration activities and
creation of information networks). The paper focuses on workplace innovation as a dimension of
171
Page 2
Annals of the „Constantin Brâncuşi” University of Târgu Jiu, Economy Series, Issue 3/2018
„ACADEMICA BRÂNCUŞI” PUBLISHER, ISSN 2344 – 3685/ISSN-L 1844 - 7007
social innovation, evaluating the impact on employment in knowledge intensive sectors and
integration in commercial markets in a wide European regional space.
The analysis is carried out on the basis of the revised framework for measuring innovation activity
and its regional results (European Commission, 2017), on the one hand, and Eurofound`s European
Working Conditions Surveys, on the other, while taking into account the existence of spatial
interdependences between economic and social characteristics of the regions considered in the
analysis. The assessment of the relationship between workplace innovation and innovation
performance was carried out for 187 territorial units (NUTS 2 and 3) in EU-28 and Norway for
2015, using cross-section data and spatial autoregressive models.
Literature review
Innovation is a key factor for economic growth and development with profound implications for all
human activities. The Oslo Manual (OECD, 2005) defines innovation-generating activities at the
company level as those in which knowledge is used, including from external sources, for equipment
purchases (incorporating superior technological performances but not in R & D directions) and
other tangible assets (land and buildings, software) acquired through training, market research or
other preparation for the implementation of innovative processes (planning and control, testing and
evaluation).
The topic regarding interdependencies between innovation and work processes is thoroughly
analyzed by Arundel, Lorenz, Lundvall, and Valeyre (2005), who stress that the way employees
work significantly influences the company's ability to innovate. Innovation means not only new
products, methods or processes, but the organization ability to adapt itself to changes. Recent
studies (Howaldt, Butzin, Domanski, Kaletka, 2014; Howaldt and Schröder, 2018) underline the
paradigm shift in innovation, largely reflected in international research, towards opening the
innovation process to society with non-technological innovations aimed at changing social
practices. The new approach to understanding the challenges of contemporary society is also found
in national or European policies, strategies, programs and research innovation; the Europe 2020
Strategy is relevant in this respect (European Commission, 2010, Eurofound, 2016). The new
paradigm of innovation not only integrates changes in innovation processes and their
implementation into society structures but also changes in the subject of innovation induced by
social innovation and for which Howaldt and Schröder (2018, p. 1) cite Gillwald (2000), according
to which the relevance of technical novelty should be supplemented with the novelty of social
implications and consequences (either benefits or costs) on the relations and structures of society
(Choi and Majumdar, 2014, p. 10).
One of the most widely accepted approaches to innovative work organization is that proposed by
Lorenz and Valeyre (2005), which outlined four specific forms of work organization defined by
them as discretionary learning (DL), lean production (LP), Taylorism (TA) and traditional or simple
organizations (SO). Subsequently, these forms of work organization were taken over, explained and
used in analyzes and studies by other authors (Arundel, Lorenz, Lundvall and Valeyre, 2007;
Lundvall and Lorenz, 2007; Lorenz, 2015; Lundvall, 2016), and also by European Union
institutions for projects, policies and initiatives.
Methodology
In analyzing the influence of some economic and social determinants of innovation on occupation
and integration in the commercial markets, as impact measures, we have developed an operational
research model that includes the theoretical and empirical elements used to substantiate the
econometric analysis, the estimation models, the influence variables and their measures, as well as
the methods that we have selected and proposed in the assessment of the influence relationship.
172
Page 3
Annals of the „Constantin Brâncuşi” University of Târgu Jiu, Economy Series, Issue 3/2018
„ACADEMICA BRÂNCUŞI” PUBLISHER, ISSN 2344 – 3685/ISSN-L 1844 - 7007
The Regional Innovation Scoreboard database includes the innovation dimension for 220 territorial
administrative units in 22 Member States and Norway, and for the other Member States, Cyprus,
Estonia, Latvia, Lithuania, Luxembourg and Malta the national data is the same for the NUTS-1 or
NUTS-2 regions. In the classification of regions, depending on the innovation performance, four
categories of regional innovators are defined by the European Commission: Innovation Leaders,
Strong Innovators, Moderate Innovators and Modest Innovators.
Database construction for innovation indicators and the estimation of the innovative forms of work
organization frequency raised the issue of the non-uniformity in spatial mapping of the
observations. For this, there wasn’t a perfect correlation between the European classification of the
territorial units and the ones from the European Working Conditions Survey. For data
comparability, we omitted some regional areas or ranked them at a lower classification level. As a
result, the number of NUTS 1, 2 or 3 regions considered in the analysis is 187.
Since the data used for measuring work organization is dichotomic, the working methods comprise
of a multiple correspondence analysis (MCA) and a cluster analysis. By assigning values to
observations and categories, multiple correspondence analysis quantifies nominal data in order to
bring observations in the same category closer. The MCA analysis was based on the results of the
EWCS 2015 survey, for which the configuration of the main forms of work organization, according
to the theoretical and empirical models of the literature, was made using 15 variables whose
observations were grouped on structured factorial axes in relation to the contribution of the
variables to the explanation of their total variance. Work organization forms dimensions for
innovation leader regions in EU-28 and Norway, comprising the first two axes, are illustrated in the
following figure.
FIGURE NO. 1: Work organization forms for innovation leaders in EU-28 and
Norway, through MCA and cluster analysis Source: Authors' processing in SPAD 9.0
Spatial dependence associated with dependent variables, regressions, and error terms is included in
estimates by autoregressive spatial models (Belotti, Hughes and Mortari, 2013), as: Spatial
Autoregressive Model - SAR, Spatial Error Model - SEM, Spatial Durbin Model - SDM, Spatial
Autocorrelation Model - SAC, and Spatial Autoregressive Generalized Method of Moments
(SPGMM). The measurement construction of innovative forms of work organization by national
and regional units was carried with SPAD software (Statistical Package for Augmented Designs)
and STATA 14.0, the latter for evaluating spatial autoregressive models.
Results of the relationship between participatory forms of work organization and indicators of
European economic performance
173
Page 4
Annals of the „Constantin Brâncuşi” University of Târgu Jiu, Economy Series, Issue 3/2018
„ACADEMICA BRÂNCUŞI” PUBLISHER, ISSN 2344 – 3685/ISSN-L 1844 - 7007
The phase of testing for spatial autocorrelation structure is based on the need to certify the level of
dependency between the variables in regions located in the vicinity of others. The results obtained
for spatial autocorrelation measurement instruments, Moran and Geary, with a statistical
significance of over 99%, reveal the existence of positive spatial autocorrelation for the dependent
variables considered. These are presented in Table no. 1.
TABEL NO. 1: Spatial autocorrelation indices at NUTS level, 2015
Moran’s I Geary’s C
Dependent variable I E(I) sd(I) z p-value* C E(C) sd(C) z p-value*
Employment in medium‑high/high tech
manufacturing and knowledge‑intensive
services
0.349 -0.005 0.036 9.822 0.000 0.653 1.000 0.039 -8.818 0.000
Sales of new-to-market and new-to-firm innovations
0.596 -0.005 0.036 16.771 0.000 0.399 1.000 0.044 -13.776 0.000
Source: Authors' processing in STATA 14.0
In order to reveal the influence of forms of work organization on the dependent variables (the
increase of employment and sales), the econometric evaluation of the relationship was tested by
sequentially including spatial patterns of both organizational forms and dependent and independent
variables. Given that the simultaneous use of all four forms of work organization in the regression
equations (discretionary learning, lean production, taylorism and traditional organizations) would
lead to shifted results because of their multicollinearity (the estimated coefficients being the same
for all forms of organization), in the specifications we considered only three forms of organizations,
using alternatively as an explanatory variable the employment in medium‑high/high tech
manufacturing and knowledge‑intensive services, respectively sales of new-to-market and new-to-
firm innovations.
TABEL NO. 2: Spatial dependence between forms of work organization and employment
M1
(SAR) M2
(SAR) M3
(SEM) M4
(SEM) M5
(SEM) M6
(SDM) M7
(SDM) M8
(SDM) M9
(SAC) M10
(SAC) M11
(SPGMM) Number of observations 187 187 187 187 187 187 187 187 187 187 187 Wald test 78.20*** 75.32*** 74.93*** 74.49*** 65.19*** 101.57*** 97.27*** 91.21*** 72.29*** 72.01*** 70.72*** Log Likelihood function 126.44 126.26*** 128.85 128.77 118.57 131.99 131.58 121.90 129.19 129.13 107.29
Spatial autocorrelation tests Ho: Error has No Spatial AutoCorrelation / Ha: Error has Spatial AutoCorrelation
GLOBAL Moran MI 0.29*** 0.30*** 0.32*** 0.32*** 0.27*** 0.25*** 0.27*** 0.18*** 0.33*** 0.33*** 0.32*** GLOBAL Geary GC 0.69*** 0.69*** 0.67*** 0.67*** 0.73*** 0.74*** 0.73*** 0.81*** 0.67*** 0.67*** 0.67*** GLOBAL Getis-Ords -0.29*** -0.30*** -0.32* -0.32*** -0.27*** -0.25*** -0.27*** -0.18*** -0.33*** -0.33*** -0.32*** LM Error (Burridge) 58.43*** 63.84*** 72.37*** 74.49*** 50.38*** 40.38*** 46.73*** 21.84*** 76.38*** 78.16*** 70.84*** LM Error (Robust) 25.84*** 28.00*** 51.10*** 55.76*** 49.02*** 1947.55*** 2448.35*** 1974.14*** 136.99*** 145.98*** 29.37***
Ho: Spatial Lagged Dependent Variable has No Spatial AutoCorrelation / Ha: Spatial Lagged Dependent Variable has Spatial AutoCorrelation LM Lag (Anselin) 102.74*** 113.20*** 168.52*** 177.53*** 136.46*** 145.58*** 173.27*** 92.98*** 244.67*** 256.37*** 144.83*** LM Lag (Robust) 70.14*** 77.36*** 147.25*** 158.79*** 135.11*** 2052.75*** 2574.89*** 2045.28*** 305.28*** 324.19*** 103.35***
Ho: No General Spatial AutoCorrelation / Ha: General Spatial AutoCorrelation LM SAC (LMErr+LMLag_R) 128.57*** 141.20*** 219.62*** 233.29*** 185.49*** 2093.13*** 2621.62*** 2067.12*** 381.66*** 402.35*** 174.19***
LM SAC (LMLag+LMErr_R)
128.57*** 141.20*** 219.62*** 233.29*** 185.49*** 2093.13*** 2621.62*** 2067.12*** 381.66*** 402.35*** 174.19***
Diagnostic Criteria for Model Selection AIC 0.02 0.02 0.02 0.020 0.02 0.02 0.02 0.02 0.02 0.02 0.02 AIC (Log) -3.89 -3.90 -3.86 -3.89 -3.85 -3.92 -3.92 -3.89 -3.87 -3.88 -3.89 Schwarz Criterion 0.02 0.02 0.02 0.020 0.02 0.03 0.03 0.03 0.02 0.02 0.02 Schwarz Criterion (Log) -3.74 -3.76 -3.73 -3.75 -3.72 -3.62 -3.66 -3.64 -3.72 -3.74 -3.73
* p<0.05, ** p<0.01, *** p<0.001
Source: Authors' processing in STATA 14.0
Interpreting individual model results involves checking for spatial autocorrelation within each
estimation and selecting the model(s) that best matches the set of observations constituted by factor
variables. Tables no. 2 and 3 comprise the results of panel data estimation on employment in
medium‑high/high tech manufacturing and knowledge‑intensive services, the first summing up
diagnostic tests for spatial dependence and the selection of the models appropriate to the data set,
and the latter the extent to which the variables used in the analysis influence employment. Direct
effects and recorded spillover effects were calculated for developed models, but they were not
represented distinctively.
Even though spatial autocorrelation could be verified in several models, the results obtained for
estimated employment elasticity ratios in relation to the explanatory variables differ not only
according to the factorial combinations considered in the specifications but also by the type of
spatial model used. Analyzing each type of model, the results indicate the lag models, which could
indicate the preference in choosing this spatial model, have the highest values for the Durbin
specification (Models 6, 7 and 8). For these models, the Akaike Information Criterion (AIC) and the
174
Page 5
Annals of the „Constantin Brâncuşi” University of Târgu Jiu, Economy Series, Issue 3/2018
„ACADEMICA BRÂNCUŞI” PUBLISHER, ISSN 2344 – 3685/ISSN-L 1844 - 7007
Schwarz Criterion should be added for the selection based on their lowest values. We note that no
precise differentiation can be made based on their values, so we will proceed to choosing the
optimal spatial model by maximizing the log-likelihood function, accordingly to the Durbin
estimate (Model 6).
TABEL NO. 3: Spatial impacts on employment in knowledge intensive activities
----------------------------------------------------------------------------------------------------------------------------------------- (1) (2) (3) (4) (5) (6) (7) (8) (9) (10) (11) SAR SAR SEM SEM SEM SDM SDM SDM SAC SAC SPGMM ----------------------------------------------------------------------------------------------------------------------------------------- DL 0.00212* 0.00217* 0.00242** 0.00242** 0.00193* 0.00258** 0.00261** 0.00214* 0.00236* 0.00236* 0.00237* (2.20) (2.25) (2.58) (2.58) (1.96) (2.61) (2.65) (2.07) (2.57) (2.57) (2.46) LP 0.000158 0.000199 -0.000135 -0.000111 -0.000397 0.0000192 0.0000331 -0.000135 -0.000189 -0.000171 -0.000181 (0.19) (0.24) (-0.17) (-0.14) (-0.46) (0.02) (0.04) (-0.15) (-0.24) (-0.22) (-0.22) TA 0.00190* 0.00192* 0.00134 0.00136 0.000468 0.00147 0.00148 0.000906 0.00120 0.00121 0.00133 (2.02) (2.04) (1.51) (1.52) (0.50) (1.52) (1.53) (0.90) (1.36) (1.37) (1.45) GERD 0.0421** 0.0404** 0.0394** 0.0380** 0.0694*** 0.0447** 0.0408** 0.0735*** 0.0379** 0.0367** 0.0406** (3.08) (3.03) (2.87) (2.85) (5.41) (3.14) (3.00) (5.57) (2.80) (2.79) (2.91) SME_collab -0.148* -0.162** -0.225** -0.231** -0.167* -0.244** -0.251** -0.204* -0.231** -0.236** -0.221** (-2.56) (-3.11) (-3.10) (-3.26) (-2.32) (-3.15) (-3.27) (-2.56) (-3.16) (-3.26) (-3.03) LLL -0.0784 -0.0746 0.0511 0.0557 0.0403 0.0616 0.0845 0.0897 0.0474 (-1.24) (-1.18) (0.63) (0.69) (0.40) (0.63) (0.94) (1.01) (0.59) Scient_pub 0.309*** 0.300*** 0.302*** 0.296*** 0.290*** 0.273*** 0.286*** 0.281*** 0.298*** (4.26) (4.23) (4.47) (4.49) (3.96) (3.88) (4.21) (4.23) (4.30) SME_mark -0.0411 -0.0337 -0.0114 -0.0818 -0.0388 -0.0313 -0.0345 (-0.59) (-0.40) (-0.10) (-0.87) (-0.30) (-0.37) (-0.41) SME_prod 0.0603 0.0442 (0.50) (0.35) w1x_DL -0.00262 -0.00252 -0.000873 (-0.91) (-0.89) (-0.29) w1x_LP 0.000157 0.00000369 0.000891 (0.07) (0.00) (0.36) w1x_TA 0.000557 0.000441 0.00318 (0.17) (0.14) (0.96) w1x_GERD 0.0327 0.0312 0.0275 (0.83) (0.81) (0.78) w1x_SME_collab 0.219 0.207* 0.201 (1.91) (1.98) (1.68) w1x_LLL -0.0362 -0.0368 (-0.23) (-0.24) w1x_Scientific+pub -0.304 -0.334 (-1.24) (-1.65) w1x_SME_mark 0.0398 -0.0189 (0.23) (-0.09) w1x_SME_prod -0.132 (-0.60) cons 0.0429 0.0332 0.282*** 0.273*** 0.358*** 0.0925 0.0975 0.0318 0.395** 0.387** 0.287*** (0.54) (0.43) (3.94) (4.01) (5.01) (0.42) (0.44) (0.13) (2.61) (2.61) (4.00) ----------------------------------------------------------------------------------------------------------------------------------------- Rho_cons 0.528*** 0.531*** 0.542*** 0.553*** 0.459*** -0.240 -0.243 (6.56) (6.63) (5.95) (6.28) (4.67) (-0.87) (-0.88) ----------------------------------------------------------------------------------------------------------------------------------------- Sigma_cons 0.121*** 0.121*** 0.118*** 0.118*** 0.126*** 0.117*** 0.117*** 0.124*** 0.116*** 0.116*** (19.14) (19.13) (19.00) (19.01) (19.08) (19.05) (19.05) (19.14) (17.11) (17.14) ----------------------------------------------------------------------------------------------------------------------------------------- Lambda_cons 0.607*** 0.608*** 0.537*** 0.716*** 0.717*** (7.56) (7.61) (6.09) (5.94) (6.02) ----------------------------------------------------------------------------------------------------------------------------------------- N 187 187 187 187 187 187 187 187 187 187 187 -----------------------------------------------------------------------------------------------------------------------------------------
t statistics in parentheses * p<0.05, ** p<0.01, *** p<0.001 Source: Authors' processing in STATA 14.0
The elasticity coefficients obtained for evaluating the relation between employment and variables of
forms of work organization clearly highlight the steady and robust influence of discretionary
learning. The estimated coefficients are positive and statistically significant, suggesting the
importance of this class of organization in increasing labor market integration. Moreover, the
elasticities have a statistical significance of over 95%. The other two forms of organization used in
the models generally influence the degree of occupancy in the same direction, but their coefficients
are not statistically significant. In addition, discretionary learning has a constant effect on all
developed spatial models, whereas the estimated direction of influence of “lean” type fluctuates
according to the type of model used (for Models 3, 8 and 9 results are negative); the employment
elasticity in relation to the Taylor type of work organization is positive but inconsistent in respect
with the economic impact magnitude.
For the cumulated effects of the three forms of organization used, in Models 6 and 7 (Durbin type)
the spillover effects are slightly more pronounced than the direct ones, which means there is a
strong spatial dependence between the regions considered in the analysis. At the same time, the
value of direct effects is highest for discretionary learning, both in Model 9 and Model 6, their value
being approximately double than the Taylor type (0.0007) and significantly higher than lean
production (0,00). The direct and indirect spatial effects, relative to the type of innovators (firms)
that introduced new (or improved) products or processes and new marketing or work organization
methods, are positive, with a range of differences in impact size. Thus, if product and process
innovators have greater effects in supporting employment in their own region (direct effects),
innovation in marketing and organization in a region seems to support an increase in employment in
other regions.
175
Page 6
Annals of the „Constantin Brâncuşi” University of Târgu Jiu, Economy Series, Issue 3/2018
„ACADEMICA BRÂNCUŞI” PUBLISHER, ISSN 2344 – 3685/ISSN-L 1844 - 7007
Increasing the quality of research is considered a strategic objective of the Europe 2020 R & D
system (European Commission, 2010). In all developed models, R & D expenditure - including
private, public and tertiary sectors - has been included as explanatory factors. A positive, direct
relationship also exists between employment and research spending in the business sector and,
being very important for employment growth, the quality of scientific research and the
attractiveness of research systems. The development of inter and intra-firm connections leads to
different implications. Thus, collaborations between companies on research and innovation do not
positively influence the outcome (in our case the occupation) of their own region, but that of other
neighboring units. This could be explained by the fact that such collaborations do not always
involve new human resources, but only more intense use of internal ones. We can conclude that the
results obtained by innovating are being exploited by developing new activities in neighboring
regions.
Another performance measure of an innovation system (European Commission, 2017) is given by
the sales of innovative products, new-to-market and new-to-firm. Similar to the analysis
evaluating the influence of forms of work organization on employment, Tables no. 4 and 5 include
test results and estimated elasticity coefficients for the assessment of innovative product sales.
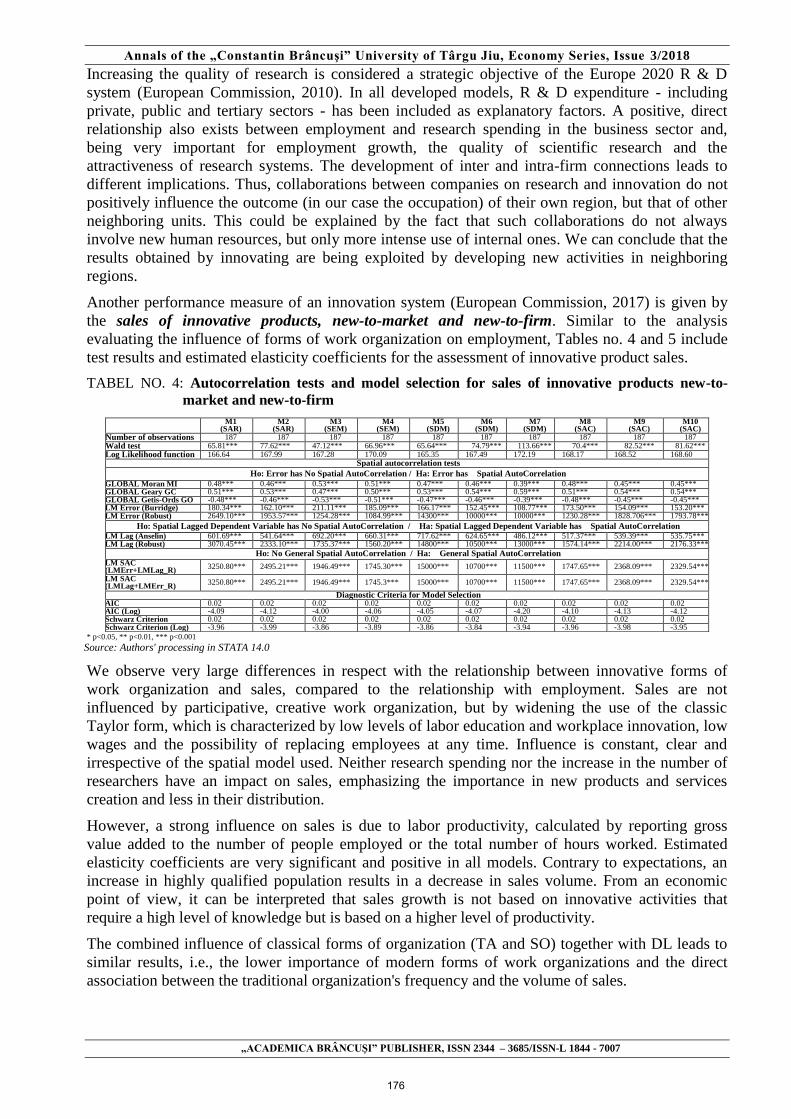
TABEL NO. 4: Autocorrelation tests and model selection for sales of innovative products new-to-
market and new-to-firm
* p<0.05, ** p<0.01, *** p<0.001
Source: Authors' processing in STATA 14.0
We observe very large differences in respect with the relationship between innovative forms of
work organization and sales, compared to the relationship with employment. Sales are not
influenced by participative, creative work organization, but by widening the use of the classic
Taylor form, which is characterized by low levels of labor education and workplace innovation, low
wages and the possibility of replacing employees at any time. Influence is constant, clear and
irrespective of the spatial model used. Neither research spending nor the increase in the number of
researchers have an impact on sales, emphasizing the importance in new products and services
creation and less in their distribution.
However, a strong influence on sales is due to labor productivity, calculated by reporting gross
value added to the number of people employed or the total number of hours worked. Estimated
elasticity coefficients are very significant and positive in all models. Contrary to expectations, an
increase in highly qualified population results in a decrease in sales volume. From an economic
point of view, it can be interpreted that sales growth is not based on innovative activities that
require a high level of knowledge but is based on a higher level of productivity.
The combined influence of classical forms of organization (TA and SO) together with DL leads to
similar results, i.e., the lower importance of modern forms of work organizations and the direct
association between the traditional organization's frequency and the volume of sales.
M1
(SAR) M2
(SAR) M3
(SEM) M4
(SEM) M5
(SDM) M6
(SDM) M7
(SDM) M8
(SAC) M9
(SAC) M10
(SAC) Number of observations 187 187 187 187 187 187 187 187 187 187 Wald test 65.81*** 77.62*** 47.12*** 66.96*** 65.64*** 74.79*** 113.66*** 70.4*** 82.52*** 81.62*** Log Likelihood function 166.64 167.99 167.28 170.09 165.35 167.49 172.19 168.17 168.52 168.60
Spatial autocorrelation tests
Ho: Error has No Spatial AutoCorrelation / Ha: Error has Spatial AutoCorrelation
GLOBAL Moran MI 0.48*** 0.46*** 0.53*** 0.51*** 0.47*** 0.46*** 0.39*** 0.48*** 0.45*** 0.45*** GLOBAL Geary GC 0.51*** 0.53*** 0.47*** 0.50*** 0.53*** 0.54*** 0.59*** 0.51*** 0.54*** 0.54*** GLOBAL Getis-Ords GO -0.48*** -0.46*** -0.53*** -0.51*** -0.47*** -0.46*** -0.39*** -0.48*** -0.45*** -0.45*** LM Error (Burridge) 180.34*** 162.10*** 211.11*** 185.09*** 166.17*** 152.45*** 108.77*** 173.50*** 154.09*** 153.20*** LM Error (Robust) 2649.10*** 1953.57*** 1254.28*** 1084.99*** 14300*** 10000*** 10000*** 1230.28*** 1828.706*** 1793.78***
Ho: Spatial Lagged Dependent Variable has No Spatial AutoCorrelation / Ha: Spatial Lagged Dependent Variable has Spatial AutoCorrelation
LM Lag (Anselin) 601.69*** 541.64*** 692.20*** 660.31*** 717.62*** 624.65*** 486.12*** 517.37*** 539.39*** 535.75*** LM Lag (Robust) 3070.45*** 2333.10*** 1735.37*** 1560.20*** 14800*** 10500*** 13000*** 1574.14*** 2214.00*** 2176.33***
Ho: No General Spatial AutoCorrelation / Ha: General Spatial AutoCorrelation LM SAC (LMErr+LMLag_R)
3250.80*** 2495.21*** 1946.49*** 1745.30*** 15000*** 10700*** 11500*** 1747.65*** 2368.09*** 2329.54***
LM SAC (LMLag+LMErr_R)
3250.80*** 2495.21*** 1946.49*** 1745.3*** 15000*** 10700*** 11500*** 1747.65*** 2368.09*** 2329.54***
Diagnostic Criteria for Model Selection AIC 0.02 0.02 0.02 0.02 0.02 0.02 0.02 0.02 0.02 0.02 AIC (Log) -4.09 -4.12 -4.00 -4.06 -4.05 -4.07 -4.20 -4.10 -4.13 -4.12 Schwarz Criterion 0.02 0.02 0.02 0.02 0.02 0.02 0.02 0.02 0.02 0.02 Schwarz Criterion (Log) -3.96 -3.99 -3.86 -3.89 -3.86 -3.84 -3.94 -3.96 -3.98 -3.95
176
Page 7
Annals of the „Constantin Brâncuşi” University of Târgu Jiu, Economy Series, Issue 3/2018
„ACADEMICA BRÂNCUŞI” PUBLISHER, ISSN 2344 – 3685/ISSN-L 1844 - 7007
TABEL NO. 5: Spatial autoregressive models for testing the influence of work organization on sales of
innovative products
-------------------------------------------------------------------------------------------------------------------------------------------- (1) (2) (3) (4) (5) (6) (7) (8) (9) (10) SAR SAR SEM SEM SDM SDM SDM SAC SAC SAC -------------------------------------------------------------------------------------------------------------------------------------------- DL 0.000396 0.000222 0.000179 0.000602 0.000575 0.000599 0.000338 0.000209 0.000228 0.000167 (0.54) (0.30) (0.25) (0.79) (0.75) (0.78) (0.45) (0.28) (0.31) (0.22) LP 0.000934 0.00106 0.000846 0.000844 0.00123 0.00147* 0.00136* 0.00105 0.000941 0.000937 (1.45) (1.65) (1.32) (1.33) (1.79) (2.12) (2.01) (1.59) (1.41) (1.41) TA 0.00143* 0.00158* 0.00113 0.00138* 0.00169* 0.00183* 0.00166* 0.00149* 0.00157* 0.00152* (1.99) (2.19) (1.62) (1.99) (2.23) (2.43) (2.23) (1.99) (2.15) (2.05) GERD 0.0124 0.00590 0.00647 0.0209* 0.00931 0.00736 0.00491 0.00905 0.0104 (1.38) (0.60) (0.59) (2.13) (0.83) (0.66) (0.47) (0.82) (0.90) Tertiary_edu -0.0835 -0.133* -0.237*** -0.0792 -0.178* -0.238** -0.167 -0.142 -0.140 (-1.83) (-2.45) (-3.36) (-1.49) (-2.48) (-3.17) (-1.87) (-1.87) (-1.84) Productiv_munc 0.00158*** 0.00151*** 0.00245*** 0.00204** 0.00182* 0.00178** 0.00187** (3.50) (3.37) (3.64) (2.68) (2.30) (2.89) (2.79) Productiv_hours 0.00404*** (3.81) Scientists_perc 0.0111 0.0126 0.0264 0.0199* 0.0159 0.0125 0.0100 0.0105 (1.65) (1.35) (1.93) (2.05) (1.65) (1.58) (1.29) (1.32) BERD 0.0745 (1.19) RDexp 0.105 (1.91) SME_inho -0.0204 -0.0514 -0.0492 (-0.32) (-0.91) (-0.86) Tertiary_scientists_thous -0.0174** (-3.27) Scientific_pub -0.0250 (-0.39) w1x_DL 0.00177 0.00180 0.00120 (0.89) (0.87) (0.58) w1x_LP 0.00198 0.00201 0.00191 (1.12) (1.15) (1.11) w1x_TA 0.00194 0.00228 0.00262 (0.84) (1.00) (1.16) w1x_GERD 0.0378 0.0499* 0.0323 (1.69) (2.11) (1.29) w1x_Tertiary_edu 0.138 0.242* 0.295* (1.48) (2.03) (2.37) w1x_ Scientists_perc -0.0163 -0.00876 (-1.13) (-0.61) w1 Productiv_ocup -0.00000100 (-0.96) _cons -0.00426 -0.00973 0.247*** 0.206*** -0.239 -0.274 -0.259 0.0286 0.0132 0.0168 (-0.08) (-0.19) (4.27) (3.37) (-1.45) (-1.66) (-1.59) (0.28) (0.19) (0.23) -------------------------------------------------------------------------------------------------------------------------------------------- Rho_cons 0.679*** 0.672*** 0.692*** 0.689*** 0.640*** 0.569* 0.655*** 0.648*** (11.59) (11.44) (11.59) (11.43) (9.16) (2.34) (4.35) (4.15) -------------------------------------------------------------------------------------------------------------------------------------------- Sigma_cons 0.0954*** 0.0948*** 0.0945*** 0.0934*** 0.0959*** 0.0948*** 0.0932*** 0.0957*** 0.0948*** 0.0948*** (19.05) (19.06) (18.97) (18.99) (19.01) (19.01) (19.02) (18.67) (18.10) (18.14) -------------------------------------------------------------------------------------------------------------------------------------------- Lambda_cons 0.718*** 0.696*** 0.236 0.0474 0.0638 (12.32) (11.45) (0.56) (0.13) (0.17) -------------------------------------------------------------------------------------------------------------------------------------------- N 187 187 187 187 187 187 187 187 187 187 --------------------------------------------------------------------------------------------------------------------------------------------
t statistics in parentheses * p<0.05, ** p<0.01, *** p<0.001
Source: Authors' processing in STATA 14.0
Conclusions
Referring to the impact assessment on innovation performance, no matter how we measured it, it
can be mentioned that the forms of manifestation of innovative work organization forms have
potentially partial non-homogeneous effects. Starting from the most knowledge intensive form of
work organization, discretionary learning (DL), the effect estimation suggests that predominantly a
higher level of its presence in the companies leads to a higher level of performance in innovation at
regional level. However, combining it with the traditional form of organizations at the expense of
"lean" production has negative consequences in terms of the direction of influence on performance,
a possible explanation being that traditional organizations occupy a significant share in the sample
of analysis, which is not, however, taken into account - distorting the results obtained.
The inclusion of the "lean" production, together with discretionary learning and Taylorism, leads to
positive performance effects, while its cumulation with traditional organizations results in negative
effects on both the latter form and on "lean" production. The two classical forms of organization,
less intensive, confirm that Taylorism has a positive overall impact, and traditional organizations
have a negative one, both on the increase of the occupancy rate, and sales of products.
We cannot ignore the fact that the determinants of spatial autoregressive models, depending on their
type, have specific roles in innovation performance. Hence, it is important to take into account their
differentiated application according to specific characteristic of each form of work organization, not
only at the national level but also at the regional one. Also, this requires orientating the innovative
processes towards knowledge development (at company and employee level), respectively the
valorization of intensive in knowledge forms of work organization advantages. Concluding,
organizational and institutional policies should mainly focus on investing in human resources,
177
Page 8
Annals of the „Constantin Brâncuşi” University of Târgu Jiu, Economy Series, Issue 3/2018
„ACADEMICA BRÂNCUŞI” PUBLISHER, ISSN 2344 – 3685/ISSN-L 1844 - 7007
funding innovative activities through R & D spending, improving latent products and processes and,
last but not least, increasing employment productivity.
Bibliography
[1] Arundel, A., Lorenz, E, Lundvall, B.-Å. and Valeyre, A. (2007), “How Europe’s economies learn: a
comparison of work organisation and innovation mode for the EU-15”, Industrial and Corporate
Change, vol. 16, no. 6, pp. 1175-1210.
[2] Benhamou, S. (2017). „Imaginer l’avenir du travail. Quatre types d’organisation du travail à l’horizon
2030”. France Srategie, No. 2017-05 avril.
[3] Cedefop (2011). “Learning while working: success stories on workplace learning in Europe”.
Luxembourg: Publications Office.
[4] Cedefop (2012). “Learning and innovation in enterprises” Research Paper No 27.
[5] Cox, A., Rickard, C., and Tamkin, P. (2012). „Work organisation and innovation”. European
Foundation for the Improvement of Living and Working Conditions.
[6] Dortmund/Brussels Position Paper on Workplace Innovation (2012),12 iunie 2012.
[7] Eurofound (2009). „Working conditions in the European Union: Work Organisation”. Eurofound,
Dublin.
[8] Eurofound (2012). „Work organisation and innovation”. Eurofound, Dublin.
[9] Eurofound (2017) “Sixth European Working Conditions Survey (EWCS 2015)”, microdata.
[10] European Commission (2016) European Innovation Scoreboard 2016.
[11] Eurostat, OECD (2005). “Oslo manual: guidelines for collecting and interpreting innovation data”.
Paris: OECD.
[12] Gillwald, K. (2000). „Konzepte sozialer Innovation”. WZB Discussion paper. Internet:
http://bibliothek.wzb.eu/pdf/2000/p00-519.pdf.
[13] Holm, J., and Lorenz, E. (2013). “A Decline in the Quality of Jobs? A cross-sectional and longitudinal
study of work organisation in European nations”, The 8th European Meeting on Applied Evolutionary
Economics, June 10-12 2013, SKEMA Business School, Sophia Antipolis, France.
[14] Howaldt, J., and Schröder Antonius (2018). „The Growing Importance of Social Innovation” în
Howaldt, J., Schröder, A., Butzin, A., Rehfeld, D., (2018). „Towards a general theory and typology of
social innovation”.
[15] Lorenz, E., (2015). “Work Organisation, Forms of Employee Learning and Labour Market Structure:
Accounting for international differences in workplace innovation”, Journal of the Knowledge
Economy.
[16] Lorenz, E., and A. Valeyre (2005). “Organisational Innovation, HRM and Labour Market Structure: A
comparison of the EU-15”, Journal of Industrial Relations, pp. 424 - 442.
[17] OECD (2005). “Oslo manual: guidelines for collecting and interpreting innovation data”. Paris:
OECD.
[18] OECD (2017). „Science, Technology and Industry Scoreboard. The digital transformation”. Paris,
OECD Publishing.
[19] Oeij, P. R., Rus, D., and Pot, F. (2017). „Workplace innovation. Theory, Research and Practice”.
Springer International Publishing.
[20] Oeij, P., Dhondt, S., and van der Torre, W. (2017). „Linking practice fields of social innovations in
the domain of employment”.
[21] Oeij, P., Dhondt, S., Pot, F., and Totterdill, P. (2018). „Workplace innovation as an important driver
of social innovation”.
[22] Pot, F., Totterdill, P., and Dhondt, S. (2016). „Workplace innovation: European policy and theoretical
foundation.” World Review of Entrepreneurship, Management and Sustainable Development, Vol.
12(1), pp. 13 – 32.
[23] Viton, P. (2010). „Notes on Spatial Econometric Models”. City and Regional Planning, Ohio State
870.03, pp. 1 – 23.
Databases
[24] European Foundation for the Improvement of Living and Working Conditions. (2017). European
Working Conditions Survey, 2015. [data collection]. 4th Edition. UK Data Service. SN: 8098,
http://doi.org/10.5255/UKDA-SN-8098-4.
178