27
Fourth Quarter Investor Presentation December 2017 LISTED CORR NYSE
Fourth Quarter 2017 Investor Presentation | 1
Fourth Quarter Investor Presentation
December 2017
LISTED
CORR
NYSE
Fourth Quarter 2017 Investor Presentation | 2
Disclaimer
This presentation contains certain statements that may include "forward-looking
statements" within the meaning of Section 27A of the Securities Act of 1933 and Section
21E of the Securities Exchange Act of 1934. All statements, other than statements of
historical fact, included herein are "forward-looking statements."
Although CorEnergy believes that the expectations reflected in these forward-looking
statements are reasonable, they do involve assumptions, risks and uncertainties, and these
expectations may prove to be incorrect. Actual results could differ materially from those
anticipated in these forward-looking statements as a result of a variety of factors, including
those discussed in CorEnergy’s reports that are filed with the Securities and Exchange
Commission. You should not place undue reliance on these forward-looking statements,
which speak only as of the date of this presentation.
Other than as required by law, CorEnergy does not assume a duty to update any forward-
looking statement. In particular, any distribution paid in the future to our stockholders will
depend on the actual performance of CorEnergy, its costs of leverage and other operating
expenses and will be subject to the approval of CorEnergy’s Board of Directors and
compliance with leverage covenants.

Fourth Quarter 2017 Investor Presentation | 3
Becky SandringSenior Vice President, Secretary & Treasurer
Ms. Sandring has over 20 years of experience in the energy
industry. Prior to CorEnergy, Ms. Sandring was a Vice
President with The Calvin Group. From 1993-2008, Ms.
Sandring held various roles at Aquila Inc., formerly UtiliCorp
United.
CorEnergy Senior ManagementDave SchulteCo-Founder, CEO & PresidentMr. Schulte has 27 years of investment experience, including
18 years in the energy industry. Previously, Mr. Schulte was a
co-founder and Managing Director of Tortoise Capital Advisors,
an investment advisor with $16 billion under management. and
a Managing Director at Kansas City Equity Partners (KCEP).
Before joining KCEP, he spent five years as an investment
banker at the predecessor of Oppenheimer & Co.
Rick GreenCo-Founder, Executive Chairman
Mr. Green has spent more than 30 years in the energy
industry, with 20 years as CEO of Aquila, Inc., an
international electric and gas utility business and national
energy marketing and trading business. During his tenure,
Mr. Green led the strategy and successful business
expansion of Aquila, Inc. to a Fortune 30 company.
Jeff FulmerSenior Vice PresidentMr. Fulmer is a petroleum engineer and professional geologist
with more than 30 years of energy industry experience. Prior
to joining CorEnergy, Mr. Fulmer spent six years as a Senior
Advisor with Tortoise Capital Advisors, led a post 9/11 critical
infrastructure team for the U.S. Department of Defense, and
held leadership and technical positions with Statoil Energy,
ARCO Oil and Tenneco Oil Exploration and Production.
Rick KreulPresident, MoGas, LLC & MoWood, LLCMr. Kreul, a mechanical engineer with more than 35 years of
energy industry experience, serves as President of
CorEnergy’s wholly-owned subsidiaries, MoWood, LLC and
MoGas Pipeline, LLC. Previously, Mr. Kreul served as Vice
President of Energy Delivery for Aquila, Inc., Vice President
for Inergy, L.P., and various engineering and management
roles with Mobil Oil.
Nate PoundstoneChief Accounting Officer
Mr. Poundstone has nearly 20 years of experience in the
accounting profession. Prior to joining CorEnergy, Mr.
Poundstone was Vice President and Chief Accounting
officer with CVR Energy, a diversified holding company
primarily engaged in the petroleum refining and nitrogen
fertilizer manufacturing industries. Prior to CVR Energy, he
held various audit and professional practice roles as a senior
manager with KPMG LLP.
Jeff TeevenVice President, FinanceMr. Teeven has more than 20 years of experience in private
equity management and mergers and acquisitions in multiple
sectors including energy. He served as a founding partner of
Consumer Growth Partners, a private equity firm focused on
the specialty retail and branded consumer products sectors,
as well as 10 years with Kansas City Equity Partners (KCEP).
Sean DeGonVice President
Mr. DeGon is a chemical engineer with nearly 20 years of
energy industry experience. Prior to joining CorEnergy in
2017, Mr. DeGon was a Director at IHS Markit where he led
and participated in well over 100 consulting projects focused
on liquid storage terminals, pipelines, refineries, processing
facilities and other energy assets, primarily in the U.S. and
the rest of the Americas.
Fourth Quarter 2017 Investor Presentation | 4
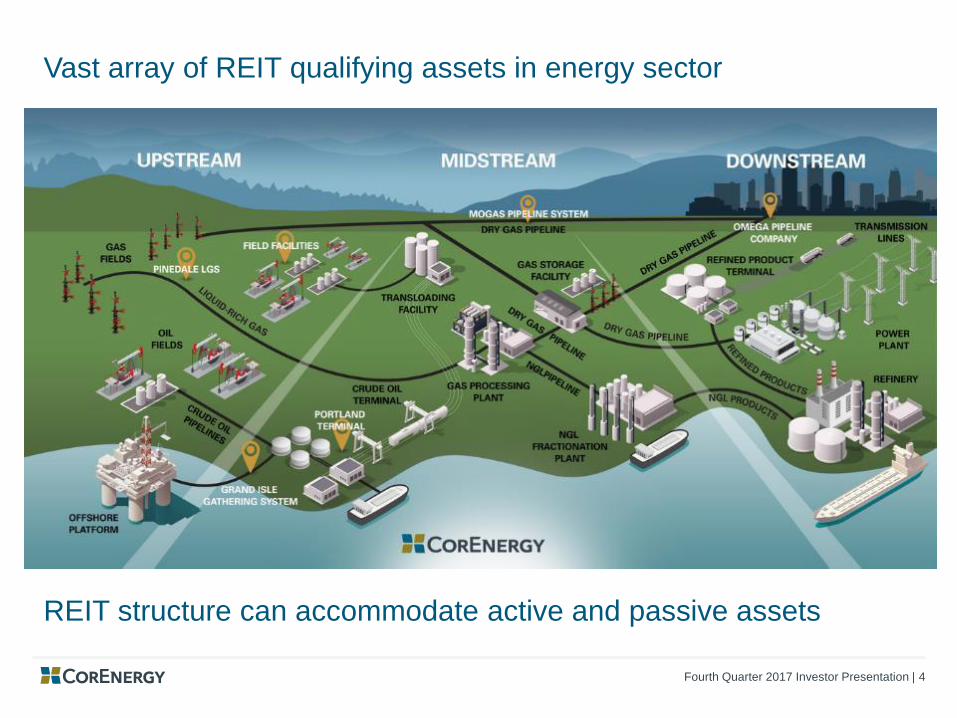
Vast array of REIT qualifying assets in energy sector
REIT structure can accommodate active and passive assets
Fourth Quarter 2017 Investor Presentation | 5
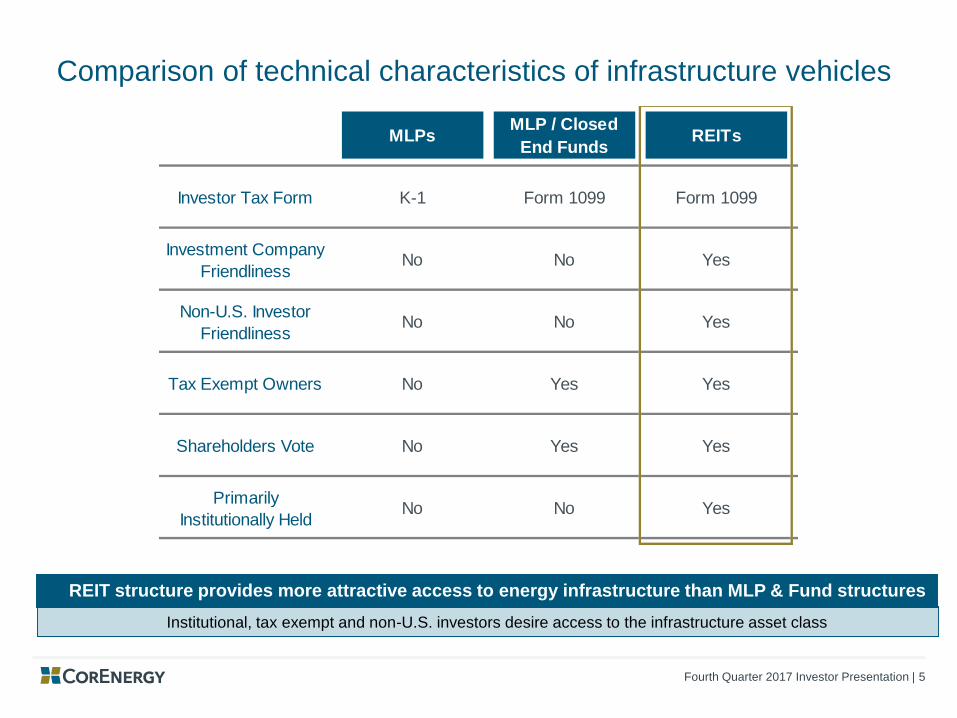
Comparison of technical characteristics of infrastructure vehicles
Institutional, tax exempt and non-U.S. investors desire access to the infrastructure asset class
REIT structure provides more attractive access to energy infrastructure than MLP & Fund structures
MLPsMLP / Closed
End FundsREITs
Investor Tax Form K-1 Form 1099 Form 1099
Investment Company
FriendlinessNo No Yes
Non-U.S. Investor
FriendlinessNo No Yes
Tax Exempt Owners No Yes Yes
Shareholders Vote No Yes Yes
Primarily
Institutionally HeldNo No Yes
Fourth Quarter 2017 Investor Presentation | 6
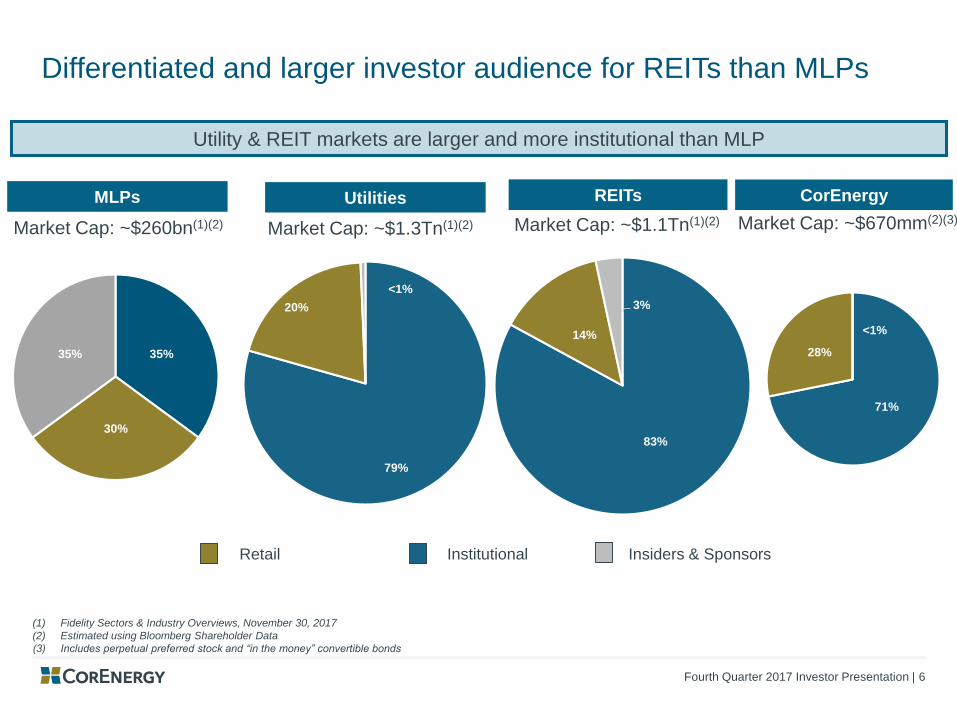
Differentiated and larger investor audience for REITs than MLPs
(1) Fidelity Sectors & Industry Overviews, November 30, 2017
(2) Estimated using Bloomberg Shareholder Data
(3) Includes perpetual preferred stock and “in the money” convertible bonds
Utility & REIT markets are larger and more institutional than MLP
Market Cap: ~$1.1Tn(1)(2)Market Cap: ~$1.3Tn(1)(2)
REITs
Market Cap: ~$260bn(1)(2)
MLPs Utilities
Retail Institutional Insiders & Sponsors
Market Cap: ~$670mm(2)(3)
71%
28%
CorEnergy
<1%
31%35%
<1%
79%
20%
<1%
83%
14%
3%
35%
30%
35%
Fourth Quarter 2017 Investor Presentation | 7
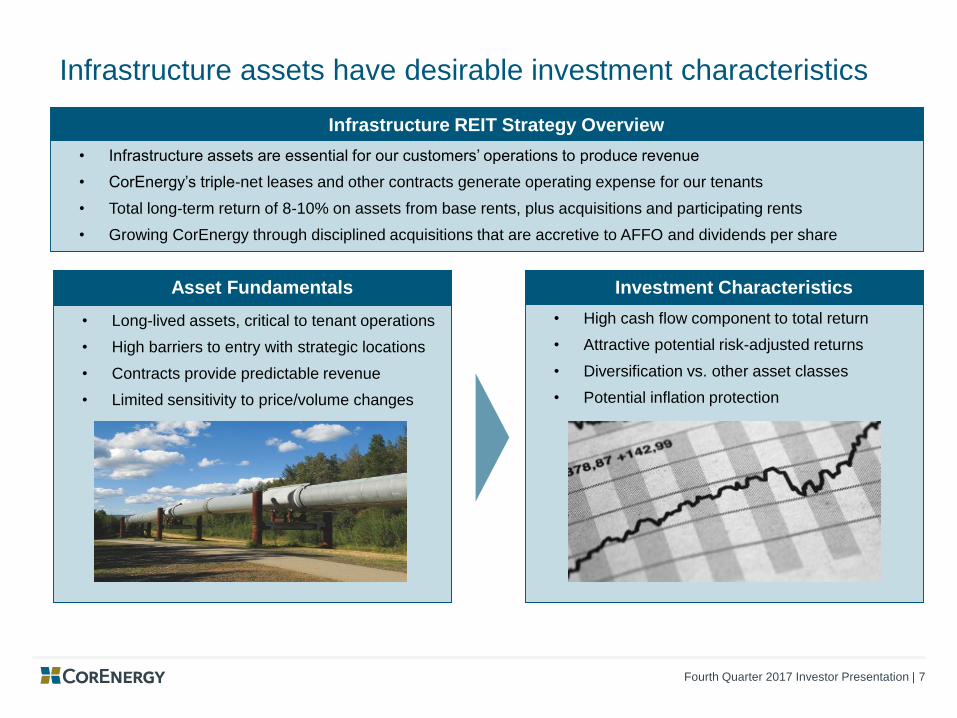
Infrastructure assets have desirable investment characteristics
• Long-lived assets, critical to tenant operations
• High barriers to entry with strategic locations
• Contracts provide predictable revenue
• Limited sensitivity to price/volume changes
Asset Fundamentals
• High cash flow component to total return
• Attractive potential risk-adjusted returns
• Diversification vs. other asset classes
• Potential inflation protection
Investment Characteristics
• Infrastructure assets are essential for our customers’ operations to produce revenue
• CorEnergy’s triple-net leases and other contracts generate operating expense for our tenants
• Total long-term return of 8-10% on assets from base rents, plus acquisitions and participating rents
• Growing CorEnergy through disciplined acquisitions that are accretive to AFFO and dividends per share
Infrastructure REIT Strategy Overview
Fourth Quarter 2017 Investor Presentation | 8
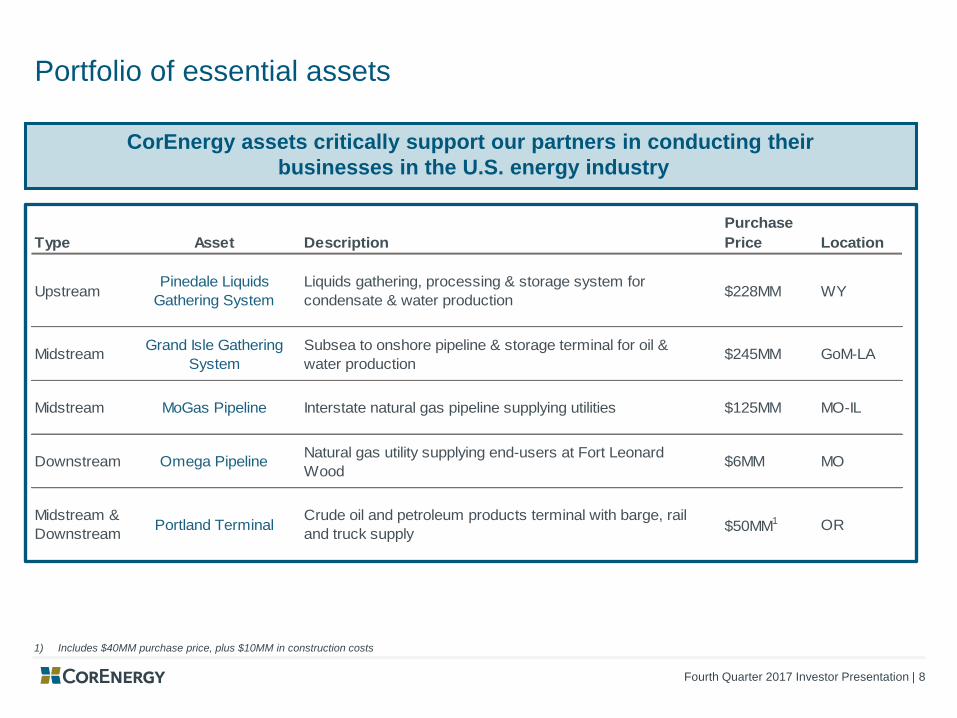
Portfolio of essential assets
CorEnergy assets critically support our partners in conducting their
businesses in the U.S. energy industry
Type Asset Description
Purchase
Price Location
UpstreamPinedale Liquids
Gathering System
Liquids gathering, processing & storage system for
condensate & water production$228MM WY
MidstreamGrand Isle Gathering
System
Subsea to onshore pipeline & storage terminal for oil &
water production$245MM GoM-LA
Midstream MoGas Pipeline Interstate natural gas pipeline supplying utilities $125MM MO-IL
Downstream Omega PipelineNatural gas utility supplying end-users at Fort Leonard
Wood$6MM MO
Midstream &
DownstreamPortland Terminal
Crude oil and petroleum products terminal with barge, rail
and truck supply$50MM1 OR
1) Includes $40MM purchase price, plus $10MM in construction costs
Fourth Quarter 2017 Investor Presentation | 9
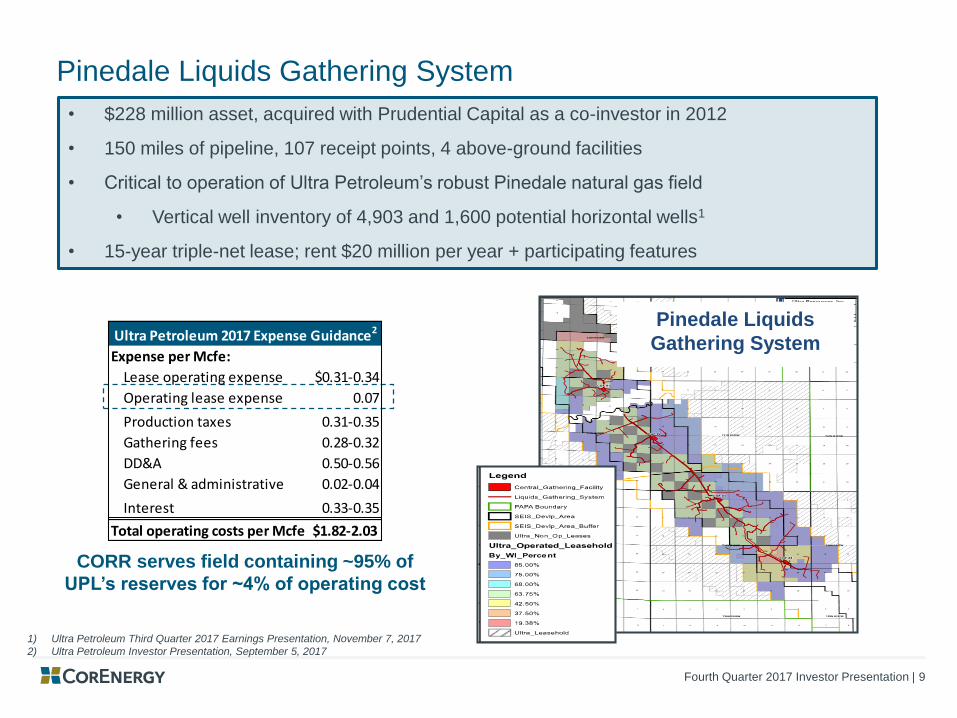
Pinedale Liquids Gathering System
• $228 million asset, acquired with Prudential Capital as a co-investor in 2012
• 150 miles of pipeline, 107 receipt points, 4 above-ground facilities
• Critical to operation of Ultra Petroleum’s robust Pinedale natural gas field
• Vertical well inventory of 4,903 and 1,600 potential horizontal wells1
• 15-year triple-net lease; rent $20 million per year + participating features
Pinedale Liquids
Gathering System
CORR serves field containing ~95% of
UPL’s reserves for ~4% of operating cost
1) Ultra Petroleum Third Quarter 2017 Earnings Presentation, November 7, 2017
2) Ultra Petroleum Investor Presentation, September 5, 2017
Expense per Mcfe:
Lease operating expense $0.31-0.34
Operating lease expense 0.07
Production taxes 0.31-0.35
Gathering fees 0.28-0.32
DD&A 0.50-0.56
General & administrative 0.02-0.04
Interest 0.33-0.35
Total operating costs per Mcfe $1.82-2.03
Ultra Petroleum 2017 Expense Guidance2
Fourth Quarter 2017 Investor Presentation | 10
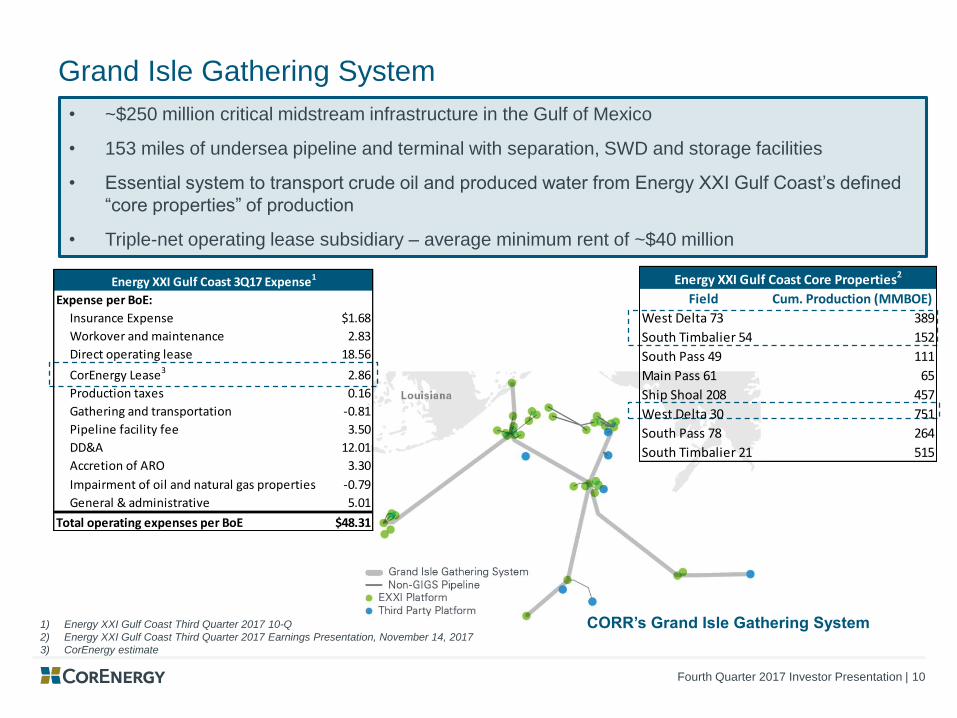
Grand Isle Gathering System
• ~$250 million critical midstream infrastructure in the Gulf of Mexico
• 153 miles of undersea pipeline and terminal with separation, SWD and storage facilities
• Essential system to transport crude oil and produced water from Energy XXI Gulf Coast’s defined
“core properties” of production
• Triple-net operating lease subsidiary – average minimum rent of ~$40 million
1) Energy XXI Gulf Coast Third Quarter 2017 10-Q
2) Energy XXI Gulf Coast Third Quarter 2017 Earnings Presentation, November 14, 2017
3) CorEnergy estimate
CORR’s Grand Isle Gathering System
Field Cum. Production (MMBOE)
West Delta 73 389
South Timbalier 54 152
South Pass 49 111
Main Pass 61 65
Ship Shoal 208 457
West Delta 30 751
South Pass 78 264
South Timbalier 21 515
Energy XXI Gulf Coast Core Properties2
Expense per BoE:
Insurance Expense $1.68
Workover and maintenance 2.83
Direct operating lease 18.56
CorEnergy Lease3 2.86
Production taxes 0.16
Gathering and transportation -0.81
Pipeline facility fee 3.50
DD&A 12.01
Accretion of ARO 3.30
Impairment of oil and natural gas properties -0.79
General & administrative 5.01
Total operating expenses per BoE $48.31
Energy XXI Gulf Coast 3Q17 Expense1
Fourth Quarter 2017 Investor Presentation | 11
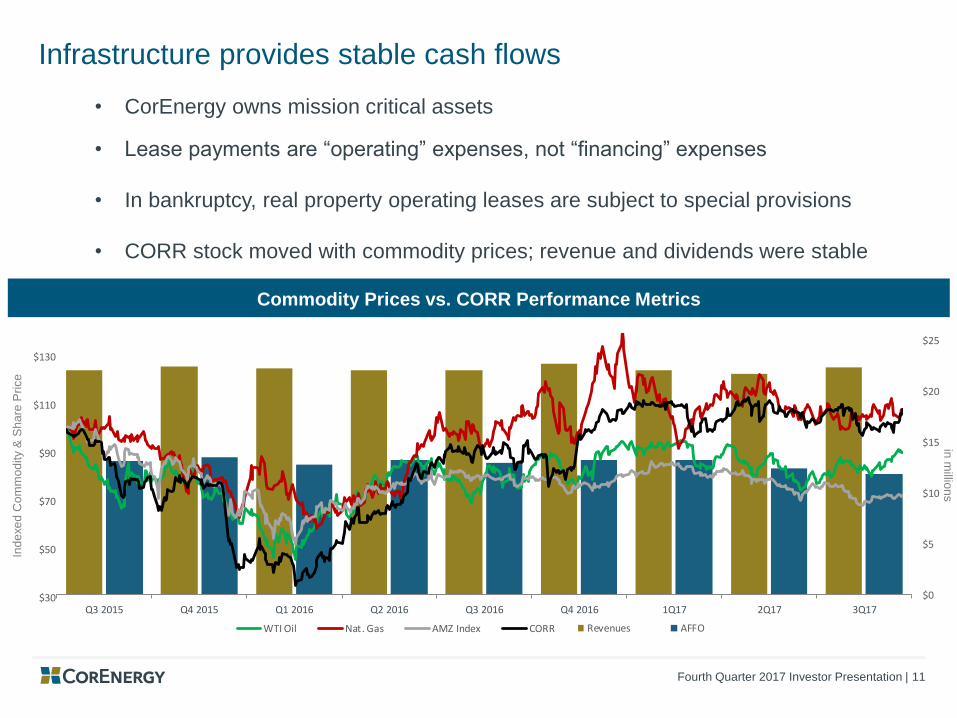
Infrastructure provides stable cash flows
• CorEnergy owns mission critical assets
• Lease payments are “operating” expenses, not “financing” expenses
• In bankruptcy, real property operating leases are subject to special provisions
• CORR stock moved with commodity prices; revenue and dividends were stable
Commodity Prices vs. CORR Performance Metrics
in m
illion
sIn
de
xe
d C
om
mo
dity &
Sh
are
Pri
ce
Q3 2015 Q4 2015 Q1 2016 Q2 2016 Q3 2016 Q4 2016 1Q17 2Q17 3Q17
$0
$5
$10
$15
$20
$25
Revenues AFFO
$30
$50
$70
$90
$110
$130
WTI Oil Nat. Gas AMZ Index CORR
Fourth Quarter 2017 Investor Presentation | 12
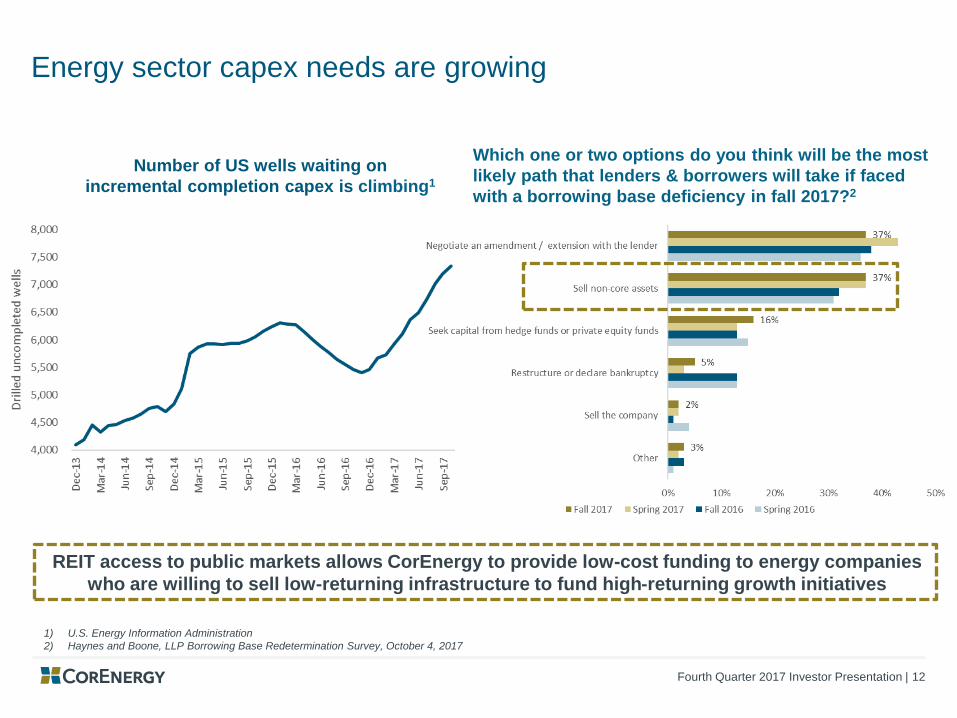
Energy sector capex needs are growing
1) U.S. Energy Information Administration
2) Haynes and Boone, LLP Borrowing Base Redetermination Survey, October 4, 2017
Number of US wells waiting on
incremental completion capex is climbing1
REIT access to public markets allows CorEnergy to provide low-cost funding to energy companies
who are willing to sell low-returning infrastructure to fund high-returning growth initiatives
Which one or two options do you think will be the most
likely path that lenders & borrowers will take if faced
with a borrowing base deficiency in fall 2017?2
Fourth Quarter 2017 Investor Presentation | 13
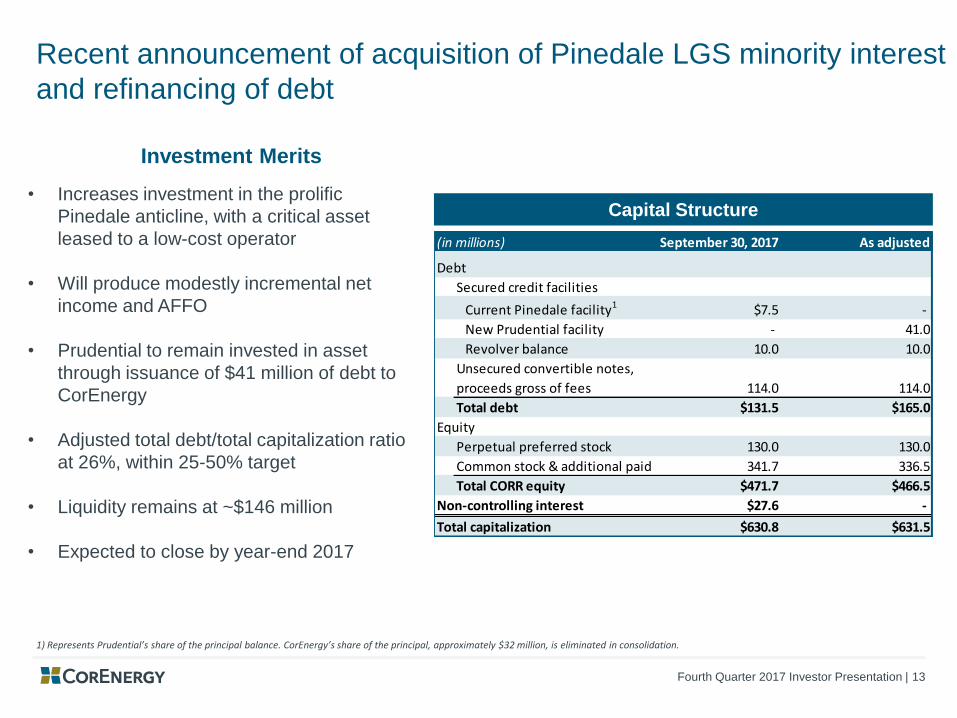
Recent announcement of acquisition of Pinedale LGS minority interest
and refinancing of debt
Capital Structure
Investment Merits
• Increases investment in the prolific
Pinedale anticline, with a critical asset
leased to a low-cost operator
• Will produce modestly incremental net
income and AFFO
• Prudential to remain invested in asset
through issuance of $41 million of debt to
CorEnergy
• Adjusted total debt/total capitalization ratio
at 26%, within 25-50% target
• Liquidity remains at ~$146 million
• Expected to close by year-end 2017
1) Represents Prudential’s share of the principal balance. CorEnergy’s share of the principal, approximately $32 million, is eliminated in consolidation.
(in millions) September 30, 2017 As adjusted
Debt
Secured credit facilities
Current Pinedale facility1 $7.5 -
New Prudential facility - 41.0
Revolver balance 10.0 10.0
Unsecured convertible notes,
proceeds gross of fees 114.0 114.0
Total debt $131.5 $165.0
Equity
Perpetual preferred stock 130.0 130.0
Common stock & additional paid in capital 341.7 336.5
Total CORR equity $471.7 $466.5
Non-controlling interest $27.6 -
Total capitalization $630.8 $631.5
Fourth Quarter 2017 Investor Presentation | 14
Durable revenues + low leverage = dividend stability
• Lease payments produce predictable cash flows
• Assets are critical to tenant revenue production
• Lease expense is an operating cost (not a financing cost)
• Lease payments are made during bankruptcy
• Results in utility-like consistency of revenue for CORR
• Conservative leverage profile & multiple capital sources
• We believe the $3.00 annualized dividend is a sustainable payout
• Dividend is based solely on minimum rents
• CorEnergy retains debt repayment and reinvestment capital prior to
dividend payment
• Upside from portfolio growth and participating rents
Energy REIT provided a new business model in 2012:
Investor friendly access to infrastructure assets
Fourth Quarter 2017 Investor Presentation | 15
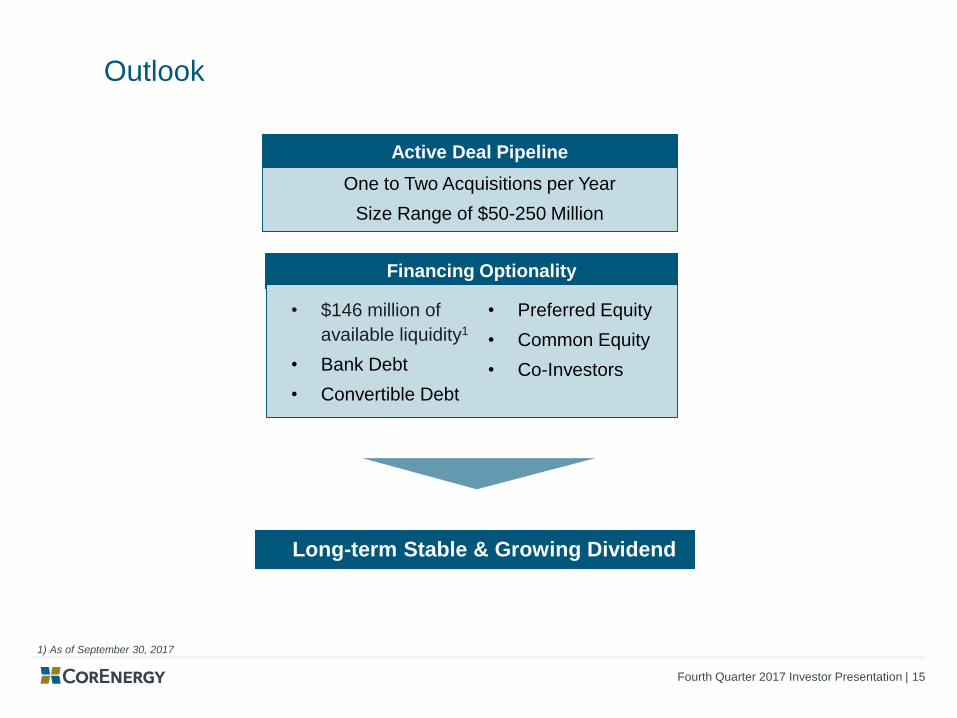
Financing Optionality
Outlook
One to Two Acquisitions per Year
Size Range of $50-250 Million
Active Deal Pipeline
1) As of September 30, 2017
Long-term Stable & Growing Dividend
• $146 million of
available liquidity1
• Bank Debt
• Convertible Debt
• Preferred Equity
• Common Equity
• Co-Investors
Fourth Quarter 2017 Investor Presentation | 16
APPENDIX
Fourth Quarter 2017 Investor Presentation | 17
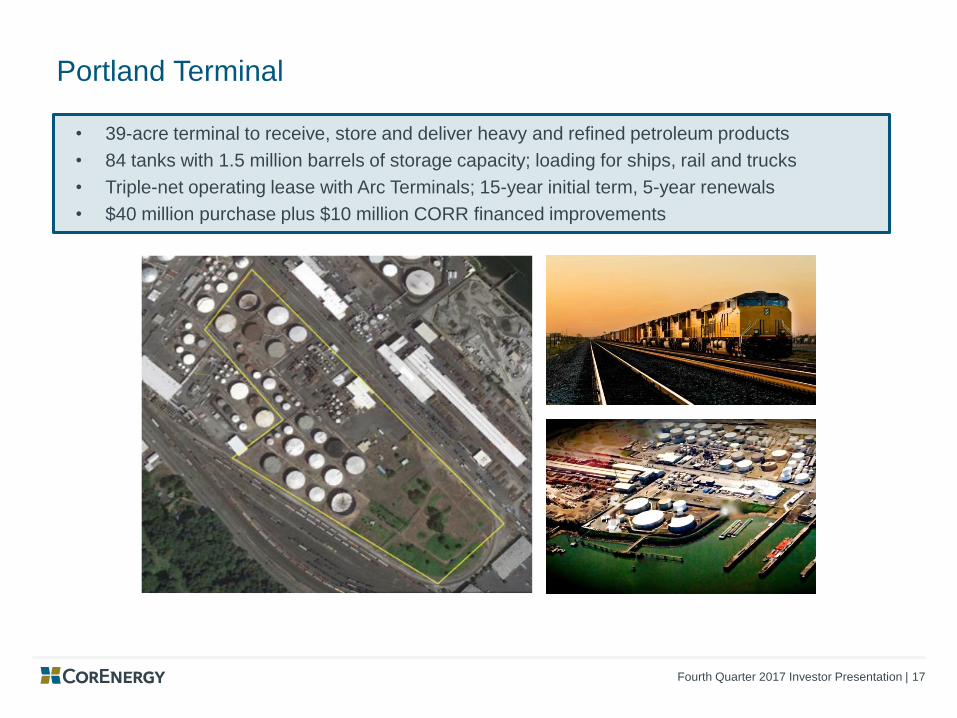
Portland Terminal
• 39-acre terminal to receive, store and deliver heavy and refined petroleum products
• 84 tanks with 1.5 million barrels of storage capacity; loading for ships, rail and trucks
• Triple-net operating lease with Arc Terminals; 15-year initial term, 5-year renewals
• $40 million purchase plus $10 million CORR financed improvements
Fourth Quarter 2017 Investor Presentation | 18
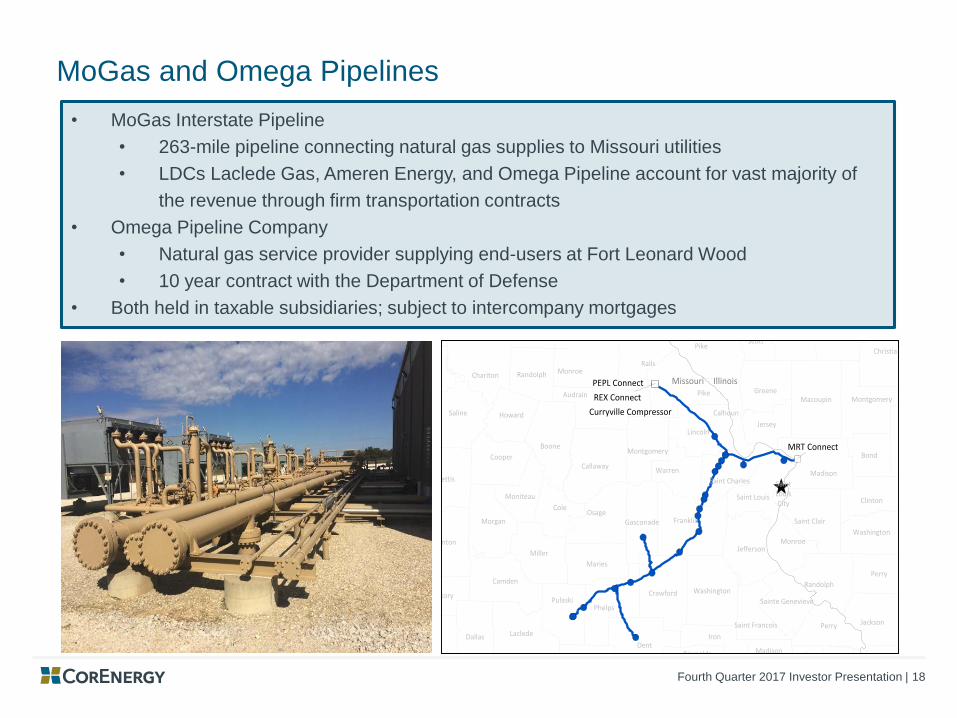
MoGas and Omega Pipelines
• MoGas Interstate Pipeline
• 263-mile pipeline connecting natural gas supplies to Missouri utilities
• LDCs Laclede Gas, Ameren Energy, and Omega Pipeline account for vast majority of
the revenue through firm transportation contracts
• Omega Pipeline Company
• Natural gas service provider supplying end-users at Fort Leonard Wood
• 10 year contract with the Department of Defense
• Both held in taxable subsidiaries; subject to intercompany mortgages
600188_1.wor (NY00813G)
Pike
Calhoun
Lincoln
Audrain
Monroe
Laclede
Pulaski
Madison
SaintLouisCity
Saint Charles
Saint Louis
Chariton
Moniteau
Warren
Franklin
Phelps
BollingerCape GirardeauMadison
Saint Francois
TexasReynolds
Iron
IllinoisMissouri
Curryville Compressor
REX Connect
PEPL Connect
MRT Connect
Alexander
Bond
Christian
Clinton
Fayette
Franklin
Greene
Jackson
Jefferson
Jersey
Macon
Macoupin
Marion
Monroe
Montgomery
Morgan
Perry
Pike
Pulaski
Randolph
Saint Clair
Sangamon
Scott
Shelby
Union
Washington
Williamson
Benton
Boone
Callaway
Camden
Carroll
Cole
Cooper
Crawford
DallasDent
Gasconade
Greene
Hickory
Howard
Jefferson
Linn
LivingstonMacon
Maries
Marion
Miller
Montgomery
MorganOsage
Perry
Pettis
Polk
Ralls
Randolph
Sainte Genevieve
Saline
Shannon
Shelby
Washington
Wayne
Webster Wright
Fourth Quarter 2017 Investor Presentation | 19
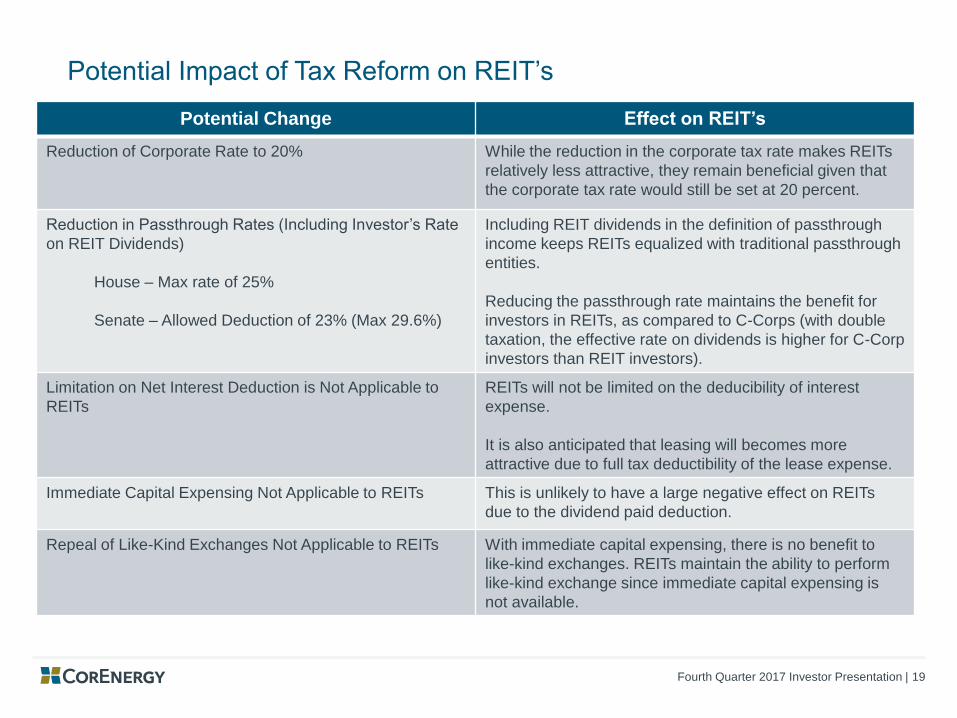
Potential Impact of Tax Reform on REIT’s
Potential Change Effect on REIT’s
Reduction of Corporate Rate to 20% While the reduction in the corporate tax rate makes REITs
relatively less attractive, they remain beneficial given that
the corporate tax rate would still be set at 20 percent.
Reduction in Passthrough Rates (Including Investor’s Rate
on REIT Dividends)
House – Max rate of 25%
Senate – Allowed Deduction of 23% (Max 29.6%)
Including REIT dividends in the definition of passthrough
income keeps REITs equalized with traditional passthrough
entities.
Reducing the passthrough rate maintains the benefit for
investors in REITs, as compared to C-Corps (with double
taxation, the effective rate on dividends is higher for C-Corp
investors than REIT investors).
Limitation on Net Interest Deduction is Not Applicable to
REITs
REITs will not be limited on the deducibility of interest
expense.
It is also anticipated that leasing will becomes more
attractive due to full tax deductibility of the lease expense.
Immediate Capital Expensing Not Applicable to REITs This is unlikely to have a large negative effect on REITs
due to the dividend paid deduction.
Repeal of Like-Kind Exchanges Not Applicable to REITs With immediate capital expensing, there is no benefit to
like-kind exchanges. REITs maintain the ability to perform
like-kind exchange since immediate capital expensing is
not available.
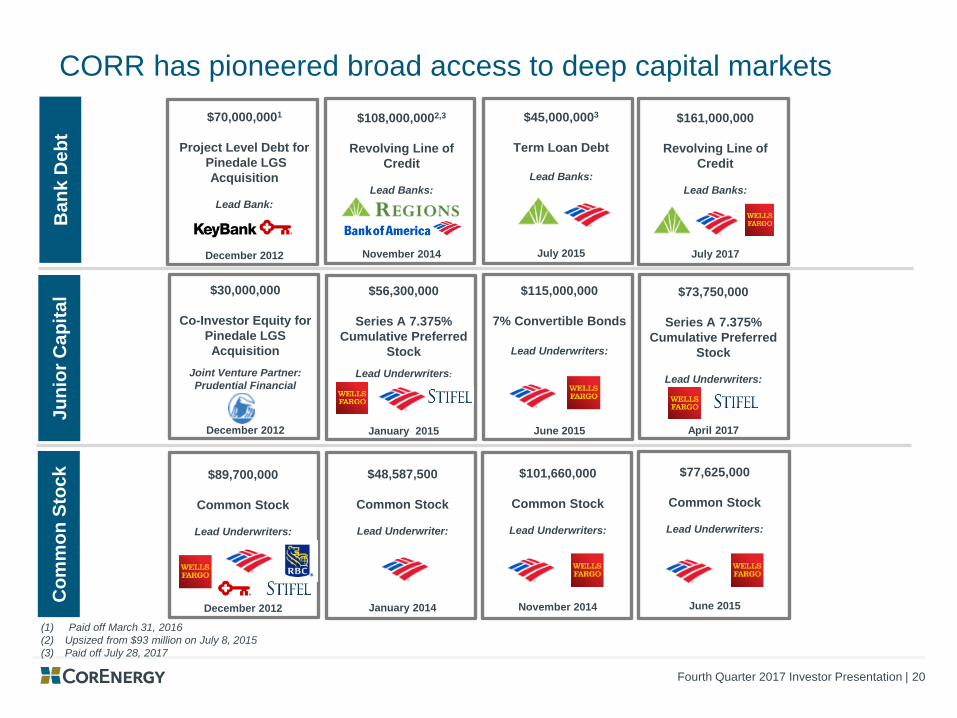
Fourth Quarter 2017 Investor Presentation | 20
(1) Paid off March 31, 2016
(2) Upsized from $93 million on July 8, 2015
(3) Paid off July 28, 2017
CORR has pioneered broad access to deep capital marketsC
om
mo
n S
toc
kB
an
k D
eb
t
$30,000,000
Co-Investor Equity for
Pinedale LGS
Acquisition
Joint Venture Partner:
Prudential Financial
December 2012
$70,000,0001
Project Level Debt for
Pinedale LGS
Acquisition
Lead Bank:
December 2012
Ju
nio
r C
ap
ita
l
$101,660,000
Common Stock
Lead Underwriters:
November 2014
$108,000,0002,3
Revolving Line of
Credit
Lead Banks:
November 2014
$45,000,0003
Term Loan Debt
Lead Banks:
July 2015
$115,000,000
7% Convertible Bonds
Lead Underwriters:
June 2015
$89,700,000
Common Stock
Lead Underwriters:
December 2012
$77,625,000
Common Stock
Lead Underwriters:
June 2015
$48,587,500
Common Stock
Lead Underwriter:
January 2014
$56,300,000
Series A 7.375%
Cumulative Preferred
Stock
Lead Underwriters:
January 2015
$73,750,000
Series A 7.375%
Cumulative Preferred
Stock
Lead Underwriters:
April 2017
$161,000,000
Revolving Line of
Credit
Lead Banks:
July 2017
Fourth Quarter 2017 Investor Presentation | 21
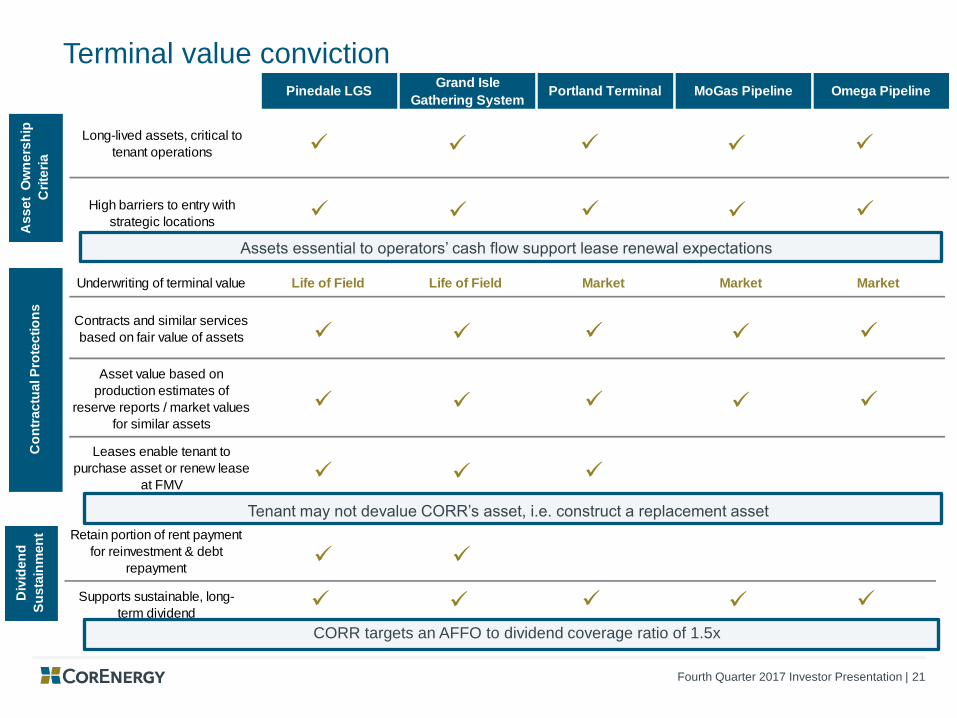
Terminal value convictionPinedale LGS
Grand Isle
Gathering SystemPortland Terminal MoGas Pipeline Omega Pipeline
Long-lived assets, critical to
tenant operations
High barriers to entry with
strategic locations
As
se
t O
wn
ers
hip
Cri
teri
a
✓ ✓✓ ✓ ✓
✓ ✓✓ ✓ ✓
Assets essential to operators’ cash flow support lease renewal expectations
Tenant may not devalue CORR’s asset, i.e. construct a replacement asset
CORR targets an AFFO to dividend coverage ratio of 1.5x
✓ ✓✓ ✓ ✓
✓ ✓✓ ✓ ✓
✓ ✓ ✓
Underwriting of terminal value Life of Field Life of Field Market Market Market
Contracts and similar services
based on fair value of assets
Asset value based on
production estimates of
reserve reports / market values
for similar assets
Leases enable tenant to
purchase asset or renew lease
at FMV
Co
ntr
ac
tua
l P
rote
cti
on
s
✓ ✓
✓ ✓✓ ✓ ✓
Retain portion of rent payment
for reinvestment & debt
repayment
Supports sustainable, long-
term dividend
Div
iden
d
Su
sta
inm
en
t
Fourth Quarter 2017 Investor Presentation | 22
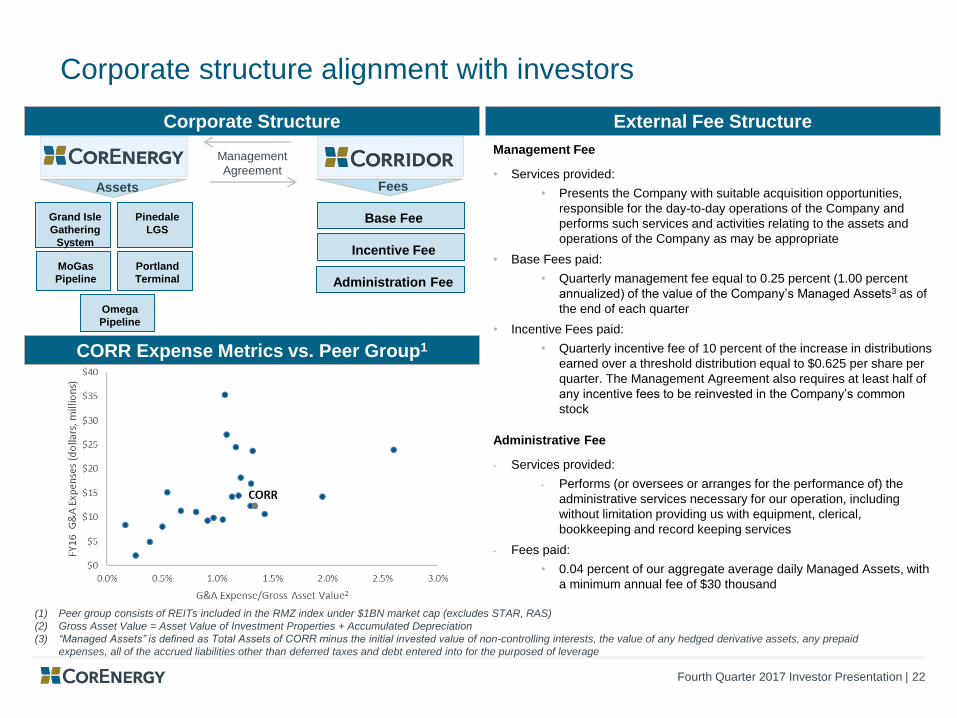
Corporate structure alignment with investors
CORR Expense Metrics vs. Peer Group1
Base Fee
Incentive Fee
Administration Fee
Grand Isle
Gathering
System
Pinedale
LGS
MoGas
Pipeline
Portland
Terminal
Omega
Pipeline
Assets Fees
Management Fee
• Services provided:
• Presents the Company with suitable acquisition opportunities,
responsible for the day-to-day operations of the Company and
performs such services and activities relating to the assets and
operations of the Company as may be appropriate
• Base Fees paid:
• Quarterly management fee equal to 0.25 percent (1.00 percent
annualized) of the value of the Company’s Managed Assets3 as of
the end of each quarter
• Incentive Fees paid:
• Quarterly incentive fee of 10 percent of the increase in distributions
earned over a threshold distribution equal to $0.625 per share per
quarter. The Management Agreement also requires at least half of
any incentive fees to be reinvested in the Company’s common
stock
Administrative Fee
• Services provided:
• Performs (or oversees or arranges for the performance of) the
administrative services necessary for our operation, including
without limitation providing us with equipment, clerical,
bookkeeping and record keeping services
• Fees paid:
• 0.04 percent of our aggregate average daily Managed Assets, with
a minimum annual fee of $30 thousand
External Fee Structure Corporate Structure
Management
Agreement
(1) Peer group consists of REITs included in the RMZ index under $1BN market cap (excludes STAR, RAS)
(2) Gross Asset Value = Asset Value of Investment Properties + Accumulated Depreciation
(3) “Managed Assets” is defined as Total Assets of CORR minus the initial invested value of non-controlling interests, the value of any hedged derivative assets, any prepaid
expenses, all of the accrued liabilities other than deferred taxes and debt entered into for the purposed of leverage
Fourth Quarter 2017 Investor Presentation | 23
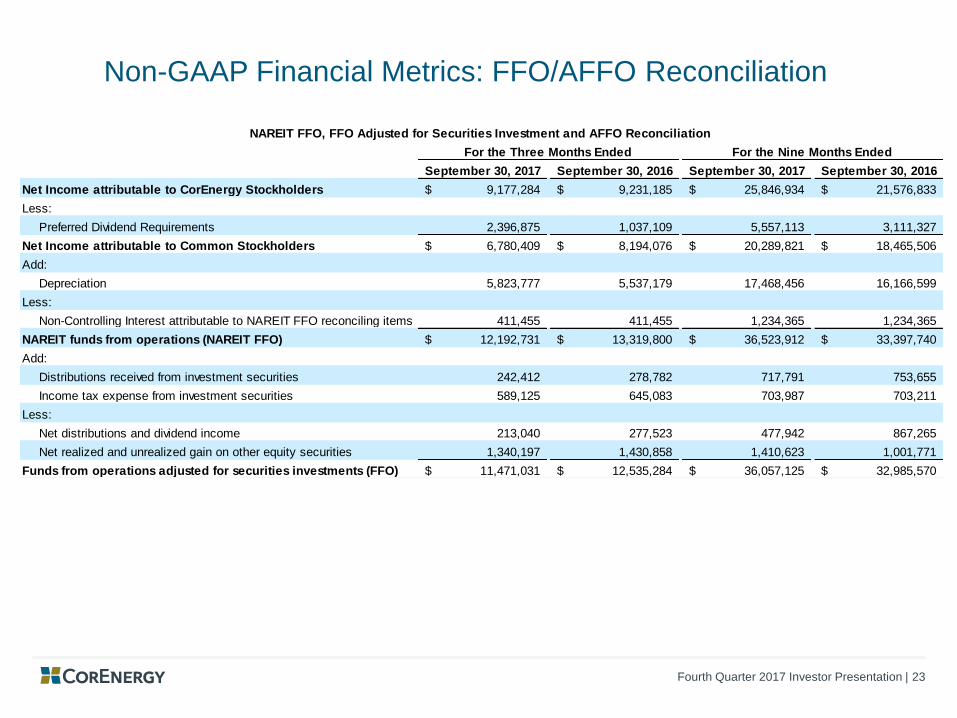
Non-GAAP Financial Metrics: FFO/AFFO Reconciliation
September 30, 2017 September 30, 2016 September 30, 2017 September 30, 2016
Net Income attributable to CorEnergy Stockholders 9,177,284$ 9,231,185$ 25,846,934$ 21,576,833$
Less:
Preferred Dividend Requirements 2,396,875 1,037,109 5,557,113 3,111,327
Net Income attributable to Common Stockholders 6,780,409$ 8,194,076$ 20,289,821$ 18,465,506$
Add:
Depreciation 5,823,777 5,537,179 17,468,456 16,166,599
Less:
Non-Controlling Interest attributable to NAREIT FFO reconciling items 411,455 411,455 1,234,365 1,234,365
NAREIT funds from operations (NAREIT FFO) 12,192,731$ 13,319,800$ 36,523,912$ 33,397,740$
Add:
Distributions received from investment securities 242,412 278,782 717,791 753,655
Income tax expense from investment securities 589,125 645,083 703,987 703,211
Less:
Net distributions and dividend income 213,040 277,523 477,942 867,265
Net realized and unrealized gain on other equity securities 1,340,197 1,430,858 1,410,623 1,001,771
Funds from operations adjusted for securities investments (FFO) 11,471,031$ 12,535,284$ 36,057,125$ 32,985,570$
NAREIT FFO, FFO Adjusted for Securities Investment and AFFO Reconciliation
For the Three Months Ended For the Nine Months Ended
Fourth Quarter 2017 Investor Presentation | 24
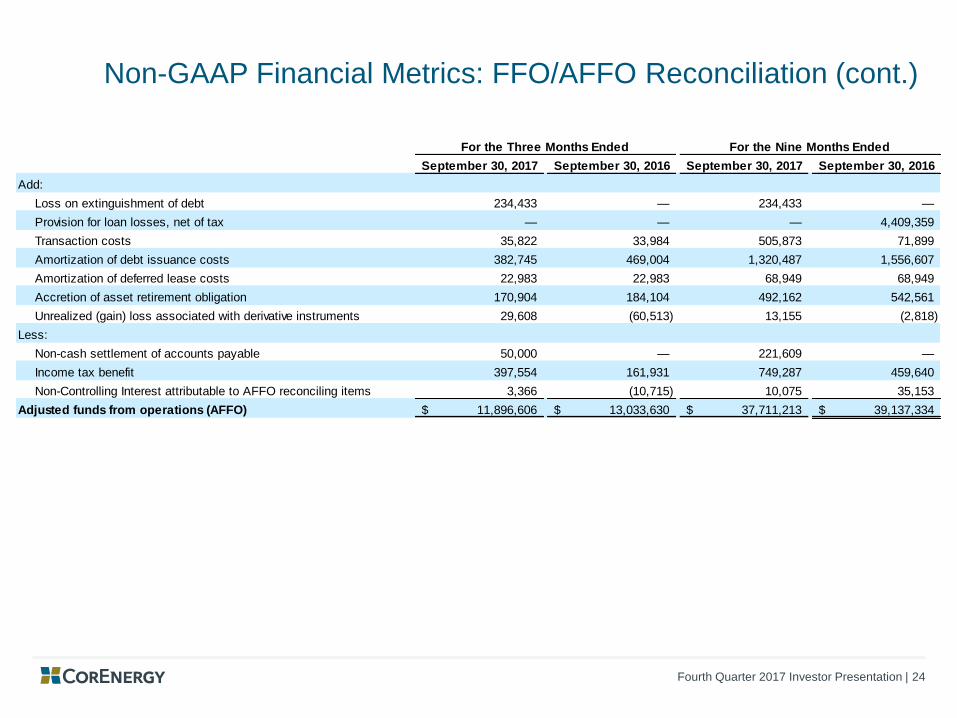
Non-GAAP Financial Metrics: FFO/AFFO Reconciliation (cont.)
September 30, 2017 September 30, 2016 September 30, 2017 September 30, 2016
Add:
Loss on extinguishment of debt 234,433 — 234,433 —
Provision for loan losses, net of tax — — — 4,409,359
Transaction costs 35,822 33,984 505,873 71,899
Amortization of debt issuance costs 382,745 469,004 1,320,487 1,556,607
Amortization of deferred lease costs 22,983 22,983 68,949 68,949
Accretion of asset retirement obligation 170,904 184,104 492,162 542,561
Unrealized (gain) loss associated with derivative instruments 29,608 (60,513) 13,155 (2,818)
Less:
Non-cash settlement of accounts payable 50,000 — 221,609 —
Income tax benefit 397,554 161,931 749,287 459,640
Non-Controlling Interest attributable to AFFO reconciling items 3,366 (10,715) 10,075 35,153
Adjusted funds from operations (AFFO) 11,896,606$ 13,033,630$ 37,711,213$ 39,137,334$
For the Three Months Ended For the Nine Months Ended
Fourth Quarter 2017 Investor Presentation | 25
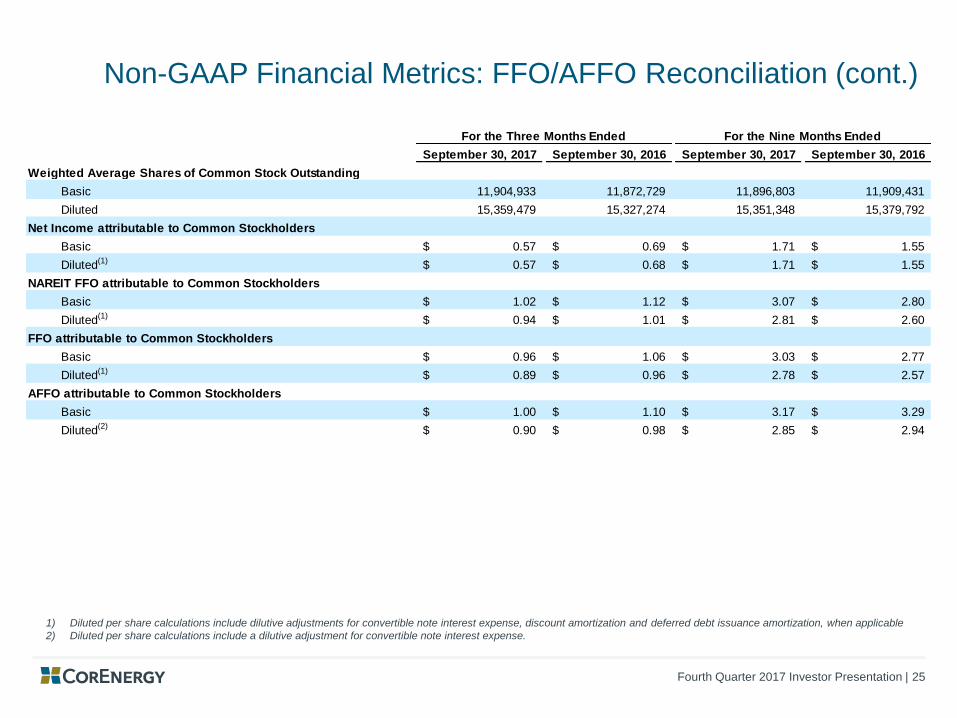
Non-GAAP Financial Metrics: FFO/AFFO Reconciliation (cont.)
1) Diluted per share calculations include dilutive adjustments for convertible note interest expense, discount amortization and deferred debt issuance amortization, when applicable
2) Diluted per share calculations include a dilutive adjustment for convertible note interest expense.
September 30, 2017 September 30, 2016 September 30, 2017 September 30, 2016
Weighted Average Shares of Common Stock Outstanding
Basic 11,904,933 11,872,729 11,896,803 11,909,431
Diluted 15,359,479 15,327,274 15,351,348 15,379,792
Net Income attributable to Common Stockholders
Basic 0.57$ 0.69$ 1.71$ 1.55$
Diluted(1) 0.57$ 0.68$ 1.71$ 1.55$
NAREIT FFO attributable to Common Stockholders
Basic 1.02$ 1.12$ 3.07$ 2.80$
Diluted(1) 0.94$ 1.01$ 2.81$ 2.60$
FFO attributable to Common Stockholders
Basic 0.96$ 1.06$ 3.03$ 2.77$
Diluted(1) 0.89$ 0.96$ 2.78$ 2.57$
AFFO attributable to Common Stockholders
Basic 1.00$ 1.10$ 3.17$ 3.29$
Diluted(2) 0.90$ 0.98$ 2.85$ 2.94$
For the Three Months Ended For the Nine Months Ended
Fourth Quarter 2017 Investor Presentation | 26
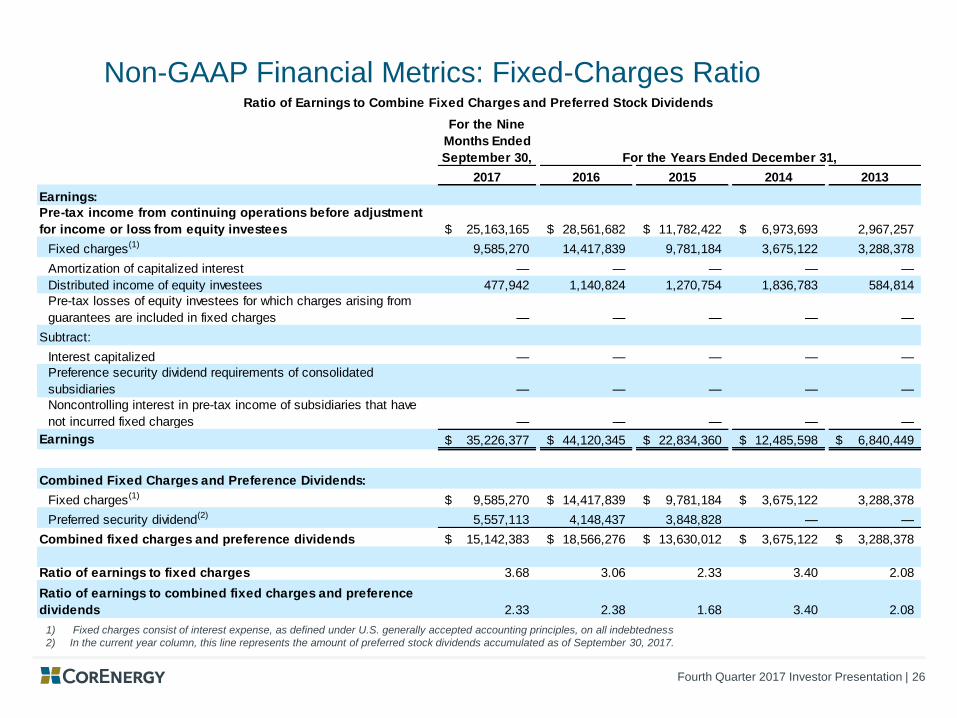
Non-GAAP Financial Metrics: Fixed-Charges Ratio
1) Fixed charges consist of interest expense, as defined under U.S. generally accepted accounting principles, on all indebtedness
2) In the current year column, this line represents the amount of preferred stock dividends accumulated as of September 30, 2017.
For the Nine
Months Ended
September 30,
2017 2016 2015 2014 2013
Earnings:
Pre-tax income from continuing operations before adjustment
for income or loss from equity investees 25,163,165$ 28,561,682$ 11,782,422$ 6,973,693$ 2,967,257
Fixed charges(1) 9,585,270 14,417,839 9,781,184 3,675,122 3,288,378
Amortization of capitalized interest — — — — —
Distributed income of equity investees 477,942 1,140,824 1,270,754 1,836,783 584,814
Pre-tax losses of equity investees for which charges arising from
guarantees are included in fixed charges — — — — —
Subtract:
Interest capitalized — — — — —
Preference security dividend requirements of consolidated
subsidiaries — — — — —
Noncontrolling interest in pre-tax income of subsidiaries that have
not incurred fixed charges — — — — —
Earnings 35,226,377$ 44,120,345$ 22,834,360$ 12,485,598$ 6,840,449$
Combined Fixed Charges and Preference Dividends:
Fixed charges(1) 9,585,270$ 14,417,839$ 9,781,184$ 3,675,122$ 3,288,378
Preferred security dividend(2) 5,557,113 4,148,437 3,848,828 — —
Combined fixed charges and preference dividends 15,142,383$ 18,566,276$ 13,630,012$ 3,675,122$ 3,288,378$
Ratio of earnings to fixed charges 3.68 3.06 2.33 3.40 2.08
Ratio of earnings to combined fixed charges and preference
dividends 2.33 2.38 1.68 3.40 2.08
Ratio of Earnings to Combine Fixed Charges and Preferred Stock Dividends
For the Years Ended December 31,
Fourth Quarter 2017 Investor Presentation | 27


