FOXY System Fiber Optic Oxygen Sensor System Operating Manual Version 1.61F Ocean Optics, Inc. 380 Main Street Dunedin, FL 34698 (727) 733-2447 (727) 733-3962 fax For the latest information, consult our web site: www.OceanOptics.com Or, e-mail our Technical Service Department: [email protected]030800
Transcript
FOXY SystemFiber Optic Oxygen Sensor System
Operating ManualVersion 1.61F
Ocean Optics, Inc.380 Main StreetDunedin, FL 34698(727) 733-2447(727) 733-3962 fax
For the latest information, consult our web site:www.OceanOptics.com
Software Directions............................................................................................................. 11Optimizing Signal to Noise.................................................................................................. 13Setting Integration Period ................................................................................................... 13Setting Signal Averaging .................................................................................................... 13Setting Optical Smoothing .................................................................................................. 14Oxygen Configuration Screen............................................................................................. 15Storing Reference Values................................................................................................... 16Viewing Windows ............................................................................................................... 16Viewing Time Series........................................................................................................... 16Saving Oxygen Values ....................................................................................................... 17
Appendix I: Useful values for oxygen analysis.............................................................. 18
Appendix II: Changing Base Address & IRQ on the ADC500...................................... 19
Appendix III: R-450 Blue LED Light Source.................................................................... 22
Appendix IV: Installation of SAD500 ................................................................................ 23
Technical Support ............................................................................................................... 25
Introduction
The FOXY Fiber Optic Sensor System is easy to setup and use. In most cases, your system can be up andrunning in a few minutes. If you need additional assistance, please refer to the S2000 operating manual, orcontact our Technical Services Department. The numbers and addresses are shown on the cover.
The FOXY system consists of several modular components, which together comprise an oxygen sensingsystem. There are several variations and configurations that will work. Please make sure that you have allof the required components. If you are not sure, call our technical service department. In general, thesystems consist of a spectrometer, and oxygen probe with fiber optics, and a blue LED excitation source.Item codes follow:
Spectrometers:The S2000-FL is configured for fluorescence in general and is ideal for oxygen sensing. It requires aseparate excitation source.S2000-FL S2000 fiber optic spectrometer for fluorescence, grating #3, 360 – 900nm, 200
µm slit, L2 lens. $2000.00
A/D Products:The S2000-FL will interface to a desktop computer using one of the following A/D systems: ADC500,ADC1000 or SAD500. The spectrometer can be used with a notebook computer using the serial interface ofthe SAD500. The SAD500 has a microprocessor which can be used to calculate O2 levels directly, for easyinterface to PLCs and other control equipment:ADC500 500 KHz 12 bit ISA bus A/D card. $499.00ADC1000 1 MHz 12 bit ISA bus A/D card. $599.00SAD500 500 KHz microprocessor A/D system in a stand-alone box. The SAD500-S is
stacked in the spectrometer box. The SAD500-R is in a 19” rack mountconfiguration. $699.00
The best system performance is achieved by the combination of a rack mounted blue LED (R-450) and thespectrometer in a single package called an SF2000. The SF2000 has a master spectrometer and cardmounted blue LED in an SD2000 enclosure. The LED uses an external power source but has internalconnections for synchronization with the S2000, and for on/off control through the software. An A/D card,oxygen probe, bifurcated fiber assembly and splice bushing are also required (FOXY-2).SF2000 S2000 fiber optic spectrometer for fluorescence, grating #3, 360 – 900nm, 200
µm slit, L2 lens, with integral R-450 card mounted blue LED pulsed source indual spectrometer enclosure. $2499.00
The card mounted Blue LED pulsed source can also be added to our line of rack mounted components. Therack-mounted spectrometers and accessories permit up to 8 spectrometers to be operated from a single A/Dboard. Full control of R-450 requires a J series or later version of the S2000.
Oxygen probes:The FOXY kit can be combined with any suitable spectrometer and A/D card to make a fiber optic sensingsystem. If you are buying the kit to add to an existing spectrometer, make sure that the spectrometer is setup to monitor low light levels.FOXY Fiber Optic Oxygen Kit for S2000-FL, consisting of one each of FOXY-R
probe, LS-450 pulsed blue LED, FOXY600-VIS/NIR cable assembly, 21-02Splice bushing, and OOIFOXY oxygen sensor software. $1499.00
FOXY-2 Fiber Optic Oxygen Kit for SF2000, consisting of one each of FOXY-R probe,FOXY600-VIS/NIR cable assembly, 21-02 Splice bushing, and OOIFOXYoxygen sensor software. $999.00
2
Oxygen sensors:FOXY-R Fiber Optic Oxygen Sensor on 1mm fiber in 1/16” SS ferule. $499.00FOXY-AL300 Fiber Optic Oxygen sensor on 300 micron Aluminum jacketed fiber. Requires
BIF200-VIS/NIR cable assembly. $499.00FOXY-PI600 Fiber Optic Oxygen Sensor on 600 micron Polyimide jacketed fiber. RequiresBIF-400-VIS/NIR cable assembly. $499.00FOXY-GF Glass fiber membranes for Oxygen, 5/pk. $50.00FOXY-RECOV Re-coating of probes. $100.00FOXY-SGS Glass cover slips for Oxygen, 5/pk. $200.00
Blue LEDs:LS-450 Blue LED pulsed source with cable for external connection to spectrometer.
$499.00R-450 Card mounted Blue LED pulsed source for mounting in spectrometer enclosure
or19” rack system. $499.00
Other Items:FOXY600-VIS/NIR Bifurcated 600 micron fiber assembly. $450.00BIF200-VIS/NIR Bifurcated 200 micron fiber assembly (for use with FOXY-AL300). $350.00BIF400-VIS/NIR Bifuracted 400 micron fiber assembly (for use with FOXY-PI600). $400.0021-02 Splice bushing . $ 13.00
3
Description of System Components
Oxygen Sensor
Oxygen sensors are available in a variety ofcustom formats. The standard product, FOXY-R,consists of a 1mm core diameter optical fiber in a1/16th inch O.D. stainless steel tube, beveled at 45degrees. The distal tip is polished and coated withthe oxygen sensing material. The proximal end isfinished in a 905 SMA fitting for coupling to theoptical cables. The probe is designed to couple to a600 micron bifurcated fiber using a splice bushing.The FOXY-AL300 is similar, except that the fiberis jacketed with an extremely tough aluminumcoating. The result is a tough, small diameterprobe with very small bending radius. The FOXY-AL300 should be coupled to a 200 micronbifurcated fiber. The FOXY-PI600 is a 600 micronfiber jacketed with polyimide. It is designed to becoupled to a bifuracted 400 micron fiber. Therelative signal strength of the probes scales to theircross sectional area.
Spectrometer
The spectrometer is an S2000 fiber opticspectrometer optimized for low light levelapplications. The spectrometer can be used withthe oxygen sensor, or for other applications by connecting it to the appropriate sampling optics. For oxygenwork, one leg of the bifurcated assembly delivers fluorescence from the probe tip to the spectrometer. TheS2000 interfaces to a computer by way of an A/D card. The 25 pin connector in the rear of the unit couplesto an ADC500 card in a desktop computer, or to a SAD500 A/D system for connection through the serialport to a notebook computer, desktop PC, PLC or other serial devices.
The 15 pin connector at the rear of the S2000 is for connecting various accessories, such as the LS-450 blueLED. Timing signals and on/off for controlling the LED will be transmitted from the spectrometer to theLED. In the rack mounted devices, such as the R-450, these signals are routed through header pins thatconnect the 2 boards.
Blue LED
The Blue LED is specially designed for use with the oxygen sensor. A linear voltage regulator providesconstant power to the LED. External power is supplied by a 12 Volt DC power transformer. If you need a220 volt supply, contact our sales department to order a INT-P ($20.00). The trigger cable is designed toplug into the 15 pin connector of the S2000. If you purchased an SF2000 or a rack mounted LED, thetrigger lines are connected internally.
4
OOIFOXY Software
The oxygen probe can be used with any software that operates the S2000 (e.g. OOIBASE, OCEANS32,EXCEL). However, OOIFOXY is provided as a user friendly, easy to use package especially designed forthe oxygen sensor. You should have a diskette with OOIFOXY installation software in your package.Please check our website periodically to learn about free upgrades and other technical issues related to thissoftware. If you purchased a SAD500, it is possible to have the spectra converted to oxygen values at themicroprocessor level, and transmitted through the serial interface to other devices. Call our tech servicedepartment for details.
5
Installing the System
Installing the system consists of 3 steps:1. Installing the A/D card in the computer2. Installing the software in the computer3. Coupling the optical components
A /D Card
ADC500 or ADC1000 – If you familiar with installing computer boards, this will be easy. If you’ve neverdone this, you might want to consult our S2000 manual for detailed procedures.
Turn off your computer and disconnect the power cord. Open thecomputer case and locate an empty ISA slot. You should pick onethat is away from the video card. You will need to remove the slotcover from the chassis. Then insert the ADC500 or ADC1000 inthe ISA slot, making sure to properly seat the card edge into theconnectors. Fasten the card to the chassis with the cover platescrew.
The ADC500 and ADC1000 cards come preset to a base addressof 768 (decimal) and IRQ = 7. This will work in most computers.However, if you have another card or device using these settings,you will need to change the base address or IRQ by changingsome dip switches. Please refer to Appendix I for details.
Connect the blue interface cable from the ADC500 or ADC1000to the S2000-FL or SF2000 spectrometer.
Software
Installing software is easy, just insert the diskette, and run SETUP. The installation program will ask you afew questions, and take care of the rest. If you don’t know what to answer, just stick with the defaultoptions. OOIFOXY will be installed in your program directory. Just double click on the OOIFOXYselection to start.
Optical Components
The FOXY probe should be coupled to the common leg of the bifurcated optical assembly. The commonleg is identified as the single cable coming from the stainless steel breakout in the middle of the “Y” shapedassembly. Use the SMA splice bushing to couple these pieces together. It is only necessary to make thesefinger tight to make a good connection.
Connect one of the legs of the assembly to LED, the other goes to the spectrometer. Again, finger tight issufficient. Both legs are equivalent, so it doesn’t matter which one is connected to the spectrometer.
6
The Blue LED must be connected to the power source, and to the trigger line from the spectrometer. Thereis an OFF/TRIGGERED/ON switch on the back of the unit. The triggered position is towards the outside ofthe case, on towards the inside. NOTE: The LED will not turn on in trigger mode unless the software hasbeen activated. Exiting the software will not turn the LED off, but rebooting the computer will. In triggeredmode, the intensity will appear to be ½ as bright as the ON mode. Triggered mode is recommended for usewith the oxygen sensor.
The rack mounted blue LED in the SF2000 has various options set by jumpers on the board. These comepreset for the optimum performance with the oxygen probe. However, if you wish to change any of thesettings, remove the 2 screws from the back of the SF2000, and slide the spectrometer and R-450 cards outof the box. You can safely run the system out of the box as it is low voltage only. Refer to Appendix II forjumper settings. The settings control 1) manual vs software control of on/off and 2) the pulse frequency ofthe LED.
7
Using the System
Starting & Setting Parameters
Double click on the OOIFOXY menu selection under PROGRAMS to start the software. Make sure theBlue LED switch is in the ON or TRIGGERED position. You should see blue light coming from thesensor. Shielding the tip from ambient light, you should be able to see a red glow if you look at the tipfrom the side
At this point you should see a spectrum on the screen consisting of a back reflection of the blue LED in the450 - 550nm range and a fluorescence peak in the 600 - 615nm range. The exact location of the peaks willvary from unit to unit and should be determined each time a new component is installed. Use the cursor tolocate the wavelength of the maximum signal for each peak, and record these in the oxygen parametersdialog box accessed by clicking on the wrench icon.
The magnitude of the peaks depends on the integration period of the detector. You can increase the signalby making the integration period longer, and decrease the signal by making the integration period shorter.Click on the icon with the integral sign to set the integration period. Adjust it until you have thefluorescence peak about half way up the screen (about 2000 counts), and the LED peak anywhere (it doesnot matter if the LED peak is saturated). NOTE: the signal differs greatly between air and waterdeployments; install the probe in the test media before adjusting integration period.
The spectra are broad smooth curves. An increase in signal-to-noise can be obtained through smoothing.Click on the Σ icon and set the smoothing to 25 pixels.
The probe should be installed in a suitable sampling compartment. It is critical that ambient light beexcluded from the field of view of the probe tip, and that provisions for sampling standard oxygen levelsare available. For gases, a flow chamber with connections to N2, dry air, and/or O2 is suggested. For fluids,these gases can be used with glass frits (airstones) and a stirrer to bring the liquid into equilibrium with thecalibration gas. As an option, sodium hydrosulfite can be used to strip O2 from aqueous solutions.
8
Storing Reference Values and Dark
Three (3) values are required to calculated oxygen concentration of a sample:1. the dark level of the detector2. the intensity at a low oxygen level (preferably zero)3. the intensity at a known high level of oxygen (preferably near the concentration of your samples).
These values are stored in the software by clicking on the appropriate icons:1. the black box for dark2. the down arrow for low oxygen3. the up arrow for high oxygen.
The standard values for the calibration gases are entered into the oxygen configuration dialog box,accessed with icon with the wrench symbol. The wavelengths for the blue LED and oxygen fluorescenceas determined from inspection of the spectra should be entered into the appropriate text boxes. Allsettings are stored in an initialization file so that the software can be exited and re-entered without thenecessity of re-calibration.
Viewing Oxygen Concentration
Once you have stored dark, high and low, you can view the oxygen concentration by clicking on the O2icon. A time series graph window appears with text data at the bottom of the graph, and a time series ofoxygen values in the plot area. This data is updated in real-time, as fast as the spectrometer acquires dataand the computer can redraw the graph. To slow down the acquisition rate, increase the number of scansthat are signal averaged, or set a delay between acquisitions in the O2 configuration box. To signal averageclick on the Setup | Data Acquisition icon indicated with a blue spectra. If you want to speed up acquisition,decrease the number of scans being averaged, or decrease the integration period.
The oxygen values can be logged to an ASCII data file in 3 ways:1. Clicking on the log value icon indicated by the pen & paper will write the current value to a standard
log file named CH0.log.2. Setting the Auto log function in the O2 dialog box to ON will cause every value to be written to the
log file.3. Using File | Export will write the currently display time series to a file of your choice.
9
Principle of Operation
Fluorescence Quenching
The probe consists of an optical fiber coated on the distal end with a thin layer of a hydrophobic sol-gelmaterial. A ruthenium complex is trapped in the sol-gel matrix, effectively immobilized and protected fromwater. The LED excites the ruthenium complex with ~475nm light. The excited complex fluoresces,emitting energy at ~600nm. If the excited ruthenium complex encounters an oxygen molecule, the excessenergy will be transferred to the oxygen molecule in a non-radiative transfer, decreasing the fluorescencesignal. The degree to which this process occurs depends on the concentration of oxygen molecules.
Stern-Volmer Equation & Calibration
The fluorescence is related quantitatively to the partial pressure of oxygen through the Stern-Volmerequation:
pOk
II
20 1+=
I0 is the intensity of fluorescence at zero pressure of oxygen, I is the intensity of fluorescence at a pressurep of oxygen, and k is the Stern-Volmer constant. For a given media, and at a constant total pressure, andtemperature, the partial pressure of O2 is proportional to O2 concentration.
It is evident from the equation that the sensor willbe most sensitive to low levels of oxygen. Thephotometric signal to noise is roughly proportionalto the square root of the signal intensity, and the rateof change of signal intensity with oxygenconcentration is greatest at low levels.
The Stern-Volmer constant (k) is primarilydependent on the chemical composition of theruthenium complex. The probes have shownexcellent stability over time, and this value shouldbe largely independent of the other parts of themeasurement system. However, k does vary amongprobes, and is also temperature dependent. Allmeasurements should be made at the sametemperature as the calibration experiments.
I0 depends on details of the optical setup: LED power, optical fibers, losses at the probe to fiber coupling,and backscattering from the media. It is important to measure I0 for each experimental setup.Backscattering in the media can increase the collection efficiency of the probe, increasing the observedfluorescence. It is important to perform calibration procedures in the media of interest for highly scatteringsubstances. For optically clear fluids and gases, this is not necessary.
Fluorescence Quenching
0
200
400
600
800
1000
1200
0 5 10 15 20
O2 Concentration (%)
Inte
nsity
(cou
nts)
10
Application Tips
Ambient Light
The S2000 is very sensitive, and the oxygen probe will readily detect ambient light. The probe must beshielded from ambient light to obtain reliable data. You can determine if ambient light is entering the probeby turning the blue LED off. The spectra should appear flat, near the bottom of the scale.
Scattering Media
Florescence emissions from the ruthenium complexes propagate in all directions. In clear media, only thoseemissions propagating towards the fiber within the acceptance angle of the probe are detected. If the probetip is held near a reflecting surface, or immersed in a highly scattering media, the fluorescence signal willincrease. The increase will be proportional for both I and I0 in the Stern-Volmer equation, and will notaffect the constant. For this reason it is necessary to measure I0 in the media.
Temperature
Temperature affects k and I0 for each probe, and may havesecondary effects on the collection optics. It is recommendedthat measurements be performed at a constant temperature.The effect of temperature is predictable, and can be used tocorrect sample data that is collected at a different temperaturethan the calibration standards.
Calibration
Any two levels of know O2concentration or partial pressure canbe used to calibrate the system. Ifyou are using the probe in gases, N2can be used for the low value (0%)and air (20.9%) or O2 (100%) forthe high value. It may be difficult toprepare standards for liquid media.Sodium hydrosulfite dissolved inaqueous media will consume O2rapidly, and can be used to prepare a0% concentration. Air saturatedvalues for various solvents and saltsolutions can be found in textbooks.
OOIFOXY will be installed in your PROGRAMS directory. Double click on the entry or icon to start thesoftware.
On startup, a single window will appear showing the SCOPE MODE view of the spectrometer (top panel inthe picture above). This graph shows the output from the spectrometer in real-time. If the LED is off, youshould see a trace running across the bottom of the screen. If you turn the LED on, you should see a spectrawith 2 peaks like the picture above. The lower wavelength peak is back reflection of the blue LED sourcefrom the sensor surface. The longer wavelength peak is the red fluorescence from the ruthenium complex.Data windows can be opened and closed, and displayed in tiled or cascaded view. Clicking on a windowtitle bar selects the window for modification by the various tools.
The software consists of all the commands necessary to control the spectrometer, acquire data, convert thedata into meaningful numbers, and save the data in files and logs. OOIFOXY is an enhanced version ofOOIBASE, which is the general software supplied with all spectrometers.
The software can be used by activating icons and menu items. The top row of icons refer to generalspectroscopy functions. The bottom row are related to functions required for use in the oxygen sensingmode. Specific instructions can be found in the HELP file for icon and menu commands. Briefly, the iconsfor general spectroscopy are:
12
Open a new window. Each window shows data from the spectrometer.Open a saved file. Spectra are stored as binary files.Save a file. Binary files can be read into a window for display.Print. Send the graph in the window to the printer.
Store Dark. For general spectroscopy, stores dark spectraStore Reference. For general spectroscopy, stores spectra of 100% transmission or reflection, or blackbodysourceSnapshot Mode. Turns off real-time mode
Scope Mode. Shows data in A/D counts.Absorbance. With a suitable dark & reference, shows absorbance valuesTransmission. With a suitable dark & reference, show % T or %RIrradiance. With a suitable dark & reference, shows relative energy.
Subtract Dark Spectra. Affects display only.Configure Data Acquisition. Set static signal averaging, triggering options, A/D resolution and otherparameters.Averaging. Set dynamic signal averaging and spectral smoothing.Integration. Sets detector integration period.Channel selector. For multi-spectrometer systems, sets the spectrometer channel for the current window.
Y Rescale. Rescales the current window in the Y axis.Set Scale. Shows dialog box for setting x & y limits.Default Scale. Returns scale to default settingsCursor On/Off. Puts vertical cursor in current window, values reported at bottom of main window.Move Cursor. Left, right, fast & slow.
O2. Opens a new window in the oxygen time series mode.Configure O2. Opens the oxygen configuration screen.Store Dark. Stores the dark values at the fluorescence and reference wavelengths.
Store High O2. Stores the intensity values at the fluorescence and reference wavelengths for the high O2standard.Store Low O2. Stores the intensity values at the fluorescence and reference wavelengths for the high O2standard.Log O2 Value. Writes the currently display oxygen value and time value to the general log file, CH0.LOG.
13
Optimizing Signal to Noise
Photometric signal to noise in the oxygen sensor system is limited by the number of photons. Randomnessin photon flux yields signal to noise ratios that are approximately equal to the square root of the number ofphotons sampled. The number of photons sampled can be increased by:1. increasing the integration period.2. signal averaging through time.3. signal averaging across the spectra.
The trade off to options 1 & 2 are the speed of acquiring data. The appropriate setting depends on yourapplication needs, the stability of the oxygen levels in the samples, or your patience in waiting for answers!The trade-off to option number 3 is optical wavelength resolution. As the fluorescence and LED spectra arebroad smooth curves, optical resolution is not a concern, and smoothing should be set to the maximum 25pixels. In addition, the software permits averaging across the whole band. You should set these values inthe oxygen configuration dialog box to 100 pixels for the oxygen peak and 50 for the blue LED.
Setting Integration Period
The integration period for the CCD controlsthe length of time the detector is exposed tolight before being read. It is analogous to theshutter speed in a camera. The ideal settingdepends on the intensity of the light beingsampled. To adjust the integration period, clickon the integration icon, and either enter theperiod in msec in the text box, or use the slidebar. To see the effects of the change, click onupdate. You can see the spectra being acquiredbehind the dialog box. Select a setting thatgives a signal that is >75% of full scale, butless than saturation. Any values at or above4095 counts will be invalid. Remember thatthe signal at low O2 concentration is about 40% higher than in air. NOTE! Set the integration period tofactors of 2 only (i.e. 2,4,8,16,32,64,128,256…) This is to insure an constant number of LED pulses duringthe integration period.
Setting Signal Averaging
Signal averaging over time can be done in a static mode ora dynamic mode. In static mode, n number of scans areacquired, averaged and sent to the graphics module for. Indynamic mode, the graphics display a running average of nscans. There is no quantitative difference between thesemodes, only the cosmetics of data presentation are affected.
To set Static Averaging, click on the Configure DataAcquisition icon. Enter the number of scans to be averagedin the text box.
To set dynamic averaging, click on the Σ icon. Enter thenumber of scans to average in the text box, or use theslide bar.
14
Setting Optical Smoothing
To set optical smoothing, click on the Σ icon. Enter the number of pixels to smooth in the text box, or usethe slide bar. You will need to click once to bring the slide bar control to the smoothing function, then clickand drag to move the control. Smoothing for oxygen sensors should be set to the maximum of 25 pixels.
15
Oxygen Configuration Screen
The oxygen configuration screen is used to set values for the particular oxygen probe being used. All valuesare written to a file that is read whenever the software is started, allowing the user to exit and re-enter thesoftware without having to recalibrate the sensor.
The analysis wavelength is the wavelength of the fluorescence maximum. For the oxygen sensor this liesin the 600 – 615nm range. You should measure the wavelength of the maximum fluorescence signal byusing the cursor. Then enter this value in the text box. To improve signal to noise, the fluorescence bandcan be integrated. Set the half band- width in pixels in the text box next to the analysis wavelength. Avalue approximately equal to half width, half-maximum intensity is appropriate (100 for the oxygen peakand 25 for the blue LED).
The reference wavelength is the peak of the blue fluorescence, a point along the shoulder of the Blue LEDcurve if it is saturated, the second order peak for the blue LED (around 900 nm), or an internal fluorescencestandard for future probe products. Use the cursor to determine the wavelength of the reference you havechosen, and also set a bandwidth for integration. This reference value will be used to correct any variationsin excitation energy, if you turn on the Enable Reference Monitoring Check box.
The spectrometer and LED can run all the time, or the software will turn on the LED, record spectra, turnoff the LED and wait. This mode is useful to prevent photo-bleaching of the probe and improve stability.To activate this mode, click the Toggle Lamp On/OFF button. If you have an SF2000, the blue LED willturn on only when data is being acquired. To preserve the probe, you wait between readings by enteringthe value in seconds in the Delay Between Acquisitions check box, and also clicking the Enable TimeDelay check box.
16
Automated data logging can be turned on and off with the Log Every Acquisition check box. When thisbox is checked, every oxygen and time value are appended to the log file FILENAME.log where thefilename comes from the Log Filename text box
The values of the oxygen concentration standards are entered into the Low and High calibrationconcentration text boxes. Although zero oxygen level is recommended for the low concentration, anyvalue can be used for the standards, as long as they are sufficiently different. The units for the calibrationstandards and for the values reported for the samples can be entered into the Concentration Units text box.This is just a text string and has no mathematical significance.
The values for the Stern-Volmer Constant (k) and Intensity at Zero Oxygen Concentration (I0) arecalculated from the intensities recorded by clicking on the High, Low and Dark icons, and theconcentration values for the standards. The results are posted to the text boxes. If you wish to enter thesemanually you can do so. If the lock values boxes are checked, these values will be set.
The View pull down menu offers Absorbance, Concentration, Oxygen Concentration, Scope Mode, ScopeMode – Dark, and Transmission. The Oxygen Concentration mode uses the Stern-Volmer equation and is thecorrect choice for using the FOXY probe. The other modes are available for non oxygen sensing applications.
Storing Reference Values
The fluorescence intensities for high and low oxygen concentration standards are stored by clicking on theupward arrow and down arrow icons. The dark value is stored by clicking the black box icon. Old valuesare overwritten when these icons are clicked. The values are saved in an initialization file, and are read atstart-up. It is important that these values be re-measured whenever the analysis wavelength, bandwidth,detector signal averaging, smoothing, and/or integration period are changed.
Viewing Windows
Data is viewed in a window. New windows are opened by clicking on the blank sheet icon at the top lefttool bar. When you open a new window, it will default to the scope mode spectra. This view can bechanged to absorbance, transmission, or irradiance spectra, or to a time series. When multiple windows areopen, the actions of the icons will apply to the highlighted (selected window) only. Each window has itsown set of parameters indicated in the oxygen configuration screen. However, only the values in theselected window will be saved on exiting the program.
Viewing Time Series
To view the Oxygen time series data, click on the O2 icon. A time series window will open. The graphic isoxygen concentration (dependent) vs. time (independent). If you have selected a different view mode, datawill be displayed as absorbance, transmission, etc. The current values are displayed in red letters under thegraph, along with a rate of change value based on the last 2 data points.
The graph can be re-scaled using the standard graphic functions previously described. The cursor can beused to find the values of any point (current or past) on the graph.
As values are added, the graph eventually fills the available x axis space, and then automatically rescales onthe x axis.
The time values are calculated from the computer’s system clock through the Windows timer functions. Itis precise to 1 millisecond.
17
Saving Oxygen Values
The data in the time series can be logged automatically by activating the log every value checkbox in theO2 configuration screen. The data will be appended to the file given by FILENAME.log where filename isthe character string entered in the text box in the oxygen configuration screen. Data can also be logged ondemand by clicking on the log data point icon.
The time series data that is availableon screen can be saved all at once byusing the Save Time Series Dataoption in FOXY menu. These timeseries files can also be viewed inOOIFOXY by using Open TimeSeries Data.
The time series graph can be reset bychoosing Clear Time Series Data. Ifyou open the oxygen parametersscreen, and click OK, you will beasked if you would like to reset thetimes series.
In addition to the Stern-VolmerOxygen Concentration presentation,OOIFOXY can be used to displaytime series data at the analysiswavelength as Absorbance, Concentration (Beers Law), Scope Mode Intensity, and Analysis/ReferenceIntensity (intensity at analysis wavelength divided by intensity at reference wavelength).These modes are made available for diagnostic purposes, and for using the spectrometer for applicationsthat do not involve an oxygen sensor.
In all cases, the values used for calculating theview are those stored by the Oxygen standardicons. For absorbance, the blank or reference isstored using the up arrow. Dark is stored usingthe black box icon. For concentration,absorbance is multiplied by the value in theconstant text box. This constant should be handcalculated, and entered in the text box. Youshould also lock the value with the checkbox.
18
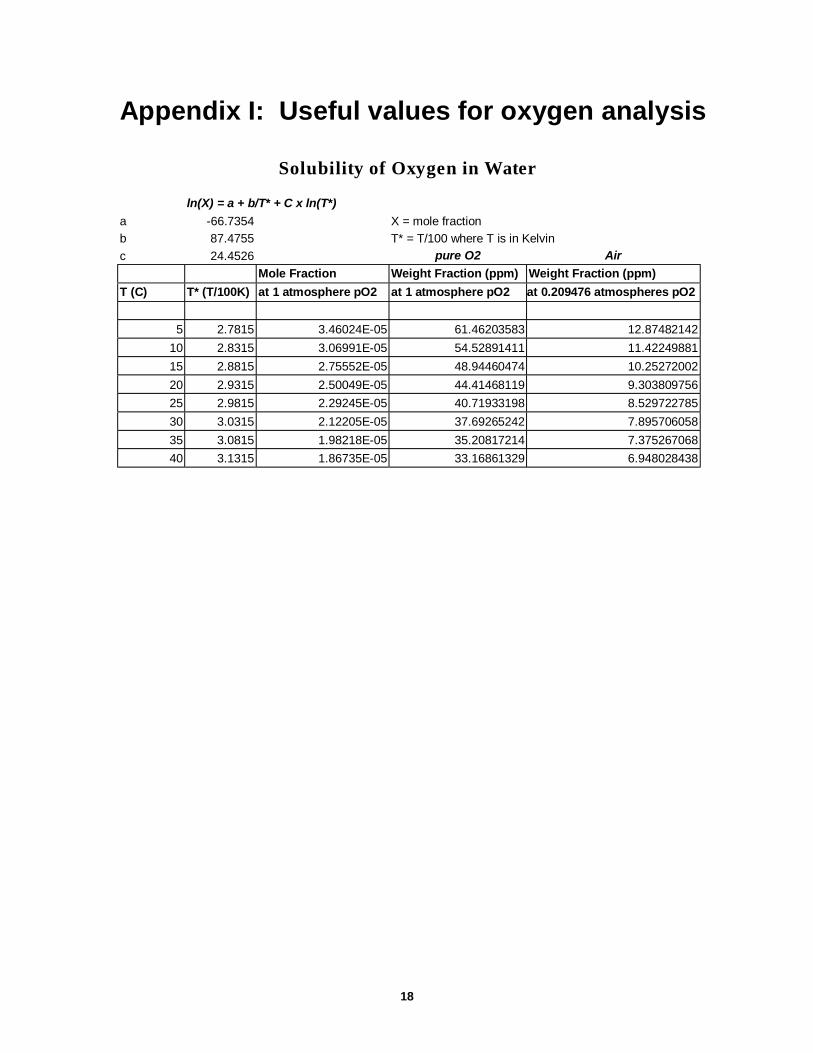
Appendix I: Useful values for oxygen analysis
Solubility of Oxygen in Water
ln(X) = a + b/T* + C x ln(T*)a -66.7354 X = mole fractionb 87.4755 T* = T/100 where T is in Kelvinc 24.4526 pure O2 Air
Mole Fraction Weight Fraction (ppm) Weight Fraction (ppm)T (C) T* (T/100K) at 1 atmosphere pO2 at 1 atmosphere pO2 at 0.209476 atmospheres pO2
Appendix II: Changing Base Address & IRQon the ADC500The ADC500 is preset to a default base address (768) and IRQ level (7). There may be other devices inyour computer which conflict with these settings. Conflicts are manifested by software which hangs up,zeros in spectral data, divide by zero errors or other problems. Diagnosing the source of the conflict is aninexact science, and it is necessary to use a trial & error approach. If you are using Windows 95, click onStart | System | Control Panel, then click on the system icon, click on the device manager tab, click oncomputer (at the top of the list) and select properties. The used IRQ's and base addresses are listed here.
Note: You must set both the hardware and the software to change the base address or irq levels.
To change a setting:1. Turn off the computer and remove the cover. After grounding yourself to the power supply, unplug the
computer.2. Remove the mounting screw and remove the PC1000 master card.3. Change the base address or the IRQ level by moving the dip switches as indicated. The base address is
set through the bank of 6 dip switches labeled SW1. The IRQ is set through a bank of 4 dip switcheslabeled SW2.
4. Reinstall the card.5. Change the software settings to match the hardware settings (see the appropriate software section for
Switches in the OFF position have the decimal values shown. Switches in the ON position have a value ofzero. The base address is the sum of the values of the switches. In the above example, switches 5 & 6 areadded to give a total of 768. A few of the many combinations are illustrated below.
The IRQ level is set using SW2. Set to the ON position only one of the SW2 dip switches. (Note: ourservice department can modify your PC1000 to operate at a different IRQ level should that becomenecessary) .
Example: (IRQ = 5)1 2 3 4
onoff
IRQ value 3 5 7Value asshown
5
Example: (IRQ = 3)1 2 3 4
onoff
IRQ value 3 5 7Value asshown
3
21
Changing Software SettingsIf you changed the hardware switches, you must change the software settings as well.1. Start the program2. Select SETUP, CONFIGURE SPECTROMETER. Then choose the appropriate IRQ and/or base
address from the dialog box.3. Exit and Restart the software.
22
Appendix III: R-450 Blue LED Light SourceThe R-LS-450 Blue LED light source allows the user to utilize all of the built-in features of Ocean OpticsS2000 Product line.
Features1. Internal 470nm short pass filter (Filter has 50% transmission at 470nm)2. Pulsed or Continuous (CW) mode operation3. All features controllable via software.4. Adjustable focusing SMA connector to maximize light into fiber
Operating ModeThree jumpers determine the operating mode of the R-LS-450. These functions are described below:
JP1 S0 Enable: If the jumper is present the S0 line of the spectrometer turns the light source on (TTLhigh) and off (TTL low). This feature is only available with S2000 Rev J or later spectrometers. Defaults toon with revisions prior to J.
JP3 Remote/Manual Control: Determines the source of control. A jumper needs to be in either theRemote (software) or Manual.
JP2 Strobe select: Determines the LED’s pulse frequency at 50% duty cycle. The various frequencies arejumper selectable and are divided down from the Master Clock frequency. If you have and ADC500, it’sMaster Frequency is 500KHz and thus the “2^10” position implies this frequency is divided by 1024 (210)or 488Hz. A CW position will turn the source on continuously and the CS position allows for softwarecontrol of the frequency using the continuous strobe line (available on when using an ADC1000 or PC2000only).
S1 JP1 JP3 LED Statusoff X X OffCW out X Continuously onCW in Remote CW mode controlled by software (S0)*CW in Manual Continuously on
Pulsed out X Pulsing at rate determined by JPPulsed in Remote Pulsed mode controlled by software (S0)*Pulsed in Manual Pulsing at rate determined by JP
Requires revision J or later S2000 (i.e. J is 3rd letter in S2000 serial number)
23
Appendix IV: Installation of SAD500
Hardware Installation
The SAD500 is a microprocessor-controlled Serial Port Interface A/D converter for serial port connectionor stand-alone operation. The SAD500 can be used to interface to desktop or portable PCs, PLCs, and otherdevices that support the RS-232 communication protocol. Interfacing the SAD500 to a desktop or portablePC is simple.
1. If you ordered your SAD500 mountedonto your S2000 spectrometer, simplyconnect the 6-pin DIN end of the serialcable to the SAD500 and the DB9 endto your PC. Some PCs may require a 9-pin to 25-pin converter (not included).If you ordered your SAD500 in its ownhousing, attach the 25-pin conductorribbon cable from the S2000-seriesspectrometer to the SAD500. Thenconnect the 6-pin DIN end of the serialcable to the SAD500 and the DB9 endto your PC.
2. For either configuration, note the serialport number (also called COM Port) onthe PC to which you are interfacing.(Older PCs may not have numberedports.)
3. Plug the +12V DC wall transformer intoan outlet and connect it to the SAD500.
Software Installation
The SAD500 requires that you have version 3.00.00 or later of our device driver (OOIDRV16.DLL orOOIDRV32.DLL). You can download the latest version of the driver from our web site atwww.oceanoptics.com.
Installing OOIBase (Windows)1. Insert the OOIBase floppy disk into a floppy drive.2. Select Run and type (drive):setup. Click OK.3. Click OK at the “Welcome!” dialog box.4. Select the Destination Directory. Choose the default destination or type where you want the software
housed. Click OK.5. In the “Make Backups” dialog box, click YES.6. After the software installation is complete, you will go back out to your desktop.7. Start OOIBase by selecting Start | Programs | OOIBase V 1.5 | OOIBase V 1.5.
The “Interface Setup Parameters” Dialog BoxAfter selecting OOIBase V 1.5, the “Interface Setup Parameters” dialog box opens. You must specify yourhardware configuration in this dialog box.8. First, choose the S2000/PC2000 option under Spectrometer.9. Next, choose the SAD500 option under A/D Converter.
24
10. Under Serial Port, you must specify the same COM port number as the one being used to interface toyour SAD500. See the Troubleshooting section for help in determining the COM Port number.
11. The SAD Pixel Resolution parameter specifies that every nth pixel of the S2000 is transmitted from theSAD500 to the PC. You can enter resolution values from 1 to 500. Ultimately, your resolution valuedepends on your experiment. By sacrificing pixel resolution, you gain speed. The transfer of onecomplete spectra requires ~0.6 seconds when communicating at 57,600 baud rate. If you need yourinformation in <0.6 seconds, increase the pixel resolution. You can always go back to this dialog box byselecting Setup | Configure Hardware.
12. For this configuration, only these four parameters apply to your system. Ignore any others and click OK.13. If you do not see the “Interface Setup Parameters” screen when you start OOIBase, exit OOIBase by
selecting File | Exit. Then select Start | Run, and type C:\windows\ooidrv.ini. This will openNotepad and allow you to edit the initialization file for our device driver. Find the “Initialized” entrywithin this file. Make sure this line reads: Initialized=0. Save the OOIDRV.INI file and exitNotepad. Restart OOIBase. You should now see the “Interface Setup Parameters” dialog box allowingyou to specify your hardware configuration.
14. At this point, OOIBase (or other Ocean Optics software) should be acquiring data from yourspectrometer. There should be a dynamic trace responding to light near the bottom of the displayedgraph. If your spectrometer is not responding to light, please contact our Technical SupportDepartment.
Troubleshooting
Occasionally, there will be problems associated with your PC configuration and the software. Here are afew tips to assist you.• To ensure that the software and hardware are in-synch, exit OOIBase, cycle power on the SAD500 and
restart OOIBase.• In Windows 95 and Windows 98, you can find out your Serial Port number by selecting Start |
Settings | Control Panel. Then double-click on the System icon and select the Device Manager tab.Double-click on Ports (COM & LPT) and this will display the COM port numbers. Ensure that thereis no yellow warning sign next to the COM Port you are attempting to use.
• If the ports on your PC are not labeled and you don’t know which COM port you are using for yourSAD500, you may have to resort to trial and error. If you choose the wrong serial port number, youwill not see a dynamic trace responding to light near the bottom of the displayed graph (see step 14).Instead, you will see a straight line.
• The default baud rate is 57,600. If your computer is not capable of communicating at this speed, selectStart | Run, and type c:\windows\ooidrv.ini. This will open Notepad and allow you to editthe initialization file for our device driver. Find the “SerialPortBaudIndex=5” line and change it to avalue your PC supports. Notes just above this line on your screen describe your options. Save theOOIDRV.INI file, exit Notepad and restart OOIBase. (Use of the 115,200 baud rate is prone to errorsand not recommended in a multitasking environment.)
• The 16-bit communication library requires approximately 3 seconds to completely closecommunications with the SAD500, and the 32-bit communications library requires 6 seconds. If youexit OOIBase and try to restart without allowing enough time to transpire, conflicts will occur. Thebest solution at this point is to restart Windows and then run OOIBase.
• On some computers, users may have to disable any virus protection software to ensure timely andcomplete transfer of the data.
25
Technical SupportFor immediate technical assistance, please contact us via e-mail at [email protected]. Ourapplication engineers will be glad to assist you.
Watch for Free Updates!
The OOIFOXY software will be continuously updated and improved. You are entitled to free updates untila completely new version is released. Download the latest version at www.oceanoptics.com. See the back ofyour Software and Resources Library CD for the password.
For more information, please contact Ocean Optics, Inc. via one of the methods below:
Ocean Optics, Inc.380 Main Street [email protected], FL 34698 [email protected](727) 733-2447 http://www.OceanOptics.com(727) 733-3698 (FAX)