394
Fund Factbook Swiss Market Data as at March 2012
| Date post: | 27-Mar-2018 |
| Category: |
Documents |
| Upload: | phungtuong |
| View: | 221 times |
| Download: | 4 times |
booklet issuerId channelId languageId perDateFund Factbook9926 9913 18 20120330
Fund FactbookSwiss MarketData as at March 2012

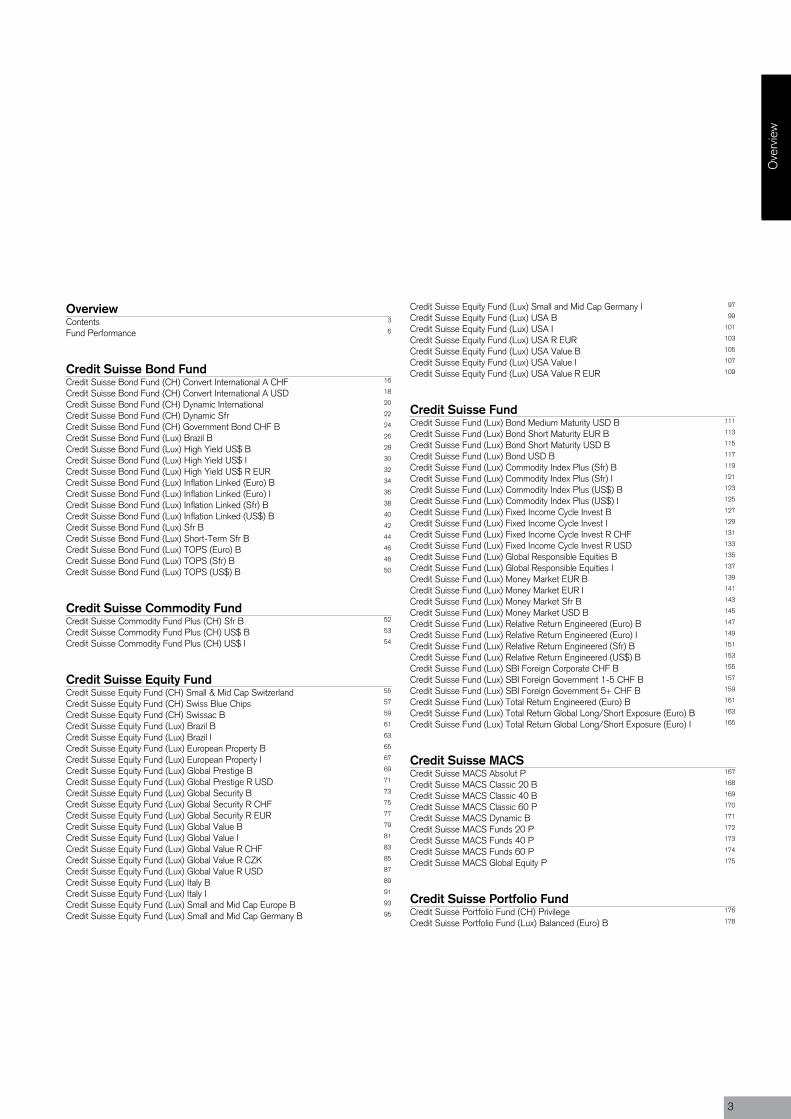
OverviewContents 3
Fund Performance 6
Credit Suisse Bond FundCredit Suisse Bond Fund (CH) Convert International A CHF 16
Credit Suisse Bond Fund (CH) Convert International A USD 18
Credit Suisse Bond Fund (CH) Dynamic International 20
Credit Suisse Bond Fund (CH) Dynamic Sfr 22
Credit Suisse Bond Fund (CH) Government Bond CHF B 24
Credit Suisse Bond Fund (Lux) Brazil B 26
Credit Suisse Bond Fund (Lux) High Yield US$ B 28
Credit Suisse Bond Fund (Lux) High Yield US$ I 30
Credit Suisse Bond Fund (Lux) High Yield US$ R EUR 32
Credit Suisse Bond Fund (Lux) Inflation Linked (Euro) B 34
Credit Suisse Bond Fund (Lux) Inflation Linked (Euro) I 36
Credit Suisse Bond Fund (Lux) Inflation Linked (Sfr) B 38
Credit Suisse Bond Fund (Lux) Inflation Linked (US$) B 40
Credit Suisse Bond Fund (Lux) Sfr B 42
Credit Suisse Bond Fund (Lux) Short-Term Sfr B 44
Credit Suisse Bond Fund (Lux) TOPS (Euro) B 46
Credit Suisse Bond Fund (Lux) TOPS (Sfr) B 48
Credit Suisse Bond Fund (Lux) TOPS (US$) B 50
Credit Suisse Commodity FundCredit Suisse Commodity Fund Plus (CH) Sfr B 52
Credit Suisse Commodity Fund Plus (CH) US$ B 53
Credit Suisse Commodity Fund Plus (CH) US$ I 54
Credit Suisse Equity FundCredit Suisse Equity Fund (CH) Small & Mid Cap Switzerland 55
Credit Suisse Equity Fund (CH) Swiss Blue Chips 57
Credit Suisse Equity Fund (CH) Swissac B 59
Credit Suisse Equity Fund (Lux) Brazil B 61
Credit Suisse Equity Fund (Lux) Brazil I 63
Credit Suisse Equity Fund (Lux) European Property B 65
Credit Suisse Equity Fund (Lux) European Property I 67
Credit Suisse Equity Fund (Lux) Global Prestige B 69
Credit Suisse Equity Fund (Lux) Global Prestige R USD 71
Credit Suisse Equity Fund (Lux) Global Security B 73
Credit Suisse Equity Fund (Lux) Global Security R CHF 75
Credit Suisse Equity Fund (Lux) Global Security R EUR 77
Credit Suisse Equity Fund (Lux) Global Value B 79
Credit Suisse Equity Fund (Lux) Global Value I 81
Credit Suisse Equity Fund (Lux) Global Value R CHF 83
Credit Suisse Equity Fund (Lux) Global Value R CZK 85
Credit Suisse Equity Fund (Lux) Global Value R USD 87
Credit Suisse Equity Fund (Lux) Italy B 89
Credit Suisse Equity Fund (Lux) Italy I 91
Credit Suisse Equity Fund (Lux) Small and Mid Cap Europe B 93
Credit Suisse Equity Fund (Lux) Small and Mid Cap Germany B 95
Credit Suisse Equity Fund (Lux) Small and Mid Cap Germany I 97
Credit Suisse Equity Fund (Lux) USA B 99
Credit Suisse Equity Fund (Lux) USA I 101
Credit Suisse Equity Fund (Lux) USA R EUR 103
Credit Suisse Equity Fund (Lux) USA Value B 105
Credit Suisse Equity Fund (Lux) USA Value I 107
Credit Suisse Equity Fund (Lux) USA Value R EUR 109
Credit Suisse FundCredit Suisse Fund (Lux) Bond Medium Maturity USD B 111
Credit Suisse Fund (Lux) Bond Short Maturity EUR B 113
Credit Suisse Fund (Lux) Bond Short Maturity USD B 115
Credit Suisse Fund (Lux) Bond USD B 117
Credit Suisse Fund (Lux) Commodity Index Plus (Sfr) B 119
Credit Suisse Fund (Lux) Commodity Index Plus (Sfr) I 121
Credit Suisse Fund (Lux) Commodity Index Plus (US$) B 123
Credit Suisse Fund (Lux) Commodity Index Plus (US$) I 125
Credit Suisse Fund (Lux) Fixed Income Cycle Invest B 127
Credit Suisse Fund (Lux) Fixed Income Cycle Invest I 129
Credit Suisse Fund (Lux) Fixed Income Cycle Invest R CHF 131
Credit Suisse Fund (Lux) Fixed Income Cycle Invest R USD 133
Credit Suisse Fund (Lux) Global Responsible Equities B 135
Credit Suisse Fund (Lux) Global Responsible Equities I 137
Credit Suisse Fund (Lux) Money Market EUR B 139
Credit Suisse Fund (Lux) Money Market EUR I 141
Credit Suisse Fund (Lux) Money Market Sfr B 143
Credit Suisse Fund (Lux) Money Market USD B 145
Credit Suisse Fund (Lux) Relative Return Engineered (Euro) B 147
Credit Suisse Fund (Lux) Relative Return Engineered (Euro) I 149
Credit Suisse Fund (Lux) Relative Return Engineered (Sfr) B 151
Credit Suisse Fund (Lux) Relative Return Engineered (US$) B 153
Credit Suisse Fund (Lux) SBI Foreign Corporate CHF B 155
Credit Suisse Fund (Lux) SBI Foreign Government 1-5 CHF B 157
Credit Suisse Fund (Lux) SBI Foreign Government 5+ CHF B 159
Credit Suisse Fund (Lux) Total Return Engineered (Euro) B 161
Credit Suisse Fund (Lux) Total Return Global Long/Short Exposure (Euro) B 163
Credit Suisse Fund (Lux) Total Return Global Long/Short Exposure (Euro) I 165
Credit Suisse MACSCredit Suisse MACS Absolut P 167
Credit Suisse MACS Classic 20 B 168
Credit Suisse MACS Classic 40 B 169
Credit Suisse MACS Classic 60 P 170
Credit Suisse MACS Dynamic B 171
Credit Suisse MACS Funds 20 P 172
Credit Suisse MACS Funds 40 P 173
Credit Suisse MACS Funds 60 P 174
Credit Suisse MACS Global Equity P 175
Credit Suisse Portfolio FundCredit Suisse Portfolio Fund (CH) Privilege 176
Credit Suisse Portfolio Fund (Lux) Balanced (Euro) B 178
Ove
rvie
w
3
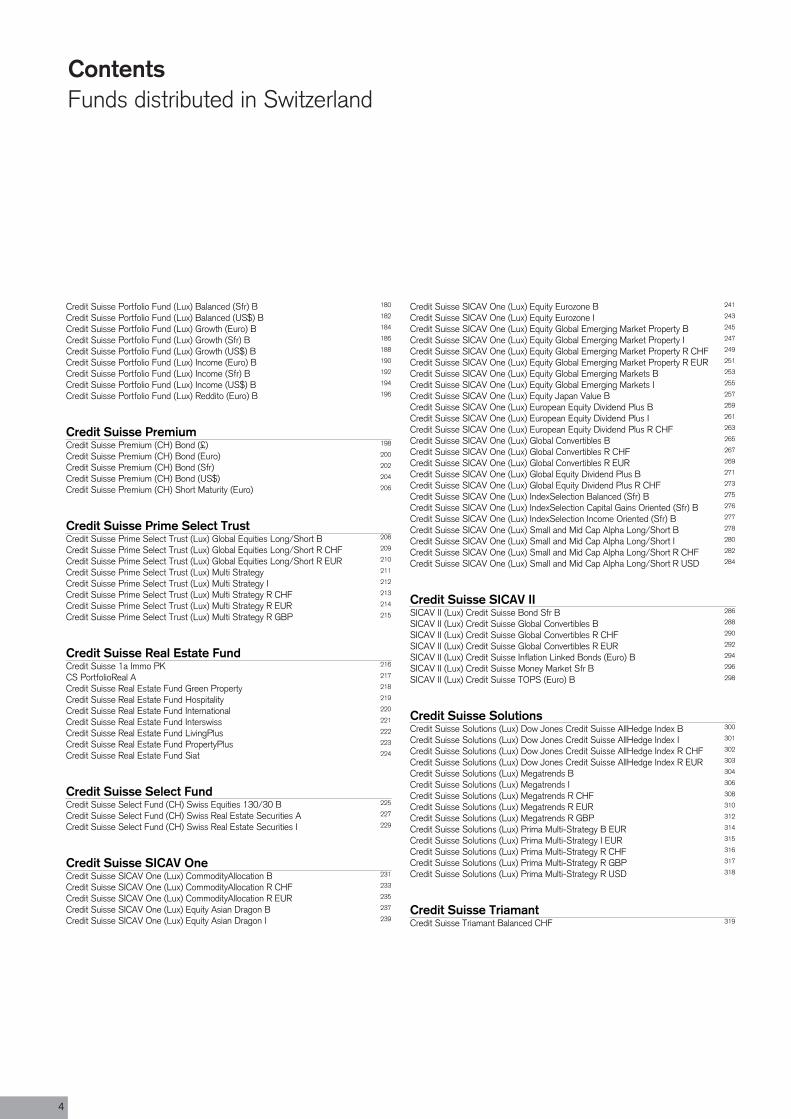
Credit Suisse Portfolio Fund (Lux) Balanced (Sfr) B 180
Credit Suisse Portfolio Fund (Lux) Balanced (US$) B 182
Credit Suisse Portfolio Fund (Lux) Growth (Euro) B 184
Credit Suisse Portfolio Fund (Lux) Growth (Sfr) B 186
Credit Suisse Portfolio Fund (Lux) Growth (US$) B 188
Credit Suisse Portfolio Fund (Lux) Income (Euro) B 190
Credit Suisse Portfolio Fund (Lux) Income (Sfr) B 192
Credit Suisse Portfolio Fund (Lux) Income (US$) B 194
Credit Suisse Portfolio Fund (Lux) Reddito (Euro) B 196
Credit Suisse PremiumCredit Suisse Premium (CH) Bond (£) 198
Credit Suisse Premium (CH) Bond (Euro) 200
Credit Suisse Premium (CH) Bond (Sfr) 202
Credit Suisse Premium (CH) Bond (US$) 204
Credit Suisse Premium (CH) Short Maturity (Euro) 206
Credit Suisse Prime Select TrustCredit Suisse Prime Select Trust (Lux) Global Equities Long/Short B 208
Credit Suisse Prime Select Trust (Lux) Global Equities Long/Short R CHF 209
Credit Suisse Prime Select Trust (Lux) Global Equities Long/Short R EUR 210
Credit Suisse Prime Select Trust (Lux) Multi Strategy 211
Credit Suisse Prime Select Trust (Lux) Multi Strategy I 212
Credit Suisse Prime Select Trust (Lux) Multi Strategy R CHF 213
Credit Suisse Prime Select Trust (Lux) Multi Strategy R EUR 214
Credit Suisse Prime Select Trust (Lux) Multi Strategy R GBP 215
Credit Suisse Real Estate FundCredit Suisse 1a Immo PK 216
CS PortfolioReal A 217
Credit Suisse Real Estate Fund Green Property 218
Credit Suisse Real Estate Fund Hospitality 219
Credit Suisse Real Estate Fund International 220
Credit Suisse Real Estate Fund Interswiss 221
Credit Suisse Real Estate Fund LivingPlus 222
Credit Suisse Real Estate Fund PropertyPlus 223
Credit Suisse Real Estate Fund Siat 224
Credit Suisse Select FundCredit Suisse Select Fund (CH) Swiss Equities 130/30 B 225
Credit Suisse Select Fund (CH) Swiss Real Estate Securities A 227
Credit Suisse Select Fund (CH) Swiss Real Estate Securities I 229
Credit Suisse SICAV OneCredit Suisse SICAV One (Lux) CommodityAllocation B 231
Credit Suisse SICAV One (Lux) CommodityAllocation R CHF 233
Credit Suisse SICAV One (Lux) CommodityAllocation R EUR 235
Credit Suisse SICAV One (Lux) Equity Asian Dragon B 237
Credit Suisse SICAV One (Lux) Equity Asian Dragon I 239
Credit Suisse SICAV One (Lux) Equity Eurozone B 241
Credit Suisse SICAV One (Lux) Equity Eurozone I 243
Credit Suisse SICAV One (Lux) Equity Global Emerging Market Property B 245
Credit Suisse SICAV One (Lux) Equity Global Emerging Market Property I 247
Credit Suisse SICAV One (Lux) Equity Global Emerging Market Property R CHF 249
Credit Suisse SICAV One (Lux) Equity Global Emerging Market Property R EUR 251
Credit Suisse SICAV One (Lux) Equity Global Emerging Markets B 253
Credit Suisse SICAV One (Lux) Equity Global Emerging Markets I 255
Credit Suisse SICAV One (Lux) Equity Japan Value B 257
Credit Suisse SICAV One (Lux) European Equity Dividend Plus B 259
Credit Suisse SICAV One (Lux) European Equity Dividend Plus I 261
Credit Suisse SICAV One (Lux) European Equity Dividend Plus R CHF 263
Credit Suisse SICAV One (Lux) Global Convertibles B 265
Credit Suisse SICAV One (Lux) Global Convertibles R CHF 267
Credit Suisse SICAV One (Lux) Global Convertibles R EUR 269
Credit Suisse SICAV One (Lux) Global Equity Dividend Plus B 271
Credit Suisse SICAV One (Lux) Global Equity Dividend Plus R CHF 273
Credit Suisse SICAV One (Lux) IndexSelection Balanced (Sfr) B 275
Credit Suisse SICAV One (Lux) IndexSelection Capital Gains Oriented (Sfr) B 276
Credit Suisse SICAV One (Lux) IndexSelection Income Oriented (Sfr) B 277
Credit Suisse SICAV One (Lux) Small and Mid Cap Alpha Long/Short B 278
Credit Suisse SICAV One (Lux) Small and Mid Cap Alpha Long/Short I 280
Credit Suisse SICAV One (Lux) Small and Mid Cap Alpha Long/Short R CHF 282
Credit Suisse SICAV One (Lux) Small and Mid Cap Alpha Long/Short R USD 284
Credit Suisse SICAV IISICAV II (Lux) Credit Suisse Bond Sfr B 286
SICAV II (Lux) Credit Suisse Global Convertibles B 288
SICAV II (Lux) Credit Suisse Global Convertibles R CHF 290
SICAV II (Lux) Credit Suisse Global Convertibles R EUR 292
SICAV II (Lux) Credit Suisse Inflation Linked Bonds (Euro) B 294
SICAV II (Lux) Credit Suisse Money Market Sfr B 296
SICAV II (Lux) Credit Suisse TOPS (Euro) B 298
Credit Suisse SolutionsCredit Suisse Solutions (Lux) Dow Jones Credit Suisse AllHedge Index B 300
Credit Suisse Solutions (Lux) Dow Jones Credit Suisse AllHedge Index I 301
Credit Suisse Solutions (Lux) Dow Jones Credit Suisse AllHedge Index R CHF 302
Credit Suisse Solutions (Lux) Dow Jones Credit Suisse AllHedge Index R EUR 303
Credit Suisse Solutions (Lux) Megatrends B 304
Credit Suisse Solutions (Lux) Megatrends I 306
Credit Suisse Solutions (Lux) Megatrends R CHF 308
Credit Suisse Solutions (Lux) Megatrends R EUR 310
Credit Suisse Solutions (Lux) Megatrends R GBP 312
Credit Suisse Solutions (Lux) Prima Multi-Strategy B EUR 314
Credit Suisse Solutions (Lux) Prima Multi-Strategy I EUR 315
Credit Suisse Solutions (Lux) Prima Multi-Strategy R CHF 316
Credit Suisse Solutions (Lux) Prima Multi-Strategy R GBP 317
Credit Suisse Solutions (Lux) Prima Multi-Strategy R USD 318
Credit Suisse TriamantCredit Suisse Triamant Balanced CHF 319
ContentsFunds distributed in Switzerland
4
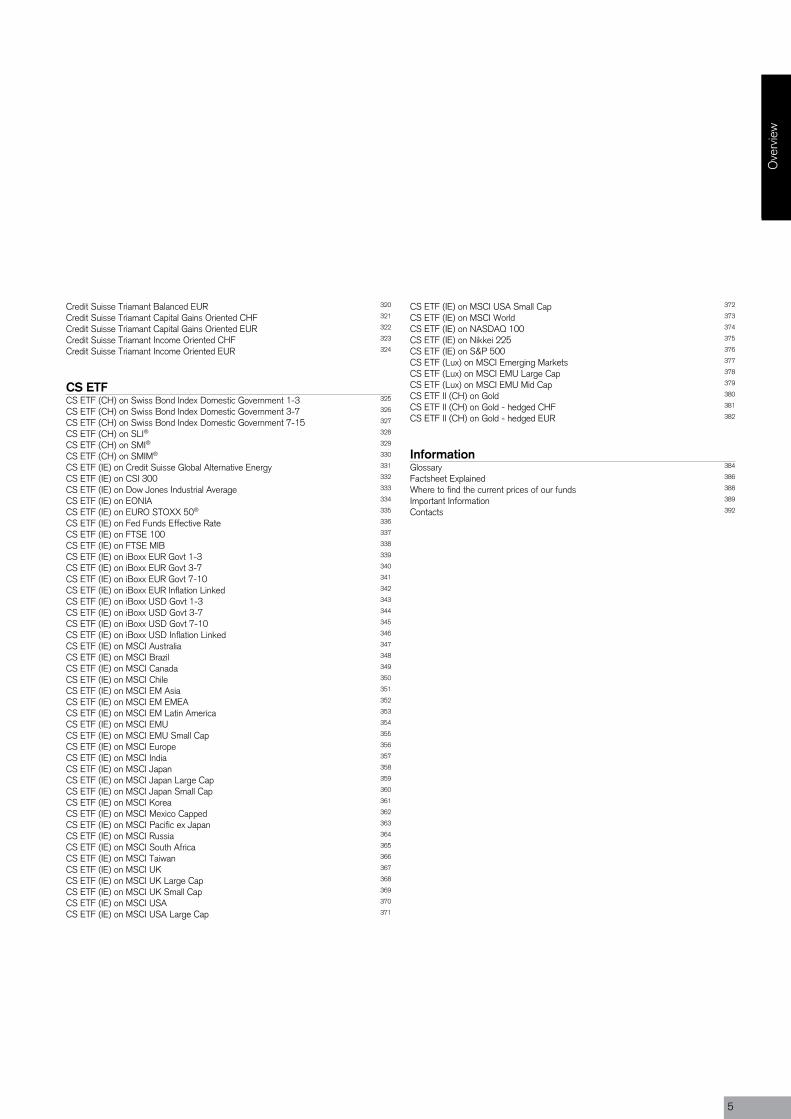
Credit Suisse Triamant Balanced EUR 320
Credit Suisse Triamant Capital Gains Oriented CHF 321
Credit Suisse Triamant Capital Gains Oriented EUR 322
Credit Suisse Triamant Income Oriented CHF 323
Credit Suisse Triamant Income Oriented EUR 324
CS ETFCS ETF (CH) on Swiss Bond Index Domestic Government 1-3 325
CS ETF (CH) on Swiss Bond Index Domestic Government 3-7 326
CS ETF (CH) on Swiss Bond Index Domestic Government 7-15 327
CS ETF (CH) on SLI® 328
CS ETF (CH) on SMI® 329
CS ETF (CH) on SMIM® 330
CS ETF (IE) on Credit Suisse Global Alternative Energy 331
CS ETF (IE) on CSI 300 332
CS ETF (IE) on Dow Jones Industrial Average 333
CS ETF (IE) on EONIA 334
CS ETF (IE) on EURO STOXX 50® 335
CS ETF (IE) on Fed Funds Effective Rate 336
CS ETF (IE) on FTSE 100 337
CS ETF (IE) on FTSE MIB 338
CS ETF (IE) on iBoxx EUR Govt 1-3 339
CS ETF (IE) on iBoxx EUR Govt 3-7 340
CS ETF (IE) on iBoxx EUR Govt 7-10 341
CS ETF (IE) on iBoxx EUR Inflation Linked 342
CS ETF (IE) on iBoxx USD Govt 1-3 343
CS ETF (IE) on iBoxx USD Govt 3-7 344
CS ETF (IE) on iBoxx USD Govt 7-10 345
CS ETF (IE) on iBoxx USD Inflation Linked 346
CS ETF (IE) on MSCI Australia 347
CS ETF (IE) on MSCI Brazil 348
CS ETF (IE) on MSCI Canada 349
CS ETF (IE) on MSCI Chile 350
CS ETF (IE) on MSCI EM Asia 351
CS ETF (IE) on MSCI EM EMEA 352
CS ETF (IE) on MSCI EM Latin America 353
CS ETF (IE) on MSCI EMU 354
CS ETF (IE) on MSCI EMU Small Cap 355
CS ETF (IE) on MSCI Europe 356
CS ETF (IE) on MSCI India 357
CS ETF (IE) on MSCI Japan 358
CS ETF (IE) on MSCI Japan Large Cap 359
CS ETF (IE) on MSCI Japan Small Cap 360
CS ETF (IE) on MSCI Korea 361
CS ETF (IE) on MSCI Mexico Capped 362
CS ETF (IE) on MSCI Pacific ex Japan 363
CS ETF (IE) on MSCI Russia 364
CS ETF (IE) on MSCI South Africa 365
CS ETF (IE) on MSCI Taiwan 366
CS ETF (IE) on MSCI UK 367
CS ETF (IE) on MSCI UK Large Cap 368
CS ETF (IE) on MSCI UK Small Cap 369
CS ETF (IE) on MSCI USA 370
CS ETF (IE) on MSCI USA Large Cap 371
CS ETF (IE) on MSCI USA Small Cap 372
CS ETF (IE) on MSCI World 373
CS ETF (IE) on NASDAQ 100 374
CS ETF (IE) on Nikkei 225 375
CS ETF (IE) on S&P 500 376
CS ETF (Lux) on MSCI Emerging Markets 377
CS ETF (Lux) on MSCI EMU Large Cap 378
CS ETF (Lux) on MSCI EMU Mid Cap 379
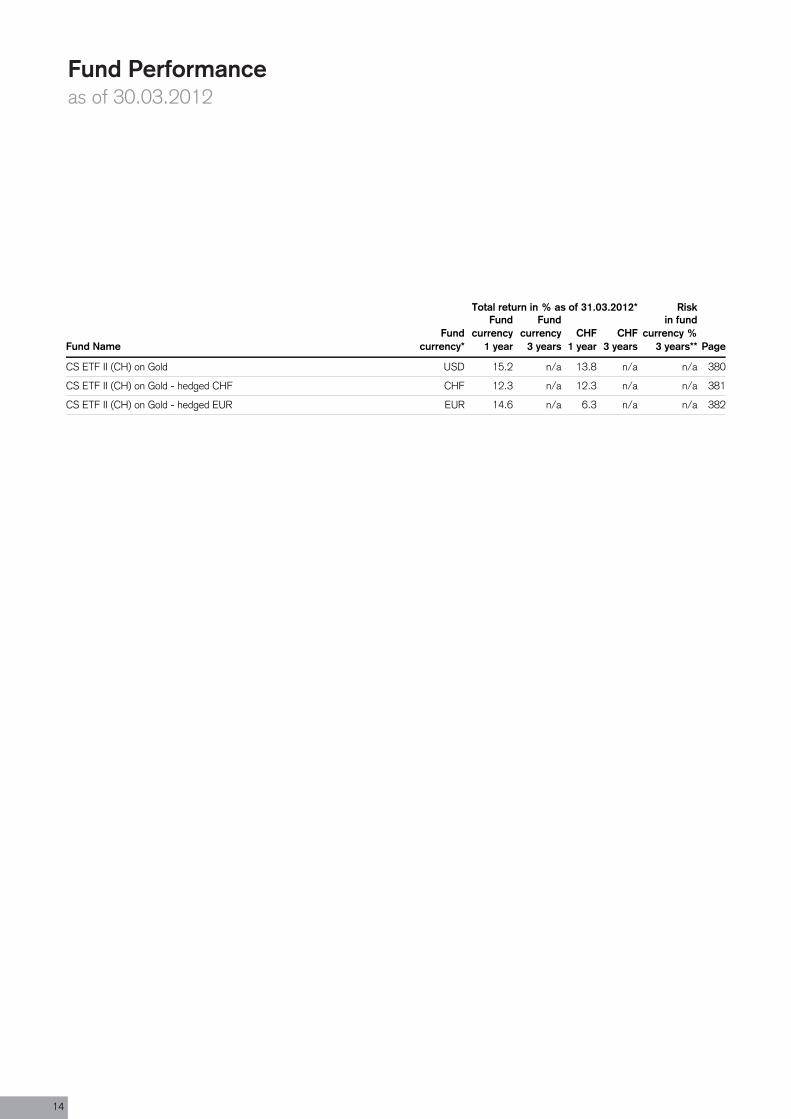
CS ETF II (CH) on Gold 380
CS ETF II (CH) on Gold - hedged CHF 381
CS ETF II (CH) on Gold - hedged EUR 382
InformationGlossary 384
Factsheet Explained 386
Where to find the current prices of our funds 388
Important Information 389
Contacts 392
Ove
rvie
w
5
Total return in % as of 31.03.2012* Risk
Fund NameFund
currency*
Fundcurrency
1 year
Fundcurrency
3 yearsCHF
1 yearCHF
3 years
in fundcurrency %
3 years** Page
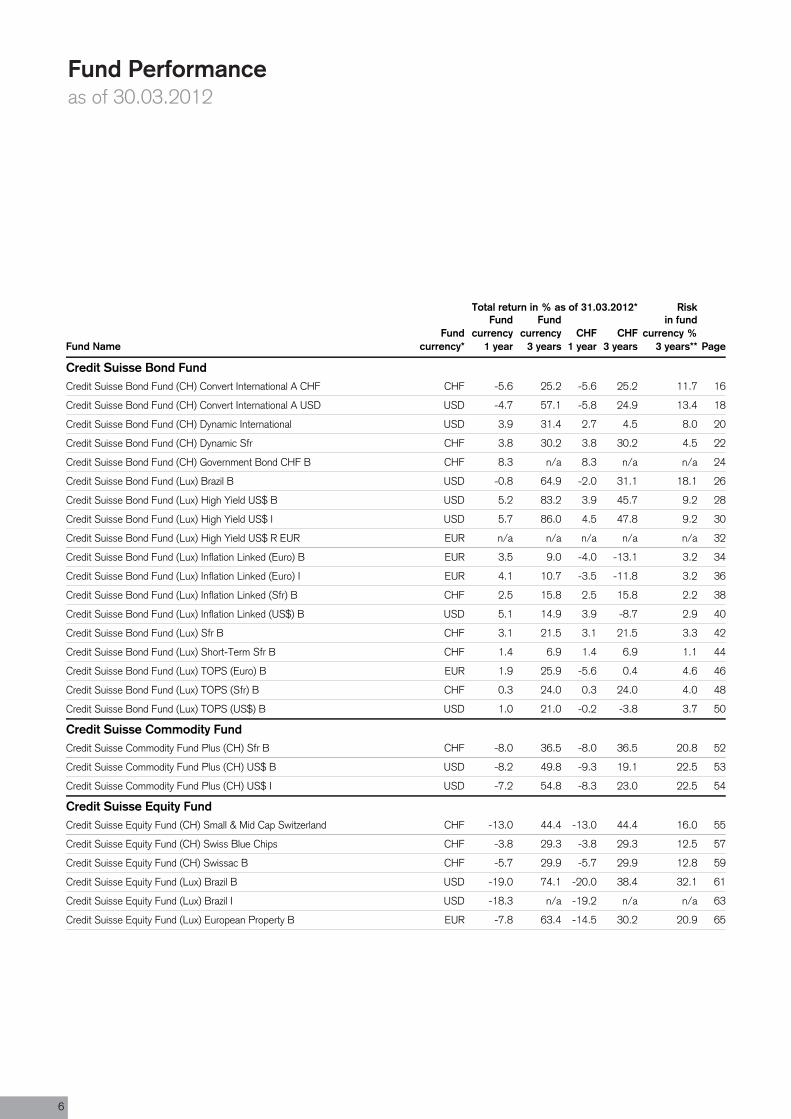
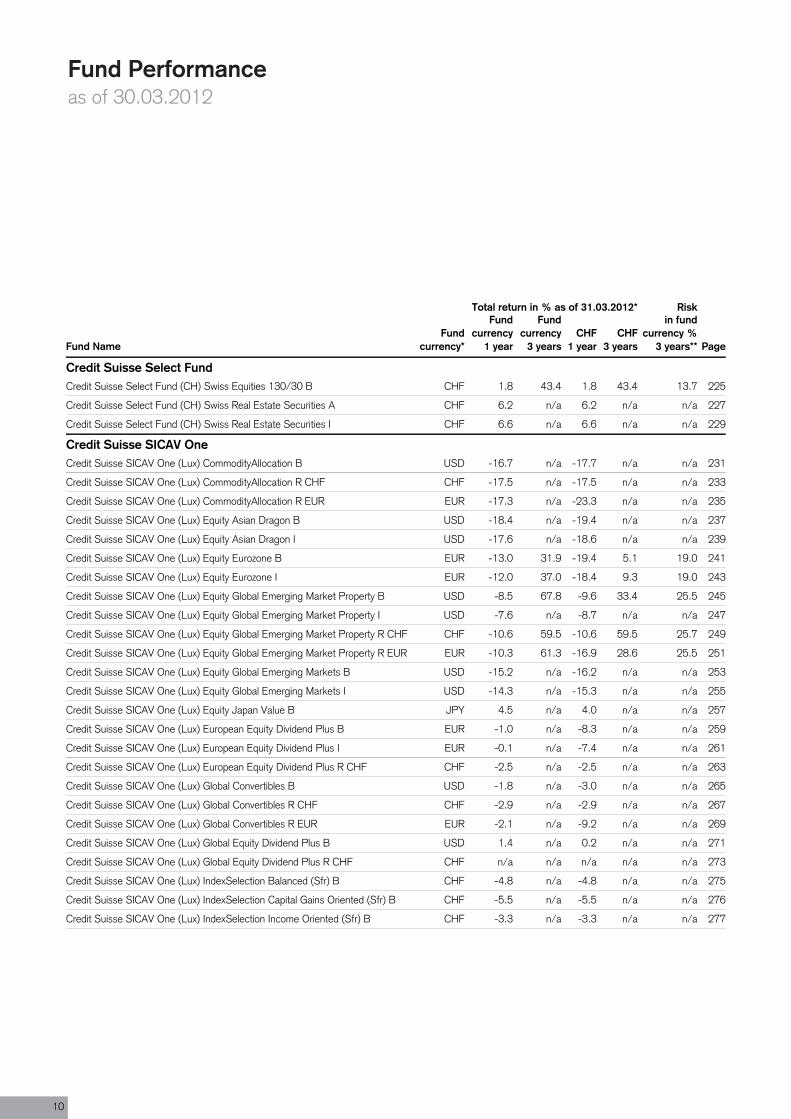
Credit Suisse Bond FundCredit Suisse Bond Fund (CH) Convert International A CHF CHF -5.6 25.2 -5.6 25.2 11.7 16
Credit Suisse Bond Fund (CH) Convert International A USD USD -4.7 57.1 -5.8 24.9 13.4 18
Credit Suisse Bond Fund (CH) Dynamic International USD 3.9 31.4 2.7 4.5 8.0 20
Credit Suisse Bond Fund (CH) Dynamic Sfr CHF 3.8 30.2 3.8 30.2 4.5 22
Credit Suisse Bond Fund (CH) Government Bond CHF B CHF 8.3 n/a 8.3 n/a n/a 24
Credit Suisse Bond Fund (Lux) Brazil B USD -0.8 64.9 -2.0 31.1 18.1 26
Credit Suisse Bond Fund (Lux) High Yield US$ B USD 5.2 83.2 3.9 45.7 9.2 28
Credit Suisse Bond Fund (Lux) High Yield US$ I USD 5.7 86.0 4.5 47.8 9.2 30
Credit Suisse Bond Fund (Lux) High Yield US$ R EUR EUR n/a n/a n/a n/a n/a 32
Credit Suisse Bond Fund (Lux) Inflation Linked (Euro) B EUR 3.5 9.0 -4.0 -13.1 3.2 34
Credit Suisse Bond Fund (Lux) Inflation Linked (Euro) I EUR 4.1 10.7 -3.5 -11.8 3.2 36
Credit Suisse Bond Fund (Lux) Inflation Linked (Sfr) B CHF 2.5 15.8 2.5 15.8 2.2 38
Credit Suisse Bond Fund (Lux) Inflation Linked (US$) B USD 5.1 14.9 3.9 -8.7 2.9 40
Credit Suisse Bond Fund (Lux) Sfr B CHF 3.1 21.5 3.1 21.5 3.3 42
Credit Suisse Bond Fund (Lux) Short-Term Sfr B CHF 1.4 6.9 1.4 6.9 1.1 44
Credit Suisse Bond Fund (Lux) TOPS (Euro) B EUR 1.9 25.9 -5.6 0.4 4.6 46
Credit Suisse Bond Fund (Lux) TOPS (Sfr) B CHF 0.3 24.0 0.3 24.0 4.0 48
Credit Suisse Bond Fund (Lux) TOPS (US$) B USD 1.0 21.0 -0.2 -3.8 3.7 50
Credit Suisse Commodity FundCredit Suisse Commodity Fund Plus (CH) Sfr B CHF -8.0 36.5 -8.0 36.5 20.8 52
Credit Suisse Commodity Fund Plus (CH) US$ B USD -8.2 49.8 -9.3 19.1 22.5 53
Credit Suisse Commodity Fund Plus (CH) US$ I USD -7.2 54.8 -8.3 23.0 22.5 54
Credit Suisse Equity FundCredit Suisse Equity Fund (CH) Small & Mid Cap Switzerland CHF -13.0 44.4 -13.0 44.4 16.0 55
Credit Suisse Equity Fund (CH) Swiss Blue Chips CHF -3.8 29.3 -3.8 29.3 12.5 57
Credit Suisse Equity Fund (CH) Swissac B CHF -5.7 29.9 -5.7 29.9 12.8 59
Credit Suisse Equity Fund (Lux) Brazil B USD -19.0 74.1 -20.0 38.4 32.1 61
Credit Suisse Equity Fund (Lux) Brazil I USD -18.3 n/a -19.2 n/a n/a 63
Credit Suisse Equity Fund (Lux) European Property B EUR -7.8 63.4 -14.5 30.2 20.9 65
Fund Performanceas of 30.03.2012
6
Total return in % as of 31.03.2012* Risk
Fund NameFund
currency*
Fundcurrency
1 year
Fundcurrency
3 yearsCHF
1 yearCHF
3 years
in fundcurrency %
3 years** Page
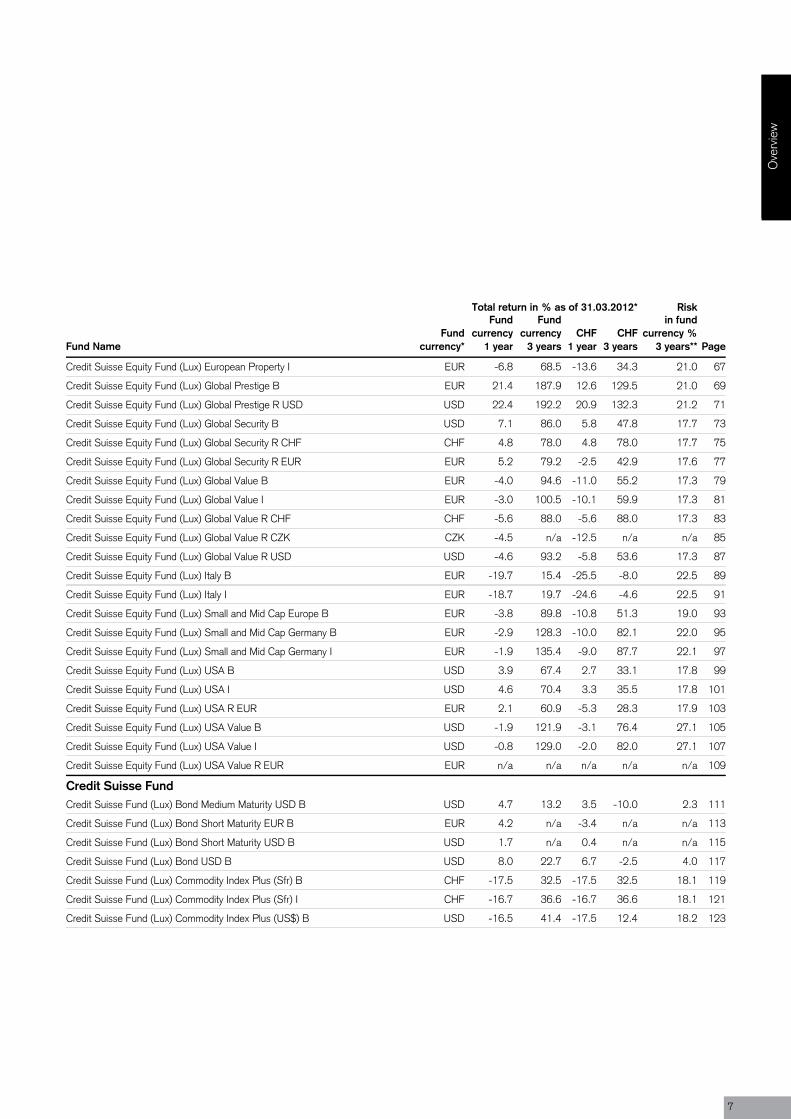
Credit Suisse Equity Fund (Lux) European Property I EUR -6.8 68.5 -13.6 34.3 21.0 67
Credit Suisse Equity Fund (Lux) Global Prestige B EUR 21.4 187.9 12.6 129.5 21.0 69
Credit Suisse Equity Fund (Lux) Global Prestige R USD USD 22.4 192.2 20.9 132.3 21.2 71
Credit Suisse Equity Fund (Lux) Global Security B USD 7.1 86.0 5.8 47.8 17.7 73
Credit Suisse Equity Fund (Lux) Global Security R CHF CHF 4.8 78.0 4.8 78.0 17.7 75
Credit Suisse Equity Fund (Lux) Global Security R EUR EUR 5.2 79.2 -2.5 42.9 17.6 77
Credit Suisse Equity Fund (Lux) Global Value B EUR -4.0 94.6 -11.0 55.2 17.3 79
Credit Suisse Equity Fund (Lux) Global Value I EUR -3.0 100.5 -10.1 59.9 17.3 81
Credit Suisse Equity Fund (Lux) Global Value R CHF CHF -5.6 88.0 -5.6 88.0 17.3 83
Credit Suisse Equity Fund (Lux) Global Value R CZK CZK -4.5 n/a -12.5 n/a n/a 85
Credit Suisse Equity Fund (Lux) Global Value R USD USD -4.6 93.2 -5.8 53.6 17.3 87
Credit Suisse Equity Fund (Lux) Italy B EUR -19.7 15.4 -25.5 -8.0 22.5 89
Credit Suisse Equity Fund (Lux) Italy I EUR -18.7 19.7 -24.6 -4.6 22.5 91
Credit Suisse Equity Fund (Lux) Small and Mid Cap Europe B EUR -3.8 89.8 -10.8 51.3 19.0 93
Credit Suisse Equity Fund (Lux) Small and Mid Cap Germany B EUR -2.9 128.3 -10.0 82.1 22.0 95
Credit Suisse Equity Fund (Lux) Small and Mid Cap Germany I EUR -1.9 135.4 -9.0 87.7 22.1 97
Credit Suisse Equity Fund (Lux) USA B USD 3.9 67.4 2.7 33.1 17.8 99
Credit Suisse Equity Fund (Lux) USA I USD 4.6 70.4 3.3 35.5 17.8 101
Credit Suisse Equity Fund (Lux) USA R EUR EUR 2.1 60.9 -5.3 28.3 17.9 103
Credit Suisse Equity Fund (Lux) USA Value B USD -1.9 121.9 -3.1 76.4 27.1 105
Credit Suisse Equity Fund (Lux) USA Value I USD -0.8 129.0 -2.0 82.0 27.1 107
Credit Suisse Equity Fund (Lux) USA Value R EUR EUR n/a n/a n/a n/a n/a 109
Credit Suisse FundCredit Suisse Fund (Lux) Bond Medium Maturity USD B USD 4.7 13.2 3.5 -10.0 2.3 111
Credit Suisse Fund (Lux) Bond Short Maturity EUR B EUR 4.2 n/a -3.4 n/a n/a 113
Credit Suisse Fund (Lux) Bond Short Maturity USD B USD 1.7 n/a 0.4 n/a n/a 115
Credit Suisse Fund (Lux) Bond USD B USD 8.0 22.7 6.7 -2.5 4.0 117
Credit Suisse Fund (Lux) Commodity Index Plus (Sfr) B CHF -17.5 32.5 -17.5 32.5 18.1 119
Credit Suisse Fund (Lux) Commodity Index Plus (Sfr) I CHF -16.7 36.6 -16.7 36.6 18.1 121
Credit Suisse Fund (Lux) Commodity Index Plus (US$) B USD -16.5 41.4 -17.5 12.4 18.2 123
Ove
rvie
w
7
Total return in % as of 31.03.2012* Risk
Fund NameFund
currency*
Fundcurrency
1 year
Fundcurrency
3 yearsCHF
1 yearCHF
3 years
in fundcurrency %
3 years** Page
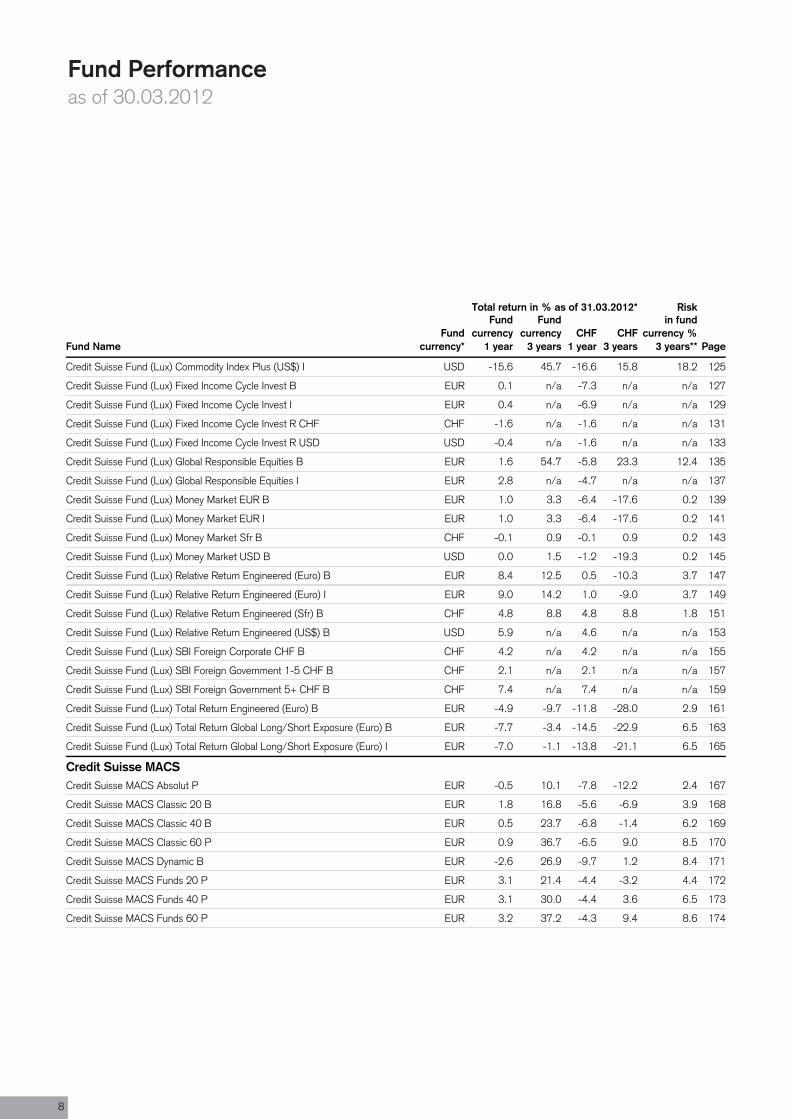
Credit Suisse Fund (Lux) Commodity Index Plus (US$) I USD -15.6 45.7 -16.6 15.8 18.2 125
Credit Suisse Fund (Lux) Fixed Income Cycle Invest B EUR 0.1 n/a -7.3 n/a n/a 127
Credit Suisse Fund (Lux) Fixed Income Cycle Invest I EUR 0.4 n/a -6.9 n/a n/a 129
Credit Suisse Fund (Lux) Fixed Income Cycle Invest R CHF CHF -1.6 n/a -1.6 n/a n/a 131
Credit Suisse Fund (Lux) Fixed Income Cycle Invest R USD USD -0.4 n/a -1.6 n/a n/a 133
Credit Suisse Fund (Lux) Global Responsible Equities B EUR 1.6 54.7 -5.8 23.3 12.4 135
Credit Suisse Fund (Lux) Global Responsible Equities I EUR 2.8 n/a -4.7 n/a n/a 137
Credit Suisse Fund (Lux) Money Market EUR B EUR 1.0 3.3 -6.4 -17.6 0.2 139
Credit Suisse Fund (Lux) Money Market EUR I EUR 1.0 3.3 -6.4 -17.6 0.2 141
Credit Suisse Fund (Lux) Money Market Sfr B CHF -0.1 0.9 -0.1 0.9 0.2 143
Credit Suisse Fund (Lux) Money Market USD B USD 0.0 1.5 -1.2 -19.3 0.2 145
Credit Suisse Fund (Lux) Relative Return Engineered (Euro) B EUR 8.4 12.5 0.5 -10.3 3.7 147
Credit Suisse Fund (Lux) Relative Return Engineered (Euro) I EUR 9.0 14.2 1.0 -9.0 3.7 149
Credit Suisse Fund (Lux) Relative Return Engineered (Sfr) B CHF 4.8 8.8 4.8 8.8 1.8 151
Credit Suisse Fund (Lux) Relative Return Engineered (US$) B USD 5.9 n/a 4.6 n/a n/a 153
Credit Suisse Fund (Lux) SBI Foreign Corporate CHF B CHF 4.2 n/a 4.2 n/a n/a 155
Credit Suisse Fund (Lux) SBI Foreign Government 1-5 CHF B CHF 2.1 n/a 2.1 n/a n/a 157
Credit Suisse Fund (Lux) SBI Foreign Government 5+ CHF B CHF 7.4 n/a 7.4 n/a n/a 159
Credit Suisse Fund (Lux) Total Return Engineered (Euro) B EUR -4.9 -9.7 -11.8 -28.0 2.9 161
Credit Suisse Fund (Lux) Total Return Global Long/Short Exposure (Euro) B EUR -7.7 -3.4 -14.5 -22.9 6.5 163
Credit Suisse Fund (Lux) Total Return Global Long/Short Exposure (Euro) I EUR -7.0 -1.1 -13.8 -21.1 6.5 165
Credit Suisse MACSCredit Suisse MACS Absolut P EUR -0.5 10.1 -7.8 -12.2 2.4 167
Credit Suisse MACS Classic 20 B EUR 1.8 16.8 -5.6 -6.9 3.9 168
Credit Suisse MACS Classic 40 B EUR 0.5 23.7 -6.8 -1.4 6.2 169
Credit Suisse MACS Classic 60 P EUR 0.9 36.7 -6.5 9.0 8.5 170
Credit Suisse MACS Dynamic B EUR -2.6 26.9 -9.7 1.2 8.4 171
Credit Suisse MACS Funds 20 P EUR 3.1 21.4 -4.4 -3.2 4.4 172
Credit Suisse MACS Funds 40 P EUR 3.1 30.0 -4.4 3.6 6.5 173
Credit Suisse MACS Funds 60 P EUR 3.2 37.2 -4.3 9.4 8.6 174
Fund Performanceas of 30.03.2012
8
Total return in % as of 31.03.2012* Risk
Fund NameFund
currency*
Fundcurrency
1 year
Fundcurrency
3 yearsCHF
1 yearCHF
3 years
in fundcurrency %
3 years** Page
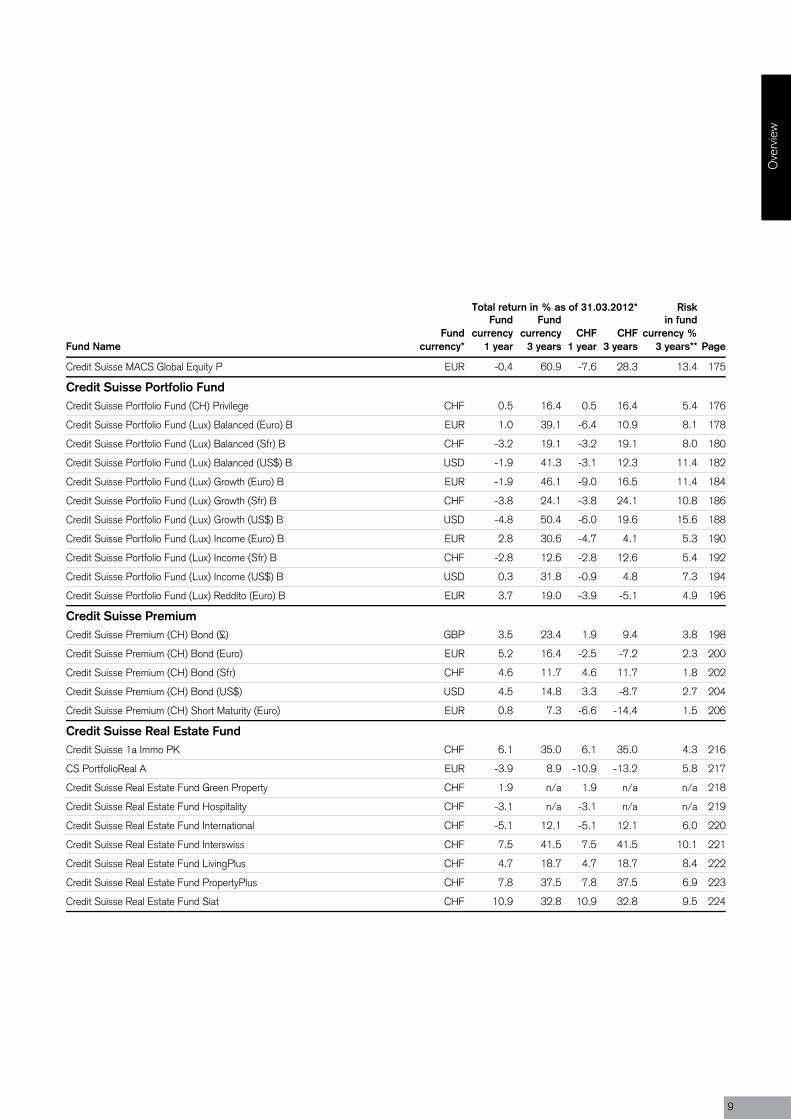
Credit Suisse MACS Global Equity P EUR -0.4 60.9 -7.6 28.3 13.4 175
Credit Suisse Portfolio FundCredit Suisse Portfolio Fund (CH) Privilege CHF 0.5 16.4 0.5 16.4 5.4 176
Credit Suisse Portfolio Fund (Lux) Balanced (Euro) B EUR 1.0 39.1 -6.4 10.9 8.1 178
Credit Suisse Portfolio Fund (Lux) Balanced (Sfr) B CHF -3.2 19.1 -3.2 19.1 8.0 180
Credit Suisse Portfolio Fund (Lux) Balanced (US$) B USD -1.9 41.3 -3.1 12.3 11.4 182
Credit Suisse Portfolio Fund (Lux) Growth (Euro) B EUR -1.9 46.1 -9.0 16.5 11.4 184
Credit Suisse Portfolio Fund (Lux) Growth (Sfr) B CHF -3.8 24.1 -3.8 24.1 10.8 186
Credit Suisse Portfolio Fund (Lux) Growth (US$) B USD -4.8 50.4 -6.0 19.6 15.6 188
Credit Suisse Portfolio Fund (Lux) Income (Euro) B EUR 2.8 30.6 -4.7 4.1 5.3 190
Credit Suisse Portfolio Fund (Lux) Income (Sfr) B CHF -2.8 12.6 -2.8 12.6 5.4 192
Credit Suisse Portfolio Fund (Lux) Income (US$) B USD 0.3 31.8 -0.9 4.8 7.3 194
Credit Suisse Portfolio Fund (Lux) Reddito (Euro) B EUR 3.7 19.0 -3.9 -5.1 4.9 196
Credit Suisse PremiumCredit Suisse Premium (CH) Bond (£) GBP 3.5 23.4 1.9 9.4 3.8 198
Credit Suisse Premium (CH) Bond (Euro) EUR 5.2 16.4 -2.5 -7.2 2.3 200
Credit Suisse Premium (CH) Bond (Sfr) CHF 4.6 11.7 4.6 11.7 1.8 202
Credit Suisse Premium (CH) Bond (US$) USD 4.5 14.8 3.3 -8.7 2.7 204
Credit Suisse Premium (CH) Short Maturity (Euro) EUR 0.8 7.3 -6.6 -14.4 1.5 206
Credit Suisse Real Estate FundCredit Suisse 1a Immo PK CHF 6.1 35.0 6.1 35.0 4.3 216
CS PortfolioReal A EUR -3.9 8.9 -10.9 -13.2 5.8 217
Credit Suisse Real Estate Fund Green Property CHF 1.9 n/a 1.9 n/a n/a 218
Credit Suisse Real Estate Fund Hospitality CHF -3.1 n/a -3.1 n/a n/a 219
Credit Suisse Real Estate Fund International CHF -5.1 12.1 -5.1 12.1 6.0 220
Credit Suisse Real Estate Fund Interswiss CHF 7.5 41.5 7.5 41.5 10.1 221
Credit Suisse Real Estate Fund LivingPlus CHF 4.7 18.7 4.7 18.7 8.4 222
Credit Suisse Real Estate Fund PropertyPlus CHF 7.8 37.5 7.8 37.5 6.9 223
Credit Suisse Real Estate Fund Siat CHF 10.9 32.8 10.9 32.8 9.5 224
Ove
rvie
w
9
Total return in % as of 31.03.2012* Risk
Fund NameFund
currency*
Fundcurrency
1 year
Fundcurrency
3 yearsCHF
1 yearCHF
3 years
in fundcurrency %
3 years** Page
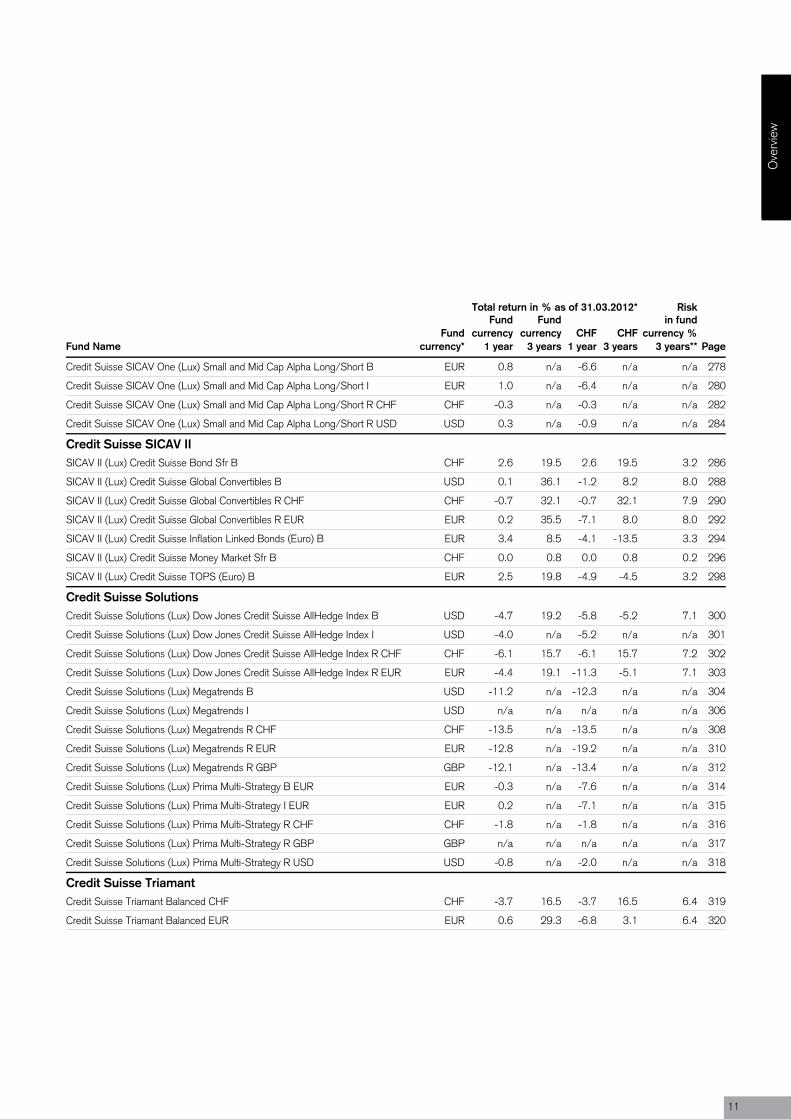
Credit Suisse Select FundCredit Suisse Select Fund (CH) Swiss Equities 130/30 B CHF 1.8 43.4 1.8 43.4 13.7 225
Credit Suisse Select Fund (CH) Swiss Real Estate Securities A CHF 6.2 n/a 6.2 n/a n/a 227
Credit Suisse Select Fund (CH) Swiss Real Estate Securities I CHF 6.6 n/a 6.6 n/a n/a 229
Credit Suisse SICAV OneCredit Suisse SICAV One (Lux) CommodityAllocation B USD -16.7 n/a -17.7 n/a n/a 231
Credit Suisse SICAV One (Lux) CommodityAllocation R CHF CHF -17.5 n/a -17.5 n/a n/a 233
Credit Suisse SICAV One (Lux) CommodityAllocation R EUR EUR -17.3 n/a -23.3 n/a n/a 235
Credit Suisse SICAV One (Lux) Equity Asian Dragon B USD -18.4 n/a -19.4 n/a n/a 237
Credit Suisse SICAV One (Lux) Equity Asian Dragon I USD -17.6 n/a -18.6 n/a n/a 239
Credit Suisse SICAV One (Lux) Equity Eurozone B EUR -13.0 31.9 -19.4 5.1 19.0 241
Credit Suisse SICAV One (Lux) Equity Eurozone I EUR -12.0 37.0 -18.4 9.3 19.0 243
Credit Suisse SICAV One (Lux) Equity Global Emerging Market Property B USD -8.5 67.8 -9.6 33.4 25.5 245
Credit Suisse SICAV One (Lux) Equity Global Emerging Market Property I USD -7.6 n/a -8.7 n/a n/a 247
Credit Suisse SICAV One (Lux) Equity Global Emerging Market Property R CHF CHF -10.6 59.5 -10.6 59.5 25.7 249
Credit Suisse SICAV One (Lux) Equity Global Emerging Market Property R EUR EUR -10.3 61.3 -16.9 28.6 25.5 251
Credit Suisse SICAV One (Lux) Equity Global Emerging Markets B USD -15.2 n/a -16.2 n/a n/a 253
Credit Suisse SICAV One (Lux) Equity Global Emerging Markets I USD -14.3 n/a -15.3 n/a n/a 255
Credit Suisse SICAV One (Lux) Equity Japan Value B JPY 4.5 n/a 4.0 n/a n/a 257
Credit Suisse SICAV One (Lux) European Equity Dividend Plus B EUR -1.0 n/a -8.3 n/a n/a 259
Credit Suisse SICAV One (Lux) European Equity Dividend Plus I EUR -0.1 n/a -7.4 n/a n/a 261
Credit Suisse SICAV One (Lux) European Equity Dividend Plus R CHF CHF -2.5 n/a -2.5 n/a n/a 263
Credit Suisse SICAV One (Lux) Global Convertibles B USD -1.8 n/a -3.0 n/a n/a 265
Credit Suisse SICAV One (Lux) Global Convertibles R CHF CHF -2.9 n/a -2.9 n/a n/a 267
Credit Suisse SICAV One (Lux) Global Convertibles R EUR EUR -2.1 n/a -9.2 n/a n/a 269
Credit Suisse SICAV One (Lux) Global Equity Dividend Plus B USD 1.4 n/a 0.2 n/a n/a 271
Credit Suisse SICAV One (Lux) Global Equity Dividend Plus R CHF CHF n/a n/a n/a n/a n/a 273
Credit Suisse SICAV One (Lux) IndexSelection Balanced (Sfr) B CHF -4.8 n/a -4.8 n/a n/a 275
Credit Suisse SICAV One (Lux) IndexSelection Capital Gains Oriented (Sfr) B CHF -5.5 n/a -5.5 n/a n/a 276
Credit Suisse SICAV One (Lux) IndexSelection Income Oriented (Sfr) B CHF -3.3 n/a -3.3 n/a n/a 277
Fund Performanceas of 30.03.2012
10
Total return in % as of 31.03.2012* Risk
Fund NameFund
currency*
Fundcurrency
1 year
Fundcurrency
3 yearsCHF
1 yearCHF
3 years
in fundcurrency %
3 years** Page
Credit Suisse SICAV One (Lux) Small and Mid Cap Alpha Long/Short B EUR 0.8 n/a -6.6 n/a n/a 278
Credit Suisse SICAV One (Lux) Small and Mid Cap Alpha Long/Short I EUR 1.0 n/a -6.4 n/a n/a 280
Credit Suisse SICAV One (Lux) Small and Mid Cap Alpha Long/Short R CHF CHF -0.3 n/a -0.3 n/a n/a 282
Credit Suisse SICAV One (Lux) Small and Mid Cap Alpha Long/Short R USD USD 0.3 n/a -0.9 n/a n/a 284
Credit Suisse SICAV IISICAV II (Lux) Credit Suisse Bond Sfr B CHF 2.6 19.5 2.6 19.5 3.2 286
SICAV II (Lux) Credit Suisse Global Convertibles B USD 0.1 36.1 -1.2 8.2 8.0 288
SICAV II (Lux) Credit Suisse Global Convertibles R CHF CHF -0.7 32.1 -0.7 32.1 7.9 290
SICAV II (Lux) Credit Suisse Global Convertibles R EUR EUR 0.2 35.5 -7.1 8.0 8.0 292
SICAV II (Lux) Credit Suisse Inflation Linked Bonds (Euro) B EUR 3.4 8.5 -4.1 -13.5 3.3 294
SICAV II (Lux) Credit Suisse Money Market Sfr B CHF 0.0 0.8 0.0 0.8 0.2 296
SICAV II (Lux) Credit Suisse TOPS (Euro) B EUR 2.5 19.8 -4.9 -4.5 3.2 298
Credit Suisse SolutionsCredit Suisse Solutions (Lux) Dow Jones Credit Suisse AllHedge Index B USD -4.7 19.2 -5.8 -5.2 7.1 300
Credit Suisse Solutions (Lux) Dow Jones Credit Suisse AllHedge Index I USD -4.0 n/a -5.2 n/a n/a 301
Credit Suisse Solutions (Lux) Dow Jones Credit Suisse AllHedge Index R CHF CHF -6.1 15.7 -6.1 15.7 7.2 302
Credit Suisse Solutions (Lux) Dow Jones Credit Suisse AllHedge Index R EUR EUR -4.4 19.1 -11.3 -5.1 7.1 303
Credit Suisse Solutions (Lux) Megatrends B USD -11.2 n/a -12.3 n/a n/a 304
Credit Suisse Solutions (Lux) Megatrends I USD n/a n/a n/a n/a n/a 306
Credit Suisse Solutions (Lux) Megatrends R CHF CHF -13.5 n/a -13.5 n/a n/a 308
Credit Suisse Solutions (Lux) Megatrends R EUR EUR -12.8 n/a -19.2 n/a n/a 310
Credit Suisse Solutions (Lux) Megatrends R GBP GBP -12.1 n/a -13.4 n/a n/a 312
Credit Suisse Solutions (Lux) Prima Multi-Strategy B EUR EUR -0.3 n/a -7.6 n/a n/a 314
Credit Suisse Solutions (Lux) Prima Multi-Strategy I EUR EUR 0.2 n/a -7.1 n/a n/a 315
Credit Suisse Solutions (Lux) Prima Multi-Strategy R CHF CHF -1.8 n/a -1.8 n/a n/a 316
Credit Suisse Solutions (Lux) Prima Multi-Strategy R GBP GBP n/a n/a n/a n/a n/a 317
Credit Suisse Solutions (Lux) Prima Multi-Strategy R USD USD -0.8 n/a -2.0 n/a n/a 318
Credit Suisse TriamantCredit Suisse Triamant Balanced CHF CHF -3.7 16.5 -3.7 16.5 6.4 319
Credit Suisse Triamant Balanced EUR EUR 0.6 29.3 -6.8 3.1 6.4 320
Ove
rvie
w
11
Total return in % as of 31.03.2012* Risk
Fund NameFund
currency*
Fundcurrency
1 year
Fundcurrency
3 yearsCHF
1 yearCHF
3 years
in fundcurrency %
3 years** Page
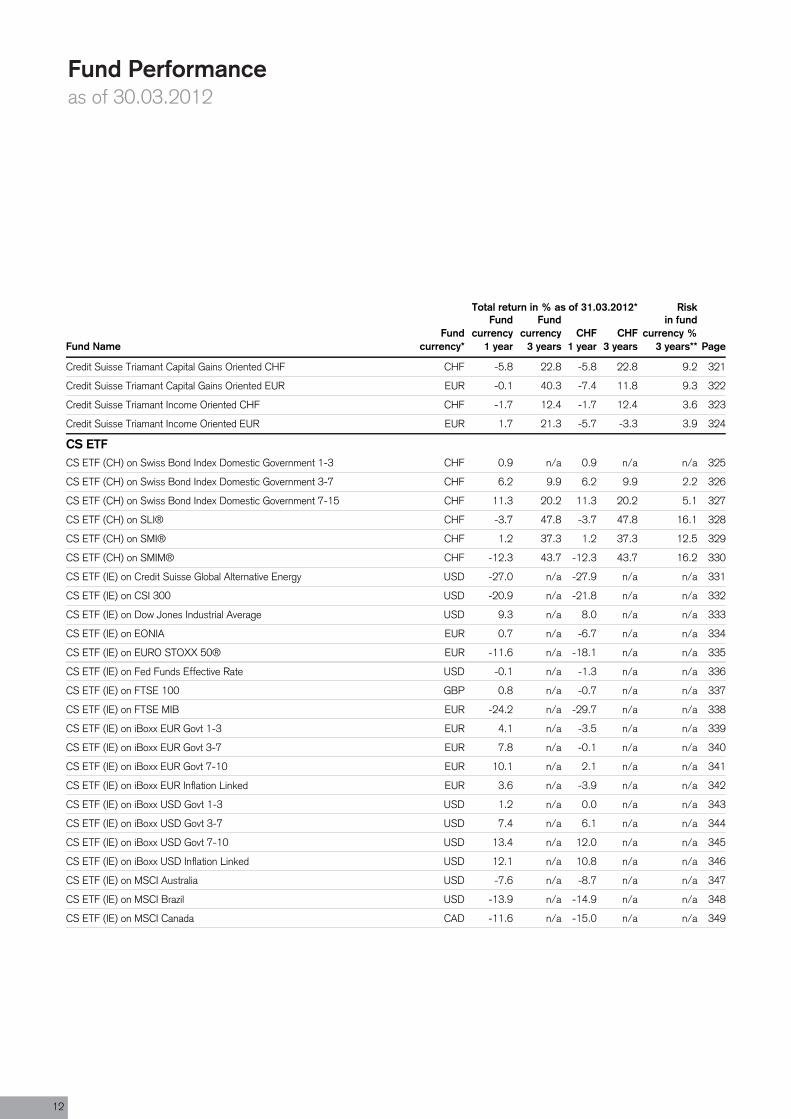
Credit Suisse Triamant Capital Gains Oriented CHF CHF -5.8 22.8 -5.8 22.8 9.2 321
Credit Suisse Triamant Capital Gains Oriented EUR EUR -0.1 40.3 -7.4 11.8 9.3 322
Credit Suisse Triamant Income Oriented CHF CHF -1.7 12.4 -1.7 12.4 3.6 323
Credit Suisse Triamant Income Oriented EUR EUR 1.7 21.3 -5.7 -3.3 3.9 324
CS ETFCS ETF (CH) on Swiss Bond Index Domestic Government 1-3 CHF 0.9 n/a 0.9 n/a n/a 325
CS ETF (CH) on Swiss Bond Index Domestic Government 3-7 CHF 6.2 9.9 6.2 9.9 2.2 326
CS ETF (CH) on Swiss Bond Index Domestic Government 7-15 CHF 11.3 20.2 11.3 20.2 5.1 327
CS ETF (CH) on SLI® CHF -3.7 47.8 -3.7 47.8 16.1 328
CS ETF (CH) on SMI® CHF 1.2 37.3 1.2 37.3 12.5 329
CS ETF (CH) on SMIM® CHF -12.3 43.7 -12.3 43.7 16.2 330
CS ETF (IE) on Credit Suisse Global Alternative Energy USD -27.0 n/a -27.9 n/a n/a 331
CS ETF (IE) on CSI 300 USD -20.9 n/a -21.8 n/a n/a 332
CS ETF (IE) on Dow Jones Industrial Average USD 9.3 n/a 8.0 n/a n/a 333
CS ETF (IE) on EONIA EUR 0.7 n/a -6.7 n/a n/a 334
CS ETF (IE) on EURO STOXX 50® EUR -11.6 n/a -18.1 n/a n/a 335
CS ETF (IE) on Fed Funds Effective Rate USD -0.1 n/a -1.3 n/a n/a 336
CS ETF (IE) on FTSE 100 GBP 0.8 n/a -0.7 n/a n/a 337
CS ETF (IE) on FTSE MIB EUR -24.2 n/a -29.7 n/a n/a 338
CS ETF (IE) on iBoxx EUR Govt 1-3 EUR 4.1 n/a -3.5 n/a n/a 339
CS ETF (IE) on iBoxx EUR Govt 3-7 EUR 7.8 n/a -0.1 n/a n/a 340
CS ETF (IE) on iBoxx EUR Govt 7-10 EUR 10.1 n/a 2.1 n/a n/a 341
CS ETF (IE) on iBoxx EUR Inflation Linked EUR 3.6 n/a -3.9 n/a n/a 342
CS ETF (IE) on iBoxx USD Govt 1-3 USD 1.2 n/a 0.0 n/a n/a 343
CS ETF (IE) on iBoxx USD Govt 3-7 USD 7.4 n/a 6.1 n/a n/a 344
CS ETF (IE) on iBoxx USD Govt 7-10 USD 13.4 n/a 12.0 n/a n/a 345
CS ETF (IE) on iBoxx USD Inflation Linked USD 12.1 n/a 10.8 n/a n/a 346
CS ETF (IE) on MSCI Australia USD -7.6 n/a -8.7 n/a n/a 347
CS ETF (IE) on MSCI Brazil USD -13.9 n/a -14.9 n/a n/a 348
CS ETF (IE) on MSCI Canada CAD -11.6 n/a -15.0 n/a n/a 349
Fund Performanceas of 30.03.2012
12
Total return in % as of 31.03.2012* Risk
Fund NameFund
currency*
Fundcurrency
1 year
Fundcurrency
3 yearsCHF
1 yearCHF
3 years
in fundcurrency %
3 years** Page
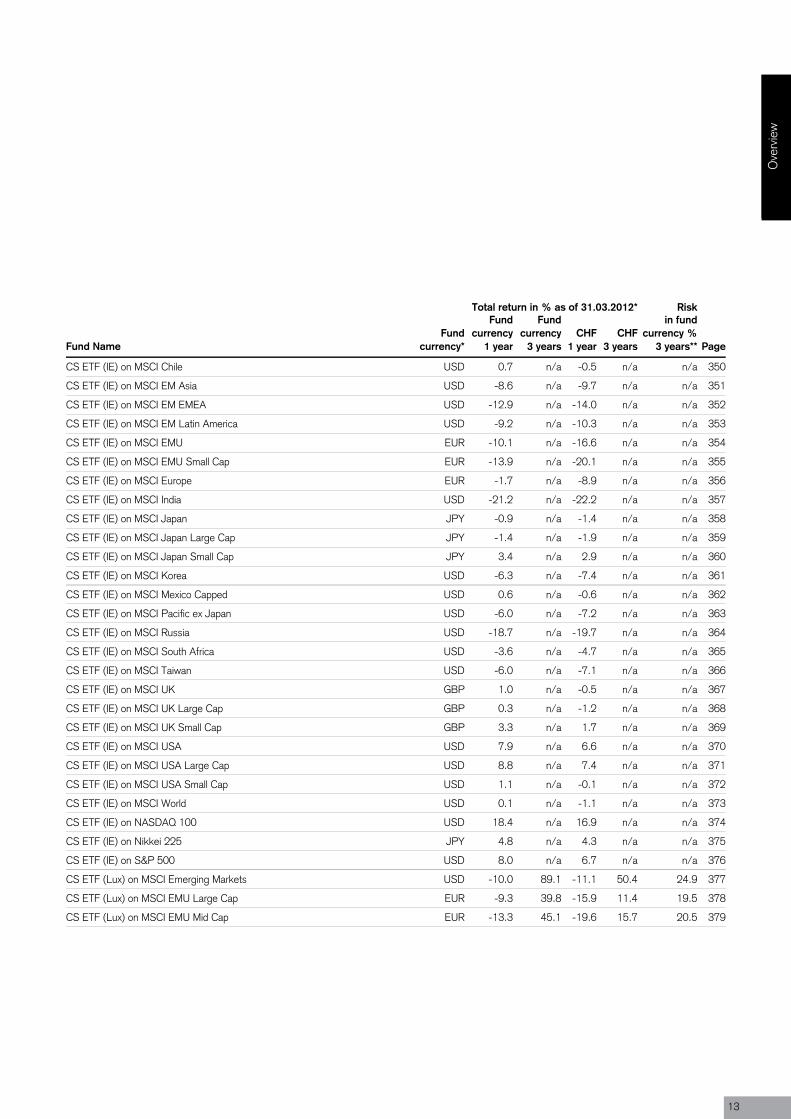
CS ETF (IE) on MSCI Chile USD 0.7 n/a -0.5 n/a n/a 350
CS ETF (IE) on MSCI EM Asia USD -8.6 n/a -9.7 n/a n/a 351
CS ETF (IE) on MSCI EM EMEA USD -12.9 n/a -14.0 n/a n/a 352
CS ETF (IE) on MSCI EM Latin America USD -9.2 n/a -10.3 n/a n/a 353
CS ETF (IE) on MSCI EMU EUR -10.1 n/a -16.6 n/a n/a 354
CS ETF (IE) on MSCI EMU Small Cap EUR -13.9 n/a -20.1 n/a n/a 355
CS ETF (IE) on MSCI Europe EUR -1.7 n/a -8.9 n/a n/a 356
CS ETF (IE) on MSCI India USD -21.2 n/a -22.2 n/a n/a 357
CS ETF (IE) on MSCI Japan JPY -0.9 n/a -1.4 n/a n/a 358
CS ETF (IE) on MSCI Japan Large Cap JPY -1.4 n/a -1.9 n/a n/a 359
CS ETF (IE) on MSCI Japan Small Cap JPY 3.4 n/a 2.9 n/a n/a 360
CS ETF (IE) on MSCI Korea USD -6.3 n/a -7.4 n/a n/a 361
CS ETF (IE) on MSCI Mexico Capped USD 0.6 n/a -0.6 n/a n/a 362
CS ETF (IE) on MSCI Pacific ex Japan USD -6.0 n/a -7.2 n/a n/a 363
CS ETF (IE) on MSCI Russia USD -18.7 n/a -19.7 n/a n/a 364
CS ETF (IE) on MSCI South Africa USD -3.6 n/a -4.7 n/a n/a 365
CS ETF (IE) on MSCI Taiwan USD -6.0 n/a -7.1 n/a n/a 366
CS ETF (IE) on MSCI UK GBP 1.0 n/a -0.5 n/a n/a 367
CS ETF (IE) on MSCI UK Large Cap GBP 0.3 n/a -1.2 n/a n/a 368
CS ETF (IE) on MSCI UK Small Cap GBP 3.3 n/a 1.7 n/a n/a 369
CS ETF (IE) on MSCI USA USD 7.9 n/a 6.6 n/a n/a 370
CS ETF (IE) on MSCI USA Large Cap USD 8.8 n/a 7.4 n/a n/a 371
CS ETF (IE) on MSCI USA Small Cap USD 1.1 n/a -0.1 n/a n/a 372
CS ETF (IE) on MSCI World USD 0.1 n/a -1.1 n/a n/a 373
CS ETF (IE) on NASDAQ 100 USD 18.4 n/a 16.9 n/a n/a 374
CS ETF (IE) on Nikkei 225 JPY 4.8 n/a 4.3 n/a n/a 375
CS ETF (IE) on S&P 500 USD 8.0 n/a 6.7 n/a n/a 376
CS ETF (Lux) on MSCI Emerging Markets USD -10.0 89.1 -11.1 50.4 24.9 377
CS ETF (Lux) on MSCI EMU Large Cap EUR -9.3 39.8 -15.9 11.4 19.5 378
CS ETF (Lux) on MSCI EMU Mid Cap EUR -13.3 45.1 -19.6 15.7 20.5 379
Ove
rvie
w
13
Total return in % as of 31.03.2012* Risk
Fund NameFund
currency*
Fundcurrency
1 year
Fundcurrency
3 yearsCHF
1 yearCHF
3 years
in fundcurrency %
3 years** Page
CS ETF II (CH) on Gold USD 15.2 n/a 13.8 n/a n/a 380
CS ETF II (CH) on Gold - hedged CHF CHF 12.3 n/a 12.3 n/a n/a 381
CS ETF II (CH) on Gold - hedged EUR EUR 14.6 n/a 6.3 n/a n/a 382
Fund Performanceas of 30.03.2012
14
Total return in % as of 29.02.2012* Risk
Fund NameFund
currency*
Fundcurrency
1 year
Fundcurrency
3 yearsCHF
1 yearCHF
3 years
in fundcurrency %
3 years** Page
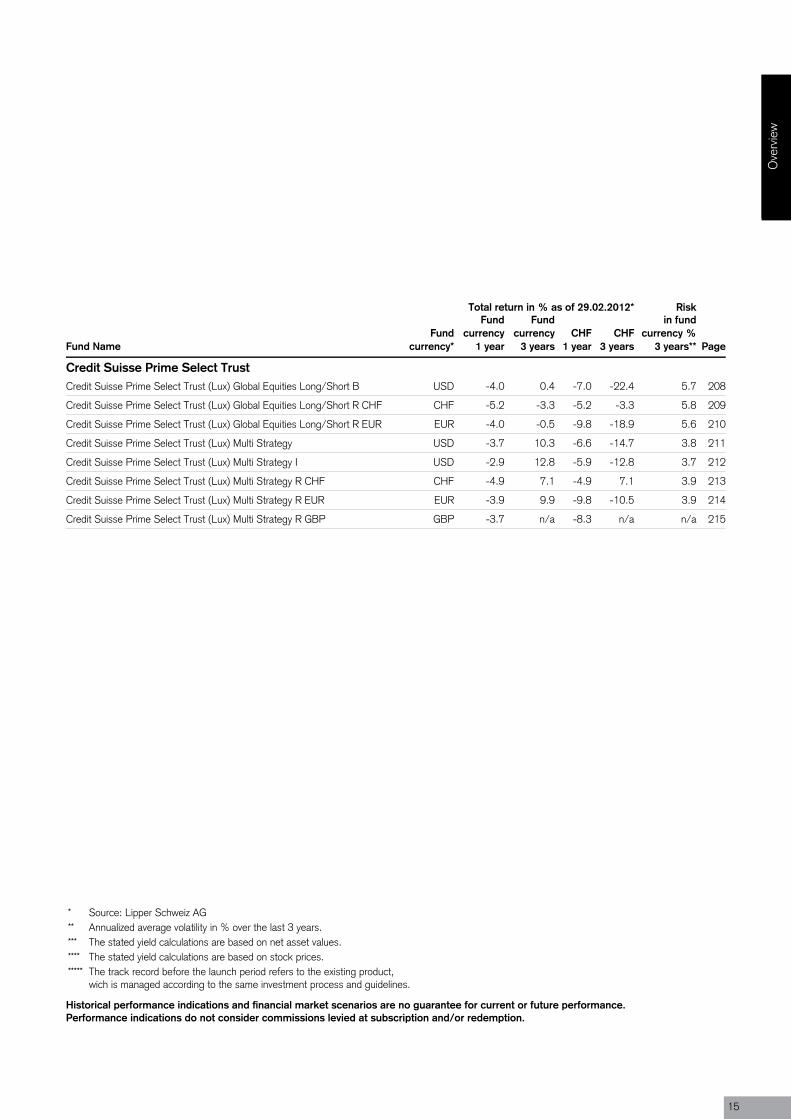
Credit Suisse Prime Select TrustCredit Suisse Prime Select Trust (Lux) Global Equities Long/Short B USD -4.0 0.4 -7.0 -22.4 5.7 208
Credit Suisse Prime Select Trust (Lux) Global Equities Long/Short R CHF CHF -5.2 -3.3 -5.2 -3.3 5.8 209
Credit Suisse Prime Select Trust (Lux) Global Equities Long/Short R EUR EUR -4.0 -0.5 -9.8 -18.9 5.6 210
Credit Suisse Prime Select Trust (Lux) Multi Strategy USD -3.7 10.3 -6.6 -14.7 3.8 211
Credit Suisse Prime Select Trust (Lux) Multi Strategy I USD -2.9 12.8 -5.9 -12.8 3.7 212
Credit Suisse Prime Select Trust (Lux) Multi Strategy R CHF CHF -4.9 7.1 -4.9 7.1 3.9 213
Credit Suisse Prime Select Trust (Lux) Multi Strategy R EUR EUR -3.9 9.9 -9.8 -10.5 3.9 214
Credit Suisse Prime Select Trust (Lux) Multi Strategy R GBP GBP -3.7 n/a -8.3 n/a n/a 215
* Source: Lipper Schweiz AG** Annualized average volatility in % over the last 3 years.*** The stated yield calculations are based on net asset values.**** The stated yield calculations are based on stock prices.***** The track record before the launch period refers to the existing product,
wich is managed according to the same investment process and guidelines.
Historical performance indications and financial market scenarios are no guarantee for current or future performance.Performance indications do not consider commissions levied at subscription and/or redemption.
Ove
rvie
w
15
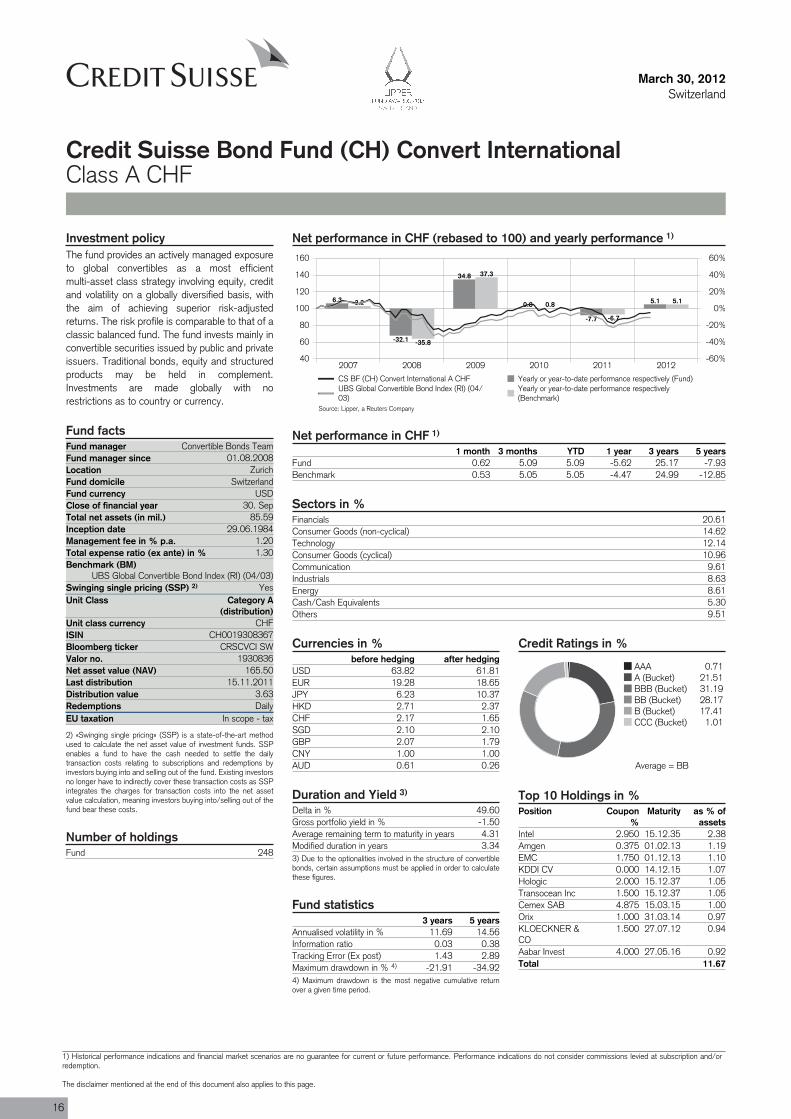
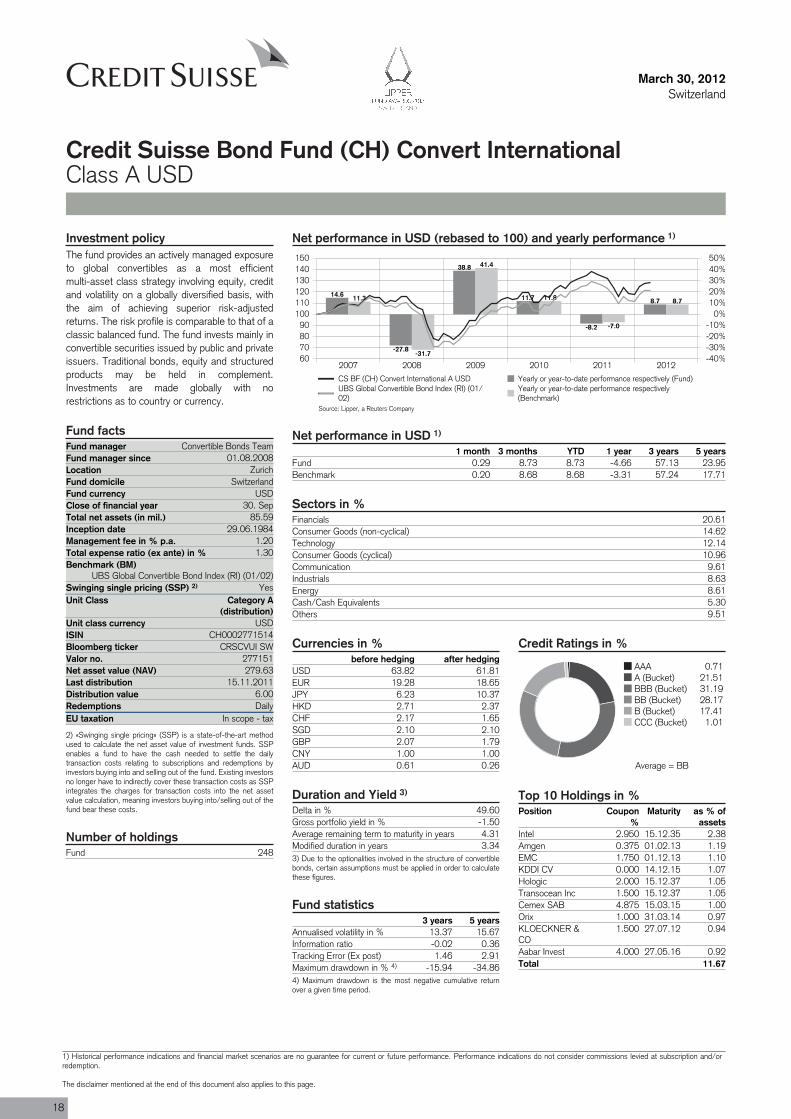
Fund manager Convertible Bonds TeamFund manager since 01.08.2008Location ZurichFund domicile SwitzerlandFund currency USDClose of financial year 30. SepTotal net assets (in mil.) 85.59Inception date 29.06.1984Management fee in % p.a. 1.20Total expense ratio (ex ante) in % 1.30Benchmark (BM)
UBS Global Convertible Bond Index (RI) (04/03)Swinging single pricing (SSP) 2) YesUnit Class Category A
(distribution)
ISIN CH0019308367
Valor no. 1930836
Last distribution 15.11.2011Distribution value 3.63Redemptions DailyEU taxation In scope - tax
Fund 248
March 30, 2012Switzerland
Credit Suisse Bond Fund (CH) Convert InternationalClass A CHF
Net performance in CHF (rebased to 100) and yearly performance 1)
2007 2008 2009 2010 2011 201240
60
80
100
120
140
160
-60%
-40%
-20%
0%
20%
40%
60%
6.3
-32.1
34.8
0.8
-7.7
5.13.2
-35.8
37.3
0.8
-6.7
5.1
CS BF (CH) Convert International A CHF Yearly or year-to-date performance respectively (Fund)UBS Global Convertible Bond Index (RI) (04/03)
Yearly or year-to-date performance respectively(Benchmark)
Net performance in CHF 1)
1 month 3 months YTD 1 year 3 years 5 yearsFund 0.62 5.09 5.09 -5.62 25.17 -7.93Benchmark 0.53 5.05 5.05 -4.47 24.99 -12.85
Sectors in %Financials 20.61Consumer Goods (non-cyclical) 14.62Technology 12.14Consumer Goods (cyclical) 10.96Communication 9.61Industrials 8.63Energy 8.61Cash/Cash Equivalents 5.30Others 9.51
Currencies in %before hedging after hedging
USD 63.82 61.81EUR 19.28 18.65JPY 6.23 10.37HKD 2.71 2.37CHF 2.17 1.65SGD 2.10 2.10GBP 2.07 1.79CNY 1.00 1.00AUD 0.61 0.26
Credit Ratings in %
AAA 0.71A (Bucket) 21.51BBB (Bucket) 31.19BB (Bucket) 28.17B (Bucket) 17.41CCC (Bucket) 1.01
Top 10 Holdings in %Position Coupon
%Maturity as % of
assetsIntel 2.950 15.12.35 2.38Amgen 0.375 01.02.13 1.19EMC 1.750 01.12.13 1.10KDDI CV 0.000 14.12.15 1.07Hologic 2.000 15.12.37 1.05Transocean Inc 1.500 15.12.37 1.05Cemex SAB 4.875 15.03.15 1.00Orix 1.000 31.03.14 0.97KLOECKNER &CO
1.500 27.07.12 0.94
Aabar Invest 4.000 27.05.16 0.92Total 11.67
Duration and Yield 3)
Delta in % 49.60Gross portfolio yield in % -1.50Average remaining term to maturity in years 4.31Modified duration in years 3.343) Due to the optionalities involved in the structure of convertiblebonds, certain assumptions must be applied in order to calculatethese figures.
Fund statistics3 years 5 years
Annualised volatility in % 11.69 14.56Information ratio 0.03 0.38Tracking Error (Ex post) 1.43 2.89Maximum drawdown in % 4) -21.91 -34.924) Maximum drawdown is the most negative cumulative returnover a given time period.
Investment policyThe fund provides an actively managed exposureto global convertibles as a most efficientmulti-asset class strategy involving equity, creditand volatility on a globally diversified basis, withthe aim of achieving superior risk-adjustedreturns. The risk profile is comparable to that of aclassic balanced fund. The fund invests mainly inconvertible securities issued by public and privateissuers. Traditional bonds, equity and structuredproducts may be held in complement.Investments are made globally with norestrictions as to country or currency.
Fund facts
Unit class currency CHF
Bloomberg ticker CRSCVCI SW
Net asset value (NAV) 165.50
2) «Swinging single pricing» (SSP) is a state-of-the-art methodused to calculate the net asset value of investment funds. SSPenables a fund to have the cash needed to settle the dailytransaction costs relating to subscriptions and redemptions byinvestors buying into and selling out of the fund. Existing investorsno longer have to indirectly cover these transaction costs as SSPintegrates the charges for transaction costs into the net assetvalue calculation, meaning investors buying into/selling out of thefund bear these costs.
Number of holdings
Source: Lipper, a Reuters Company
Average = BB
16
1) Historical performance indications and financial market scenarios are no guarantee for current or future performance. Performance indications do not consider commissions levied at subscription and/orredemption.
The disclaimer mentioned at the end of this document also applies to this page.
March 30, 2012Switzerland
Credit Suisse Bond Fund (CH) Convert InternationalClass A CHF
Review previous quarter 5)
Global convertibles had a great start to the yearand returned 8.8% in Q1 2012 (currencyhedged), whereas the investment grade part ofthe universe showed a return of 5.7%. Thispositive performance was mainly attributed tostrong global equity markets and further spreadtightening.
In general, the investment environment improvedand rising investor sentiment gave equity marketsthe needed support for growth. Since themassive interventions by the ECB, financial
system stability has improved and the downsiderisk to the global economy has been reduced. Inthe US, with the unemployment rate remainingstable at 8.3% and unemployment benefit claimsfalling to the lowest level since April 2008,consumer confidence reached thesecond-highest level in four years and retail salesclimbed by most in five months. On the otherhand, inflation rose in February the most in 10months, mainly driven by gasoline prices.
In the BRIC countries (especially China and
India), stimulating monetary policy improved theoutlook for risky assets and equity marketscontinued to rise in light of the momentum builtup in December. With regards to convertiblessector performances, all were in positive territory.The highest contributions came fromTechnology, Industrial Goods and Healthcare,whereas Food & Beverage, Chemicals and Retailwere more or less flat. Convertibles primarymarket activity of USD 8.8bn in March, thehighest since June 2011, brought the totalissuance in the first quarter to USD 15.1bn.
Outlook for the market 5)
The economic climate remains supportive, butoverbought market conditions are impairing thenear-term technical picture. We are proceedingon the assumption that the headwinds(technicals, euro area crisis and geopoliticalrisks) will have only very short-livedconsequences for the markets.
We have a positive medium-term stance on
stocks and would therefore take advantage ofshare price setbacks to increase the exposure insome convertibles. On the regional side, we stillfavor the US due to its defensive characteristicsand its further improving fundamentals, whereasour view on Japan is neutral. We still likeemerging markets in the long-term due to theirpositive fundamentals and growth prospects, butare cautious in the short-term.
In general, global valuations and sentiment haveimproved and we expect a robust earningsseason ahead. We remain neutrally positioned interms of equity sensitivity across all convertibleproducts, looking for alpha generation oncompany selection level.
Portfolio ManagementThe portfolio is managed by a team of experienced investment professionals who are based in Zurich. The fund is managed according to the team's view onsecurity selection, equity sectors, equity sensitivity, credit, and duration. The team includes several portfolio managers who contribute to the co-managementof the fund according to their area of expertise.
Cre
dit S
uiss
e B
ond
Fund
5) If not expressly indicated otherwise, all quantitative data contained in this comment is based on Lipper, Bloomberg or Datastream.
17
Fund manager Convertible Bonds TeamFund manager since 01.08.2008Location ZurichFund domicile SwitzerlandFund currency USDClose of financial year 30. SepTotal net assets (in mil.) 85.59Inception date 29.06.1984Management fee in % p.a. 1.20Total expense ratio (ex ante) in % 1.30Benchmark (BM)
UBS Global Convertible Bond Index (RI) (01/02)Swinging single pricing (SSP) 2) YesUnit Class Category A
(distribution)
ISIN CH0002771514
Valor no. 277151
Last distribution 15.11.2011Distribution value 6.00Redemptions DailyEU taxation In scope - tax
Fund 248
March 30, 2012Switzerland
Credit Suisse Bond Fund (CH) Convert InternationalClass A USD
Net performance in USD (rebased to 100) and yearly performance 1)
2007 2008 2009 2010 2011 201260708090
100110120130140150
-40%-30%-20%-10%
0%10%20%30%40%50%
14.6
-27.8
38.8
11.7
-8.2
8.711.3
-31.7
41.4
11.8
-7.0
8.7
CS BF (CH) Convert International A USD Yearly or year-to-date performance respectively (Fund)UBS Global Convertible Bond Index (RI) (01/02)
Yearly or year-to-date performance respectively(Benchmark)
Net performance in USD 1)
1 month 3 months YTD 1 year 3 years 5 yearsFund 0.29 8.73 8.73 -4.66 57.13 23.95Benchmark 0.20 8.68 8.68 -3.31 57.24 17.71
Sectors in %Financials 20.61Consumer Goods (non-cyclical) 14.62Technology 12.14Consumer Goods (cyclical) 10.96Communication 9.61Industrials 8.63Energy 8.61Cash/Cash Equivalents 5.30Others 9.51
Currencies in %before hedging after hedging
USD 63.82 61.81EUR 19.28 18.65JPY 6.23 10.37HKD 2.71 2.37CHF 2.17 1.65SGD 2.10 2.10GBP 2.07 1.79CNY 1.00 1.00AUD 0.61 0.26
Credit Ratings in %
AAA 0.71A (Bucket) 21.51BBB (Bucket) 31.19BB (Bucket) 28.17B (Bucket) 17.41CCC (Bucket) 1.01
Top 10 Holdings in %Position Coupon
%Maturity as % of
assetsIntel 2.950 15.12.35 2.38Amgen 0.375 01.02.13 1.19EMC 1.750 01.12.13 1.10KDDI CV 0.000 14.12.15 1.07Hologic 2.000 15.12.37 1.05Transocean Inc 1.500 15.12.37 1.05Cemex SAB 4.875 15.03.15 1.00Orix 1.000 31.03.14 0.97KLOECKNER &CO
1.500 27.07.12 0.94
Aabar Invest 4.000 27.05.16 0.92Total 11.67
Duration and Yield 3)
Delta in % 49.60Gross portfolio yield in % -1.50Average remaining term to maturity in years 4.31Modified duration in years 3.343) Due to the optionalities involved in the structure of convertiblebonds, certain assumptions must be applied in order to calculatethese figures.
Fund statistics3 years 5 years
Annualised volatility in % 13.37 15.67Information ratio -0.02 0.36Tracking Error (Ex post) 1.46 2.91Maximum drawdown in % 4) -15.94 -34.864) Maximum drawdown is the most negative cumulative returnover a given time period.
Investment policyThe fund provides an actively managed exposureto global convertibles as a most efficientmulti-asset class strategy involving equity, creditand volatility on a globally diversified basis, withthe aim of achieving superior risk-adjustedreturns. The risk profile is comparable to that of aclassic balanced fund. The fund invests mainly inconvertible securities issued by public and privateissuers. Traditional bonds, equity and structuredproducts may be held in complement.Investments are made globally with norestrictions as to country or currency.
Fund facts
Unit class currency USD
Bloomberg ticker CRSCVUI SW
Net asset value (NAV) 279.63
2) «Swinging single pricing» (SSP) is a state-of-the-art methodused to calculate the net asset value of investment funds. SSPenables a fund to have the cash needed to settle the dailytransaction costs relating to subscriptions and redemptions byinvestors buying into and selling out of the fund. Existing investorsno longer have to indirectly cover these transaction costs as SSPintegrates the charges for transaction costs into the net assetvalue calculation, meaning investors buying into/selling out of thefund bear these costs.
Number of holdings
Source: Lipper, a Reuters Company
Average = BB
18
1) Historical performance indications and financial market scenarios are no guarantee for current or future performance. Performance indications do not consider commissions levied at subscription and/orredemption.
The disclaimer mentioned at the end of this document also applies to this page.

March 30, 2012Switzerland
Credit Suisse Bond Fund (CH) Convert InternationalClass A USD
Review previous quarter 5)
Global convertibles had a great start to the yearand returned 8.8% in Q1 2012 (currencyhedged), whereas the investment grade part ofthe universe showed a return of 5.7%. Thispositive performance was mainly attributed tostrong global equity markets and further spreadtightening.
In general, the investment environment improvedand rising investor sentiment gave equity marketsthe needed support for growth. Since themassive interventions by the ECB, financial
system stability has improved and the downsiderisk to the global economy has been reduced. Inthe US, with the unemployment rate remainingstable at 8.3% and unemployment benefit claimsfalling to the lowest level since April 2008,consumer confidence reached thesecond-highest level in four years and retail salesclimbed by most in five months. On the otherhand, inflation rose in February the most in 10months, mainly driven by gasoline prices.
In the BRIC countries (especially China and
India), stimulating monetary policy improved theoutlook for risky assets and equity marketscontinued to rise in light of the momentum builtup in December. With regards to convertiblessector performances, all were in positive territory.The highest contributions came fromTechnology, Industrial Goods and Healthcare,whereas Food & Beverage, Chemicals and Retailwere more or less flat. Convertibles primarymarket activity of USD 8.8bn in March, thehighest since June 2011, brought the totalissuance in the first quarter to USD 15.1bn.
Outlook for the market 5)
The economic climate remains supportive, butoverbought market conditions are impairing thenear-term technical picture. We are proceedingon the assumption that the headwinds(technicals, euro area crisis and geopoliticalrisks) will have only very short-livedconsequences for the markets.
We have a positive medium-term stance on
stocks and would therefore take advantage ofshare price setbacks to increase the exposure insome convertibles. On the regional side, we stillfavor the US due to its defensive characteristicsand its further improving fundamentals, whereasour view on Japan is neutral. We still likeemerging markets in the long-term due to theirpositive fundamentals and growth prospects, butare cautious in the short-term.
In general, global valuations and sentiment haveimproved and we expect a robust earningsseason ahead. We remain neutrally positioned interms of equity sensitivity across all convertibleproducts, looking for alpha generation oncompany selection level.
Portfolio ManagementThe portfolio is managed by a team of experienced investment professionals who are based in Zurich. The fund is managed according to the team's view onsecurity selection, equity sectors, equity sensitivity, credit, and duration. The team includes several portfolio managers who contribute to the co-managementof the fund according to their area of expertise.
Cre
dit S
uiss
e B
ond
Fund
5) If not expressly indicated otherwise, all quantitative data contained in this comment is based on Lipper, Bloomberg or Datastream.
19
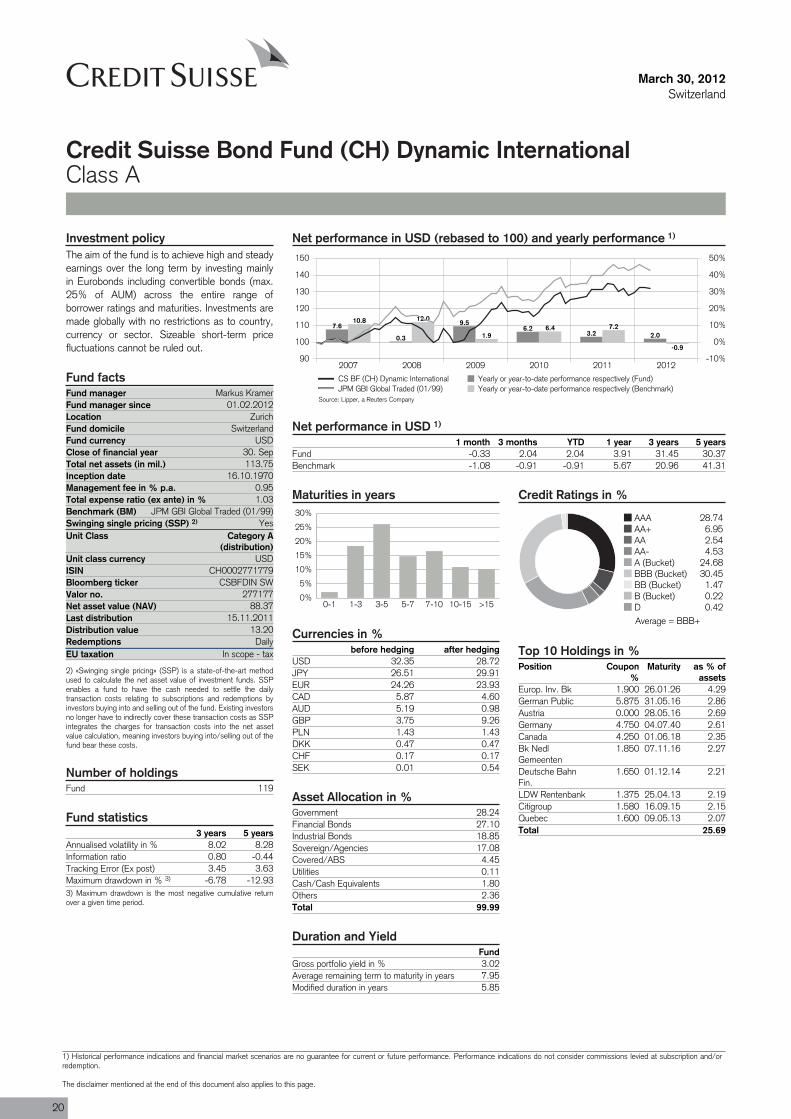
Fund manager Markus KramerFund manager since 01.02.2012Location ZurichFund domicile SwitzerlandFund currency USDClose of financial year 30. SepTotal net assets (in mil.) 113.75Inception date 16.10.1970Management fee in % p.a. 0.95Total expense ratio (ex ante) in % 1.03Benchmark (BM) JPM GBI Global Traded (01/99)Swinging single pricing (SSP) 2) YesUnit Class Category A
(distribution)
ISIN CH0002771779
Valor no. 277177
Last distribution 15.11.2011Distribution value 13.20Redemptions DailyEU taxation In scope - tax
Fund 119
March 30, 2012Switzerland
Credit Suisse Bond Fund (CH) Dynamic InternationalClass A
Net performance in USD (rebased to 100) and yearly performance 1)
2007 2008 2009 2010 2011 201290
100
110
120
130
140
150
-10%
0%
10%
20%
30%
40%
50%
7.6
0.3
9.56.2
3.2 2.0
10.8 12.0
1.96.4 7.2
-0.9
CS BF (CH) Dynamic International Yearly or year-to-date performance respectively (Fund)JPM GBI Global Traded (01/99) Yearly or year-to-date performance respectively (Benchmark)
Net performance in USD 1)
1 month 3 months YTD 1 year 3 years 5 yearsFund -0.33 2.04 2.04 3.91 31.45 30.37Benchmark -1.08 -0.91 -0.91 5.67 20.96 41.31
Maturities in years
0%
5%
10%
15%
20%
25%
30%
0-1 1-3 3-5 5-7 7-10 10-15 >15
Currencies in %before hedging after hedging
USD 32.35 28.72JPY 26.51 29.91EUR 24.26 23.93CAD 5.87 4.60AUD 5.19 0.98GBP 3.75 9.26PLN 1.43 1.43DKK 0.47 0.47CHF 0.17 0.17SEK 0.01 0.54
Asset Allocation in %Government 28.24Financial Bonds 27.10Industrial Bonds 18.85Sovereign/Agencies 17.08Covered/ABS 4.45Utilities 0.11Cash/Cash Equivalents 1.80Others 2.36Total 99.99
Duration and YieldFund
Gross portfolio yield in % 3.02Average remaining term to maturity in years 7.95Modified duration in years 5.85
Credit Ratings in %
AAA 28.74AA+ 6.95AA 2.54AA- 4.53A (Bucket) 24.68BBB (Bucket) 30.45BB (Bucket) 1.47B (Bucket) 0.22D 0.42
Top 10 Holdings in %Position Coupon
%Maturity as % of
assetsEurop. Inv. Bk 1.900 26.01.26 4.29German Public 5.875 31.05.16 2.86Austria 0.000 28.05.16 2.69Germany 4.750 04.07.40 2.61Canada 4.250 01.06.18 2.35Bk NedlGemeenten
1.850 07.11.16 2.27
Deutsche BahnFin.
1.650 01.12.14 2.21
LDW Rentenbank 1.375 25.04.13 2.19Citigroup 1.580 16.09.15 2.15Quebec 1.600 09.05.13 2.07Total 25.69
Investment policyThe aim of the fund is to achieve high and steadyearnings over the long term by investing mainlyin Eurobonds including convertible bonds (max.25% of AUM) across the entire range ofborrower ratings and maturities. Investments aremade globally with no restrictions as to country,currency or sector. Sizeable short-term pricefluctuations cannot be ruled out.
Fund facts
Unit class currency USD
Bloomberg ticker CSBFDIN SW
Net asset value (NAV) 88.37
2) «Swinging single pricing» (SSP) is a state-of-the-art methodused to calculate the net asset value of investment funds. SSPenables a fund to have the cash needed to settle the dailytransaction costs relating to subscriptions and redemptions byinvestors buying into and selling out of the fund. Existing investorsno longer have to indirectly cover these transaction costs as SSPintegrates the charges for transaction costs into the net assetvalue calculation, meaning investors buying into/selling out of thefund bear these costs.
Number of holdings
Fund statistics3 years 5 years
Annualised volatility in % 8.02 8.28Information ratio 0.80 -0.44Tracking Error (Ex post) 3.45 3.63Maximum drawdown in % 3) -6.78 -12.933) Maximum drawdown is the most negative cumulative returnover a given time period.
Source: Lipper, a Reuters Company
Average = BBB+
20
1) Historical performance indications and financial market scenarios are no guarantee for current or future performance. Performance indications do not consider commissions levied at subscription and/orredemption.
The disclaimer mentioned at the end of this document also applies to this page.
March 30, 2012Switzerland
Credit Suisse Bond Fund (CH) Dynamic InternationalClass A
Review previous quarter 4)
Despite the return of risk appetite, sovereignbond yields remained surprisingly low in the firstquarter. While US Treasury yields rose by asmuch as 40bps at the long end of the curve,the German Bund curve remained roughlyunchanged over the quarter. Within Europe, Italy,Portugal and Ireland had double digit returnswhile core EU markets ended the quarter inslightly positive territory.
Government bonds returned 0.3% in Q1 in localcurrencies as measured by the JPM GBI GlobalIndex. Best performers were EMU governmentbonds, which returned an overall 3.6%, driven byItaly (+11.4%), Ireland (+10.4%) and Portugal(+10.0%). UK Gilts, on the other hand,performed worst and lost 2.0%, while USTreasuries returned -1.3%.
The increasing risk appetite in Q1 resulted ina negative performance of the USD against allmajor currencies except for the JPY. Among thebest performers were the commodity currencies,with the NZD and the NOK appreciating by6.1% and 5.6% respectively. The EUR gained3.2%, while the JPY lost a hefty 7.2%..
Outlook for the market 4)
The US economy gathered considerablemomentum in the second half of 2011 asconsumer spending rebounded. The pace islikely to slow somewhat in the short run, butcontinued gains in employment suggest thatgrowth may surprise on the upside in 2012.However, oil prices being back close to their2011 peaks keep us from turning overlyoptimistic as they begin to hurt still very subduedconsumers, while wage gains remain fairlyanemic. Also, corporate investment looks robust,but is unlikely to accelerate. The massive liquidityinjections by the ECB and the Greek debt
restructuring have succeeded in stabilizing banksand government debt.
However, the outlook for consumers andbusinesses remains subdued. Fiscal tighteningis already “biting” in many countries and, afterthe elections, the French government will likelyfollow. After the increase in major benchmarkyields (except German Bunds), we do not expectsignificant interest rate increases in the comingmonths, with current levels broadly in line withactual economic fundamentals and the continuedaccommodation from major central banks likely
to cap large moves. After the sharp tighteningof the past few months, credit spreads in manymarket segments are now close to their historicalaverages. While the ample liquidity provided bycentral banks is likely to remain supportive,potential for strong credit returns has abated, inour view. Additionally, political headlines in theeurozone could continue to drive short-termvolatility, with the market likely to focus ondevelopments in Spain and the Frenchpresidential election, while Greece should movemore to the background.
Portfolio ManagementMarkus Kramer, Vice President, is a senior portfolio manager for Global Fixed Income portfolios. Prior to joining Credit Suisse in
September 2011, he worked at Zurich Cantonal Bank Asset Management for six years. Mr. Kramer holds a Masters Degree from the University of Zurich(specializing in banking and finance) and is a CFA charterholder and a Certified FRM holder. He is a board member of the Swiss Bond Commission.
Cre
dit S
uiss
e B
ond
Fund
4) If not expressly indicated otherwise, all quantitative data contained in this comment is based on Lipper, Bloomberg or Datastream.
21
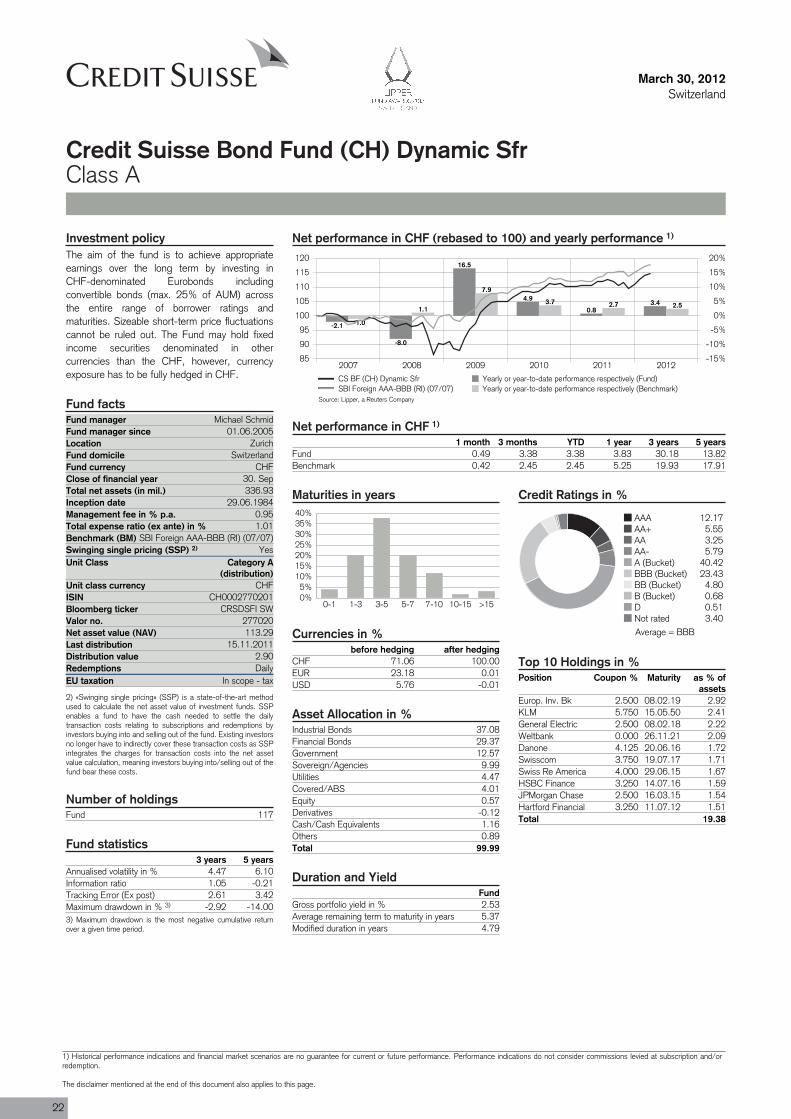
Fund manager Michael SchmidFund manager since 01.06.2005Location ZurichFund domicile SwitzerlandFund currency CHFClose of financial year 30. SepTotal net assets (in mil.) 336.93Inception date 29.06.1984Management fee in % p.a. 0.95Total expense ratio (ex ante) in % 1.01Benchmark (BM) SBI Foreign AAA-BBB (RI) (07/07)Swinging single pricing (SSP) 2) YesUnit Class Category A
(distribution)
ISIN CH0002770201
Valor no. 277020
Last distribution 15.11.2011Distribution value 2.90Redemptions DailyEU taxation In scope - tax
Fund 117
March 30, 2012Switzerland
Credit Suisse Bond Fund (CH) Dynamic SfrClass A
Net performance in CHF (rebased to 100) and yearly performance 1)
2007 2008 2009 2010 2011 201285
90
95
100
105
110
115
120
-15%
-10%
-5%
0%
5%
10%
15%
20%
-2.1
-8.0
16.5
4.9
0.83.4
-1.0
1.1
7.9
3.7 2.7 2.5
CS BF (CH) Dynamic Sfr Yearly or year-to-date performance respectively (Fund)SBI Foreign AAA-BBB (RI) (07/07) Yearly or year-to-date performance respectively (Benchmark)
Net performance in CHF 1)
1 month 3 months YTD 1 year 3 years 5 yearsFund 0.49 3.38 3.38 3.83 30.18 13.82Benchmark 0.42 2.45 2.45 5.25 19.93 17.91
Maturities in years
0%5%
10%15%20%25%30%35%40%
0-1 1-3 3-5 5-7 7-10 10-15 >15
Currencies in %before hedging after hedging
CHF 71.06 100.00EUR 23.18 0.01USD 5.76 -0.01
Asset Allocation in %Industrial Bonds 37.08Financial Bonds 29.37Government 12.57Sovereign/Agencies 9.99Utilities 4.47Covered/ABS 4.01Equity 0.57Derivatives -0.12Cash/Cash Equivalents 1.16Others 0.89Total 99.99
Duration and YieldFund
Gross portfolio yield in % 2.53Average remaining term to maturity in years 5.37Modified duration in years 4.79
Credit Ratings in %
AAA 12.17AA+ 5.55AA 3.25AA- 5.79A (Bucket) 40.42BBB (Bucket) 23.43BB (Bucket) 4.80B (Bucket) 0.68D 0.51Not rated 3.40
Top 10 Holdings in %Position Coupon % Maturity as % of
assetsEurop. Inv. Bk 2.500 08.02.19 2.92KLM 5.750 15.05.50 2.41General Electric 2.500 08.02.18 2.22Weltbank 0.000 26.11.21 2.09Danone 4.125 20.06.16 1.72Swisscom 3.750 19.07.17 1.71Swiss Re America 4.000 29.06.15 1.67HSBC Finance 3.250 14.07.16 1.59JPMorgan Chase 2.500 16.03.15 1.54Hartford Financial 3.250 11.07.12 1.51Total 19.38
Investment policyThe aim of the fund is to achieve appropriateearnings over the long term by investing inCHF-denominated Eurobonds includingconvertible bonds (max. 25% of AUM) acrossthe entire range of borrower ratings andmaturities. Sizeable short-term price fluctuationscannot be ruled out. The Fund may hold fixedincome securities denominated in othercurrencies than the CHF, however, currencyexposure has to be fully hedged in CHF.
Fund facts
Unit class currency CHF
Bloomberg ticker CRSDSFI SW
Net asset value (NAV) 113.29
2) «Swinging single pricing» (SSP) is a state-of-the-art methodused to calculate the net asset value of investment funds. SSPenables a fund to have the cash needed to settle the dailytransaction costs relating to subscriptions and redemptions byinvestors buying into and selling out of the fund. Existing investorsno longer have to indirectly cover these transaction costs as SSPintegrates the charges for transaction costs into the net assetvalue calculation, meaning investors buying into/selling out of thefund bear these costs.
Number of holdings
Fund statistics3 years 5 years
Annualised volatility in % 4.47 6.10Information ratio 1.05 -0.21Tracking Error (Ex post) 2.61 3.42Maximum drawdown in % 3) -2.92 -14.003) Maximum drawdown is the most negative cumulative returnover a given time period.
Source: Lipper, a Reuters Company
Average = BBB
22
1) Historical performance indications and financial market scenarios are no guarantee for current or future performance. Performance indications do not consider commissions levied at subscription and/orredemption.
The disclaimer mentioned at the end of this document also applies to this page.
March 30, 2012Switzerland
Credit Suisse Bond Fund (CH) Dynamic SfrClass A
Review previous quarter 4)
Substantial liquidity injections by the ECB (LTROI and LTRO II) and the restructuring of the Greekgovernment debt helped to stabilize markets inQ1 2012. There are still structural problemsrelated to European borrowers andheterogeneous global growth patterns.Nevertheless, the Swiss economy narrowlyavoided recession thanks to domesticconsumption and high demand for Swisswatches and pharmaceutical products in other
countries. The SNB stuck to its guns andmaintained its expansive monetary policy, onceagain confirming a minimum exchange rate of1.20 francs to the euro.
Interest rates remained very low for all termsin the quarter under review. The 10-year swaprate even dipped below the 1% mark in earlyMarch to 0.99%, setting a new record low. Whileshort-term Confederation bonds of up to three
years still exhibited negative yields at the start ofthe reporting period, the curve has since returnedto normal. At the end of the quarter, the 3-monthCHF LIBOR was 6bps higher at 0.11%, whilethe yield on 2-year Confederation bonds rose to0.02% (+6bps) and 10-year bonds came in at0.85% (+21bps). The performance of the firstquarter was mostly positive thanks to investordemand for high yielding bonds which resulted ina reduction of credit spreads.
Outlook for the market 4)
While the US economy performed surprisinglywell, production in Japan and Europe stagnated.Switzerland's GDP managed to grow at a rateof 0.1% in Q4 2011 despite the continuousstrength of the Swiss franc. A number of leadingindicators are showing early signs of stabilization,which could suggest that the economy hasbottomed out. The Swiss economy is dependenton global economic trends, and it remains to beseen whether the progress made with regard toovercoming the European sovereign debt crisiswill bring a lasting improvement to the situation.That said, a resurgence of the debt crisis cannot
be ruled out. Other geopolitical tensions couldlead to increased volatility in commodity prices. Inits first assessment of monetary policy in March2012 the SNB maintained its expansive courseand confirmed the minimum exchange rate of1.20 francs to the euro. The target range forthe CHF 3-month LIBOR is still 0-0.25%, andliquidity is still being kept high. On the otherhand, inflation is expected to rise modestly(2013: 0.3% and 2014: 0.6%). Also, theforecast for economic growth has been revisedupwards to 1% for 2012.
For the first time since last year the score ofour interest rate factor model turned negative asthe more friendly fundamental picture suggestshigher yields going forward. The technical inputalso changed to negative due to an overboughtsituation in the short term. The behavioral inputalso neutralized because of the recent strongflattening of the yield curve. We will reduce ourduration in the portfolios towards a shorterposition than the benchmark. We recommendtop quality issues and would increase thediversification in the portfolio as even somefrequent issuers have become expensive.
Portfolio ManagementMichael Schmid, Director, is a senior portfolio manager in the fixed-income Total Return Strategy team. He is a member of CSAM's GlobalCredit Committee. Before he joined the Total Return Strategy team he was head of the Credit Portfolios team and portfolio manager forvarious European high-yield mandates. Prior to joining CSAM in 1998, he worked for three years at Revisuisse PricewaterhouseCoopersas a bank auditor. Michael Schmid graduated from the University of Zurich (specialising in banking and finance) and is a Certified EFFASFinancial Analyst.
Cre
dit S
uiss
e B
ond
Fund
4) If not expressly indicated otherwise, all quantitative data contained in this comment is based on Lipper, Bloomberg or Datastream.
23
Fund manager Eric SuterFund manager since 28.02.2011Location ZurichFund domicile SwitzerlandFund currency CHFClose of financial year 30. SepTotal net assets (in mil.) 130.46Inception date 28.02.2011Management fee in % p.a. 0.80Total expense ratio (ex ante) in % 0.88Benchmark (BM) SBI Domestic Govt. (RI)Swinging single pricing (SSP) 2) YesUnit Class Category B
(capital growth)
ISIN CH0117770815
Valor no. 11777081
Redemptions DailyEU taxation Out of scope
Fund 62
March 30, 2012Switzerland
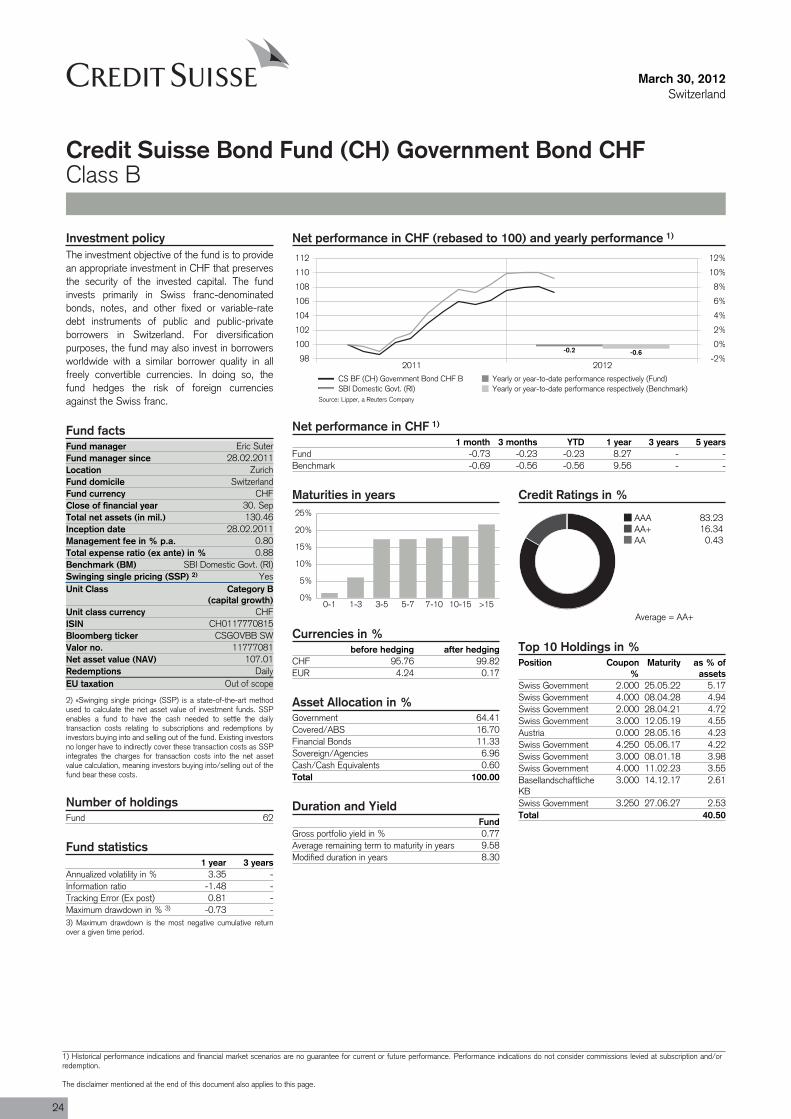
Credit Suisse Bond Fund (CH) Government Bond CHFClass B
Net performance in CHF (rebased to 100) and yearly performance 1)
2011 201298
100
102
104
106
108
110
112
-2%
0%
2%
4%
6%
8%
10%
12%
-0.2 -0.6
CS BF (CH) Government Bond CHF B Yearly or year-to-date performance respectively (Fund)SBI Domestic Govt. (RI) Yearly or year-to-date performance respectively (Benchmark)
Net performance in CHF 1)
1 month 3 months YTD 1 year 3 years 5 yearsFund -0.73 -0.23 -0.23 8.27 - -Benchmark -0.69 -0.56 -0.56 9.56 - -
Maturities in years
0%
5%
10%
15%
20%
25%
0-1 1-3 3-5 5-7 7-10 10-15 >15
Currencies in %before hedging after hedging
CHF 95.76 99.82EUR 4.24 0.17
Asset Allocation in %Government 64.41Covered/ABS 16.70Financial Bonds 11.33Sovereign/Agencies 6.96Cash/Cash Equivalents 0.60Total 100.00
Duration and YieldFund
Gross portfolio yield in % 0.77Average remaining term to maturity in years 9.58Modified duration in years 8.30
Credit Ratings in %
AAA 83.23AA+ 16.34AA 0.43
Top 10 Holdings in %Position Coupon
%Maturity as % of
assetsSwiss Government 2.000 25.05.22 5.17Swiss Government 4.000 08.04.28 4.94Swiss Government 2.000 28.04.21 4.72Swiss Government 3.000 12.05.19 4.55Austria 0.000 28.05.16 4.23Swiss Government 4.250 05.06.17 4.22Swiss Government 3.000 08.01.18 3.98Swiss Government 4.000 11.02.23 3.55BasellandschaftlicheKB
3.000 14.12.17 2.61
Swiss Government 3.250 27.06.27 2.53Total 40.50
Investment policyThe investment objective of the fund is to providean appropriate investment in CHF that preservesthe security of the invested capital. The fundinvests primarily in Swiss franc-denominatedbonds, notes, and other fixed or variable-ratedebt instruments of public and public-privateborrowers in Switzerland. For diversificationpurposes, the fund may also invest in borrowersworldwide with a similar borrower quality in allfreely convertible currencies. In doing so, thefund hedges the risk of foreign currenciesagainst the Swiss franc.
Fund facts
Unit class currency CHF
Bloomberg ticker CSGOVBB SW
Net asset value (NAV) 107.01
2) «Swinging single pricing» (SSP) is a state-of-the-art methodused to calculate the net asset value of investment funds. SSPenables a fund to have the cash needed to settle the dailytransaction costs relating to subscriptions and redemptions byinvestors buying into and selling out of the fund. Existing investorsno longer have to indirectly cover these transaction costs as SSPintegrates the charges for transaction costs into the net assetvalue calculation, meaning investors buying into/selling out of thefund bear these costs.
Number of holdings
Fund statistics1 year 3 years
Annualized volatility in % 3.35 -Information ratio -1.48 -Tracking Error (Ex post) 0.81 -Maximum drawdown in % 3) -0.73 -3) Maximum drawdown is the most negative cumulative returnover a given time period.
Source: Lipper, a Reuters Company
Average = AA+
24
1) Historical performance indications and financial market scenarios are no guarantee for current or future performance. Performance indications do not consider commissions levied at subscription and/orredemption.
The disclaimer mentioned at the end of this document also applies to this page.
March 30, 2012Switzerland
Credit Suisse Bond Fund (CH) Government Bond CHFClass B
Review previous quarter 4)
Substantial liquidity injections by the ECB (LTROI and LTRO II) and the restructuring of the Greekgovernment debt helped to stabilize markets inQ1 2012. There are still structural problemsrelated to European borrowers andheterogeneous global growth patterns.Nevertheless, the Swiss economy narrowlyavoided recession thanks to domesticconsumption and high demand for Swisswatches and pharmaceutical products in other
countries. The SNB stuck to its guns andmaintained its expansive monetary policy, onceagain confirming a minimum exchange rate of1.20 francs to the euro.
Interest rates remained very low for all termsin the quarter under review. The 10-year swaprate even dipped below the 1% mark in earlyMarch to 0.99%, setting a new record low. Whileshort-term Confederation bonds of up to three
years still exhibited negative yields at the start ofthe reporting period, the curve has since returnedto normal. At the end of the quarter, the 3-monthCHF LIBOR was 6bps higher at 0.11%, whilethe yield on 2-year Confederation bonds rose to0.02% (+6bps) and 10-year bonds came in at0.85% (+21bps). The performance of the firstquarter was mostly positive thanks to investordemand for high yielding bonds which resulted ina reduction of credit spreads.
Outlook for the market 4)
While the US economy performed surprisinglywell, production in Japan and Europe stagnated.Switzerland's GDP managed to grow at a rateof 0.1% in Q4 2011 despite the continuousstrength of the Swiss franc. A number of leadingindicators are showing early signs of stabilization,which could suggest that the economy hasbottomed out. The Swiss economy is dependenton global economic trends, and it remains to beseen whether the progress made with regard toovercoming the European sovereign debt crisiswill bring a lasting improvement to the situation.That said, a resurgence of the debt crisis cannot
be ruled out. Other geopolitical tensions couldlead to increased volatility in commodity prices. Inits first assessment of monetary policy in March2012 the SNB maintained its expansive courseand confirmed the minimum exchange rate of1.20 francs to the euro. The target range forthe CHF 3-month LIBOR is still 0-0.25%, andliquidity is still being kept high. On the otherhand, inflation is expected to rise modestly(2013: 0.3% and 2014: 0.6%). Also, theforecast for economic growth has been revisedupwards to 1% for 2012.
For the first time since last year the score ofour interest rate factor model turned negative asthe more friendly fundamental picture suggestshigher yields going forward. The technical inputalso changed to negative due to an overboughtsituation in the short term. The behavioral inputalso neutralized because of the recent strongflattening of the yield curve. We will reduce ourduration in the portfolios towards a shorterposition than the benchmark. We recommendtop quality issues and would increase thediversification in the portfolio as even some wellregarded names have gotten into trouble.
Portfolio ManagementEric Suter, Director, is a senior portfolio manager. He heads the Swiss Fixed Income Team and is responsible for the Swiss Fixed Incomeinvestment decision process. Eric joined CS Group in 1983 and worked in trading, product development and structuring of fixed incomeproducts. In 1995 he moved to fixed income asset management. He received a Bachelor in Business Administration from the KaderschuleZurich (KSZ), is a Certified International Investment Analyst (CIIA) and a member of the Swiss Bond Commission. Eric Suter, Director,leitet das Schweizer Franken Obligationen Team und ist verantwortlich für den Schweizer Franken Anlageprozess. Er stiess 1983 zur CSGroup und arbeitete im Handel, der Produkteentwicklung sowie in der Strukturierung von Zinsprodukten. 1995 wechselte er insObligationen Portfolio Management. Hr. Suter hat einen Abschluss in Betriebsökonomie der Kaderschule Zürich (KSZ), ist dipl.Finanzanalytiker und Vermögensverwalter (AZEK) sowie Mitglied der Schweizer Obligationenkommission (OKS).
Eric Suter, Director, dirige l'équipe Obligations CHF. Il a rejoint le CS Group en 1983 et a travaillé dans la vente, le développement produits ainsi que lastructuration de produits obligataires. En 1995, il est passé dans le domaine Portfolio Management Obligations. E. Suter dispose de diplômes en économied'entreprise de l'Ecole de cadres de Zurich (KSZ), d'analyste financier et gestionnaire de fortune (CFPI) et est membre de la Commission Suisse desObligations (OKS).
Cre
dit S
uiss
e B
ond
Fund
4) If not expressly indicated otherwise, all quantitative data contained in this comment is based on Lipper, Bloomberg or Datastream.
25
Fund 12
Fund manager Gustavo BaltarFund manager since 01.07.2011Location Sao Paulo, BrazilFund domicile LuxembourgFund currency USDClose of financial year 30. SepTotal net assets (in mil.) 141.79Inception date 14.12.2007Management fee in % p.a. 1.20Total expense ratio (ex ante) in % 1.66Benchmark (BM) Brazil CETIP Rate AccumulatedSwinging single pricing (SSP) 2) Yes , current 6%Unit Class Category B
(capital growth)
ISIN LU0334849683
Valor no. 3605447
Redemptions DailyEU taxation In scope - tax
March 30, 2012Switzerland
Credit Suisse Bond Fund (Lux) BrazilClass B
Net performance in USD (rebased to 100) and yearly performance 1)
2008 2009 2010 2011 201260
80
100
120
140
160
180
-40%
-20%
0%
20%
40%
60%
80%
-17.4
45.3
13.6
-1.2
5.2
-14.2
47.0
15.2
-0.7
4.8
CS BF (Lux) Brazil B Yearly or year-to-date performance respectively (Fund)Brazil CETIP Rate Accumulated Yearly or year-to-date performance respectively (Benchmark)
Net performance in USD 1)
1 month 3 months YTD 1 year 3 years 5 yearsFund -4.79 5.18 5.18 -0.79 64.89 -Benchmark -5.12 4.76 4.76 -0.67 69.12 -
Maturities in years
0%5%
10%15%20%25%30%35%40%45%
0-1 1-3 3-5 5-7 7-10 10-15 >15
Currencies in %before hedging after hedging
BRL 99.67 99.67USD 0.45 0.45JPY -0.12 -0.12
Asset Allocation in %Government 91.39Industrial Bonds 3.18Structured Notes 2.80Financial Bonds 2.19Cash/Cash Equivalents 0.44Total 100.00
Number of holdings
Duration and YieldFund
Gross portfolio yield in % 2.44Average remaining term to maturity in years 3.21Modified duration in years 2.04
Credit Ratings in %
A- 0.90BBB 94.76BBB- 2.27Not rated 2.07
Top 10 Holdings in %Position Coupon % Maturity as % of
assetsBrazil 0.000 07.03.15 26.85Brazil 0.000 07.03.17 23.30Brazil 0.000 15.08.16 16.30Brazil 0.000 15.08.12 12.32Brazil 0.000 07.03.13 9.78Brazil 0.000 07.09.17 2.85Banco Votorantim 0.000 16.05.16 2.19Iguatemi Empresa 0.000 01.06.14 2.00Anh-Busch InBev 9.750 17.11.15 0.87Telemar 0.000 01.03.13 0.31Total 96.77
Investment policyThe aim of the Fund is to achieve a high level ofsteady income and an above average yield, whilsttaking into account the security of the capitalinvested. The Fund invests in debt securitiesissued by governments, institutions andcompanies domiciled in Brazil. Investments arepredominantly denominated in Brazilian reals.
Fund facts
Unit class currency USD
Bloomberg ticker CRSBLBB LX
Net asset value (NAV) 142.63
2) The net asset value will be increased by 6% per unit ifnet subscription applications for the subfund (i.e. subscriptionapplications minus redemption applications) exceed USD200,000 on a given valuation day. The increase in net assetvalue covers the tax charges incurred by the subfund on thepurchase of Brazilian securities. In the event of a change in thecurrently applicable tax rate, the Board of Directors will adjust theamount required to be added to the net asset value accordingly.The net asset value will not be adjusted if either net subscriptionapplications do not exceed the aforementioned threshold or elsenet redemption applications are received on any given valuationday. If in future purchases of Brazilian securities no longer incurtax charges, the adjustment of the net asset value will be waivedaltogether.
Fund statistics1 year 3 years
Annualized volatility in % 26.51 18.15Information ratio -0.01 -0.10Tracking Error (Ex post) 12.13 8.88Maximum drawdown in % 3) -18.17 -18.173) Maximum drawdown is the most negative cumulative returnover a given time period.
Source: Lipper, a Reuters Company
Average = BBB-
26
1) Historical performance indications and financial market scenarios are no guarantee for current or future performance. Performance indications do not consider commissions levied at subscription and/orredemption.
The disclaimer mentioned at the end of this document also applies to this page.
March 30, 2012Switzerland
Credit Suisse Bond Fund (Lux) BrazilClass B
Review previous quarter 4)
The year started out with an expected cut of50bps in Brazil’s Selic (the central bank'sinterest rate). But the minutes of the meeting ofthe Monetary Policy Committee (Copom) were alittle out of the ordinary. The Committee said itfelt there was a high probability of interest ratesreaching the single digits in 2012.
Meanwhile, the Fed extended its bias towardvery low interest rates until the end of 2014.In Europe, the ECB’s three-year repos with theblock’s financial institutions reduced fears ofreduced liquidity and systemic risk. In China themonetary easing process that will likely top the
government’s agenda this year is becomingincreasingly evident. This situation poses greaterrisk to the path of inflation in Brazil. Although theIPCA’s re-weighting should have a downwardeffect on the index, the government hasscheduled stimulus measures to take effect in2012. The main measures are: a 14% increasein the minimum wage, a 2% cut (so far) in theSelic rate, reinforcement of the expansion ofcredit for public-sector banks, and tax breaks.Finally, the government continues to send a clearmessage of protectionism for Brazilianmanufacturers.
In its latest minutes, the central bank pointedout that the steady-state real interest rate haspermanently settled at a lower level. This is theissue that will determine whether we are seeinga new level of interest rates or of inflation. Webelieve that this inclination has created a floor forinflation of 5%, with a greater possibility of hittingthe upper limit of the target range than returningto 4.5%. The main risk to the allocations ofthe fund is a sudden deterioration in Europe.Nevertheless, we still believe in a structuralinflation floor.
Outlook for the market 4)
Expectations converged to a Selic of 9.5%,which diminishes doubts as to whether or notthe 10% threshold will be broken this quarter.The expectation of an announcement of anacross-the-board budget cut in February/March
and low current inflation corroborate thisscenario. The current outlook is for local interestrates to remain at a historically low levelthroughout the year, even if price pressures ariseas a result of the stimulus measures scheduled
for 2012. The inflation projected in the yield ofsecurities indexed to the IPCA (around 5.50%for the next few years) illustrates this dynamic.
Portfolio ManagementGustavo Baltar - Vice President, Gustavo is one of the portfolio managers responsible for fixed income and hedge funds. He joined CreditSuisse in 2004, in the Economic Research Department, where he was responsible for analyzing the Brazilian Balance of Payments andlocal market strategy, preparing economic reports and making presentations to clients. From 2006 to 2008 he worked in InstitutionalSales, serving corporate clients, third party distribu-tors and pension funds. Gustavo holds a Master’s degree from Instituto Coppead deAdministração da Universidade Federal do Rio de Janeiro (UFRJ) and a degree in Economics from Instituto de Economia of UFRJ.
Cre
dit S
uiss
e B
ond
Fund
4) If not expressly indicated otherwise, all quantitative data contained in this comment is based on Lipper, Bloomberg or Datastream.
27
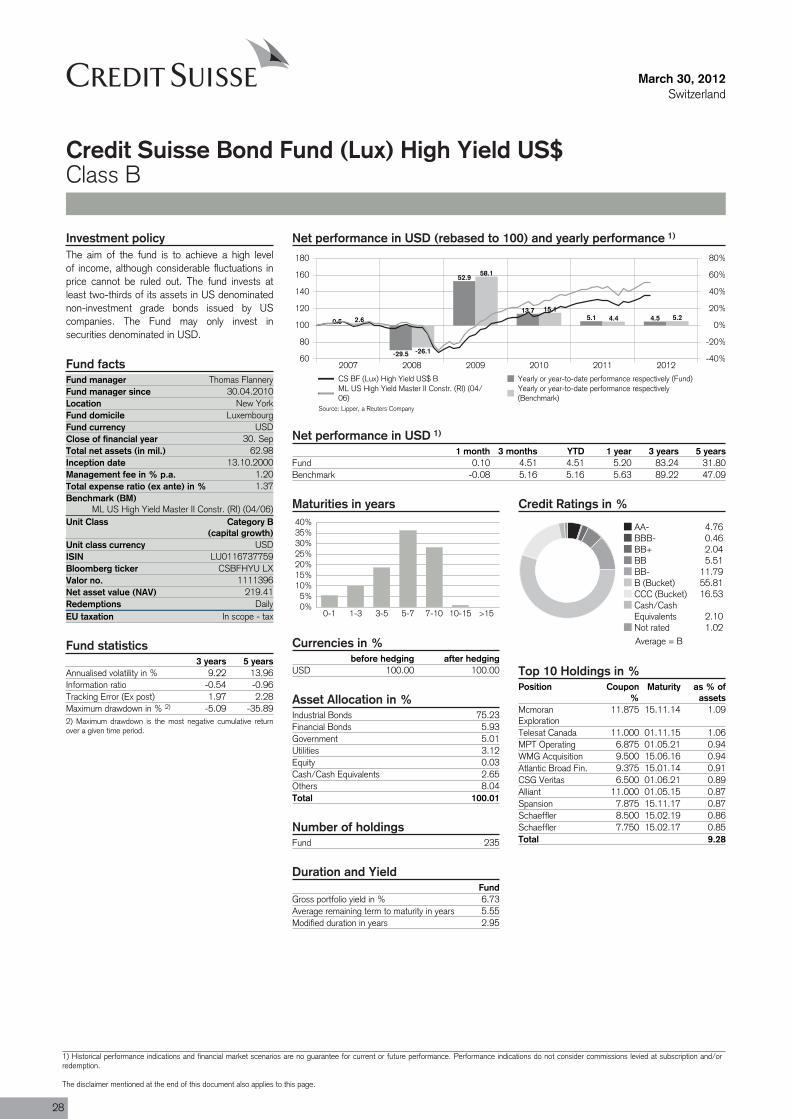
Fund 235
Fund manager Thomas FlanneryFund manager since 30.04.2010Location New YorkFund domicile LuxembourgFund currency USDClose of financial year 30. SepTotal net assets (in mil.) 62.98Inception date 13.10.2000Management fee in % p.a. 1.20Total expense ratio (ex ante) in % 1.37Benchmark (BM)
ML US High Yield Master II Constr. (RI) (04/06)Unit Class Category B
(capital growth)
ISIN LU0116737759
Valor no. 1111396
Redemptions DailyEU taxation In scope - tax
March 30, 2012Switzerland
Credit Suisse Bond Fund (Lux) High Yield US$Class B
Net performance in USD (rebased to 100) and yearly performance 1)
2007 2008 2009 2010 2011 201260
80
100
120
140
160
180
-40%
-20%
0%
20%
40%
60%
80%
0.5
-29.5
52.9
13.75.1 4.52.6
-26.1
58.1
15.14.4 5.2
CS BF (Lux) High Yield US$ B Yearly or year-to-date performance respectively (Fund)ML US High Yield Master II Constr. (RI) (04/06)
Yearly or year-to-date performance respectively(Benchmark)
Net performance in USD 1)
1 month 3 months YTD 1 year 3 years 5 yearsFund 0.10 4.51 4.51 5.20 83.24 31.80Benchmark -0.08 5.16 5.16 5.63 89.22 47.09
Maturities in years
0%5%
10%15%20%25%30%35%40%
0-1 1-3 3-5 5-7 7-10 10-15 >15
Currencies in %before hedging after hedging
USD 100.00 100.00
Asset Allocation in %Industrial Bonds 75.23Financial Bonds 5.93Government 5.01Utilities 3.12Equity 0.03Cash/Cash Equivalents 2.65Others 8.04Total 100.01
Number of holdings
Duration and YieldFund
Gross portfolio yield in % 6.73Average remaining term to maturity in years 5.55Modified duration in years 2.95
Credit Ratings in %
AA- 4.76BBB- 0.46BB+ 2.04BB 5.51BB- 11.79B (Bucket) 55.81CCC (Bucket) 16.53Cash/CashEquivalents 2.10Not rated 1.02
Top 10 Holdings in %Position Coupon
%Maturity as % of
assetsMcmoranExploration
11.875 15.11.14 1.09
Telesat Canada 11.000 01.11.15 1.06MPT Operating 6.875 01.05.21 0.94WMG Acquisition 9.500 15.06.16 0.94Atlantic Broad Fin. 9.375 15.01.14 0.91CSG Veritas 6.500 01.06.21 0.89Alliant 11.000 01.05.15 0.87Spansion 7.875 15.11.17 0.87Schaeffler 8.500 15.02.19 0.86Schaeffler 7.750 15.02.17 0.85Total 9.28
Investment policyThe aim of the fund is to achieve a high levelof income, although considerable fluctuations inprice cannot be ruled out. The fund invests atleast two-thirds of its assets in US denominatednon-investment grade bonds issued by UScompanies. The Fund may only invest insecurities denominated in USD.
Fund facts
Unit class currency USD
Bloomberg ticker CSBFHYU LX
Net asset value (NAV) 219.41
Fund statistics3 years 5 years
Annualised volatility in % 9.22 13.96Information ratio -0.54 -0.96Tracking Error (Ex post) 1.97 2.28Maximum drawdown in % 2) -5.09 -35.892) Maximum drawdown is the most negative cumulative returnover a given time period.
Source: Lipper, a Reuters Company
Average = B
28
1) Historical performance indications and financial market scenarios are no guarantee for current or future performance. Performance indications do not consider commissions levied at subscription and/orredemption.
The disclaimer mentioned at the end of this document also applies to this page.

March 30, 2012Switzerland
Credit Suisse Bond Fund (Lux) High Yield US$Class B
Review previous quarter 3)
The high yield market posted slightly negativereturns in March 2012, as prices retreated fromthe highs reached by strong positive momentumin the first two months of the year. The BofAMerrill Lynch High Yield Master II ConstrainedIndex returned -0.1% for the month, down froma 2.3% gain in February, and is up 5.16% for thequarter. High yield spreads finished the periodat +613bps and the yield-to-worst finished themonth at 7.26%.
From a quality point-of view, CCC and CCsegments produced gains for the quarter with
respective returns of 9.26% and 15.40%. Incontrast, the BB and B segments returned4.12% and 4.75%. The top performingindustries in the firrst quarter were Banks,Transportation, Insurance and Real Estate, whileMetals/Mining and Utilities had the lowestreturns for the period.
JPMorgan reported the par-weighted high yieldbond default rate was unchanged at 1.9% forMarch, well below the long term average of4.2%. The US high yield distress ratio, whichmeasures the proportion of bonds trading at
spreads of more than 1,000bps over Treasuries,fell to 12.2% in March versus 17.9% at the endof December, according to BofA.
Retail demand for the high yield asset classremained strong with 17 consecutive weeks ofinflows totaling USD 24.5bn. Year-to-dateinflows into high yield now total USD 18.8bn,surpassing the full-year 2011 total inflow of USD15.6bn. New issue volumes have been robustwith year-to-date primary issuance totaling USD107.7bn, the largest quarterly volume on record.
Outlook for the market 3)
Portfolio exposures remain defensive, with anemphasis on securities with less interest ratesensitivity. We have maintained exposure toshorter duration bonds while avoiding lowyielding, longer maturity bonds with lowconvexity. In addition, we continue tooverweight B-rated bonds with the bestrisk-return profiles while underweighting themost aggressive CC-rated components of theIndex. In addition, as markets have rallied, wehave begun to rotate out of positions that are
now trading tight on a relative value basis.Sector-wise, we have a positive view on theEnergy, Technology and Media Sectors. Wecontinue to remain cautious with respect toconsumer-driven industries with low assetquality.
The European LTRO facilities and the FOMC’sstatement indicating continued low Fed fundsrates through 2014 have tempered marketvolatility and sentiment leading into 2012. On
a fundamental basis, high yield companies havefocused on deleveraging and extendingmaturities since early 2009. These improvedfundamentals continue to support expectationsfor 2012 and 2013 defaults to be lower thanhistorical averages. Though broader USeconomic trends are showing signs of growthand eurozone concerns have waned, we remaincautious given the potential for renewed headlinerisk.
Portfolio ManagementThomas J. Flannery is a Managing Director of Credit Suisse and Portfolio Manager for Performing Credit Strategies with primaryresponsibility for managing the high yield bond portfolios. Mr. Flannery is also a member of the Credit Investments Group CreditCommittee. Prior to Credit Suisse, Mr. Flannery served as an Associate at First Dominion Capital, LLC, which he joined in 1998. Mr.Flannery began his career with Houlihan Lokey Howard & Zukin, Inc., where he served as an Analyst in the Financial Restructuring Group,working on a variety of debtor and creditor representation assignments. Mr. Flannery graduated with a B.S. in Finance from GeorgetownUniversity.
Cre
dit S
uiss
e B
ond
Fund
3) If not expressly indicated otherwise, all quantitative data contained in this comment is based on Lipper, Bloomberg or Datastream.
29
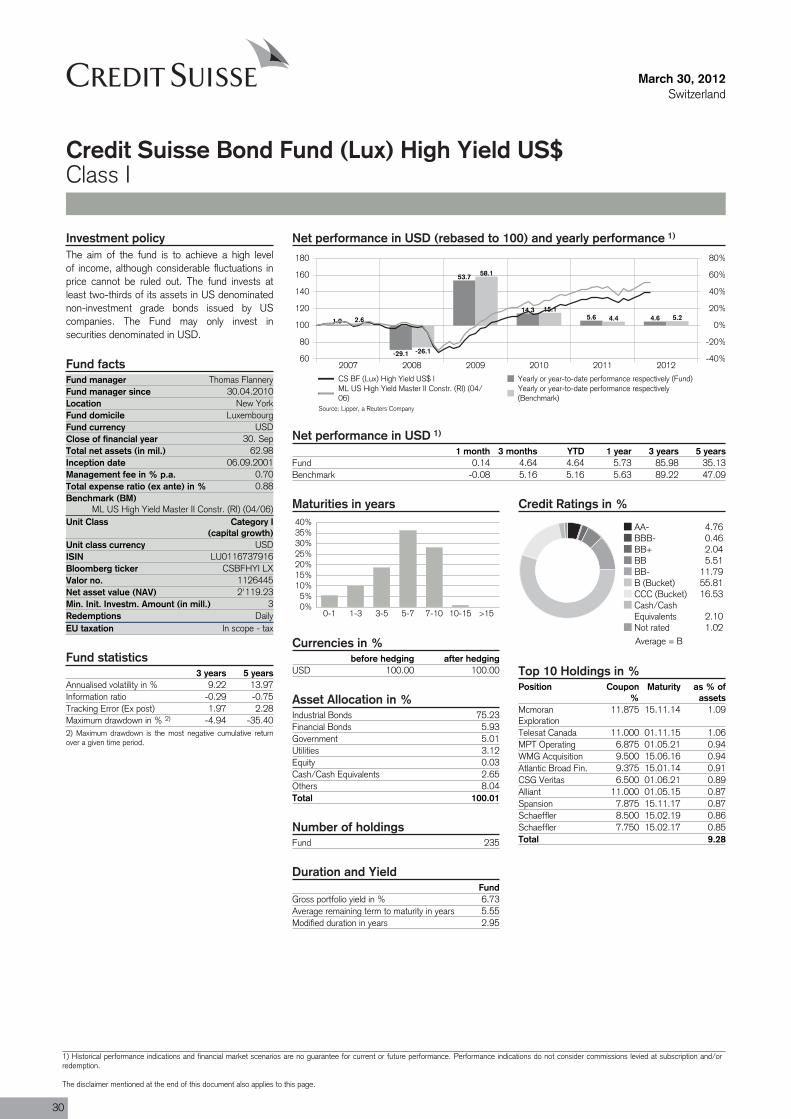
Fund 235
Fund manager Thomas FlanneryFund manager since 30.04.2010Location New YorkFund domicile LuxembourgFund currency USDClose of financial year 30. SepTotal net assets (in mil.) 62.98Inception date 06.09.2001Management fee in % p.a. 0.70Total expense ratio (ex ante) in % 0.88Benchmark (BM)
ML US High Yield Master II Constr. (RI) (04/06)Unit Class Category I
(capital growth)
ISIN LU0116737916
Valor no. 1126445
Min. Init. Investm. Amount (in mill.) 3Redemptions DailyEU taxation In scope - tax
March 30, 2012Switzerland
Credit Suisse Bond Fund (Lux) High Yield US$Class I
Net performance in USD (rebased to 100) and yearly performance 1)
2007 2008 2009 2010 2011 201260
80
100
120
140
160
180
-40%
-20%
0%
20%
40%
60%
80%
1.0
-29.1
53.7
14.35.6 4.62.6
-26.1
58.1
15.14.4 5.2
CS BF (Lux) High Yield US$ I Yearly or year-to-date performance respectively (Fund)ML US High Yield Master II Constr. (RI) (04/06)
Yearly or year-to-date performance respectively(Benchmark)
Net performance in USD 1)
1 month 3 months YTD 1 year 3 years 5 yearsFund 0.14 4.64 4.64 5.73 85.98 35.13Benchmark -0.08 5.16 5.16 5.63 89.22 47.09
Maturities in years
0%5%
10%15%20%25%30%35%40%
0-1 1-3 3-5 5-7 7-10 10-15 >15
Currencies in %before hedging after hedging
USD 100.00 100.00
Asset Allocation in %Industrial Bonds 75.23Financial Bonds 5.93Government 5.01Utilities 3.12Equity 0.03Cash/Cash Equivalents 2.65Others 8.04Total 100.01
Number of holdings
Duration and YieldFund
Gross portfolio yield in % 6.73Average remaining term to maturity in years 5.55Modified duration in years 2.95
Credit Ratings in %
AA- 4.76BBB- 0.46BB+ 2.04BB 5.51BB- 11.79B (Bucket) 55.81CCC (Bucket) 16.53Cash/CashEquivalents 2.10Not rated 1.02
Top 10 Holdings in %Position Coupon
%Maturity as % of
assetsMcmoranExploration
11.875 15.11.14 1.09
Telesat Canada 11.000 01.11.15 1.06MPT Operating 6.875 01.05.21 0.94WMG Acquisition 9.500 15.06.16 0.94Atlantic Broad Fin. 9.375 15.01.14 0.91CSG Veritas 6.500 01.06.21 0.89Alliant 11.000 01.05.15 0.87Spansion 7.875 15.11.17 0.87Schaeffler 8.500 15.02.19 0.86Schaeffler 7.750 15.02.17 0.85Total 9.28
Investment policyThe aim of the fund is to achieve a high levelof income, although considerable fluctuations inprice cannot be ruled out. The fund invests atleast two-thirds of its assets in US denominatednon-investment grade bonds issued by UScompanies. The Fund may only invest insecurities denominated in USD.
Fund facts
Unit class currency USD
Bloomberg ticker CSBFHYI LX
Net asset value (NAV) 2'119.23
Fund statistics3 years 5 years
Annualised volatility in % 9.22 13.97Information ratio -0.29 -0.75Tracking Error (Ex post) 1.97 2.28Maximum drawdown in % 2) -4.94 -35.402) Maximum drawdown is the most negative cumulative returnover a given time period.
Source: Lipper, a Reuters Company
Average = B
30
1) Historical performance indications and financial market scenarios are no guarantee for current or future performance. Performance indications do not consider commissions levied at subscription and/orredemption.
The disclaimer mentioned at the end of this document also applies to this page.
March 30, 2012Switzerland
Credit Suisse Bond Fund (Lux) High Yield US$Class I
Review previous quarter 3)
The high yield market posted slightly negativereturns in March 2012, as prices retreated fromthe highs reached by strong positive momentumin the first two months of the year. The BofAMerrill Lynch High Yield Master II ConstrainedIndex returned -0.1% for the month, down froma 2.3% gain in February, and is up 5.16% for thequarter. High yield spreads finished the periodat +613bps and the yield-to-worst finished themonth at 7.26%.
From a quality point-of view, CCC and CCsegments produced gains for the quarter with
respective returns of 9.26% and 15.40%. Incontrast, the BB and B segments returned4.12% and 4.75%. The top performingindustries in the firrst quarter were Banks,Transportation, Insurance and Real Estate, whileMetals/Mining and Utilities had the lowestreturns for the period.
JPMorgan reported the par-weighted high yieldbond default rate was unchanged at 1.9% forMarch, well below the long term average of4.2%. The US high yield distress ratio, whichmeasures the proportion of bonds trading at
spreads of more than 1,000bps over Treasuries,fell to 12.2% in March versus 17.9% at the endof December, according to BofA.
Retail demand for the high yield asset classremained strong with 17 consecutive weeks ofinflows totaling USD 24.5bn. Year-to-dateinflows into high yield now total USD 18.8bn,surpassing the full-year 2011 total inflow of USD15.6bn. New issue volumes have been robustwith year-to-date primary issuance totaling USD107.7bn, the largest quarterly volume on record.
Outlook for the market 3)
Portfolio exposures remain defensive, with anemphasis on securities with less interest ratesensitivity. We have maintained exposure toshorter duration bonds while avoiding lowyielding, longer maturity bonds with lowconvexity. In addition, we continue tooverweight B-rated bonds with the bestrisk-return profiles while underweighting themost aggressive CC-rated components of theIndex. In addition, as markets have rallied, wehave begun to rotate out of positions that are
now trading tight on a relative value basis.Sector-wise, we have a positive view on theEnergy, Technology and Media Sectors. Wecontinue to remain cautious with respect toconsumer-driven industries with low assetquality.
The European LTRO facilities and the FOMC’sstatement indicating continued low Fed fundsrates through 2014 have tempered marketvolatility and sentiment leading into 2012. On
a fundamental basis, high yield companies havefocused on deleveraging and extendingmaturities since early 2009. These improvedfundamentals continue to support expectationsfor 2012 and 2013 defaults to be lower thanhistorical averages. Though broader USeconomic trends are showing signs of growthand eurozone concerns have waned, we remaincautious given the potential for renewed headlinerisk.
Portfolio ManagementThomas J. Flannery is a Managing Director of Credit Suisse and Portfolio Manager for Performing Credit Strategies with primaryresponsibility for managing the high yield bond portfolios. Mr. Flannery is also a member of the Credit Investments Group CreditCommittee. Prior to Credit Suisse, Mr. Flannery served as an Associate at First Dominion Capital, LLC, which he joined in 1998. Mr.Flannery began his career with Houlihan Lokey Howard & Zukin, Inc., where he served as an Analyst in the Financial Restructuring Group,working on a variety of debtor and creditor representation assignments. Mr. Flannery graduated with a B.S. in Finance from GeorgetownUniversity.
Cre
dit S
uiss
e B
ond
Fund
3) If not expressly indicated otherwise, all quantitative data contained in this comment is based on Lipper, Bloomberg or Datastream.
31
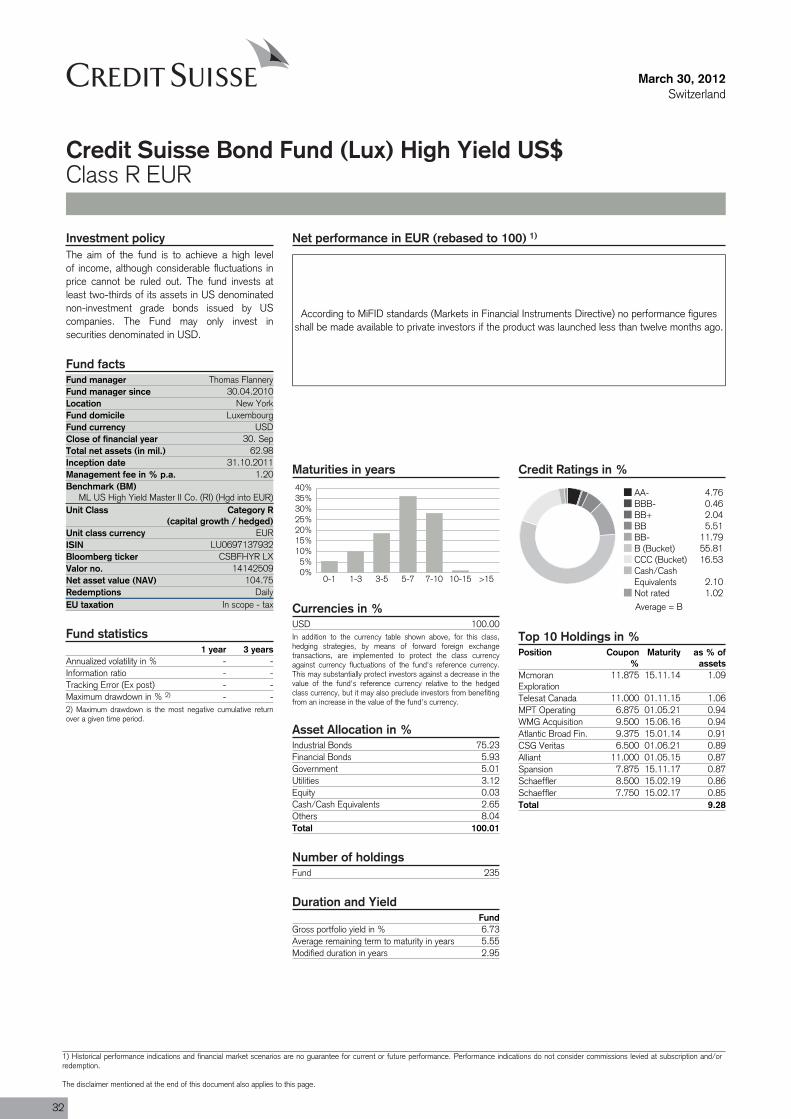
Fund 235
Fund manager Thomas FlanneryFund manager since 30.04.2010Location New YorkFund domicile LuxembourgFund currency USDClose of financial year 30. SepTotal net assets (in mil.) 62.98Inception date 31.10.2011Management fee in % p.a. 1.20Benchmark (BM)
ML US High Yield Master II Co. (RI) (Hgd into EUR)Unit Class Category R
(capital growth / hedged)
ISIN LU0697137932
Valor no. 14142509
Redemptions DailyEU taxation In scope - tax
March 30, 2012Switzerland
Credit Suisse Bond Fund (Lux) High Yield US$Class R EUR
Net performance in EUR (rebased to 100) 1)
According to MiFID standards (Markets in Financial Instruments Directive) no performance figuresshall be made available to private investors if the product was launched less than twelve months ago.
Maturities in years
0%5%
10%15%20%25%30%35%40%
0-1 1-3 3-5 5-7 7-10 10-15 >15
Currencies in %USD 100.00In addition to the currency table shown above, for this class,hedging strategies, by means of forward foreign exchangetransactions, are implemented to protect the class currencyagainst currency fluctuations of the fund's reference currency.This may substantially protect investors against a decrease in thevalue of the fund's reference currency relative to the hedgedclass currency, but it may also preclude investors from benefitingfrom an increase in the value of the fund's currency.
Asset Allocation in %Industrial Bonds 75.23Financial Bonds 5.93Government 5.01Utilities 3.12Equity 0.03Cash/Cash Equivalents 2.65Others 8.04Total 100.01
Number of holdings
Duration and YieldFund
Gross portfolio yield in % 6.73Average remaining term to maturity in years 5.55Modified duration in years 2.95
Credit Ratings in %
AA- 4.76BBB- 0.46BB+ 2.04BB 5.51BB- 11.79B (Bucket) 55.81CCC (Bucket) 16.53Cash/CashEquivalents 2.10Not rated 1.02
Top 10 Holdings in %Position Coupon
%Maturity as % of
assetsMcmoranExploration
11.875 15.11.14 1.09
Telesat Canada 11.000 01.11.15 1.06MPT Operating 6.875 01.05.21 0.94WMG Acquisition 9.500 15.06.16 0.94Atlantic Broad Fin. 9.375 15.01.14 0.91CSG Veritas 6.500 01.06.21 0.89Alliant 11.000 01.05.15 0.87Spansion 7.875 15.11.17 0.87Schaeffler 8.500 15.02.19 0.86Schaeffler 7.750 15.02.17 0.85Total 9.28
Investment policyThe aim of the fund is to achieve a high levelof income, although considerable fluctuations inprice cannot be ruled out. The fund invests atleast two-thirds of its assets in US denominatednon-investment grade bonds issued by UScompanies. The Fund may only invest insecurities denominated in USD.
Fund facts
Unit class currency EUR
Bloomberg ticker CSBFHYR LX
Net asset value (NAV) 104.75
Fund statistics1 year 3 years
Annualized volatility in % - -Information ratio - -Tracking Error (Ex post) - -Maximum drawdown in % 2) - -2) Maximum drawdown is the most negative cumulative returnover a given time period.
Average = B
32
1) Historical performance indications and financial market scenarios are no guarantee for current or future performance. Performance indications do not consider commissions levied at subscription and/orredemption.
The disclaimer mentioned at the end of this document also applies to this page.
March 30, 2012Switzerland
Credit Suisse Bond Fund (Lux) High Yield US$Class R EUR
Review previous quarter 3)
The high yield market posted slightly negativereturns in March 2012, as prices retreated fromthe highs reached by strong positive momentumin the first two months of the year. The BofAMerrill Lynch High Yield Master II ConstrainedIndex returned -0.1% for the month, down froma 2.3% gain in February, and is up 5.16% for thequarter. High yield spreads finished the periodat +613bps and the yield-to-worst finished themonth at 7.26%.
From a quality point-of view, CCC and CCsegments produced gains for the quarter with
respective returns of 9.26% and 15.40%. Incontrast, the BB and B segments returned4.12% and 4.75%. The top performingindustries in the firrst quarter were Banks,Transportation, Insurance and Real Estate, whileMetals/Mining and Utilities had the lowestreturns for the period.
JPMorgan reported the par-weighted high yieldbond default rate was unchanged at 1.9% forMarch, well below the long term average of4.2%. The US high yield distress ratio, whichmeasures the proportion of bonds trading at
spreads of more than 1,000bps over Treasuries,fell to 12.2% in March versus 17.9% at the endof December, according to BofA.
Retail demand for the high yield asset classremained strong with 17 consecutive weeks ofinflows totaling USD 24.5bn. Year-to-dateinflows into high yield now total USD 18.8bn,surpassing the full-year 2011 total inflow of USD15.6bn. New issue volumes have been robustwith year-to-date primary issuance totaling USD107.7bn, the largest quarterly volume on record.
Outlook for the market 3)
Portfolio exposures remain defensive, with anemphasis on securities with less interest ratesensitivity. We have maintained exposure toshorter duration bonds while avoiding lowyielding, longer maturity bonds with lowconvexity. In addition, we continue tooverweight B-rated bonds with the bestrisk-return profiles while underweighting themost aggressive CC-rated components of theIndex. In addition, as markets have rallied, wehave begun to rotate out of positions that are
now trading tight on a relative value basis.Sector-wise, we have a positive view on theEnergy, Technology and Media Sectors. Wecontinue to remain cautious with respect toconsumer-driven industries with low assetquality.
The European LTRO facilities and the FOMC’sstatement indicating continued low Fed fundsrates through 2014 have tempered marketvolatility and sentiment leading into 2012. On
a fundamental basis, high yield companies havefocused on deleveraging and extendingmaturities since early 2009. These improvedfundamentals continue to support expectationsfor 2012 and 2013 defaults to be lower thanhistorical averages. Though broader USeconomic trends are showing signs of growthand eurozone concerns have waned, we remaincautious given the potential for renewed headlinerisk.
Portfolio ManagementThomas J. Flannery is a Managing Director of Credit Suisse and Portfolio Manager for Performing Credit Strategies with primaryresponsibility for managing the high yield bond portfolios. Mr. Flannery is also a member of the Credit Investments Group CreditCommittee. Prior to Credit Suisse, Mr. Flannery served as an Associate at First Dominion Capital, LLC, which he joined in 1998. Mr.Flannery began his career with Houlihan Lokey Howard & Zukin, Inc., where he served as an Analyst in the Financial Restructuring Group,working on a variety of debtor and creditor representation assignments. Mr. Flannery graduated with a B.S. in Finance from GeorgetownUniversity.
Cre
dit S
uiss
e B
ond
Fund
3) If not expressly indicated otherwise, all quantitative data contained in this comment is based on Lipper, Bloomberg or Datastream.
33
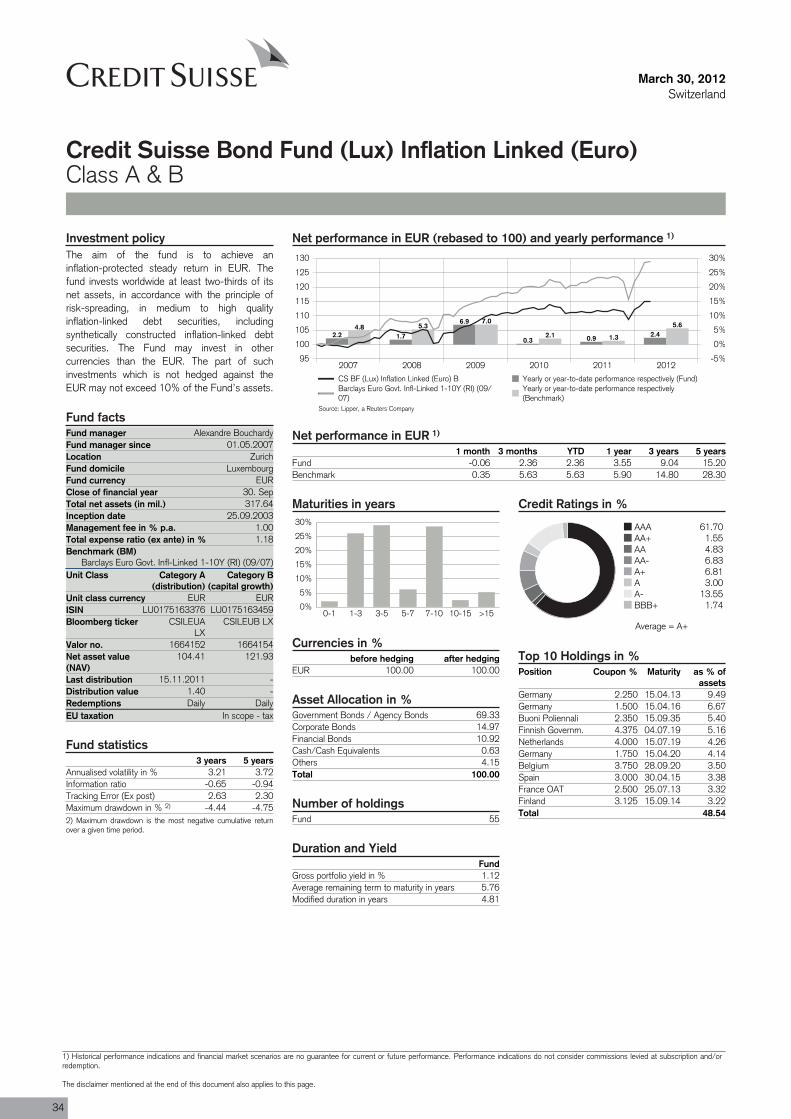
Fund 55
Fund manager Alexandre BouchardyFund manager since 01.05.2007Location ZurichFund domicile LuxembourgFund currency EURClose of financial year 30. SepTotal net assets (in mil.) 317.64Inception date 25.09.2003Management fee in % p.a. 1.00Total expense ratio (ex ante) in % 1.18Benchmark (BM)
Barclays Euro Govt. Infl-Linked 1-10Y (RI) (09/07)Unit Class Category A
(distribution)
ISIN LU0175163376
Valor no. 1664152
Last distribution 15.11.2011Distribution value 1.40Redemptions DailyEU taxation In scope - tax
March 30, 2012Switzerland
Credit Suisse Bond Fund (Lux) Inflation Linked (Euro)Class A & B
Net performance in EUR (rebased to 100) and yearly performance 1)
2007 2008 2009 2010 2011 201295
100
105
110
115
120
125
130
-5%
0%
5%
10%
15%
20%
25%
30%
2.2 1.7
6.9
0.3 0.9 2.44.8 5.3
7.0
2.1 1.3
5.6
CS BF (Lux) Inflation Linked (Euro) B Yearly or year-to-date performance respectively (Fund)Barclays Euro Govt. Infl-Linked 1-10Y (RI) (09/07)
Yearly or year-to-date performance respectively(Benchmark)
Net performance in EUR 1)
1 month 3 months YTD 1 year 3 years 5 yearsFund -0.06 2.36 2.36 3.55 9.04 15.20Benchmark 0.35 5.63 5.63 5.90 14.80 28.30
Maturities in years
0%
5%
10%
15%
20%
25%
30%
0-1 1-3 3-5 5-7 7-10 10-15 >15
Currencies in %before hedging after hedging
EUR 100.00 100.00
Asset Allocation in %Government Bonds / Agency Bonds 69.33Corporate Bonds 14.97Financial Bonds 10.92Cash/Cash Equivalents 0.63Others 4.15Total 100.00
Number of holdings
Duration and YieldFund
Gross portfolio yield in % 1.12Average remaining term to maturity in years 5.76Modified duration in years 4.81
Credit Ratings in %
AAA 61.70AA+ 1.55AA 4.83AA- 6.83A+ 6.81A 3.00A- 13.55BBB+ 1.74
Top 10 Holdings in %Position Coupon % Maturity as % of
assetsGermany 2.250 15.04.13 9.49Germany 1.500 15.04.16 6.67Buoni Poliennali 2.350 15.09.35 5.40Finnish Governm. 4.375 04.07.19 5.16Netherlands 4.000 15.07.19 4.26Germany 1.750 15.04.20 4.14Belgium 3.750 28.09.20 3.50Spain 3.000 30.04.15 3.38France OAT 2.500 25.07.13 3.32Finland 3.125 15.09.14 3.22Total 48.54
Investment policyThe aim of the fund is to achieve aninflation-protected steady return in EUR. Thefund invests worldwide at least two-thirds of itsnet assets, in accordance with the principle ofrisk-spreading, in medium to high qualityinflation-linked debt securities, includingsynthetically constructed inflation-linked debtsecurities. The Fund may invest in othercurrencies than the EUR. The part of suchinvestments which is not hedged against theEUR may not exceed 10% of the Fund’s assets.
Fund facts
Category B(capital growth)
Unit class currency EUR EURLU0175163459
Bloomberg ticker CSILEUALX
CSILEUB LX
1664154Net asset value(NAV)
104.41 121.93
--
Daily
Fund statistics3 years 5 years
Annualised volatility in % 3.21 3.72Information ratio -0.65 -0.94Tracking Error (Ex post) 2.63 2.30Maximum drawdown in % 2) -4.44 -4.752) Maximum drawdown is the most negative cumulative returnover a given time period.
Source: Lipper, a Reuters Company
Average = A+
34
1) Historical performance indications and financial market scenarios are no guarantee for current or future performance. Performance indications do not consider commissions levied at subscription and/orredemption.
The disclaimer mentioned at the end of this document also applies to this page.
March 30, 2012Switzerland
Credit Suisse Bond Fund (Lux) Inflation Linked (Euro)Class A & B
Review previous quarter 3)
Inflation-linked bonds’ returns were positive inQ1, the overall index returned 1.2% (hedgedin USD). The quarter was characterized by, yetagain, strong differences across countries.Indeed, the best performing market was Europewith a return of 6.2%, followed by Japan (2.4%)and the US (0.8%). Helped by the positivesentiment impact of the ECB’s 3 year LTROs,Italy alone managed to return an impressive14%, by far erasing the losses of the previousquarter. France profited as well from the positivesentiment and returned 3.7%, while Germanymanaged a still decent 1.2%. The worstperforming markets were Sweden (-1.6%), the
UK (-1.4%) and Canada (-1.4%) which sufferedfrom the recent rates increase, especially at thelong-end of the curve. Compared to nominalbonds, inflation-linked bonds outperformed byalmost 2% as inflation expectations rose on theback of high energy prices and improvedeconomic data.
In absolute terms, the fund returned 2.65%gross of fees (2.36% net). While the decreasein real rates contributed positively, it was partiallyoffset by a negative inflation accrual of -0.4%.Relative to benchmark, the fund underperformedby -2.98% gross of fees (-3.27% net).
Duration/curve management was positive as weheld an overweight at the very long end of thecurve (30y). Market allocation however wasnegative. Indeed, our structural* underweight inFrance and Italy contributed negatively as bothcountries performed strongly.
*France and Italy have weights of respectively47% and 27% in the benchmark. Fordiversification purposes, we will not hold suchan exposure in these countries. Thus, we arerunning a structural underweight.
Outlook for the market 3)
On the inflation side, headline CPI for Februaryincreased by 2.9% y-o-y in the US and by 2.7%y-o-y in Europe, whereas core indices increasedby 2.2% y-o-y and 1.5% y-o-y respectively.Against the background of reduced politicaltension in the Middle East, oil prices havestabilized and retraced from their peaks reachedearlier in March. Some relief on the headlinemeasure of CPI could therefore be expected inthe coming quarters. Regarding the core
measure of inflation, it is likely to remain subduedin Europe amid tepid growth as well as fiscal andprivate sector deleveraging. In the US, however,rental inflation has been the key component ofthe steady increase in core inflation and is likelyto increase further, albeit at a more moderatepace.
In terms of strategy, we have continued ourdiversification strategy. Indeed, we have profited
from better levels in order to reduce ourallocation to Italy and France while increasingit in Belgium. Furthermore, we increased ourexposure to core corporates, especially in thetelecommunication and insurance sectors.Finally, we have reduced both our real interestrate and inflation duration by selling long-datedGerman nominal bonds. Going forward, we arelooking at pursuing this diversification strategy byreducing our exposure to France especially.
Portfolio ManagementAlexandre Bouchardy, Director, is a senior portfolio manager in the International Fixed Income team. He joined CSAM in 2002. Previouslyhe gained first experience in asset management at two different companies in Geneva and Paris. Mr. Bouchardy graduated from theUniversity of Lausanne specialising in economics and finance.
Cre
dit S
uiss
e B
ond
Fund
3) If not expressly indicated otherwise, all quantitative data contained in this comment is based on Lipper, Bloomberg or Datastream.
35
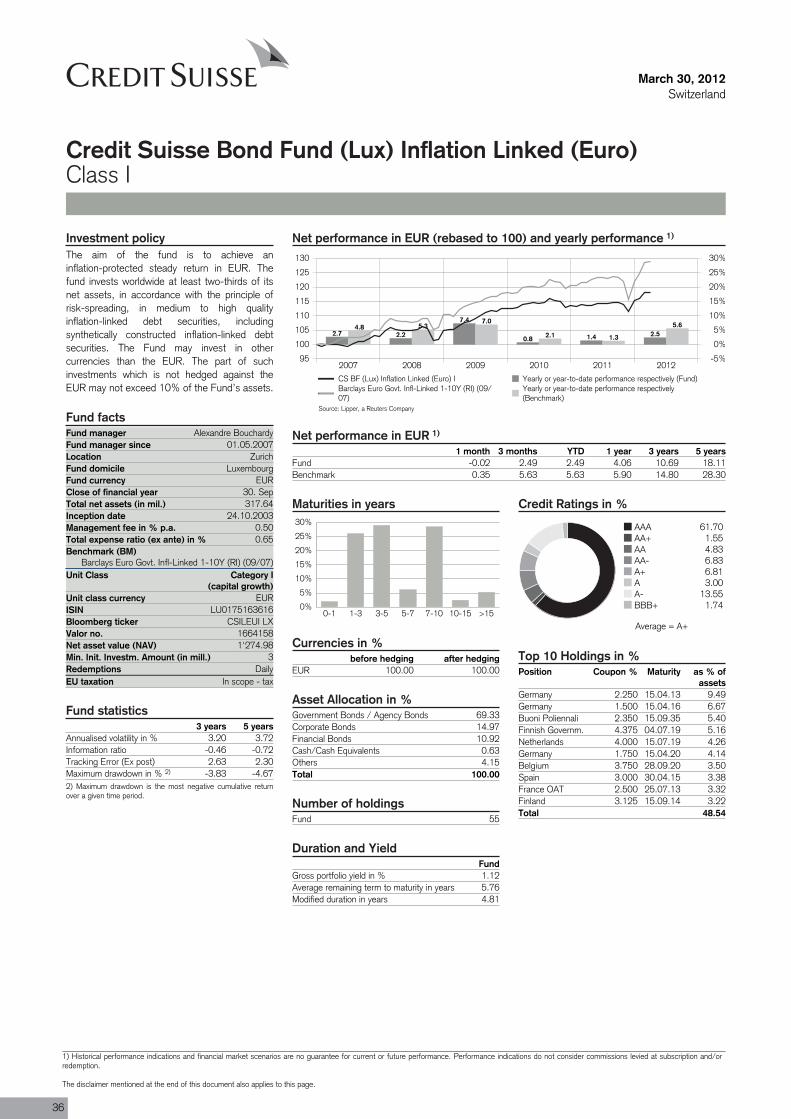
Fund 55
Fund manager Alexandre BouchardyFund manager since 01.05.2007Location ZurichFund domicile LuxembourgFund currency EURClose of financial year 30. SepTotal net assets (in mil.) 317.64Inception date 24.10.2003Management fee in % p.a. 0.50Total expense ratio (ex ante) in % 0.65Benchmark (BM)
Barclays Euro Govt. Infl-Linked 1-10Y (RI) (09/07)Unit Class Category I
(capital growth)
ISIN LU0175163616
Valor no. 1664158
Min. Init. Investm. Amount (in mill.) 3Redemptions DailyEU taxation In scope - tax
March 30, 2012Switzerland
Credit Suisse Bond Fund (Lux) Inflation Linked (Euro)Class I
Net performance in EUR (rebased to 100) and yearly performance 1)
2007 2008 2009 2010 2011 201295
100
105
110
115
120
125
130
-5%
0%
5%
10%
15%
20%
25%
30%
2.7 2.2
7.4
0.8 1.4 2.54.8 5.3
7.0
2.1 1.3
5.6
CS BF (Lux) Inflation Linked (Euro) I Yearly or year-to-date performance respectively (Fund)Barclays Euro Govt. Infl-Linked 1-10Y (RI) (09/07)
Yearly or year-to-date performance respectively(Benchmark)
Net performance in EUR 1)
1 month 3 months YTD 1 year 3 years 5 yearsFund -0.02 2.49 2.49 4.06 10.69 18.11Benchmark 0.35 5.63 5.63 5.90 14.80 28.30
Maturities in years
0%
5%
10%
15%
20%
25%
30%
0-1 1-3 3-5 5-7 7-10 10-15 >15
Currencies in %before hedging after hedging
EUR 100.00 100.00
Asset Allocation in %Government Bonds / Agency Bonds 69.33Corporate Bonds 14.97Financial Bonds 10.92Cash/Cash Equivalents 0.63Others 4.15Total 100.00
Number of holdings
Duration and YieldFund
Gross portfolio yield in % 1.12Average remaining term to maturity in years 5.76Modified duration in years 4.81
Credit Ratings in %
AAA 61.70AA+ 1.55AA 4.83AA- 6.83A+ 6.81A 3.00A- 13.55BBB+ 1.74
Top 10 Holdings in %Position Coupon % Maturity as % of
assetsGermany 2.250 15.04.13 9.49Germany 1.500 15.04.16 6.67Buoni Poliennali 2.350 15.09.35 5.40Finnish Governm. 4.375 04.07.19 5.16Netherlands 4.000 15.07.19 4.26Germany 1.750 15.04.20 4.14Belgium 3.750 28.09.20 3.50Spain 3.000 30.04.15 3.38France OAT 2.500 25.07.13 3.32Finland 3.125 15.09.14 3.22Total 48.54
Investment policyThe aim of the fund is to achieve aninflation-protected steady return in EUR. Thefund invests worldwide at least two-thirds of itsnet assets, in accordance with the principle ofrisk-spreading, in medium to high qualityinflation-linked debt securities, includingsynthetically constructed inflation-linked debtsecurities. The Fund may invest in othercurrencies than the EUR. The part of suchinvestments which is not hedged against theEUR may not exceed 10% of the Fund’s assets.
Fund facts
Unit class currency EUR
Bloomberg ticker CSILEUI LX
Net asset value (NAV) 1'274.98
Fund statistics3 years 5 years
Annualised volatility in % 3.20 3.72Information ratio -0.46 -0.72Tracking Error (Ex post) 2.63 2.30Maximum drawdown in % 2) -3.83 -4.672) Maximum drawdown is the most negative cumulative returnover a given time period.
Source: Lipper, a Reuters Company
Average = A+
36
1) Historical performance indications and financial market scenarios are no guarantee for current or future performance. Performance indications do not consider commissions levied at subscription and/orredemption.
The disclaimer mentioned at the end of this document also applies to this page.
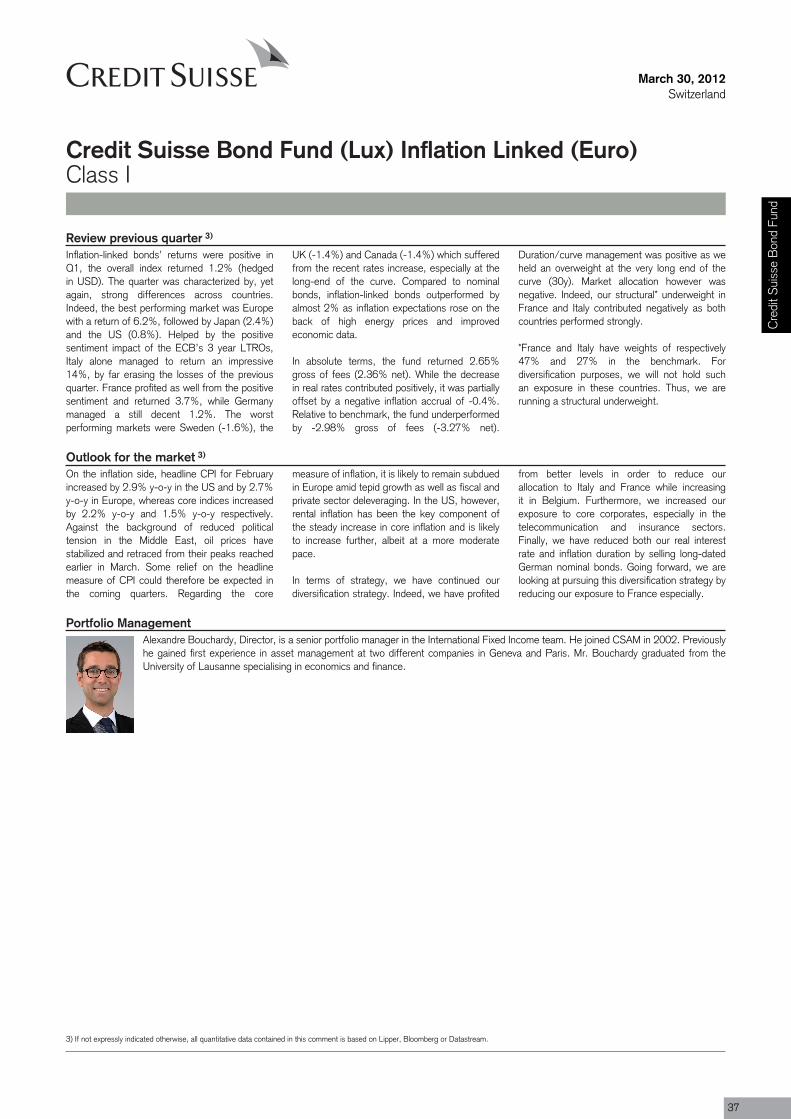
March 30, 2012Switzerland
Credit Suisse Bond Fund (Lux) Inflation Linked (Euro)Class I
Review previous quarter 3)
Inflation-linked bonds’ returns were positive inQ1, the overall index returned 1.2% (hedgedin USD). The quarter was characterized by, yetagain, strong differences across countries.Indeed, the best performing market was Europewith a return of 6.2%, followed by Japan (2.4%)and the US (0.8%). Helped by the positivesentiment impact of the ECB’s 3 year LTROs,Italy alone managed to return an impressive14%, by far erasing the losses of the previousquarter. France profited as well from the positivesentiment and returned 3.7%, while Germanymanaged a still decent 1.2%. The worstperforming markets were Sweden (-1.6%), the
UK (-1.4%) and Canada (-1.4%) which sufferedfrom the recent rates increase, especially at thelong-end of the curve. Compared to nominalbonds, inflation-linked bonds outperformed byalmost 2% as inflation expectations rose on theback of high energy prices and improvedeconomic data.
In absolute terms, the fund returned 2.65%gross of fees (2.36% net). While the decreasein real rates contributed positively, it was partiallyoffset by a negative inflation accrual of -0.4%.Relative to benchmark, the fund underperformedby -2.98% gross of fees (-3.27% net).
Duration/curve management was positive as weheld an overweight at the very long end of thecurve (30y). Market allocation however wasnegative. Indeed, our structural* underweight inFrance and Italy contributed negatively as bothcountries performed strongly.
*France and Italy have weights of respectively47% and 27% in the benchmark. Fordiversification purposes, we will not hold suchan exposure in these countries. Thus, we arerunning a structural underweight.
Outlook for the market 3)
On the inflation side, headline CPI for Februaryincreased by 2.9% y-o-y in the US and by 2.7%y-o-y in Europe, whereas core indices increasedby 2.2% y-o-y and 1.5% y-o-y respectively.Against the background of reduced politicaltension in the Middle East, oil prices havestabilized and retraced from their peaks reachedearlier in March. Some relief on the headlinemeasure of CPI could therefore be expected inthe coming quarters. Regarding the core
measure of inflation, it is likely to remain subduedin Europe amid tepid growth as well as fiscal andprivate sector deleveraging. In the US, however,rental inflation has been the key component ofthe steady increase in core inflation and is likelyto increase further, albeit at a more moderatepace.
In terms of strategy, we have continued ourdiversification strategy. Indeed, we have profited
from better levels in order to reduce ourallocation to Italy and France while increasingit in Belgium. Furthermore, we increased ourexposure to core corporates, especially in thetelecommunication and insurance sectors.Finally, we have reduced both our real interestrate and inflation duration by selling long-datedGerman nominal bonds. Going forward, we arelooking at pursuing this diversification strategy byreducing our exposure to France especially.
Portfolio ManagementAlexandre Bouchardy, Director, is a senior portfolio manager in the International Fixed Income team. He joined CSAM in 2002. Previouslyhe gained first experience in asset management at two different companies in Geneva and Paris. Mr. Bouchardy graduated from theUniversity of Lausanne specialising in economics and finance.
Cre
dit S
uiss
e B
ond
Fund
3) If not expressly indicated otherwise, all quantitative data contained in this comment is based on Lipper, Bloomberg or Datastream.
37
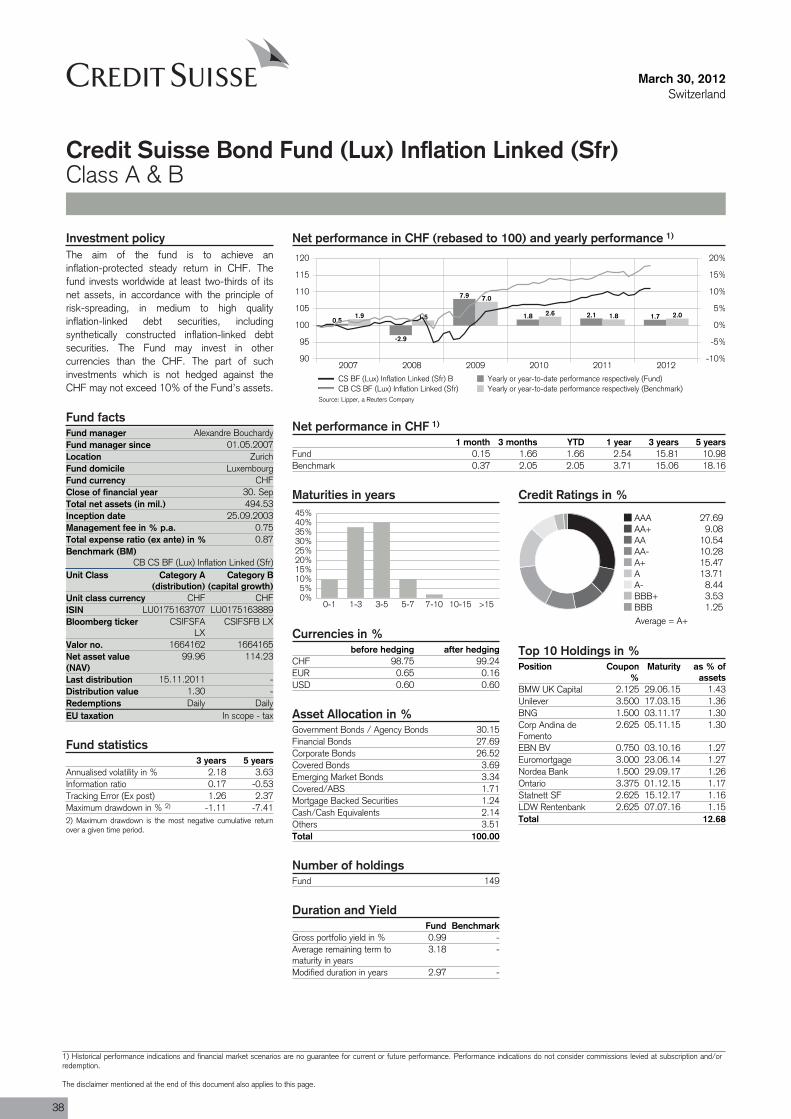
Fund 149
Fund manager Alexandre BouchardyFund manager since 01.05.2007Location ZurichFund domicile LuxembourgFund currency CHFClose of financial year 30. SepTotal net assets (in mil.) 494.53Inception date 25.09.2003Management fee in % p.a. 0.75Total expense ratio (ex ante) in % 0.87Benchmark (BM)
CB CS BF (Lux) Inflation Linked (Sfr)Unit Class Category A
(distribution)
ISIN LU0175163707
Valor no. 1664162
Last distribution 15.11.2011Distribution value 1.30Redemptions DailyEU taxation In scope - tax
March 30, 2012Switzerland
Credit Suisse Bond Fund (Lux) Inflation Linked (Sfr)Class A & B
Net performance in CHF (rebased to 100) and yearly performance 1)
2007 2008 2009 2010 2011 201290
95
100
105
110
115
120
-10%
-5%
0%
5%
10%
15%
20%
0.5
-2.9
7.9
1.8 2.1 1.71.9 1.5
7.0
2.6 1.8 2.0
CS BF (Lux) Inflation Linked (Sfr) B Yearly or year-to-date performance respectively (Fund)CB CS BF (Lux) Inflation Linked (Sfr) Yearly or year-to-date performance respectively (Benchmark)
Net performance in CHF 1)
1 month 3 months YTD 1 year 3 years 5 yearsFund 0.15 1.66 1.66 2.54 15.81 10.98Benchmark 0.37 2.05 2.05 3.71 15.06 18.16
Maturities in years
0%5%
10%15%20%25%30%35%40%45%
0-1 1-3 3-5 5-7 7-10 10-15 >15
Currencies in %before hedging after hedging
CHF 98.75 99.24EUR 0.65 0.16USD 0.60 0.60
Asset Allocation in %Government Bonds / Agency Bonds 30.15Financial Bonds 27.69Corporate Bonds 26.52Covered Bonds 3.69Emerging Market Bonds 3.34Covered/ABS 1.71Mortgage Backed Securities 1.24Cash/Cash Equivalents 2.14Others 3.51Total 100.00
Number of holdings
Duration and YieldFund Benchmark
Gross portfolio yield in % 0.99 -Average remaining term tomaturity in years
3.18 -
Modified duration in years 2.97 -
Credit Ratings in %
AAA 27.69AA+ 9.08AA 10.54AA- 10.28A+ 15.47A 13.71A- 8.44BBB+ 3.53BBB 1.25
Top 10 Holdings in %Position Coupon
%Maturity as % of
assetsBMW UK Capital 2.125 29.06.15 1.43Unilever 3.500 17.03.15 1.36BNG 1.500 03.11.17 1.30Corp Andina deFomento
2.625 05.11.15 1.30
EBN BV 0.750 03.10.16 1.27Euromortgage 3.000 23.06.14 1.27Nordea Bank 1.500 29.09.17 1.26Ontario 3.375 01.12.15 1.17Statnett SF 2.625 15.12.17 1.16LDW Rentenbank 2.625 07.07.16 1.15Total 12.68
Investment policyThe aim of the fund is to achieve aninflation-protected steady return in CHF. Thefund invests worldwide at least two-thirds of itsnet assets, in accordance with the principle ofrisk-spreading, in medium to high qualityinflation-linked debt securities, includingsynthetically constructed inflation-linked debtsecurities. The Fund may invest in othercurrencies than the CHF. The part of suchinvestments which is not hedged against theCHF may not exceed 10% of the Fund’s assets.
Fund facts
Category B(capital growth)
Unit class currency CHF CHFLU0175163889
Bloomberg ticker CSIFSFALX
CSIFSFB LX
1664165Net asset value(NAV)
99.96 114.23
--
Daily
Fund statistics3 years 5 years
Annualised volatility in % 2.18 3.63Information ratio 0.17 -0.53Tracking Error (Ex post) 1.26 2.37Maximum drawdown in % 2) -1.11 -7.412) Maximum drawdown is the most negative cumulative returnover a given time period.
Source: Lipper, a Reuters Company
Average = A+
38
1) Historical performance indications and financial market scenarios are no guarantee for current or future performance. Performance indications do not consider commissions levied at subscription and/orredemption.
The disclaimer mentioned at the end of this document also applies to this page.
March 30, 2012Switzerland
Credit Suisse Bond Fund (Lux) Inflation Linked (Sfr)Class A & B
Review previous quarter 3)
Inflation-linked bonds’ returns were positive inQ1, the overall index returned 1.2% (hedgedin USD). The quarter was characterized by, yetagain, strong differences across countries.Indeed, the best performing market was Europewith a return of 6.2%, followed by Japan (2.4%)and the US (0.8%). Helped by the positivesentiment impact of the ECB’s 3 year LTROs,Italy alone managed to return an impressive14%, by far erasing the losses of the previousquarter. France profited as well from the positivesentiment and returned 3.7%, while Germany
managed a still decent 1.2%. The worstperforming markets were Sweden (-1.6%), theUK (-1.4%) and Canada (-1.4%) which sufferedfrom the recent rates increase, especially at thelong-end of the curve. Compared to nominalbonds, inflation-linked bonds outperformed byalmost 2% as inflation expectations rose on theback of high energy prices and improvedeconomic data.
The fund returned 1.90% gross of fees on thequarter (1.66% net). It underperformed the
nominal benchmark by 14bps gross of fees(52bps net). The inflation swaps overlaydelivered a positive performance contribution dueto the strong rise in the USD breakeven inflation(the 5 year USD breakeven increased by 43bpsduring the quarter, whereas the 5 year EURbreakeven declined by 8bps). The defensivecredit exposure of the fund relative to thebenchmark explains most of theunderperformance. The fund maintained a realduration close to benchmark during the quarter.
Outlook for the market 3)
On the inflation side, headline CPI for Februaryincreased by 2.9% y-o-y in the US and by 2.7%y-o-y in Europe, whereas core indices increasedby 2.2% y-o-y and 1.5% y-o-y respectively.Against the background of reduced politicaltension in the Middle East, oil prices havestabilized and retraced from their peaks reachedearlier in March. Some relief on the headlinemeasure of CPI could therefore be expected in
the coming quarters. Regarding the coremeasure of inflation, it is likely to remain subduedin Europe amid tepid growth as well as fiscal andprivate sector deleveraging. In the US, however,rental inflation has been the key component ofthe steady increase in core inflation and is likelyto increase further, albeit at a more moderatepace.
In terms of strategy, although we believe thatrates won’t revisit the lows seen last year, wethink that the unresolved situation in Europe andthe strong CHF will put a cap on higher rates.Thus, we maintain the real rate duration slightlyshorter than the benchmark and the breakevenduration slightly above 0. We also maintain adefensive credit exposure.
Portfolio ManagementAlexandre Bouchardy, Director, is a senior portfolio manager in the International Fixed Income team. He joined CSAM in 2002. Previouslyhe gained first experience in asset management at two different companies in Geneva and Paris. Mr. Bouchardy graduated from theUniversity of Lausanne specialising in economics and finance.
Cre
dit S
uiss
e B
ond
Fund
3) If not expressly indicated otherwise, all quantitative data contained in this comment is based on Lipper, Bloomberg or Datastream.
39
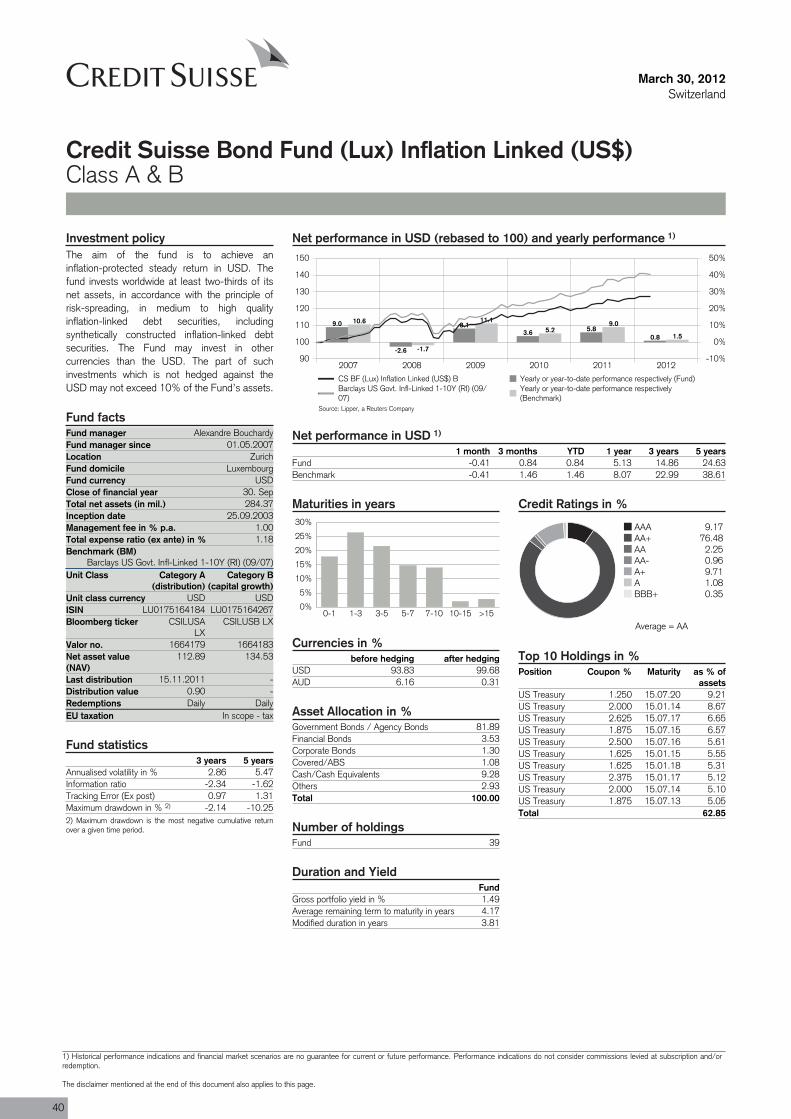
Fund 39
Fund manager Alexandre BouchardyFund manager since 01.05.2007Location ZurichFund domicile LuxembourgFund currency USDClose of financial year 30. SepTotal net assets (in mil.) 284.37Inception date 25.09.2003Management fee in % p.a. 1.00Total expense ratio (ex ante) in % 1.18Benchmark (BM)
Barclays US Govt. Infl-Linked 1-10Y (RI) (09/07)Unit Class Category A
(distribution)
ISIN LU0175164184
Valor no. 1664179
Last distribution 15.11.2011Distribution value 0.90Redemptions DailyEU taxation In scope - tax
March 30, 2012Switzerland
Credit Suisse Bond Fund (Lux) Inflation Linked (US$)Class A & B
Net performance in USD (rebased to 100) and yearly performance 1)
2007 2008 2009 2010 2011 201290
100
110
120
130
140
150
-10%
0%
10%
20%
30%
40%
50%
9.0
-2.6
8.13.6 5.8
0.8
10.6
-1.7
11.15.2
9.0
1.5
CS BF (Lux) Inflation Linked (US$) B Yearly or year-to-date performance respectively (Fund)Barclays US Govt. Infl-Linked 1-10Y (RI) (09/07)
Yearly or year-to-date performance respectively(Benchmark)
Net performance in USD 1)
1 month 3 months YTD 1 year 3 years 5 yearsFund -0.41 0.84 0.84 5.13 14.86 24.63Benchmark -0.41 1.46 1.46 8.07 22.99 38.61
Maturities in years
0%
5%
10%
15%
20%
25%
30%
0-1 1-3 3-5 5-7 7-10 10-15 >15
Currencies in %before hedging after hedging
USD 93.83 99.68AUD 6.16 0.31
Asset Allocation in %Government Bonds / Agency Bonds 81.89Financial Bonds 3.53Corporate Bonds 1.30Covered/ABS 1.08Cash/Cash Equivalents 9.28Others 2.93Total 100.00
Number of holdings
Duration and YieldFund
Gross portfolio yield in % 1.49Average remaining term to maturity in years 4.17Modified duration in years 3.81
Credit Ratings in %
AAA 9.17AA+ 76.48AA 2.25AA- 0.96A+ 9.71A 1.08BBB+ 0.35
Top 10 Holdings in %Position Coupon % Maturity as % of
assetsUS Treasury 1.250 15.07.20 9.21US Treasury 2.000 15.01.14 8.67US Treasury 2.625 15.07.17 6.65US Treasury 1.875 15.07.15 6.57US Treasury 2.500 15.07.16 5.61US Treasury 1.625 15.01.15 5.55US Treasury 1.625 15.01.18 5.31US Treasury 2.375 15.01.17 5.12US Treasury 2.000 15.07.14 5.10US Treasury 1.875 15.07.13 5.05Total 62.85
Investment policyThe aim of the fund is to achieve aninflation-protected steady return in USD. Thefund invests worldwide at least two-thirds of itsnet assets, in accordance with the principle ofrisk-spreading, in medium to high qualityinflation-linked debt securities, includingsynthetically constructed inflation-linked debtsecurities. The Fund may invest in othercurrencies than the USD. The part of suchinvestments which is not hedged against theUSD may not exceed 10% of the Fund’s assets.
Fund facts
Category B(capital growth)
Unit class currency USD USDLU0175164267
Bloomberg ticker CSILUSALX
CSILUSB LX
1664183Net asset value(NAV)
112.89 134.53
--
Daily
Fund statistics3 years 5 years
Annualised volatility in % 2.86 5.47Information ratio -2.34 -1.62Tracking Error (Ex post) 0.97 1.31Maximum drawdown in % 2) -2.14 -10.252) Maximum drawdown is the most negative cumulative returnover a given time period.
Source: Lipper, a Reuters Company
Average = AA
40
1) Historical performance indications and financial market scenarios are no guarantee for current or future performance. Performance indications do not consider commissions levied at subscription and/orredemption.
The disclaimer mentioned at the end of this document also applies to this page.
March 30, 2012Switzerland
Credit Suisse Bond Fund (Lux) Inflation Linked (US$)Class A & B
Review previous quarter 3)
Inflation-linked bonds’ returns were positive inQ1, the overall index returned 1.2% (hedgedin USD). The quarter was characterized by, yetagain, strong differences across countries.Indeed, the best performing market was Europewith a return of 6.2%, followed by Japan (2.4%)and the US (0.8%). Helped by the positivesentiment impact of the ECB’s 3 year LTROs,Italy alone managed to return an impressive14%, by far erasing the losses of the previousquarter. France profited as well from the positive
sentiment and returned 3.7%, while Germanymanaged a still decent 1.2%. The worstperforming markets were Sweden (-1.6%), theUK (-1.4%) and Canada (-1.4%) which sufferedfrom the recent rates increase, especially at thelong-end of the curve. Compared to nominalbonds, inflation-linked bonds outperformed byalmost 2% as inflation expectations rose on theback of high energy prices and improvedeconomic data.
In absolute terms, the fund returned 1.12%gross of fees (0.84% net). Both the decreasein real rates and the inflation compensationcontributed positively, the former by 1.03%, thelatter by 0.09%. Relative to benchmark, the fundunderperformed by -0.33% gross of fees(-0.62% net). Both market allocation andduration management were negative. Theoverweight in Australia was slightly negative asthe AUD market underperformed, while our shortduration was negative as real rates fell.
Outlook for the market 3)
On the inflation side, headline CPI for Februaryincreased by 2.9% y-o-y in the US and by 2.7%y-o-y in Europe, whereas core indices increasedby 2.2% y-o-y and 1.5% y-o-y respectively.Against the background of reduced politicaltension in the Middle East, oil prices havestabilized and retraced from their peaks reachedearlier in March. Some relief on the headlinemeasure of CPI could therefore be expected in
the coming quarters. Regarding the coremeasure of inflation, it is likely to remain subduedin Europe amid tepid growth as well as fiscal andprivate sector deleveraging. In the US, however,rental inflation has been the key component ofthe steady increase in core inflation and is likelyto increase further, albeit at a more moderatepace.
In terms of strategy, there were no changes onthe quarter. We maintain a short duration aswe believe expectations of further quantitativeeasing are too aggressively priced in the bondmarkets. On the market side, we are keepingan overweight in Australia for diversificationpurposes.
Portfolio ManagementAlexandre Bouchardy, Director, is a senior portfolio manager in the International Fixed Income team. He joined CSAM in 2002. Previouslyhe gained first experience in asset management at two different companies in Geneva and Paris. Mr. Bouchardy graduated from theUniversity of Lausanne specialising in economics and finance.
Cre
dit S
uiss
e B
ond
Fund
3) If not expressly indicated otherwise, all quantitative data contained in this comment is based on Lipper, Bloomberg or Datastream.
41
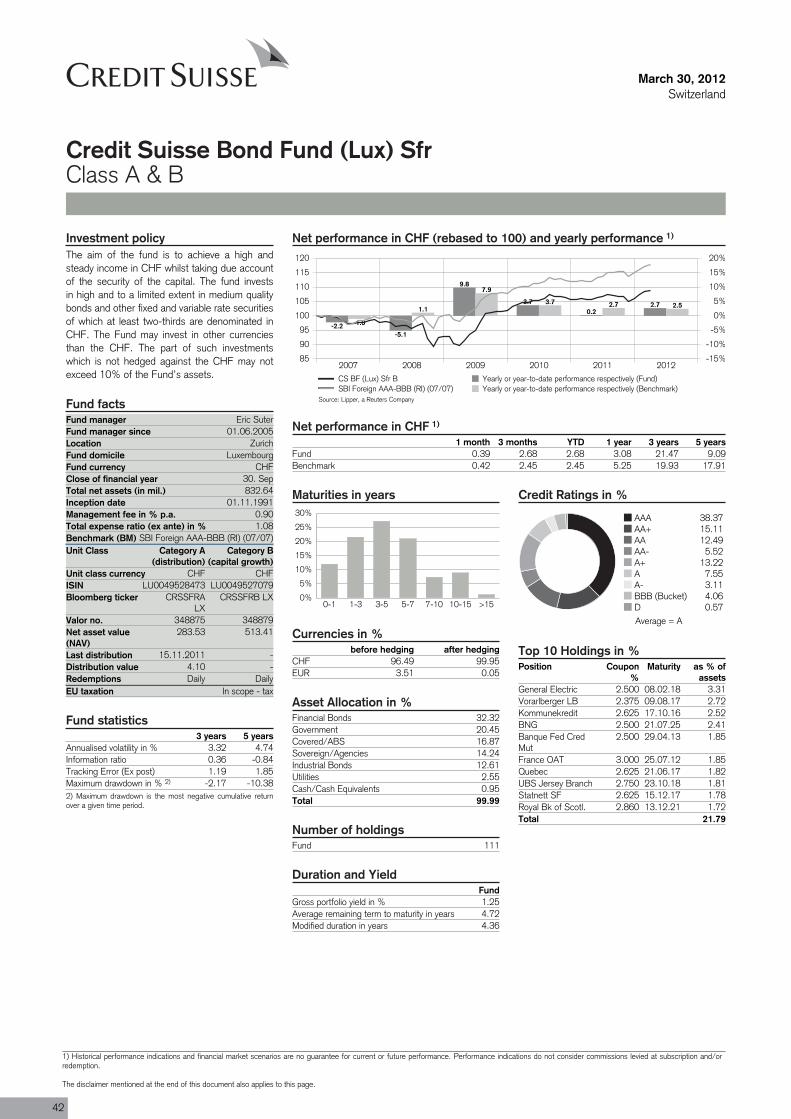
Fund 111
Fund manager Eric SuterFund manager since 01.06.2005Location ZurichFund domicile LuxembourgFund currency CHFClose of financial year 30. SepTotal net assets (in mil.) 832.64Inception date 01.11.1991Management fee in % p.a. 0.90Total expense ratio (ex ante) in % 1.08Benchmark (BM) SBI Foreign AAA-BBB (RI) (07/07)Unit Class Category A
(distribution)
ISIN LU0049528473
Valor no. 348875
Last distribution 15.11.2011Distribution value 4.10Redemptions DailyEU taxation In scope - tax
March 30, 2012Switzerland
Credit Suisse Bond Fund (Lux) SfrClass A & B
Net performance in CHF (rebased to 100) and yearly performance 1)
2007 2008 2009 2010 2011 201285
90
95
100
105
110
115
120
-15%
-10%
-5%
0%
5%
10%
15%
20%
-2.2-5.1
9.8
3.70.2
2.7
-1.0
1.1
7.9
3.7 2.7 2.5
CS BF (Lux) Sfr B Yearly or year-to-date performance respectively (Fund)SBI Foreign AAA-BBB (RI) (07/07) Yearly or year-to-date performance respectively (Benchmark)
Net performance in CHF 1)
1 month 3 months YTD 1 year 3 years 5 yearsFund 0.39 2.68 2.68 3.08 21.47 9.09Benchmark 0.42 2.45 2.45 5.25 19.93 17.91
Maturities in years
0%
5%
10%
15%
20%
25%
30%
0-1 1-3 3-5 5-7 7-10 10-15 >15
Currencies in %before hedging after hedging
CHF 96.49 99.95EUR 3.51 0.05
Asset Allocation in %Financial Bonds 32.32Government 20.45Covered/ABS 16.87Sovereign/Agencies 14.24Industrial Bonds 12.61Utilities 2.55Cash/Cash Equivalents 0.95Total 99.99
Number of holdings
Duration and YieldFund
Gross portfolio yield in % 1.25Average remaining term to maturity in years 4.72Modified duration in years 4.36
Credit Ratings in %
AAA 38.37AA+ 15.11AA 12.49AA- 5.52A+ 13.22A 7.55A- 3.11BBB (Bucket) 4.06D 0.57
Top 10 Holdings in %Position Coupon
%Maturity as % of
assetsGeneral Electric 2.500 08.02.18 3.31Vorarlberger LB 2.375 09.08.17 2.72Kommunekredit 2.625 17.10.16 2.52BNG 2.500 21.07.25 2.41Banque Fed CredMut
2.500 29.04.13 1.85
France OAT 3.000 25.07.12 1.85Quebec 2.625 21.06.17 1.82UBS Jersey Branch 2.750 23.10.18 1.81Statnett SF 2.625 15.12.17 1.78Royal Bk of Scotl. 2.860 13.12.21 1.72Total 21.79
Investment policyThe aim of the fund is to achieve a high andsteady income in CHF whilst taking due accountof the security of the capital. The fund investsin high and to a limited extent in medium qualitybonds and other fixed and variable rate securitiesof which at least two-thirds are denominated inCHF. The Fund may invest in other currenciesthan the CHF. The part of such investmentswhich is not hedged against the CHF may notexceed 10% of the Fund’s assets.
Fund facts
Category B(capital growth)
Unit class currency CHF CHFLU0049527079
Bloomberg ticker CRSSFRALX
CRSSFRB LX
348879Net asset value(NAV)
283.53 513.41
--
Daily
Fund statistics3 years 5 years
Annualised volatility in % 3.32 4.74Information ratio 0.36 -0.84Tracking Error (Ex post) 1.19 1.85Maximum drawdown in % 2) -2.17 -10.382) Maximum drawdown is the most negative cumulative returnover a given time period.
Source: Lipper, a Reuters Company
Average = A
42
1) Historical performance indications and financial market scenarios are no guarantee for current or future performance. Performance indications do not consider commissions levied at subscription and/orredemption.
The disclaimer mentioned at the end of this document also applies to this page.
March 30, 2012Switzerland
Credit Suisse Bond Fund (Lux) SfrClass A & B
Review previous quarter 3)
Substantial liquidity injections by the ECB (LTROI and LTRO II) and the restructuring of the Greekgovernment debt helped to stabilize markets inQ1 2012. There are still structural problemsrelated to European borrowers andheterogeneous global growth patterns.Nevertheless, the Swiss economy narrowlyavoided recession thanks to domesticconsumption and high demand for Swisswatches and pharmaceutical products in other
countries. The SNB stuck to its guns andmaintained its expansive monetary policy, onceagain confirming a minimum exchange rate of1.20 francs to the euro.
Interest rates remained very low for all termsin the quarter under review. The 10-year swaprate even dipped below the 1% mark in earlyMarch to 0.99%, setting a new record low. Whileshort-term Confederation bonds of up to three
years still exhibited negative yields at the start ofthe reporting period, the curve has since returnedto normal. At the end of the quarter, the 3-monthCHF LIBOR was 6bps higher at 0.11%, whilethe yield on 2-year Confederation bonds rose to0.02% (+6bps) and 10-year bonds came in at0.85% (+21bps). The performance of the firstquarter was mostly positive thanks to investordemand for high yielding bonds which resulted ina reduction of credit spreads.
Outlook for the market 3)
While the US economy performed surprisinglywell, production in Japan and Europe stagnated.Switzerland's GDP managed to grow at a rateof 0.1% in Q4 2011 despite the continuousstrength of the Swiss franc. A number of leadingindicators are showing early signs of stabilization,which could suggest that the economy hasbottomed out. The Swiss economy is dependenton global economic trends, and it remains to beseen whether the progress made with regard toovercoming the European sovereign debt crisiswill bring a lasting improvement to the situation.That said, a resurgence of the debt crisis cannot
be ruled out. Other geopolitical tensions couldlead to increased volatility in commodity prices. Inits first assessment of monetary policy in March2012 the SNB maintained its expansive courseand confirmed the minimum exchange rate of1.20 francs to the euro. The target range forthe CHF 3-month LIBOR is still 0-0.25%, andliquidity is still being kept high. On the otherhand, inflation is expected to rise modestly(2013: 0.3% and 2014: 0.6%). Also, theforecast for economic growth has been revisedupwards to 1% for 2012.
For the first time since last year the score ofour interest rate factor model turned negative asthe more friendly fundamental picture suggestshigher yields going forward. The technical inputalso changed to negative due to an overboughtsituation in the short term. The behavioral inputalso neutralized because of the recent strongflattening of the yield curve. We will reduce ourduration in the portfolios towards a shorterposition than the benchmark. We recommendtop quality issues and would increase thediversification in the portfolio as even some wellregarded names have gotten into trouble.
Portfolio ManagementEric Suter, Director, is a senior portfolio manager. He heads the Swiss Fixed Income Team and is responsible for the Swiss Fixed Incomeinvestment decision process. Eric joined CS Group in 1983 and worked in trading, product development and structuring of fixed incomeproducts. In 1995 he moved to fixed income asset management. He received a Bachelor in Business Administration from the KaderschuleZurich (KSZ), is a Certified International Investment Analyst (CIIA) and a member of the Swiss Bond Commission. Eric Suter, Director,leitet das Schweizer Franken Obligationen Team und ist verantwortlich für den Schweizer Franken Anlageprozess. Er stiess 1983 zur CSGroup und arbeitete im Handel, der Produkteentwicklung sowie in der Strukturierung von Zinsprodukten. 1995 wechselte er insObligationen Portfolio Management. Hr. Suter hat einen Abschluss in Betriebsökonomie der Kaderschule Zürich (KSZ), ist dipl.Finanzanalytiker und Vermögensverwalter (AZEK) sowie Mitglied der Schweizer Obligationenkommission (OKS).
Eric Suter, Director, dirige l'équipe Obligations CHF. Il a rejoint le CS Group en 1983 et a travaillé dans la vente, le développement produits ainsi que lastructuration de produits obligataires. En 1995, il est passé dans le domaine Portfolio Management Obligations. E. Suter dispose de diplômes en économied'entreprise de l'Ecole de cadres de Zurich (KSZ), d'analyste financier et gestionnaire de fortune (CFPI) et est membre de la Commission Suisse desObligations (OKS).
Cre
dit S
uiss
e B
ond
Fund
3) If not expressly indicated otherwise, all quantitative data contained in this comment is based on Lipper, Bloomberg or Datastream.
43
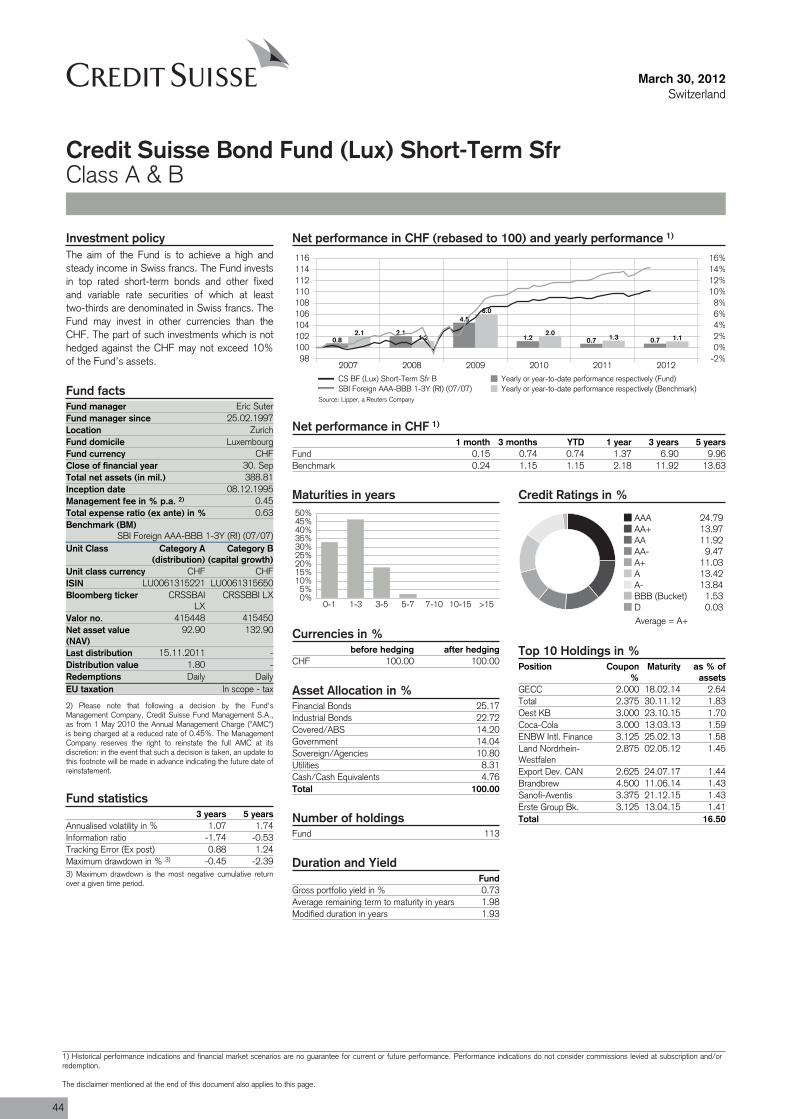
Fund 113
Fund manager Eric SuterFund manager since 25.02.1997Location ZurichFund domicile LuxembourgFund currency CHFClose of financial year 30. SepTotal net assets (in mil.) 388.81Inception date 08.12.1995Management fee in % p.a. 2) 0.45Total expense ratio (ex ante) in % 0.63Benchmark (BM)
SBI Foreign AAA-BBB 1-3Y (RI) (07/07)Unit Class Category A
(distribution)
ISIN LU0061315221
Valor no. 415448
Last distribution 15.11.2011Distribution value 1.80Redemptions DailyEU taxation In scope - tax
March 30, 2012Switzerland
Credit Suisse Bond Fund (Lux) Short-Term SfrClass A & B
Net performance in CHF (rebased to 100) and yearly performance 1)
2007 2008 2009 2010 2011 201298
100102104106108110112114116
-2%0%2%4%6%8%
10%12%14%16%
0.82.1
4.5
1.2 0.7 0.72.1
1.2
6.0
2.01.3 1.1
CS BF (Lux) Short-Term Sfr B Yearly or year-to-date performance respectively (Fund)SBI Foreign AAA-BBB 1-3Y (RI) (07/07) Yearly or year-to-date performance respectively (Benchmark)
Net performance in CHF 1)
1 month 3 months YTD 1 year 3 years 5 yearsFund 0.15 0.74 0.74 1.37 6.90 9.96Benchmark 0.24 1.15 1.15 2.18 11.92 13.63
Maturities in years
0%5%
10%15%20%25%30%35%40%45%50%
0-1 1-3 3-5 5-7 7-10 10-15 >15
Currencies in %before hedging after hedging
CHF 100.00 100.00
Asset Allocation in %Financial Bonds 25.17Industrial Bonds 22.72Covered/ABS 14.20Government 14.04Sovereign/Agencies 10.80Utilities 8.31Cash/Cash Equivalents 4.76Total 100.00
Number of holdings
Duration and YieldFund
Gross portfolio yield in % 0.73Average remaining term to maturity in years 1.98Modified duration in years 1.93
Credit Ratings in %
AAA 24.79AA+ 13.97AA 11.92AA- 9.47A+ 11.03A 13.42A- 13.84BBB (Bucket) 1.53D 0.03
Top 10 Holdings in %Position Coupon
%Maturity as % of
assetsGECC 2.000 18.02.14 2.64Total 2.375 30.11.12 1.83Oest KB 3.000 23.10.15 1.70Coca-Cola 3.000 13.03.13 1.59ENBW Intl. Finance 3.125 25.02.13 1.58Land Nordrhein-Westfalen
2.875 02.05.12 1.45
Export Dev. CAN 2.625 24.07.17 1.44Brandbrew 4.500 11.06.14 1.43Sanofi-Aventis 3.375 21.12.15 1.43Erste Group Bk. 3.125 13.04.15 1.41Total 16.50
Investment policyThe aim of the Fund is to achieve a high andsteady income in Swiss francs. The Fund investsin top rated short-term bonds and other fixedand variable rate securities of which at leasttwo-thirds are denominated in Swiss francs. TheFund may invest in other currencies than theCHF. The part of such investments which is nothedged against the CHF may not exceed 10%of the Fund’s assets.
Fund facts
Category B(capital growth)
Unit class currency CHF CHFLU0061315650
Bloomberg ticker CRSSBAILX
CRSSBBI LX
415450Net asset value(NAV)
92.90 132.90
--
Daily
2) Please note that following a decision by the Fund'sManagement Company, Credit Suisse Fund Management S.A.,as from 1 May 2010 the Annual Management Charge ("AMC")is being charged at a reduced rate of 0.45%. The ManagementCompany reserves the right to reinstate the full AMC at itsdiscretion: in the event that such a decision is taken, an update tothis footnote will be made in advance indicating the future date ofreinstatement.
Fund statistics3 years 5 years
Annualised volatility in % 1.07 1.74Information ratio -1.74 -0.53Tracking Error (Ex post) 0.88 1.24Maximum drawdown in % 3) -0.45 -2.393) Maximum drawdown is the most negative cumulative returnover a given time period.
Source: Lipper, a Reuters Company
Average = A+
44
1) Historical performance indications and financial market scenarios are no guarantee for current or future performance. Performance indications do not consider commissions levied at subscription and/orredemption.
The disclaimer mentioned at the end of this document also applies to this page.
March 30, 2012Switzerland
Credit Suisse Bond Fund (Lux) Short-Term SfrClass A & B
Review previous quarter 4)
Substantial liquidity injections by the ECB (LTROI and LTRO II) and the restructuring of the Greekgovernment debt helped to stabilize markets inQ1 2012. There are still structural problemsrelated to European borrowers (which are notto be underestimated) and heterogeneous globalgrowth patterns. Nevertheless, the Swisseconomy narrowly avoided recession thanks todomestic consumption and high demand forSwiss watches and pharmaceutical products in
other countries. The SNB stuck to its guns andmaintained its expansive monetary policy, onceagain confirming a minimum exchange rate of1.20 francs to the euro.
Interest rates remained very low for all termsin the quarter under review. The 10-year swaprate even dipped below the 1% mark in earlyMarch to 0.99%, setting a new record low. Whileshort-term Confederation bonds of up to three
years still exhibited negative yields at the start ofthe reporting period, the curve has since returnedto normal. At the end of the quarter, the 3-monthCHF LIBOR was 6bps higher at 0.11%, whilethe yield on 2-year Confederation bonds rose to0.02% (+6bps) and 10-year bonds came in at0.85% (+21bps). The performance of the firstquarter was mostly positive thanks to investordemand for high yielding bonds which resulted ina reduction of credit spreads.
Outlook for the market 4)
While the US economy performed surprisinglywell, production in Japan and Europe stagnated.Switzerland's GDP managed to grow at a rateof 0.1% in Q4 2011 despite the continuousstrength of the Swiss franc. A number of leadingindicators are showing early signs of stabilization,which could suggest that the economy hasbottomed out. The Swiss economy is dependenton global economic trends, and it remains to beseen whether the progress made with regard toovercoming the European sovereign debt crisiswill bring a lasting improvement to the situation.That said, a resurgence of the debt crisis cannot
be ruled out. Other geopolitical tensions couldlead to increased volatility in commodity prices. Inits first assessment of monetary policy in March2012 the SNB maintained its expansive courseand confirmed the minimum exchange rate of1.20 francs to the euro. The target range forthe CHF 3-month LIBOR is still 0-0.25%, andliquidity is still being kept high. On the otherhand, inflation is expected to rise modestly(2013: 0.3% and 2014: 0.6%). Also, theforecast for economic growth has been revisedupwards to 1% for 2012.
For the first time since last year the score ofour interest rate factor model turned negative asthe more friendly fundamental picture suggestshigher yields going forward. The technical inputalso changed to negative due to an overboughtsituation in the short term. The behavioral inputalso neutralized because of the recent strongflattening of the yield curve. We will reduce ourduration in the portfolios towards a shorterposition than the benchmark. We recommendtop quality issues and would increase thediversification in the portfolio as even some wellregarded names have gotten into trouble.
Portfolio ManagementEric Suter, Director, is a senior portfolio manager. He heads the Swiss Fixed Income Team and is responsible for the Swiss Fixed Incomeinvestment decision process. Eric joined CS Group in 1983 and worked in trading, product development and structuring of fixed incomeproducts. In 1995 he moved to fixed income asset management. He received a Bachelor in Business Administration from the KaderschuleZurich (KSZ), is a Certified International Investment Analyst (CIIA) and a member of the Swiss Bond Commission. Eric Suter, Director,leitet das Schweizer Franken Obligationen Team und ist verantwortlich für den Schweizer Franken Anlageprozess. Er stiess 1983 zur CSGroup und arbeitete im Handel, der Produkteentwicklung sowie in der Strukturierung von Zinsprodukten. 1995 wechselte er insObligationen Portfolio Management. Hr. Suter hat einen Abschluss in Betriebsökonomie der Kaderschule Zürich (KSZ), ist dipl.Finanzanalytiker und Vermögensverwalter (AZEK) sowie Mitglied der Schweizer Obligationenkommission (OKS).
Eric Suter, Director, dirige l'équipe Obligations CHF. Il a rejoint le CS Group en 1983 et a travaillé dans la vente, le développement produits ainsi que lastructuration de produits obligataires. En 1995, il est passé dans le domaine Portfolio Management Obligations. E. Suter dispose de diplômes en économied'entreprise de l'Ecole de cadres de Zurich (KSZ), d'analyste financier et gestionnaire de fortune (CFPI) et est membre de la Commission Suisse desObligations (OKS).
Cre
dit S
uiss
e B
ond
Fund
4) If not expressly indicated otherwise, all quantitative data contained in this comment is based on Lipper, Bloomberg or Datastream.
45
Fund 91
Fund manager Maurizio PedriniFund manager since 13.12.2002Location ZurichFund domicile LuxembourgFund currency EURClose of financial year 30. SepTotal net assets (in mil.) 122.49Inception date 13.12.2002Management fee in % p.a. 1.00Total expense ratio (ex ante) in % 1.17Benchmark (BM) LIBOR EUR 3MUnit Class Category A
(distribution)
ISIN LU0155950867
Valor no. 1498937
Last distribution 15.11.2011Distribution value 4.55Redemptions DailyEU taxation In scope - tax
March 30, 2012Switzerland
Credit Suisse Bond Fund (Lux) TOPS (Euro)Class A & B
Net performance in EUR (rebased to 100) and yearly performance 1)
2007 2008 2009 2010 2011 201285
90
95
100
105
110
115
120
-15%
-10%
-5%
0%
5%
10%
15%
20%
0.9
-8.4
15.7
2.8
-1.4
3.54.3 4.81.3 0.7 1.3 0.3
CS BF (Lux) TOPS (Euro) B Yearly or year-to-date performance respectively (Fund)LIBOR EUR 3M Yearly or year-to-date performance respectively (Benchmark)
Net performance in EUR 1)
1 month 3 months YTD 1 year 3 years 5 yearsFund 0.44 3.48 3.48 1.86 25.87 11.50Benchmark 0.07 0.27 0.27 1.35 3.12 12.31
Maturities in years
0%5%
10%15%20%25%30%35%40%
0-1 1-3 3-5 5-7 7-10 10-15 >15
Currencies in %before hedging after hedging
EUR 71.92 100.23USD 27.99 -0.33GBP 0.09 0.09
Asset Allocation in %Industrial Bonds 42.88Financial Bonds 30.16Government 13.72Sovereign/Agencies 4.20Utilities 3.95Covered/ABS 1.85Funds 1.54Derivatives -4.43Cash/Cash Equivalents 6.14Total 100.01
Number of holdings
Duration and YieldFund
Gross portfolio yield in % 2.42Average remaining term to maturity in years 4.07Modified duration in years 1.67
Credit Ratings in %
AAA 10.33AA 1.84AA- 7.28A+ 12.79A 21.98A- 14.34BBB+ 16.56BBB 14.88
Top 10 Holdings in %Position Coupon
%Maturity as % of
assetsVeolia 1.750 17.06.15 3.84Quebec 9.000 01.04.16 2.10Pfizer Inc. 4.750 03.06.16 1.90Compagnie Fin etIndus
5.000 24.05.21 1.89
Toronto Dominion 1.625 14.09.16 1.85America Movil SAB 3.750 28.06.17 1.80Hammerson 4.875 19.06.15 1.79Gaz Capital 5.364 31.10.14 1.77Barclays 4.000 20.01.17 1.74Eur. InvestmentBank
3.125 03.03.17 1.74
Total 20.42
Investment policyThe aim of the fund is to achieve a steadyincome in EUR whilst taking due account of thesecurity of the capital. The fund invests in debtsecurities rated at between high quality and lowerinvestment grade, including bonds, notes andsimilar fixed or variable interest securitiesworldwide. The Fund may invest in othercurrencies than the EUR. The part of suchinvestments which is not hedged against theEUR may not exceed 10% of the Fund’s assets.
Fund facts
Category B(capital growth)
Unit class currency EUR EURLU0155951089
Bloomberg ticker CSBTPEALX
CSBTPEB LX
1498940Net asset value(NAV)
94.65 121.83
--
Daily
Fund statistics3 years 5 years
Annualised volatility in % 4.60 5.00Information ratio 1.46 -0.03Tracking Error (Ex post) 4.54 5.19Maximum drawdown in % 2) -3.46 -12.362) Maximum drawdown is the most negative cumulative returnover a given time period.
Source: Lipper, a Reuters Company
Average = A-
46
1) Historical performance indications and financial market scenarios are no guarantee for current or future performance. Performance indications do not consider commissions levied at subscription and/orredemption.
The disclaimer mentioned at the end of this document also applies to this page.

March 30, 2012Switzerland
Credit Suisse Bond Fund (Lux) TOPS (Euro)Class A & B
Review previous quarter 3)
Substantial liquidity injections by the ECB (LTROI and LTRO II) and the restructuring of the Greekgovernment debt helped to stabilize markets inQ1 2012. Risky assets strongly outperformedgovernments bonds in general and peripheralgovernment bonds of the euro area also surgedin price. Q1 2012 was therefore one of thestrongest in recent history. Credit spreadstightened as measured by the iTraxx EuropeMain Index (5yrs) from 173bps to 125bps andin the US from 120bps to 92bps (CDX IG 5yrs).Interest rates in the US climbed higher on theback of improving economic data. The US yield
curve steepened as the differential between 2yrsand 10yrs maturities increased by 15pbs to179bps.
Unlike in the US, yield changes in the eurozoneresembled the picture of a butterfly as the shortend and the long end gapped higher while themiddle of the curve (6yrs -12 yrs) was lower.Spain got back into the spotlight after thegovernment warned that the budget deficit will behigher than originally forecasted in 2011. Also,demand was lower than expected at one of itsgovernment debt auctions. One of the key issues
in Europe is still that in order to reduce theirbudget deficits, governments need to introduceausterity measures which may cause civil unrestand a negative GDP growth rate. LTRO’s havereduced the liquidity issue for banks. However,many banks in Europe remain weakly capitalized.One of the bright spots are the high growth ratesof emerging market countries. Even as Chinahas declared that it will target a lower growth rateunder its new five-year plan, investors continueto be attracted by the higher interest rates andearnings growth of Asian and Latin Americaneconomies.
Outlook for the market 3)
The Fed announced that it does not expect torevise its monetary policy anytime soon. Therecovery of the US economy remains protractedbut recently exceeded the expectations of themarket. In particular, the labor market has beenmore dynamic as more jobs were created in Q1and the jobless rate dropped to 8.2%.Manufacturing also suggested that the USeconomy continues to be on a slow butcontinuous growth path. There are virtually noinflationary forces that could lead the Fed toincrease interest rates within a year. Interestrates will likely stay at the current level for some
time in the US which in turn may hurt emergingmarkets because their currencies are likely toappreciate versus the USD. In order to remaincompetitive, countries such as Brazil and otherfast growing economies need to replace moreexpensive labor with capital and encouragedomestic consumption. What does this mean forcredit spreads and interest rates?
For the first time since last year the score ofour interest rate factor model turned negative asthe more friendly fundamental picture suggestshigher yields going forward. The technical input
also changed to negative due to an overboughtsituation in the short term. The behavioral inputalso neutralized because of the recent strongflattening of yield curves in Europe. We willtherefore reduce our duration in the portfoliostowards a shorter position than the benchmark.In corporate bonds we recommend issuers witha good credit profile and would increase thediversification in the portfolio as even somefrequent issuers have become expensive. Aconsolidation period seems likely after the strongrally in the first quarter.
Portfolio ManagementMaurizio Pedrini is a Managing Director of Credit Suisse's Asset Management business, based in Zurich. He is Global Co-Head FixedIncome, focusing on retail funds and institutional products. He joined Credit Suisse in 1998. Prior to this he was Head of Bond Researchand Bond Fund Management at UBS Private Banking. Maurizio has more than 17 years of professional experience in the fixed income andforeign exchange business. Maurizio holds a Master's degree from the University of Zurich (specializing in Finance and Monetary Theory)and is a Certified EFFAS Financial Ana-lyst. He is a visiting lecturer at the University of Zurich for the EFFAS Financial Analyst studycourse and at the University of Applied Sciences Northwestern Switzerland on various fixed income topics. Maurizio is a member of theSwiss Bond Commission.
Cre
dit S
uiss
e B
ond
Fund
3) If not expressly indicated otherwise, all quantitative data contained in this comment is based on Lipper, Bloomberg or Datastream.
47
Fund 84
Fund manager Maurizio PedriniFund manager since 13.12.2002Location ZurichFund domicile LuxembourgFund currency CHFClose of financial year 30. SepTotal net assets (in mil.) 169.58Inception date 13.12.2002Management fee in % p.a. 0.50Total expense ratio (ex ante) in % 0.66Benchmark (BM) LIBOR CHF 3MUnit Class Category A
(distribution)
ISIN LU0155951675
Valor no. 1498944
Last distribution 15.11.2011Distribution value 4.13Redemptions DailyEU taxation In scope - tax
March 30, 2012Switzerland
Credit Suisse Bond Fund (Lux) TOPS (Sfr)Class A & B
Net performance in CHF (rebased to 100) and yearly performance 1)
2007 2008 2009 2010 2011 201285
90
95
100
105
110
115
120
-15%
-10%
-5%
0%
5%
10%
15%
20%
-0.4
-11.1
15.3
3.6
-1.4
2.42.6 2.70.4 0.2 0.1 0.0
CS BF (Lux) TOPS (Sfr) B Yearly or year-to-date performance respectively (Fund)LIBOR CHF 3M Yearly or year-to-date performance respectively (Benchmark)
Net performance in CHF 1)
1 month 3 months YTD 1 year 3 years 5 yearsFund 0.50 2.43 2.43 0.30 24.01 6.51Benchmark 0.01 0.02 0.02 0.10 0.60 5.50
Maturities in years
0%5%
10%15%20%25%30%35%40%45%
0-1 1-3 3-5 5-7 7-10 10-15 >15
Currencies in %before hedging after hedging
CHF 67.51 96.67EUR 28.19 2.90USD 2.20 0.10GBP 2.10 0.32
Asset Allocation in %Industrial Bonds 38.80Financial Bonds 26.48Government 13.65Utilities 10.86Sovereign/Agencies 4.00Covered/ABS 2.32Funds 1.34Derivatives -1.45Cash/Cash Equivalents 3.12Others 0.88Total 100.00
Number of holdings
Duration and YieldFund
Gross portfolio yield in % 1.65Average remaining term to maturity in years 3.19Modified duration in years 1.36
Credit Ratings in %
AAA 2.39AA+ 2.88AA 0.91AA- 5.97A+ 16.83A 24.78A- 20.95BBB (Bucket) 24.38Not rated 0.91
Top 10 Holdings in %Position Coupon
%Maturity as % of
assetsBG Energy Capital 5.875 13.11.12 1.78PHILIP MORRIS 5.875 04.09.15 1.67Veolia 1.750 17.06.15 1.67IBM 3.625 27.05.15 1.64Comm. Bk ofAustral.
3.000 09.11.17 1.62
Siemens 5.250 14.09.66 1.62Rabobank 6.875 12.11.49 1.61Andina Corp. 5.000 13.08.13 1.59BMW US Capital 3.625 04.03.15 1.59Cargill 3.750 07.11.14 1.59Total 16.38
Investment policyThe aim of the fund is to achieve a steadyincome in CHF whilst taking due account of thesecurity of the capital. The fund invests in debtsecurities rated at between high quality and lowerinvestment grade, including bonds, notes andsimilar fixed or variable interest securitiesworldwide. The Fund may invest in othercurrencies than the CHF. The part of suchinvestments which is not hedged against theCHF may not exceed 10% of the Fund’s assets.
Fund facts
Category B(capital growth)
Unit class currency CHF CHFLU0155952053
Bloomberg ticker CSBTPSALX
CSBTPSB LX
1498946Net asset value(NAV)
94.86 109.85
--
Daily
Fund statistics3 years 5 years
Annualised volatility in % 4.00 5.14Information ratio 1.77 0.04Tracking Error (Ex post) 3.94 5.32Maximum drawdown in % 2) -3.13 -14.192) Maximum drawdown is the most negative cumulative returnover a given time period.
Source: Lipper, a Reuters Company
Average = A-
48
1) Historical performance indications and financial market scenarios are no guarantee for current or future performance. Performance indications do not consider commissions levied at subscription and/orredemption.
The disclaimer mentioned at the end of this document also applies to this page.
March 30, 2012Switzerland
Credit Suisse Bond Fund (Lux) TOPS (Sfr)Class A & B
Review previous quarter 3)
Substantial liquidity injections by the ECB (LTROI and LTRO II) and the restructuring of the Greekgovernment debt helped to stabilize markets inQ1 2012. Risky assets strongly outperformedgovernments bonds in general and peripheralgovernment bonds of the euro area also surgedin price. Q1 2012 was therefore one of thestrongest in recent history. Credit spreadstightened as measured by the iTraxx EuropeMain Index (5yrs) from 173bps to 125bps andin the US from 120bps to 92bps (CDX IG 5yrs).Interest rates in the US climbed higher on theback of improving economic data. The US yield
curve steepened as the differential between 2yrsand 10yrs maturities increased by 15pbs to179bps.
Unlike in the US, yield changes in the eurozoneresembled the picture of a butterfly as the shortend and the long end gapped higher while themiddle of the curve (6yrs -12 yrs) was lower.Spain got back into the spotlight after thegovernment warned that the budget deficit will behigher than originally forecasted in 2011. Also,demand was lower than expected at one of itsgovernment debt auctions. One of the key issues
in Europe is still that in order to reduce theirbudget deficits, governments need to introduceausterity measures which may cause civil unrestand a negative GDP growth rate. LTRO’s havereduced the liquidity issue for banks. However,many banks in Europe remain weakly capitalized.One of the bright spots are the high growth ratesof emerging market countries. Even as Chinahas declared that it will target a lower growth rateunder its new five-year plan, investors continueto be attracted by the higher interest rates andearnings growth of Asian and Latin Americaneconomies.
Outlook for the market 3)
The Fed announced that it does not expect torevise its monetary policy anytime soon. Therecovery of the US economy remains protractedbut recently exceeded the expectations of themarket. In particular, the labor market has beenmore dynamic as more jobs were created in Q1and the jobless rate dropped to 8.2%.Manufacturing also suggested that the USeconomy continues to be on a slow butcontinuous growth path. There are virtually noinflationary forces that could lead the Fed toincrease interest rates within a year. Interestrates will likely stay at the current level for some
time in the US which in turn may hurt emergingmarkets because their currencies are likely toappreciate versus the USD. In order to remaincompetitive, countries such as Brazil and otherfast growing economies need to replace moreexpensive labor with capital and encouragedomestic consumption. What does this mean forcredit spreads and interest rates?
For the first time since last year the score ofour interest rate factor model turned negative asthe more friendly fundamental picture suggestshigher yields going forward. The technical input
also changed to negative due to an overboughtsituation in the short term. The behavioral inputalso neutralized because of the recent strongflattening of yield curves in Europe. We willtherefore reduce our duration in the portfoliostowards a shorter position than the benchmark.In corporate bonds we recommend issuers witha good credit profile and would increase thediversification in the portfolio as even somefrequent issuers have become expensive. Aconsolidation period seems likely after the strongrally in the first quarter.
Portfolio ManagementMaurizio Pedrini is a Managing Director of Credit Suisse's Asset Management business, based in Zurich. He is Global Co-Head FixedIncome, focusing on retail funds and institutional products. He joined Credit Suisse in 1998. Prior to this he was Head of Bond Researchand Bond Fund Management at UBS Private Banking. Maurizio has more than 17 years of professional experience in the fixed income andforeign exchange business. Maurizio holds a Master's degree from the University of Zurich (specializing in Finance and Monetary Theory)and is a Certified EFFAS Financial Ana-lyst. He is a visiting lecturer at the University of Zurich for the EFFAS Financial Analyst studycourse and at the University of Applied Sciences Northwestern Switzerland on various fixed income topics. Maurizio is a member of theSwiss Bond Commission.
Cre
dit S
uiss
e B
ond
Fund
3) If not expressly indicated otherwise, all quantitative data contained in this comment is based on Lipper, Bloomberg or Datastream.
49
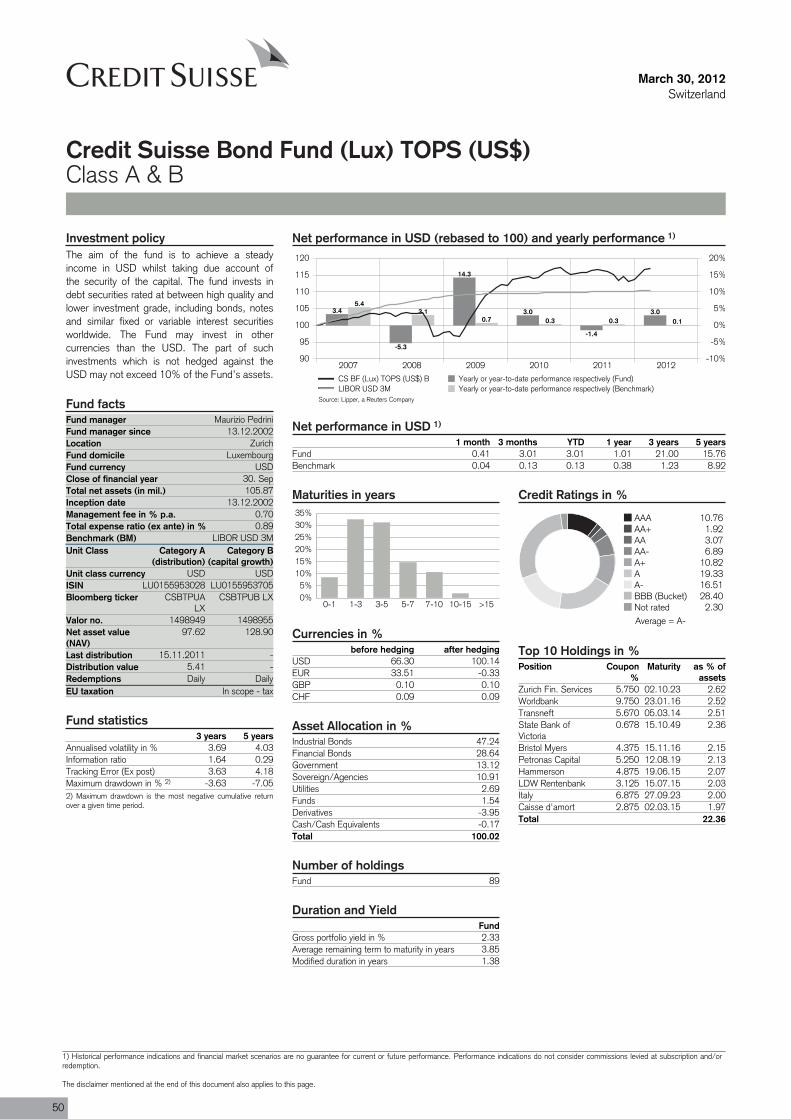
Fund 89
Fund manager Maurizio PedriniFund manager since 13.12.2002Location ZurichFund domicile LuxembourgFund currency USDClose of financial year 30. SepTotal net assets (in mil.) 105.87Inception date 13.12.2002Management fee in % p.a. 0.70Total expense ratio (ex ante) in % 0.89Benchmark (BM) LIBOR USD 3MUnit Class Category A
(distribution)
ISIN LU0155953028
Valor no. 1498949
Last distribution 15.11.2011Distribution value 5.41Redemptions DailyEU taxation In scope - tax
March 30, 2012Switzerland
Credit Suisse Bond Fund (Lux) TOPS (US$)Class A & B
Net performance in USD (rebased to 100) and yearly performance 1)
2007 2008 2009 2010 2011 201290
95
100
105
110
115
120
-10%
-5%
0%
5%
10%
15%
20%
3.4
-5.3
14.3
3.0
-1.4
3.05.4
3.10.7 0.3 0.3 0.1
CS BF (Lux) TOPS (US$) B Yearly or year-to-date performance respectively (Fund)LIBOR USD 3M Yearly or year-to-date performance respectively (Benchmark)
Net performance in USD 1)
1 month 3 months YTD 1 year 3 years 5 yearsFund 0.41 3.01 3.01 1.01 21.00 15.76Benchmark 0.04 0.13 0.13 0.38 1.23 8.92
Maturities in years
0%5%
10%15%20%25%30%35%
0-1 1-3 3-5 5-7 7-10 10-15 >15
Currencies in %before hedging after hedging
USD 66.30 100.14EUR 33.51 -0.33GBP 0.10 0.10CHF 0.09 0.09
Asset Allocation in %Industrial Bonds 47.24Financial Bonds 28.64Government 13.12Sovereign/Agencies 10.91Utilities 2.69Funds 1.54Derivatives -3.95Cash/Cash Equivalents -0.17Total 100.02
Number of holdings
Duration and YieldFund
Gross portfolio yield in % 2.33Average remaining term to maturity in years 3.85Modified duration in years 1.38
Credit Ratings in %
AAA 10.76AA+ 1.92AA 3.07AA- 6.89A+ 10.82A 19.33A- 16.51BBB (Bucket) 28.40Not rated 2.30
Top 10 Holdings in %Position Coupon
%Maturity as % of
assetsZurich Fin. Services 5.750 02.10.23 2.62Worldbank 9.750 23.01.16 2.52Transneft 5.670 05.03.14 2.51State Bank ofVictoria
0.678 15.10.49 2.36
Bristol Myers 4.375 15.11.16 2.15Petronas Capital 5.250 12.08.19 2.13Hammerson 4.875 19.06.15 2.07LDW Rentenbank 3.125 15.07.15 2.03Italy 6.875 27.09.23 2.00Caisse d'amort 2.875 02.03.15 1.97Total 22.36
Investment policyThe aim of the fund is to achieve a steadyincome in USD whilst taking due account ofthe security of the capital. The fund invests indebt securities rated at between high quality andlower investment grade, including bonds, notesand similar fixed or variable interest securitiesworldwide. The Fund may invest in othercurrencies than the USD. The part of suchinvestments which is not hedged against theUSD may not exceed 10% of the Fund’s assets.
Fund facts
Category B(capital growth)
Unit class currency USD USDLU0155953705
Bloomberg ticker CSBTPUALX
CSBTPUB LX
1498955Net asset value(NAV)
97.62 128.90
--
Daily
Fund statistics3 years 5 years
Annualised volatility in % 3.69 4.03Information ratio 1.64 0.29Tracking Error (Ex post) 3.63 4.18Maximum drawdown in % 2) -3.63 -7.052) Maximum drawdown is the most negative cumulative returnover a given time period.
Source: Lipper, a Reuters Company
Average = A-
50
1) Historical performance indications and financial market scenarios are no guarantee for current or future performance. Performance indications do not consider commissions levied at subscription and/orredemption.
The disclaimer mentioned at the end of this document also applies to this page.
March 30, 2012Switzerland
Credit Suisse Bond Fund (Lux) TOPS (US$)Class A & B
Review previous quarter 3)
Substantial liquidity injections by the ECB (LTROI and LTRO II) and the restructuring of the Greekgovernment debt helped to stabilize markets inQ1 2012. Risky assets strongly outperformedgovernments bonds in general and peripheralgovernment bonds of the euro area also surgedin price. Q1 2012 was therefore one of thestrongest in recent history. Credit spreadstightened as measured by the iTraxx EuropeMain Index (5yrs) from 173bps to 125bps andin the US from 120bps to 92bps (CDX IG 5yrs).Interest rates in the US climbed higher on theback of improving economic data. The US yield
curve steepened as the differential between 2yrsand 10yrs maturities increased by 15pbs to179bps.
Unlike in the US, yield changes in the eurozoneresembled the picture of a butterfly as the shortend and the long end gapped higher while themiddle of the curve (6yrs -12 yrs) was lower.Spain got back into the spotlight after thegovernment warned that the budget deficit will behigher than originally forecasted in 2011. Also,demand was lower than expected at one of itsgovernment debt auctions. One of the key issues
in Europe is still that in order to reduce theirbudget deficits, governments need to introduceausterity measures which may cause civil unrestand a negative GDP growth rate. LTRO’s havereduced the liquidity issue for banks. However,many banks in Europe remain weakly capitalized.One of the bright spots are the high growth ratesof emerging market countries. Even as Chinahas declared that it will target a lower growth rateunder its new five-year plan, investors continueto be attracted by the higher interest rates andearnings growth of Asian and Latin Americaneconomies.
Outlook for the market 3)
The Fed announced that it does not expect torevise its monetary policy anytime soon. Therecovery of the US economy remains protractedbut recently exceeded the expectations of themarket. In particular, the labor market has beenmore dynamic as more jobs were created in Q1and the jobless rate dropped to 8.2%.Manufacturing also suggested that the USeconomy continues to be on a slow butcontinuous growth path. There are virtually noinflationary forces that could lead the Fed toincrease interest rates within a year. Interestrates will likely stay at the current level for some
time in the US which in turn may hurt emergingmarkets because their currencies are likely toappreciate versus the USD. In order to remaincompetitive, countries such as Brazil and otherfast growing economies need to replace moreexpensive labor with capital and encouragedomestic consumption. What does this mean forcredit spreads and interest rates?
For the first time since last year the score ofour interest rate factor model turned negative asthe more friendly fundamental picture suggestshigher yields going forward. The technical input
also changed to negative due to an overboughtsituation in the short term. The behavioral inputalso neutralized because of the recent strongflattening of yield curves in Europe. We willtherefore reduce our duration in the portfoliostowards a shorter position than the benchmark.In corporate bonds we recommend issuers witha good credit profile and would increase thediversification in the portfolio as even somefrequent issuers have become expensive. Aconsolidation period seems likely after the strongrally in the first quarter.
Portfolio ManagementMaurizio Pedrini is a Managing Director of Credit Suisse's Asset Management business, based in Zurich. He is Global Co-Head FixedIncome, focusing on retail funds and institutional products. He joined Credit Suisse in 1998. Prior to this he was Head of Bond Researchand Bond Fund Management at UBS Private Banking. Maurizio has more than 17 years of professional experience in the fixed income andforeign exchange business. Maurizio holds a Master's degree from the University of Zurich (specializing in Finance and Monetary Theory)and is a Certified EFFAS Financial Ana-lyst. He is a visiting lecturer at the University of Zurich for the EFFAS Financial Analyst studycourse and at the University of Applied Sciences Northwestern Switzerland on various fixed income topics. Maurizio is a member of theSwiss Bond Commission.
Cre
dit S
uiss
e B
ond
Fund
3) If not expressly indicated otherwise, all quantitative data contained in this comment is based on Lipper, Bloomberg or Datastream.
51
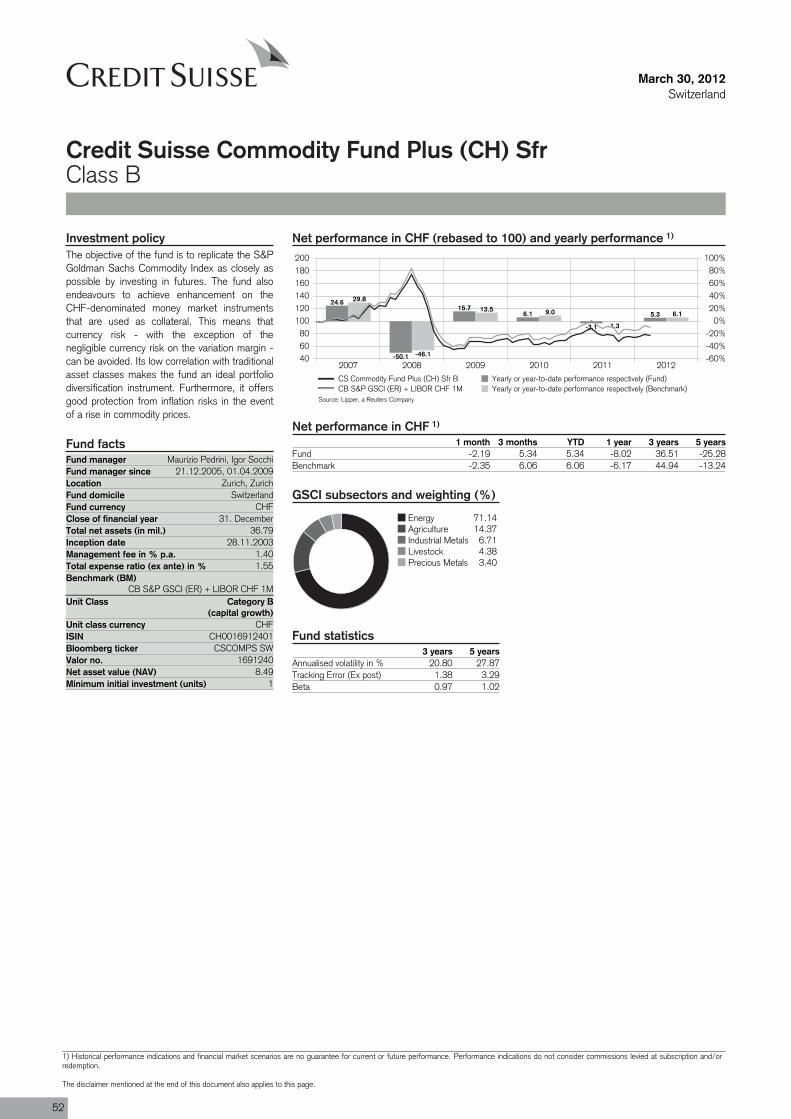
Fund manager Maurizio Pedrini, Igor SocchiFund manager since 21.12.2005, 01.04.2009Location Zurich, ZurichFund domicile SwitzerlandFund currency CHFClose of financial year 31. DecemberTotal net assets (in mil.) 36.79Inception date 28.11.2003Management fee in % p.a. 1.40Total expense ratio (ex ante) in % 1.55Benchmark (BM)
CB S&P GSCI (ER) + LIBOR CHF 1MUnit Class Category B
(capital growth)
ISIN CH0016912401
Valor no. 1691240
Minimum initial investment (units) 1
March 30, 2012Switzerland
Credit Suisse Commodity Fund Plus (CH) SfrClass B
Net performance in CHF (rebased to 100) and yearly performance 1)
2007 2008 2009 2010 2011 2012406080
100120140160180200
-60%-40%-20%
0%20%40%60%80%
100%
24.6
-50.1
15.76.1
-3.1
5.3
29.8
-46.1
13.5 9.0
-1.3
6.1
CS Commodity Fund Plus (CH) Sfr B Yearly or year-to-date performance respectively (Fund)CB S&P GSCI (ER) + LIBOR CHF 1M Yearly or year-to-date performance respectively (Benchmark)
Net performance in CHF 1)
1 month 3 months YTD 1 year 3 years 5 yearsFund -2.19 5.34 5.34 -8.02 36.51 -25.28Benchmark -2.35 6.06 6.06 -6.17 44.94 -13.24
GSCI subsectors and weighting (%)
Energy 71.14Agriculture 14.37Industrial Metals 6.71Livestock 4.38Precious Metals 3.40
Fund statistics3 years 5 years
Annualised volatility in % 20.80 27.87Tracking Error (Ex post) 1.38 3.29Beta 0.97 1.02
Investment policyThe objective of the fund is to replicate the S&PGoldman Sachs Commodity Index as closely aspossible by investing in futures. The fund alsoendeavours to achieve enhancement on theCHF-denominated money market instrumentsthat are used as collateral. This means thatcurrency risk - with the exception of thenegligible currency risk on the variation margin -can be avoided. Its low correlation with traditionalasset classes makes the fund an ideal portfoliodiversification instrument. Furthermore, it offersgood protection from inflation risks in the eventof a rise in commodity prices.
Fund facts
Unit class currency CHF
Bloomberg ticker CSCOMPS SW
Net asset value (NAV) 8.49
Source: Lipper, a Reuters Company
52
1) Historical performance indications and financial market scenarios are no guarantee for current or future performance. Performance indications do not consider commissions levied at subscription and/orredemption.
The disclaimer mentioned at the end of this document also applies to this page.
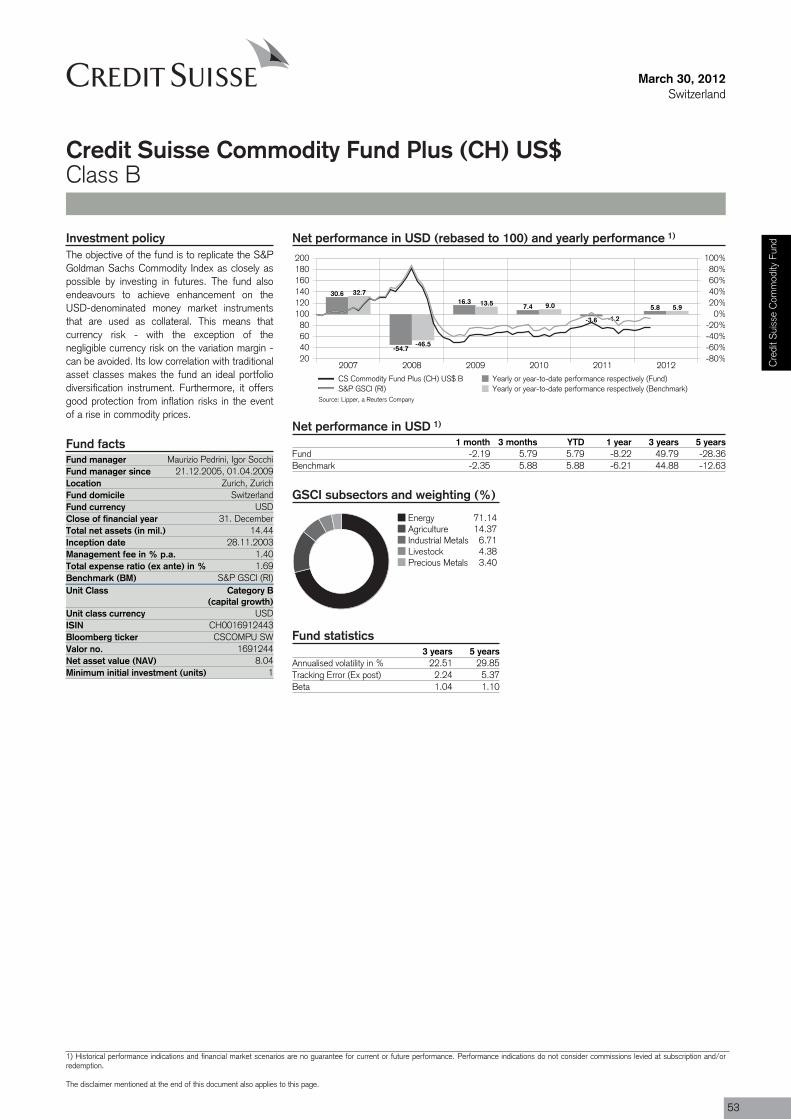
Fund manager Maurizio Pedrini, Igor SocchiFund manager since 21.12.2005, 01.04.2009Location Zurich, ZurichFund domicile SwitzerlandFund currency USDClose of financial year 31. DecemberTotal net assets (in mil.) 14.44Inception date 28.11.2003Management fee in % p.a. 1.40Total expense ratio (ex ante) in % 1.69Benchmark (BM) S&P GSCI (RI)Unit Class Category B
(capital growth)
ISIN CH0016912443
Valor no. 1691244
Minimum initial investment (units) 1
March 30, 2012Switzerland
Credit Suisse Commodity Fund Plus (CH) US$Class B
Net performance in USD (rebased to 100) and yearly performance 1)
2007 2008 2009 2010 2011 201220406080
100120140160180200
-80%-60%-40%-20%
0%20%40%60%80%
100%
30.6
-54.7
16.37.4
-3.6
5.8
32.7
-46.5
13.5 9.0
-1.2
5.9
CS Commodity Fund Plus (CH) US$ B Yearly or year-to-date performance respectively (Fund)S&P GSCI (RI) Yearly or year-to-date performance respectively (Benchmark)
Net performance in USD 1)
1 month 3 months YTD 1 year 3 years 5 yearsFund -2.19 5.79 5.79 -8.22 49.79 -28.36Benchmark -2.35 5.88 5.88 -6.21 44.88 -12.63
GSCI subsectors and weighting (%)
Energy 71.14Agriculture 14.37Industrial Metals 6.71Livestock 4.38Precious Metals 3.40
Fund statistics3 years 5 years
Annualised volatility in % 22.51 29.85Tracking Error (Ex post) 2.24 5.37Beta 1.04 1.10
Investment policyThe objective of the fund is to replicate the S&PGoldman Sachs Commodity Index as closely aspossible by investing in futures. The fund alsoendeavours to achieve enhancement on theUSD-denominated money market instrumentsthat are used as collateral. This means thatcurrency risk - with the exception of thenegligible currency risk on the variation margin -can be avoided. Its low correlation with traditionalasset classes makes the fund an ideal portfoliodiversification instrument. Furthermore, it offersgood protection from inflation risks in the eventof a rise in commodity prices.
Fund facts
Unit class currency USD
Bloomberg ticker CSCOMPU SW
Net asset value (NAV) 8.04
Source: Lipper, a Reuters Company
Cre
dit S
uiss
e C
omm
odity
Fun
d
1) Historical performance indications and financial market scenarios are no guarantee for current or future performance. Performance indications do not consider commissions levied at subscription and/orredemption.
The disclaimer mentioned at the end of this document also applies to this page.
53
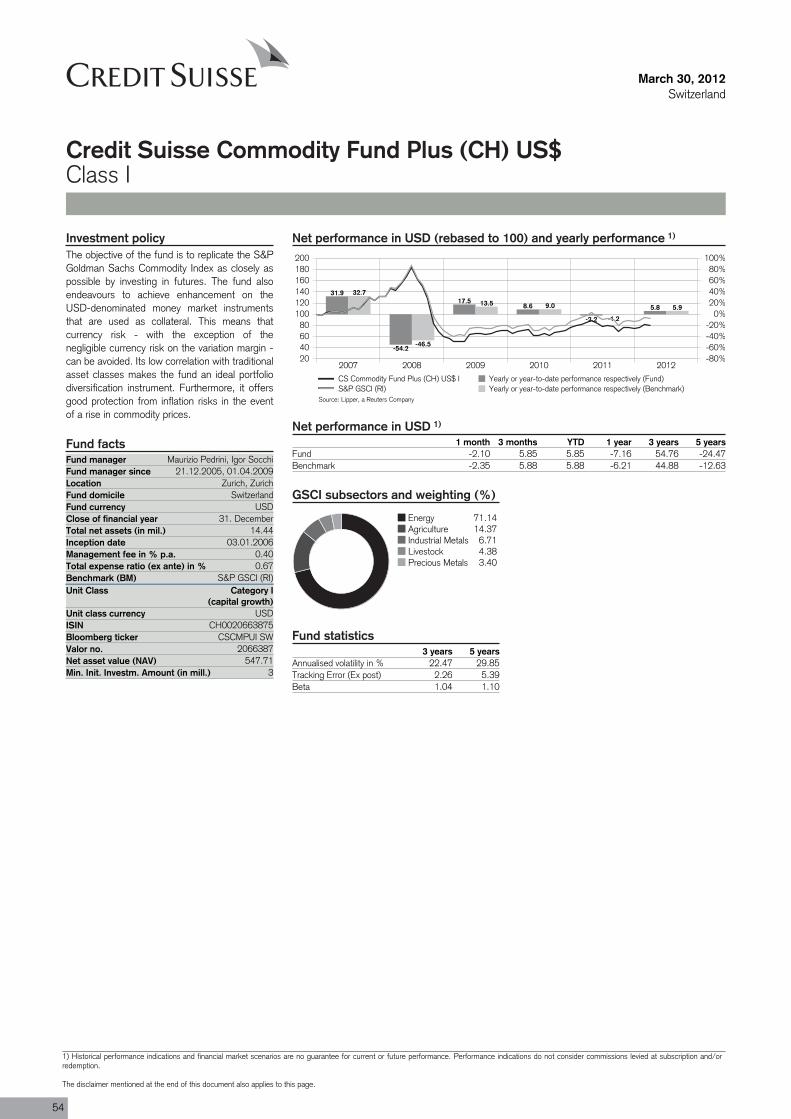
Fund manager Maurizio Pedrini, Igor SocchiFund manager since 21.12.2005, 01.04.2009Location Zurich, ZurichFund domicile SwitzerlandFund currency USDClose of financial year 31. DecemberTotal net assets (in mil.) 14.44Inception date 03.01.2006Management fee in % p.a. 0.40Total expense ratio (ex ante) in % 0.67Benchmark (BM) S&P GSCI (RI)Unit Class Category I
(capital growth)
ISIN CH0020663875
Valor no. 2066387
Min. Init. Investm. Amount (in mill.) 3
March 30, 2012Switzerland
Credit Suisse Commodity Fund Plus (CH) US$Class I
Net performance in USD (rebased to 100) and yearly performance 1)
2007 2008 2009 2010 2011 201220406080
100120140160180200
-80%-60%-40%-20%
0%20%40%60%80%
100%
31.9
-54.2
17.58.6
-2.2
5.8
32.7
-46.5
13.5 9.0
-1.2
5.9
CS Commodity Fund Plus (CH) US$ I Yearly or year-to-date performance respectively (Fund)S&P GSCI (RI) Yearly or year-to-date performance respectively (Benchmark)
Net performance in USD 1)
1 month 3 months YTD 1 year 3 years 5 yearsFund -2.10 5.85 5.85 -7.16 54.76 -24.47Benchmark -2.35 5.88 5.88 -6.21 44.88 -12.63
GSCI subsectors and weighting (%)
Energy 71.14Agriculture 14.37Industrial Metals 6.71Livestock 4.38Precious Metals 3.40
Fund statistics3 years 5 years
Annualised volatility in % 22.47 29.85Tracking Error (Ex post) 2.26 5.39Beta 1.04 1.10
Investment policyThe objective of the fund is to replicate the S&PGoldman Sachs Commodity Index as closely aspossible by investing in futures. The fund alsoendeavours to achieve enhancement on theUSD-denominated money market instrumentsthat are used as collateral. This means thatcurrency risk - with the exception of thenegligible currency risk on the variation margin -can be avoided. Its low correlation with traditionalasset classes makes the fund an ideal portfoliodiversification instrument. Furthermore, it offersgood protection from inflation risks in the eventof a rise in commodity prices.
Fund facts
Unit class currency USD
Bloomberg ticker CSCMPUI SW
Net asset value (NAV) 547.71
Source: Lipper, a Reuters Company
54
1) Historical performance indications and financial market scenarios are no guarantee for current or future performance. Performance indications do not consider commissions levied at subscription and/orredemption.
The disclaimer mentioned at the end of this document also applies to this page.
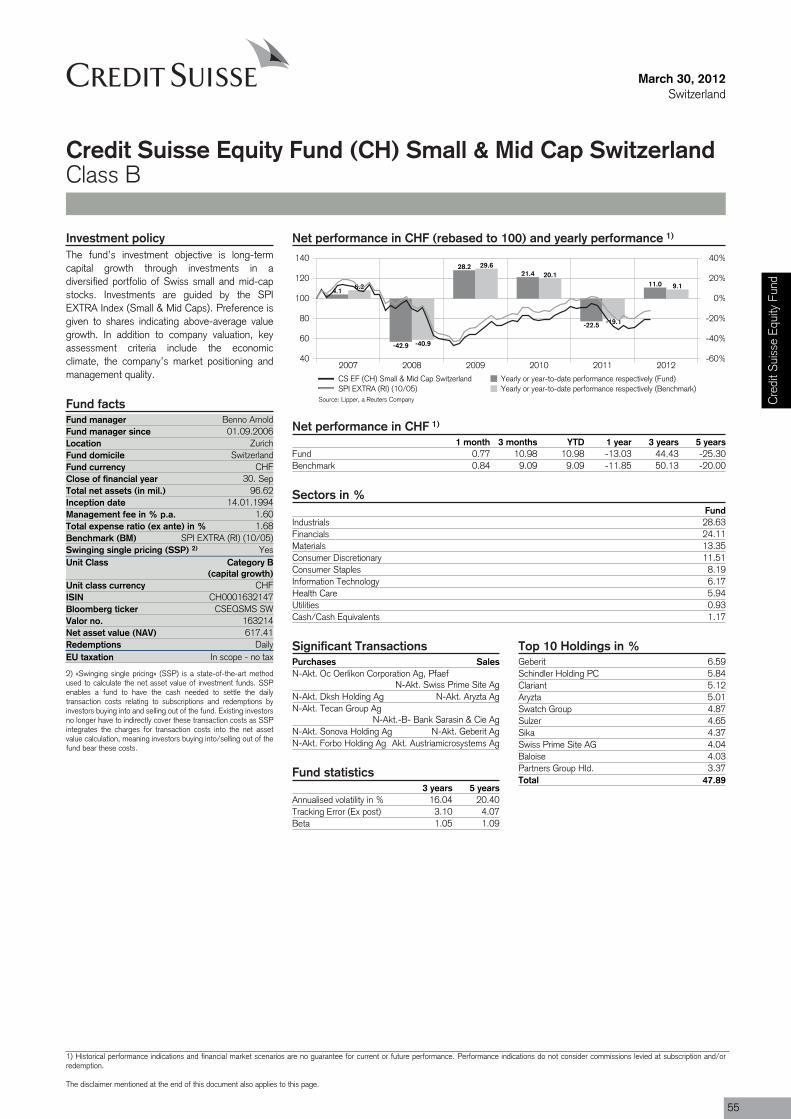
Purchases SalesN-Akt. Oc Oerlikon Corporation Ag, Pfaef
N-Akt. Swiss Prime Site AgN-Akt. Dksh Holding Ag N-Akt. Aryzta AgN-Akt. Tecan Group Ag
N-Akt.-B- Bank Sarasin & Cie AgN-Akt. Sonova Holding Ag N-Akt. Geberit AgN-Akt. Forbo Holding Ag Akt. Austriamicrosystems Ag
Fund manager Benno ArnoldFund manager since 01.09.2006Location ZurichFund domicile SwitzerlandFund currency CHFClose of financial year 30. SepTotal net assets (in mil.) 96.62Inception date 14.01.1994Management fee in % p.a. 1.60Total expense ratio (ex ante) in % 1.68Benchmark (BM) SPI EXTRA (RI) (10/05)Swinging single pricing (SSP) 2) YesUnit Class Category B
(capital growth)
ISIN CH0001632147
Valor no. 163214
Redemptions DailyEU taxation In scope - no tax
March 30, 2012Switzerland
Credit Suisse Equity Fund (CH) Small & Mid Cap SwitzerlandClass B
Net performance in CHF (rebased to 100) and yearly performance 1)
2007 2008 2009 2010 2011 201240
60
80
100
120
140
-60%
-40%
-20%
0%
20%
40%
4.1
-42.9
28.221.4
-22.5
11.08.3
-40.9
29.620.1
-19.1
9.1
CS EF (CH) Small & Mid Cap Switzerland Yearly or year-to-date performance respectively (Fund)SPI EXTRA (RI) (10/05) Yearly or year-to-date performance respectively (Benchmark)
Net performance in CHF 1)
1 month 3 months YTD 1 year 3 years 5 yearsFund 0.77 10.98 10.98 -13.03 44.43 -25.30Benchmark 0.84 9.09 9.09 -11.85 50.13 -20.00
Sectors in %Fund
Industrials 28.63Financials 24.11Materials 13.35Consumer Discretionary 11.51Consumer Staples 8.19Information Technology 6.17Health Care 5.94Utilities 0.93Cash/Cash Equivalents 1.17
Top 10 Holdings in %Geberit 6.59Schindler Holding PC 5.84Clariant 5.12Aryzta 5.01Swatch Group 4.87Sulzer 4.65Sika 4.37Swiss Prime Site AG 4.04Baloise 4.03Partners Group Hld. 3.37Total 47.89
Significant Transactions
Fund statistics3 years 5 years
Annualised volatility in % 16.04 20.40Tracking Error (Ex post) 3.10 4.07Beta 1.05 1.09
Investment policyThe fund’s investment objective is long-termcapital growth through investments in adiversified portfolio of Swiss small and mid-capstocks. Investments are guided by the SPIEXTRA Index (Small & Mid Caps). Preference isgiven to shares indicating above-average valuegrowth. In addition to company valuation, keyassessment criteria include the economicclimate, the company’s market positioning andmanagement quality.
Fund facts
Unit class currency CHF
Bloomberg ticker CSEQSMS SW
Net asset value (NAV) 617.41
2) «Swinging single pricing» (SSP) is a state-of-the-art methodused to calculate the net asset value of investment funds. SSPenables a fund to have the cash needed to settle the dailytransaction costs relating to subscriptions and redemptions byinvestors buying into and selling out of the fund. Existing investorsno longer have to indirectly cover these transaction costs as SSPintegrates the charges for transaction costs into the net assetvalue calculation, meaning investors buying into/selling out of thefund bear these costs.
Source: Lipper, a Reuters Company Cre
dit S
uiss
e Eq
uity
Fun
d
1) Historical performance indications and financial market scenarios are no guarantee for current or future performance. Performance indications do not consider commissions levied at subscription and/orredemption.
The disclaimer mentioned at the end of this document also applies to this page.
55
March 30, 2012Switzerland
Credit Suisse Equity Fund (CH) Small & Mid Cap SwitzerlandClass B
Review previous quarter 3)
The first quarter was characterized by low tradingvolumes and a low volatility of the Swiss market.The benchmark (SPI Extra Index) posted astrong performance of +9% and performedclearly better than the SPI Index (+7%). Theportfolio outperformed the index by 2.34%. Themacroeconomic news flow improved, especiallyconcerning the US, but Europe as a whole showsvery few signs of an economic recovery so far.Only the European debt problem seems to besolved for the moment. During the first quartermost of the Swiss companies reported solid
results for 2011, but the outlook given for 2012was relatively cautious in some cases.
Positive performance contributions came fromthe overweight in the cyclical cluster and theunderweight in the growth cluster, as well as thebanks. The defensive cluster and insurances, inwhich we are underweight, showed a negativeperformance contribution. The overweightpositions in Clariant, Austriamicrosystems andSulzer, as well as the underweights in Lonza,Valiant and Sonova, had a positive impact on
the portfolio’s performance. However, theunderweight in Kuoni, Swiss Life and GeorgFischer, as well as the overweight in Aryzta andBarry Callebaut, affected the performancenegatively.
We reduced the exposure to banks, defensiveand medium-cyclical companies (i.e. BankSarasin, Aryzta, Geberit). On the other hand weincreased the overweight in cyclical and growthcompanies (i.e. Forbo, Sonova, Tecan).
Outlook for the market 3)
Our macro scenario of a slowly recovering worldeconomy was corroborated again in March. Inthe US we detect a broadening of the upturn.Alongside the steadily improving employmentmarket, the spotlight has now also turned to thebottom forming in the housing market, whichis very important for the overall economy. This,coupled with a noticeable increase in aggregatewages, has significantly improved the outlook forpersonal consumption. This means that theexport sector is now being joined by a second,strongly supportive pillar. But given the expectedfiscal-policy headwind, it is still questionablewhether the US economy can continue growing
at the current brisk annualized pace of about3-4%. Nevertheless, a firm pedestal ofeconomic activity is in place, and it can continueemitting forceful impulses for the globaleconomy. This also goes for the sustainedimprovement in the economic climate inemerging-market countries.
We are nonetheless proceeding on theassumption that the headwinds described willhave only very short-lived consequences for themarkets. From a valuation standpoint, most ofthe undervaluations have been corrected.However, stocks remain inexpensively valued in
historical comparison, especially relative tobonds. Sentiment has improved, but is still along way from euphoria. Institutional investorswith non-benchmarked portfolios are still holdingtiny equity allocations. We expect the economicupturn to continue, albeit at a moderate pace.The Swiss Market (SPI) trades at a P/E 2012of 12.4x which compares to a P/E 2012 ofthe SPI Extra index of 14.3x. EPS growth for2012 is expected to be 13.3% for the SPI and51.5% for the SPI Extra. Although we expectsmall negative short term earnings revisions theSwiss market is valued attractively.
Portfolio ManagementBenno Arnold, Director, is Senior Portfolio Manager for Swiss small- and mid-cap companies. Benno holds a Master in Economics fromUniversity of St. Gallen. He received the certification as an EFFAS Financial Analyst and is a CFA charter holder. Before joining CreditSuisse, he worked for seven years for UBS and its daughter-company as buy-side Analyst and Portfolio Manager where he wasresponsible for two strategy funds. For four years Benno worked as sell-side Analyst at Bank Vontobel focusing on Swiss small- andmid-cap companies.
3) If not expressly indicated otherwise, all quantitative data contained in this comment is based on Lipper, Bloomberg or Datastream.
56
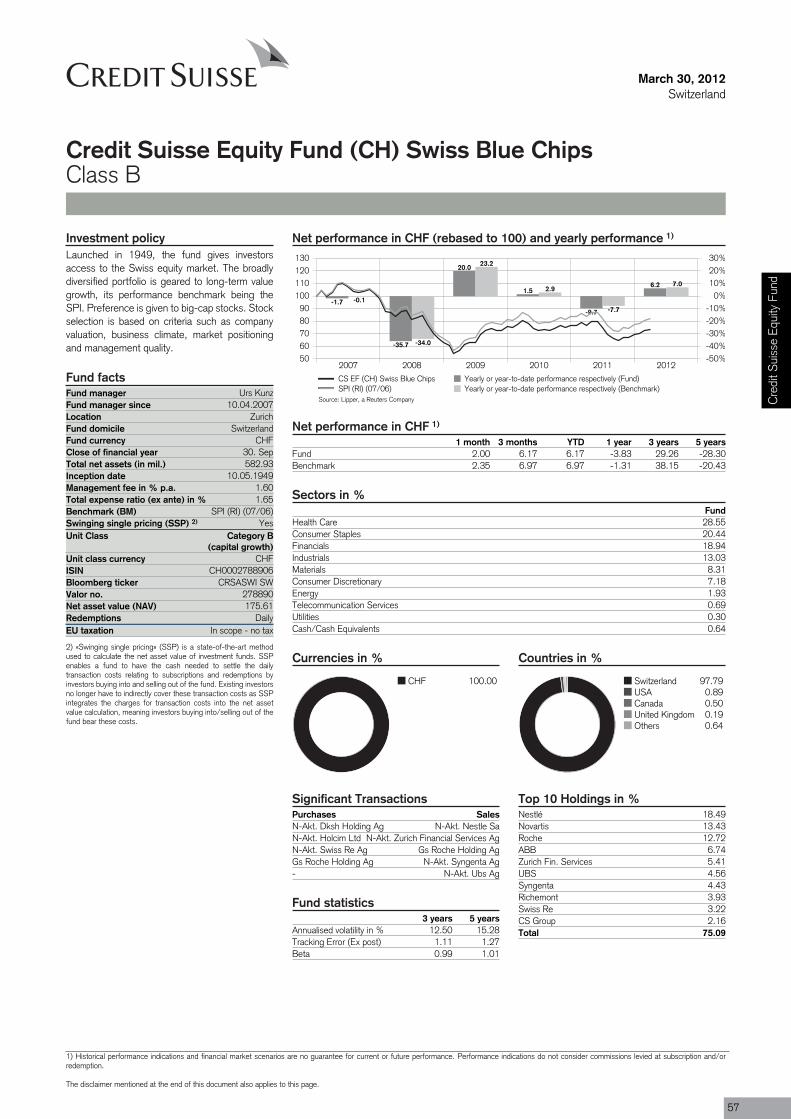
Purchases SalesN-Akt. Dksh Holding Ag N-Akt. Nestle SaN-Akt. Holcim Ltd N-Akt. Zurich Financial Services AgN-Akt. Swiss Re Ag Gs Roche Holding AgGs Roche Holding Ag N-Akt. Syngenta Ag- N-Akt. Ubs Ag
Fund manager Urs KunzFund manager since 10.04.2007Location ZurichFund domicile SwitzerlandFund currency CHFClose of financial year 30. SepTotal net assets (in mil.) 582.93Inception date 10.05.1949Management fee in % p.a. 1.60Total expense ratio (ex ante) in % 1.65Benchmark (BM) SPI (RI) (07/06)Swinging single pricing (SSP) 2) YesUnit Class Category B
(capital growth)
ISIN CH0002788906
Valor no. 278890
Redemptions DailyEU taxation In scope - no tax
March 30, 2012Switzerland
Credit Suisse Equity Fund (CH) Swiss Blue ChipsClass B
Net performance in CHF (rebased to 100) and yearly performance 1)
2007 2008 2009 2010 2011 20125060708090
100110120130
-50%-40%-30%-20%-10%
0%10%20%30%
-1.7
-35.7
20.0
1.5
-9.7
6.2
-0.1
-34.0
23.2
2.9
-7.7
7.0
CS EF (CH) Swiss Blue Chips Yearly or year-to-date performance respectively (Fund)SPI (RI) (07/06) Yearly or year-to-date performance respectively (Benchmark)
Net performance in CHF 1)
1 month 3 months YTD 1 year 3 years 5 yearsFund 2.00 6.17 6.17 -3.83 29.26 -28.30Benchmark 2.35 6.97 6.97 -1.31 38.15 -20.43
Sectors in %Fund
Health Care 28.55Consumer Staples 20.44Financials 18.94Industrials 13.03Materials 8.31Consumer Discretionary 7.18Energy 1.93Telecommunication Services 0.69Utilities 0.30Cash/Cash Equivalents 0.64
Currencies in %
CHF 100.00
Countries in %
Switzerland 97.79USA 0.89Canada 0.50United Kingdom 0.19Others 0.64
Significant Transactions
Fund statistics3 years 5 years
Annualised volatility in % 12.50 15.28Tracking Error (Ex post) 1.11 1.27Beta 0.99 1.01
Top 10 Holdings in %Nestlé 18.49Novartis 13.43Roche 12.72ABB 6.74Zurich Fin. Services 5.41UBS 4.56Syngenta 4.43Richemont 3.93Swiss Re 3.22CS Group 2.16Total 75.09
Investment policyLaunched in 1949, the fund gives investorsaccess to the Swiss equity market. The broadlydiversified portfolio is geared to long-term valuegrowth, its performance benchmark being theSPI. Preference is given to big-cap stocks. Stockselection is based on criteria such as companyvaluation, business climate, market positioningand management quality.
Fund facts
Unit class currency CHF
Bloomberg ticker CRSASWI SW
Net asset value (NAV) 175.61
2) «Swinging single pricing» (SSP) is a state-of-the-art methodused to calculate the net asset value of investment funds. SSPenables a fund to have the cash needed to settle the dailytransaction costs relating to subscriptions and redemptions byinvestors buying into and selling out of the fund. Existing investorsno longer have to indirectly cover these transaction costs as SSPintegrates the charges for transaction costs into the net assetvalue calculation, meaning investors buying into/selling out of thefund bear these costs.
Source: Lipper, a Reuters Company Cre
dit S
uiss
e Eq
uity
Fun
d
1) Historical performance indications and financial market scenarios are no guarantee for current or future performance. Performance indications do not consider commissions levied at subscription and/orredemption.
The disclaimer mentioned at the end of this document also applies to this page.
57
March 30, 2012Switzerland
Credit Suisse Equity Fund (CH) Swiss Blue ChipsClass B
Review previous quarter 3)
The global macroeconomic picture improvedsignificantly in the first quarter. Business climatesurveys confirm an upward trend reversal andare showing encouraging signs of a worldwidecyclical recovery. This especially goes for the US.At the same time, significant liquidity measuresby Europe’s central banks dramatically reducedthe risk of a renewed escalation of the Europeandebt crisis. The leading central banks aregenerally adopting a very supportive role, whichshould continue to have a positive impact on theglobal economy.
The economic environment described above
proved beneficial for equities, as reflected in theimpressive price gains seen on most stockmarkets over the last three months. But riskareas, primarily Greece, proved repeatedly to bea source of volatility. However, the consensusseems to have moved toward an understandingthat leading politicians and central banks arecapable of intervening, if necessary, to limit spillover effects to other countries or banks.
Many stock markets recovered substantially fromtheir lows from last summer, with the Swissmarket also performing well. Small Caps wereparticularly in favor, with a return of +11.5%,
which was better than Mid Caps (+8.6%). Thewide Swiss Performance Index advanced by+7.0%. On our cluster basis, insurances(+16.2%) were leading, followed bymedium-cyclical (+13.7%) and cyclicalcompanies (+13.6%) and banks (+11.2%).Underperformers were defensive (+2.1%) andgrowth stocks (+6.2%). Transaction wise wereduced our exposure in growth stocks by around1%, while, on the other hand, we added tomedium-cyclicals, cyclicals and insurances, andalso re-invested dividend payments.
Outlook for the market 3)
Our macro scenario of a slowly recovering worldeconomy was corroborated again in March. Inthe US we detect a broadening of the upturn.Alongside the steadily improving employmentmarket, the spotlight has now also turned to thebottom forming in the housing market, whichis very important for the overall economy. This,coupled with a noticeable increase in aggregatewages, has significantly improved the outlook forpersonal consumption. This means that theexport sector is now being joined by a second,strongly supportive pillar. But given the expectedfiscal-policy headwind, it is still questionable
whether the US economy can continue growingat the current brisk annualized pace of about3-4%. Nevertheless, a firm pedestal ofeconomic activity is in place, and it can continueemitting forceful impulses for the globaleconomy. This also goes for the sustainedimprovement in the economic climate inemerging-market countries.
We are nonetheless proceeding on theassumption that the headwinds described willhave only very short-lived consequences for themarkets. From a valuation standpoint, most of
the undervaluations have been corrected.However, stocks remain inexpensively valued inhistorical comparison, especially relative tobonds. Sentiment has improved, but is still along way from euphoria. Institutional investorswith non-benchmarked portfolios are still holdingtiny equity allocations. We expect the economicupturn to continue, albeit at a moderate pace.The Swiss Equity Market stands at a P/E of 12.4and a risk premium of 7.2%, which still reflectsan undervaluation based on historic contexts.
Portfolio ManagementMr Kunz graduated from the University of St. Gallen with a Masters in Economics. He started his career as a Financial Analyst for NorthAmerican equities and bonds, before joining the research department for Swiss equities at Credit Suisse First Boston. For eight years hewas responsible for various sectors (with particular focus on the transport industry) in Switzerland and Europe, and for two years headedthe capital goods industry research team. Thereafter he transferred to Swiss Re New Markets as a Financial Analyst for alternative risktransfer. In December 1999 he joined CSAM as a Buyside Analyst for Swiss equities. Mr Kunz is a Certified EFFAS Financial Analyst.
3) If not expressly indicated otherwise, all quantitative data contained in this comment is based on Lipper, Bloomberg or Datastream.
58
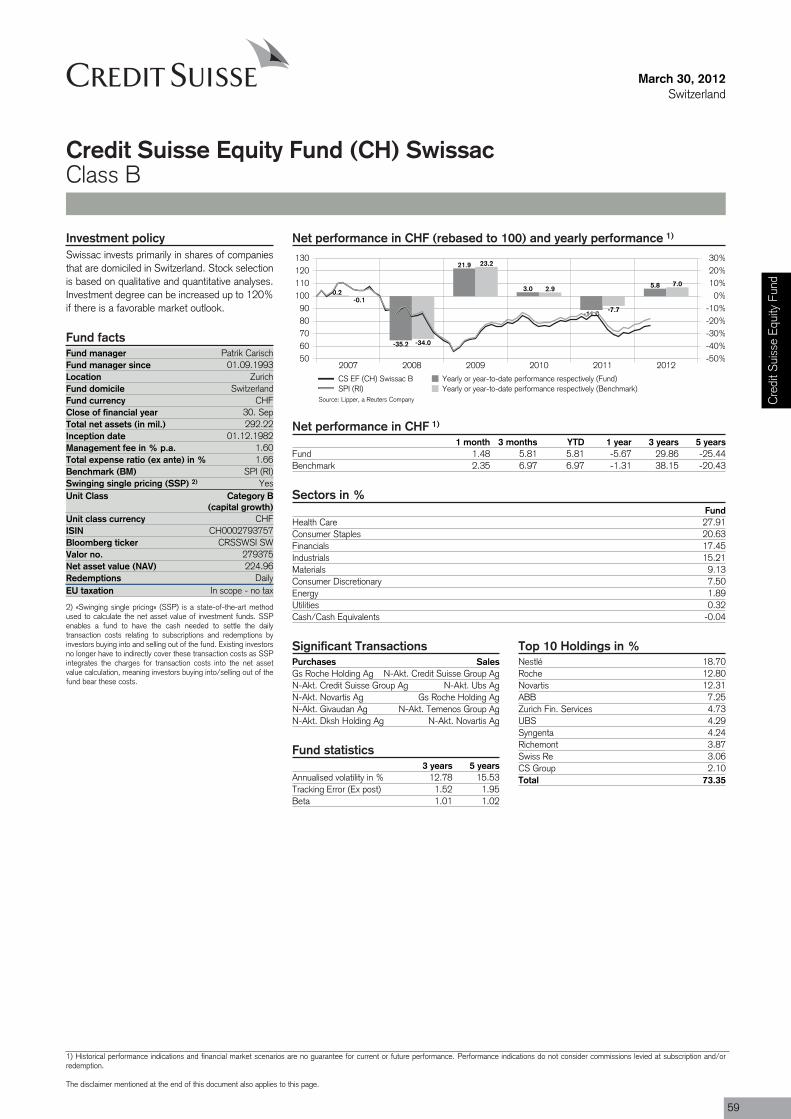
Purchases SalesGs Roche Holding Ag N-Akt. Credit Suisse Group AgN-Akt. Credit Suisse Group Ag N-Akt. Ubs AgN-Akt. Novartis Ag Gs Roche Holding AgN-Akt. Givaudan Ag N-Akt. Temenos Group AgN-Akt. Dksh Holding Ag N-Akt. Novartis Ag
Fund manager Patrik CarischFund manager since 01.09.1993Location ZurichFund domicile SwitzerlandFund currency CHFClose of financial year 30. SepTotal net assets (in mil.) 292.22Inception date 01.12.1982Management fee in % p.a. 1.60Total expense ratio (ex ante) in % 1.66Benchmark (BM) SPI (RI)Swinging single pricing (SSP) 2) YesUnit Class Category B
(capital growth)
ISIN CH0002793757
Valor no. 279375
Redemptions DailyEU taxation In scope - no tax
March 30, 2012Switzerland
Credit Suisse Equity Fund (CH) SwissacClass B
Net performance in CHF (rebased to 100) and yearly performance 1)
2007 2008 2009 2010 2011 20125060708090
100110120130
-50%-40%-30%-20%-10%
0%10%20%30%
0.2
-35.2
21.9
3.0
-11.0
5.8
-0.1
-34.0
23.2
2.9
-7.7
7.0
CS EF (CH) Swissac B Yearly or year-to-date performance respectively (Fund)SPI (RI) Yearly or year-to-date performance respectively (Benchmark)
Net performance in CHF 1)
1 month 3 months YTD 1 year 3 years 5 yearsFund 1.48 5.81 5.81 -5.67 29.86 -25.44Benchmark 2.35 6.97 6.97 -1.31 38.15 -20.43
Sectors in %Fund
Health Care 27.91Consumer Staples 20.63Financials 17.45Industrials 15.21Materials 9.13Consumer Discretionary 7.50Energy 1.89Utilities 0.32Cash/Cash Equivalents -0.04
Top 10 Holdings in %Nestlé 18.70Roche 12.80Novartis 12.31ABB 7.25Zurich Fin. Services 4.73UBS 4.29Syngenta 4.24Richemont 3.87Swiss Re 3.06CS Group 2.10Total 73.35
Significant Transactions
Fund statistics3 years 5 years
Annualised volatility in % 12.78 15.53Tracking Error (Ex post) 1.52 1.95Beta 1.01 1.02
Investment policySwissac invests primarily in shares of companiesthat are domiciled in Switzerland. Stock selectionis based on qualitative and quantitative analyses.Investment degree can be increased up to 120%if there is a favorable market outlook.
Fund facts
Unit class currency CHF
Bloomberg ticker CRSSWSI SW
Net asset value (NAV) 224.96
2) «Swinging single pricing» (SSP) is a state-of-the-art methodused to calculate the net asset value of investment funds. SSPenables a fund to have the cash needed to settle the dailytransaction costs relating to subscriptions and redemptions byinvestors buying into and selling out of the fund. Existing investorsno longer have to indirectly cover these transaction costs as SSPintegrates the charges for transaction costs into the net assetvalue calculation, meaning investors buying into/selling out of thefund bear these costs.
Source: Lipper, a Reuters Company Cre
dit S
uiss
e Eq
uity
Fun
d
1) Historical performance indications and financial market scenarios are no guarantee for current or future performance. Performance indications do not consider commissions levied at subscription and/orredemption.
The disclaimer mentioned at the end of this document also applies to this page.
59
March 30, 2012Switzerland
Credit Suisse Equity Fund (CH) SwissacClass B
Review previous quarter 3)
The global macroeconomic picture improvedsignificantly in the first quarter. Business climatesurveys confirm an upward trend reversal andare showing encouraging signs of a worldwidecyclical recovery. This especially goes for the US.At the same time, significant liquidity measuresby Europe’s central banks dramatically reducedthe risk of a renewed escalation of the Europeandebt crisis. The leading central banks aregenerally adopting a very supportive role, whichshould continue to have a positive impact on theglobal economy.
The economic environment described above
proved beneficial for equities, as reflected in theimpressive price gains seen on most stockmarkets over the last three months. But riskareas, primarily Greece, proved repeatedly to bea source of volatility. However, the consensusseems to have moved toward an understandingthat leading politicians and central banks arecapable of intervening, if necessary, to limit spillover effects to other countries or banks.
Many stock markets recovered substantially fromtheir lows from last summer, with the Swissmarket also performing well. Small Caps wereparticularly in favor, with a return of +11.5%,
which was better than Mid Caps (+8.6%). Thewide Swiss Performance Index advanced by+7.0%. On our cluster basis, insurances(+16.2%) were leading, followed bymedium-cyclical (+13.7%) and cyclicalcompanies (+13.6%) and banks (+11.2%).Underperformers were defensive (+2.1%) andgrowth stocks (+6.2%). Transaction wise wereduced our exposure in growth stocks by around1%, while, on the other hand, we added tomedium-cyclicals, cyclicals and insurances, andalso re-invested dividend payments.
Outlook for the market 3)
Our macro scenario of a slowly recovering worldeconomy was corroborated again in March. Inthe US we detect a broadening of the upturn.Alongside the steadily improving employmentmarket, the spotlight has now also turned to thebottom forming in the housing market, whichis very important for the overall economy. This,coupled with a noticeable increase in aggregatewages, has significantly improved the outlook forpersonal consumption. This means that theexport sector is now being joined by a second,strongly supportive pillar. But given the expectedfiscal-policy headwind, it is still questionable
whether the US economy can continue growingat the current brisk annualized pace of about3-4%. Nevertheless, a firm pedestal ofeconomic activity is in place, and it can continueemitting forceful impulses for the globaleconomy. This also goes for the sustainedimprovement in the economic climate inemerging-market countries.
We are nonetheless proceeding on theassumption that the headwinds described willhave only very short-lived consequences for themarkets. From a valuation standpoint, most of
the undervaluations have been corrected.However, stocks remain inexpensively valued inhistorical comparison, especially relative tobonds. Sentiment has improved, but is still along way from euphoria. Institutional investorswith non-benchmarked portfolios are still holdingtiny equity allocations. We expect the economicupturn to continue, albeit at a moderate pace.The Swiss Equity Market stands at a P/E of 12.4and a risk premium of 7.2%, which still reflectsan undervaluation based on historic contexts.
Portfolio ManagementPatrik Carisch, Managing Director, is Head of Swiss Equities at Credit Suisse Asset Management in Zurich. Mr. Carisch earned a BBAfrom the Business School of Zurich and is an EFFAS (European Federation of Financial Analysts Societies) Financial Analyst. He joinedthe Credit Suisse Group in 1985 as an equity research analyst covering several Swiss sectors, as well as Germany and Scandinavia. InOctober 1993, he transferred to Asset Management. Since 1993, he has managed the CS Equity Fund (CH) Swissac. Mr. Carisch alsomanages the CSA Equity Switzerland.
3) If not expressly indicated otherwise, all quantitative data contained in this comment is based on Lipper, Bloomberg or Datastream.
60
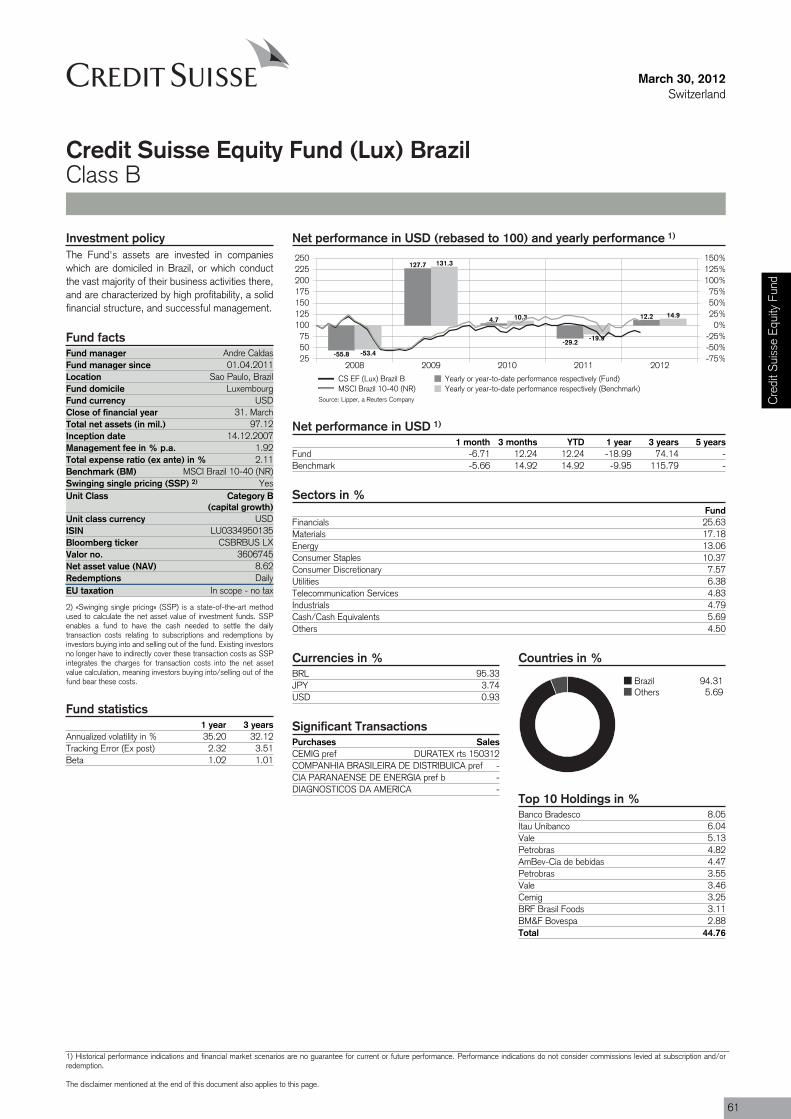
Purchases SalesCEMIG pref DURATEX rts 150312COMPANHIA BRASILEIRA DE DISTRIBUICA pref -CIA PARANAENSE DE ENERGIA pref b -DIAGNOSTICOS DA AMERICA -
Fund manager Andre CaldasFund manager since 01.04.2011Location Sao Paulo, BrazilFund domicile LuxembourgFund currency USDClose of financial year 31. MarchTotal net assets (in mil.) 97.12Inception date 14.12.2007Management fee in % p.a. 1.92Total expense ratio (ex ante) in % 2.11Benchmark (BM) MSCI Brazil 10-40 (NR)Swinging single pricing (SSP) 2) YesUnit Class Category B
(capital growth)
ISIN LU0334950135
Valor no. 3606745
Redemptions DailyEU taxation In scope - no tax
March 30, 2012Switzerland
Credit Suisse Equity Fund (Lux) BrazilClass B
Net performance in USD (rebased to 100) and yearly performance 1)
2008 2009 2010 2011 2012255075
100125150175200225250
-75%-50%-25%
0%25%50%75%
100%125%150%
-55.8
127.7
4.7
-29.2
12.2
-53.4
131.3
10.3
-19.9
14.9
CS EF (Lux) Brazil B Yearly or year-to-date performance respectively (Fund)MSCI Brazil 10-40 (NR) Yearly or year-to-date performance respectively (Benchmark)
Net performance in USD 1)
1 month 3 months YTD 1 year 3 years 5 yearsFund -6.71 12.24 12.24 -18.99 74.14 -Benchmark -5.66 14.92 14.92 -9.95 115.79 -
Sectors in %Fund
Financials 25.63Materials 17.18Energy 13.06Consumer Staples 10.37Consumer Discretionary 7.57Utilities 6.38Telecommunication Services 4.83Industrials 4.79Cash/Cash Equivalents 5.69Others 4.50
Currencies in %BRL 95.33JPY 3.74USD 0.93
Countries in %
Brazil 94.31Others 5.69
Top 10 Holdings in %Banco Bradesco 8.05Itau Unibanco 6.04Vale 5.13Petrobras 4.82AmBev-Cia de bebidas 4.47Petrobras 3.55Vale 3.46Cemig 3.25BRF Brasil Foods 3.11BM&F Bovespa 2.88Total 44.76
Significant Transactions
Investment policyThe Fund's assets are invested in companieswhich are domiciled in Brazil, or which conductthe vast majority of their business activities there,and are characterized by high profitability, a solidfinancial structure, and successful management.
Fund facts
Unit class currency USD
Bloomberg ticker CSBRBUS LX
Net asset value (NAV) 8.62
2) «Swinging single pricing» (SSP) is a state-of-the-art methodused to calculate the net asset value of investment funds. SSPenables a fund to have the cash needed to settle the dailytransaction costs relating to subscriptions and redemptions byinvestors buying into and selling out of the fund. Existing investorsno longer have to indirectly cover these transaction costs as SSPintegrates the charges for transaction costs into the net assetvalue calculation, meaning investors buying into/selling out of thefund bear these costs.
Fund statistics1 year 3 years
Annualized volatility in % 35.20 32.12Tracking Error (Ex post) 2.32 3.51Beta 1.02 1.01
Source: Lipper, a Reuters Company Cre
dit S
uiss
e Eq
uity
Fun
d
1) Historical performance indications and financial market scenarios are no guarantee for current or future performance. Performance indications do not consider commissions levied at subscription and/orredemption.
The disclaimer mentioned at the end of this document also applies to this page.
61
March 30, 2012Switzerland
Credit Suisse Equity Fund (Lux) BrazilClass B
Review previous quarter 3)
In December, we projected 2012 as anotheryear of cherry-picking, in which companies withsolid fundamentals should stand out, justifyingvaluation gaps and creating good investment
opportunities. The performance of the Ibovespain January revealed precisely the opposite interms of beta and liquidity. Net assets with highbetas stood out the most, and resilient
companies with solid fundamentals were thebiggest detractors. Justified or not by events inEurope, the United States and Japan receivedlarge capital inflows (LTRO, QE3, etc.).
Outlook for the market 3)
After a series of measures indicating a strongpost-growth agenda and dovish discourse byBrazil’s central bank, we remain optimistic onBrazil and expect the economy to pick up againin 2012. The main risk related to such measures
would be a possible rise in inflation, but webelieve the debate will be put on the backburneruntil the second quarter of 2012. Overall, weremain optimistic about sectors related to thedomestic economy and try to choose assets with
an asymmetrical risk/reward relationship, even ifin some cases they trade at no discount or at apremium.
Portfolio ManagementAndre is one of the portfolio managers responsible for equity funds. Before joining Credit Suisse in 2008, he already had experience as aRisk Manager/Product Controller, as Fixed Income and Pension Fund Portfolio Manager in. He also worked as a Hedge Fund Manager atBassini Playfair Wright, in NY, USA. Andre holds a degree in Computer Science from UFGRS, and a MBA from MIT Sloan School ofManagement.
3) If not expressly indicated otherwise, all quantitative data contained in this comment is based on Lipper, Bloomberg or Datastream.
62
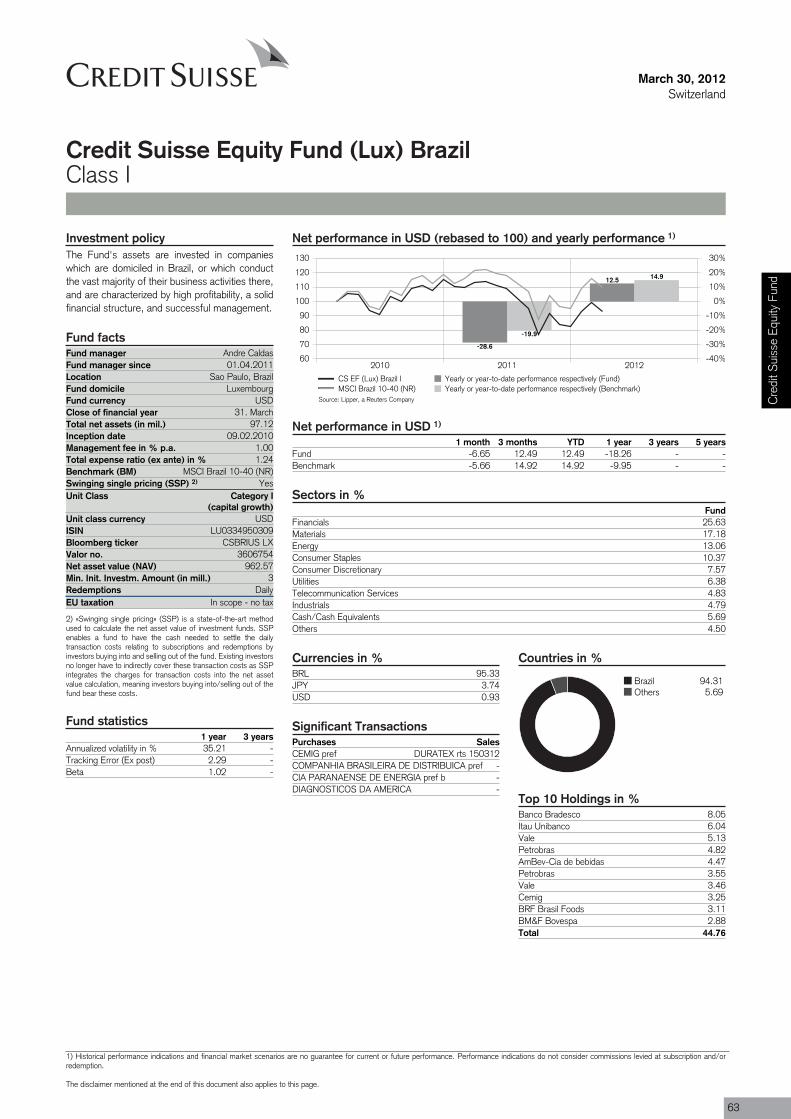
Purchases SalesCEMIG pref DURATEX rts 150312COMPANHIA BRASILEIRA DE DISTRIBUICA pref -CIA PARANAENSE DE ENERGIA pref b -DIAGNOSTICOS DA AMERICA -
Fund manager Andre CaldasFund manager since 01.04.2011Location Sao Paulo, BrazilFund domicile LuxembourgFund currency USDClose of financial year 31. MarchTotal net assets (in mil.) 97.12Inception date 09.02.2010Management fee in % p.a. 1.00Total expense ratio (ex ante) in % 1.24Benchmark (BM) MSCI Brazil 10-40 (NR)Swinging single pricing (SSP) 2) YesUnit Class Category I
(capital growth)
ISIN LU0334950309
Valor no. 3606754
Min. Init. Investm. Amount (in mill.) 3Redemptions DailyEU taxation In scope - no tax
March 30, 2012Switzerland
Credit Suisse Equity Fund (Lux) BrazilClass I
Net performance in USD (rebased to 100) and yearly performance 1)
2010 2011 201260
70
80
90
100
110
120
130
-40%
-30%
-20%
-10%
0%
10%
20%
30%
-28.6
12.5
-19.9
14.9
CS EF (Lux) Brazil I Yearly or year-to-date performance respectively (Fund)MSCI Brazil 10-40 (NR) Yearly or year-to-date performance respectively (Benchmark)
Net performance in USD 1)
1 month 3 months YTD 1 year 3 years 5 yearsFund -6.65 12.49 12.49 -18.26 - -Benchmark -5.66 14.92 14.92 -9.95 - -
Sectors in %Fund
Financials 25.63Materials 17.18Energy 13.06Consumer Staples 10.37Consumer Discretionary 7.57Utilities 6.38Telecommunication Services 4.83Industrials 4.79Cash/Cash Equivalents 5.69Others 4.50
Currencies in %BRL 95.33JPY 3.74USD 0.93
Countries in %
Brazil 94.31Others 5.69
Top 10 Holdings in %Banco Bradesco 8.05Itau Unibanco 6.04Vale 5.13Petrobras 4.82AmBev-Cia de bebidas 4.47Petrobras 3.55Vale 3.46Cemig 3.25BRF Brasil Foods 3.11BM&F Bovespa 2.88Total 44.76
Significant Transactions
Investment policyThe Fund's assets are invested in companieswhich are domiciled in Brazil, or which conductthe vast majority of their business activities there,and are characterized by high profitability, a solidfinancial structure, and successful management.
Fund facts
Unit class currency USD
Bloomberg ticker CSBRIUS LX
Net asset value (NAV) 962.57
2) «Swinging single pricing» (SSP) is a state-of-the-art methodused to calculate the net asset value of investment funds. SSPenables a fund to have the cash needed to settle the dailytransaction costs relating to subscriptions and redemptions byinvestors buying into and selling out of the fund. Existing investorsno longer have to indirectly cover these transaction costs as SSPintegrates the charges for transaction costs into the net assetvalue calculation, meaning investors buying into/selling out of thefund bear these costs.
Fund statistics1 year 3 years
Annualized volatility in % 35.21 -Tracking Error (Ex post) 2.29 -Beta 1.02 -
Source: Lipper, a Reuters Company Cre
dit S
uiss
e Eq
uity
Fun
d
1) Historical performance indications and financial market scenarios are no guarantee for current or future performance. Performance indications do not consider commissions levied at subscription and/orredemption.
The disclaimer mentioned at the end of this document also applies to this page.
63
March 30, 2012Switzerland
Credit Suisse Equity Fund (Lux) BrazilClass I
Review previous quarter 3)
In December, we projected 2012 as anotheryear of cherry-picking, in which companies withsolid fundamentals should stand out, justifyingvaluation gaps and creating good investment
opportunities. The performance of the Ibovespain January revealed precisely the opposite interms of beta and liquidity. Net assets with highbetas stood out the most, and resilient
companies with solid fundamentals were thebiggest detractors. Justified or not by events inEurope, the United States and Japan receivedlarge capital inflows (LTRO, QE3, etc.).
Outlook for the market 3)
After a series of measures indicating a strongpost-growth agenda and dovish discourse byBrazil’s central bank, we remain optimistic onBrazil and expect the economy to pick up againin 2012. The main risk related to such measures
would be a possible rise in inflation, but webelieve the debate will be put on the backburneruntil the second quarter of 2012. Overall, weremain optimistic about sectors related to thedomestic economy and try to choose assets with
an asymmetrical risk/reward relationship, even ifin some cases they trade at no discount or at apremium.
Portfolio ManagementAndre is one of the portfolio managers responsible for equity funds. Before joining Credit Suisse in 2008, he already had experience as aRisk Manager/Product Controller, as Fixed Income and Pension Fund Portfolio Manager in. He also worked as a Hedge Fund Manager atBassini Playfair Wright, in NY, USA. Andre holds a degree in Computer Science from UFGRS, and a MBA from MIT Sloan School ofManagement.
3) If not expressly indicated otherwise, all quantitative data contained in this comment is based on Lipper, Bloomberg or Datastream.
64
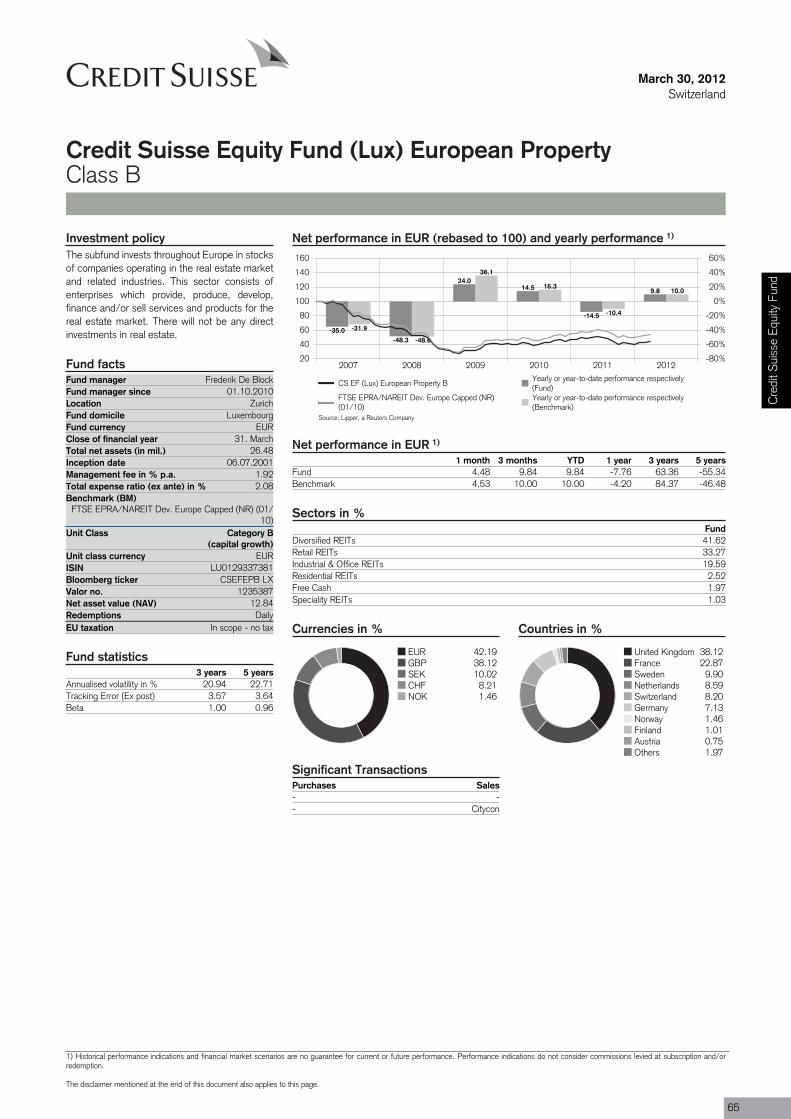
Purchases Sales- -- Citycon
Fund manager Frederik De BlockFund manager since 01.10.2010Location ZurichFund domicile LuxembourgFund currency EURClose of financial year 31. MarchTotal net assets (in mil.) 26.48Inception date 06.07.2001Management fee in % p.a. 1.92Total expense ratio (ex ante) in % 2.08Benchmark (BM)
FTSE EPRA/NAREIT Dev. Europe Capped (NR) (01/10)
Unit Class Category B(capital growth)
ISIN LU0129337381
Valor no. 1235387
Redemptions DailyEU taxation In scope - no tax
March 30, 2012Switzerland
Credit Suisse Equity Fund (Lux) European PropertyClass B
Net performance in EUR (rebased to 100) and yearly performance 1)
2007 2008 2009 2010 2011 201220
40
60
80
100
120
140
160
-80%
-60%
-40%
-20%
0%
20%
40%
60%
-35.0-48.3
24.014.5
-14.5
9.8
-31.9
-48.6
36.1
16.3
-10.4
10.0
CS EF (Lux) European Property BYearly or year-to-date performance respectively(Fund)
FTSE EPRA/NAREIT Dev. Europe Capped (NR)(01/10)
Yearly or year-to-date performance respectively(Benchmark)
Net performance in EUR 1)
1 month 3 months YTD 1 year 3 years 5 yearsFund 4.48 9.84 9.84 -7.76 63.36 -55.34Benchmark 4.53 10.00 10.00 -4.20 84.37 -46.48
Sectors in %Fund
Diversified REITs 41.62Retail REITs 33.27Industrial & Office REITs 19.59Residential REITs 2.52Free Cash 1.97Speciality REITs 1.03
Currencies in %
EUR 42.19GBP 38.12SEK 10.02CHF 8.21NOK 1.46
Countries in %
United Kingdom 38.12France 22.87Sweden 9.90Netherlands 8.59Switzerland 8.20Germany 7.13Norway 1.46Finland 1.01Austria 0.75Others 1.97
Significant Transactions
Investment policyThe subfund invests throughout Europe in stocksof companies operating in the real estate marketand related industries. This sector consists ofenterprises which provide, produce, develop,finance and/or sell services and products for thereal estate market. There will not be any directinvestments in real estate.
Fund facts
Unit class currency EUR
Bloomberg ticker CSEFEPB LX
Net asset value (NAV) 12.84
Fund statistics3 years 5 years
Annualised volatility in % 20.94 22.71Tracking Error (Ex post) 3.57 3.64Beta 1.00 0.96
Source: Lipper, a Reuters Company
Cre
dit S
uiss
e Eq
uity
Fun
d
1) Historical performance indications and financial market scenarios are no guarantee for current or future performance. Performance indications do not consider commissions levied at subscription and/orredemption.
The disclaimer mentioned at the end of this document also applies to this page.
65
March 30, 2012Switzerland
Credit Suisse Equity Fund (Lux) European PropertyClass B
Review previous quarter 2)
After starting strongly in 2012, European realestate equities have performed more or less inline with the general equity indices since thebeginning of February. During Q1 2012, theEPRA Europe Capped Index (all figures in EURterms) gained 10%. As investors were takingmore risks and picked up the stocks thatunderperformed, Italy was the best performingmarket with a gain of more than 30%. But as theproblems in Southern Europe might resurface,we did not invest in these countries as mostcompanies have above average debt levels andwill face higher refinancing costs. The secondbest country was Norway, with a gain of morethan 20%. The fund is overweight and given the
attractive valuation and strong real estate marketin Norway we keep our position there.
France and the Netherlands also benefited fromthe more benign environment and outperformedthe market. During the quarter, the fund turnedthe underweight into an overweight position andprofited from this outperformance. Theoutperformance was partly due to the strong risein Klepierre, after the US REIT Simon PropertyGroup bought a stake of almost 30% in thecompany from BNP Paribas at a decent premiumto the stock price. Subsequently, the marketre-rated the Dutch retail REITs. The fund isoverweight both Klepierre and its Dutch
competitors.
The fund’s performance was negatively impactedby the strong rise in the stock price of theGerman residential REIT Gagfah, after it reachedan agreement with the City of Dresden regardinga EUR 1 billion claim by the city against thecompany. Gagfah gained more than 50%. Butas it has a large part of its debt to be refinancedin the short-term as well as a stretched balancesheet coupled with declining cash flows, we donot invest in this company.
Outlook for the market 2)
The euro crisis appears to be contained, but stillsmoldering, with possible tests ahead (Spanishbank refinancing, G-20 support, Frenchelections, Irish referendum, etc.). The massiveliquidity injections by the ECB and the Greekdebt restructuring have succeeded in stabilizingbanks and government debt. However, with theexception of a few economies (among themGermany, Sweden and Switzerland) where labormarkets and domestic demand are buoyant, theoutlook of consumers – and businesses –remains subdued.
In tandem with better macro data, earnings and
sales momentum have improved. Valuations areat fair levels, downside risks remain andvulnerability to temporary setbacks hasincreased. But with central banks unlikely toprematurely end their ultra-expansive monetarypolicy, and benchmark bond yields still generallylow (despite the recent move upward), and aliquidity overhang in financial markets, investorsare likely to regard these instances asopportunities to enter stock markets.Strategically, real estate investments shouldbenefit from their relatively high rental yields inthe current near-zero interest rate environment.
Within the fund, the management avoids eitherhighly leveraged companies or those with highexposure to Southern and Central Europe. Themanagement prefers companies with decentbalance sheets and potential for future growth.The management will also keep a close eye onvaluations and will not hesitate to take profits ifequity prices rise above fair values or enlargepositions if valuations become even moreattractive. For the time being the fund isoverweight in Sweden, the UK, Norway andFrance, and underweight in Greece, Italy,Belgium, Switzerland, Austria and Spain.
Portfolio ManagementFrederik De Block is an Vice President and Investment Professional for European real estate securities. Mr. De Block joined the team inFebruary 2008 from Deutsche Bank, where he was an equity fund manager. Previously Mr. De Block was a financial analyst for Europeancompanies. Mr. De Block is a CFA charterholder and holds both a Master‘s Degree in Finance from Ehsal/Brussels and a Master’sDegree in Business Economics from the University of Leuven.
2) If not expressly indicated otherwise, all quantitative data contained in this comment is based on Lipper, Bloomberg or Datastream.
66
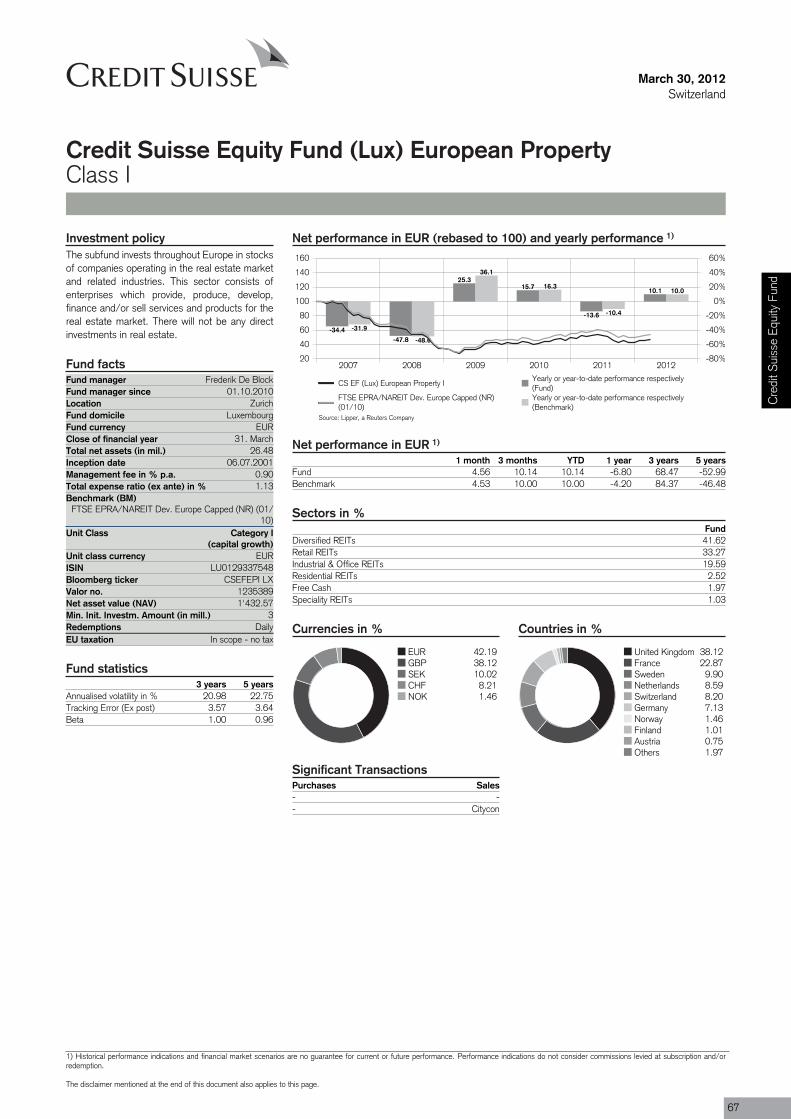
Purchases Sales- -- Citycon
Fund manager Frederik De BlockFund manager since 01.10.2010Location ZurichFund domicile LuxembourgFund currency EURClose of financial year 31. MarchTotal net assets (in mil.) 26.48Inception date 06.07.2001Management fee in % p.a. 0.90Total expense ratio (ex ante) in % 1.13Benchmark (BM)
FTSE EPRA/NAREIT Dev. Europe Capped (NR) (01/10)
Unit Class Category I(capital growth)
ISIN LU0129337548
Valor no. 1235389
Min. Init. Investm. Amount (in mill.) 3Redemptions DailyEU taxation In scope - no tax
March 30, 2012Switzerland
Credit Suisse Equity Fund (Lux) European PropertyClass I
Net performance in EUR (rebased to 100) and yearly performance 1)
2007 2008 2009 2010 2011 201220
40
60
80
100
120
140
160
-80%
-60%
-40%
-20%
0%
20%
40%
60%
-34.4-47.8
25.315.7
-13.6
10.1
-31.9
-48.6
36.1
16.3
-10.4
10.0
CS EF (Lux) European Property IYearly or year-to-date performance respectively(Fund)
FTSE EPRA/NAREIT Dev. Europe Capped (NR)(01/10)
Yearly or year-to-date performance respectively(Benchmark)
Net performance in EUR 1)
1 month 3 months YTD 1 year 3 years 5 yearsFund 4.56 10.14 10.14 -6.80 68.47 -52.99Benchmark 4.53 10.00 10.00 -4.20 84.37 -46.48
Sectors in %Fund
Diversified REITs 41.62Retail REITs 33.27Industrial & Office REITs 19.59Residential REITs 2.52Free Cash 1.97Speciality REITs 1.03
Currencies in %
EUR 42.19GBP 38.12SEK 10.02CHF 8.21NOK 1.46
Countries in %
United Kingdom 38.12France 22.87Sweden 9.90Netherlands 8.59Switzerland 8.20Germany 7.13Norway 1.46Finland 1.01Austria 0.75Others 1.97
Significant Transactions
Investment policyThe subfund invests throughout Europe in stocksof companies operating in the real estate marketand related industries. This sector consists ofenterprises which provide, produce, develop,finance and/or sell services and products for thereal estate market. There will not be any directinvestments in real estate.
Fund facts
Unit class currency EUR
Bloomberg ticker CSEFEPI LX
Net asset value (NAV) 1'432.57
Fund statistics3 years 5 years
Annualised volatility in % 20.98 22.75Tracking Error (Ex post) 3.57 3.64Beta 1.00 0.96
Source: Lipper, a Reuters Company
Cre
dit S
uiss
e Eq
uity
Fun
d
1) Historical performance indications and financial market scenarios are no guarantee for current or future performance. Performance indications do not consider commissions levied at subscription and/orredemption.
The disclaimer mentioned at the end of this document also applies to this page.
67
March 30, 2012Switzerland
Credit Suisse Equity Fund (Lux) European PropertyClass I
Review previous quarter 2)
After starting strongly in 2012, European realestate equities have performed more or less inline with the general equity indices since thebeginning of February. During Q1 2012, theEPRA Europe Capped Index (all figures in EURterms) gained 10%. As investors were takingmore risks and picked up the stocks thatunderperformed, Italy was the best performingmarket with a gain of more than 30%. But as theproblems in Southern Europe might resurface,we did not invest in these countries as mostcompanies have above average debt levels andwill face higher refinancing costs. The secondbest country was Norway, with a gain of morethan 20%. The fund is overweight and given the
attractive valuation and strong real estate marketin Norway we keep our position there.
France and the Netherlands also benefited fromthe more benign environment and outperformedthe market. During the quarter, the fund turnedthe underweight into an overweight position andprofited from this outperformance. Theoutperformance was partly due to the strong risein Klepierre, after the US REIT Simon PropertyGroup bought a stake of almost 30% in thecompany from BNP Paribas at a decent premiumto the stock price. Subsequently, the marketre-rated the Dutch retail REITs. The fund isoverweight both Klepierre and its Dutch
competitors.
The fund’s performance was negatively impactedby the strong rise in the stock price of theGerman residential REIT Gagfah, after it reachedan agreement with the City of Dresden regardinga EUR 1 billion claim by the city against thecompany. Gagfah gained more than 50%. Butas it has a large part of its debt to be refinancedin the short-term as well as a stretched balancesheet coupled with declining cash flows, we donot invest in this company.
Outlook for the market 2)
The euro crisis appears to be contained, but stillsmoldering, with possible tests ahead (Spanishbank refinancing, G-20 support, Frenchelections, Irish referendum, etc.). The massiveliquidity injections by the ECB and the Greekdebt restructuring have succeeded in stabilizingbanks and government debt. However, with theexception of a few economies (among themGermany, Sweden and Switzerland) where labormarkets and domestic demand are buoyant, theoutlook of consumers – and businesses –remains subdued.
In tandem with better macro data, earnings and
sales momentum have improved. Valuations areat fair levels, downside risks remain andvulnerability to temporary setbacks hasincreased. But with central banks unlikely toprematurely end their ultra-expansive monetarypolicy, and benchmark bond yields still generallylow (despite the recent move upward), and aliquidity overhang in financial markets, investorsare likely to regard these instances asopportunities to enter stock markets.Strategically, real estate investments shouldbenefit from their relatively high rental yields inthe current near-zero interest rate environment.
Within the fund, the management avoids eitherhighly leveraged companies or those with highexposure to Southern and Central Europe. Themanagement prefers companies with decentbalance sheets and potential for future growth.The management will also keep a close eye onvaluations and will not hesitate to take profits ifequity prices rise above fair values or enlargepositions if valuations become even moreattractive. For the time being the fund isoverweight in Sweden, the UK, Norway andFrance, and underweight in Greece, Italy,Belgium, Switzerland, Austria and Spain.
Portfolio ManagementFrederik De Block is an Vice President and Investment Professional for European real estate securities. Mr. De Block joined the team inFebruary 2008 from Deutsche Bank, where he was an equity fund manager. Previously Mr. De Block was a financial analyst for Europeancompanies. Mr. De Block is a CFA charterholder and holds both a Master‘s Degree in Finance from Ehsal/Brussels and a Master’sDegree in Business Economics from the University of Leuven.
2) If not expressly indicated otherwise, all quantitative data contained in this comment is based on Lipper, Bloomberg or Datastream.
68
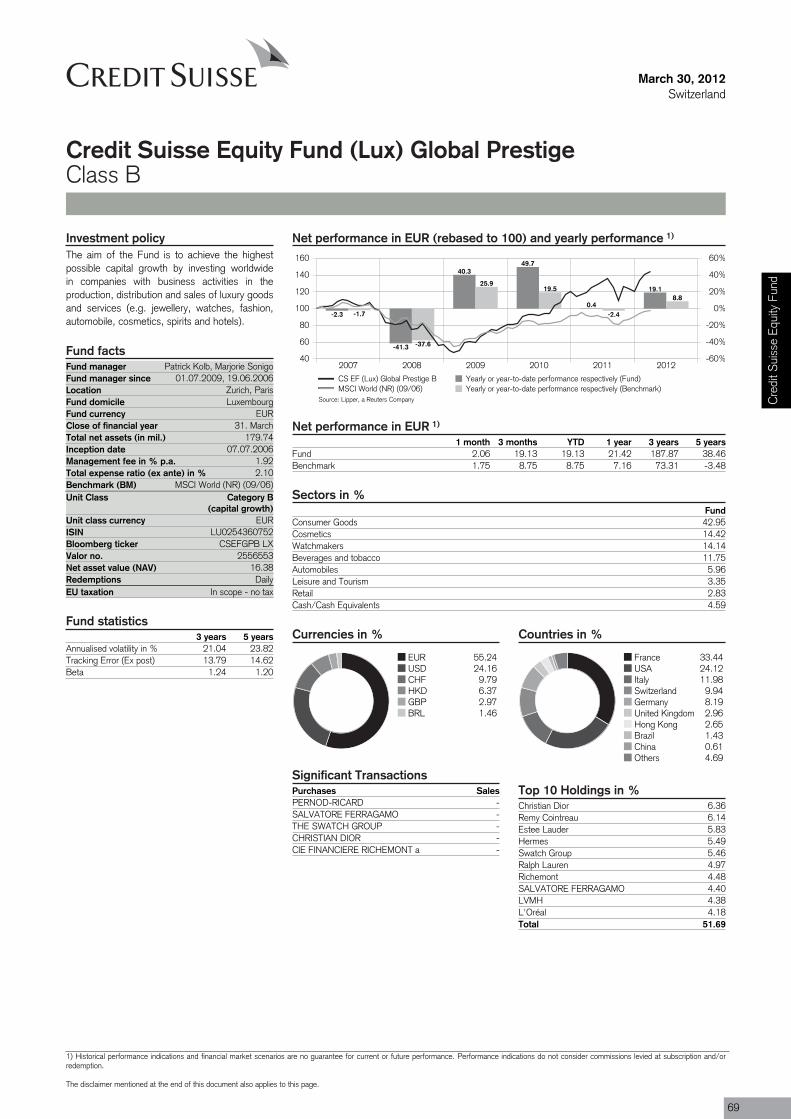
Purchases SalesPERNOD-RICARD -SALVATORE FERRAGAMO -THE SWATCH GROUP -CHRISTIAN DIOR -CIE FINANCIERE RICHEMONT a -
Fund manager Patrick Kolb, Marjorie SonigoFund manager since 01.07.2009, 19.06.2006Location Zurich, ParisFund domicile LuxembourgFund currency EURClose of financial year 31. MarchTotal net assets (in mil.) 179.74Inception date 07.07.2006Management fee in % p.a. 1.92Total expense ratio (ex ante) in % 2.10Benchmark (BM) MSCI World (NR) (09/06)Unit Class Category B
(capital growth)
ISIN LU0254360752
Valor no. 2556553
Redemptions DailyEU taxation In scope - no tax
March 30, 2012Switzerland
Credit Suisse Equity Fund (Lux) Global PrestigeClass B
Net performance in EUR (rebased to 100) and yearly performance 1)
2007 2008 2009 2010 2011 201240
60
80
100
120
140
160
-60%
-40%
-20%
0%
20%
40%
60%
-2.3
-41.3
40.349.7
0.4
19.1
-1.7
-37.6
25.919.5
-2.4
8.8
CS EF (Lux) Global Prestige B Yearly or year-to-date performance respectively (Fund)MSCI World (NR) (09/06) Yearly or year-to-date performance respectively (Benchmark)
Net performance in EUR 1)
1 month 3 months YTD 1 year 3 years 5 yearsFund 2.06 19.13 19.13 21.42 187.87 38.46Benchmark 1.75 8.75 8.75 7.16 73.31 -3.48
Sectors in %Fund
Consumer Goods 42.95Cosmetics 14.42Watchmakers 14.14Beverages and tobacco 11.75Automobiles 5.96Leisure and Tourism 3.35Retail 2.83Cash/Cash Equivalents 4.59
Currencies in %
EUR 55.24USD 24.16CHF 9.79HKD 6.37GBP 2.97BRL 1.46
Countries in %
France 33.44USA 24.12Italy 11.98Switzerland 9.94Germany 8.19United Kingdom 2.96Hong Kong 2.65Brazil 1.43China 0.61Others 4.69
Top 10 Holdings in %Christian Dior 6.36Remy Cointreau 6.14Estee Lauder 5.83Hermes 5.49Swatch Group 5.46Ralph Lauren 4.97Richemont 4.48SALVATORE FERRAGAMO 4.40LVMH 4.38L'Oréal 4.18Total 51.69
Significant Transactions
Investment policyThe aim of the Fund is to achieve the highestpossible capital growth by investing worldwidein companies with business activities in theproduction, distribution and sales of luxury goodsand services (e.g. jewellery, watches, fashion,automobile, cosmetics, spirits and hotels).
Fund facts
Unit class currency EUR
Bloomberg ticker CSEFGPB LX
Net asset value (NAV) 16.38
Fund statistics3 years 5 years
Annualised volatility in % 21.04 23.82Tracking Error (Ex post) 13.79 14.62Beta 1.24 1.20
Source: Lipper, a Reuters Company Cre
dit S
uiss
e Eq
uity
Fun
d
1) Historical performance indications and financial market scenarios are no guarantee for current or future performance. Performance indications do not consider commissions levied at subscription and/orredemption.
The disclaimer mentioned at the end of this document also applies to this page.
69
March 30, 2012Switzerland
Credit Suisse Equity Fund (Lux) Global PrestigeClass B
Review previous quarter 2)
Since the beginning of the year, monetary policydecisions were greatly favorable for the financialsector and were greeted by the financialmarkets, which globally ended the first quarterwith positive performances. But althoughEuropean markets are still affected by budgetproblems, news flow is positive for the rest of the
world. The US economy remains resilient and theemerging markets benefit from contained highgrowth and rising standards of living.
In this global favorable context, the luxury goodssector outperformed general markets.Publications of figures and forecasts were
particularly good for this sector, even for theEuropean luxury groups, which shouldcompensate weaknesses from their domesticconsumers by “shopping tourism” (most of theChinese purchases are made abroad andChinese tourism is developing very fast).
Outlook for the market 2)
In 2011, the luxury goods sector has againshown its resilience in a not very favorable worldeconomic environment. The increase in activitycontinued with double-digit growth rates and withresults which again exceeded expectationsthanks to the increase in demand from emergingcountries – from both domestic consumption andincreased tourism. At the same time, marginscontinued to increase supported by rises in pricesmade during the year.
In our opinion, in 2012, the sector’s growthshould stay at high levels, approximately 10%,
thanks to the dynamism of sales in Asia. Themargins could reach new historic highs helpedby the pursuit of rises in prices, development ofdirect sales and currency effects more favorablethan in 2011. Valuations are still attractive andthe sector justifies completely its premiumcompared to the market thanks to strongfundamentals and to its favorable growthperspectives.
During the last quarter, we benefited from stronginflows to continue to reinforce the portfolio’sexposure to more defensive sub sectors and to
increase the weights in consumer goods: inapparels, we reinforced positions initiated lastsummer in Salvatore Ferragamo and Prada andwe also initiated a new position in Limited Brands(lingerie through Victoria’s Secret and La Senzaetc). We continued to reinforce the alcoholic subsector by increasing weightings in Pernod Ricard,which generate more than 30% of global salesin Asia. We also initiated a new position in theChinese jeweler Chow Tai Fook Jewellery, whichshould benefit from the strong forecasted growthof this retail segment in China.
Portfolio ManagementPatrick Kolb is working since June 2005 as a Portfolio Manager at Credit Suisse in Global Equities. After graduation in 2001 in majorfinance at University of Zurich, he was a PhD-Student and a Research Assistant at the Swiss Banking Institute of the University of Zurich.He finished his doctorate in 2005.
2) If not expressly indicated otherwise, all quantitative data contained in this comment is based on Lipper, Bloomberg or Datastream.
70
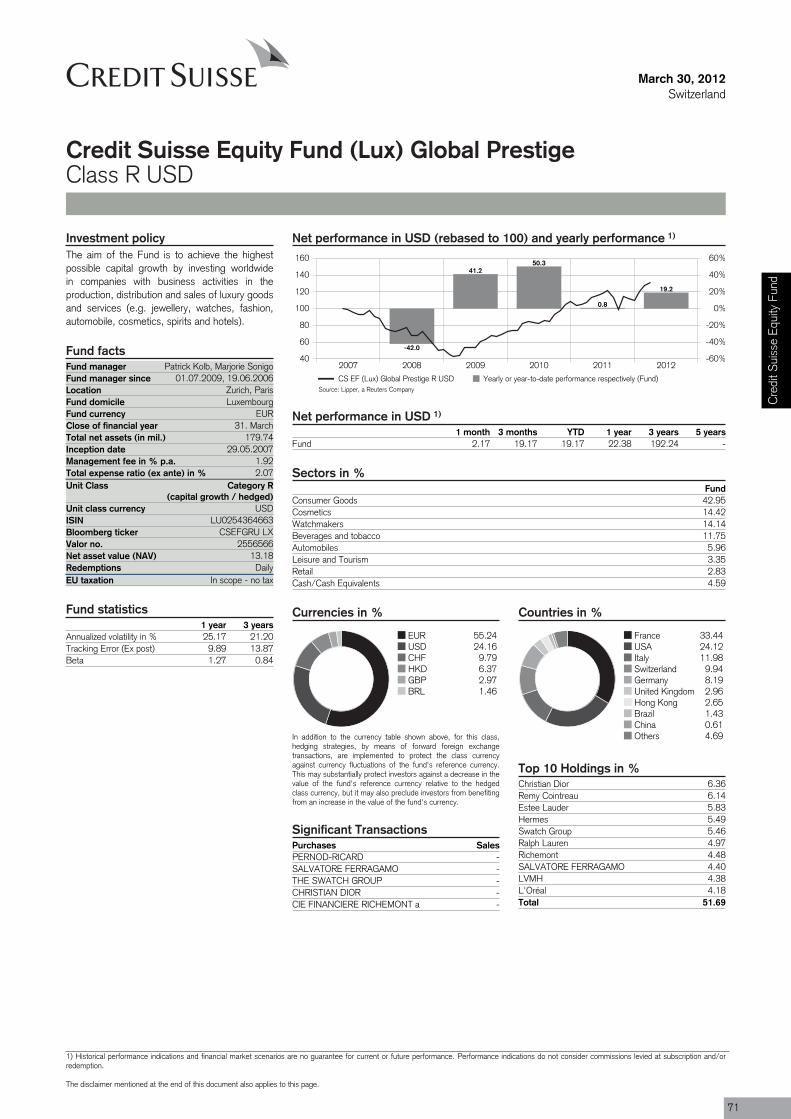
Purchases SalesPERNOD-RICARD -SALVATORE FERRAGAMO -THE SWATCH GROUP -CHRISTIAN DIOR -CIE FINANCIERE RICHEMONT a -
Fund manager Patrick Kolb, Marjorie SonigoFund manager since 01.07.2009, 19.06.2006Location Zurich, ParisFund domicile LuxembourgFund currency EURClose of financial year 31. MarchTotal net assets (in mil.) 179.74Inception date 29.05.2007Management fee in % p.a. 1.92Total expense ratio (ex ante) in % 2.07Unit Class Category R
(capital growth / hedged)
ISIN LU0254364663
Valor no. 2556566
Redemptions DailyEU taxation In scope - no tax
March 30, 2012Switzerland
Credit Suisse Equity Fund (Lux) Global PrestigeClass R USD
Net performance in USD (rebased to 100) and yearly performance 1)
2007 2008 2009 2010 2011 201240
60
80
100
120
140
160
-60%
-40%
-20%
0%
20%
40%
60%
-42.0
41.250.3
0.8
19.2
CS EF (Lux) Global Prestige R USD Yearly or year-to-date performance respectively (Fund)
Net performance in USD 1)
1 month 3 months YTD 1 year 3 years 5 yearsFund 2.17 19.17 19.17 22.38 192.24 -
Sectors in %Fund
Consumer Goods 42.95Cosmetics 14.42Watchmakers 14.14Beverages and tobacco 11.75Automobiles 5.96Leisure and Tourism 3.35Retail 2.83Cash/Cash Equivalents 4.59
Currencies in %
EUR 55.24USD 24.16CHF 9.79HKD 6.37GBP 2.97BRL 1.46
In addition to the currency table shown above, for this class,hedging strategies, by means of forward foreign exchangetransactions, are implemented to protect the class currencyagainst currency fluctuations of the fund's reference currency.This may substantially protect investors against a decrease in thevalue of the fund's reference currency relative to the hedgedclass currency, but it may also preclude investors from benefitingfrom an increase in the value of the fund's currency.
Countries in %
France 33.44USA 24.12Italy 11.98Switzerland 9.94Germany 8.19United Kingdom 2.96Hong Kong 2.65Brazil 1.43China 0.61Others 4.69
Top 10 Holdings in %Christian Dior 6.36Remy Cointreau 6.14Estee Lauder 5.83Hermes 5.49Swatch Group 5.46Ralph Lauren 4.97Richemont 4.48SALVATORE FERRAGAMO 4.40LVMH 4.38L'Oréal 4.18Total 51.69
Significant Transactions
Investment policyThe aim of the Fund is to achieve the highestpossible capital growth by investing worldwidein companies with business activities in theproduction, distribution and sales of luxury goodsand services (e.g. jewellery, watches, fashion,automobile, cosmetics, spirits and hotels).
Fund facts
Unit class currency USD
Bloomberg ticker CSEFGRU LX
Net asset value (NAV) 13.18
Fund statistics1 year 3 years
Annualized volatility in % 25.17 21.20Tracking Error (Ex post) 9.89 13.87Beta 1.27 0.84
Source: Lipper, a Reuters Company
Cre
dit S
uiss
e Eq
uity
Fun
d
1) Historical performance indications and financial market scenarios are no guarantee for current or future performance. Performance indications do not consider commissions levied at subscription and/orredemption.
The disclaimer mentioned at the end of this document also applies to this page.
71

March 30, 2012Switzerland
Credit Suisse Equity Fund (Lux) Global PrestigeClass R USD
Review previous quarter 2)
Since the beginning of the year, monetary policydecisions were greatly favorable for the financialsector and were greeted by the financialmarkets, which globally ended the first quarterwith positive performances. But althoughEuropean markets are still affected by budgetproblems, news flow is positive for the rest of the
world. The US economy remains resilient and theemerging markets benefit from contained highgrowth and rising standards of living.
In this global favorable context, the luxury goodssector outperformed general markets.Publications of figures and forecasts were
particularly good for this sector, even for theEuropean luxury groups, which shouldcompensate weaknesses from their domesticconsumers by “shopping tourism” (most of theChinese purchases are made abroad andChinese tourism is developing very fast).
Outlook for the market 2)
In 2011, the luxury goods sector has againshown its resilience in a not very favorable worldeconomic environment. The increase in activitycontinued with double-digit growth rates and withresults which again exceeded expectationsthanks to the increase in demand from emergingcountries – from both domestic consumption andincreased tourism. At the same time, marginscontinued to increase supported by rises in pricesmade during the year.
In our opinion, in 2012, the sector’s growthshould stay at high levels, approximately 10%,
thanks to the dynamism of sales in Asia. Themargins could reach new historic highs helpedby the pursuit of rises in prices, development ofdirect sales and currency effects more favorablethan in 2011. Valuations are still attractive andthe sector justifies completely its premiumcompared to the market thanks to strongfundamentals and to its favorable growthperspectives.
During the last quarter, we benefited from stronginflows to continue to reinforce the portfolio’sexposure to more defensive sub sectors and to
increase the weights in consumer goods: inapparels, we reinforced positions initiated lastsummer in Salvatore Ferragamo and Prada andwe also initiated a new position in Limited Brands(lingerie through Victoria’s Secret and La Senzaetc). We continued to reinforce the alcoholic subsector by increasing weightings in Pernod Ricard,which generate more than 30% of global salesin Asia. We also initiated a new position in theChinese jeweler Chow Tai Fook Jewellery, whichshould benefit from the strong forecasted growthof this retail segment in China.
Portfolio ManagementPatrick Kolb is working since June 2005 as a Portfolio Manager at Credit Suisse in Global Equities. After graduation in 2001 in majorfinance at University of Zurich, he was a PhD-Student and a Research Assistant at the Swiss Banking Institute of the University of Zurich.He finished his doctorate in 2005.
2) If not expressly indicated otherwise, all quantitative data contained in this comment is based on Lipper, Bloomberg or Datastream.
72
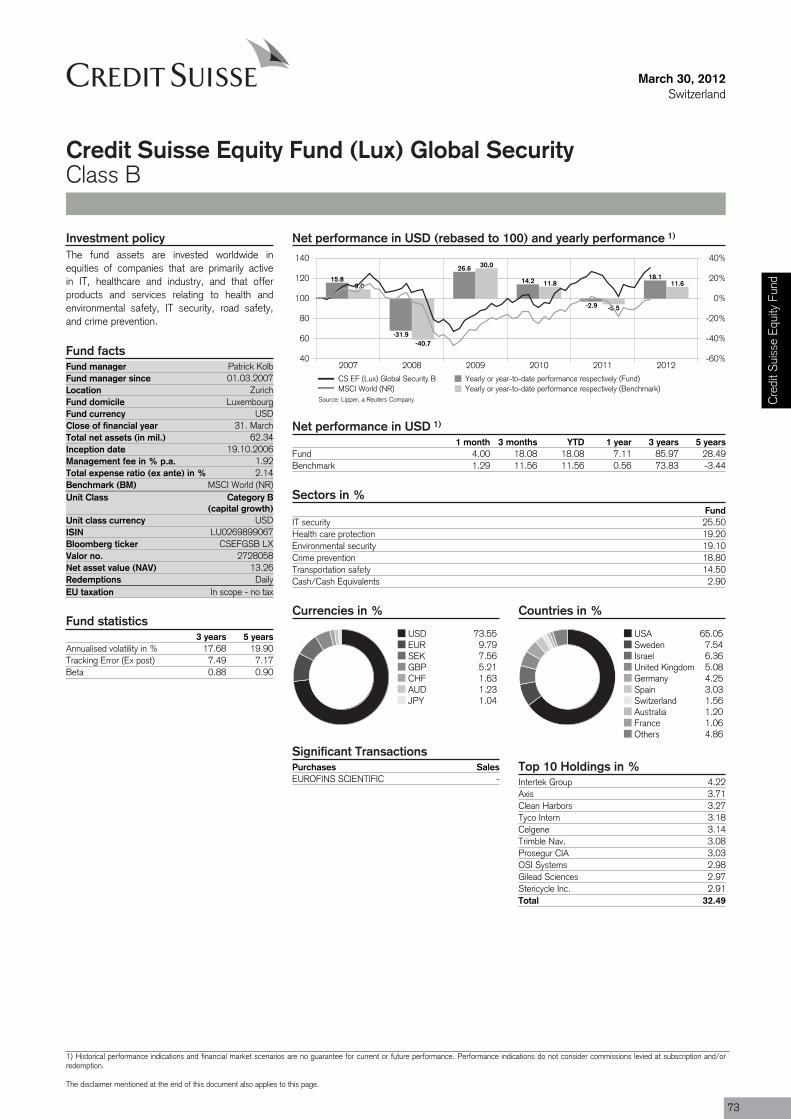
Purchases SalesEUROFINS SCIENTIFIC -
Fund manager Patrick KolbFund manager since 01.03.2007Location ZurichFund domicile LuxembourgFund currency USDClose of financial year 31. MarchTotal net assets (in mil.) 62.34Inception date 19.10.2006Management fee in % p.a. 1.92Total expense ratio (ex ante) in % 2.14Benchmark (BM) MSCI World (NR)Unit Class Category B
(capital growth)
ISIN LU0269899067
Valor no. 2728058
Redemptions DailyEU taxation In scope - no tax
March 30, 2012Switzerland
Credit Suisse Equity Fund (Lux) Global SecurityClass B
Net performance in USD (rebased to 100) and yearly performance 1)
2007 2008 2009 2010 2011 201240
60
80
100
120
140
-60%
-40%
-20%
0%
20%
40%
15.8
-31.9
26.6
14.2
-2.9
18.19.0
-40.7
30.0
11.8
-5.5
11.6
CS EF (Lux) Global Security B Yearly or year-to-date performance respectively (Fund)MSCI World (NR) Yearly or year-to-date performance respectively (Benchmark)
Net performance in USD 1)
1 month 3 months YTD 1 year 3 years 5 yearsFund 4.00 18.08 18.08 7.11 85.97 28.49Benchmark 1.29 11.56 11.56 0.56 73.83 -3.44
Sectors in %Fund
IT security 25.50Health care protection 19.20Environmental security 19.10Crime prevention 18.80Transportation safety 14.50Cash/Cash Equivalents 2.90
Currencies in %
USD 73.55EUR 9.79SEK 7.56GBP 5.21CHF 1.63AUD 1.23JPY 1.04
Countries in %
USA 65.05Sweden 7.54Israel 6.36United Kingdom 5.08Germany 4.25Spain 3.03Switzerland 1.56Australia 1.20France 1.06Others 4.86
Top 10 Holdings in %Intertek Group 4.22Axis 3.71Clean Harbors 3.27Tyco Intern 3.18Celgene 3.14Trimble Nav. 3.08Prosegur CIA 3.03OSI Systems 2.98Gilead Sciences 2.97Stericycle Inc. 2.91Total 32.49
Significant Transactions
Investment policyThe fund assets are invested worldwide inequities of companies that are primarily activein IT, healthcare and industry, and that offerproducts and services relating to health andenvironmental safety, IT security, road safety,and crime prevention.
Fund facts
Unit class currency USD
Bloomberg ticker CSEFGSB LX
Net asset value (NAV) 13.26
Fund statistics3 years 5 years
Annualised volatility in % 17.68 19.90Tracking Error (Ex post) 7.49 7.17Beta 0.88 0.90
Source: Lipper, a Reuters Company Cre
dit S
uiss
e Eq
uity
Fun
d
1) Historical performance indications and financial market scenarios are no guarantee for current or future performance. Performance indications do not consider commissions levied at subscription and/orredemption.
The disclaimer mentioned at the end of this document also applies to this page.
73
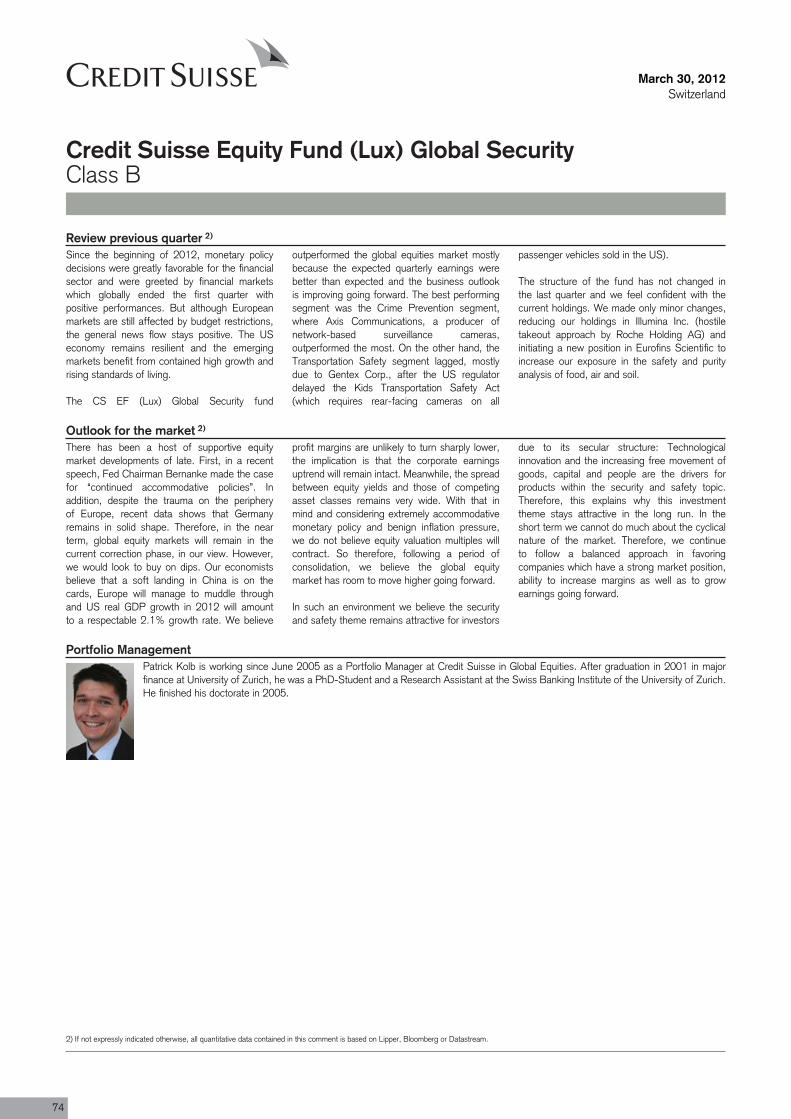
March 30, 2012Switzerland
Credit Suisse Equity Fund (Lux) Global SecurityClass B
Review previous quarter 2)
Since the beginning of 2012, monetary policydecisions were greatly favorable for the financialsector and were greeted by financial marketswhich globally ended the first quarter withpositive performances. But although Europeanmarkets are still affected by budget restrictions,the general news flow stays positive. The USeconomy remains resilient and the emergingmarkets benefit from contained high growth andrising standards of living.
The CS EF (Lux) Global Security fund
outperformed the global equities market mostlybecause the expected quarterly earnings werebetter than expected and the business outlookis improving going forward. The best performingsegment was the Crime Prevention segment,where Axis Communications, a producer ofnetwork-based surveillance cameras,outperformed the most. On the other hand, theTransportation Safety segment lagged, mostlydue to Gentex Corp., after the US regulatordelayed the Kids Transportation Safety Act(which requires rear-facing cameras on all
passenger vehicles sold in the US).
The structure of the fund has not changed inthe last quarter and we feel confident with thecurrent holdings. We made only minor changes,reducing our holdings in Illumina Inc. (hostiletakeout approach by Roche Holding AG) andinitiating a new position in Eurofins Scientific toincrease our exposure in the safety and purityanalysis of food, air and soil.
Outlook for the market 2)
There has been a host of supportive equitymarket developments of late. First, in a recentspeech, Fed Chairman Bernanke made the casefor “continued accommodative policies”. Inaddition, despite the trauma on the peripheryof Europe, recent data shows that Germanyremains in solid shape. Therefore, in the nearterm, global equity markets will remain in thecurrent correction phase, in our view. However,we would look to buy on dips. Our economistsbelieve that a soft landing in China is on thecards, Europe will manage to muddle throughand US real GDP growth in 2012 will amountto a respectable 2.1% growth rate. We believe
profit margins are unlikely to turn sharply lower,the implication is that the corporate earningsuptrend will remain intact. Meanwhile, the spreadbetween equity yields and those of competingasset classes remains very wide. With that inmind and considering extremely accommodativemonetary policy and benign inflation pressure,we do not believe equity valuation multiples willcontract. So therefore, following a period ofconsolidation, we believe the global equitymarket has room to move higher going forward.
In such an environment we believe the securityand safety theme remains attractive for investors
due to its secular structure: Technologicalinnovation and the increasing free movement ofgoods, capital and people are the drivers forproducts within the security and safety topic.Therefore, this explains why this investmenttheme stays attractive in the long run. In theshort term we cannot do much about the cyclicalnature of the market. Therefore, we continueto follow a balanced approach in favoringcompanies which have a strong market position,ability to increase margins as well as to growearnings going forward.
Portfolio ManagementPatrick Kolb is working since June 2005 as a Portfolio Manager at Credit Suisse in Global Equities. After graduation in 2001 in majorfinance at University of Zurich, he was a PhD-Student and a Research Assistant at the Swiss Banking Institute of the University of Zurich.He finished his doctorate in 2005.
2) If not expressly indicated otherwise, all quantitative data contained in this comment is based on Lipper, Bloomberg or Datastream.
74

Purchases SalesEUROFINS SCIENTIFIC -
Fund manager Patrick KolbFund manager since 01.03.2007Location ZurichFund domicile LuxembourgFund currency USDClose of financial year 31. MarchTotal net assets (in mil.) 62.34Inception date 19.10.2006Management fee in % p.a. 1.92Total expense ratio (ex ante) in % 2.17Unit Class Category R
(capital growth / hedged)
ISIN LU0269899737
Valor no. 2728102
Redemptions DailyEU taxation In scope - no tax
March 30, 2012Switzerland
Credit Suisse Equity Fund (Lux) Global SecurityClass R CHF
Net performance in CHF (rebased to 100) and yearly performance 1)
2007 2008 2009 2010 2011 201260
70
80
90
100
110
120
130
-40%
-30%
-20%
-10%
0%
10%
20%
30%
11.9
-32.5
24.9
12.5
-4.8
17.8
CS EF (Lux) Global Security R CHF Yearly or year-to-date performance respectively (Fund)
Net performance in CHF 1)
1 month 3 months YTD 1 year 3 years 5 yearsFund 3.99 17.80 17.80 4.81 78.01 17.91
Sectors in %Fund
IT security 25.50Health care protection 19.20Environmental security 19.10Crime prevention 18.80Transportation safety 14.50Cash/Cash Equivalents 2.90
Currencies in %
USD 73.55EUR 9.79SEK 7.56GBP 5.21CHF 1.63AUD 1.23JPY 1.04
In addition to the currency table shown above, for this class,hedging strategies, by means of forward foreign exchangetransactions, are implemented to protect the class currencyagainst currency fluctuations of the fund's reference currency.This may substantially protect investors against a decrease in thevalue of the fund's reference currency relative to the hedgedclass currency, but it may also preclude investors from benefitingfrom an increase in the value of the fund's currency.
Countries in %
USA 65.05Sweden 7.54Israel 6.36United Kingdom 5.08Germany 4.25Spain 3.03Switzerland 1.56Australia 1.20France 1.06Others 4.86
Top 10 Holdings in %Intertek Group 4.22Axis 3.71Clean Harbors 3.27Tyco Intern 3.18Celgene 3.14Trimble Nav. 3.08Prosegur CIA 3.03OSI Systems 2.98Gilead Sciences 2.97Stericycle Inc. 2.91Total 32.49
Significant Transactions
Investment policyThe fund assets are invested worldwide inequities of companies that are primarily activein IT, healthcare and industry, and that offerproducts and services relating to health andenvironmental safety, IT security, road safety,and crime prevention.
Fund facts
Unit class currency CHF
Bloomberg ticker CSEFGSR LX
Net asset value (NAV) 11.98
Fund statistics3 years 5 years
Annualised volatility in % 17.68 19.86Tracking Error (Ex post) 12.72 13.36Beta 0.81 0.81
Source: Lipper, a Reuters Company
Cre
dit S
uiss
e Eq
uity
Fun
d
1) Historical performance indications and financial market scenarios are no guarantee for current or future performance. Performance indications do not consider commissions levied at subscription and/orredemption.
The disclaimer mentioned at the end of this document also applies to this page.
75

March 30, 2012Switzerland
Credit Suisse Equity Fund (Lux) Global SecurityClass R CHF
Review previous quarter 2)
Since the beginning of 2012, monetary policydecisions were greatly favorable for the financialsector and were greeted by financial marketswhich globally ended the first quarter withpositive performances. But although Europeanmarkets are still affected by budget restrictions,the general news flow stays positive. The USeconomy remains resilient and the emergingmarkets benefit from contained high growth andrising standards of living.
The CS EF (Lux) Global Security fund
outperformed the global equities market mostlybecause the expected quarterly earnings werebetter than expected and the business outlookis improving going forward. The best performingsegment was the Crime Prevention segment,where Axis Communications, a producer ofnetwork-based surveillance cameras,outperformed the most. On the other hand, theTransportation Safety segment lagged, mostlydue to Gentex Corp., after the US regulatordelayed the Kids Transportation Safety Act(which requires rear-facing cameras on all
passenger vehicles sold in the US).
The structure of the fund has not changed inthe last quarter and we feel confident with thecurrent holdings. We made only minor changes,reducing our holdings in Illumina Inc. (hostiletakeout approach by Roche Holding AG) andinitiating a new position in Eurofins Scientific toincrease our exposure in the safety and purityanalysis of food, air and soil.
Outlook for the market 2)
There has been a host of supportive equitymarket developments of late. First, in a recentspeech, Fed Chairman Bernanke made the casefor “continued accommodative policies”. Inaddition, despite the trauma on the peripheryof Europe, recent data shows that Germanyremains in solid shape. Therefore, in the nearterm, global equity markets will remain in thecurrent correction phase, in our view. However,we would look to buy on dips. Our economistsbelieve that a soft landing in China is on thecards, Europe will manage to muddle throughand US real GDP growth in 2012 will amountto a respectable 2.1% growth rate. We believe
profit margins are unlikely to turn sharply lower,the implication is that the corporate earningsuptrend will remain intact. Meanwhile, the spreadbetween equity yields and those of competingasset classes remains very wide. With that inmind and considering extremely accommodativemonetary policy and benign inflation pressure,we do not believe equity valuation multiples willcontract. So therefore, following a period ofconsolidation, we believe the global equitymarket has room to move higher going forward.
In such an environment we believe the securityand safety theme remains attractive for investors
due to its secular structure: Technologicalinnovation and the increasing free movement ofgoods, capital and people are the drivers forproducts within the security and safety topic.Therefore, this explains why this investmenttheme stays attractive in the long run. In theshort term we cannot do much about the cyclicalnature of the market. Therefore, we continueto follow a balanced approach in favoringcompanies which have a strong market position,ability to increase margins as well as to growearnings going forward.
Portfolio ManagementPatrick Kolb is working since June 2005 as a Portfolio Manager at Credit Suisse in Global Equities. After graduation in 2001 in majorfinance at University of Zurich, he was a PhD-Student and a Research Assistant at the Swiss Banking Institute of the University of Zurich.He finished his doctorate in 2005.
2) If not expressly indicated otherwise, all quantitative data contained in this comment is based on Lipper, Bloomberg or Datastream.
76
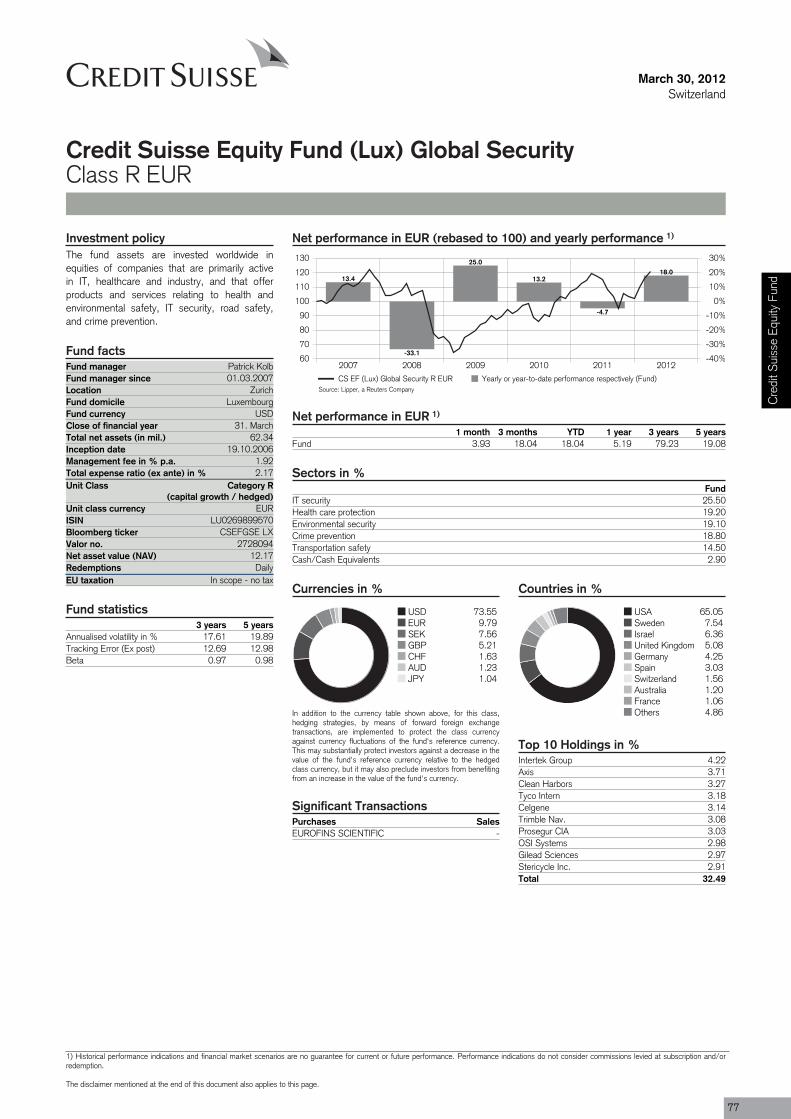
Purchases SalesEUROFINS SCIENTIFIC -
Fund manager Patrick KolbFund manager since 01.03.2007Location ZurichFund domicile LuxembourgFund currency USDClose of financial year 31. MarchTotal net assets (in mil.) 62.34Inception date 19.10.2006Management fee in % p.a. 1.92Total expense ratio (ex ante) in % 2.17Unit Class Category R
(capital growth / hedged)
ISIN LU0269899570
Valor no. 2728094
Redemptions DailyEU taxation In scope - no tax
March 30, 2012Switzerland
Credit Suisse Equity Fund (Lux) Global SecurityClass R EUR
Net performance in EUR (rebased to 100) and yearly performance 1)
2007 2008 2009 2010 2011 201260
70
80
90
100
110
120
130
-40%
-30%
-20%
-10%
0%
10%
20%
30%
13.4
-33.1
25.0
13.2
-4.7
18.0
CS EF (Lux) Global Security R EUR Yearly or year-to-date performance respectively (Fund)
Net performance in EUR 1)
1 month 3 months YTD 1 year 3 years 5 yearsFund 3.93 18.04 18.04 5.19 79.23 19.08
Sectors in %Fund
IT security 25.50Health care protection 19.20Environmental security 19.10Crime prevention 18.80Transportation safety 14.50Cash/Cash Equivalents 2.90
Currencies in %
USD 73.55EUR 9.79SEK 7.56GBP 5.21CHF 1.63AUD 1.23JPY 1.04
In addition to the currency table shown above, for this class,hedging strategies, by means of forward foreign exchangetransactions, are implemented to protect the class currencyagainst currency fluctuations of the fund's reference currency.This may substantially protect investors against a decrease in thevalue of the fund's reference currency relative to the hedgedclass currency, but it may also preclude investors from benefitingfrom an increase in the value of the fund's currency.
Countries in %
USA 65.05Sweden 7.54Israel 6.36United Kingdom 5.08Germany 4.25Spain 3.03Switzerland 1.56Australia 1.20France 1.06Others 4.86
Top 10 Holdings in %Intertek Group 4.22Axis 3.71Clean Harbors 3.27Tyco Intern 3.18Celgene 3.14Trimble Nav. 3.08Prosegur CIA 3.03OSI Systems 2.98Gilead Sciences 2.97Stericycle Inc. 2.91Total 32.49
Significant Transactions
Investment policyThe fund assets are invested worldwide inequities of companies that are primarily activein IT, healthcare and industry, and that offerproducts and services relating to health andenvironmental safety, IT security, road safety,and crime prevention.
Fund facts
Unit class currency EUR
Bloomberg ticker CSEFGSE LX
Net asset value (NAV) 12.17
Fund statistics3 years 5 years
Annualised volatility in % 17.61 19.89Tracking Error (Ex post) 12.69 12.98Beta 0.97 0.98
Source: Lipper, a Reuters Company
Cre
dit S
uiss
e Eq
uity
Fun
d
1) Historical performance indications and financial market scenarios are no guarantee for current or future performance. Performance indications do not consider commissions levied at subscription and/orredemption.
The disclaimer mentioned at the end of this document also applies to this page.
77
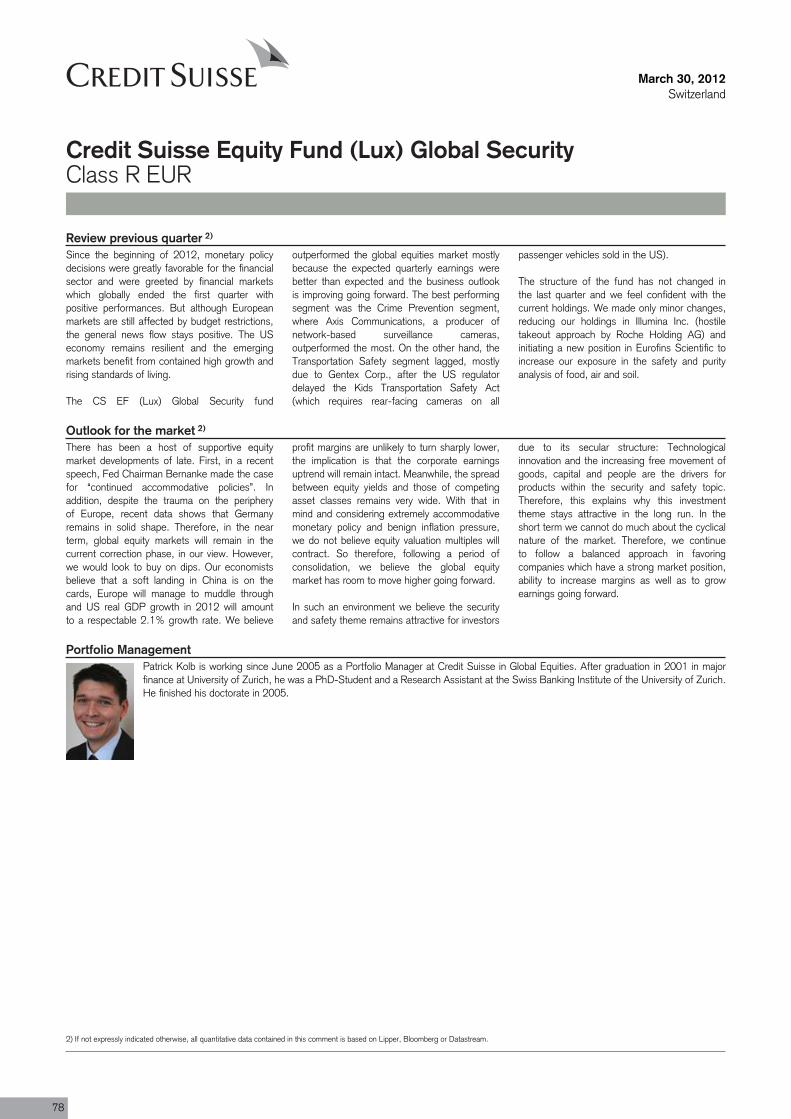
March 30, 2012Switzerland
Credit Suisse Equity Fund (Lux) Global SecurityClass R EUR
Review previous quarter 2)
Since the beginning of 2012, monetary policydecisions were greatly favorable for the financialsector and were greeted by financial marketswhich globally ended the first quarter withpositive performances. But although Europeanmarkets are still affected by budget restrictions,the general news flow stays positive. The USeconomy remains resilient and the emergingmarkets benefit from contained high growth andrising standards of living.
The CS EF (Lux) Global Security fund
outperformed the global equities market mostlybecause the expected quarterly earnings werebetter than expected and the business outlookis improving going forward. The best performingsegment was the Crime Prevention segment,where Axis Communications, a producer ofnetwork-based surveillance cameras,outperformed the most. On the other hand, theTransportation Safety segment lagged, mostlydue to Gentex Corp., after the US regulatordelayed the Kids Transportation Safety Act(which requires rear-facing cameras on all
passenger vehicles sold in the US).
The structure of the fund has not changed inthe last quarter and we feel confident with thecurrent holdings. We made only minor changes,reducing our holdings in Illumina Inc. (hostiletakeout approach by Roche Holding AG) andinitiating a new position in Eurofins Scientific toincrease our exposure in the safety and purityanalysis of food, air and soil.
Outlook for the market 2)
There has been a host of supportive equitymarket developments of late. First, in a recentspeech, Fed Chairman Bernanke made the casefor “continued accommodative policies”. Inaddition, despite the trauma on the peripheryof Europe, recent data shows that Germanyremains in solid shape. Therefore, in the nearterm, global equity markets will remain in thecurrent correction phase, in our view. However,we would look to buy on dips. Our economistsbelieve that a soft landing in China is on thecards, Europe will manage to muddle throughand US real GDP growth in 2012 will amountto a respectable 2.1% growth rate. We believe
profit margins are unlikely to turn sharply lower,the implication is that the corporate earningsuptrend will remain intact. Meanwhile, the spreadbetween equity yields and those of competingasset classes remains very wide. With that inmind and considering extremely accommodativemonetary policy and benign inflation pressure,we do not believe equity valuation multiples willcontract. So therefore, following a period ofconsolidation, we believe the global equitymarket has room to move higher going forward.
In such an environment we believe the securityand safety theme remains attractive for investors
due to its secular structure: Technologicalinnovation and the increasing free movement ofgoods, capital and people are the drivers forproducts within the security and safety topic.Therefore, this explains why this investmenttheme stays attractive in the long run. In theshort term we cannot do much about the cyclicalnature of the market. Therefore, we continueto follow a balanced approach in favoringcompanies which have a strong market position,ability to increase margins as well as to growearnings going forward.
Portfolio ManagementPatrick Kolb is working since June 2005 as a Portfolio Manager at Credit Suisse in Global Equities. After graduation in 2001 in majorfinance at University of Zurich, he was a PhD-Student and a Research Assistant at the Swiss Banking Institute of the University of Zurich.He finished his doctorate in 2005.
2) If not expressly indicated otherwise, all quantitative data contained in this comment is based on Lipper, Bloomberg or Datastream.
78
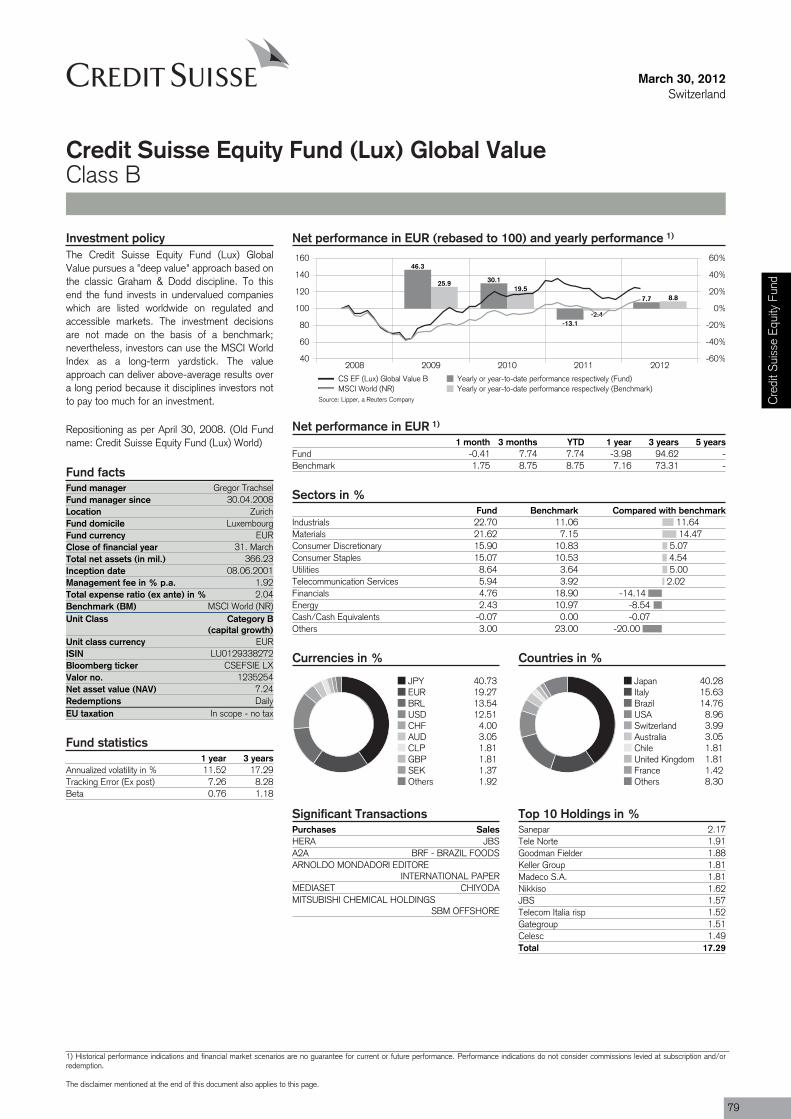
11.6414.47
5.074.545.00
2.02-14.14
-8.54-0.07
-20.00
Purchases SalesHERA JBSA2A BRF - BRAZIL FOODSARNOLDO MONDADORI EDITORE
INTERNATIONAL PAPERMEDIASET CHIYODAMITSUBISHI CHEMICAL HOLDINGS
SBM OFFSHORE
Fund manager Gregor TrachselFund manager since 30.04.2008Location ZurichFund domicile LuxembourgFund currency EURClose of financial year 31. MarchTotal net assets (in mil.) 366.23Inception date 08.06.2001Management fee in % p.a. 1.92Total expense ratio (ex ante) in % 2.04Benchmark (BM) MSCI World (NR)Unit Class Category B
(capital growth)
ISIN LU0129338272
Valor no. 1235254
Redemptions DailyEU taxation In scope - no tax
March 30, 2012Switzerland
Credit Suisse Equity Fund (Lux) Global ValueClass B
Net performance in EUR (rebased to 100) and yearly performance 1)
2008 2009 2010 2011 201240
60
80
100
120
140
160
-60%
-40%
-20%
0%
20%
40%
60%46.3
30.1
-13.1
7.7
25.919.5
-2.4
8.8
CS EF (Lux) Global Value B Yearly or year-to-date performance respectively (Fund)MSCI World (NR) Yearly or year-to-date performance respectively (Benchmark)
Net performance in EUR 1)
1 month 3 months YTD 1 year 3 years 5 yearsFund -0.41 7.74 7.74 -3.98 94.62 -Benchmark 1.75 8.75 8.75 7.16 73.31 -
Sectors in %Fund Benchmark Compared with benchmark
Industrials 22.70 11.06Materials 21.62 7.15Consumer Discretionary 15.90 10.83Consumer Staples 15.07 10.53Utilities 8.64 3.64Telecommunication Services 5.94 3.92Financials 4.76 18.90Energy 2.43 10.97Cash/Cash Equivalents -0.07 0.00Others 3.00 23.00
Currencies in %
JPY 40.73EUR 19.27BRL 13.54USD 12.51CHF 4.00AUD 3.05CLP 1.81GBP 1.81SEK 1.37Others 1.92
Countries in %
Japan 40.28Italy 15.63Brazil 14.76USA 8.96Switzerland 3.99Australia 3.05Chile 1.81United Kingdom 1.81France 1.42Others 8.30
Top 10 Holdings in %Sanepar 2.17Tele Norte 1.91Goodman Fielder 1.88Keller Group 1.81Madeco S.A. 1.81Nikkiso 1.62JBS 1.57Telecom Italia risp 1.52Gategroup 1.51Celesc 1.49Total 17.29
Significant Transactions
Investment policyThe Credit Suisse Equity Fund (Lux) GlobalValue pursues a "deep value" approach based onthe classic Graham & Dodd discipline. To thisend the fund invests in undervalued companieswhich are listed worldwide on regulated andaccessible markets. The investment decisionsare not made on the basis of a benchmark;nevertheless, investors can use the MSCI WorldIndex as a long-term yardstick. The valueapproach can deliver above-average results overa long period because it disciplines investors notto pay too much for an investment.
Repositioning as per April 30, 2008. (Old Fundname: Credit Suisse Equity Fund (Lux) World)
Fund facts
Unit class currency EUR
Bloomberg ticker CSEFSIE LX
Net asset value (NAV) 7.24
Fund statistics1 year 3 years
Annualized volatility in % 11.52 17.29Tracking Error (Ex post) 7.26 8.28Beta 0.76 1.18
Source: Lipper, a Reuters Company Cre
dit S
uiss
e Eq
uity
Fun
d
1) Historical performance indications and financial market scenarios are no guarantee for current or future performance. Performance indications do not consider commissions levied at subscription and/orredemption.
The disclaimer mentioned at the end of this document also applies to this page.
79

March 30, 2012Switzerland
Credit Suisse Equity Fund (Lux) Global ValueClass B
Review previous quarter 2)
Performance: Net asset value (I-shares) rose by7.92% in Q1 2012. Since April 30, 2008, whenthe Fund became responsibility of the ValueTeam, it has compounded at an annual net returnrate of 6.95%.
Transactions: Very little changes were made inthe portfolio during Q1 2012. We established
one new position in an Italian diversified regionalutility. Furthermore we accumulated shares in avariety of existing portfolio holdings. None weresold. The cash balance remains low at less than1% of AuM.
Corporate actions / mergers and acquisitions:There were no major events affecting our
portfolio companies during the reporting period.
Commentary: There were no noteworthy issueswhich may have impacted portfolio strategy orstructure in Q1 2012. For more topics andissues, please consult the separate quarterlycommentary on the global strategy.
Outlook for the market 2)
The medium- to long-term strategy (5-10 years)followed by the Fund places its emphasis on fourmain investment situations:
First, we select companies in industries whosemargins get temporarily squeezed by rising inputcosts (chemicals, packaging and foodprocessors, among others). With a time lag, theshrewd competitors in this space typically findways to apply stringent cost control and/or adjustpricing to a level that will restore, or at leastapproach, historic margins.
Second, we select companies experiencingcyclical weakness triggered by the
macroeconomic slowdown (e.g., machinery,engineering and commercial services). For theinvestor who is willing to look patiently over thecourse of an entire cycle, as we are, somebusinesses now appear too cheap given theirentrenched market positions and healthy balancesheets.
Third, we select companies in industries facingstructural issues that require a fundamentaltransformation in strategy and execution (e.g.,traditional media, advertising services, basicmaterials, certain utility services). Here, themarket now and then tends to over-discount thevalue of legacy-burdened incumbents while
placing heavy bets on newcomers with a cleanslate. Taking history as a guide, sometimes itturns out that late-movers with deep pocketsmay in the end prevail against an aggressive newentrant.
Last but not least, at these prices we also likeselect owners of land (forestry, agriculture, realestate). These equities have sold off due to theslump in global real estate finance. However,we believe that their long-term benefits asinflation-protected assets far outweigh thoseshorter-term concerns.
Portfolio ManagementGregor P. Trachsel, Director, is in charge of Value Investments within the Global Equity Team in Zurich. He joined Credit Suisse in 2008from M.M. Warburg Bank (Switzerland) Ltd. Zurich, where he was investment manager for value-based equity portfolios. Prior to that, heheld several positions in the Banking industry as investment manager and buy-side analyst. He holds an MBA from the Columbia UniversityGraduate School of Business, New York, in Accounting (Security Analysis) and Finance (Money Management).
2) If not expressly indicated otherwise, all quantitative data contained in this comment is based on Lipper, Bloomberg or Datastream.
80
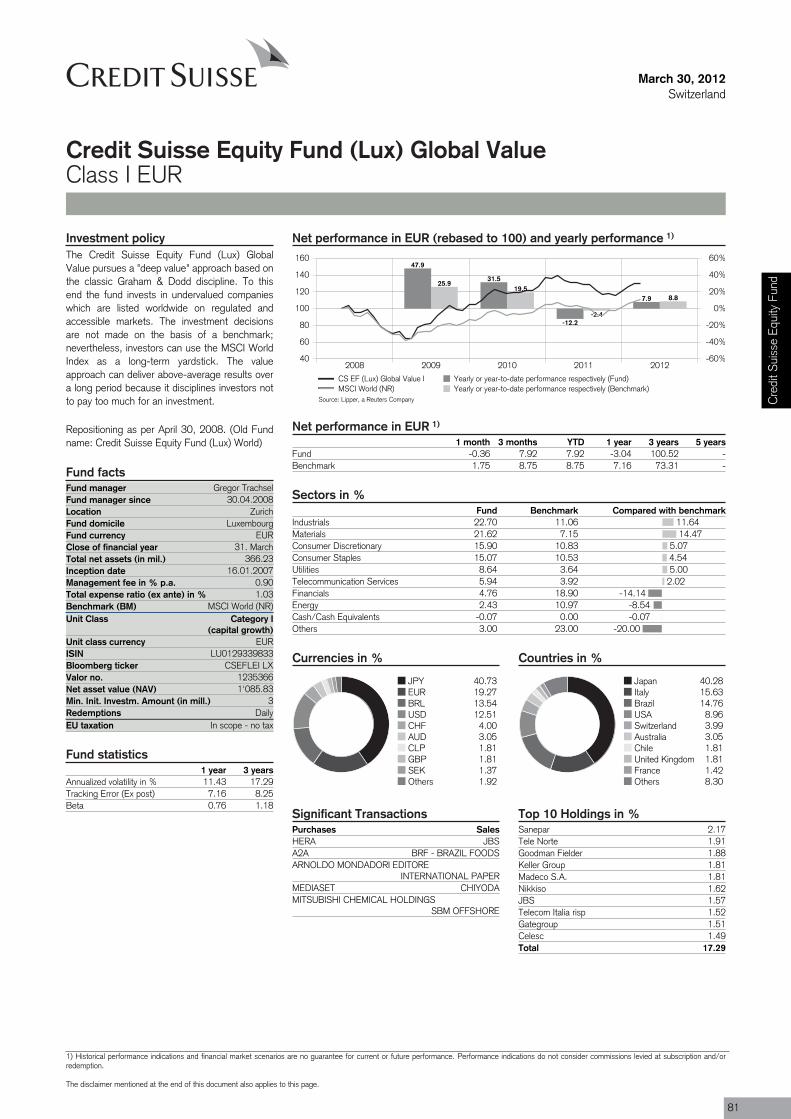
11.6414.47
5.074.545.00
2.02-14.14
-8.54-0.07
-20.00
Purchases SalesHERA JBSA2A BRF - BRAZIL FOODSARNOLDO MONDADORI EDITORE
INTERNATIONAL PAPERMEDIASET CHIYODAMITSUBISHI CHEMICAL HOLDINGS
SBM OFFSHORE
Fund manager Gregor TrachselFund manager since 30.04.2008Location ZurichFund domicile LuxembourgFund currency EURClose of financial year 31. MarchTotal net assets (in mil.) 366.23Inception date 16.01.2007Management fee in % p.a. 0.90Total expense ratio (ex ante) in % 1.03Benchmark (BM) MSCI World (NR)Unit Class Category I
(capital growth)
ISIN LU0129339833
Valor no. 1235366
Min. Init. Investm. Amount (in mill.) 3Redemptions DailyEU taxation In scope - no tax
March 30, 2012Switzerland
Credit Suisse Equity Fund (Lux) Global ValueClass I EUR
Net performance in EUR (rebased to 100) and yearly performance 1)
2008 2009 2010 2011 201240
60
80
100
120
140
160
-60%
-40%
-20%
0%
20%
40%
60%47.9
31.5
-12.2
7.9
25.919.5
-2.4
8.8
CS EF (Lux) Global Value I Yearly or year-to-date performance respectively (Fund)MSCI World (NR) Yearly or year-to-date performance respectively (Benchmark)
Net performance in EUR 1)
1 month 3 months YTD 1 year 3 years 5 yearsFund -0.36 7.92 7.92 -3.04 100.52 -Benchmark 1.75 8.75 8.75 7.16 73.31 -
Sectors in %Fund Benchmark Compared with benchmark
Industrials 22.70 11.06Materials 21.62 7.15Consumer Discretionary 15.90 10.83Consumer Staples 15.07 10.53Utilities 8.64 3.64Telecommunication Services 5.94 3.92Financials 4.76 18.90Energy 2.43 10.97Cash/Cash Equivalents -0.07 0.00Others 3.00 23.00
Currencies in %
JPY 40.73EUR 19.27BRL 13.54USD 12.51CHF 4.00AUD 3.05CLP 1.81GBP 1.81SEK 1.37Others 1.92
Countries in %
Japan 40.28Italy 15.63Brazil 14.76USA 8.96Switzerland 3.99Australia 3.05Chile 1.81United Kingdom 1.81France 1.42Others 8.30
Top 10 Holdings in %Sanepar 2.17Tele Norte 1.91Goodman Fielder 1.88Keller Group 1.81Madeco S.A. 1.81Nikkiso 1.62JBS 1.57Telecom Italia risp 1.52Gategroup 1.51Celesc 1.49Total 17.29
Significant Transactions
Investment policyThe Credit Suisse Equity Fund (Lux) GlobalValue pursues a "deep value" approach based onthe classic Graham & Dodd discipline. To thisend the fund invests in undervalued companieswhich are listed worldwide on regulated andaccessible markets. The investment decisionsare not made on the basis of a benchmark;nevertheless, investors can use the MSCI WorldIndex as a long-term yardstick. The valueapproach can deliver above-average results overa long period because it disciplines investors notto pay too much for an investment.
Repositioning as per April 30, 2008. (Old Fundname: Credit Suisse Equity Fund (Lux) World)
Fund facts
Unit class currency EUR
Bloomberg ticker CSEFLEI LX
Net asset value (NAV) 1'085.83
Fund statistics1 year 3 years
Annualized volatility in % 11.43 17.29Tracking Error (Ex post) 7.16 8.25Beta 0.76 1.18
Source: Lipper, a Reuters Company Cre
dit S
uiss
e Eq
uity
Fun
d
1) Historical performance indications and financial market scenarios are no guarantee for current or future performance. Performance indications do not consider commissions levied at subscription and/orredemption.
The disclaimer mentioned at the end of this document also applies to this page.
81

March 30, 2012Switzerland
Credit Suisse Equity Fund (Lux) Global ValueClass I EUR
Review previous quarter 2)
Performance: Net asset value (I-shares) rose by7.92% in Q1 2012. Since April 30, 2008, whenthe Fund became responsibility of the ValueTeam, it has compounded at an annual net returnrate of 6.95%.
Transactions: Very little changes were made inthe portfolio during Q1 2012. We established
one new position in an Italian diversified regionalutility. Furthermore we accumulated shares in avariety of existing portfolio holdings. None weresold. The cash balance remains low at less than1% of AuM.
Corporate actions / mergers and acquisitions:There were no major events affecting our
portfolio companies during the reporting period.
Commentary: There were no noteworthy issueswhich may have impacted portfolio strategy orstructure in Q1 2012. For more topics andissues, please consult the separate quarterlycommentary on the global strategy.
Outlook for the market 2)
The medium- to long-term strategy (5-10 years)followed by the Fund places its emphasis on fourmain investment situations:
First, we select companies in industries whosemargins get temporarily squeezed by rising inputcosts (chemicals, packaging and foodprocessors, among others). With a time lag, theshrewd competitors in this space typically findways to apply stringent cost control and/or adjustpricing to a level that will restore, or at leastapproach, historic margins.
Second, we select companies experiencingcyclical weakness triggered by the
macroeconomic slowdown (e.g., machinery,engineering and commercial services). For theinvestor who is willing to look patiently over thecourse of an entire cycle, as we are, somebusinesses now appear too cheap given theirentrenched market positions and healthy balancesheets.
Third, we select companies in industries facingstructural issues that require a fundamentaltransformation in strategy and execution (e.g.,traditional media, advertising services, basicmaterials, certain utility services). Here, themarket now and then tends to over-discount thevalue of legacy-burdened incumbents while
placing heavy bets on newcomers with a cleanslate. Taking history as a guide, sometimes itturns out that late-movers with deep pocketsmay in the end prevail against an aggressive newentrant.
Last but not least, at these prices we also likeselect owners of land (forestry, agriculture, realestate). These equities have sold off due to theslump in global real estate finance. However,we believe that their long-term benefits asinflation-protected assets far outweigh thoseshorter-term concerns.
Portfolio ManagementGregor P. Trachsel, Director, is in charge of Value Investments within the Global Equity Team in Zurich. He joined Credit Suisse in 2008from M.M. Warburg Bank (Switzerland) Ltd. Zurich, where he was investment manager for value-based equity portfolios. Prior to that, heheld several positions in the Banking industry as investment manager and buy-side analyst. He holds an MBA from the Columbia UniversityGraduate School of Business, New York, in Accounting (Security Analysis) and Finance (Money Management).
2) If not expressly indicated otherwise, all quantitative data contained in this comment is based on Lipper, Bloomberg or Datastream.
82

Purchases SalesHERA JBSA2A BRF - BRAZIL FOODSARNOLDO MONDADORI EDITORE
INTERNATIONAL PAPERMEDIASET CHIYODAMITSUBISHI CHEMICAL HOLDINGS
SBM OFFSHORE
Fund manager Gregor TrachselFund manager since 30.04.2008Location ZurichFund domicile LuxembourgFund currency EURClose of financial year 31. MarchTotal net assets (in mil.) 366.23Inception date 18.10.2006Management fee in % p.a. 1.92Total expense ratio (ex ante) in % 2.02Unit Class Category R
(capital growth / hedged)
ISIN LU0268334421
Valor no. 2705191
Redemptions DailyEU taxation In scope - no tax
March 30, 2012Switzerland
Credit Suisse Equity Fund (Lux) Global ValueClass R CHF
Net performance in CHF (rebased to 100) and yearly performance 1)
2008 2009 2010 2011 201260
80
100
120
140
160
-40%
-20%
0%
20%
40%
60%45.0
28.7
-14.5
7.4
CS EF (Lux) Global Value R CHF Yearly or year-to-date performance respectively (Fund)
Net performance in CHF 1)
1 month 3 months YTD 1 year 3 years 5 yearsFund -0.40 7.40 7.40 -5.55 88.00 -
Sectors in %Fund
Industrials 22.70Materials 21.62Consumer Discretionary 15.90Consumer Staples 15.07Utilities 8.64Telecommunication Services 5.94Financials 4.76Energy 2.43Cash/Cash Equivalents -0.07Others 3.00
Currencies in %
JPY 40.73EUR 19.27BRL 13.54USD 12.51CHF 4.00AUD 3.05CLP 1.81GBP 1.81SEK 1.37Others 1.92
In addition to the currency table shown above, for this class,hedging strategies, by means of forward foreign exchangetransactions, are implemented to protect the class currencyagainst currency fluctuations of the fund's reference currency.This may substantially protect investors against a decrease in thevalue of the fund's reference currency relative to the hedgedclass currency, but it may also preclude investors from benefitingfrom an increase in the value of the fund's currency.
Countries in %
Japan 40.28Italy 15.63Brazil 14.76USA 8.96Switzerland 3.99Australia 3.05Chile 1.81United Kingdom 1.81France 1.42Others 8.30
Top 10 Holdings in %Sanepar 2.17Tele Norte 1.91Goodman Fielder 1.88Keller Group 1.81Madeco S.A. 1.81Nikkiso 1.62JBS 1.57Telecom Italia risp 1.52Gategroup 1.51Celesc 1.49Total 17.29
Significant Transactions
Investment policyThe Credit Suisse Equity Fund (Lux) GlobalValue pursues a "deep value" approach based onthe classic Graham & Dodd discipline. To thisend the fund invests in undervalued companieswhich are listed worldwide on regulated andaccessible markets. The investment decisionsare not made on the basis of a benchmark;nevertheless, investors can use the MSCI WorldIndex as a long-term yardstick. The valueapproach can deliver above-average results overa long period because it disciplines investors notto pay too much for an investment.
Repositioning as per April 30, 2008. (Old Fundname: Credit Suisse Equity Fund (Lux) World)
Fund facts
Unit class currency CHF
Bloomberg ticker CSEFWRC LX
Net asset value (NAV) 9.87
Fund statistics1 year 3 years
Annualized volatility in % 11.59 17.34Tracking Error (Ex post) 14.39 13.95Beta 0.33 0.67
Source: Lipper, a Reuters Company
Cre
dit S
uiss
e Eq
uity
Fun
d
1) Historical performance indications and financial market scenarios are no guarantee for current or future performance. Performance indications do not consider commissions levied at subscription and/orredemption.
The disclaimer mentioned at the end of this document also applies to this page.
83
March 30, 2012Switzerland
Credit Suisse Equity Fund (Lux) Global ValueClass R CHF
Review previous quarter 2)
Performance: Net asset value (I-shares) rose by7.92% in Q1 2012. Since April 30, 2008, whenthe Fund became responsibility of the ValueTeam, it has compounded at an annual net returnrate of 6.95%.
Transactions: Very little changes were made inthe portfolio during Q1 2012. We established
one new position in an Italian diversified regionalutility. Furthermore we accumulated shares in avariety of existing portfolio holdings. None weresold. The cash balance remains low at less than1% of AuM.
Corporate actions / mergers and acquisitions:There were no major events affecting our
portfolio companies during the reporting period.
Commentary: There were no noteworthy issueswhich may have impacted portfolio strategy orstructure in Q1 2012. For more topics andissues, please consult the separate quarterlycommentary on the global strategy.
Outlook for the market 2)
The medium- to long-term strategy (5-10 years)followed by the Fund places its emphasis on fourmain investment situations:
First, we select companies in industries whosemargins get temporarily squeezed by rising inputcosts (chemicals, packaging and foodprocessors, among others). With a time lag, theshrewd competitors in this space typically findways to apply stringent cost control and/or adjustpricing to a level that will restore, or at leastapproach, historic margins.
Second, we select companies experiencingcyclical weakness triggered by the
macroeconomic slowdown (e.g., machinery,engineering and commercial services). For theinvestor who is willing to look patiently over thecourse of an entire cycle, as we are, somebusinesses now appear too cheap given theirentrenched market positions and healthy balancesheets.
Third, we select companies in industries facingstructural issues that require a fundamentaltransformation in strategy and execution (e.g.,traditional media, advertising services, basicmaterials, certain utility services). Here, themarket now and then tends to over-discount thevalue of legacy-burdened incumbents while
placing heavy bets on newcomers with a cleanslate. Taking history as a guide, sometimes itturns out that late-movers with deep pocketsmay in the end prevail against an aggressive newentrant.
Last but not least, at these prices we also likeselect owners of land (forestry, agriculture, realestate). These equities have sold off due to theslump in global real estate finance. However,we believe that their long-term benefits asinflation-protected assets far outweigh thoseshorter-term concerns.
Portfolio ManagementGregor P. Trachsel, Director, is in charge of Value Investments within the Global Equity Team in Zurich. He joined Credit Suisse in 2008from M.M. Warburg Bank (Switzerland) Ltd. Zurich, where he was investment manager for value-based equity portfolios. Prior to that, heheld several positions in the Banking industry as investment manager and buy-side analyst. He holds an MBA from the Columbia UniversityGraduate School of Business, New York, in Accounting (Security Analysis) and Finance (Money Management).
2) If not expressly indicated otherwise, all quantitative data contained in this comment is based on Lipper, Bloomberg or Datastream.
84
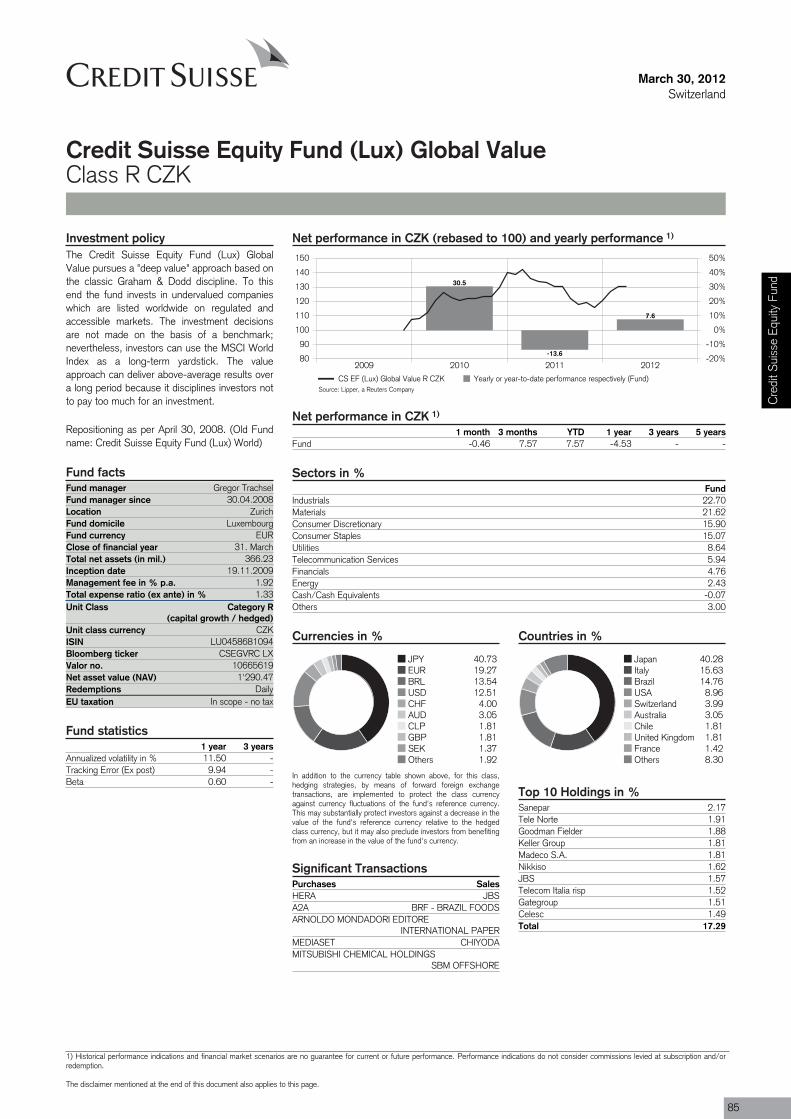
Purchases SalesHERA JBSA2A BRF - BRAZIL FOODSARNOLDO MONDADORI EDITORE
INTERNATIONAL PAPERMEDIASET CHIYODAMITSUBISHI CHEMICAL HOLDINGS
SBM OFFSHORE
Fund manager Gregor TrachselFund manager since 30.04.2008Location ZurichFund domicile LuxembourgFund currency EURClose of financial year 31. MarchTotal net assets (in mil.) 366.23Inception date 19.11.2009Management fee in % p.a. 1.92Total expense ratio (ex ante) in % 1.33Unit Class Category R
(capital growth / hedged)
ISIN LU0458681094
Valor no. 10665619
Redemptions DailyEU taxation In scope - no tax
March 30, 2012Switzerland
Credit Suisse Equity Fund (Lux) Global ValueClass R CZK
Net performance in CZK (rebased to 100) and yearly performance 1)
2009 2010 2011 201280
90
100
110
120
130
140
150
-20%
-10%
0%
10%
20%
30%
40%
50%
30.5
-13.6
7.6
CS EF (Lux) Global Value R CZK Yearly or year-to-date performance respectively (Fund)
Net performance in CZK 1)
1 month 3 months YTD 1 year 3 years 5 yearsFund -0.46 7.57 7.57 -4.53 - -
Sectors in %Fund
Industrials 22.70Materials 21.62Consumer Discretionary 15.90Consumer Staples 15.07Utilities 8.64Telecommunication Services 5.94Financials 4.76Energy 2.43Cash/Cash Equivalents -0.07Others 3.00
Currencies in %
JPY 40.73EUR 19.27BRL 13.54USD 12.51CHF 4.00AUD 3.05CLP 1.81GBP 1.81SEK 1.37Others 1.92
In addition to the currency table shown above, for this class,hedging strategies, by means of forward foreign exchangetransactions, are implemented to protect the class currencyagainst currency fluctuations of the fund's reference currency.This may substantially protect investors against a decrease in thevalue of the fund's reference currency relative to the hedgedclass currency, but it may also preclude investors from benefitingfrom an increase in the value of the fund's currency.
Countries in %
Japan 40.28Italy 15.63Brazil 14.76USA 8.96Switzerland 3.99Australia 3.05Chile 1.81United Kingdom 1.81France 1.42Others 8.30
Top 10 Holdings in %Sanepar 2.17Tele Norte 1.91Goodman Fielder 1.88Keller Group 1.81Madeco S.A. 1.81Nikkiso 1.62JBS 1.57Telecom Italia risp 1.52Gategroup 1.51Celesc 1.49Total 17.29
Significant Transactions
Investment policyThe Credit Suisse Equity Fund (Lux) GlobalValue pursues a "deep value" approach based onthe classic Graham & Dodd discipline. To thisend the fund invests in undervalued companieswhich are listed worldwide on regulated andaccessible markets. The investment decisionsare not made on the basis of a benchmark;nevertheless, investors can use the MSCI WorldIndex as a long-term yardstick. The valueapproach can deliver above-average results overa long period because it disciplines investors notto pay too much for an investment.
Repositioning as per April 30, 2008. (Old Fundname: Credit Suisse Equity Fund (Lux) World)
Fund facts
Unit class currency CZK
Bloomberg ticker CSEGVRC LX
Net asset value (NAV) 1'290.47
Fund statistics1 year 3 years
Annualized volatility in % 11.50 -Tracking Error (Ex post) 9.94 -Beta 0.60 -
Source: Lipper, a Reuters Company
Cre
dit S
uiss
e Eq
uity
Fun
d
1) Historical performance indications and financial market scenarios are no guarantee for current or future performance. Performance indications do not consider commissions levied at subscription and/orredemption.
The disclaimer mentioned at the end of this document also applies to this page.
85

March 30, 2012Switzerland
Credit Suisse Equity Fund (Lux) Global ValueClass R CZK
Review previous quarter 2)
Performance: Net asset value (I-shares) rose by7.92% in Q1 2012. Since April 30, 2008, whenthe Fund became responsibility of the ValueTeam, it has compounded at an annual net returnrate of 6.95%.
Transactions: Very little changes were made inthe portfolio during Q1 2012. We established
one new position in an Italian diversified regionalutility. Furthermore we accumulated shares in avariety of existing portfolio holdings. None weresold. The cash balance remains low at less than1% of AuM.
Corporate actions / mergers and acquisitions:There were no major events affecting our
portfolio companies during the reporting period.
Commentary: There were no noteworthy issueswhich may have impacted portfolio strategy orstructure in Q1 2012. For more topics andissues, please consult the separate quarterlycommentary on the global strategy.
Outlook for the market 2)
The medium- to long-term strategy (5-10 years)followed by the Fund places its emphasis on fourmain investment situations:
First, we select companies in industries whosemargins get temporarily squeezed by rising inputcosts (chemicals, packaging and foodprocessors, among others). With a time lag, theshrewd competitors in this space typically findways to apply stringent cost control and/or adjustpricing to a level that will restore, or at leastapproach, historic margins.
Second, we select companies experiencingcyclical weakness triggered by the
macroeconomic slowdown (e.g., machinery,engineering and commercial services). For theinvestor who is willing to look patiently over thecourse of an entire cycle, as we are, somebusinesses now appear too cheap given theirentrenched market positions and healthy balancesheets.
Third, we select companies in industries facingstructural issues that require a fundamentaltransformation in strategy and execution (e.g.,traditional media, advertising services, basicmaterials, certain utility services). Here, themarket now and then tends to over-discount thevalue of legacy-burdened incumbents while
placing heavy bets on newcomers with a cleanslate. Taking history as a guide, sometimes itturns out that late-movers with deep pocketsmay in the end prevail against an aggressive newentrant.
Last but not least, at these prices we also likeselect owners of land (forestry, agriculture, realestate). These equities have sold off due to theslump in global real estate finance. However,we believe that their long-term benefits asinflation-protected assets far outweigh thoseshorter-term concerns.
Portfolio ManagementGregor P. Trachsel, Director, is in charge of Value Investments within the Global Equity Team in Zurich. He joined Credit Suisse in 2008from M.M. Warburg Bank (Switzerland) Ltd. Zurich, where he was investment manager for value-based equity portfolios. Prior to that, heheld several positions in the Banking industry as investment manager and buy-side analyst. He holds an MBA from the Columbia UniversityGraduate School of Business, New York, in Accounting (Security Analysis) and Finance (Money Management).
2) If not expressly indicated otherwise, all quantitative data contained in this comment is based on Lipper, Bloomberg or Datastream.
86
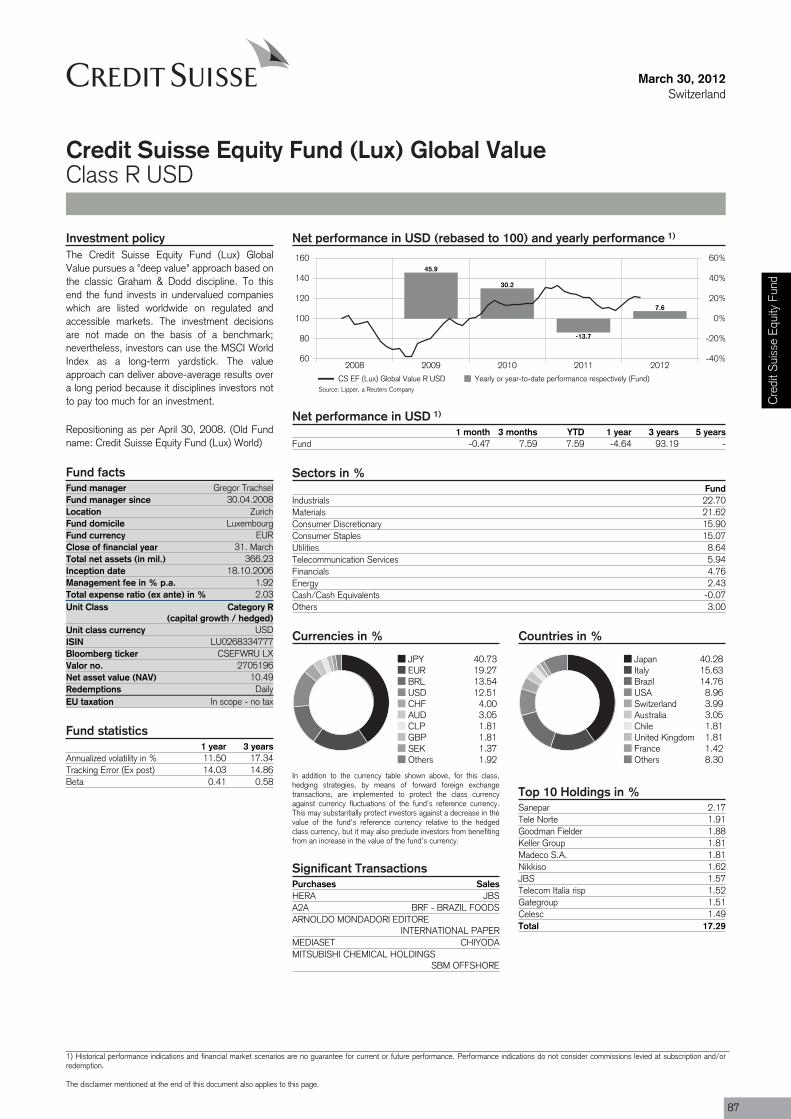
Purchases SalesHERA JBSA2A BRF - BRAZIL FOODSARNOLDO MONDADORI EDITORE
INTERNATIONAL PAPERMEDIASET CHIYODAMITSUBISHI CHEMICAL HOLDINGS
SBM OFFSHORE
Fund manager Gregor TrachselFund manager since 30.04.2008Location ZurichFund domicile LuxembourgFund currency EURClose of financial year 31. MarchTotal net assets (in mil.) 366.23Inception date 18.10.2006Management fee in % p.a. 1.92Total expense ratio (ex ante) in % 2.03Unit Class Category R
(capital growth / hedged)
ISIN LU0268334777
Valor no. 2705196
Redemptions DailyEU taxation In scope - no tax
March 30, 2012Switzerland
Credit Suisse Equity Fund (Lux) Global ValueClass R USD
Net performance in USD (rebased to 100) and yearly performance 1)
2008 2009 2010 2011 201260
80
100
120
140
160
-40%
-20%
0%
20%
40%
60%45.9
30.2
-13.7
7.6
CS EF (Lux) Global Value R USD Yearly or year-to-date performance respectively (Fund)
Net performance in USD 1)
1 month 3 months YTD 1 year 3 years 5 yearsFund -0.47 7.59 7.59 -4.64 93.19 -
Sectors in %Fund
Industrials 22.70Materials 21.62Consumer Discretionary 15.90Consumer Staples 15.07Utilities 8.64Telecommunication Services 5.94Financials 4.76Energy 2.43Cash/Cash Equivalents -0.07Others 3.00
Currencies in %
JPY 40.73EUR 19.27BRL 13.54USD 12.51CHF 4.00AUD 3.05CLP 1.81GBP 1.81SEK 1.37Others 1.92
In addition to the currency table shown above, for this class,hedging strategies, by means of forward foreign exchangetransactions, are implemented to protect the class currencyagainst currency fluctuations of the fund's reference currency.This may substantially protect investors against a decrease in thevalue of the fund's reference currency relative to the hedgedclass currency, but it may also preclude investors from benefitingfrom an increase in the value of the fund's currency.
Countries in %
Japan 40.28Italy 15.63Brazil 14.76USA 8.96Switzerland 3.99Australia 3.05Chile 1.81United Kingdom 1.81France 1.42Others 8.30
Top 10 Holdings in %Sanepar 2.17Tele Norte 1.91Goodman Fielder 1.88Keller Group 1.81Madeco S.A. 1.81Nikkiso 1.62JBS 1.57Telecom Italia risp 1.52Gategroup 1.51Celesc 1.49Total 17.29
Significant Transactions
Investment policyThe Credit Suisse Equity Fund (Lux) GlobalValue pursues a "deep value" approach based onthe classic Graham & Dodd discipline. To thisend the fund invests in undervalued companieswhich are listed worldwide on regulated andaccessible markets. The investment decisionsare not made on the basis of a benchmark;nevertheless, investors can use the MSCI WorldIndex as a long-term yardstick. The valueapproach can deliver above-average results overa long period because it disciplines investors notto pay too much for an investment.
Repositioning as per April 30, 2008. (Old Fundname: Credit Suisse Equity Fund (Lux) World)
Fund facts
Unit class currency USD
Bloomberg ticker CSEFWRU LX
Net asset value (NAV) 10.49
Fund statistics1 year 3 years
Annualized volatility in % 11.50 17.34Tracking Error (Ex post) 14.03 14.86Beta 0.41 0.58
Source: Lipper, a Reuters Company
Cre
dit S
uiss
e Eq
uity
Fun
d
1) Historical performance indications and financial market scenarios are no guarantee for current or future performance. Performance indications do not consider commissions levied at subscription and/orredemption.
The disclaimer mentioned at the end of this document also applies to this page.
87

March 30, 2012Switzerland
Credit Suisse Equity Fund (Lux) Global ValueClass R USD
Review previous quarter 2)
Performance: Net asset value (I-shares) rose by7.92% in Q1 2012. Since April 30, 2008, whenthe Fund became responsibility of the ValueTeam, it has compounded at an annual net returnrate of 6.95%.
Transactions: Very little changes were made inthe portfolio during Q1 2012. We established
one new position in an Italian diversified regionalutility. Furthermore we accumulated shares in avariety of existing portfolio holdings. None weresold. The cash balance remains low at less than1% of AuM.
Corporate actions / mergers and acquisitions:There were no major events affecting our
portfolio companies during the reporting period.
Commentary: There were no noteworthy issueswhich may have impacted portfolio strategy orstructure in Q1 2012. For more topics andissues, please consult the separate quarterlycommentary on the global strategy.
Outlook for the market 2)
The medium- to long-term strategy (5-10 years)followed by the Fund places its emphasis on fourmain investment situations:
First, we select companies in industries whosemargins get temporarily squeezed by rising inputcosts (chemicals, packaging and foodprocessors, among others). With a time lag, theshrewd competitors in this space typically findways to apply stringent cost control and/or adjustpricing to a level that will restore, or at leastapproach, historic margins.
Second, we select companies experiencingcyclical weakness triggered by the
macroeconomic slowdown (e.g., machinery,engineering and commercial services). For theinvestor who is willing to look patiently over thecourse of an entire cycle, as we are, somebusinesses now appear too cheap given theirentrenched market positions and healthy balancesheets.
Third, we select companies in industries facingstructural issues that require a fundamentaltransformation in strategy and execution (e.g.,traditional media, advertising services, basicmaterials, certain utility services). Here, themarket now and then tends to over-discount thevalue of legacy-burdened incumbents while
placing heavy bets on newcomers with a cleanslate. Taking history as a guide, sometimes itturns out that late-movers with deep pocketsmay in the end prevail against an aggressive newentrant.
Last but not least, at these prices we also likeselect owners of land (forestry, agriculture, realestate). These equities have sold off due to theslump in global real estate finance. However,we believe that their long-term benefits asinflation-protected assets far outweigh thoseshorter-term concerns.
Portfolio ManagementGregor P. Trachsel, Director, is in charge of Value Investments within the Global Equity Team in Zurich. He joined Credit Suisse in 2008from M.M. Warburg Bank (Switzerland) Ltd. Zurich, where he was investment manager for value-based equity portfolios. Prior to that, heheld several positions in the Banking industry as investment manager and buy-side analyst. He holds an MBA from the Columbia UniversityGraduate School of Business, New York, in Accounting (Security Analysis) and Finance (Money Management).
2) If not expressly indicated otherwise, all quantitative data contained in this comment is based on Lipper, Bloomberg or Datastream.
88

Purchases SalesBANCO POPOLARE INTESA SANPAOLOFINMECCANICA ASSICURAZIONI GENERALIUNICREDIT UNICREDITHERA MEDIOBANCA- ENI
Fund manager Stefano AndreaniFund manager since 14.01.2008Location MilanoFund domicile LuxembourgFund currency EURClose of financial year 31. MarchTotal net assets (in mil.) 38.64Inception date 25.09.1992Management fee in % p.a. 1.92Total expense ratio (ex ante) in % 2.13Benchmark (BM) MSCI Italy 10/40 (NR) (07/11)Unit Class Category B
(capital growth)
ISIN LU0055733355
Valor no. 349537
Redemptions DailyEU taxation In scope - no tax
March 30, 2012Switzerland
Credit Suisse Equity Fund (Lux) ItalyClass B
Net performance in EUR (rebased to 100) and yearly performance 1)
2007 2008 2009 2010 2011 201240
60
80
100
120
140
-60%
-40%
-20%
0%
20%
40%
-5.9
-44.6
23.2
-5.2
-22.9
10.0
-4.3
-47.4
22.6
-9.1
-25.4
9.5
CS EF (Lux) Italy B Yearly or year-to-date performance respectively (Fund)MSCI Italy 10/40 (NR) (07/11) Yearly or year-to-date performance respectively (Benchmark)
Net performance in EUR 1)
1 month 3 months YTD 1 year 3 years 5 yearsFund -1.90 10.00 10.00 -19.65 15.41 -49.58Benchmark -2.56 9.51 9.51 -23.99 9.58 -54.12
Sectors in %Fund
Financials 37.67Industrials 18.73Consumer Discretionary 14.35Utilities 12.70Energy 10.62Telecommunication Services 3.38Consumer Staples 1.48Health Care 1.20Materials 0.46Cash/Cash Equivalents -0.60
Top 10 Holdings in %ENI 7.22Intesa Sanpaolo 7.13Assicurazioni Gen. 6.18Luxottica 5.15Unicredit Fin. 5.10Banco Pop. 5.02Atlantia 4.89Prysmian 4.74Enel 4.73Terna 4.68Total 54.84
Significant Transactions
Fund statistics3 years 5 years
Annualised volatility in % 22.46 21.85Tracking Error (Ex post) 2.94 3.07Beta 0.91 0.92
Investment policyThe aim of the Fund is to achieve the highestpossible capital growth by investing in leadingItalian companies characterised by highprofitability, a sound financial structure andsuccessful management.
Fund facts
Unit class currency EUR
Bloomberg ticker CRSITBI LX
Net asset value (NAV) 244.84
Source: Lipper, a Reuters Company Cre
dit S
uiss
e Eq
uity
Fun
d
1) Historical performance indications and financial market scenarios are no guarantee for current or future performance. Performance indications do not consider commissions levied at subscription and/orredemption.
The disclaimer mentioned at the end of this document also applies to this page.
89

March 30, 2012Switzerland
Credit Suisse Equity Fund (Lux) ItalyClass B
Review previous quarter 2)
The Italian equity market recorded a positive startto the year, with Q1 returns of +5.90% for theFTSEMIB, +7.25% for the FTSE All-Share and13.60% for the FTSE Small Cap. The quarterwas characterized by a very strong start, whichsaw the FTSEMIB rising 13.5% by mid-March. Asimilar (inverted) path was seen in the BTP-Bundspread, which narrowed from 512bps to a lowof 276bps, before close the quarter at around330bps.
At a sector level, the best performers were all inthe higher beta space: Capital Goods (+27.1%)Consumers (+24.5%), Cyclicals (+23.4%) andHoldings & Real Estate (+18.8%). Among thelaggards, were Utilities (-3.9%), Insurance andAsset Management (-2.8%) and Banks (-1.2%).
At a single stock level, the best performer ofthe quarter was Ferragamo (+52.6%), followed
by Banco Popolare (+42.2%), Finmeccanica(+42.1%), Parmalat (+40.8%) Prysmian(+37.3%) and Pirelli (37.1%). Among theweakest stocks, were many utilities: A2A(-17.2%), Enel (-13.7%), Enel Green Power(-11.7%), while Unicredit (-11.1%) were weakeron equity issuance and Mediaset (-3.3%) werelower on weak advertising figures.
Outlook for the market 2)
After a very good start to the year for Europe,and Italy in particular, some issues of concernare back on the mind of the market participants,impacting stock market performance. Thebiggest worries seem to be that of a possibleglobal economic slowdown, growing political riskin Europe and an increase in country specific riskfor Spain.
On the other hand, there are some positiveelements that cannot be ignored: aggressiveliquidity measures by the ECB, which marks astructural change of strategy and hasre-established the supply/demand balance onthe institutional market, a still sound position forMonti’s government and some encouraging
macroeconomic indicators (such as the Germanleading indicator) which point to a possiblerecovery in the second half of the year. TheEUR/USD back to around 1.30 is another factorthat should support exports, increasing activitylevels and giving a positive contribution to GDP.
Portfolio ManagementStefano Andreani, CFA, joined Credit Suisse Group in January 2008 in MACS Milan as Italian Equities Manager for mutual funds andEuropean Equities Portfolio Manager for Institutional Clients portfolios. From May 2003 to January 2007 he worked at Eurizon Capital(Sanpaolo AM), initially on an internship, but from February 2004 as Assistant Portfolio Manager on balanced portfolios for institutionalclients. In March 2005, he assumed direct responsibility for managing Italian and European equities. Mr. Andreani graduated in Institutionsand Financial Markets (CLEFIN) from the Università Commerciale Luigi Bocconi in April 2003.
2) If not expressly indicated otherwise, all quantitative data contained in this comment is based on Lipper, Bloomberg or Datastream.
90
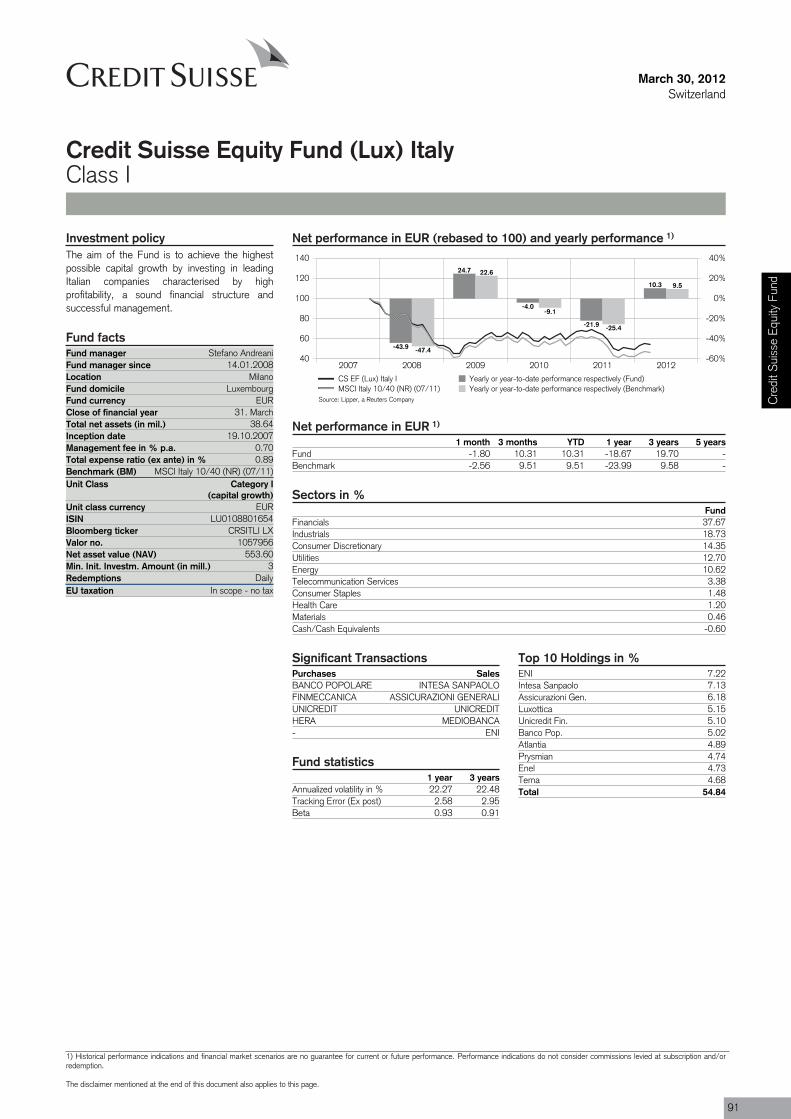
Purchases SalesBANCO POPOLARE INTESA SANPAOLOFINMECCANICA ASSICURAZIONI GENERALIUNICREDIT UNICREDITHERA MEDIOBANCA- ENI
Fund manager Stefano AndreaniFund manager since 14.01.2008Location MilanoFund domicile LuxembourgFund currency EURClose of financial year 31. MarchTotal net assets (in mil.) 38.64Inception date 19.10.2007Management fee in % p.a. 0.70Total expense ratio (ex ante) in % 0.89Benchmark (BM) MSCI Italy 10/40 (NR) (07/11)Unit Class Category I
(capital growth)
ISIN LU0108801654
Valor no. 1057956
Min. Init. Investm. Amount (in mill.) 3Redemptions DailyEU taxation In scope - no tax
March 30, 2012Switzerland
Credit Suisse Equity Fund (Lux) ItalyClass I
Net performance in EUR (rebased to 100) and yearly performance 1)
2007 2008 2009 2010 2011 201240
60
80
100
120
140
-60%
-40%
-20%
0%
20%
40%
-43.9
24.7
-4.0
-21.9
10.3
-47.4
22.6
-9.1
-25.4
9.5
CS EF (Lux) Italy I Yearly or year-to-date performance respectively (Fund)MSCI Italy 10/40 (NR) (07/11) Yearly or year-to-date performance respectively (Benchmark)
Net performance in EUR 1)
1 month 3 months YTD 1 year 3 years 5 yearsFund -1.80 10.31 10.31 -18.67 19.70 -Benchmark -2.56 9.51 9.51 -23.99 9.58 -
Sectors in %Fund
Financials 37.67Industrials 18.73Consumer Discretionary 14.35Utilities 12.70Energy 10.62Telecommunication Services 3.38Consumer Staples 1.48Health Care 1.20Materials 0.46Cash/Cash Equivalents -0.60
Top 10 Holdings in %ENI 7.22Intesa Sanpaolo 7.13Assicurazioni Gen. 6.18Luxottica 5.15Unicredit Fin. 5.10Banco Pop. 5.02Atlantia 4.89Prysmian 4.74Enel 4.73Terna 4.68Total 54.84
Significant Transactions
Fund statistics1 year 3 years
Annualized volatility in % 22.27 22.48Tracking Error (Ex post) 2.58 2.95Beta 0.93 0.91
Investment policyThe aim of the Fund is to achieve the highestpossible capital growth by investing in leadingItalian companies characterised by highprofitability, a sound financial structure andsuccessful management.
Fund facts
Unit class currency EUR
Bloomberg ticker CRSITLI LX
Net asset value (NAV) 553.60
Source: Lipper, a Reuters Company Cre
dit S
uiss
e Eq
uity
Fun
d
1) Historical performance indications and financial market scenarios are no guarantee for current or future performance. Performance indications do not consider commissions levied at subscription and/orredemption.
The disclaimer mentioned at the end of this document also applies to this page.
91
March 30, 2012Switzerland
Credit Suisse Equity Fund (Lux) ItalyClass I
Review previous quarter 2)
The Italian equity market recorded a positive startto the year, with Q1 returns of +5.90% for theFTSEMIB, +7.25% for the FTSE All-Share and13.60% for the FTSE Small Cap. The quarterwas characterized by a very strong start, whichsaw the FTSEMIB rising 13.5% by mid-March. Asimilar (inverted) path was seen in the BTP-Bundspread, which narrowed from 512bps to a lowof 276bps, before close the quarter at around330bps.
At a sector level, the best performers were all inthe higher beta space: Capital Goods (+27.1%)Consumers (+24.5%), Cyclicals (+23.4%) andHoldings & Real Estate (+18.8%). Among thelaggards, were Utilities (-3.9%), Insurance andAsset Management (-2.8%) and Banks (-1.2%).
At a single stock level, the best performer ofthe quarter was Ferragamo (+52.6%), followed
by Banco Popolare (+42.2%), Finmeccanica(+42.1%), Parmalat (+40.8%) Prysmian(+37.3%) and Pirelli (37.1%). Among theweakest stocks, were many utilities: A2A(-17.2%), Enel (-13.7%), Enel Green Power(-11.7%), while Unicredit (-11.1%) were weakeron equity issuance and Mediaset (-3.3%) werelower on weak advertising figures.
Outlook for the market 2)
After a very good start to the year for Europe,and Italy in particular, some issues of concernare back on the mind of the market participants,impacting stock market performance. Thebiggest worries seem to be that of a possibleglobal economic slowdown, growing political riskin Europe and an increase in country specific riskfor Spain.
On the other hand, there are some positiveelements that cannot be ignored: aggressiveliquidity measures by the ECB, which marks astructural change of strategy and hasre-established the supply/demand balance onthe institutional market, a still sound position forMonti’s government and some encouraging
macroeconomic indicators (such as the Germanleading indicator) which point to a possiblerecovery in the second half of the year. TheEUR/USD back to around 1.30 is another factorthat should support exports, increasing activitylevels and giving a positive contribution to GDP.
Portfolio ManagementStefano Andreani, CFA, joined Credit Suisse Group in January 2008 in MACS Milan as Italian Equities Manager for mutual funds andEuropean Equities Portfolio Manager for Institutional Clients portfolios. From May 2003 to January 2007 he worked at Eurizon Capital(Sanpaolo AM), initially on an internship, but from February 2004 as Assistant Portfolio Manager on balanced portfolios for institutionalclients. In March 2005, he assumed direct responsibility for managing Italian and European equities. Mr. Andreani graduated in Institutionsand Financial Markets (CLEFIN) from the Università Commerciale Luigi Bocconi in April 2003.
2) If not expressly indicated otherwise, all quantitative data contained in this comment is based on Lipper, Bloomberg or Datastream.
92
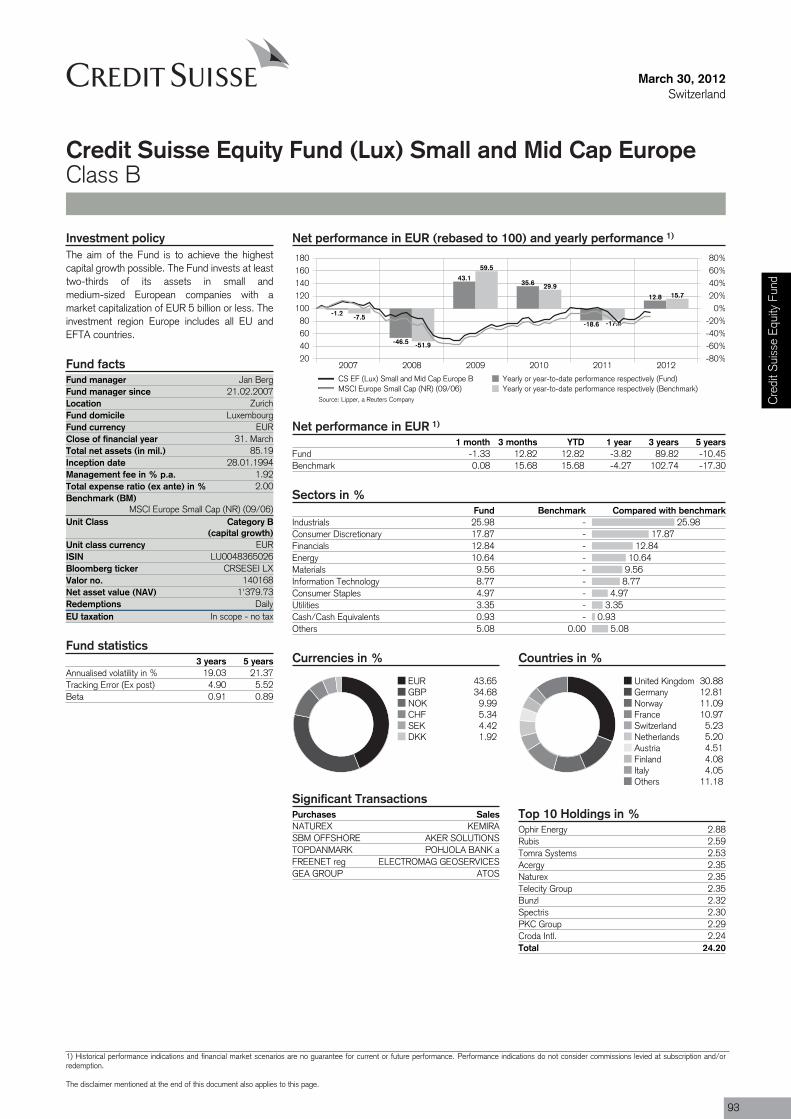
25.9817.87
12.8410.64
9.568.77
4.973.35
0.935.08
Purchases SalesNATUREX KEMIRASBM OFFSHORE AKER SOLUTIONSTOPDANMARK POHJOLA BANK aFREENET reg ELECTROMAG GEOSERVICESGEA GROUP ATOS
Fund manager Jan BergFund manager since 21.02.2007Location ZurichFund domicile LuxembourgFund currency EURClose of financial year 31. MarchTotal net assets (in mil.) 85.19Inception date 28.01.1994Management fee in % p.a. 1.92Total expense ratio (ex ante) in % 2.00Benchmark (BM)
MSCI Europe Small Cap (NR) (09/06)Unit Class Category B
(capital growth)
ISIN LU0048365026
Valor no. 140168
Redemptions DailyEU taxation In scope - no tax
March 30, 2012Switzerland
Credit Suisse Equity Fund (Lux) Small and Mid Cap EuropeClass B
Net performance in EUR (rebased to 100) and yearly performance 1)
2007 2008 2009 2010 2011 201220406080
100120140160180
-80%-60%-40%-20%
0%20%40%60%80%
-1.2
-46.5
43.135.6
-18.6
12.8
-7.5
-51.9
59.5
29.9
-17.4
15.7
CS EF (Lux) Small and Mid Cap Europe B Yearly or year-to-date performance respectively (Fund)MSCI Europe Small Cap (NR) (09/06) Yearly or year-to-date performance respectively (Benchmark)
Net performance in EUR 1)
1 month 3 months YTD 1 year 3 years 5 yearsFund -1.33 12.82 12.82 -3.82 89.82 -10.45Benchmark 0.08 15.68 15.68 -4.27 102.74 -17.30
Sectors in %Fund Benchmark Compared with benchmark
Industrials 25.98 -Consumer Discretionary 17.87 -Financials 12.84 -Energy 10.64 -Materials 9.56 -Information Technology 8.77 -Consumer Staples 4.97 -Utilities 3.35 -Cash/Cash Equivalents 0.93 -Others 5.08 0.00
Currencies in %
EUR 43.65GBP 34.68NOK 9.99CHF 5.34SEK 4.42DKK 1.92
Countries in %
United Kingdom 30.88Germany 12.81Norway 11.09France 10.97Switzerland 5.23Netherlands 5.20Austria 4.51Finland 4.08Italy 4.05Others 11.18
Top 10 Holdings in %Ophir Energy 2.88Rubis 2.59Tomra Systems 2.53Acergy 2.35Naturex 2.35Telecity Group 2.35Bunzl 2.32Spectris 2.30PKC Group 2.29Croda Intl. 2.24Total 24.20
Significant Transactions
Investment policyThe aim of the Fund is to achieve the highestcapital growth possible. The Fund invests at leasttwo-thirds of its assets in small andmedium-sized European companies with amarket capitalization of EUR 5 billion or less. Theinvestment region Europe includes all EU andEFTA countries.
Fund facts
Unit class currency EUR
Bloomberg ticker CRSESEI LX
Net asset value (NAV) 1'379.73
Fund statistics3 years 5 years
Annualised volatility in % 19.03 21.37Tracking Error (Ex post) 4.90 5.52Beta 0.91 0.89
Source: Lipper, a Reuters Company Cre
dit S
uiss
e Eq
uity
Fun
d
1) Historical performance indications and financial market scenarios are no guarantee for current or future performance. Performance indications do not consider commissions levied at subscription and/orredemption.
The disclaimer mentioned at the end of this document also applies to this page.
93
March 30, 2012Switzerland
Credit Suisse Equity Fund (Lux) Small and Mid Cap EuropeClass B
Review previous quarter 2)
Small and mid cap stocks outperformed largecaps as ample liquidity has been supportive forour market segment. The MSCI Europe SmallCap Index rallied nearly 16% ahead with theGerman and Nordic indices contributing verywell. Also, markets like Italy recovered from thedoubts about the high debt burden and the firstmeasures that have started to be put in place by
Italian government.
YTD performance of small and mid caps, whichis now about 400bps above large caps, has beendriven by more defensive sectors like healthcareand telecoms. This supports the view thatinvestors take a look into more defensive names.From a county level, best performing contributors
have been Germany, Austria, Sweden andSwitzerland. German equities had a strong firstquarter 2012. The Midcap market Index was up19.39% outperforming large caps, with the DAXup only 17.78% in the same period. The fundreported a 12.8% increase over the quarter.
Outlook for the market 2)
We believe European small cap remains the mostinteresting segment in the markets. For the firsttime since 1999 dividend yields in small capequities are higher than bonds yields which initself should support the small cap end of themarket.
Even though economic growth in Germany isexpected to cool down at the beginning of 2012and growth prospects have worsened due to the
European debt crisis, the Northern Europeindustrial sector remains very healthy and theexposure to niche markets supports growth fromemerging countries. Austerity measures arebeing implemented in several countries andtighter credit conditions are expected to subduegrowth particularly in peripheral Europeancountries. Companies that depend on peripheralEuropean countries will have more difficulties tomeet analyst expectations as a consequence.
However Germany’s IFO business climate indexsurprised recently with five upward moves in arow which points to a return to growth in Q22012. Other factors supporting equities are theample liquidity provided by the ECB to banks,governments preventing contagion risk byproviding stability funds, the recapitalization ofweak banks in H1 2012 and the budgetconsolidation in several European countries.
Portfolio ManagementJan Berg, Director, is a portfolio manager within the Equity Team. Jan joined the CS Small&Mid Cap Team in August 2006. Prior to this,he held a position in equity syndication and equity capital markets for four years with Dresdner Kleinwort, where he worked on numeroussmall- and mid-cap IPOs in Germany as well as several major capital market transactions. He continued developing his market expertise atDeutsche Bank Institutional Equities, where he focused on small- and mid-cap company analysis and marketing in Europe. He wasresponsible for the franchise with small cap investors, in particular mutual funds and insurance groups. Jan Berg graduated from theUniversity of Saarbrücken with an MSc in Economics and received CEFA certification in 2001.
2) If not expressly indicated otherwise, all quantitative data contained in this comment is based on Lipper, Bloomberg or Datastream.
94
Purchases SalesGSW IMMOBILIEN AIXTRON SECENTROTHERM BRENNTAG regSKY DEUTSCHLAND reg SALZGITTERDEUTSCHE EUROSHOP reg LEONI regQSC PROSIEBEN SAT.1 MEDIA pref
Fund manager Felix MeierFund manager since 01.01.2003Location ZurichFund domicile LuxembourgFund currency EURClose of financial year 31. MarchTotal net assets (in mil.) 269.85Inception date 26.08.1994Management fee in % p.a. 1.92Total expense ratio (ex ante) in % 2.09Benchmark (BM) Midcap Market Index (RI) (07/08)Unit Class Category B
(capital growth)
ISIN LU0052265898
Valor no. 248590
Redemptions DailyEU taxation In scope - no tax
March 30, 2012Switzerland
Credit Suisse Equity Fund (Lux) Small and Mid Cap GermanyClass B
Net performance in EUR (rebased to 100) and yearly performance 1)
2007 2008 2009 2010 2011 201240
60
80
100
120
140
160
-60%
-40%
-20%
0%
20%
40%
60%
-3.2
-44.4
46.6
29.8
-15.3
19.3
1.6
-47.1
38.826.9
-13.9
19.4
CS EF (Lux) Small and Mid Cap Germany B Yearly or year-to-date performance respectively (Fund)Midcap Market Index (RI) (07/08) Yearly or year-to-date performance respectively (Benchmark)
Net performance in EUR 1)
1 month 3 months YTD 1 year 3 years 5 yearsFund 2.22 19.34 19.34 -2.89 128.34 -8.00Benchmark 2.78 19.39 19.39 -0.36 119.19 -11.86
Sectors in %Fund
Industrials 32.41Consumer Discretionary 22.92Information Technology 13.16Materials 10.81Health Care 9.94Financials 8.10Telecommunication Services 1.36Consumer Staples 1.29Cash/Cash Equivalents 0.01
Currencies in %
EUR 99.99CHF 0.01
Countries in %
Germany 90.26France 9.39Switzerland 0.34Others 0.01
Top 10 Holdings in %EADS 9.39Continental 4.75GEA Group AG 4.49Lanxess 3.70Bilfinger & Berger 3.16MTU Aero Engines 3.15Tipp24 3.02Wire Card 2.78Morphosys 2.56Sky Deutschland AG 2.55Total 39.55
Significant Transactions
Investment policyThe aim of the Fund is to achieve the highestpossible capital growth. Investment focus is onsmall and mid-sized companies domiciled inGermany. Small and mid sized companies arecompanies not being part of the DAX 30 Index.
Fund facts
Unit class currency EUR
Bloomberg ticker CRSESGI LX
Net asset value (NAV) 1'139.64
Fund statistics3 years 5 years
Annualised volatility in % 22.04 25.60Tracking Error (Ex post) 3.25 3.71Beta 0.97 0.99
Source: Lipper, a Reuters Company Cre
dit S
uiss
e Eq
uity
Fun
d
1) Historical performance indications and financial market scenarios are no guarantee for current or future performance. Performance indications do not consider commissions levied at subscription and/orredemption.
The disclaimer mentioned at the end of this document also applies to this page.
95
March 30, 2012Switzerland
Credit Suisse Equity Fund (Lux) Small and Mid Cap GermanyClass B
Review previous quarter 2)
German equities had a strong first quarter 2012.The Midcap market Index was up 19.39% in Q1.The combination of austerity measures beingimplemented in several European countries andlots of liquidity provided by the ECB helped tomove the European debt crisis out of the focusof investors. The ECB twice provided unlimitedfunding to banks for a period of three yearsat an interest rate of only one per cent. Thisstep underlined its willingness to provide morethan enough liquidity to the banking system andreduced significantly counterparty andrefinancing risk within the financial sector.Germany’s fundamental economy is still on the
recovery path, highlighted by the IFO Index risingfive times in a row. Cyclical stocks out of theauto, chemical and financial sectors performedwell.
The fund reported an increase of 19.34% inQ1, net of fees for the B-share class. The slightoutperformance on a gross basis was mainly aresult of stock selection. Best attributors in Q1included our overweight in semiconductorproduction equipment supplier Suess Microtec(+91%) and online lottery ticket broker Tipp24(+19%). Suess Microtec’s order situation isexpected to improve quickly in Q1 compared to
a weak Q4 last year when Suess had to reduceits order entry guidance. Tipp24 released betterthan expected results and still benefitted from there-launch of its activities on the German market.New gaming legislation permits the onlinebrokerage of state-run lotteries once more.Worst attributors included our underweights inKabel Deutschland (+18%) and chemicalsproducer Lanxess (+55%). Kabel Deutschlandcould show strong growth in internet & telephonyand premium TV. Lanxess could profit from astrong demand for high performance tires.
Outlook for the market 2)
Economic growth in Germany is expected to cooldown in the beginning of 2012. Growthprospects have worsened due to the Europeandebt crisis. Austerity measures are beingimplemented in several countries and tightercredit conditions are expected to subdue growth,particularly in peripheral European countries.Companies that depend on peripheral Europeancountries will have more difficulties to meetanalyst expectations as a consequence.
However Germany’s IFO business climate indexsurprised recently with five upward moves in arow which points to a return to growth in Q22012. German companies are very competitive,show better balance sheets and have becomemore flexible at adjusting their cost base.
Factors supporting equities are the ampleliquidity provided by the ECB to banks,governments preventing contagion risk by
providing stability funds, the recapitalization ofweak banks in H1 2012 and the budgetconsolidation in several European countries.Attractive valuations, decreasing credit defaultspreads and a still quite defensive positioning ofinvestors build the basis for a further recovery.The beta of the fund is expected at about 1 -neither aggressive nor defensive.
Portfolio ManagementAfter completing his studies in business management at the University of St. Gallen in June 1998, Felix Meier attended the GraduateTrainee Programme of Zurich Financial Services in Zürich Invest Bank and Group Investments. In October 1999, he joined the EuropeanEquity team, in which he was responsible for active equity mandates. Since 2001 he has specialised in German Small Caps. From June toAugust 2002 he worked for CSAM New York as a Small Cap Analyst. Having qualified as a Chartered Financial Analyst (CFA), Felix Meieris a member of the Association of Investment Management and Research (AIMR) and of the Swiss Society of Investment Professionals(SSIP).
2) If not expressly indicated otherwise, all quantitative data contained in this comment is based on Lipper, Bloomberg or Datastream.
96

Purchases SalesGSW IMMOBILIEN AIXTRON SECENTROTHERM BRENNTAG regSKY DEUTSCHLAND reg SALZGITTERDEUTSCHE EUROSHOP reg LEONI regQSC PROSIEBEN SAT.1 MEDIA pref
Fund manager Felix MeierFund manager since 01.01.2003Location ZurichFund domicile LuxembourgFund currency EURClose of financial year 31. MarchTotal net assets (in mil.) 269.85Inception date 29.08.2005Management fee in % p.a. 0.90Total expense ratio (ex ante) in % 0.86Benchmark (BM) Midcap Market Index (RI) (07/08)Unit Class Category I
(capital growth)
ISIN LU0108803940
Valor no. 1057945
Min. Init. Investm. Amount (in mill.) 3Redemptions DailyEU taxation In scope - no tax
March 30, 2012Switzerland
Credit Suisse Equity Fund (Lux) Small and Mid Cap GermanyClass I
Net performance in EUR (rebased to 100) and yearly performance 1)
2007 2008 2009 2010 2011 201240
60
80
100
120
140
160
-60%
-40%
-20%
0%
20%
40%
60%
-2.2
-43.7
48.0
31.2
-14.5
19.7
1.6
-47.1
38.826.9
-13.9
19.4
CS EF (Lux) Small and Mid Cap Germany I Yearly or year-to-date performance respectively (Fund)Midcap Market Index (RI) (07/08) Yearly or year-to-date performance respectively (Benchmark)
Net performance in EUR 1)
1 month 3 months YTD 1 year 3 years 5 yearsFund 2.30 19.66 19.66 -1.87 135.40 -3.10Benchmark 2.78 19.39 19.39 -0.36 119.19 -11.86
Sectors in %Fund
Industrials 32.41Consumer Discretionary 22.92Information Technology 13.16Materials 10.81Health Care 9.94Financials 8.10Telecommunication Services 1.36Consumer Staples 1.29Cash/Cash Equivalents 0.01
Currencies in %
EUR 99.99CHF 0.01
Countries in %
Germany 90.26France 9.39Switzerland 0.34Others 0.01
Top 10 Holdings in %EADS 9.39Continental 4.75GEA Group AG 4.49Lanxess 3.70Bilfinger & Berger 3.16MTU Aero Engines 3.15Tipp24 3.02Wire Card 2.78Morphosys 2.56Sky Deutschland AG 2.55Total 39.55
Significant Transactions
Investment policyThe aim of the Fund is to achieve the highestpossible capital growth. Investment focus is onsmall and mid-sized companies domiciled inGermany. Small and mid sized companies arecompanies not being part of the DAX 30 Index.
Fund facts
Unit class currency EUR
Bloomberg ticker CSEFSCI LX
Net asset value (NAV) 1'413.11
Fund statistics3 years 5 years
Annualised volatility in % 22.05 25.60Tracking Error (Ex post) 3.25 3.70Beta 0.97 0.99
Source: Lipper, a Reuters Company Cre
dit S
uiss
e Eq
uity
Fun
d
1) Historical performance indications and financial market scenarios are no guarantee for current or future performance. Performance indications do not consider commissions levied at subscription and/orredemption.
The disclaimer mentioned at the end of this document also applies to this page.
97
March 30, 2012Switzerland
Credit Suisse Equity Fund (Lux) Small and Mid Cap GermanyClass I
Review previous quarter 2)
German equities had a strong first quarter 2012.The Midcap market Index was up 19.39% in Q1.The combination of austerity measures beingimplemented in several European countries andlots of liquidity provided by the ECB helped tomove the European debt crisis out of the focusof investors. The ECB twice provided unlimitedfunding to banks for a period of three yearsat an interest rate of only one per cent. Thisstep underlined its willingness to provide morethan enough liquidity to the banking system andreduced significantly counterparty andrefinancing risk within the financial sector.Germany’s fundamental economy is still on the
recovery path, highlighted by the IFO Index risingfive times in a row. Cyclical stocks out of theauto, chemical and financial sectors performedwell.
The fund reported an increase of 19.34% inQ1, net of fees for the B-share class. The slightoutperformance on a gross basis was mainly aresult of stock selection. Best attributors in Q1included our overweight in semiconductorproduction equipment supplier Suess Microtec(+91%) and online lottery ticket broker Tipp24(+19%). Suess Microtec’s order situation isexpected to improve quickly in Q1 compared to
a weak Q4 last year when Suess had to reduceits order entry guidance. Tipp24 released betterthan expected results and still benefitted from there-launch of its activities on the German market.New gaming legislation permits the onlinebrokerage of state-run lotteries once more.Worst attributors included our underweights inKabel Deutschland (+18%) and chemicalsproducer Lanxess (+55%). Kabel Deutschlandcould show strong growth in internet & telephonyand premium TV. Lanxess could profit from astrong demand for high performance tires.
Outlook for the market 2)
Economic growth in Germany is expected to cooldown in the beginning of 2012. Growthprospects have worsened due to the Europeandebt crisis. Austerity measures are beingimplemented in several countries and tightercredit conditions are expected to subdue growth,particularly in peripheral European countries.Companies that depend on peripheral Europeancountries will have more difficulties to meetanalyst expectations as a consequence.
However Germany’s IFO business climate indexsurprised recently with five upward moves in arow which points to a return to growth in Q22012. German companies are very competitive,show better balance sheets and have becomemore flexible at adjusting their cost base.
Factors supporting equities are the ampleliquidity provided by the ECB to banks,governments preventing contagion risk by
providing stability funds, the recapitalization ofweak banks in H1 2012 and the budgetconsolidation in several European countries.Attractive valuations, decreasing credit defaultspreads and a still quite defensive positioning ofinvestors build the basis for a further recovery.The beta of the fund is expected at about 1 -neither aggressive nor defensive.
Portfolio ManagementAfter completing his studies in business management at the University of St. Gallen in June 1998, Felix Meier attended the GraduateTrainee Programme of Zurich Financial Services in Zürich Invest Bank and Group Investments. In October 1999, he joined the EuropeanEquity team, in which he was responsible for active equity mandates. Since 2001 he has specialised in German Small Caps. From June toAugust 2002 he worked for CSAM New York as a Small Cap Analyst. Having qualified as a Chartered Financial Analyst (CFA), Felix Meieris a member of the Association of Investment Management and Research (AIMR) and of the Swiss Society of Investment Professionals(SSIP).
2) If not expressly indicated otherwise, all quantitative data contained in this comment is based on Lipper, Bloomberg or Datastream.
98

Purchases SalesSTARWOOD HOTELS & RESORTS PFIZERCOMCAST a KROGEREXPRESS SCRIPTS INGERSOLL-RANDCUMMINS EXXON MOBILPRECISION CASTPARTS ORACLE
Fund manager Martino PerkmannFund manager since 31.12.2009Location ZurichFund domicile LuxembourgFund currency USDClose of financial year 31. MarchTotal net assets (in mil.) 586.88Inception date 07.06.1991Management fee in % p.a. 1.25Total expense ratio (ex ante) in % 1.51Benchmark (BM) MSCI USA (NR) (01/10)Unit Class Category B
(capital growth)
ISIN LU0055732977
Valor no. 349533
Redemptions DailyEU taxation In scope - no tax
March 30, 2012Switzerland
Credit Suisse Equity Fund (Lux) USAClass B
Net performance in USD (rebased to 100) and yearly performance 1)
2007 2008 2009 2010 2011 20125060708090
100110120130140
-50%-40%-30%-20%-10%
0%10%20%30%40%
6.5
-37.3
28.0
9.0
-3.4
12.74.9
-37.4
25.6
14.8
1.4
12.7
CS EF (Lux) USA B Yearly or year-to-date performance respectively (Fund)MSCI USA (NR) (01/10) Yearly or year-to-date performance respectively (Benchmark)
Net performance in USD 1)
1 month 3 months YTD 1 year 3 years 5 yearsFund 3.11 12.66 12.66 3.94 67.40 1.60Benchmark 3.15 12.65 12.65 7.91 85.31 7.43
Sectors in %Fund
Information Technology 24.70Financials 15.05Health Care 11.70Energy 11.47Consumer Discretionary 10.32Industrials 10.26Consumer Staples 6.92Materials 3.78Cash/Cash Equivalents 0.17Others 5.64
Top 10 Holdings in %Apple 5.35Exxon Mobil Corp. 3.22Qualcomm 2.93Wal-Mart Stores 2.52Chevron 2.42Discover Financial Services 2.35IBM 2.27Wells Fargo & Co. 2.12Google 2.03US Bancorp Inv. 1.97Total 27.18
Significant Transactions
Fund statistics3 years 5 years
Annualised volatility in % 17.81 19.82Tracking Error (Ex post) 2.68 2.89Beta 1.09 1.02
Investment policyThe aim of the Fund is to achieve the highestpossible capital growth by investing in leadingUS companies characterised by high profitability,a sound financial structure and successfulmanagement.
Fund facts
Unit class currency USD
Bloomberg ticker CRSNABI LX
Net asset value (NAV) 732.09
Source: Lipper, a Reuters Company Cre
dit S
uiss
e Eq
uity
Fun
d
1) Historical performance indications and financial market scenarios are no guarantee for current or future performance. Performance indications do not consider commissions levied at subscription and/orredemption.
The disclaimer mentioned at the end of this document also applies to this page.
99
March 30, 2012Switzerland
Credit Suisse Equity Fund (Lux) USAClass B
Review previous quarter 2)
A good Q4 earnings season and furtherimprovements in macroeconomic data continuedto drive better investor sentiment and the equitymarket in Q1 of this year. The US appears tobe on a path of slow but steady growth. Marketsreacted positively to the unexpected drop in theunemployment rate to 8.2%, and retail sales alsolooked promising in the quarter. Housing marketfundamentals continued to improve with pricesstabilizing and housing activity improving. TheEuropean sovereign debt crisis stabilized duringthe quarter after some tense negotiations. TheECB’s plan to pump liquidity into the bankingsystem also proved a salve to the crisis.
For Q1, the MSCI US returned 12.65%, makingit the best three month performance in US stockssince 2009. The cyclical sectors Financials,Information Technology and ConsumerDiscretionary performed best while moredefensive sectors like Utilities, Telecom Servicesand Consumer Staples lagged. The portfolioperformed in line with its benchmark, returning12.66%. Our overweight in InformationTechnology and Financials and underweight inUtilities and Consumer Staples contributedpositively. Stock selection within Financials,Industrials and Information Technology
contributed most to performance. The mostsignificant detractor to relative performance wasstock selection in Consumer Discretionary.
At the level of individual holdings, DiscoverFinancials increased 39% in the quarter andcontributed most to performance. Continuedimprovements in credit performance, solidorganic growth in each of their lending productsand strong volume growth were key drivers forthe success. In Technology the fund benefitedfrom our overweights in Apple, Qualcomm andEMC.
Outlook for the market 2)
Following the rally in the recent quarter, webelieve opportunities are rarer than they were justthree months ago. Given current valuation levels,it seems unlikely that there will be many morequarters where the broad equity market will beup more than 10%. The uncertainty that made2011 such a challenging year remains more orless in place also in 2012. The developed worldis still figuring out how to handle its debt issues,growth concerns keep popping up in China andelsewhere and elections across the globe couldhave a big impact on equity market performance.
We believe that US corporate earnings will
continue to rise, albeit at a slower pace thanthey have been. We continue to believe thatthe US housing market, an important piece ofthe US economic recovery, is likely to continueits bottoming-out process in 2012. Furthermore,we believe that in some regions housing pricescould even begin to firm up, starting a long-termupward trend.
Our portfolio is positioned for a modest economicrecovery and our main area of focus with regardto the equity market has not changed. Wecontinue to concentrate on well positioned firmslevered to specific market opportunities that are
capable, in our view, of maintaining their strongcompetitive positions. From a sector perspective,we remain overweight in Information Technologyand prefer companies benefiting from attractivesecular growth and trends like virtualization andcloud computing.
We continue to remain underweight lower betasectors like Utilities, Telecom and ConsumerStaples as we have difficulties in finding goodrisk/reward opportunities and find better growthstories in Information Technology, Financials andIndustrials.
Portfolio ManagementMartino Perkmann is a Director in Credit Suisse’s Asset Management Business, based in Zürich. He is heading the US Equities Team inMACS and responsible for sector specialization in Consumer Discretionary and StaplesMr Perkmann joined Credit Suisse Asset Management in January 2005. Previously he was a portfolio manager in the equity teams atDeka Investment in Frankfurt, Germany. He has over 10 years experience as an equity portfolio manager.Mr Perkmann holds a degree in Business economics from University of Nuremberg. Martino Perkmann is a CFA Charterholder.
2) If not expressly indicated otherwise, all quantitative data contained in this comment is based on Lipper, Bloomberg or Datastream.
100

Purchases SalesSTARWOOD HOTELS & RESORTS PFIZERCOMCAST a KROGEREXPRESS SCRIPTS INGERSOLL-RANDCUMMINS EXXON MOBILPRECISION CASTPARTS ORACLE
Fund manager Martino PerkmannFund manager since 31.12.2009Location ZurichFund domicile LuxembourgFund currency USDClose of financial year 31. MarchTotal net assets (in mil.) 586.88Inception date 14.04.2000Management fee in % p.a. 0.65Total expense ratio (ex ante) in % 0.92Benchmark (BM) MSCI USA (NR) (01/10)Unit Class Category I
(capital growth)
ISIN LU0108804591
Valor no. 1057955
Min. Init. Investm. Amount (in mill.) 3Redemptions DailyEU taxation In scope - no tax
March 30, 2012Switzerland
Credit Suisse Equity Fund (Lux) USAClass I
Net performance in USD (rebased to 100) and yearly performance 1)
2007 2008 2009 2010 2011 201240
60
80
100
120
140
-60%
-40%
-20%
0%
20%
40%
7.1
-37.0
28.8
9.7
-2.8
12.84.9
-37.4
25.6
14.8
1.4
12.7
CS EF (Lux) USA I Yearly or year-to-date performance respectively (Fund)MSCI USA (NR) (01/10) Yearly or year-to-date performance respectively (Benchmark)
Net performance in USD 1)
1 month 3 months YTD 1 year 3 years 5 yearsFund 3.16 12.83 12.83 4.57 70.45 4.67Benchmark 3.15 12.65 12.65 7.91 85.31 7.43
Sectors in %Fund
Information Technology 24.70Financials 15.05Health Care 11.70Energy 11.47Consumer Discretionary 10.32Industrials 10.26Consumer Staples 6.92Materials 3.78Cash/Cash Equivalents 0.17Others 5.64
Top 10 Holdings in %Apple 5.35Exxon Mobil Corp. 3.22Qualcomm 2.93Wal-Mart Stores 2.52Chevron 2.42Discover Financial Services 2.35IBM 2.27Wells Fargo & Co. 2.12Google 2.03US Bancorp Inv. 1.97Total 27.18
Significant Transactions
Fund statistics3 years 5 years
Annualised volatility in % 17.82 19.83Tracking Error (Ex post) 2.68 2.90Beta 1.09 1.02
Investment policyThe aim of the Fund is to achieve the highestpossible capital growth by investing in leadingUS companies characterised by high profitability,a sound financial structure and successfulmanagement.
Fund facts
Unit class currency USD
Bloomberg ticker CRSNAII LX
Net asset value (NAV) 1'025.10
Source: Lipper, a Reuters Company Cre
dit S
uiss
e Eq
uity
Fun
d
1) Historical performance indications and financial market scenarios are no guarantee for current or future performance. Performance indications do not consider commissions levied at subscription and/orredemption.
The disclaimer mentioned at the end of this document also applies to this page.
101

March 30, 2012Switzerland
Credit Suisse Equity Fund (Lux) USAClass I
Review previous quarter 2)
A good Q4 earnings season and furtherimprovements in macroeconomic data continuedto drive better investor sentiment and the equitymarket in Q1 of this year. The US appears tobe on a path of slow but steady growth. Marketsreacted positively to the unexpected drop in theunemployment rate to 8.2%, and retail sales alsolooked promising in the quarter. Housing marketfundamentals continued to improve with pricesstabilizing and housing activity improving. TheEuropean sovereign debt crisis stabilized duringthe quarter after some tense negotiations. TheECB’s plan to pump liquidity into the bankingsystem also proved a salve to the crisis.
For Q1, the MSCI US returned 12.65%, makingit the best three month performance in US stockssince 2009. The cyclical sectors Financials,Information Technology and ConsumerDiscretionary performed best while moredefensive sectors like Utilities, Telecom Servicesand Consumer Staples lagged. The portfolioperformed in line with its benchmark, returning12.66%. Our overweight in InformationTechnology and Financials and underweight inUtilities and Consumer Staples contributedpositively. Stock selection within Financials,Industrials and Information Technology
contributed most to performance. The mostsignificant detractor to relative performance wasstock selection in Consumer Discretionary.
At the level of individual holdings, DiscoverFinancials increased 39% in the quarter andcontributed most to performance. Continuedimprovements in credit performance, solidorganic growth in each of their lending productsand strong volume growth were key drivers forthe success. In Technology the fund benefitedfrom our overweights in Apple, Qualcomm andEMC.
Outlook for the market 2)
Following the rally in the recent quarter, webelieve opportunities are rarer than they were justthree months ago. Given current valuation levels,it seems unlikely that there will be many morequarters where the broad equity market will beup more than 10%. The uncertainty that made2011 such a challenging year remains more orless in place also in 2012. The developed worldis still figuring out how to handle its debt issues,growth concerns keep popping up in China andelsewhere and elections across the globe couldhave a big impact on equity market performance.
We believe that US corporate earnings will
continue to rise, albeit at a slower pace thanthey have been. We continue to believe thatthe US housing market, an important piece ofthe US economic recovery, is likely to continueits bottoming-out process in 2012. Furthermore,we believe that in some regions housing pricescould even begin to firm up, starting a long-termupward trend.
Our portfolio is positioned for a modest economicrecovery and our main area of focus with regardto the equity market has not changed. Wecontinue to concentrate on well positioned firmslevered to specific market opportunities that are
capable, in our view, of maintaining their strongcompetitive positions. From a sector perspective,we remain overweight in Information Technologyand prefer companies benefiting from attractivesecular growth and trends like virtualization andcloud computing.
We continue to remain underweight lower betasectors like Utilities, Telecom and ConsumerStaples as we have difficulties in finding goodrisk/reward opportunities and find better growthstories in Information Technology, Financials andIndustrials.
Portfolio ManagementMartino Perkmann is a Director in Credit Suisse’s Asset Management Business, based in Zürich. He is heading the US Equities Team inMACS and responsible for sector specialization in Consumer Discretionary and StaplesMr Perkmann joined Credit Suisse Asset Management in January 2005. Previously he was a portfolio manager in the equity teams atDeka Investment in Frankfurt, Germany. He has over 10 years experience as an equity portfolio manager.Mr Perkmann holds a degree in Business economics from University of Nuremberg. Martino Perkmann is a CFA Charterholder.
2) If not expressly indicated otherwise, all quantitative data contained in this comment is based on Lipper, Bloomberg or Datastream.
102
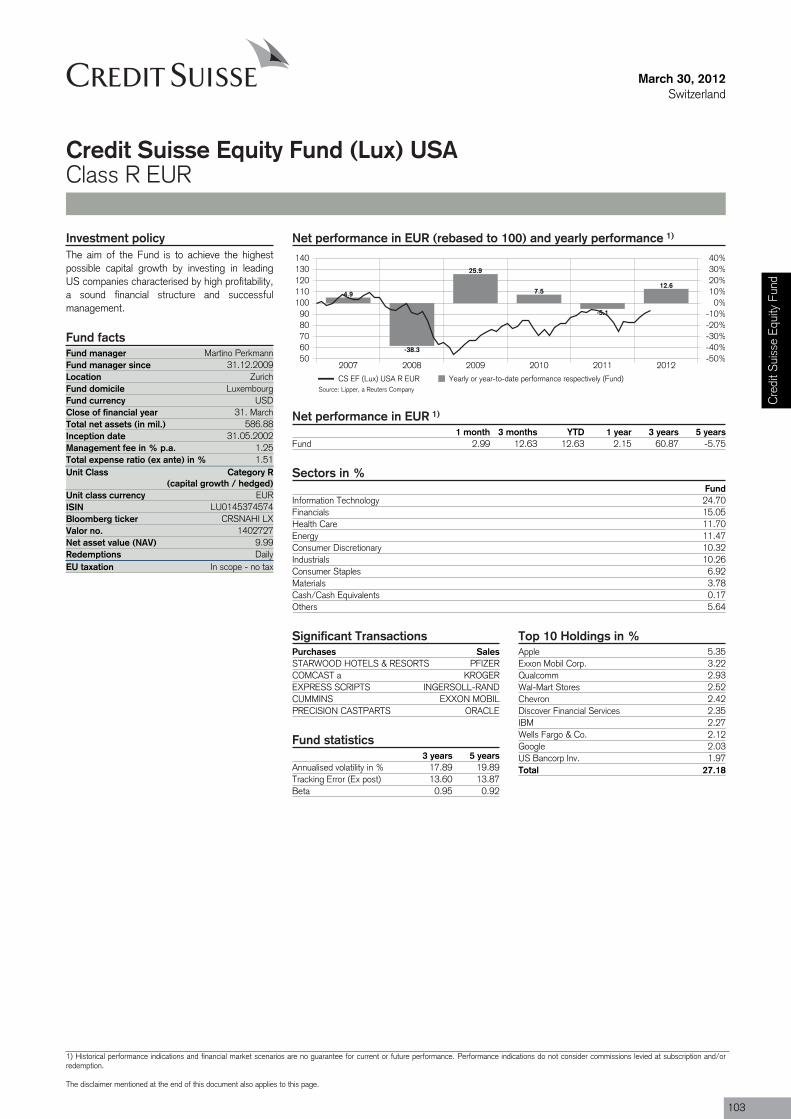
Purchases SalesSTARWOOD HOTELS & RESORTS PFIZERCOMCAST a KROGEREXPRESS SCRIPTS INGERSOLL-RANDCUMMINS EXXON MOBILPRECISION CASTPARTS ORACLE
Fund manager Martino PerkmannFund manager since 31.12.2009Location ZurichFund domicile LuxembourgFund currency USDClose of financial year 31. MarchTotal net assets (in mil.) 586.88Inception date 31.05.2002Management fee in % p.a. 1.25Total expense ratio (ex ante) in % 1.51Unit Class Category R
(capital growth / hedged)
ISIN LU0145374574
Valor no. 1402727
Redemptions DailyEU taxation In scope - no tax
March 30, 2012Switzerland
Credit Suisse Equity Fund (Lux) USAClass R EUR
Net performance in EUR (rebased to 100) and yearly performance 1)
2007 2008 2009 2010 2011 20125060708090
100110120130140
-50%-40%-30%-20%-10%
0%10%20%30%40%
4.9
-38.3
25.9
7.5
-5.1
12.6
CS EF (Lux) USA R EUR Yearly or year-to-date performance respectively (Fund)
Net performance in EUR 1)
1 month 3 months YTD 1 year 3 years 5 yearsFund 2.99 12.63 12.63 2.15 60.87 -5.75
Sectors in %Fund
Information Technology 24.70Financials 15.05Health Care 11.70Energy 11.47Consumer Discretionary 10.32Industrials 10.26Consumer Staples 6.92Materials 3.78Cash/Cash Equivalents 0.17Others 5.64
Top 10 Holdings in %Apple 5.35Exxon Mobil Corp. 3.22Qualcomm 2.93Wal-Mart Stores 2.52Chevron 2.42Discover Financial Services 2.35IBM 2.27Wells Fargo & Co. 2.12Google 2.03US Bancorp Inv. 1.97Total 27.18
Significant Transactions
Fund statistics3 years 5 years
Annualised volatility in % 17.89 19.89Tracking Error (Ex post) 13.60 13.87Beta 0.95 0.92
Investment policyThe aim of the Fund is to achieve the highestpossible capital growth by investing in leadingUS companies characterised by high profitability,a sound financial structure and successfulmanagement.
Fund facts
Unit class currency EUR
Bloomberg ticker CRSNAHI LX
Net asset value (NAV) 9.99
Source: Lipper, a Reuters Company
Cre
dit S
uiss
e Eq
uity
Fun
d
1) Historical performance indications and financial market scenarios are no guarantee for current or future performance. Performance indications do not consider commissions levied at subscription and/orredemption.
The disclaimer mentioned at the end of this document also applies to this page.
103
March 30, 2012Switzerland
Credit Suisse Equity Fund (Lux) USAClass R EUR
Review previous quarter 2)
A good Q4 earnings season and furtherimprovements in macroeconomic data continuedto drive better investor sentiment and the equitymarket in Q1 of this year. The US appears tobe on a path of slow but steady growth. Marketsreacted positively to the unexpected drop in theunemployment rate to 8.2%, and retail sales alsolooked promising in the quarter. Housing marketfundamentals continued to improve with pricesstabilizing and housing activity improving. TheEuropean sovereign debt crisis stabilized duringthe quarter after some tense negotiations. TheECB’s plan to pump liquidity into the bankingsystem also proved a salve to the crisis.
For Q1, the MSCI US returned 12.65%, makingit the best three month performance in US stockssince 2009. The cyclical sectors Financials,Information Technology and ConsumerDiscretionary performed best while moredefensive sectors like Utilities, Telecom Servicesand Consumer Staples lagged. The portfolioperformed in line with its benchmark, returning12.66%. Our overweight in InformationTechnology and Financials and underweight inUtilities and Consumer Staples contributedpositively. Stock selection within Financials,Industrials and Information Technology
contributed most to performance. The mostsignificant detractor to relative performance wasstock selection in Consumer Discretionary.
At the level of individual holdings, DiscoverFinancials increased 39% in the quarter andcontributed most to performance. Continuedimprovements in credit performance, solidorganic growth in each of their lending productsand strong volume growth were key drivers forthe success. In Technology the fund benefitedfrom our overweights in Apple, Qualcomm andEMC.
Outlook for the market 2)
Following the rally in the recent quarter, webelieve opportunities are rarer than they were justthree months ago. Given current valuation levels,it seems unlikely that there will be many morequarters where the broad equity market will beup more than 10%. The uncertainty that made2011 such a challenging year remains more orless in place also in 2012. The developed worldis still figuring out how to handle its debt issues,growth concerns keep popping up in China andelsewhere and elections across the globe couldhave a big impact on equity market performance.
We believe that US corporate earnings will
continue to rise, albeit at a slower pace thanthey have been. We continue to believe thatthe US housing market, an important piece ofthe US economic recovery, is likely to continueits bottoming-out process in 2012. Furthermore,we believe that in some regions housing pricescould even begin to firm up, starting a long-termupward trend.
Our portfolio is positioned for a modest economicrecovery and our main area of focus with regardto the equity market has not changed. Wecontinue to concentrate on well positioned firmslevered to specific market opportunities that are
capable, in our view, of maintaining their strongcompetitive positions. From a sector perspective,we remain overweight in Information Technologyand prefer companies benefiting from attractivesecular growth and trends like virtualization andcloud computing.
We continue to remain underweight lower betasectors like Utilities, Telecom and ConsumerStaples as we have difficulties in finding goodrisk/reward opportunities and find better growthstories in Information Technology, Financials andIndustrials.
Portfolio ManagementMartino Perkmann is a Director in Credit Suisse’s Asset Management Business, based in Zürich. He is heading the US Equities Team inMACS and responsible for sector specialization in Consumer Discretionary and StaplesMr Perkmann joined Credit Suisse Asset Management in January 2005. Previously he was a portfolio manager in the equity teams atDeka Investment in Frankfurt, Germany. He has over 10 years experience as an equity portfolio manager.Mr Perkmann holds a degree in Business economics from University of Nuremberg. Martino Perkmann is a CFA Charterholder.
2) If not expressly indicated otherwise, all quantitative data contained in this comment is based on Lipper, Bloomberg or Datastream.
104
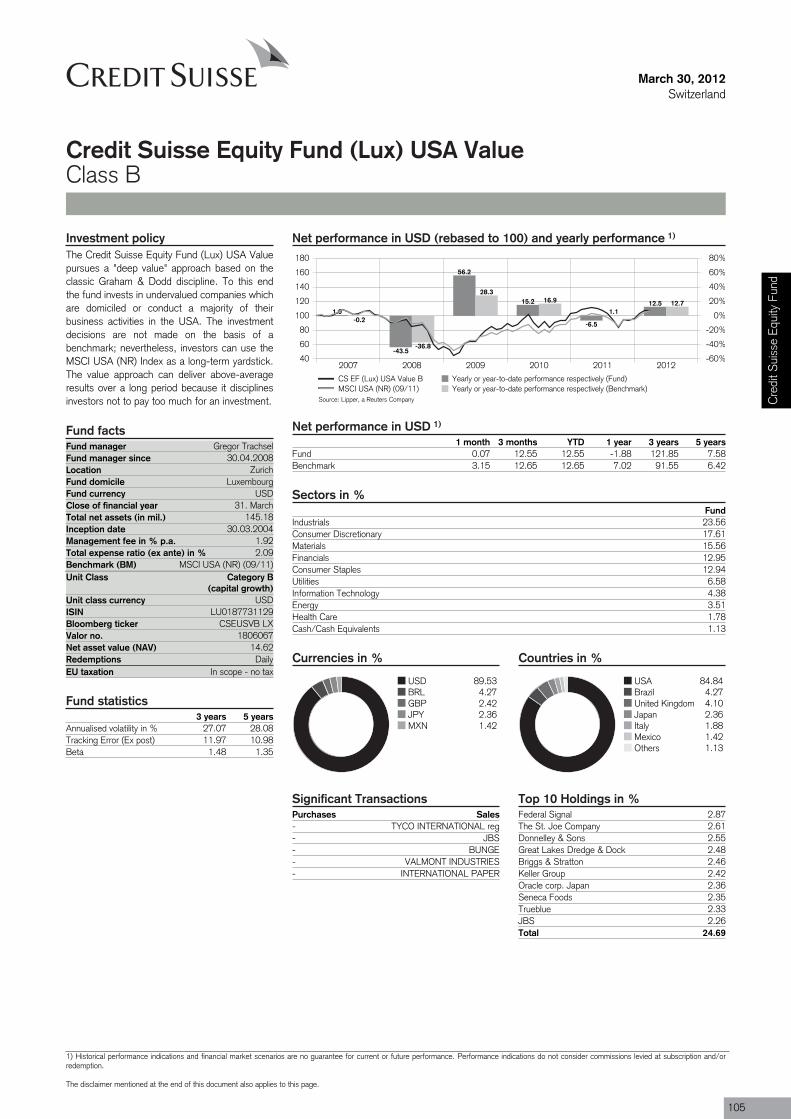
Purchases Sales- TYCO INTERNATIONAL reg- JBS- BUNGE- VALMONT INDUSTRIES- INTERNATIONAL PAPER
Fund manager Gregor TrachselFund manager since 30.04.2008Location ZurichFund domicile LuxembourgFund currency USDClose of financial year 31. MarchTotal net assets (in mil.) 145.18Inception date 30.03.2004Management fee in % p.a. 1.92Total expense ratio (ex ante) in % 2.09Benchmark (BM) MSCI USA (NR) (09/11)Unit Class Category B
(capital growth)
ISIN LU0187731129
Valor no. 1806067
Redemptions DailyEU taxation In scope - no tax
March 30, 2012Switzerland
Credit Suisse Equity Fund (Lux) USA ValueClass B
Net performance in USD (rebased to 100) and yearly performance 1)
2007 2008 2009 2010 2011 201240
60
80
100
120
140
160
180
-60%
-40%
-20%
0%
20%
40%
60%
80%
1.0
-43.5
56.2
15.2
-6.5
12.5
-0.2
-36.8
28.316.9
1.112.7
CS EF (Lux) USA Value B Yearly or year-to-date performance respectively (Fund)MSCI USA (NR) (09/11) Yearly or year-to-date performance respectively (Benchmark)
Net performance in USD 1)
1 month 3 months YTD 1 year 3 years 5 yearsFund 0.07 12.55 12.55 -1.88 121.85 7.58Benchmark 3.15 12.65 12.65 7.02 91.55 6.42
Sectors in %Fund
Industrials 23.56Consumer Discretionary 17.61Materials 15.56Financials 12.95Consumer Staples 12.94Utilities 6.58Information Technology 4.38Energy 3.51Health Care 1.78Cash/Cash Equivalents 1.13
Currencies in %
USD 89.53BRL 4.27GBP 2.42JPY 2.36MXN 1.42
Countries in %
USA 84.84Brazil 4.27United Kingdom 4.10Japan 2.36Italy 1.88Mexico 1.42Others 1.13
Top 10 Holdings in %Federal Signal 2.87The St. Joe Company 2.61Donnelley & Sons 2.55Great Lakes Dredge & Dock 2.48Briggs & Stratton 2.46Keller Group 2.42Oracle corp. Japan 2.36Seneca Foods 2.35Trueblue 2.33JBS 2.26Total 24.69
Significant Transactions
Investment policyThe Credit Suisse Equity Fund (Lux) USA Valuepursues a "deep value" approach based on theclassic Graham & Dodd discipline. To this endthe fund invests in undervalued companies whichare domiciled or conduct a majority of theirbusiness activities in the USA. The investmentdecisions are not made on the basis of abenchmark; nevertheless, investors can use theMSCI USA (NR) Index as a long-term yardstick.The value approach can deliver above-averageresults over a long period because it disciplinesinvestors not to pay too much for an investment.
Fund facts
Unit class currency USD
Bloomberg ticker CSEUSVB LX
Net asset value (NAV) 14.62
Fund statistics3 years 5 years
Annualised volatility in % 27.07 28.08Tracking Error (Ex post) 11.97 10.98Beta 1.48 1.35
Source: Lipper, a Reuters Company Cre
dit S
uiss
e Eq
uity
Fun
d
1) Historical performance indications and financial market scenarios are no guarantee for current or future performance. Performance indications do not consider commissions levied at subscription and/orredemption.
The disclaimer mentioned at the end of this document also applies to this page.
105

March 30, 2012Switzerland
Credit Suisse Equity Fund (Lux) USA ValueClass B
Review previous quarter 2)
Performance: Net asset value (I-shares) rose by12.86% in Q1 2012. Since the Fund becameresponsibility of the Value Team on April 30,2008, it has compounded at an annual net returnrate of 4.68%.
Transactions: During Q1 2012 we newly addeda position in a multinational packaging firm to theportfolio. On the other hand, we wholly disposedof our long-time position in Tyco InternationalLtd. The company’s stock price was approachingour conservative estimate of fair value after
management announced a further split-up inthree separate companies as well as the mergerof its flow control business with Pentair Inc.
Corporate actions / mergers and acquisitions: Atthe very beginning of the reporting period ourportfolio company Sunoco Inc. completed thespin-off and separate listing of its metallurgicalcoal business, Suncoke Energy Inc.
Commentary: Perhaps interesting to note is thatthe Fund did quite well during the reporting
period despite being heavily underrepresented inthe sectors and industries that lead the market’smove to the upside, notably banks, high-tech,home builders and retailers.
There were no noteworthy issues which mayhave impacted portfolio strategy or structure inQ1 2012. For more topics and issues, pleaseconsult the separate quarterly commentary onthe global strategy.
Outlook for the market 2)
The medium- to long-term strategy (5-10 years)followed by the Fund places its emphasis on fourmain investment situations:
First, we select companies in industries whosemargins get temporarily squeezed by rising inputcosts (chemicals, packaging and foodprocessors, among others). With a time lag, theshrewd competitors in this space typically findways to apply stringent cost control and/or adjustpricing to a level that will restore, or at leastapproach, historic margins.
Second, we select companies experiencingcyclical weakness triggered by the
macroeconomic slowdown (e.g., machinery,engineering and commercial services). For theinvestor who is willing to look patiently over thecourse of an entire cycle, as we are, somebusinesses now appear too cheap given theirentrenched market positions and healthy balancesheets.
Third, we select companies in industries facingstructural issues that require a fundamentaltransformation in strategy and execution (e.g.,traditional media, advertising services, basicmaterials, certain utility services). Here, themarket now and then tends to over-discount thevalue of legacy-burdened incumbents while
placing heavy bets on newcomers with a cleanslate. Taking history as a guide, sometimes itturns out that late-movers with deep pocketsmay in the end prevail against an aggressive newentrant.
Last but not least, at these prices we also likeselect owners of land (forestry, agriculture, realestate). These equities have sold off due to theslump in global real estate finance. However,we believe that their long-term benefits asinflation-protected assets far outweigh thoseshorter-term concerns.
Portfolio ManagementGregor P. Trachsel, Director, is in charge of Value Investments within the Global Equity Team in Zurich. He joined Credit Suisse in 2008from M.M. Warburg Bank (Switzerland) Ltd. Zurich, where he was investment manager for value-based equity portfolios. Prior to that, heheld several positions in the Banking industry as investment manager and buy-side analyst. He holds an MBA from the Columbia UniversityGraduate School of Business, New York, in Accounting (Security Analysis) and Finance (Money Management).
2) If not expressly indicated otherwise, all quantitative data contained in this comment is based on Lipper, Bloomberg or Datastream.
106
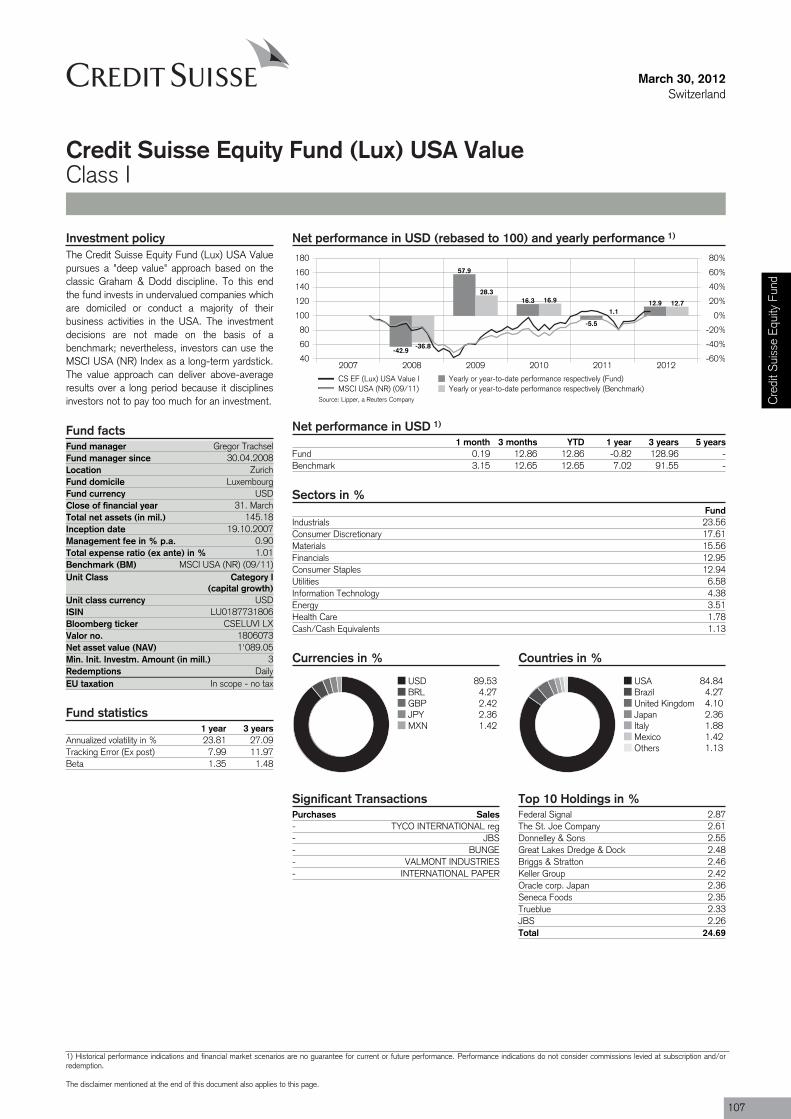
Purchases Sales- TYCO INTERNATIONAL reg- JBS- BUNGE- VALMONT INDUSTRIES- INTERNATIONAL PAPER
Fund manager Gregor TrachselFund manager since 30.04.2008Location ZurichFund domicile LuxembourgFund currency USDClose of financial year 31. MarchTotal net assets (in mil.) 145.18Inception date 19.10.2007Management fee in % p.a. 0.90Total expense ratio (ex ante) in % 1.01Benchmark (BM) MSCI USA (NR) (09/11)Unit Class Category I
(capital growth)
ISIN LU0187731806
Valor no. 1806073
Min. Init. Investm. Amount (in mill.) 3Redemptions DailyEU taxation In scope - no tax
March 30, 2012Switzerland
Credit Suisse Equity Fund (Lux) USA ValueClass I
Net performance in USD (rebased to 100) and yearly performance 1)
2007 2008 2009 2010 2011 201240
60
80
100
120
140
160
180
-60%
-40%
-20%
0%
20%
40%
60%
80%
-42.9
57.9
16.3
-5.5
12.9
-36.8
28.316.9
1.112.7
CS EF (Lux) USA Value I Yearly or year-to-date performance respectively (Fund)MSCI USA (NR) (09/11) Yearly or year-to-date performance respectively (Benchmark)
Net performance in USD 1)
1 month 3 months YTD 1 year 3 years 5 yearsFund 0.19 12.86 12.86 -0.82 128.96 -Benchmark 3.15 12.65 12.65 7.02 91.55 -
Sectors in %Fund
Industrials 23.56Consumer Discretionary 17.61Materials 15.56Financials 12.95Consumer Staples 12.94Utilities 6.58Information Technology 4.38Energy 3.51Health Care 1.78Cash/Cash Equivalents 1.13
Currencies in %
USD 89.53BRL 4.27GBP 2.42JPY 2.36MXN 1.42
Countries in %
USA 84.84Brazil 4.27United Kingdom 4.10Japan 2.36Italy 1.88Mexico 1.42Others 1.13
Top 10 Holdings in %Federal Signal 2.87The St. Joe Company 2.61Donnelley & Sons 2.55Great Lakes Dredge & Dock 2.48Briggs & Stratton 2.46Keller Group 2.42Oracle corp. Japan 2.36Seneca Foods 2.35Trueblue 2.33JBS 2.26Total 24.69
Significant Transactions
Investment policyThe Credit Suisse Equity Fund (Lux) USA Valuepursues a "deep value" approach based on theclassic Graham & Dodd discipline. To this endthe fund invests in undervalued companies whichare domiciled or conduct a majority of theirbusiness activities in the USA. The investmentdecisions are not made on the basis of abenchmark; nevertheless, investors can use theMSCI USA (NR) Index as a long-term yardstick.The value approach can deliver above-averageresults over a long period because it disciplinesinvestors not to pay too much for an investment.
Fund facts
Unit class currency USD
Bloomberg ticker CSELUVI LX
Net asset value (NAV) 1'089.05
Fund statistics1 year 3 years
Annualized volatility in % 23.81 27.09Tracking Error (Ex post) 7.99 11.97Beta 1.35 1.48
Source: Lipper, a Reuters Company Cre
dit S
uiss
e Eq
uity
Fun
d
1) Historical performance indications and financial market scenarios are no guarantee for current or future performance. Performance indications do not consider commissions levied at subscription and/orredemption.
The disclaimer mentioned at the end of this document also applies to this page.
107
March 30, 2012Switzerland
Credit Suisse Equity Fund (Lux) USA ValueClass I
Review previous quarter 2)
Performance: Net asset value (I-shares) rose by12.86% in Q1 2012. Since the Fund becameresponsibility of the Value Team on April 30,2008, it has compounded at an annual net returnrate of 4.68%.
Transactions: During Q1 2012 we newly addeda position in a multinational packaging firm to theportfolio. On the other hand, we wholly disposedof our long-time position in Tyco InternationalLtd. The company’s stock price was approachingour conservative estimate of fair value after
management announced a further split-up inthree separate companies as well as the mergerof its flow control business with Pentair Inc.
Corporate actions / mergers and acquisitions: Atthe very beginning of the reporting period ourportfolio company Sunoco Inc. completed thespin-off and separate listing of its metallurgicalcoal business, Suncoke Energy Inc.
Commentary: Perhaps interesting to note is thatthe Fund did quite well during the reporting
period despite being heavily underrepresented inthe sectors and industries that lead the market’smove to the upside, notably banks, high-tech,home builders and retailers.
There were no noteworthy issues which mayhave impacted portfolio strategy or structure inQ1 2012. For more topics and issues, pleaseconsult the separate quarterly commentary onthe global strategy.
Outlook for the market 2)
The medium- to long-term strategy (5-10 years)followed by the Fund places its emphasis on fourmain investment situations:
First, we select companies in industries whosemargins get temporarily squeezed by rising inputcosts (chemicals, packaging and foodprocessors, among others). With a time lag, theshrewd competitors in this space typically findways to apply stringent cost control and/or adjustpricing to a level that will restore, or at leastapproach, historic margins.
Second, we select companies experiencingcyclical weakness triggered by the
macroeconomic slowdown (e.g., machinery,engineering and commercial services). For theinvestor who is willing to look patiently over thecourse of an entire cycle, as we are, somebusinesses now appear too cheap given theirentrenched market positions and healthy balancesheets.
Third, we select companies in industries facingstructural issues that require a fundamentaltransformation in strategy and execution (e.g.,traditional media, advertising services, basicmaterials, certain utility services). Here, themarket now and then tends to over-discount thevalue of legacy-burdened incumbents while
placing heavy bets on newcomers with a cleanslate. Taking history as a guide, sometimes itturns out that late-movers with deep pocketsmay in the end prevail against an aggressive newentrant.
Last but not least, at these prices we also likeselect owners of land (forestry, agriculture, realestate). These equities have sold off due to theslump in global real estate finance. However,we believe that their long-term benefits asinflation-protected assets far outweigh thoseshorter-term concerns.
Portfolio ManagementGregor P. Trachsel, Director, is in charge of Value Investments within the Global Equity Team in Zurich. He joined Credit Suisse in 2008from M.M. Warburg Bank (Switzerland) Ltd. Zurich, where he was investment manager for value-based equity portfolios. Prior to that, heheld several positions in the Banking industry as investment manager and buy-side analyst. He holds an MBA from the Columbia UniversityGraduate School of Business, New York, in Accounting (Security Analysis) and Finance (Money Management).
2) If not expressly indicated otherwise, all quantitative data contained in this comment is based on Lipper, Bloomberg or Datastream.
108
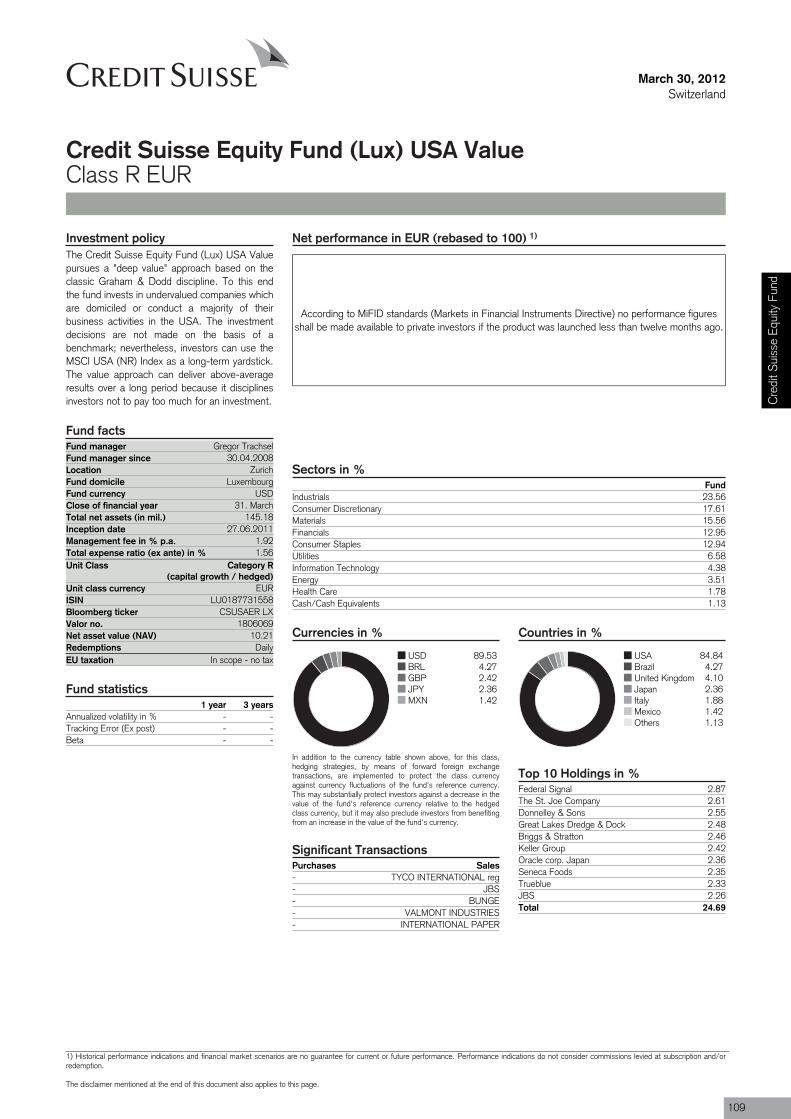
Purchases Sales- TYCO INTERNATIONAL reg- JBS- BUNGE- VALMONT INDUSTRIES- INTERNATIONAL PAPER
Fund manager Gregor TrachselFund manager since 30.04.2008Location ZurichFund domicile LuxembourgFund currency USDClose of financial year 31. MarchTotal net assets (in mil.) 145.18Inception date 27.06.2011Management fee in % p.a. 1.92Total expense ratio (ex ante) in % 1.56Unit Class Category R
(capital growth / hedged)
ISIN LU0187731558
Valor no. 1806069
Redemptions DailyEU taxation In scope - no tax
March 30, 2012Switzerland
Credit Suisse Equity Fund (Lux) USA ValueClass R EUR
Net performance in EUR (rebased to 100) 1)
According to MiFID standards (Markets in Financial Instruments Directive) no performance figuresshall be made available to private investors if the product was launched less than twelve months ago.
Sectors in %Fund
Industrials 23.56Consumer Discretionary 17.61Materials 15.56Financials 12.95Consumer Staples 12.94Utilities 6.58Information Technology 4.38Energy 3.51Health Care 1.78Cash/Cash Equivalents 1.13
Currencies in %
USD 89.53BRL 4.27GBP 2.42JPY 2.36MXN 1.42
In addition to the currency table shown above, for this class,hedging strategies, by means of forward foreign exchangetransactions, are implemented to protect the class currencyagainst currency fluctuations of the fund's reference currency.This may substantially protect investors against a decrease in thevalue of the fund's reference currency relative to the hedgedclass currency, but it may also preclude investors from benefitingfrom an increase in the value of the fund's currency.
Countries in %
USA 84.84Brazil 4.27United Kingdom 4.10Japan 2.36Italy 1.88Mexico 1.42Others 1.13
Top 10 Holdings in %Federal Signal 2.87The St. Joe Company 2.61Donnelley & Sons 2.55Great Lakes Dredge & Dock 2.48Briggs & Stratton 2.46Keller Group 2.42Oracle corp. Japan 2.36Seneca Foods 2.35Trueblue 2.33JBS 2.26Total 24.69
Significant Transactions
Investment policyThe Credit Suisse Equity Fund (Lux) USA Valuepursues a "deep value" approach based on theclassic Graham & Dodd discipline. To this endthe fund invests in undervalued companies whichare domiciled or conduct a majority of theirbusiness activities in the USA. The investmentdecisions are not made on the basis of abenchmark; nevertheless, investors can use theMSCI USA (NR) Index as a long-term yardstick.The value approach can deliver above-averageresults over a long period because it disciplinesinvestors not to pay too much for an investment.
Fund facts
Unit class currency EUR
Bloomberg ticker CSUSAER LX
Net asset value (NAV) 10.21
Fund statistics1 year 3 years
Annualized volatility in % - -Tracking Error (Ex post) - -Beta - -
Cre
dit S
uiss
e Eq
uity
Fun
d
1) Historical performance indications and financial market scenarios are no guarantee for current or future performance. Performance indications do not consider commissions levied at subscription and/orredemption.
The disclaimer mentioned at the end of this document also applies to this page.
109

March 30, 2012Switzerland
Credit Suisse Equity Fund (Lux) USA ValueClass R EUR
Review previous quarter 2)
Performance: Net asset value (I-shares) rose by12.86% in Q1 2012. Since the Fund becameresponsibility of the Value Team on April 30,2008, it has compounded at an annual net returnrate of 4.68%.
Transactions: During Q1 2012 we newly addeda position in a multinational packaging firm to theportfolio. On the other hand, we wholly disposedof our long-time position in Tyco InternationalLtd. The company’s stock price was approachingour conservative estimate of fair value after
management announced a further split-up inthree separate companies as well as the mergerof its flow control business with Pentair Inc.
Corporate actions / mergers and acquisitions: Atthe very beginning of the reporting period ourportfolio company Sunoco Inc. completed thespin-off and separate listing of its metallurgicalcoal business, Suncoke Energy Inc.
Commentary: Perhaps interesting to note is thatthe Fund did quite well during the reporting
period despite being heavily underrepresented inthe sectors and industries that lead the market’smove to the upside, notably banks, high-tech,home builders and retailers.
There were no noteworthy issues which mayhave impacted portfolio strategy or structure inQ1 2012. For more topics and issues, pleaseconsult the separate quarterly commentary onthe global strategy.
Outlook for the market 2)
The medium- to long-term strategy (5-10 years)followed by the Fund places its emphasis on fourmain investment situations:
First, we select companies in industries whosemargins get temporarily squeezed by rising inputcosts (chemicals, packaging and foodprocessors, among others). With a time lag, theshrewd competitors in this space typically findways to apply stringent cost control and/or adjustpricing to a level that will restore, or at leastapproach, historic margins.
Second, we select companies experiencingcyclical weakness triggered by the
macroeconomic slowdown (e.g., machinery,engineering and commercial services). For theinvestor who is willing to look patiently over thecourse of an entire cycle, as we are, somebusinesses now appear too cheap given theirentrenched market positions and healthy balancesheets.
Third, we select companies in industries facingstructural issues that require a fundamentaltransformation in strategy and execution (e.g.,traditional media, advertising services, basicmaterials, certain utility services). Here, themarket now and then tends to over-discount thevalue of legacy-burdened incumbents while
placing heavy bets on newcomers with a cleanslate. Taking history as a guide, sometimes itturns out that late-movers with deep pocketsmay in the end prevail against an aggressive newentrant.
Last but not least, at these prices we also likeselect owners of land (forestry, agriculture, realestate). These equities have sold off due to theslump in global real estate finance. However,we believe that their long-term benefits asinflation-protected assets far outweigh thoseshorter-term concerns.
Portfolio ManagementGregor P. Trachsel, Director, is in charge of Value Investments within the Global Equity Team in Zurich. He joined Credit Suisse in 2008from M.M. Warburg Bank (Switzerland) Ltd. Zurich, where he was investment manager for value-based equity portfolios. Prior to that, heheld several positions in the Banking industry as investment manager and buy-side analyst. He holds an MBA from the Columbia UniversityGraduate School of Business, New York, in Accounting (Security Analysis) and Finance (Money Management).
2) If not expressly indicated otherwise, all quantitative data contained in this comment is based on Lipper, Bloomberg or Datastream.
110
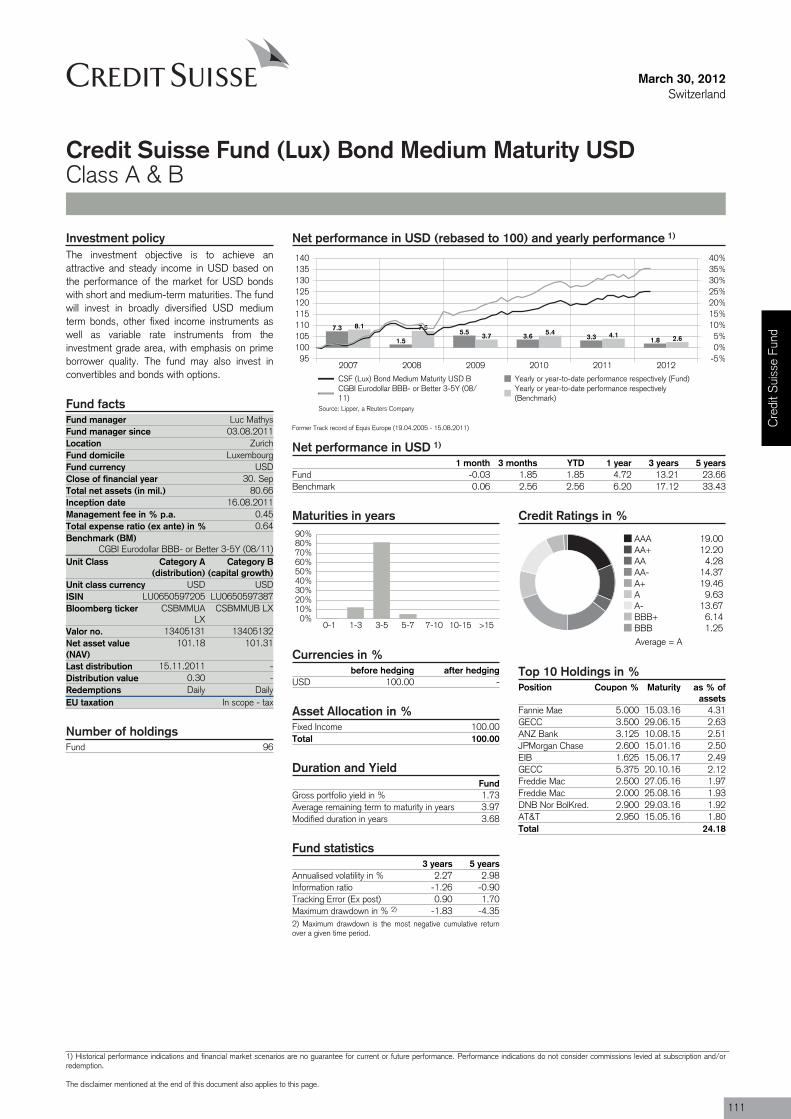
Fund manager Luc MathysFund manager since 03.08.2011Location ZurichFund domicile LuxembourgFund currency USDClose of financial year 30. SepTotal net assets (in mil.) 80.66Inception date 16.08.2011Management fee in % p.a. 0.45Total expense ratio (ex ante) in % 0.64Benchmark (BM)
CGBI Eurodollar BBB- or Better 3-5Y (08/11)Unit Class Category A
(distribution)
ISIN LU0650597205
Valor no. 13405131
Last distribution 15.11.2011Distribution value 0.30Redemptions DailyEU taxation In scope - tax
Fund 96
March 30, 2012Switzerland
Credit Suisse Fund (Lux) Bond Medium Maturity USDClass A & B
Net performance in USD (rebased to 100) and yearly performance 1)
2007 2008 2009 2010 2011 201295
100105110115120125130135140
-5%0%5%
10%15%20%25%30%35%40%
7.3
1.55.5 3.6 3.3 1.8
8.1 7.53.7 5.4 4.1 2.6
CSF (Lux) Bond Medium Maturity USD B Yearly or year-to-date performance respectively (Fund)CGBI Eurodollar BBB- or Better 3-5Y (08/11)
Yearly or year-to-date performance respectively(Benchmark)
Former Track record of Equis Europe (19.04.2005 - 15.08.2011)
Net performance in USD 1)
1 month 3 months YTD 1 year 3 years 5 yearsFund -0.03 1.85 1.85 4.72 13.21 23.66Benchmark 0.06 2.56 2.56 6.20 17.12 33.43
Maturities in years
0%10%20%30%40%50%60%70%80%90%
0-1 1-3 3-5 5-7 7-10 10-15 >15
Currencies in %before hedging after hedging
USD 100.00 -
Asset Allocation in %Fixed Income 100.00Total 100.00
Duration and YieldFund
Gross portfolio yield in % 1.73Average remaining term to maturity in years 3.97Modified duration in years 3.68
Fund statistics3 years 5 years
Annualised volatility in % 2.27 2.98Information ratio -1.26 -0.90Tracking Error (Ex post) 0.90 1.70Maximum drawdown in % 2) -1.83 -4.352) Maximum drawdown is the most negative cumulative returnover a given time period.
Credit Ratings in %
AAA 19.00AA+ 12.20AA 4.28AA- 14.37A+ 19.46A 9.63A- 13.67BBB+ 6.14BBB 1.25
Top 10 Holdings in %Position Coupon % Maturity as % of
assetsFannie Mae 5.000 15.03.16 4.31GECC 3.500 29.06.15 2.63ANZ Bank 3.125 10.08.15 2.51JPMorgan Chase 2.600 15.01.16 2.50EIB 1.625 15.06.17 2.49GECC 5.375 20.10.16 2.12Freddie Mac 2.500 27.05.16 1.97Freddie Mac 2.000 25.08.16 1.93DNB Nor BolKred. 2.900 29.03.16 1.92AT&T 2.950 15.05.16 1.80Total 24.18
Investment policyThe investment objective is to achieve anattractive and steady income in USD based onthe performance of the market for USD bondswith short and medium-term maturities. The fundwill invest in broadly diversified USD mediumterm bonds, other fixed income instruments aswell as variable rate instruments from theinvestment grade area, with emphasis on primeborrower quality. The fund may also invest inconvertibles and bonds with options.
Fund facts
Category B(capital growth)
Unit class currency USD USDLU0650597387
Bloomberg ticker CSBMMUALX
CSBMMUB LX
13405132Net asset value(NAV)
101.18 101.31
--
Daily
Number of holdings
Source: Lipper, a Reuters Company
Average = A
Cre
dit S
uiss
e Fu
nd
1) Historical performance indications and financial market scenarios are no guarantee for current or future performance. Performance indications do not consider commissions levied at subscription and/orredemption.
The disclaimer mentioned at the end of this document also applies to this page.
111
March 30, 2012Switzerland
Credit Suisse Fund (Lux) Bond Medium Maturity USDClass A & B
Review previous quarter 3)
In the first quarter, with global economicindicators remaining surprisingly resilient – mainlyin the US, emerging markets and selectedEuropean countries – and massive interventionsby the ECB, financial system stability hasimproved and the downside risk to the globaleconomy has been substantially reduced.
In the US, with the unemployment ratedecreasing to 8.3% and unemployment benefitclaims falling to the lowest level since April 2008,consumer confidence reached the
second-highest level in four years and retail salescontinued to climb. Additionally, purchasingmanager indices pointed to a continuedexpansion in business activity. On the otherhand, with oil prices back close to their 2011peaks, inflation rose in February the most in 10months, mainly driven by gasoline prices,accounting for roughly 80% of the headlinefigure.
In the first quarter, the improved financial andeconomic picture supported riskier asset classes
and longer-dated Treasury rates correctedsignificantly higher. Despite the negative impactfrom rising government rates, the CitigroupEurodollar 3-5 years index showed a positiveperformance of 2.56%, mainly due to tightercredit spreads. During the same time period,the relevant swap curve steepened slightly with5-year rates up 4bps at 1.27% and 3-year ratesdown by 6bps to 0.76%. Opposite to theprevious quarter, credit spread contraction wasmainly led by lower rated companies andfinancials.
Outlook for the market 3)
Massive interventions by the ECB, as well as theGreek debt restructuring, have improved financialstability globally and reduced the risk of a majordownturn. However, the sovereign debt risk hasnot been fully removed and could flare up again.Barring major turmoil, the US recovery looksquite robust, and limited upside surprises arestill possible. Private consumption is supportedby stronger labor income and credit growth, buthigher gasoline prices pose a risk.
While we expect in the short-term interest rate
markets to remain supported by monetary policyand systemic risks, we remain negative on thelong end of the interest rate curve, as currentyields do not compensate for future credit andinflation risks. However, with a significant yieldpick-up and protection from continued easymonetary policy, the short and medium termsegment remains attractive. While the corporatesector remains in a healthy state for the timebeing and supply and demand factors – newissues generally remain oversubscribed by amultiple – are supporting credits, the current rally
has reduced the ability to absorb future volatility.
We continue to invest into fundamentally strongcorporate and financial bonds and at the sametime try to remain as liquid as possible in thecurrent market environment. While subordinatedfinancial debt remains supported by exchangeoffers and the general improvement in investorsentiment, downgrades and political risks keepus alert on this sector.
Portfolio ManagementLuc Mathys joined Credit Suisse in December 2007 as head of global rates and credit within MACS Fixed Income. Prior he wasresponsible for the money market and global fixed in-come products within the fixed income group of Clariden Leu and managed severalinvest-ment funds. Previously he spent two years at Bank Hofmann in the fixed income research and fund management department wherehe was responsible for managing bond funds and for research and distribution of structured investment products. Prior he worked invarious roles and locations for UBS, ultimately as fixed income and currency fund manager at UBS Global Asset Management. Luc Mathysstudied economics, focusing on financial market theory and econometrics, at the University of Bern. In 2003 he successfully qualified as aChartered Financial Analyst (CFA), and then as a Financial Risk Manager (FRM).
3) If not expressly indicated otherwise, all quantitative data contained in this comment is based on Lipper, Bloomberg or Datastream.
112
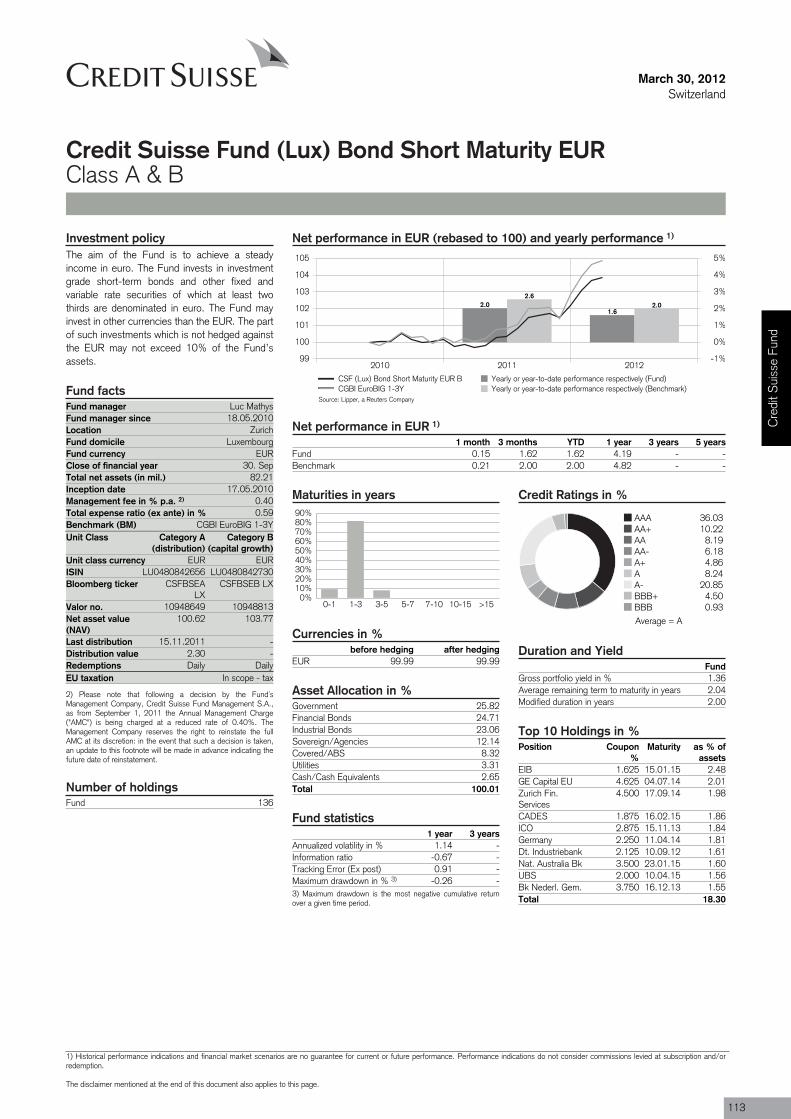
Fund manager Luc MathysFund manager since 18.05.2010Location ZurichFund domicile LuxembourgFund currency EURClose of financial year 30. SepTotal net assets (in mil.) 82.21Inception date 17.05.2010Management fee in % p.a. 2) 0.40Total expense ratio (ex ante) in % 0.59Benchmark (BM) CGBI EuroBIG 1-3YUnit Class Category A
(distribution)
ISIN LU0480842656
Valor no. 10948649
Last distribution 15.11.2011Distribution value 2.30Redemptions DailyEU taxation In scope - tax
Fund 136
March 30, 2012Switzerland
Credit Suisse Fund (Lux) Bond Short Maturity EURClass A & B
Net performance in EUR (rebased to 100) and yearly performance 1)
2010 2011 201299
100
101
102
103
104
105
-1%
0%
1%
2%
3%
4%
5%
2.01.6
2.62.0
CSF (Lux) Bond Short Maturity EUR B Yearly or year-to-date performance respectively (Fund)CGBI EuroBIG 1-3Y Yearly or year-to-date performance respectively (Benchmark)
Net performance in EUR 1)
1 month 3 months YTD 1 year 3 years 5 yearsFund 0.15 1.62 1.62 4.19 - -Benchmark 0.21 2.00 2.00 4.82 - -
Maturities in years
0%10%20%30%40%50%60%70%80%90%
0-1 1-3 3-5 5-7 7-10 10-15 >15
Currencies in %before hedging after hedging
EUR 99.99 99.99
Asset Allocation in %Government 25.82Financial Bonds 24.71Industrial Bonds 23.06Sovereign/Agencies 12.14Covered/ABS 8.32Utilities 3.31Cash/Cash Equivalents 2.65Total 100.01
Fund statistics1 year 3 years
Annualized volatility in % 1.14 -Information ratio -0.67 -Tracking Error (Ex post) 0.91 -Maximum drawdown in % 3) -0.26 -3) Maximum drawdown is the most negative cumulative returnover a given time period.
Credit Ratings in %
AAA 36.03AA+ 10.22AA 8.19AA- 6.18A+ 4.86A 8.24A- 20.85BBB+ 4.50BBB 0.93
Duration and YieldFund
Gross portfolio yield in % 1.36Average remaining term to maturity in years 2.04Modified duration in years 2.00
Top 10 Holdings in %Position Coupon
%Maturity as % of
assetsEIB 1.625 15.01.15 2.48GE Capital EU 4.625 04.07.14 2.01Zurich Fin.Services
4.500 17.09.14 1.98
CADES 1.875 16.02.15 1.86ICO 2.875 15.11.13 1.84Germany 2.250 11.04.14 1.81Dt. Industriebank 2.125 10.09.12 1.61Nat. Australia Bk 3.500 23.01.15 1.60UBS 2.000 10.04.15 1.56Bk Nederl. Gem. 3.750 16.12.13 1.55Total 18.30
Investment policyThe aim of the Fund is to achieve a steadyincome in euro. The Fund invests in investmentgrade short-term bonds and other fixed andvariable rate securities of which at least twothirds are denominated in euro. The Fund mayinvest in other currencies than the EUR. The partof such investments which is not hedged againstthe EUR may not exceed 10% of the Fund’sassets.
Fund facts
Category B(capital growth)
Unit class currency EUR EURLU0480842730
Bloomberg ticker CSFBSEALX
CSFBSEB LX
10948813Net asset value(NAV)
100.62 103.77
--
Daily
2) Please note that following a decision by the Fund´sManagement Company, Credit Suisse Fund Management S.A.,as from September 1, 2011 the Annual Management Charge("AMC") is being charged at a reduced rate of 0.40%. TheManagement Company reserves the right to reinstate the fullAMC at its discretion: in the event that such a decision is taken,an update to this footnote will be made in advance indicating thefuture date of reinstatement.
Number of holdings
Source: Lipper, a Reuters Company
Average = A
Cre
dit S
uiss
e Fu
nd
1) Historical performance indications and financial market scenarios are no guarantee for current or future performance. Performance indications do not consider commissions levied at subscription and/orredemption.
The disclaimer mentioned at the end of this document also applies to this page.
113
March 30, 2012Switzerland
Credit Suisse Fund (Lux) Bond Short Maturity EURClass A & B
Review previous quarter 4)
In the first quarter, with global economicindicators remaining surprisingly resilient – mainlyin the US, emerging markets and selectedEuropean countries – and massive interventionsby the ECB, financial system stability hasimproved and the downside risk to the globaleconomy has been substantially reduced.
In Europe, we saw a relatively successfuloutcome of the debt exchange offer for Greekdebt and the announcement to increase totalfire power of the European Financial StabilityFacility and European Stability Mechanism to atotal of EUR 500bn – excluding already paid-outor announced schemes. Additionally, the ECB
provided another substantial liquidity injection tothe financial system in the euro area. The secondLong Term Refinancing Operation provided atotal of nearly EUR 530bn in fixed rate funding,and the balance sheet of the ECB has beenboosted by more than half a trillion sinceDecember.
However, with the exception of a few countrieslike Germany, the region is still facing majorheadwinds and the unemployment rate increasedto 10.8%, the highest level in almost 14 years.At the same time inflation slowed less thaneconomists forecasted due to higher energyprices.
In the first quarter, the improved financial andeconomic picture supported riskier asset classes.Mainly driven by spread tightening in the creditand sovereign sector, the Citigroup EuroBig 1-3years index showed a positive performance in thefirst quarter of 2%. During the same time period,the relevant swap curve steepened with 3-yearrates down by 15bps to 1.21% and 1-year ratesdown by 39bps to 1.03%. Opposite to theprevious quarter, credit spread contraction wasmainly led by lower rated issuers, financials andselected peripheral sovereigns like Italy orIreland.
Outlook for the market 4)
While the massive liquidity injections by the ECBand the Greek debt restructuring havesucceeded in stabilizing banks and governmentdebt funding stress, structural financial issuesand economic weakness remain in place. InEurope, fiscal tightening should keep the overalleconomy weak, and divergences within Europeare expected to remain pronounced. Whileimmediate further easing in monetary policyseems to be unlikely at the current stage, weexpect expansionary policy to continue as somekey risks remain in place, like, for example, highoil prices or the continued struggle of European
sovereigns to improve their financial situation.While we expect in the short-term interest ratemarkets to remain supported by monetary policyand systemic risks, we remain negative on thelong end of the interest rate curve, as currentyields do not compensate for future credit andinflation risks.
However, with a significant yield pick-up andprotection from continued easy monetary policy,the short and medium term segment remainsattractive. While the corporate sector remains ina healthy state for the time being and supply and
demand factors – new issues generally remainoversubscribed by a multiple – are supportingcredits, the current rally has reduced the ability toabsorb future volatility.
We continue to invest into fundamentally strongcorporate and financial bonds and at the sametime try to remain as liquid as possible in thecurrent market environment. While subordinatedfinancial debt remains supported by exchangeoffers and the general improvement in investorsentiment, downgrades and political risks keepus alert on this sector.
Portfolio ManagementLuc Mathys joined Credit Suisse in December 2007 as head of global rates and credit within MACS Fixed Income. Prior he wasresponsible for the money market and global fixed in-come products within the fixed income group of Clariden Leu and managed severalinvest-ment funds. Previously he spent two years at Bank Hofmann in the fixed income research and fund management department wherehe was responsible for managing bond funds and for research and distribution of structured investment products. Prior he worked invarious roles and locations for UBS, ultimately as fixed income and currency fund manager at UBS Global Asset Management. Luc Mathysstudied economics, focusing on financial market theory and econometrics, at the University of Bern. In 2003 he successfully qualified as aChartered Financial Analyst (CFA), and then as a Financial Risk Manager (FRM).
4) If not expressly indicated otherwise, all quantitative data contained in this comment is based on Lipper, Bloomberg or Datastream.
114
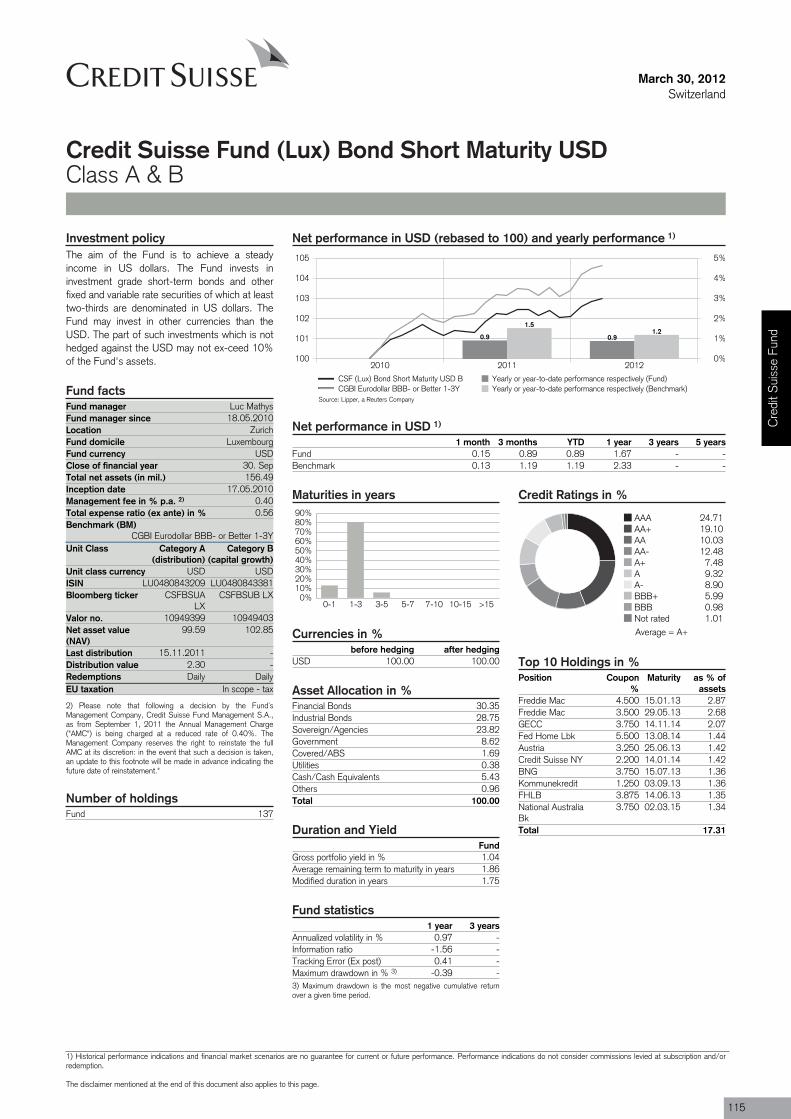
Fund manager Luc MathysFund manager since 18.05.2010Location ZurichFund domicile LuxembourgFund currency USDClose of financial year 30. SepTotal net assets (in mil.) 156.49Inception date 17.05.2010Management fee in % p.a. 2) 0.40Total expense ratio (ex ante) in % 0.56Benchmark (BM)
CGBI Eurodollar BBB- or Better 1-3YUnit Class Category A
(distribution)
ISIN LU0480843209
Valor no. 10949399
Last distribution 15.11.2011Distribution value 2.30Redemptions DailyEU taxation In scope - tax
Fund 137
March 30, 2012Switzerland
Credit Suisse Fund (Lux) Bond Short Maturity USDClass A & B
Net performance in USD (rebased to 100) and yearly performance 1)
2010 2011 2012100
101
102
103
104
105
0%
1%
2%
3%
4%
5%
0.9 0.9
1.51.2
CSF (Lux) Bond Short Maturity USD B Yearly or year-to-date performance respectively (Fund)CGBI Eurodollar BBB- or Better 1-3Y Yearly or year-to-date performance respectively (Benchmark)
Net performance in USD 1)
1 month 3 months YTD 1 year 3 years 5 yearsFund 0.15 0.89 0.89 1.67 - -Benchmark 0.13 1.19 1.19 2.33 - -
Maturities in years
0%10%20%30%40%50%60%70%80%90%
0-1 1-3 3-5 5-7 7-10 10-15 >15
Currencies in %before hedging after hedging
USD 100.00 100.00
Asset Allocation in %Financial Bonds 30.35Industrial Bonds 28.75Sovereign/Agencies 23.82Government 8.62Covered/ABS 1.69Utilities 0.38Cash/Cash Equivalents 5.43Others 0.96Total 100.00
Duration and YieldFund
Gross portfolio yield in % 1.04Average remaining term to maturity in years 1.86Modified duration in years 1.75
Fund statistics1 year 3 years
Annualized volatility in % 0.97 -Information ratio -1.56 -Tracking Error (Ex post) 0.41 -Maximum drawdown in % 3) -0.39 -3) Maximum drawdown is the most negative cumulative returnover a given time period.
Credit Ratings in %
AAA 24.71AA+ 19.10AA 10.03AA- 12.48A+ 7.48A 9.32A- 8.90BBB+ 5.99BBB 0.98Not rated 1.01
Top 10 Holdings in %Position Coupon
%Maturity as % of
assetsFreddie Mac 4.500 15.01.13 2.87Freddie Mac 3.500 29.05.13 2.68GECC 3.750 14.11.14 2.07Fed Home Lbk 5.500 13.08.14 1.44Austria 3.250 25.06.13 1.42Credit Suisse NY 2.200 14.01.14 1.42BNG 3.750 15.07.13 1.36Kommunekredit 1.250 03.09.13 1.36FHLB 3.875 14.06.13 1.35National AustraliaBk
3.750 02.03.15 1.34
Total 17.31
Investment policyThe aim of the Fund is to achieve a steadyincome in US dollars. The Fund invests ininvestment grade short-term bonds and otherfixed and variable rate securities of which at leasttwo-thirds are denominated in US dollars. TheFund may invest in other currencies than theUSD. The part of such investments which is nothedged against the USD may not ex-ceed 10%of the Fund's assets.
Fund facts
Category B(capital growth)
Unit class currency USD USDLU0480843381
Bloomberg ticker CSFBSUALX
CSFBSUB LX
10949403Net asset value(NAV)
99.59 102.85
--
Daily
2) Please note that following a decision by the Fund´sManagement Company, Credit Suisse Fund Management S.A.,as from September 1, 2011 the Annual Management Charge("AMC") is being charged at a reduced rate of 0.40%. TheManagement Company reserves the right to reinstate the fullAMC at its discretion: in the event that such a decision is taken,an update to this footnote will be made in advance indicating thefuture date of reinstatement."
Number of holdings
Source: Lipper, a Reuters Company
Average = A+
Cre
dit S
uiss
e Fu
nd
1) Historical performance indications and financial market scenarios are no guarantee for current or future performance. Performance indications do not consider commissions levied at subscription and/orredemption.
The disclaimer mentioned at the end of this document also applies to this page.
115
March 30, 2012Switzerland
Credit Suisse Fund (Lux) Bond Short Maturity USDClass A & B
Review previous quarter 4)
In the first quarter, with global economicindicators remaining surprisingly resilient – mainlyin the US, emerging markets and selectedEuropean countries – and massive interventionsby the ECB, financial system stability hasimproved and the downside risk to the globaleconomy has been substantially reduced.
In the US, with the unemployment ratedecreasing to 8.3% and unemployment benefitclaims falling to the lowest level since April 2008,consumer confidence reached the
second-highest level in four years and retail salescontinued to climb. Additionally, purchasingmanager indices pointed to a continuedexpansion in business activity. On the otherhand, with oil prices back close to their 2011peaks, inflation rose in February the most in 10months, mainly driven by gasoline prices,accounting for roughly 80% of the headlinefigure.
In the first quarter, the improved financial andeconomic picture supported riskier asset classes
and longer-dated Treasury rates correctedsignificantly higher. Despite the negative impactfrom rising government rates, the CitigroupEurodollar 1-3 years index showed a positiveperformance of 1.19%, mainly due to tightercredit spreads. During the same time period, therelevant swap curve steepened with 3-year ratesdown by 6bps to 0.76% and 1-year rates downby 19bps to 0.49%. Opposite to the previousquarter, credit spread contraction was mainly ledby lower rated companies and financials.
Outlook for the market 4)
Massive interventions by the ECB, as well as theGreek debt restructuring, have improved financialstability globally and reduced the risk of a majordownturn. However, the sovereign debt risk hasnot been fully removed and could flare up again.Barring major turmoil, the US recovery looksquite robust, and limited upside surprises arestill possible. Private consumption is supportedby stronger labor income and credit growth, buthigher gasoline prices pose a risk.
While we expect in the short-term interest rate
markets to remain supported by monetary policyand systemic risks, we remain negative on thelong end of the interest rate curve, as currentyields do not compensate for future credit andinflation risks. However, with a significant yieldpick-up and protection from continued easymonetary policy, the short and medium termsegment remains attractive. While the corporatesector remains in a healthy state for the timebeing and supply and demand factors – newissues generally remain oversubscribed by amultiple – are supporting credits, the current rally
has reduced the ability to absorb future volatility.
We continue to invest into fundamentally strongcorporate and financial bonds and at the sametime try to remain as liquid as possible in thecurrent market environment. While subordinatedfinancial debt remains supported by exchangeoffers and the general improvement in investorsentiment, downgrades and political risks keepus alert on this sector.
Portfolio ManagementLuc Mathys joined Credit Suisse in December 2007 as head of global rates and credit within MACS Fixed Income. Prior he wasresponsible for the money market and global fixed in-come products within the fixed income group of Clariden Leu and managed severalinvest-ment funds. Previously he spent two years at Bank Hofmann in the fixed income research and fund management department wherehe was responsible for managing bond funds and for research and distribution of structured investment products. Prior he worked invarious roles and locations for UBS, ultimately as fixed income and currency fund manager at UBS Global Asset Management. Luc Mathysstudied economics, focusing on financial market theory and econometrics, at the University of Bern. In 2003 he successfully qualified as aChartered Financial Analyst (CFA), and then as a Financial Risk Manager (FRM).
4) If not expressly indicated otherwise, all quantitative data contained in this comment is based on Lipper, Bloomberg or Datastream.
116
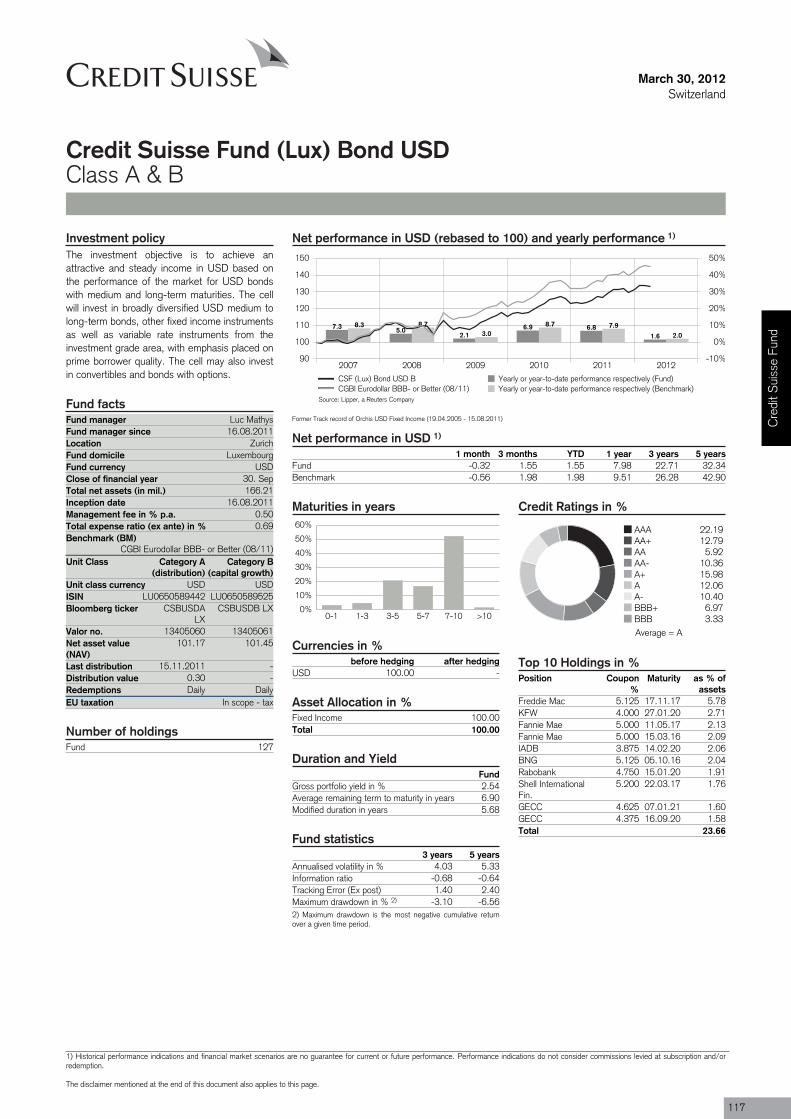
Fund manager Luc MathysFund manager since 16.08.2011Location ZurichFund domicile LuxembourgFund currency USDClose of financial year 30. SepTotal net assets (in mil.) 166.21Inception date 16.08.2011Management fee in % p.a. 0.50Total expense ratio (ex ante) in % 0.69Benchmark (BM)
CGBI Eurodollar BBB- or Better (08/11)Unit Class Category A
(distribution)
ISIN LU0650589442
Valor no. 13405060
Last distribution 15.11.2011Distribution value 0.30Redemptions DailyEU taxation In scope - tax
Fund 127
March 30, 2012Switzerland
Credit Suisse Fund (Lux) Bond USDClass A & B
Net performance in USD (rebased to 100) and yearly performance 1)
2007 2008 2009 2010 2011 201290
100
110
120
130
140
150
-10%
0%
10%
20%
30%
40%
50%
7.3 5.02.1
6.9 6.81.6
8.3 8.73.0
8.7 7.92.0
CSF (Lux) Bond USD B Yearly or year-to-date performance respectively (Fund)CGBI Eurodollar BBB- or Better (08/11) Yearly or year-to-date performance respectively (Benchmark)
Former Track record of Orchis USD Fixed Income (19.04.2005 - 15.08.2011)
Net performance in USD 1)
1 month 3 months YTD 1 year 3 years 5 yearsFund -0.32 1.55 1.55 7.98 22.71 32.34Benchmark -0.56 1.98 1.98 9.51 26.28 42.90
Maturities in years
0%
10%
20%
30%
40%
50%
60%
0-1 1-3 3-5 5-7 7-10 >10
Currencies in %before hedging after hedging
USD 100.00 -
Asset Allocation in %Fixed Income 100.00Total 100.00
Duration and YieldFund
Gross portfolio yield in % 2.54Average remaining term to maturity in years 6.90Modified duration in years 5.68
Fund statistics3 years 5 years
Annualised volatility in % 4.03 5.33Information ratio -0.68 -0.64Tracking Error (Ex post) 1.40 2.40Maximum drawdown in % 2) -3.10 -6.562) Maximum drawdown is the most negative cumulative returnover a given time period.
Credit Ratings in %
AAA 22.19AA+ 12.79AA 5.92AA- 10.36A+ 15.98A 12.06A- 10.40BBB+ 6.97BBB 3.33
Top 10 Holdings in %Position Coupon
%Maturity as % of
assetsFreddie Mac 5.125 17.11.17 5.78KFW 4.000 27.01.20 2.71Fannie Mae 5.000 11.05.17 2.13Fannie Mae 5.000 15.03.16 2.09IADB 3.875 14.02.20 2.06BNG 5.125 05.10.16 2.04Rabobank 4.750 15.01.20 1.91Shell InternationalFin.
5.200 22.03.17 1.76
GECC 4.625 07.01.21 1.60GECC 4.375 16.09.20 1.58Total 23.66
Investment policyThe investment objective is to achieve anattractive and steady income in USD based onthe performance of the market for USD bondswith medium and long-term maturities. The cellwill invest in broadly diversified USD medium tolong-term bonds, other fixed income instrumentsas well as variable rate instruments from theinvestment grade area, with emphasis placed onprime borrower quality. The cell may also investin convertibles and bonds with options.
Fund facts
Category B(capital growth)
Unit class currency USD USDLU0650589525
Bloomberg ticker CSBUSDALX
CSBUSDB LX
13405061Net asset value(NAV)
101.17 101.45
--
Daily
Number of holdings
Source: Lipper, a Reuters Company
Average = A
Cre
dit S
uiss
e Fu
nd
1) Historical performance indications and financial market scenarios are no guarantee for current or future performance. Performance indications do not consider commissions levied at subscription and/orredemption.
The disclaimer mentioned at the end of this document also applies to this page.
117
March 30, 2012Switzerland
Credit Suisse Fund (Lux) Bond USDClass A & B
Review previous quarter 3)
In the first quarter, with global economicindicators remaining surprisingly resilient – mainlyin the US, emerging markets and selectedEuropean countries – and massive interventionsby the ECB, financial system stability hasimproved and the downside risk to the globaleconomy has been substantially reduced.
In the US, with the unemployment ratedecreasing to 8.3% and unemployment benefitclaims falling to the lowest level since April 2008,consumer confidence reached the
second-highest level in four years and retail salescontinued to climb. Additionally, purchasingmanager indices pointed to a continuedexpansion in business activity. On the otherhand, with oil prices back close to their 2011peaks, inflation rose in February the most in 10months, mainly driven by gasoline prices,accounting for roughly 80% of the headlinefigure.
In the first quarter, the improved financial andeconomic picture supported riskier asset classes
and longer-dated Treasury rates correctedsignificantly higher. Despite the negative impactfrom rising government rates, the CitigroupEurodollar index showed a positive performanceof 1.98% due to tighter credit spreads. Duringthe same time period, the relevant swap curvesteepened significantly with 10-year rates up by26bps to 2.28% and 2-year rates down by15bps to 0.58%. Opposite to the previousquarter, credit spread contraction was mainly ledby lower rated companies and financials.
Outlook for the market 3)
Massive interventions by the ECB, as well as theGreek debt restructuring, have improved financialstability globally and reduced the risk of a majordownturn. However, the sovereign debt risk hasnot been fully removed and could flare up again.Barring major turmoil, the US recovery looksquite robust, and limited upside surprises arestill possible. Private consumption is supportedby stronger labor income and credit growth, buthigher gasoline prices pose a risk.
While we expect in the short-term interest rate
markets to remain supported by monetary policyand systemic risks, we remain negative on thelong end of the interest rate curve, as currentyields do not compensate for future credit andinflation risks. However, with a significant yieldpick-up and protection from continued easymonetary policy, the short and medium termsegment remains attractive. While the corporatesector remains in a healthy state for the timebeing and supply and demand factors – newissues generally remain oversubscribed by amultiple – are supporting credits, the current rally
has reduced the ability to absorb future volatility.
We continue to invest into fundamentally strongcorporate and financial bonds and at the sametime try to remain as liquid as possible in thecurrent market environment. While subordinatedfinancial debt remains supported by exchangeoffers and the general improvement in investorsentiment, downgrades and political risks keepus alert on this sector.
Portfolio ManagementLuc Mathys joined Credit Suisse in December 2007 as head of global rates and credit within MACS Fixed Income. Prior he wasresponsible for the money market and global fixed in-come products within the fixed income group of Clariden Leu and managed severalinvest-ment funds. Previously he spent two years at Bank Hofmann in the fixed income research and fund management department wherehe was responsible for managing bond funds and for research and distribution of structured investment products. Prior he worked invarious roles and locations for UBS, ultimately as fixed income and currency fund manager at UBS Global Asset Management. Luc Mathysstudied economics, focusing on financial market theory and econometrics, at the University of Bern. In 2003 he successfully qualified as aChartered Financial Analyst (CFA), and then as a Financial Risk Manager (FRM).
3) If not expressly indicated otherwise, all quantitative data contained in this comment is based on Lipper, Bloomberg or Datastream.
118
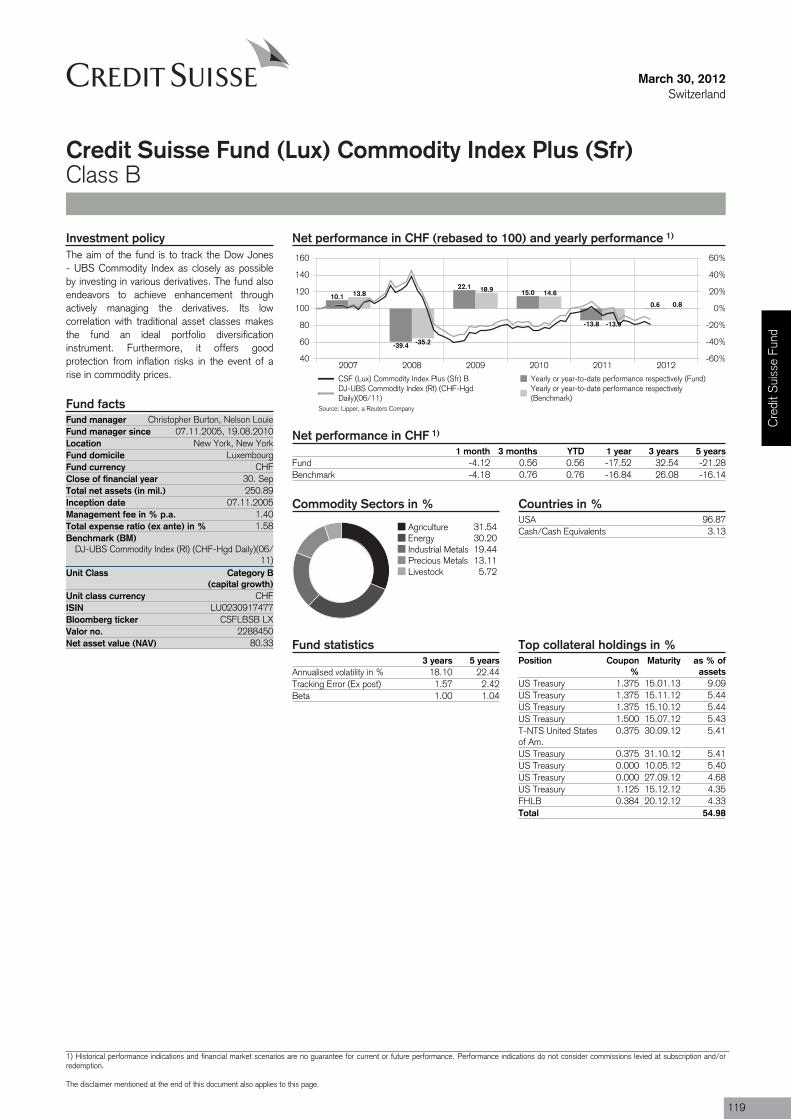
Fund manager Christopher Burton, Nelson LouieFund manager since 07.11.2005, 19.08.2010Location New York, New YorkFund domicile LuxembourgFund currency CHFClose of financial year 30. SepTotal net assets (in mil.) 250.89Inception date 07.11.2005Management fee in % p.a. 1.40Total expense ratio (ex ante) in % 1.58Benchmark (BM)
DJ-UBS Commodity Index (RI) (CHF-Hgd Daily)(06/11)
Unit Class Category B(capital growth)
ISIN LU0230917477
Valor no. 2288450
March 30, 2012Switzerland
Credit Suisse Fund (Lux) Commodity Index Plus (Sfr)Class B
Net performance in CHF (rebased to 100) and yearly performance 1)
2007 2008 2009 2010 2011 201240
60
80
100
120
140
160
-60%
-40%
-20%
0%
20%
40%
60%
10.1
-39.4
22.115.0
-13.8
0.6
13.8
-35.2
18.9 14.6
-13.9
0.8
CSF (Lux) Commodity Index Plus (Sfr) B Yearly or year-to-date performance respectively (Fund)DJ-UBS Commodity Index (RI) (CHF-HgdDaily)(06/11)
Yearly or year-to-date performance respectively(Benchmark)
Net performance in CHF 1)
1 month 3 months YTD 1 year 3 years 5 yearsFund -4.12 0.56 0.56 -17.52 32.54 -21.28Benchmark -4.18 0.76 0.76 -16.84 26.08 -16.14
Commodity Sectors in %
Agriculture 31.54Energy 30.20Industrial Metals 19.44Precious Metals 13.11Livestock 5.72
Countries in %USA 96.87Cash/Cash Equivalents 3.13
Fund statistics3 years 5 years
Annualised volatility in % 18.10 22.44Tracking Error (Ex post) 1.57 2.42Beta 1.00 1.04
Top collateral holdings in %Position Coupon
%Maturity as % of
assetsUS Treasury 1.375 15.01.13 9.09US Treasury 1.375 15.11.12 5.44US Treasury 1.375 15.10.12 5.44US Treasury 1.500 15.07.12 5.43T-NTS United Statesof Am.
0.375 30.09.12 5.41
US Treasury 0.375 31.10.12 5.41US Treasury 0.000 10.05.12 5.40US Treasury 0.000 27.09.12 4.68US Treasury 1.125 15.12.12 4.35FHLB 0.384 20.12.12 4.33Total 54.98
Investment policyThe aim of the fund is to track the Dow Jones- UBS Commodity Index as closely as possibleby investing in various derivatives. The fund alsoendeavors to achieve enhancement throughactively managing the derivatives. Its lowcorrelation with traditional asset classes makesthe fund an ideal portfolio diversificationinstrument. Furthermore, it offers goodprotection from inflation risks in the event of arise in commodity prices.
Fund facts
Unit class currency CHF
Bloomberg ticker CSFLBSB LX
Net asset value (NAV) 80.33
Source: Lipper, a Reuters Company
Cre
dit S
uiss
e Fu
nd
1) Historical performance indications and financial market scenarios are no guarantee for current or future performance. Performance indications do not consider commissions levied at subscription and/orredemption.
The disclaimer mentioned at the end of this document also applies to this page.
119

March 30, 2012Switzerland
Credit Suisse Fund (Lux) Commodity Index Plus (Sfr)Class B
Review previous quarter 2)
Commodities were mixed in Q1 2012. Gasolinegained the most. Refinery outages in conjunctionwith strong export demand have contributed todeclining US Gasoline inventories and strongmargins for domestic refiners. Silver increasedin response to the Fed’s announcement that itwould not raise the Fed Funds target rate untilat least late 2014. Soybeans also increased,buoyed by strength in US export demand,downward revisions to South Americanproduction and the USDA’s report of decreasedplanned acreage. Natural Gas experienced thelargest decline following record temperaturesacross the US and concerns over
larger-than-expected inventory builds exceedingstorage systems space. Coffee dropped to itslowest levels since the fall of 2010 due toexpectations for a record Brazilian crop. LiveCattle declined as fears that weak margins forbeef wholesalers may erode demand.
Precious Metals was the strongest sector.However, speculation that astronger-than-expected US economy might alterthe Fed’s policies limited Gold and Silver returnstowards the end of the quarter. Industrial Metalswas also higher. Copper increased due toimproved economic sentiment, and Aluminum
also increased as smelters dealt with increasingenergy costs. Agriculture also ended the quarterhigher. Sugar was up as exports from Brazilslowed in January, and Mexico’s sugarcaneharvest was downgraded due to an ongoingdrought. The Livestock sector posted a loss asweaker than expected domestic demandoutweighed continued strong exports, furtherpressuring Lean Hogs. Energy was the worstperforming sector despite petroleum productsposting gains due to increased political tensionsin the Middle East, further constricting excessproduction capacity.
Outlook for the market 2)
Commodities were generally supported by animproved macroeconomic environment in the firstquarter. In March, however, the market wasdisappointed by dips in Chinese, European andUS regional preliminary economic indicators.While some commentators suggested that theglobal rebound is running out of steam, recentpositive data – including housing starts, buildingpermits, existing home sales and a decline in USweekly initial jobless claims – have contributed tooptimism in the market.
Commodity markets in particular continue toremain vulnerable to global supply shocks. We
believe that the majority of the increase in theprice of oil over recent months has been drivenby tight fundamentals, with much of the riskpremia related to supply risk (geopolitical risk,etc). Agriculture remains vulnerable to weatherdisruptions; the sector has recently beensupported by reports of dry weather in SouthAmerica and dramatic cooling of temperaturesfor much of Europe in February. In base metals,new mining capacity has proven more difficultand expensive to obtain while labor disputescontinue to threaten existing production. Thismay bode well for component prices asmacroeconomic risk subsides.
While the economy continues to showimprovement, the US central bank may be inno hurry to raise rates and possibly choke offthe budding recovery. With inflation expectationsremaining well anchored, the odds of inflationovershooting expectations remain elevated.Commodities have historically tended tooutperform during periods of higher thanexpected inflation. We believe investors willcontinue to benefit from the inflation protectionand diversification potential of holding diversifiedcommodities exposure within a portfolio oftraditional assets.
Portfolio ManagementChristopher Burton, Director, is a Portfolio Manager and Trader for the Commodities Group within Credit Suisse Asset Management. Inthis role, Mr. Burton is responsible for analyzing and implementing the team's hedging strategies, indexing strategies, and excess returnstrategies. Prior to joining Credit Suisse in 2005, Mr. Burton served as an Analyst and Derivatives Strategist with Putnam Investments,where he developed the team's analytical tools and managed their options-based yield enhancement strategies, as well as exposuremanagement strategies. Mr. Burton earned a B.S. in Economics with concentrations in Finance and Accounting from the University ofPennsylvania's Wharton School of Business. Additionally, Mr. Burton holds the Chartered Financial Analyst designation and has achievedFinancial Risk Manager® Certification through the Global Association of Risk Professionals (GARP).
2) If not expressly indicated otherwise, all quantitative data contained in this comment is based on Lipper, Bloomberg or Datastream.
120
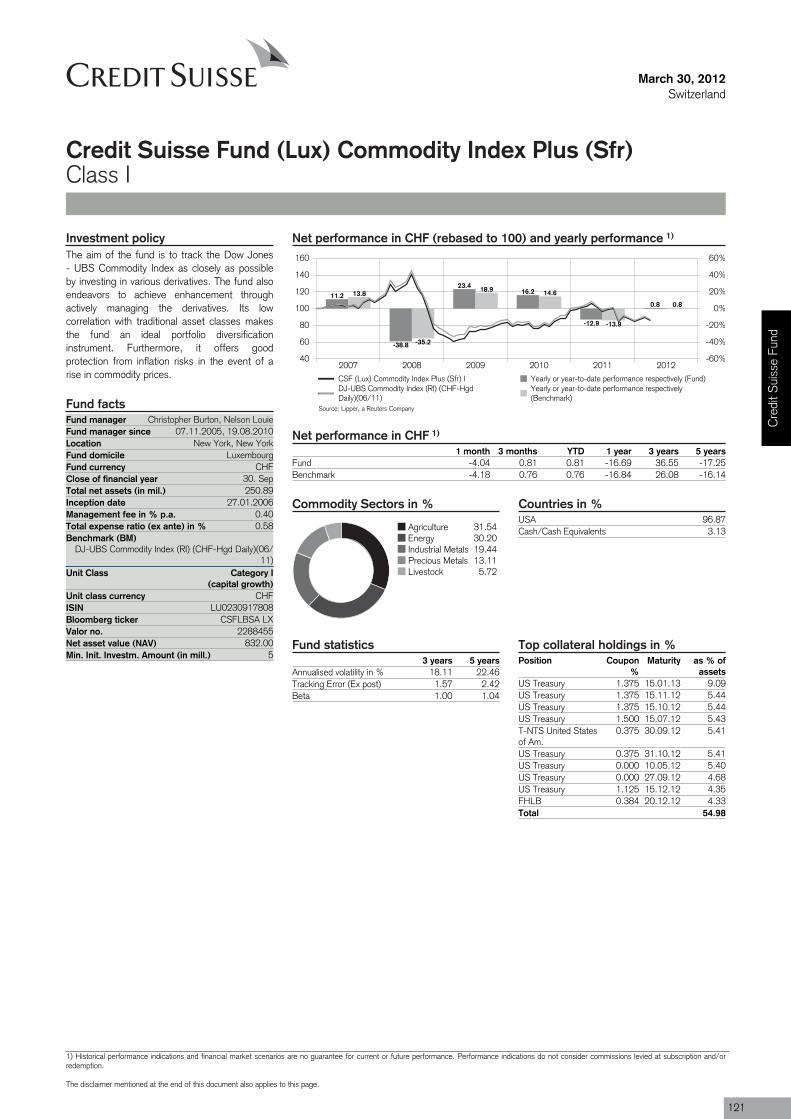
Fund manager Christopher Burton, Nelson LouieFund manager since 07.11.2005, 19.08.2010Location New York, New YorkFund domicile LuxembourgFund currency CHFClose of financial year 30. SepTotal net assets (in mil.) 250.89Inception date 27.01.2006Management fee in % p.a. 0.40Total expense ratio (ex ante) in % 0.58Benchmark (BM)
DJ-UBS Commodity Index (RI) (CHF-Hgd Daily)(06/11)
Unit Class Category I(capital growth)
ISIN LU0230917808
Valor no. 2288455
Min. Init. Investm. Amount (in mill.) 5
March 30, 2012Switzerland
Credit Suisse Fund (Lux) Commodity Index Plus (Sfr)Class I
Net performance in CHF (rebased to 100) and yearly performance 1)
2007 2008 2009 2010 2011 201240
60
80
100
120
140
160
-60%
-40%
-20%
0%
20%
40%
60%
11.2
-38.8
23.416.2
-12.9
0.8
13.8
-35.2
18.9 14.6
-13.9
0.8
CSF (Lux) Commodity Index Plus (Sfr) I Yearly or year-to-date performance respectively (Fund)DJ-UBS Commodity Index (RI) (CHF-HgdDaily)(06/11)
Yearly or year-to-date performance respectively(Benchmark)
Net performance in CHF 1)
1 month 3 months YTD 1 year 3 years 5 yearsFund -4.04 0.81 0.81 -16.69 36.55 -17.25Benchmark -4.18 0.76 0.76 -16.84 26.08 -16.14
Commodity Sectors in %
Agriculture 31.54Energy 30.20Industrial Metals 19.44Precious Metals 13.11Livestock 5.72
Countries in %USA 96.87Cash/Cash Equivalents 3.13
Fund statistics3 years 5 years
Annualised volatility in % 18.11 22.46Tracking Error (Ex post) 1.57 2.42Beta 1.00 1.04
Top collateral holdings in %Position Coupon
%Maturity as % of
assetsUS Treasury 1.375 15.01.13 9.09US Treasury 1.375 15.11.12 5.44US Treasury 1.375 15.10.12 5.44US Treasury 1.500 15.07.12 5.43T-NTS United Statesof Am.
0.375 30.09.12 5.41
US Treasury 0.375 31.10.12 5.41US Treasury 0.000 10.05.12 5.40US Treasury 0.000 27.09.12 4.68US Treasury 1.125 15.12.12 4.35FHLB 0.384 20.12.12 4.33Total 54.98
Investment policyThe aim of the fund is to track the Dow Jones- UBS Commodity Index as closely as possibleby investing in various derivatives. The fund alsoendeavors to achieve enhancement throughactively managing the derivatives. Its lowcorrelation with traditional asset classes makesthe fund an ideal portfolio diversificationinstrument. Furthermore, it offers goodprotection from inflation risks in the event of arise in commodity prices.
Fund facts
Unit class currency CHF
Bloomberg ticker CSFLBSA LX
Net asset value (NAV) 832.00
Source: Lipper, a Reuters Company
Cre
dit S
uiss
e Fu
nd
1) Historical performance indications and financial market scenarios are no guarantee for current or future performance. Performance indications do not consider commissions levied at subscription and/orredemption.
The disclaimer mentioned at the end of this document also applies to this page.
121

March 30, 2012Switzerland
Credit Suisse Fund (Lux) Commodity Index Plus (Sfr)Class I
Review previous quarter 2)
Commodities were mixed in Q1 2012. Gasolinegained the most. Refinery outages in conjunctionwith strong export demand have contributed todeclining US Gasoline inventories and strongmargins for domestic refiners. Silver increasedin response to the Fed’s announcement that itwould not raise the Fed Funds target rate untilat least late 2014. Soybeans also increased,buoyed by strength in US export demand,downward revisions to South Americanproduction and the USDA’s report of decreasedplanned acreage. Natural Gas experienced thelargest decline following record temperaturesacross the US and concerns over
larger-than-expected inventory builds exceedingstorage systems space. Coffee dropped to itslowest levels since the fall of 2010 due toexpectations for a record Brazilian crop. LiveCattle declined as fears that weak margins forbeef wholesalers may erode demand.
Precious Metals was the strongest sector.However, speculation that astronger-than-expected US economy might alterthe Fed’s policies limited Gold and Silver returnstowards the end of the quarter. Industrial Metalswas also higher. Copper increased due toimproved economic sentiment, and Aluminum
also increased as smelters dealt with increasingenergy costs. Agriculture also ended the quarterhigher. Sugar was up as exports from Brazilslowed in January, and Mexico’s sugarcaneharvest was downgraded due to an ongoingdrought. The Livestock sector posted a loss asweaker than expected domestic demandoutweighed continued strong exports, furtherpressuring Lean Hogs. Energy was the worstperforming sector despite petroleum productsposting gains due to increased political tensionsin the Middle East, further constricting excessproduction capacity.
Outlook for the market 2)
Commodities were generally supported by animproved macroeconomic environment in the firstquarter. In March, however, the market wasdisappointed by dips in Chinese, European andUS regional preliminary economic indicators.While some commentators suggested that theglobal rebound is running out of steam, recentpositive data – including housing starts, buildingpermits, existing home sales and a decline in USweekly initial jobless claims – have contributed tooptimism in the market.
Commodity markets in particular continue toremain vulnerable to global supply shocks. We
believe that the majority of the increase in theprice of oil over recent months has been drivenby tight fundamentals, with much of the riskpremia related to supply risk (geopolitical risk,etc). Agriculture remains vulnerable to weatherdisruptions; the sector has recently beensupported by reports of dry weather in SouthAmerica and dramatic cooling of temperaturesfor much of Europe in February. In base metals,new mining capacity has proven more difficultand expensive to obtain while labor disputescontinue to threaten existing production. Thismay bode well for component prices asmacroeconomic risk subsides.
While the economy continues to showimprovement, the US central bank may be inno hurry to raise rates and possibly choke offthe budding recovery. With inflation expectationsremaining well anchored, the odds of inflationovershooting expectations remain elevated.Commodities have historically tended tooutperform during periods of higher thanexpected inflation. We believe investors willcontinue to benefit from the inflation protectionand diversification potential of holding diversifiedcommodities exposure within a portfolio oftraditional assets.
Portfolio ManagementChristopher Burton, Director, is a Portfolio Manager and Trader for the Commodities Group within Credit Suisse Asset Management. Inthis role, Mr. Burton is responsible for analyzing and implementing the team's hedging strategies, indexing strategies, and excess returnstrategies. Prior to joining Credit Suisse in 2005, Mr. Burton served as an Analyst and Derivatives Strategist with Putnam Investments,where he developed the team's analytical tools and managed their options-based yield enhancement strategies, as well as exposuremanagement strategies. Mr. Burton earned a B.S. in Economics with concentrations in Finance and Accounting from the University ofPennsylvania's Wharton School of Business. Additionally, Mr. Burton holds the Chartered Financial Analyst designation and has achievedFinancial Risk Manager® Certification through the Global Association of Risk Professionals (GARP).
2) If not expressly indicated otherwise, all quantitative data contained in this comment is based on Lipper, Bloomberg or Datastream.
122

Fund manager Christopher Burton, Nelson LouieFund manager since 07.11.2005, 19.08.2010Location New York, New YorkFund domicile LuxembourgFund currency USDClose of financial year 30. SepTotal net assets (in mil.) 365.32Inception date 07.11.2005Management fee in % p.a. 1.40Total expense ratio (ex ante) in % 1.59Benchmark (BM) DJ-UBS Commodity Index (RI)Unit Class Category B
(capital growth)
ISIN LU0230918368
Valor no. 2288457
March 30, 2012Switzerland
Credit Suisse Fund (Lux) Commodity Index Plus (US$)Class B
Net performance in USD (rebased to 100) and yearly performance 1)
2007 2008 2009 2010 2011 201240
60
80
100
120
140
160
-60%
-40%
-20%
0%
20%
40%
60%
15.0
-40.1
28.016.8
-12.8
0.8
16.2
-35.6
18.9 16.8
-13.3
0.9
CSF (Lux) Commodity Index Plus (US$) B Yearly or year-to-date performance respectively (Fund)DJ-UBS Commodity Index (RI) Yearly or year-to-date performance respectively (Benchmark)
Net performance in USD 1)
1 month 3 months YTD 1 year 3 years 5 yearsFund -4.04 0.82 0.82 -16.46 41.40 -13.15Benchmark -4.14 0.89 0.89 -16.28 29.67 -13.13
Commodity Sectors in %
Agriculture 31.54Energy 30.20Industrial Metals 19.44Precious Metals 13.11Livestock 5.72
Countries in %USA 98.32Cash/Cash Equivalents 1.68
Fund statistics3 years 5 years
Annualised volatility in % 18.22 22.76Tracking Error (Ex post) 1.97 2.74Beta 1.00 1.05
Top collateral holdings in %Position Coupon % Maturity as % of
assetsUS Treasury 1.375 15.01.13 9.67US Treasury 1.375 15.11.12 6.34US Treasury 1.875 15.06.12 5.49US Treasury 1.500 15.07.12 4.95US Treasury 0.000 31.05.12 4.93US Treasury 0.000 27.09.12 4.65Fannie Mae 0.262 23.11.12 4.38US Treasury 1.375 15.10.12 4.13Freddie Mac 0.193 06.05.13 4.11US Treasury 0.375 31.10.12 4.11Total 52.76
Investment policyThe aim of the fund is to track the Dow Jones- UBS Commodity Index as closely as possibleby investing in various derivatives. The fund alsoendeavors to achieve enhancement throughactively managing the derivatives. Its lowcorrelation with traditional asset classes makesthe fund an ideal portfolio diversificationinstrument. Furthermore, it offers goodprotection from inflation risks in the event of arise in commodity prices.
Fund facts
Unit class currency USD
Bloomberg ticker CSFLCUB LX
Net asset value (NAV) 93.62
Source: Lipper, a Reuters Company
Cre
dit S
uiss
e Fu
nd
1) Historical performance indications and financial market scenarios are no guarantee for current or future performance. Performance indications do not consider commissions levied at subscription and/orredemption.
The disclaimer mentioned at the end of this document also applies to this page.
123
March 30, 2012Switzerland
Credit Suisse Fund (Lux) Commodity Index Plus (US$)Class B
Review previous quarter 2)
Commodities were mixed in Q1 2012. Gasolinegained the most. Refinery outages in conjunctionwith strong export demand have contributed todeclining US Gasoline inventories and strongmargins for domestic refiners. Silver increasedin response to the Fed’s announcement that itwould not raise the Fed Funds target rate untilat least late 2014. Soybeans also increased,buoyed by strength in US export demand,downward revisions to South Americanproduction and the USDA’s report of decreasedplanned acreage. Natural Gas experienced thelargest decline following record temperaturesacross the US and concerns over
larger-than-expected inventory builds exceedingstorage systems space. Coffee dropped to itslowest levels since the fall of 2010 due toexpectations for a record Brazilian crop. LiveCattle declined as fears that weak margins forbeef wholesalers may erode demand.
Precious Metals was the strongest sector.However, speculation that astronger-than-expected US economy might alterthe Fed’s policies limited Gold and Silver returnstowards the end of the quarter. Industrial Metalswas also higher. Copper increased due toimproved economic sentiment, and Aluminum
also increased as smelters dealt with increasingenergy costs. Agriculture also ended the quarterhigher. Sugar was up as exports from Brazilslowed in January, and Mexico’s sugarcaneharvest was downgraded due to an ongoingdrought. The Livestock sector posted a loss asweaker than expected domestic demandoutweighed continued strong exports, furtherpressuring Lean Hogs. Energy was the worstperforming sector despite petroleum productsposting gains due to increased political tensionsin the Middle East, further constricting excessproduction capacity.
Outlook for the market 2)
Commodities were generally supported by animproved macroeconomic environment in the firstquarter. In March, however, the market wasdisappointed by dips in Chinese, European andUS regional preliminary economic indicators.While some commentators suggested that theglobal rebound is running out of steam, recentpositive data – including housing starts, buildingpermits, existing home sales and a decline in USweekly initial jobless claims – have contributed tooptimism in the market.
Commodity markets in particular continue toremain vulnerable to global supply shocks. We
believe that the majority of the increase in theprice of oil over recent months has been drivenby tight fundamentals, with much of the riskpremia related to supply risk (geopolitical risk,etc). Agriculture remains vulnerable to weatherdisruptions; the sector has recently beensupported by reports of dry weather in SouthAmerica and dramatic cooling of temperaturesfor much of Europe in February. In base metals,new mining capacity has proven more difficultand expensive to obtain while labor disputescontinue to threaten existing production. Thismay bode well for component prices asmacroeconomic risk subsides.
While the economy continues to showimprovement, the US central bank may be inno hurry to raise rates and possibly choke offthe budding recovery. With inflation expectationsremaining well anchored, the odds of inflationovershooting expectations remain elevated.Commodities have historically tended tooutperform during periods of higher thanexpected inflation. We believe investors willcontinue to benefit from the inflation protectionand diversification potential of holding diversifiedcommodities exposure within a portfolio oftraditional assets.
Portfolio ManagementChristopher Burton, Director, is a Portfolio Manager and Trader for the Commodities Group within Credit Suisse Asset Management. Inthis role, Mr. Burton is responsible for analyzing and implementing the team's hedging strategies, indexing strategies, and excess returnstrategies. Prior to joining Credit Suisse in 2005, Mr. Burton served as an Analyst and Derivatives Strategist with Putnam Investments,where he developed the team's analytical tools and managed their options-based yield enhancement strategies, as well as exposuremanagement strategies. Mr. Burton earned a B.S. in Economics with concentrations in Finance and Accounting from the University ofPennsylvania's Wharton School of Business. Additionally, Mr. Burton holds the Chartered Financial Analyst designation and has achievedFinancial Risk Manager® Certification through the Global Association of Risk Professionals (GARP).
2) If not expressly indicated otherwise, all quantitative data contained in this comment is based on Lipper, Bloomberg or Datastream.
124
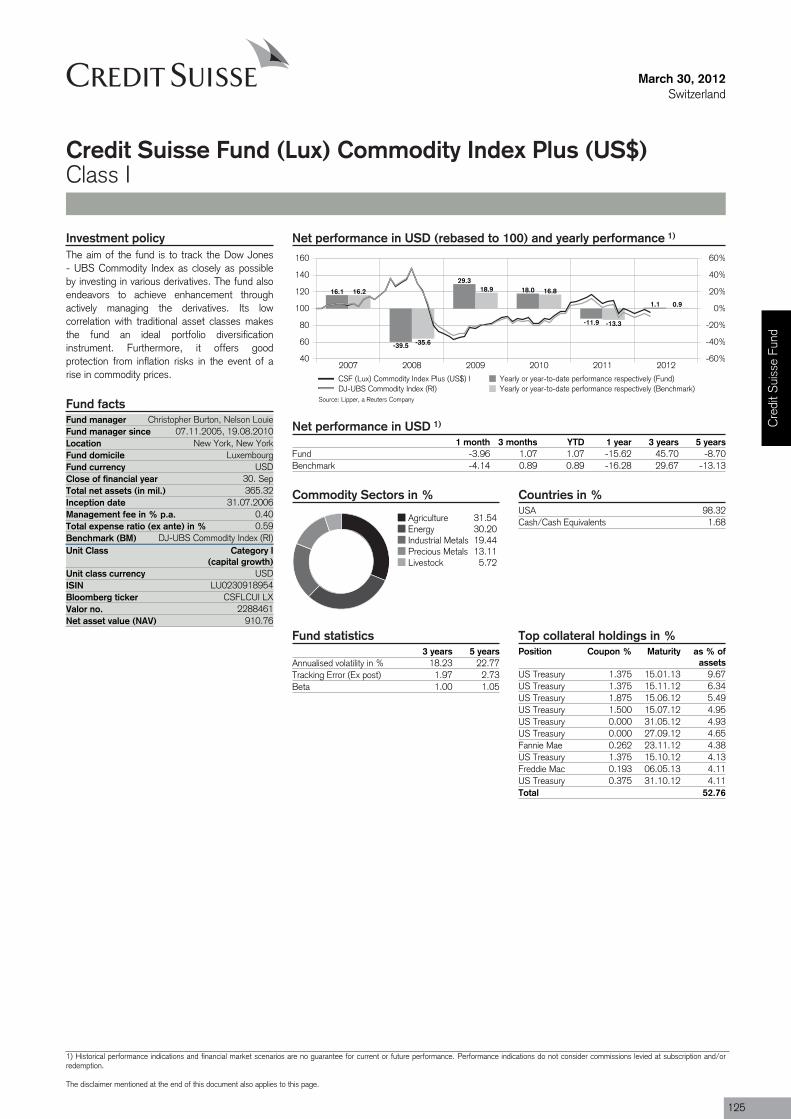
Fund manager Christopher Burton, Nelson LouieFund manager since 07.11.2005, 19.08.2010Location New York, New YorkFund domicile LuxembourgFund currency USDClose of financial year 30. SepTotal net assets (in mil.) 365.32Inception date 31.07.2006Management fee in % p.a. 0.40Total expense ratio (ex ante) in % 0.59Benchmark (BM) DJ-UBS Commodity Index (RI)Unit Class Category I
(capital growth)
ISIN LU0230918954
Valor no. 2288461
March 30, 2012Switzerland
Credit Suisse Fund (Lux) Commodity Index Plus (US$)Class I
Net performance in USD (rebased to 100) and yearly performance 1)
2007 2008 2009 2010 2011 201240
60
80
100
120
140
160
-60%
-40%
-20%
0%
20%
40%
60%
16.1
-39.5
29.318.0
-11.9
1.1
16.2
-35.6
18.9 16.8
-13.3
0.9
CSF (Lux) Commodity Index Plus (US$) I Yearly or year-to-date performance respectively (Fund)DJ-UBS Commodity Index (RI) Yearly or year-to-date performance respectively (Benchmark)
Net performance in USD 1)
1 month 3 months YTD 1 year 3 years 5 yearsFund -3.96 1.07 1.07 -15.62 45.70 -8.70Benchmark -4.14 0.89 0.89 -16.28 29.67 -13.13
Commodity Sectors in %
Agriculture 31.54Energy 30.20Industrial Metals 19.44Precious Metals 13.11Livestock 5.72
Countries in %USA 98.32Cash/Cash Equivalents 1.68
Fund statistics3 years 5 years
Annualised volatility in % 18.23 22.77Tracking Error (Ex post) 1.97 2.73Beta 1.00 1.05
Top collateral holdings in %Position Coupon % Maturity as % of
assetsUS Treasury 1.375 15.01.13 9.67US Treasury 1.375 15.11.12 6.34US Treasury 1.875 15.06.12 5.49US Treasury 1.500 15.07.12 4.95US Treasury 0.000 31.05.12 4.93US Treasury 0.000 27.09.12 4.65Fannie Mae 0.262 23.11.12 4.38US Treasury 1.375 15.10.12 4.13Freddie Mac 0.193 06.05.13 4.11US Treasury 0.375 31.10.12 4.11Total 52.76
Investment policyThe aim of the fund is to track the Dow Jones- UBS Commodity Index as closely as possibleby investing in various derivatives. The fund alsoendeavors to achieve enhancement throughactively managing the derivatives. Its lowcorrelation with traditional asset classes makesthe fund an ideal portfolio diversificationinstrument. Furthermore, it offers goodprotection from inflation risks in the event of arise in commodity prices.
Fund facts
Unit class currency USD
Bloomberg ticker CSFLCUI LX
Net asset value (NAV) 910.76
Source: Lipper, a Reuters Company
Cre
dit S
uiss
e Fu
nd
1) Historical performance indications and financial market scenarios are no guarantee for current or future performance. Performance indications do not consider commissions levied at subscription and/orredemption.
The disclaimer mentioned at the end of this document also applies to this page.
125
March 30, 2012Switzerland
Credit Suisse Fund (Lux) Commodity Index Plus (US$)Class I
Review previous quarter 2)
Commodities were mixed in Q1 2012. Gasolinegained the most. Refinery outages in conjunctionwith strong export demand have contributed todeclining US Gasoline inventories and strongmargins for domestic refiners. Silver increasedin response to the Fed’s announcement that itwould not raise the Fed Funds target rate untilat least late 2014. Soybeans also increased,buoyed by strength in US export demand,downward revisions to South Americanproduction and the USDA’s report of decreasedplanned acreage. Natural Gas experienced thelargest decline following record temperaturesacross the US and concerns over
larger-than-expected inventory builds exceedingstorage systems space. Coffee dropped to itslowest levels since the fall of 2010 due toexpectations for a record Brazilian crop. LiveCattle declined as fears that weak margins forbeef wholesalers may erode demand.
Precious Metals was the strongest sector.However, speculation that astronger-than-expected US economy might alterthe Fed’s policies limited Gold and Silver returnstowards the end of the quarter. Industrial Metalswas also higher. Copper increased due toimproved economic sentiment, and Aluminum
also increased as smelters dealt with increasingenergy costs. Agriculture also ended the quarterhigher. Sugar was up as exports from Brazilslowed in January, and Mexico’s sugarcaneharvest was downgraded due to an ongoingdrought. The Livestock sector posted a loss asweaker than expected domestic demandoutweighed continued strong exports, furtherpressuring Lean Hogs. Energy was the worstperforming sector despite petroleum productsposting gains due to increased political tensionsin the Middle East, further constricting excessproduction capacity.
Outlook for the market 2)
Commodities were generally supported by animproved macroeconomic environment in the firstquarter. In March, however, the market wasdisappointed by dips in Chinese, European andUS regional preliminary economic indicators.While some commentators suggested that theglobal rebound is running out of steam, recentpositive data – including housing starts, buildingpermits, existing home sales and a decline in USweekly initial jobless claims – have contributed tooptimism in the market.
Commodity markets in particular continue toremain vulnerable to global supply shocks. We
believe that the majority of the increase in theprice of oil over recent months has been drivenby tight fundamentals, with much of the riskpremia related to supply risk (geopolitical risk,etc). Agriculture remains vulnerable to weatherdisruptions; the sector has recently beensupported by reports of dry weather in SouthAmerica and dramatic cooling of temperaturesfor much of Europe in February. In base metals,new mining capacity has proven more difficultand expensive to obtain while labor disputescontinue to threaten existing production. Thismay bode well for component prices asmacroeconomic risk subsides.
While the economy continues to showimprovement, the US central bank may be inno hurry to raise rates and possibly choke offthe budding recovery. With inflation expectationsremaining well anchored, the odds of inflationovershooting expectations remain elevated.Commodities have historically tended tooutperform during periods of higher thanexpected inflation. We believe investors willcontinue to benefit from the inflation protectionand diversification potential of holding diversifiedcommodities exposure within a portfolio oftraditional assets.
Portfolio ManagementChristopher Burton, Director, is a Portfolio Manager and Trader for the Commodities Group within Credit Suisse Asset Management. Inthis role, Mr. Burton is responsible for analyzing and implementing the team's hedging strategies, indexing strategies, and excess returnstrategies. Prior to joining Credit Suisse in 2005, Mr. Burton served as an Analyst and Derivatives Strategist with Putnam Investments,where he developed the team's analytical tools and managed their options-based yield enhancement strategies, as well as exposuremanagement strategies. Mr. Burton earned a B.S. in Economics with concentrations in Finance and Accounting from the University ofPennsylvania's Wharton School of Business. Additionally, Mr. Burton holds the Chartered Financial Analyst designation and has achievedFinancial Risk Manager® Certification through the Global Association of Risk Professionals (GARP).
2) If not expressly indicated otherwise, all quantitative data contained in this comment is based on Lipper, Bloomberg or Datastream.
126
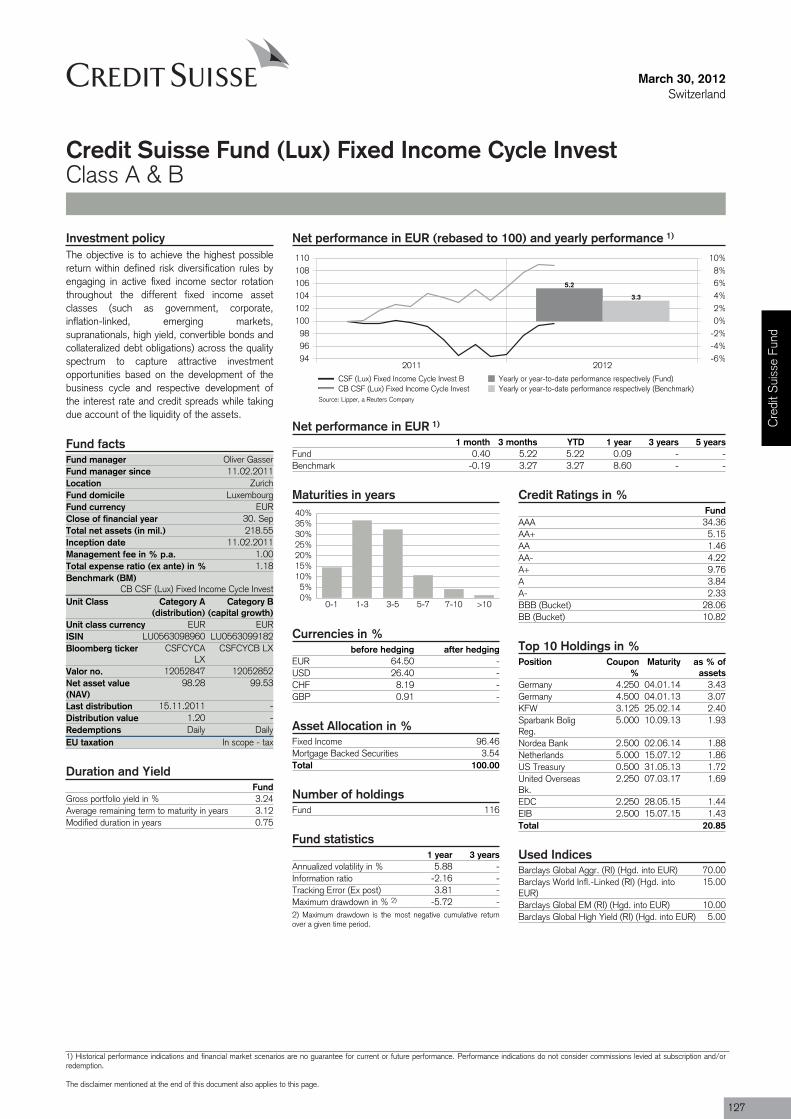
Fund 116
Fund manager Oliver GasserFund manager since 11.02.2011Location ZurichFund domicile LuxembourgFund currency EURClose of financial year 30. SepTotal net assets (in mil.) 218.55Inception date 11.02.2011Management fee in % p.a. 1.00Total expense ratio (ex ante) in % 1.18Benchmark (BM)
CB CSF (Lux) Fixed Income Cycle InvestUnit Class Category A
(distribution)
ISIN LU0563098960
Valor no. 12052847
Last distribution 15.11.2011Distribution value 1.20Redemptions DailyEU taxation In scope - tax
March 30, 2012Switzerland
Credit Suisse Fund (Lux) Fixed Income Cycle InvestClass A & B
Net performance in EUR (rebased to 100) and yearly performance 1)
2011 2012949698
100102104106108110
-6%-4%-2%0%2%4%6%8%
10%
5.2
3.3
CSF (Lux) Fixed Income Cycle Invest B Yearly or year-to-date performance respectively (Fund)CB CSF (Lux) Fixed Income Cycle Invest Yearly or year-to-date performance respectively (Benchmark)
Net performance in EUR 1)
1 month 3 months YTD 1 year 3 years 5 yearsFund 0.40 5.22 5.22 0.09 - -Benchmark -0.19 3.27 3.27 8.60 - -
Maturities in years
0%5%
10%15%20%25%30%35%40%
0-1 1-3 3-5 5-7 7-10 >10
Currencies in %before hedging after hedging
EUR 64.50 -USD 26.40 -CHF 8.19 -GBP 0.91 -
Asset Allocation in %Fixed Income 96.46Mortgage Backed Securities 3.54Total 100.00
Number of holdings
Fund statistics1 year 3 years
Annualized volatility in % 5.88 -Information ratio -2.16 -Tracking Error (Ex post) 3.81 -Maximum drawdown in % 2) -5.72 -2) Maximum drawdown is the most negative cumulative returnover a given time period.
Credit Ratings in %Fund
AAA 34.36AA+ 5.15AA 1.46AA- 4.22A+ 9.76A 3.84A- 2.33BBB (Bucket) 28.06BB (Bucket) 10.82
Top 10 Holdings in %Position Coupon
%Maturity as % of
assetsGermany 4.250 04.01.14 3.43Germany 4.500 04.01.13 3.07KFW 3.125 25.02.14 2.40Sparbank BoligReg.
5.000 10.09.13 1.93
Nordea Bank 2.500 02.06.14 1.88Netherlands 5.000 15.07.12 1.86US Treasury 0.500 31.05.13 1.72United OverseasBk.
2.250 07.03.17 1.69
EDC 2.250 28.05.15 1.44EIB 2.500 15.07.15 1.43Total 20.85
Used IndicesBarclays Global Aggr. (RI) (Hgd. into EUR) 70.00Barclays World Infl.-Linked (RI) (Hgd. intoEUR)
15.00
Barclays Global EM (RI) (Hgd. into EUR) 10.00Barclays Global High Yield (RI) (Hgd. into EUR) 5.00
Investment policyThe objective is to achieve the highest possiblereturn within defined risk diversification rules byengaging in active fixed income sector rotationthroughout the different fixed income assetclasses (such as government, corporate,inflation-linked, emerging markets,supranationals, high yield, convertible bonds andcollateralized debt obligations) across the qualityspectrum to capture attractive investmentopportunities based on the development of thebusiness cycle and respective development ofthe interest rate and credit spreads while takingdue account of the liquidity of the assets.
Fund facts
Category B(capital growth)
Unit class currency EUR EURLU0563099182
Bloomberg ticker CSFCYCALX
CSFCYCB LX
12052852Net asset value(NAV)
98.28 99.53
--
Daily
Duration and YieldFund
Gross portfolio yield in % 3.24Average remaining term to maturity in years 3.12Modified duration in years 0.75
Source: Lipper, a Reuters Company
Cre
dit S
uiss
e Fu
nd
1) Historical performance indications and financial market scenarios are no guarantee for current or future performance. Performance indications do not consider commissions levied at subscription and/orredemption.
The disclaimer mentioned at the end of this document also applies to this page.
127

March 30, 2012Switzerland
Credit Suisse Fund (Lux) Fixed Income Cycle InvestClass A & B
Review previous quarter 3)
In the first quarter of 2012, the main driversof performance were the ECB’s two long-termrefinancing operations (LTRO) in December andMarch whereby banks borrowed slightly morethan EUR 1trn. Net of repaying other facilities,the increase in banks’ borrowings from the eurosystem amounted to EUR 523bn. With thenear-term risk of a liquidity event largelyremoved, eurozone bank bonds and stressedeurozone sovereigns rallied and in turn alsoprompted a relief rally in high grade and high yieldcorporate bonds.
Banks in Italy and Spain used a large percentageof the newly obtained funds to buy the bonds oftheir domestic governments. According to ECBdata, banks in those two countries increasedtheir holdings of government bonds by EUR50bn and EUR 41bn in January and February.
The first quarter also saw a near-term resolutionfor the Greek government debt problem with85.8% of bondholders deciding to agree to therestructuring of their bonds. However, an
economic report for the European Commissionhas since found that some debt targets for 2020were based on optimistic assumptions aboutgrowth and will need to be revised upwards.
Towards the end of March, worries over the stateof the Spanish economy resurfaced due to adeterioration in the Spanish government’sfinancing position and Spain’s slowdown ingrowth subsequently causing markets to plungeonce again.
Outlook for the market 3)
The European periphery will remain in focus forquite some time to come, with Spain and Italythe biggest concerns. While Italy’s fiscal andeconomic outlook is weak, we believe Spain willenter a Troika programme this year in order torecapitalize and restructure its banks. Marketparticipants will closely follow their progress on
meeting deficit targets and further austeritymeasures could well be necessary.
At the same time, we believe the global growthpicture will remain under pressure, thus forcingcentral banks to remain highly accommodative. Inthe short to medium term, we therefore see the
market outlook skewed to the negative side withonly a few potential positive impacts arising fromthe outcome of the French and Greek electionsat the beginning of May and the Irish referendumon its Fiscal Compact at the end of May.
Portfolio ManagementOliver R. Gasser, CFA has global responsibility for structured finance within the Fixed Income team of Credit Suisse Asset Management.Prior to joining Credit Suisse, Oliver Gasser was a Director at UBS from 2002 through 2007, where as a Credit Portfolio Manager he wasresponsible for credit (de-)investments of the loan book of Global WM&BB. Prior to that, Oliver worked n various roles in the fixed incometrading and sales division of CS and CSFB Zurich for over 12 years. Mr. Gasser holds a Degree in BA from the University of AppliedSciences Zurich and qualified as a Chartered Financial Analyst (CFA) in 2006.
3) If not expressly indicated otherwise, all quantitative data contained in this comment is based on Lipper, Bloomberg or Datastream.
128
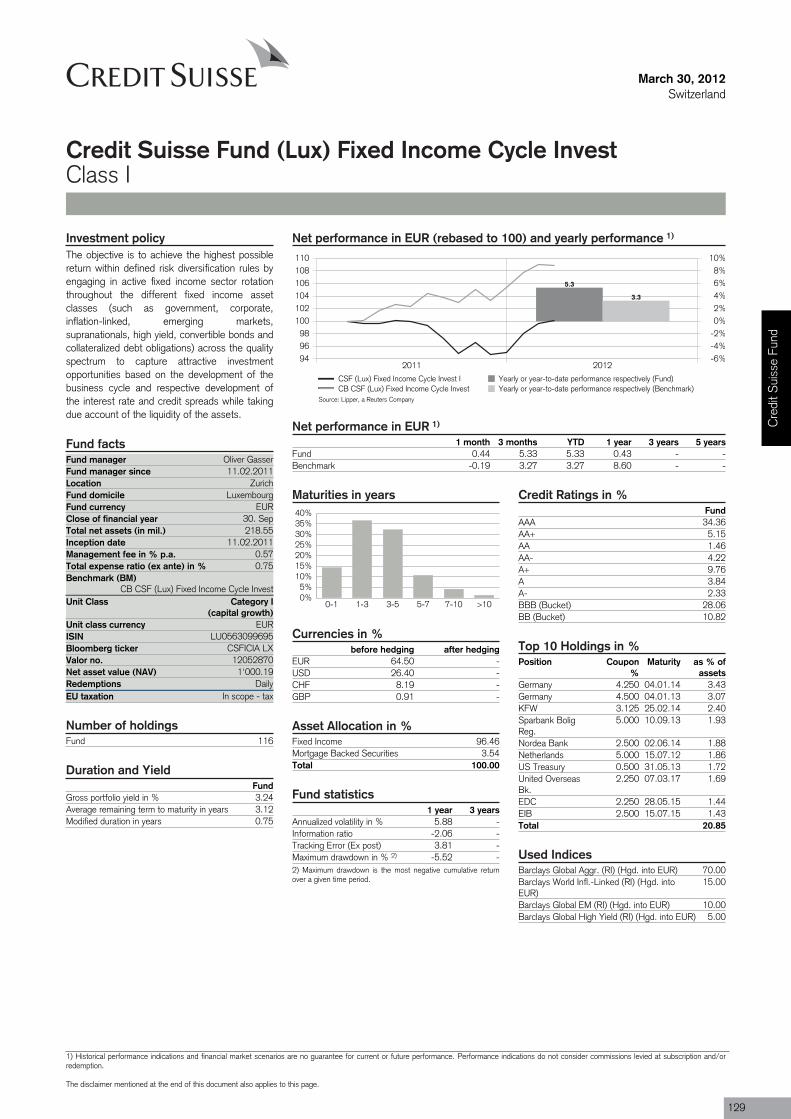
Fund manager Oliver GasserFund manager since 11.02.2011Location ZurichFund domicile LuxembourgFund currency EURClose of financial year 30. SepTotal net assets (in mil.) 218.55Inception date 11.02.2011Management fee in % p.a. 0.57Total expense ratio (ex ante) in % 0.75Benchmark (BM)
CB CSF (Lux) Fixed Income Cycle InvestUnit Class Category I
(capital growth)
ISIN LU0563099695
Valor no. 12052870
Redemptions DailyEU taxation In scope - tax
Fund 116
March 30, 2012Switzerland
Credit Suisse Fund (Lux) Fixed Income Cycle InvestClass I
Net performance in EUR (rebased to 100) and yearly performance 1)
2011 2012949698
100102104106108110
-6%-4%-2%0%2%4%6%8%
10%
5.3
3.3
CSF (Lux) Fixed Income Cycle Invest I Yearly or year-to-date performance respectively (Fund)CB CSF (Lux) Fixed Income Cycle Invest Yearly or year-to-date performance respectively (Benchmark)
Net performance in EUR 1)
1 month 3 months YTD 1 year 3 years 5 yearsFund 0.44 5.33 5.33 0.43 - -Benchmark -0.19 3.27 3.27 8.60 - -
Maturities in years
0%5%
10%15%20%25%30%35%40%
0-1 1-3 3-5 5-7 7-10 >10
Currencies in %before hedging after hedging
EUR 64.50 -USD 26.40 -CHF 8.19 -GBP 0.91 -
Asset Allocation in %Fixed Income 96.46Mortgage Backed Securities 3.54Total 100.00
Fund statistics1 year 3 years
Annualized volatility in % 5.88 -Information ratio -2.06 -Tracking Error (Ex post) 3.81 -Maximum drawdown in % 2) -5.52 -2) Maximum drawdown is the most negative cumulative returnover a given time period.
Credit Ratings in %Fund
AAA 34.36AA+ 5.15AA 1.46AA- 4.22A+ 9.76A 3.84A- 2.33BBB (Bucket) 28.06BB (Bucket) 10.82
Top 10 Holdings in %Position Coupon
%Maturity as % of
assetsGermany 4.250 04.01.14 3.43Germany 4.500 04.01.13 3.07KFW 3.125 25.02.14 2.40Sparbank BoligReg.
5.000 10.09.13 1.93
Nordea Bank 2.500 02.06.14 1.88Netherlands 5.000 15.07.12 1.86US Treasury 0.500 31.05.13 1.72United OverseasBk.
2.250 07.03.17 1.69
EDC 2.250 28.05.15 1.44EIB 2.500 15.07.15 1.43Total 20.85
Used IndicesBarclays Global Aggr. (RI) (Hgd. into EUR) 70.00Barclays World Infl.-Linked (RI) (Hgd. intoEUR)
15.00
Barclays Global EM (RI) (Hgd. into EUR) 10.00Barclays Global High Yield (RI) (Hgd. into EUR) 5.00
Investment policyThe objective is to achieve the highest possiblereturn within defined risk diversification rules byengaging in active fixed income sector rotationthroughout the different fixed income assetclasses (such as government, corporate,inflation-linked, emerging markets,supranationals, high yield, convertible bonds andcollateralized debt obligations) across the qualityspectrum to capture attractive investmentopportunities based on the development of thebusiness cycle and respective development ofthe interest rate and credit spreads while takingdue account of the liquidity of the assets.
Fund facts
Unit class currency EUR
Bloomberg ticker CSFICIA LX
Net asset value (NAV) 1'000.19
Number of holdings
Duration and YieldFund
Gross portfolio yield in % 3.24Average remaining term to maturity in years 3.12Modified duration in years 0.75
Source: Lipper, a Reuters Company
Cre
dit S
uiss
e Fu
nd
1) Historical performance indications and financial market scenarios are no guarantee for current or future performance. Performance indications do not consider commissions levied at subscription and/orredemption.
The disclaimer mentioned at the end of this document also applies to this page.
129

March 30, 2012Switzerland
Credit Suisse Fund (Lux) Fixed Income Cycle InvestClass I
Review previous quarter 3)
In the first quarter of 2012, the main driversof performance were the ECB’s two long-termrefinancing operations (LTRO) in December andMarch whereby banks borrowed slightly morethan EUR 1trn. Net of repaying other facilities,the increase in banks’ borrowings from the eurosystem amounted to EUR 523bn. With thenear-term risk of a liquidity event largelyremoved, eurozone bank bonds and stressedeurozone sovereigns rallied and in turn alsoprompted a relief rally in high grade and high yieldcorporate bonds.
Banks in Italy and Spain used a large percentageof the newly obtained funds to buy the bonds oftheir domestic governments. According to ECBdata, banks in those two countries increasedtheir holdings of government bonds by EUR50bn and EUR 41bn in January and February.
The first quarter also saw a near-term resolutionfor the Greek government debt problem with85.8% of bondholders deciding to agree to therestructuring of their bonds. However, an
economic report for the European Commissionhas since found that some debt targets for 2020were based on optimistic assumptions aboutgrowth and will need to be revised upwards.
Towards the end of March, worries over the stateof the Spanish economy resurfaced due to adeterioration in the Spanish government’sfinancing position and Spain’s slowdown ingrowth subsequently causing markets to plungeonce again.
Outlook for the market 3)
The European periphery will remain in focus forquite some time to come, with Spain and Italythe biggest concerns. While Italy’s fiscal andeconomic outlook is weak, we believe Spain willenter a Troika programme this year in order torecapitalize and restructure its banks. Marketparticipants will closely follow their progress on
meeting deficit targets and further austeritymeasures could well be necessary.
At the same time, we believe the global growthpicture will remain under pressure, thus forcingcentral banks to remain highly accommodative. Inthe short to medium term, we therefore see the
market outlook skewed to the negative side withonly a few potential positive impacts arising fromthe outcome of the French and Greek electionsat the beginning of May and the Irish referendumon its Fiscal Compact at the end of May.
Portfolio ManagementOliver R. Gasser, CFA has global responsibility for structured finance within the Fixed Income team of Credit Suisse Asset Management.Prior to joining Credit Suisse, Oliver Gasser was a Director at UBS from 2002 through 2007, where as a Credit Portfolio Manager he wasresponsible for credit (de-)investments of the loan book of Global WM&BB. Prior to that, Oliver worked n various roles in the fixed incometrading and sales division of CS and CSFB Zurich for over 12 years. Mr. Gasser holds a Degree in BA from the University of AppliedSciences Zurich and qualified as a Chartered Financial Analyst (CFA) in 2006.
3) If not expressly indicated otherwise, all quantitative data contained in this comment is based on Lipper, Bloomberg or Datastream.
130
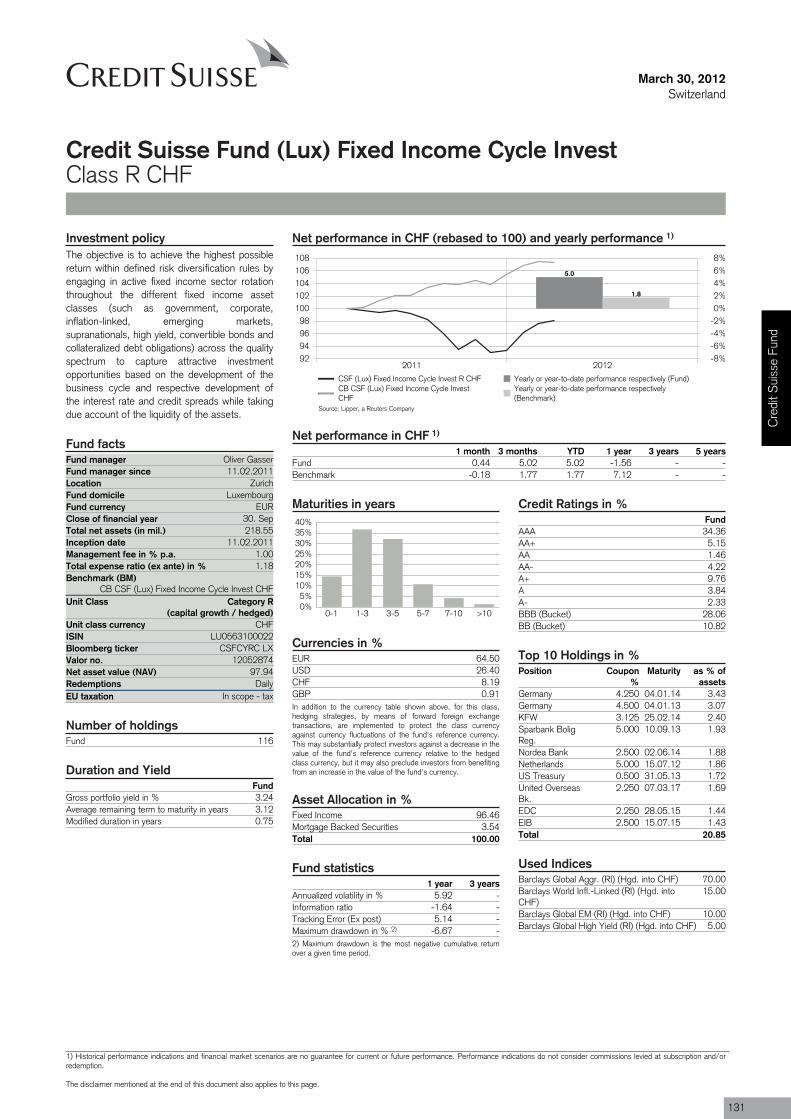
Fund manager Oliver GasserFund manager since 11.02.2011Location ZurichFund domicile LuxembourgFund currency EURClose of financial year 30. SepTotal net assets (in mil.) 218.55Inception date 11.02.2011Management fee in % p.a. 1.00Total expense ratio (ex ante) in % 1.18Benchmark (BM)
CB CSF (Lux) Fixed Income Cycle Invest CHFUnit Class Category R
(capital growth / hedged)
ISIN LU0563100022
Valor no. 12052874
Redemptions DailyEU taxation In scope - tax
Fund 116
March 30, 2012Switzerland
Credit Suisse Fund (Lux) Fixed Income Cycle InvestClass R CHF
Net performance in CHF (rebased to 100) and yearly performance 1)
2011 201292949698
100102104106108
-8%-6%-4%-2%0%2%4%6%8%
5.0
1.8
CSF (Lux) Fixed Income Cycle Invest R CHF Yearly or year-to-date performance respectively (Fund)CB CSF (Lux) Fixed Income Cycle InvestCHF
Yearly or year-to-date performance respectively(Benchmark)
Net performance in CHF 1)
1 month 3 months YTD 1 year 3 years 5 yearsFund 0.44 5.02 5.02 -1.56 - -Benchmark -0.18 1.77 1.77 7.12 - -
Maturities in years
0%5%
10%15%20%25%30%35%40%
0-1 1-3 3-5 5-7 7-10 >10
Currencies in %EUR 64.50USD 26.40CHF 8.19GBP 0.91In addition to the currency table shown above, for this class,hedging strategies, by means of forward foreign exchangetransactions, are implemented to protect the class currencyagainst currency fluctuations of the fund's reference currency.This may substantially protect investors against a decrease in thevalue of the fund's reference currency relative to the hedgedclass currency, but it may also preclude investors from benefitingfrom an increase in the value of the fund's currency.
Asset Allocation in %Fixed Income 96.46Mortgage Backed Securities 3.54Total 100.00
Fund statistics1 year 3 years
Annualized volatility in % 5.92 -Information ratio -1.64 -Tracking Error (Ex post) 5.14 -Maximum drawdown in % 2) -6.67 -2) Maximum drawdown is the most negative cumulative returnover a given time period.
Credit Ratings in %Fund
AAA 34.36AA+ 5.15AA 1.46AA- 4.22A+ 9.76A 3.84A- 2.33BBB (Bucket) 28.06BB (Bucket) 10.82
Top 10 Holdings in %Position Coupon
%Maturity as % of
assetsGermany 4.250 04.01.14 3.43Germany 4.500 04.01.13 3.07KFW 3.125 25.02.14 2.40Sparbank BoligReg.
5.000 10.09.13 1.93
Nordea Bank 2.500 02.06.14 1.88Netherlands 5.000 15.07.12 1.86US Treasury 0.500 31.05.13 1.72United OverseasBk.
2.250 07.03.17 1.69
EDC 2.250 28.05.15 1.44EIB 2.500 15.07.15 1.43Total 20.85
Used IndicesBarclays Global Aggr. (RI) (Hgd. into CHF) 70.00Barclays World Infl.-Linked (RI) (Hgd. intoCHF)
15.00
Barclays Global EM (RI) (Hgd. into CHF) 10.00Barclays Global High Yield (RI) (Hgd. into CHF) 5.00
Investment policyThe objective is to achieve the highest possiblereturn within defined risk diversification rules byengaging in active fixed income sector rotationthroughout the different fixed income assetclasses (such as government, corporate,inflation-linked, emerging markets,supranationals, high yield, convertible bonds andcollateralized debt obligations) across the qualityspectrum to capture attractive investmentopportunities based on the development of thebusiness cycle and respective development ofthe interest rate and credit spreads while takingdue account of the liquidity of the assets.
Fund facts
Unit class currency CHF
Bloomberg ticker CSFCYRC LX
Net asset value (NAV) 97.94
Number of holdings
Duration and YieldFund
Gross portfolio yield in % 3.24Average remaining term to maturity in years 3.12Modified duration in years 0.75
Source: Lipper, a Reuters Company
Cre
dit S
uiss
e Fu
nd
1) Historical performance indications and financial market scenarios are no guarantee for current or future performance. Performance indications do not consider commissions levied at subscription and/orredemption.
The disclaimer mentioned at the end of this document also applies to this page.
131

March 30, 2012Switzerland
Credit Suisse Fund (Lux) Fixed Income Cycle InvestClass R CHF
Review previous quarter 3)
In the first quarter of 2012, the main driversof performance were the ECB’s two long-termrefinancing operations (LTRO) in December andMarch whereby banks borrowed slightly morethan EUR 1trn. Net of repaying other facilities,the increase in banks’ borrowings from the eurosystem amounted to EUR 523bn. With thenear-term risk of a liquidity event largelyremoved, eurozone bank bonds and stressedeurozone sovereigns rallied and in turn alsoprompted a relief rally in high grade and high yieldcorporate bonds.
Banks in Italy and Spain used a large percentageof the newly obtained funds to buy the bonds oftheir domestic governments. According to ECBdata, banks in those two countries increasedtheir holdings of government bonds by EUR50bn and EUR 41bn in January and February.
The first quarter also saw a near-term resolutionfor the Greek government debt problem with85.8% of bondholders deciding to agree to therestructuring of their bonds. However, an
economic report for the European Commissionhas since found that some debt targets for 2020were based on optimistic assumptions aboutgrowth and will need to be revised upwards.
Towards the end of March, worries over the stateof the Spanish economy resurfaced due to adeterioration in the Spanish government’sfinancing position and Spain’s slowdown ingrowth subsequently causing markets to plungeonce again.
Outlook for the market 3)
The European periphery will remain in focus forquite some time to come, with Spain and Italythe biggest concerns. While Italy’s fiscal andeconomic outlook is weak, we believe Spain willenter a Troika programme this year in order torecapitalize and restructure its banks. Marketparticipants will closely follow their progress on
meeting deficit targets and further austeritymeasures could well be necessary.
At the same time, we believe the global growthpicture will remain under pressure, thus forcingcentral banks to remain highly accommodative. Inthe short to medium term, we therefore see the
market outlook skewed to the negative side withonly a few potential positive impacts arising fromthe outcome of the French and Greek electionsat the beginning of May and the Irish referendumon its Fiscal Compact at the end of May.
Portfolio ManagementOliver R. Gasser, CFA has global responsibility for structured finance within the Fixed Income team of Credit Suisse Asset Management.Prior to joining Credit Suisse, Oliver Gasser was a Director at UBS from 2002 through 2007, where as a Credit Portfolio Manager he wasresponsible for credit (de-)investments of the loan book of Global WM&BB. Prior to that, Oliver worked n various roles in the fixed incometrading and sales division of CS and CSFB Zurich for over 12 years. Mr. Gasser holds a Degree in BA from the University of AppliedSciences Zurich and qualified as a Chartered Financial Analyst (CFA) in 2006.
3) If not expressly indicated otherwise, all quantitative data contained in this comment is based on Lipper, Bloomberg or Datastream.
132
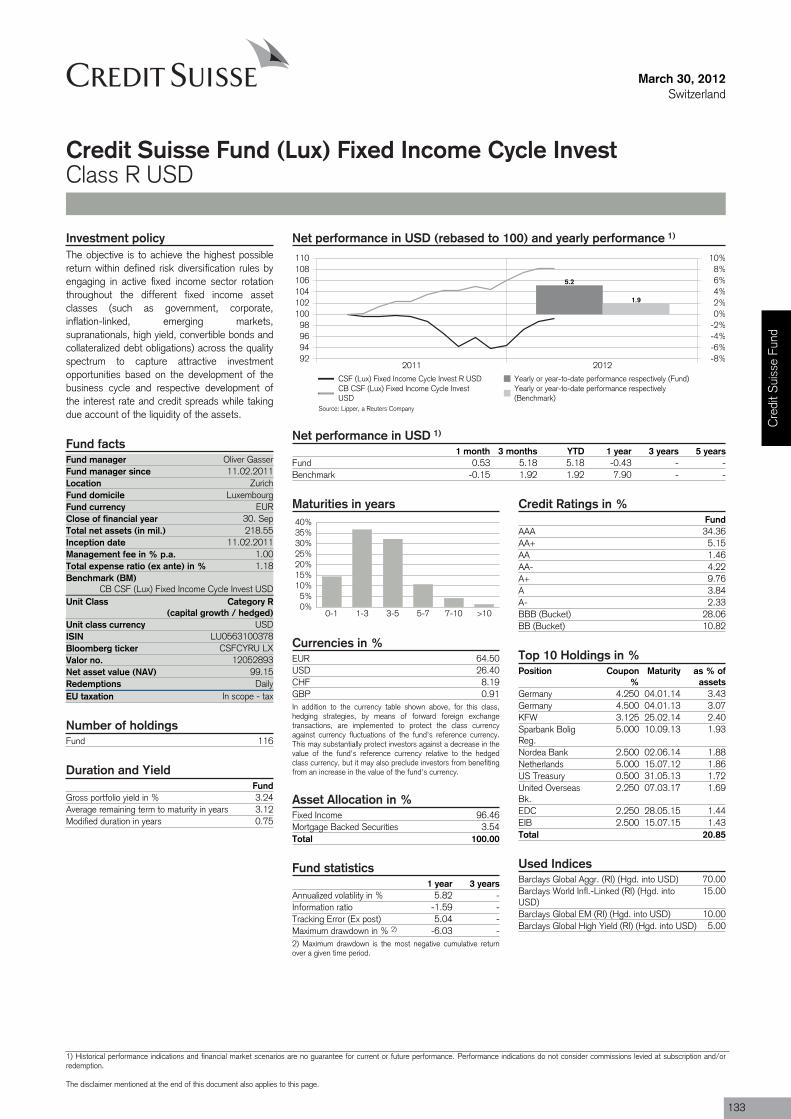
Fund manager Oliver GasserFund manager since 11.02.2011Location ZurichFund domicile LuxembourgFund currency EURClose of financial year 30. SepTotal net assets (in mil.) 218.55Inception date 11.02.2011Management fee in % p.a. 1.00Total expense ratio (ex ante) in % 1.18Benchmark (BM)
CB CSF (Lux) Fixed Income Cycle Invest USDUnit Class Category R
(capital growth / hedged)
ISIN LU0563100378
Valor no. 12052893
Redemptions DailyEU taxation In scope - tax
Fund 116
March 30, 2012Switzerland
Credit Suisse Fund (Lux) Fixed Income Cycle InvestClass R USD
Net performance in USD (rebased to 100) and yearly performance 1)
2011 201292949698
100102104106108110
-8%-6%-4%-2%0%2%4%6%8%
10%
5.2
1.9
CSF (Lux) Fixed Income Cycle Invest R USD Yearly or year-to-date performance respectively (Fund)CB CSF (Lux) Fixed Income Cycle InvestUSD
Yearly or year-to-date performance respectively(Benchmark)
Net performance in USD 1)
1 month 3 months YTD 1 year 3 years 5 yearsFund 0.53 5.18 5.18 -0.43 - -Benchmark -0.15 1.92 1.92 7.90 - -
Maturities in years
0%5%
10%15%20%25%30%35%40%
0-1 1-3 3-5 5-7 7-10 >10
Currencies in %EUR 64.50USD 26.40CHF 8.19GBP 0.91In addition to the currency table shown above, for this class,hedging strategies, by means of forward foreign exchangetransactions, are implemented to protect the class currencyagainst currency fluctuations of the fund's reference currency.This may substantially protect investors against a decrease in thevalue of the fund's reference currency relative to the hedgedclass currency, but it may also preclude investors from benefitingfrom an increase in the value of the fund's currency.
Asset Allocation in %Fixed Income 96.46Mortgage Backed Securities 3.54Total 100.00
Fund statistics1 year 3 years
Annualized volatility in % 5.82 -Information ratio -1.59 -Tracking Error (Ex post) 5.04 -Maximum drawdown in % 2) -6.03 -2) Maximum drawdown is the most negative cumulative returnover a given time period.
Credit Ratings in %Fund
AAA 34.36AA+ 5.15AA 1.46AA- 4.22A+ 9.76A 3.84A- 2.33BBB (Bucket) 28.06BB (Bucket) 10.82
Top 10 Holdings in %Position Coupon
%Maturity as % of
assetsGermany 4.250 04.01.14 3.43Germany 4.500 04.01.13 3.07KFW 3.125 25.02.14 2.40Sparbank BoligReg.
5.000 10.09.13 1.93
Nordea Bank 2.500 02.06.14 1.88Netherlands 5.000 15.07.12 1.86US Treasury 0.500 31.05.13 1.72United OverseasBk.
2.250 07.03.17 1.69
EDC 2.250 28.05.15 1.44EIB 2.500 15.07.15 1.43Total 20.85
Used IndicesBarclays Global Aggr. (RI) (Hgd. into USD) 70.00Barclays World Infl.-Linked (RI) (Hgd. intoUSD)
15.00
Barclays Global EM (RI) (Hgd. into USD) 10.00Barclays Global High Yield (RI) (Hgd. into USD) 5.00
Investment policyThe objective is to achieve the highest possiblereturn within defined risk diversification rules byengaging in active fixed income sector rotationthroughout the different fixed income assetclasses (such as government, corporate,inflation-linked, emerging markets,supranationals, high yield, convertible bonds andcollateralized debt obligations) across the qualityspectrum to capture attractive investmentopportunities based on the development of thebusiness cycle and respective development ofthe interest rate and credit spreads while takingdue account of the liquidity of the assets.
Fund facts
Unit class currency USD
Bloomberg ticker CSFCYRU LX
Net asset value (NAV) 99.15
Number of holdings
Duration and YieldFund
Gross portfolio yield in % 3.24Average remaining term to maturity in years 3.12Modified duration in years 0.75
Source: Lipper, a Reuters Company
Cre
dit S
uiss
e Fu
nd
1) Historical performance indications and financial market scenarios are no guarantee for current or future performance. Performance indications do not consider commissions levied at subscription and/orredemption.
The disclaimer mentioned at the end of this document also applies to this page.
133
March 30, 2012Switzerland
Credit Suisse Fund (Lux) Fixed Income Cycle InvestClass R USD
Review previous quarter 3)
In the first quarter of 2012, the main driversof performance were the ECB’s two long-termrefinancing operations (LTRO) in December andMarch whereby banks borrowed slightly morethan EUR 1trn. Net of repaying other facilities,the increase in banks’ borrowings from the eurosystem amounted to EUR 523bn. With thenear-term risk of a liquidity event largelyremoved, eurozone bank bonds and stressedeurozone sovereigns rallied and in turn alsoprompted a relief rally in high grade and high yieldcorporate bonds.
Banks in Italy and Spain used a large percentageof the newly obtained funds to buy the bonds oftheir domestic governments. According to ECBdata, banks in those two countries increasedtheir holdings of government bonds by EUR50bn and EUR 41bn in January and February.
The first quarter also saw a near-term resolutionfor the Greek government debt problem with85.8% of bondholders deciding to agree to therestructuring of their bonds. However, an
economic report for the European Commissionhas since found that some debt targets for 2020were based on optimistic assumptions aboutgrowth and will need to be revised upwards.
Towards the end of March, worries over the stateof the Spanish economy resurfaced due to adeterioration in the Spanish government’sfinancing position and Spain’s slowdown ingrowth subsequently causing markets to plungeonce again.
Outlook for the market 3)
The European periphery will remain in focus forquite some time to come, with Spain and Italythe biggest concerns. While Italy’s fiscal andeconomic outlook is weak, we believe Spain willenter a Troika programme this year in order torecapitalize and restructure its banks. Marketparticipants will closely follow their progress on
meeting deficit targets and further austeritymeasures could well be necessary.
At the same time, we believe the global growthpicture will remain under pressure, thus forcingcentral banks to remain highly accommodative. Inthe short to medium term, we therefore see the
market outlook skewed to the negative side withonly a few potential positive impacts arising fromthe outcome of the French and Greek electionsat the beginning of May and the Irish referendumon its Fiscal Compact at the end of May.
Portfolio ManagementOliver R. Gasser, CFA has global responsibility for structured finance within the Fixed Income team of Credit Suisse Asset Management.Prior to joining Credit Suisse, Oliver Gasser was a Director at UBS from 2002 through 2007, where as a Credit Portfolio Manager he wasresponsible for credit (de-)investments of the loan book of Global WM&BB. Prior to that, Oliver worked n various roles in the fixed incometrading and sales division of CS and CSFB Zurich for over 12 years. Mr. Gasser holds a Degree in BA from the University of AppliedSciences Zurich and qualified as a Chartered Financial Analyst (CFA) in 2006.
3) If not expressly indicated otherwise, all quantitative data contained in this comment is based on Lipper, Bloomberg or Datastream.
134
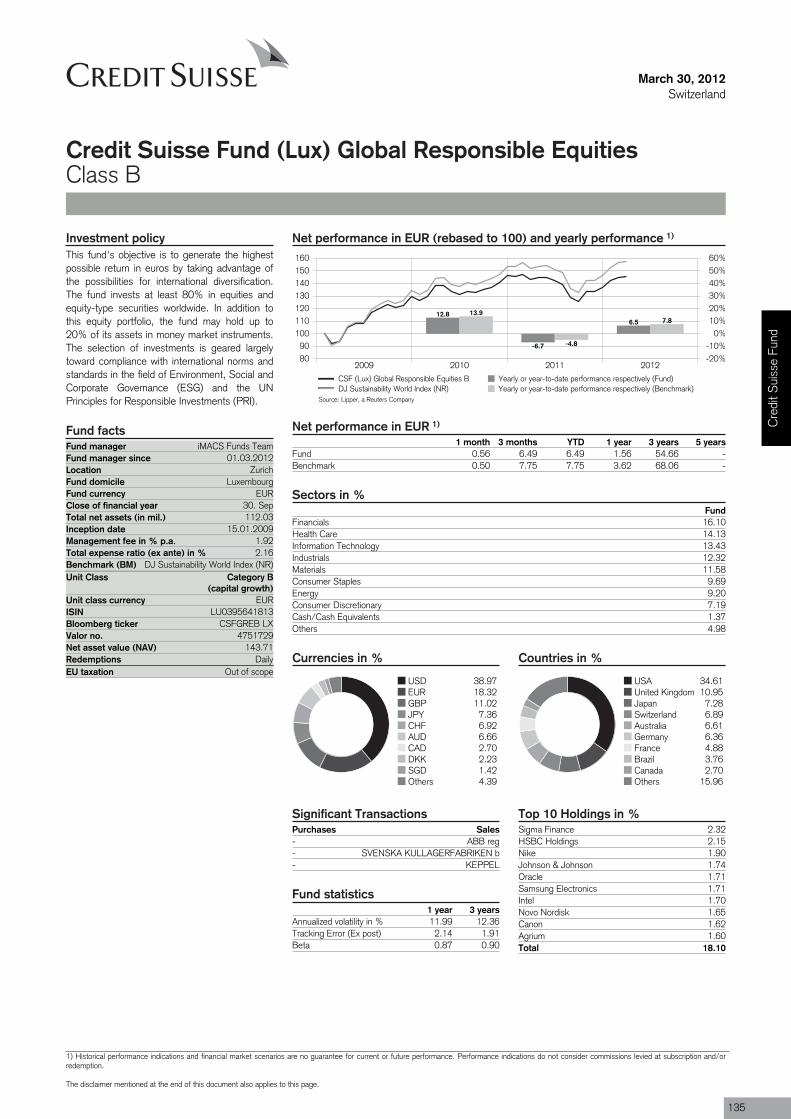
Purchases Sales- ABB reg- SVENSKA KULLAGERFABRIKEN b- KEPPEL
Fund manager iMACS Funds TeamFund manager since 01.03.2012Location ZurichFund domicile LuxembourgFund currency EURClose of financial year 30. SepTotal net assets (in mil.) 112.03Inception date 15.01.2009Management fee in % p.a. 1.92Total expense ratio (ex ante) in % 2.16Benchmark (BM) DJ Sustainability World Index (NR)Unit Class Category B
(capital growth)
ISIN LU0395641813
Valor no. 4751729
Redemptions DailyEU taxation Out of scope
March 30, 2012Switzerland
Credit Suisse Fund (Lux) Global Responsible EquitiesClass B
Net performance in EUR (rebased to 100) and yearly performance 1)
2009 2010 2011 20128090
100110120130140150160
-20%-10%
0%10%20%30%40%50%60%
12.8
-6.7
6.513.9
-4.8
7.8
CSF (Lux) Global Responsible Equities B Yearly or year-to-date performance respectively (Fund)DJ Sustainability World Index (NR) Yearly or year-to-date performance respectively (Benchmark)
Net performance in EUR 1)
1 month 3 months YTD 1 year 3 years 5 yearsFund 0.56 6.49 6.49 1.56 54.66 -Benchmark 0.50 7.75 7.75 3.62 68.06 -
Sectors in %Fund
Financials 16.10Health Care 14.13Information Technology 13.43Industrials 12.32Materials 11.58Consumer Staples 9.69Energy 9.20Consumer Discretionary 7.19Cash/Cash Equivalents 1.37Others 4.98
Currencies in %
USD 38.97EUR 18.32GBP 11.02JPY 7.36CHF 6.92AUD 6.66CAD 2.70DKK 2.23SGD 1.42Others 4.39
Countries in %
USA 34.61United Kingdom 10.95Japan 7.28Switzerland 6.89Australia 6.61Germany 6.36France 4.88Brazil 3.76Canada 2.70Others 15.96
Significant Transactions
Fund statistics1 year 3 years
Annualized volatility in % 11.99 12.36Tracking Error (Ex post) 2.14 1.91Beta 0.87 0.90
Top 10 Holdings in %Sigma Finance 2.32HSBC Holdings 2.15Nike 1.90Johnson & Johnson 1.74Oracle 1.71Samsung Electronics 1.71Intel 1.70Novo Nordisk 1.65Canon 1.62Agrium 1.60Total 18.10
Investment policyThis fund's objective is to generate the highestpossible return in euros by taking advantage ofthe possibilities for international diversification.The fund invests at least 80% in equities andequity-type securities worldwide. In addition tothis equity portfolio, the fund may hold up to20% of its assets in money market instruments.The selection of investments is geared largelytoward compliance with international norms andstandards in the field of Environment, Social andCorporate Governance (ESG) and the UNPrinciples for Responsible Investments (PRI).
Fund facts
Unit class currency EUR
Bloomberg ticker CSFGREB LX
Net asset value (NAV) 143.71
Source: Lipper, a Reuters Company
Cre
dit S
uiss
e Fu
nd
1) Historical performance indications and financial market scenarios are no guarantee for current or future performance. Performance indications do not consider commissions levied at subscription and/orredemption.
The disclaimer mentioned at the end of this document also applies to this page.
135
March 30, 2012Switzerland
Credit Suisse Fund (Lux) Global Responsible EquitiesClass B
Review previous quarter 2)
The first quarter of 2012 was again marked bythe debt situation in the eurozone, albeit this timeon a rather positive note. Government bonds ofItaly and Spain recovered some of their losses,whereas the German, French and some otherbond markets stayed at their low levels. Thegeneral mood could be summarized as “risk on”.
Economic indicators were pointing to a slightacceleration in economic growth, but were stillrather soft. This moved commodity prices up,especially oil. Equity markets also saw an
uptrend in prices. In the currency markets thepeg in EUR/CHF set by the SNB in earlySeptember at 1.20 held. It seems that Japanhas taken a similar course as the SNB and as aconsequence the JPY weakened considerably.
The eurozone showed growth in Q4 2011 of-0.3%, which was in line with expectations andthe unemployment rate increased above 10%.Greece, Italy and Spain entered into recessionduring Q4, so growth rates for the eurozone willbe low in Q1 2012. In the US growth accelerated
to 3% in Q4. House prices stabilized at lowerlevels but new building is still lagging.
Switzerland showed lower GDP growth in Q4 of0.1%, due to the strong Swiss franc dampeningforeign demand. Private consumption is stillrobust, but seems to be losing momentum. Theunemployment rate is stabilizing at low levels.The CPI and PPI are lower than before, with theCPI turning negative y-o-y.
Outlook for the market 2)
On a global level the growth picture still lookssolid. This includes the intact growth trends inAsia. Accordingly, we believe the risk of globalrecession to be moderate, but existing, though
growth in the mature markets is likely to remainvery low.
We have key overweights in the Emerging
Markets, whereas we may remain underweight inthe US, and neutral in the eurozone and Japan.
Portfolio ManagementThe portfolio is managed by a team of experienced investment professionals who are based in Zurich. The fund is managed according to CS private bankingresearch stock selection and in line with CS Asset Management Investment views. The team includes several portfolio managers who contribute to theco-management of the fund according to their area of expertise.
2) If not expressly indicated otherwise, all quantitative data contained in this comment is based on Lipper, Bloomberg or Datastream.
136
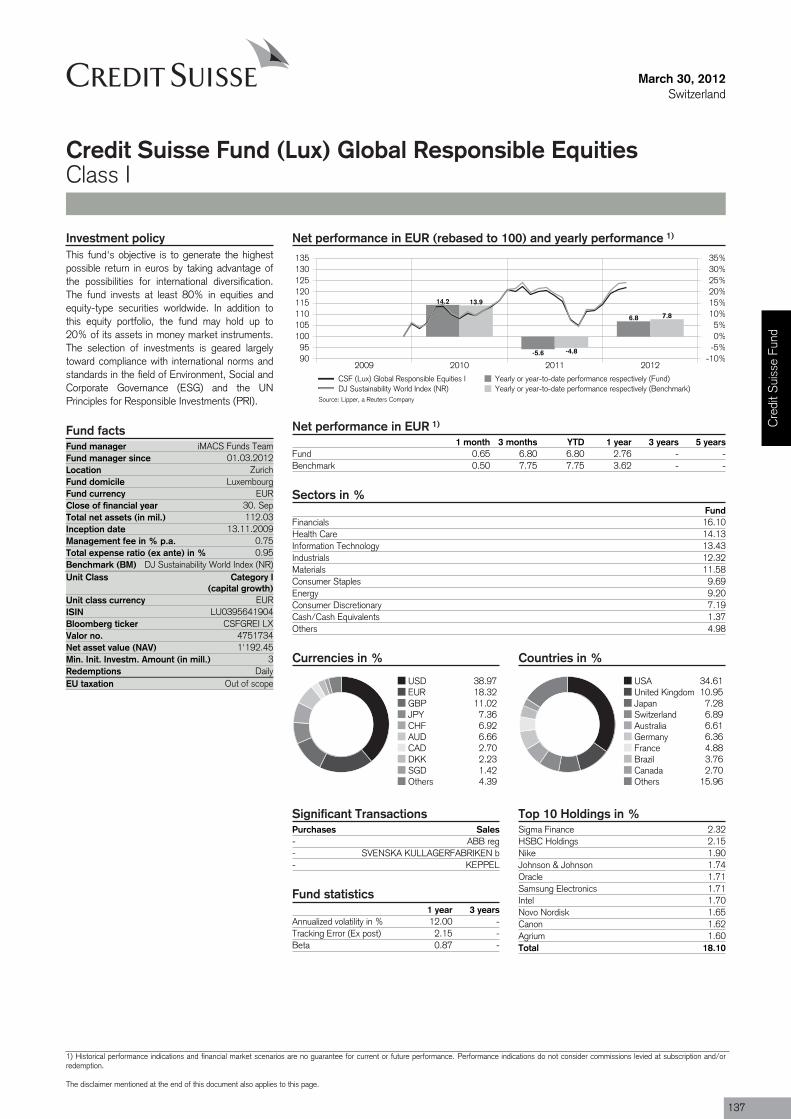
Purchases Sales- ABB reg- SVENSKA KULLAGERFABRIKEN b- KEPPEL
Fund manager iMACS Funds TeamFund manager since 01.03.2012Location ZurichFund domicile LuxembourgFund currency EURClose of financial year 30. SepTotal net assets (in mil.) 112.03Inception date 13.11.2009Management fee in % p.a. 0.75Total expense ratio (ex ante) in % 0.95Benchmark (BM) DJ Sustainability World Index (NR)Unit Class Category I
(capital growth)
ISIN LU0395641904
Valor no. 4751734
Min. Init. Investm. Amount (in mill.) 3Redemptions DailyEU taxation Out of scope
March 30, 2012Switzerland
Credit Suisse Fund (Lux) Global Responsible EquitiesClass I
Net performance in EUR (rebased to 100) and yearly performance 1)
2009 2010 2011 20129095
100105110115120125130135
-10%-5%0%5%
10%15%20%25%30%35%
14.2
-5.6
6.8
13.9
-4.8
7.8
CSF (Lux) Global Responsible Equities I Yearly or year-to-date performance respectively (Fund)DJ Sustainability World Index (NR) Yearly or year-to-date performance respectively (Benchmark)
Net performance in EUR 1)
1 month 3 months YTD 1 year 3 years 5 yearsFund 0.65 6.80 6.80 2.76 - -Benchmark 0.50 7.75 7.75 3.62 - -
Sectors in %Fund
Financials 16.10Health Care 14.13Information Technology 13.43Industrials 12.32Materials 11.58Consumer Staples 9.69Energy 9.20Consumer Discretionary 7.19Cash/Cash Equivalents 1.37Others 4.98
Currencies in %
USD 38.97EUR 18.32GBP 11.02JPY 7.36CHF 6.92AUD 6.66CAD 2.70DKK 2.23SGD 1.42Others 4.39
Countries in %
USA 34.61United Kingdom 10.95Japan 7.28Switzerland 6.89Australia 6.61Germany 6.36France 4.88Brazil 3.76Canada 2.70Others 15.96
Significant Transactions
Fund statistics1 year 3 years
Annualized volatility in % 12.00 -Tracking Error (Ex post) 2.15 -Beta 0.87 -
Top 10 Holdings in %Sigma Finance 2.32HSBC Holdings 2.15Nike 1.90Johnson & Johnson 1.74Oracle 1.71Samsung Electronics 1.71Intel 1.70Novo Nordisk 1.65Canon 1.62Agrium 1.60Total 18.10
Investment policyThis fund's objective is to generate the highestpossible return in euros by taking advantage ofthe possibilities for international diversification.The fund invests at least 80% in equities andequity-type securities worldwide. In addition tothis equity portfolio, the fund may hold up to20% of its assets in money market instruments.The selection of investments is geared largelytoward compliance with international norms andstandards in the field of Environment, Social andCorporate Governance (ESG) and the UNPrinciples for Responsible Investments (PRI).
Fund facts
Unit class currency EUR
Bloomberg ticker CSFGREI LX
Net asset value (NAV) 1'192.45
Source: Lipper, a Reuters Company
Cre
dit S
uiss
e Fu
nd
1) Historical performance indications and financial market scenarios are no guarantee for current or future performance. Performance indications do not consider commissions levied at subscription and/orredemption.
The disclaimer mentioned at the end of this document also applies to this page.
137
March 30, 2012Switzerland
Credit Suisse Fund (Lux) Global Responsible EquitiesClass I
Review previous quarter 2)
The first quarter of 2012 was again marked bythe debt situation in the eurozone, albeit this timeon a rather positive note. Government bonds ofItaly and Spain recovered some of their losses,whereas the German, French and some otherbond markets stayed at their low levels. Thegeneral mood could be summarized as “risk on”.
Economic indicators were pointing to a slightacceleration in economic growth, but were stillrather soft. This moved commodity prices up,especially oil. Equity markets also saw an
uptrend in prices. In the currency markets thepeg in EUR/CHF set by the SNB in earlySeptember at 1.20 held. It seems that Japanhas taken a similar course as the SNB and as aconsequence the JPY weakened considerably.
The eurozone showed growth in Q4 2011 of-0.3%, which was in line with expectations andthe unemployment rate increased above 10%.Greece, Italy and Spain entered into recessionduring Q4, so growth rates for the eurozone willbe low in Q1 2012. In the US growth accelerated
to 3% in Q4. House prices stabilized at lowerlevels but new building is still lagging.
Switzerland showed lower GDP growth in Q4 of0.1%, due to the strong Swiss franc dampeningforeign demand. Private consumption is stillrobust, but seems to be losing momentum. Theunemployment rate is stabilizing at low levels.The CPI and PPI are lower than before, with theCPI turning negative y-o-y.
Outlook for the market 2)
On a global level the growth picture still lookssolid. This includes the intact growth trends inAsia. Accordingly, we believe the risk of globalrecession to be moderate, but existing, though
growth in the mature markets is likely to remainvery low.
We have key overweights in the Emerging
Markets, whereas we may remain underweight inthe US, and neutral in the eurozone and Japan.
Portfolio ManagementThe portfolio is managed by a team of experienced investment professionals who are based in Zurich. The fund is managed according to CS private bankingresearch stock selection and in line with CS Asset Management Investment views. The team includes several portfolio managers who contribute to theco-management of the fund according to their area of expertise.
2) If not expressly indicated otherwise, all quantitative data contained in this comment is based on Lipper, Bloomberg or Datastream.
138

Fund manager Luc MathysFund manager since 16.08.2011Location ZurichFund domicile LuxembourgFund currency EURClose of financial year 30. SepTotal net assets (in mil.) 360.37Inception date 16.08.2011Management fee in % p.a. 0.30Total expense ratio (ex ante) in % 0.39Benchmark (BM) Citigroup EMU EUR 3M Euro Dep.Unit Class Category B
(capital growth)
ISIN LU0650600199
Valor no. 13405155
Redemptions DailyEU taxation In scope - tax
Fund 108
March 30, 2012Switzerland
Credit Suisse Fund (Lux) Money Market EURClass B
Net performance in EUR (rebased to 100) and yearly performance 1)
2007 2008 2009 2010 2011 2012100
102
104
106
108
110
112
114
0%
2%
4%
6%
8%
10%
12%
14%
3.5 3.6
2.00.8 0.8 0.3
4.24.9
1.40.5
1.20.3
CSF (Lux) Money Market EUR B Yearly or year-to-date performance respectively (Fund)Citigroup EMU EUR 3M Euro Dep. Yearly or year-to-date performance respectively (Benchmark)
Former Track record of Orchis EUR Money Market (19.04.2005 - 15.08.2011)
Net performance in EUR 1)
1 month 3 months YTD 1 year 3 years 5 yearsFund 0.10 0.32 0.32 0.98 3.34 10.63Benchmark 0.09 0.29 0.29 1.24 2.76 12.05
Maturities in months
0%
5%
10%
15%
20%
25%
30%
0-1 1-2 2-3 3-6 6-9 9-12 >12
Currencies in %before hedging after hedging
EUR 100.00 -
Asset Allocation in %Fixed Income 100.00Total 100.00
Duration and YieldFund
Gross portfolio yield in % 0.65Average remaining term to maturity in days 201Modified duration (days) 194
Fund statistics3 years 5 years
Annualised volatility in % 0.17 0.38Information ratio 1.07 -1.02Tracking Error (Ex post) 0.18 0.25Maximum drawdown in % 2) - -2) Maximum drawdown is the most negative cumulative returnover a given time period.
Credit Ratings in %
AAA 45.90AA+ 8.97AA 5.02AA- 10.28A+ 20.21A 2.22A- 7.40
Top 10 Holdings in %Position Coupon % Maturity as % of
assetsFinland 4.250 15.09.12 3.11Dt. Industriebank 2.125 10.09.12 2.79Germany 0.750 14.09.12 2.78EIB 2.500 15.04.12 2.58BNG 4.625 13.09.12 2.54KFW 5.250 04.07.12 2.25Roche 4.625 04.03.13 2.01UBS London 2.375 21.01.13 1.99Unedic 2.125 03.12.12 1.90CADES 2.625 25.04.12 1.89Total 23.84
Investment policyThe investment objective is to achieve anattractive and steady income in EUR based onthe performance of EUR money marketinstruments.The fund will invest in broadly diversified EURmoney market instruments from the investmentgrade area, with emphasis on prime borrowerquality.
Fund facts
Unit class currency EUR
Bloomberg ticker CSLMMEB LX
Net asset value (NAV) 100.49
Number of holdings
Source: Lipper, a Reuters Company
Cre
dit S
uiss
e Fu
nd
1) Historical performance indications and financial market scenarios are no guarantee for current or future performance. Performance indications do not consider commissions levied at subscription and/orredemption.
The disclaimer mentioned at the end of this document also applies to this page.
139

March 30, 2012Switzerland
Credit Suisse Fund (Lux) Money Market EURClass B
Review previous quarter 3)
In the first quarter, with global economicindicators remaining surprisingly resilient – mainlyin the US, emerging markets and selectedEuropean countries – and massive interventionsby the ECB, financial system stability hasimproved and the downside risk to the globaleconomy has been substantially reduced.
In Europe, we saw a relatively successfuloutcome of the debt exchange offer for Greekdebt and the announcement to increase totalfire power of the European Financial StabilityFacility and European Stability Mechanism to atotal of EUR 500bn – excluding already paid-outor announced schemes. Additionally, the ECB
provided another substantial liquidity injection tothe financial system in the euro area. The secondLong Term Refinancing Operation provided atotal of nearly EUR 530bn in fixed rate funding,and the balance sheet of the ECB has beenboosted by more than half a trillion sinceDecember.
However, with the exception of a few countrieslike Germany, the region is still facing majorheadwinds and the unemployment rate increasedto 10.8%, the highest level in almost 14 years.At the same time inflation slowed less thaneconomists forecasted due to higher energyprices.
In the first quarter, the improved financial andeconomic picture supported riskier asset classes.The Citigroup EUR 3 month deposit indexshowed a positive performance in the first quarter0.29%. During the same time period, therelevant EUR Libor curve steepened with12-month rates down by 53bps to 1.38% and3-month rates down by 61bps to 0.68%.Opposite to the previous quarter, credit spreadcontraction was mainly led by lower rated issuers,financials and selected peripheral sovereigns likeItaly or Ireland.
Outlook for the market 3)
While the massive liquidity injections by the ECBand the Greek debt restructuring havesucceeded in stabilizing banks and governmentdebt funding stress, structural financial issuesand economic weakness remain in place. InEurope, fiscal tightening should keep the overalleconomy weak, and divergences within Europeare expected to remain pronounced. Whileimmediate further easing in monetary policyseems to be unlikely at the current stage, weexpect expansionary policy to continue as somekey risks remain in place, like, for example, highoil prices or the continued struggle of Europeansovereigns to improve their financial situation.
While we expect in the short-term interest ratemarkets to remain supported by monetary policyand systemic risks, we remain negative on thelong end of the interest rate curve, as currentyields do not compensate for future credit andinflation risks.
However, within the money market universe, weaim to profit from positive carry in longer-datedmoney market instruments as central bank ratesare not expected to increase within the timehorizon of the average maturity of the fund. Whilethe corporate sector remains in a healthy statefor the time being and supply and demand
factors – new issues generally remainoversubscribed by a multiple – are supportingcredits, the current rally has reduced the ability toabsorb future volatility.
We continue to invest into fundamentally strongcorporate and financial bonds and at the sametime try to remain as liquid as possible in thecurrent market environment. While subordinatedfinancial debt remains supported by exchangeoffers and the general improvement in investorsentiment, downgrades and political risks keepus alert on this sector.
Portfolio ManagementLuc Mathys joined Credit Suisse in December 2007 as head of global rates and credit within MACS Fixed Income. Prior he wasresponsible for the money market and global fixed in-come products within the fixed income group of Clariden Leu and managed severalinvest-ment funds. Previously he spent two years at Bank Hofmann in the fixed income research and fund management department wherehe was responsible for managing bond funds and for research and distribution of structured investment products. Prior he worked invarious roles and locations for UBS, ultimately as fixed income and currency fund manager at UBS Global Asset Management. Luc Mathysstudied economics, focusing on financial market theory and econometrics, at the University of Bern. In 2003 he successfully qualified as aChartered Financial Analyst (CFA), and then as a Financial Risk Manager (FRM).
3) If not expressly indicated otherwise, all quantitative data contained in this comment is based on Lipper, Bloomberg or Datastream.
140
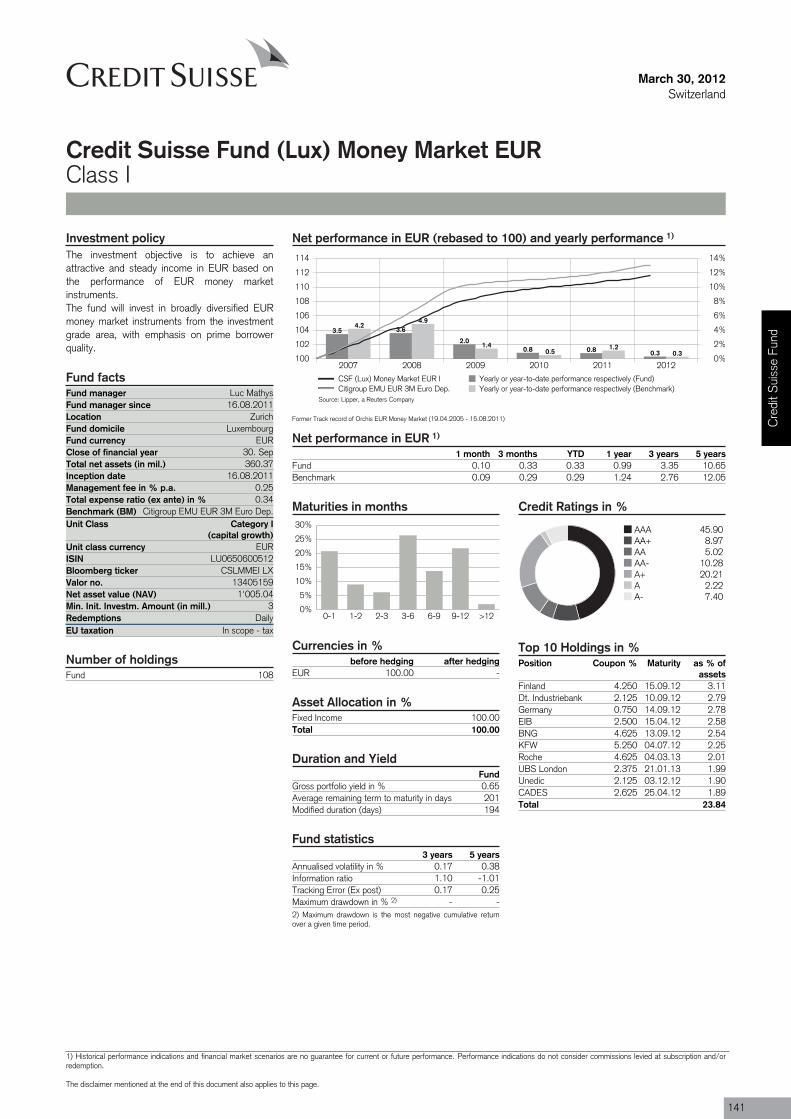
Fund manager Luc MathysFund manager since 16.08.2011Location ZurichFund domicile LuxembourgFund currency EURClose of financial year 30. SepTotal net assets (in mil.) 360.37Inception date 16.08.2011Management fee in % p.a. 0.25Total expense ratio (ex ante) in % 0.34Benchmark (BM) Citigroup EMU EUR 3M Euro Dep.Unit Class Category I
(capital growth)
ISIN LU0650600512
Valor no. 13405159
Min. Init. Investm. Amount (in mill.) 3Redemptions DailyEU taxation In scope - tax
Fund 108
March 30, 2012Switzerland
Credit Suisse Fund (Lux) Money Market EURClass I
Net performance in EUR (rebased to 100) and yearly performance 1)
2007 2008 2009 2010 2011 2012100
102
104
106
108
110
112
114
0%
2%
4%
6%
8%
10%
12%
14%
3.5 3.6
2.00.8 0.8 0.3
4.24.9
1.40.5
1.20.3
CSF (Lux) Money Market EUR I Yearly or year-to-date performance respectively (Fund)Citigroup EMU EUR 3M Euro Dep. Yearly or year-to-date performance respectively (Benchmark)
Former Track record of Orchis EUR Money Market (19.04.2005 - 15.08.2011)
Net performance in EUR 1)
1 month 3 months YTD 1 year 3 years 5 yearsFund 0.10 0.33 0.33 0.99 3.35 10.65Benchmark 0.09 0.29 0.29 1.24 2.76 12.05
Maturities in months
0%
5%
10%
15%
20%
25%
30%
0-1 1-2 2-3 3-6 6-9 9-12 >12
Currencies in %before hedging after hedging
EUR 100.00 -
Asset Allocation in %Fixed Income 100.00Total 100.00
Duration and YieldFund
Gross portfolio yield in % 0.65Average remaining term to maturity in days 201Modified duration (days) 194
Fund statistics3 years 5 years
Annualised volatility in % 0.17 0.38Information ratio 1.10 -1.01Tracking Error (Ex post) 0.17 0.25Maximum drawdown in % 2) - -2) Maximum drawdown is the most negative cumulative returnover a given time period.
Credit Ratings in %
AAA 45.90AA+ 8.97AA 5.02AA- 10.28A+ 20.21A 2.22A- 7.40
Top 10 Holdings in %Position Coupon % Maturity as % of
assetsFinland 4.250 15.09.12 3.11Dt. Industriebank 2.125 10.09.12 2.79Germany 0.750 14.09.12 2.78EIB 2.500 15.04.12 2.58BNG 4.625 13.09.12 2.54KFW 5.250 04.07.12 2.25Roche 4.625 04.03.13 2.01UBS London 2.375 21.01.13 1.99Unedic 2.125 03.12.12 1.90CADES 2.625 25.04.12 1.89Total 23.84
Investment policyThe investment objective is to achieve anattractive and steady income in EUR based onthe performance of EUR money marketinstruments.The fund will invest in broadly diversified EURmoney market instruments from the investmentgrade area, with emphasis on prime borrowerquality.
Fund facts
Unit class currency EUR
Bloomberg ticker CSLMMEI LX
Net asset value (NAV) 1'005.04
Number of holdings
Source: Lipper, a Reuters Company
Cre
dit S
uiss
e Fu
nd
1) Historical performance indications and financial market scenarios are no guarantee for current or future performance. Performance indications do not consider commissions levied at subscription and/orredemption.
The disclaimer mentioned at the end of this document also applies to this page.
141
March 30, 2012Switzerland
Credit Suisse Fund (Lux) Money Market EURClass I
Review previous quarter 3)
In the first quarter, with global economicindicators remaining surprisingly resilient – mainlyin the US, emerging markets and selectedEuropean countries – and massive interventionsby the ECB, financial system stability hasimproved and the downside risk to the globaleconomy has been substantially reduced.
In Europe, we saw a relatively successfuloutcome of the debt exchange offer for Greekdebt and the announcement to increase totalfire power of the European Financial StabilityFacility and European Stability Mechanism to atotal of EUR 500bn – excluding already paid-outor announced schemes. Additionally, the ECB
provided another substantial liquidity injection tothe financial system in the euro area. The secondLong Term Refinancing Operation provided atotal of nearly EUR 530bn in fixed rate funding,and the balance sheet of the ECB has beenboosted by more than half a trillion sinceDecember.
However, with the exception of a few countrieslike Germany, the region is still facing majorheadwinds and the unemployment rate increasedto 10.8%, the highest level in almost 14 years.At the same time inflation slowed less thaneconomists forecasted due to higher energyprices.
In the first quarter, the improved financial andeconomic picture supported riskier asset classes.The Citigroup EUR 3 month deposit indexshowed a positive performance in the first quarter0.29%. During the same time period, therelevant EUR Libor curve steepened with12-month rates down by 53bps to 1.38% and3-month rates down by 61bps to 0.68%.Opposite to the previous quarter, credit spreadcontraction was mainly led by lower rated issuers,financials and selected peripheral sovereigns likeItaly or Ireland.
Outlook for the market 3)
While the massive liquidity injections by the ECBand the Greek debt restructuring havesucceeded in stabilizing banks and governmentdebt funding stress, structural financial issuesand economic weakness remain in place. InEurope, fiscal tightening should keep the overalleconomy weak, and divergences within Europeare expected to remain pronounced. Whileimmediate further easing in monetary policyseems to be unlikely at the current stage, weexpect expansionary policy to continue as somekey risks remain in place, like, for example, highoil prices or the continued struggle of Europeansovereigns to improve their financial situation.
While we expect in the short-term interest ratemarkets to remain supported by monetary policyand systemic risks, we remain negative on thelong end of the interest rate curve, as currentyields do not compensate for future credit andinflation risks.
However, within the money market universe, weaim to profit from positive carry in longer-datedmoney market instruments as central bank ratesare not expected to increase within the timehorizon of the average maturity of the fund. Whilethe corporate sector remains in a healthy statefor the time being and supply and demand
factors – new issues generally remainoversubscribed by a multiple – are supportingcredits, the current rally has reduced the ability toabsorb future volatility.
We continue to invest into fundamentally strongcorporate and financial bonds and at the sametime try to remain as liquid as possible in thecurrent market environment. While subordinatedfinancial debt remains supported by exchangeoffers and the general improvement in investorsentiment, downgrades and political risks keepus alert on this sector.
Portfolio ManagementLuc Mathys joined Credit Suisse in December 2007 as head of global rates and credit within MACS Fixed Income. Prior he wasresponsible for the money market and global fixed in-come products within the fixed income group of Clariden Leu and managed severalinvest-ment funds. Previously he spent two years at Bank Hofmann in the fixed income research and fund management department wherehe was responsible for managing bond funds and for research and distribution of structured investment products. Prior he worked invarious roles and locations for UBS, ultimately as fixed income and currency fund manager at UBS Global Asset Management. Luc Mathysstudied economics, focusing on financial market theory and econometrics, at the University of Bern. In 2003 he successfully qualified as aChartered Financial Analyst (CFA), and then as a Financial Risk Manager (FRM).
3) If not expressly indicated otherwise, all quantitative data contained in this comment is based on Lipper, Bloomberg or Datastream.
142
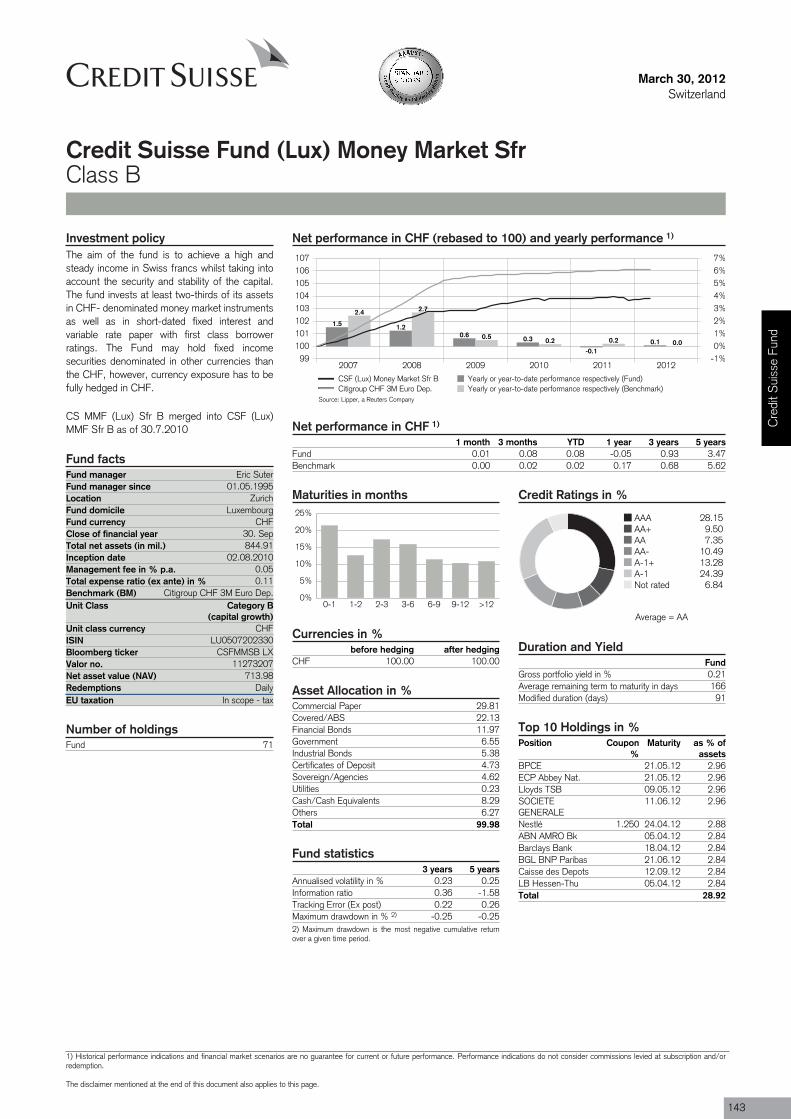
Fund manager Eric SuterFund manager since 01.05.1995Location ZurichFund domicile LuxembourgFund currency CHFClose of financial year 30. SepTotal net assets (in mil.) 844.91Inception date 02.08.2010Management fee in % p.a. 0.05Total expense ratio (ex ante) in % 0.11Benchmark (BM) Citigroup CHF 3M Euro Dep.Unit Class Category B
(capital growth)
ISIN LU0507202330
Valor no. 11273207
Redemptions DailyEU taxation In scope - tax
Fund 71
March 30, 2012Switzerland
Credit Suisse Fund (Lux) Money Market SfrClass B
Net performance in CHF (rebased to 100) and yearly performance 1)
2007 2008 2009 2010 2011 201299
100101102103104105106107
-1%0%1%2%3%4%5%6%7%
1.5 1.20.6 0.3
-0.10.1
2.4 2.7
0.5 0.2 0.2 0.0
CSF (Lux) Money Market Sfr B Yearly or year-to-date performance respectively (Fund)Citigroup CHF 3M Euro Dep. Yearly or year-to-date performance respectively (Benchmark)
Net performance in CHF 1)
1 month 3 months YTD 1 year 3 years 5 yearsFund 0.01 0.08 0.08 -0.05 0.93 3.47Benchmark 0.00 0.02 0.02 0.17 0.68 5.62
Maturities in months
0%
5%
10%
15%
20%
25%
0-1 1-2 2-3 3-6 6-9 9-12 >12
Currencies in %before hedging after hedging
CHF 100.00 100.00
Asset Allocation in %Commercial Paper 29.81Covered/ABS 22.13Financial Bonds 11.97Government 6.55Industrial Bonds 5.38Certificates of Deposit 4.73Sovereign/Agencies 4.62Utilities 0.23Cash/Cash Equivalents 8.29Others 6.27Total 99.98
Fund statistics3 years 5 years
Annualised volatility in % 0.23 0.25Information ratio 0.36 -1.58Tracking Error (Ex post) 0.22 0.26Maximum drawdown in % 2) -0.25 -0.252) Maximum drawdown is the most negative cumulative returnover a given time period.
Credit Ratings in %
AAA 28.15AA+ 9.50AA 7.35AA- 10.49A-1+ 13.28A-1 24.39Not rated 6.84
Duration and YieldFund
Gross portfolio yield in % 0.21Average remaining term to maturity in days 166Modified duration (days) 91
Top 10 Holdings in %Position Coupon
%Maturity as % of
assetsBPCE 21.05.12 2.96ECP Abbey Nat. 21.05.12 2.96Lloyds TSB 09.05.12 2.96SOCIETEGENERALE
11.06.12 2.96
Nestlé 1.250 24.04.12 2.88ABN AMRO Bk 05.04.12 2.84Barclays Bank 18.04.12 2.84BGL BNP Paribas 21.06.12 2.84Caisse des Depots 12.09.12 2.84LB Hessen-Thu 05.04.12 2.84Total 28.92
Investment policyThe aim of the fund is to achieve a high andsteady income in Swiss francs whilst taking intoaccount the security and stability of the capital.The fund invests at least two-thirds of its assetsin CHF- denominated money market instrumentsas well as in short-dated fixed interest andvariable rate paper with first class borrowerratings. The Fund may hold fixed incomesecurities denominated in other currencies thanthe CHF, however, currency exposure has to befully hedged in CHF.
CS MMF (Lux) Sfr B merged into CSF (Lux)MMF Sfr B as of 30.7.2010
Fund facts
Unit class currency CHF
Bloomberg ticker CSFMMSB LX
Net asset value (NAV) 713.98
Number of holdings
Source: Lipper, a Reuters Company
Average = AA
Cre
dit S
uiss
e Fu
nd
1) Historical performance indications and financial market scenarios are no guarantee for current or future performance. Performance indications do not consider commissions levied at subscription and/orredemption.
The disclaimer mentioned at the end of this document also applies to this page.
143
March 30, 2012Switzerland
Credit Suisse Fund (Lux) Money Market SfrClass B
Review previous quarter 3)
Substantial liquidity injections by the ECB (LTROI and LTRO II) and the restructuring of the Greekgovernment debt helped to stabilize markets inQ1 2012. There are still structural problemsrelated to European borrowers (which are notto be underestimated) and heterogeneous globalgrowth patterns. Nevertheless, the Swisseconomy narrowly avoided recession thanks todomestic consumption and high demand forSwiss watches and pharmaceutical products in
other countries. The SNB stuck to its guns andmaintained its expansive monetary policy, onceagain confirming a minimum exchange rate of1.20 francs to the euro.
Interest rates remained very low for all termsin the quarter under review. The 10-year swaprate even dipped below the 1% mark in earlyMarch to 0.99%, setting a new record low. Whileshort-term Confederation bonds of up to three
years still exhibited negative yields at the start ofthe reporting period, the curve has since returnedto normal. At the end of the quarter, the 3-monthCHF LIBOR was 6bps higher at 0.11%, whilethe yield on 2-year Confederation bonds rose to0.02% (+6bps) and 10-year bonds came in at0.85% (+21bps). The performance of the firstquarter was mostly positive thanks to investordemand for high yielding bonds which resulted ina reduction of credit spreads.
Outlook for the market 3)
While the US economy performed surprisinglywell, production in Japan and Europe stagnated.Switzerland's GDP managed to grow at a rateof 0.1% in Q4 2011 despite the continuousstrength of the Swiss franc. A number of leadingindicators are showing early signs of stabilization,which could suggest that the economy hasbottomed out. The Swiss economy is dependenton global economic trends, and it remains to beseen whether the progress made with regard toovercoming the European sovereign debt crisiswill bring a lasting improvement to the situation.That said, a resurgence of the debt crisis cannot
be ruled out. Other geopolitical tensions couldlead to increased volatility in commodity prices. Inits first assessment of monetary policy in March2012 the SNB maintained its expansive courseand confirmed the minimum exchange rate of1.20 francs to the euro. The target range forthe CHF 3-month LIBOR is still 0-0.25%, andliquidity is still being kept high. On the otherhand, inflation is expected to rise modestly(2013: 0.3% and 2014: 0.6%). Also, theforecast for economic growth has been revisedupwards to 1% for 2012.
For the first time since last year the score ofour interest rate factor model turned negative asthe more friendly fundamental picture suggestshigher yields going forward. The technical inputalso changed to negative due to an overboughtsituation in the short term. The behavioral inputalso neutralized because of the recent strongflattening of the yield curve. We recommend topquality issues and would increase thediversification in the portfolio as even some wellregarded names have gotten into trouble.
Portfolio ManagementEric Suter, Director, is a senior portfolio manager. He heads the Swiss Fixed Income Team and is responsible for the Swiss Fixed Incomeinvestment decision process. Eric joined CS Group in 1983 and worked in trading, product development and structuring of fixed incomeproducts. In 1995 he moved to fixed income asset management. He received a Bachelor in Business Administration from the KaderschuleZurich (KSZ), is a Certified International Investment Analyst (CIIA) and a member of the Swiss Bond Commission. Eric Suter, Director,leitet das Schweizer Franken Obligationen Team und ist verantwortlich für den Schweizer Franken Anlageprozess. Er stiess 1983 zur CSGroup und arbeitete im Handel, der Produkteentwicklung sowie in der Strukturierung von Zinsprodukten. 1995 wechselte er insObligationen Portfolio Management. Hr. Suter hat einen Abschluss in Betriebsökonomie der Kaderschule Zürich (KSZ), ist dipl.Finanzanalytiker und Vermögensverwalter (AZEK) sowie Mitglied der Schweizer Obligationenkommission (OKS).
Eric Suter, Director, dirige l'équipe Obligations CHF. Il a rejoint le CS Group en 1983 et a travaillé dans la vente, le développement produits ainsi que lastructuration de produits obligataires. En 1995, il est passé dans le domaine Portfolio Management Obligations. E. Suter dispose de diplômes en économied'entreprise de l'Ecole de cadres de Zurich (KSZ), d'analyste financier et gestionnaire de fortune (CFPI) et est membre de la Commission Suisse desObligations (OKS).
3) If not expressly indicated otherwise, all quantitative data contained in this comment is based on Lipper, Bloomberg or Datastream.
144
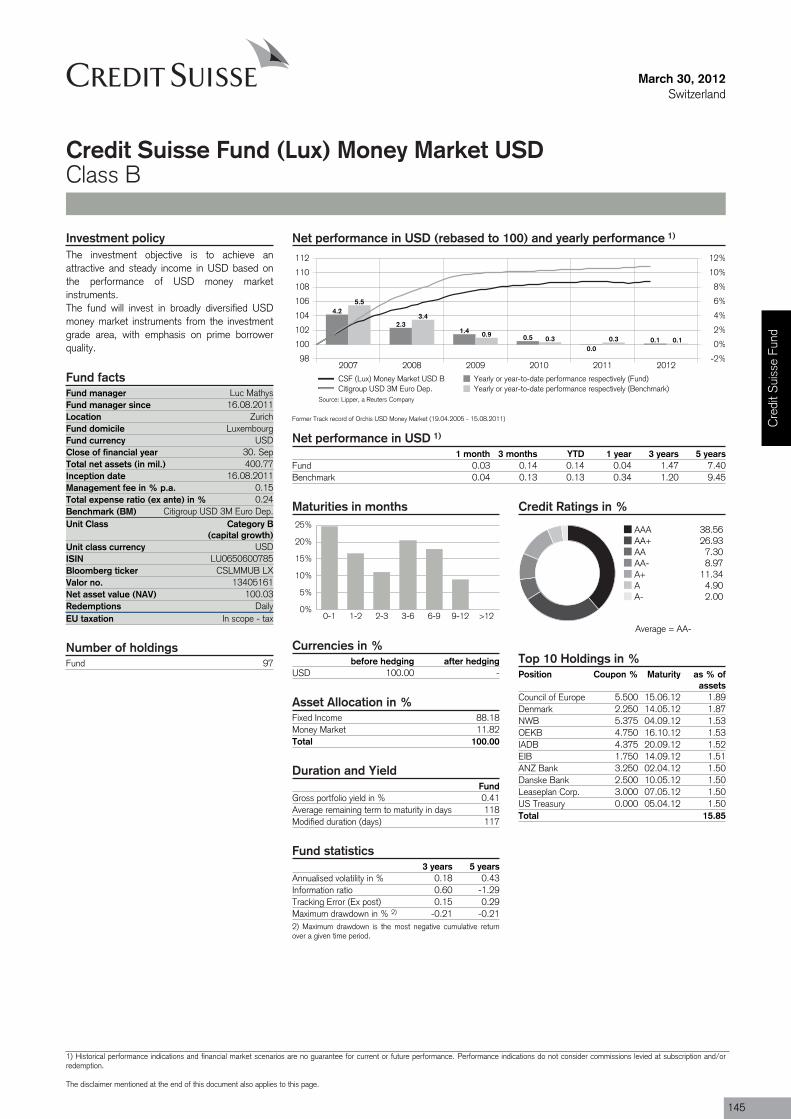
Fund manager Luc MathysFund manager since 16.08.2011Location ZurichFund domicile LuxembourgFund currency USDClose of financial year 30. SepTotal net assets (in mil.) 400.77Inception date 16.08.2011Management fee in % p.a. 0.15Total expense ratio (ex ante) in % 0.24Benchmark (BM) Citigroup USD 3M Euro Dep.Unit Class Category B
(capital growth)
ISIN LU0650600785
Valor no. 13405161
Redemptions DailyEU taxation In scope - tax
Fund 97
March 30, 2012Switzerland
Credit Suisse Fund (Lux) Money Market USDClass B
Net performance in USD (rebased to 100) and yearly performance 1)
2007 2008 2009 2010 2011 201298
100
102
104
106
108
110
112
-2%
0%
2%
4%
6%
8%
10%
12%
4.2
2.31.4
0.5
0.00.1
5.5
3.4
0.90.3 0.3 0.1
CSF (Lux) Money Market USD B Yearly or year-to-date performance respectively (Fund)Citigroup USD 3M Euro Dep. Yearly or year-to-date performance respectively (Benchmark)
Former Track record of Orchis USD Money Market (19.04.2005 - 15.08.2011)
Net performance in USD 1)
1 month 3 months YTD 1 year 3 years 5 yearsFund 0.03 0.14 0.14 0.04 1.47 7.40Benchmark 0.04 0.13 0.13 0.34 1.20 9.45
Maturities in months
0%
5%
10%
15%
20%
25%
0-1 1-2 2-3 3-6 6-9 9-12 >12
Currencies in %before hedging after hedging
USD 100.00 -
Asset Allocation in %Fixed Income 88.18Money Market 11.82Total 100.00
Duration and YieldFund
Gross portfolio yield in % 0.41Average remaining term to maturity in days 118Modified duration (days) 117
Fund statistics3 years 5 years
Annualised volatility in % 0.18 0.43Information ratio 0.60 -1.29Tracking Error (Ex post) 0.15 0.29Maximum drawdown in % 2) -0.21 -0.212) Maximum drawdown is the most negative cumulative returnover a given time period.
Credit Ratings in %
AAA 38.56AA+ 26.93AA 7.30AA- 8.97A+ 11.34A 4.90A- 2.00
Top 10 Holdings in %Position Coupon % Maturity as % of
assetsCouncil of Europe 5.500 15.06.12 1.89Denmark 2.250 14.05.12 1.87NWB 5.375 04.09.12 1.53OEKB 4.750 16.10.12 1.53IADB 4.375 20.09.12 1.52EIB 1.750 14.09.12 1.51ANZ Bank 3.250 02.04.12 1.50Danske Bank 2.500 10.05.12 1.50Leaseplan Corp. 3.000 07.05.12 1.50US Treasury 0.000 05.04.12 1.50Total 15.85
Investment policyThe investment objective is to achieve anattractive and steady income in USD based onthe performance of USD money marketinstruments.The fund will invest in broadly diversified USDmoney market instruments from the investmentgrade area, with emphasis on prime borrowerquality.
Fund facts
Unit class currency USD
Bloomberg ticker CSLMMUB LX
Net asset value (NAV) 100.03
Number of holdings
Source: Lipper, a Reuters Company
Average = AA-
Cre
dit S
uiss
e Fu
nd
1) Historical performance indications and financial market scenarios are no guarantee for current or future performance. Performance indications do not consider commissions levied at subscription and/orredemption.
The disclaimer mentioned at the end of this document also applies to this page.
145
March 30, 2012Switzerland
Credit Suisse Fund (Lux) Money Market USDClass B
Review previous quarter 3)
In the first quarter, with global economicindicators remaining surprisingly resilient – mainlyin the US, emerging markets and selectedEuropean countries – and massive interventionsby the ECB, financial system stability hasimproved and the downside risk to the globaleconomy has been substantially reduced.
In the US, with the unemployment ratedecreasing to 8.3% and unemployment benefitclaims falling to the lowest level since April 2008,consumer confidence reached the
second-highest level in four years and retail salescontinued to climb. Additionally, purchasingmanager indices pointed to a continuedexpansion in business activity. On the otherhand, with oil prices back close to their 2011peaks, inflation rose in February the most in 10months, mainly driven by gasoline prices,accounting for roughly 80% of the headlinefigure.
In the first quarter, the improved financial andeconomic picture supported riskier asset classes
and longer-dated Treasury rates correctedsignificantly higher. The Citigroup USD 3 MonthDeposit index showed a positive performanceof 0.13%. During the same time period, therelevant USD Libor curve steepened slightly with12-month rates down by 8bps to 1.05% and3-month rates down by 11bps to 0.47%.Opposite to the previous quarter, credit spreadcontraction was mainly led by lower ratedcompanies and financials.
Outlook for the market 3)
Massive interventions by the ECB, as well as theGreek debt restructuring, have improved financialstability globally and reduced the risk of a majordownturn. However, the sovereign debt risk hasnot been fully removed and could flare up again.Barring major turmoil, the US recovery looksquite robust, and limited upside surprises arestill possible. Private consumption is supportedby stronger labor income and credit growth, buthigher gasoline prices pose a risk.
While we expect in the short-term interest rate
markets to remain supported by monetary policyand systemic risks, we remain negative on thelong end of the interest rate curve, as currentyields do not compensate for future credit andinflation risks. However, within the money marketuniverse, we aim to profit from positive carryin longer-dated money market instruments ascentral bank rates are not expected to increasewithin the time horizon of the average maturity ofthe fund. While the corporate sector remains in ahealthy state for the time being and supply anddemand factors – new issues generally remain
oversubscribed by a multiple – are supportingcredits, the current rally has reduced the ability toabsorb future volatility.
We continue to invest into fundamentally strongcorporate and financial bonds and at the sametime try to remain as liquid as possible in thecurrent market environment. While subordinatedfinancial debt remains supported by exchangeoffers and the general improvement in investorsentiment, downgrades and political risks keepus alert on this sector.
Portfolio ManagementLuc Mathys joined Credit Suisse in December 2007 as head of global rates and credit within MACS Fixed Income. Prior he wasresponsible for the money market and global fixed in-come products within the fixed income group of Clariden Leu and managed severalinvest-ment funds. Previously he spent two years at Bank Hofmann in the fixed income research and fund management department wherehe was responsible for managing bond funds and for research and distribution of structured investment products. Prior he worked invarious roles and locations for UBS, ultimately as fixed income and currency fund manager at UBS Global Asset Management. Luc Mathysstudied economics, focusing on financial market theory and econometrics, at the University of Bern. In 2003 he successfully qualified as aChartered Financial Analyst (CFA), and then as a Financial Risk Manager (FRM).
3) If not expressly indicated otherwise, all quantitative data contained in this comment is based on Lipper, Bloomberg or Datastream.
146
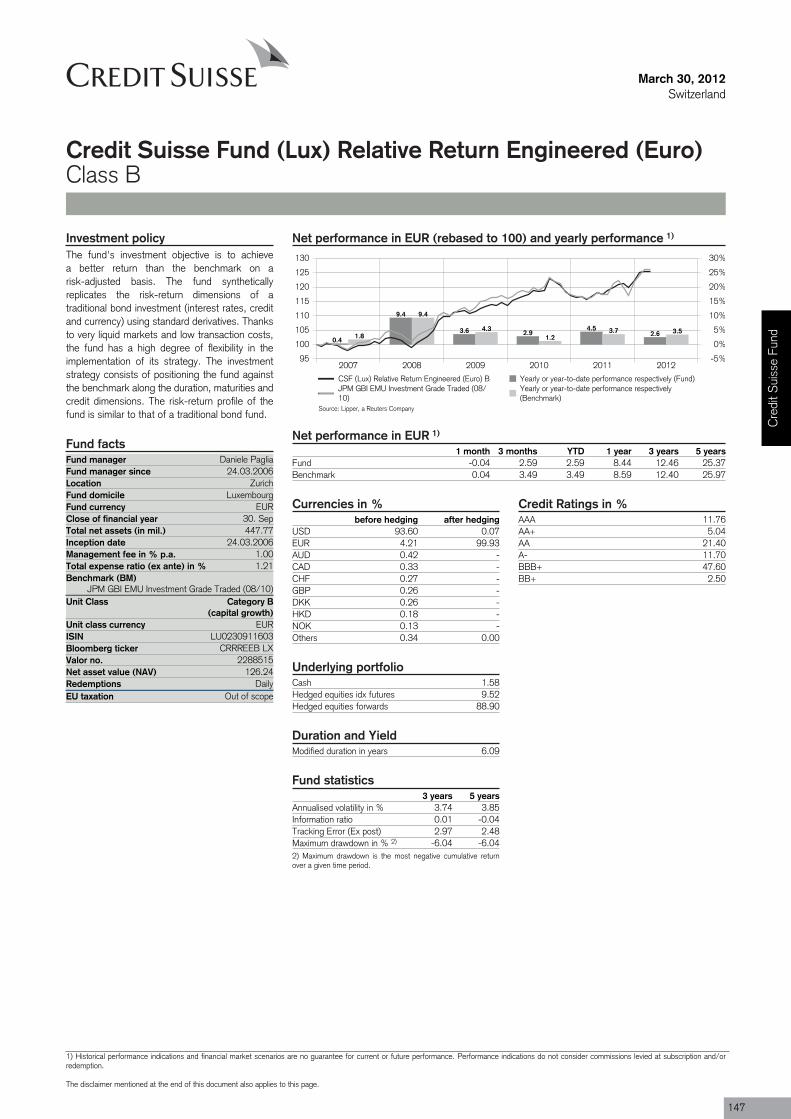
Fund manager Daniele PagliaFund manager since 24.03.2006Location ZurichFund domicile LuxembourgFund currency EURClose of financial year 30. SepTotal net assets (in mil.) 447.77Inception date 24.03.2006Management fee in % p.a. 1.00Total expense ratio (ex ante) in % 1.21Benchmark (BM)
JPM GBI EMU Investment Grade Traded (08/10)Unit Class Category B
(capital growth)
ISIN LU0230911603
Valor no. 2288515
Redemptions DailyEU taxation Out of scope
March 30, 2012Switzerland
Credit Suisse Fund (Lux) Relative Return Engineered (Euro)Class B
Net performance in EUR (rebased to 100) and yearly performance 1)
2007 2008 2009 2010 2011 201295
100
105
110
115
120
125
130
-5%
0%
5%
10%
15%
20%
25%
30%
0.4
9.4
3.6 2.94.5
2.61.8
9.4
4.31.2
3.7 3.5
CSF (Lux) Relative Return Engineered (Euro) B Yearly or year-to-date performance respectively (Fund)JPM GBI EMU Investment Grade Traded (08/10)
Yearly or year-to-date performance respectively(Benchmark)
Net performance in EUR 1)
1 month 3 months YTD 1 year 3 years 5 yearsFund -0.04 2.59 2.59 8.44 12.46 25.37Benchmark 0.04 3.49 3.49 8.59 12.40 25.97
Currencies in %before hedging after hedging
USD 93.60 0.07EUR 4.21 99.93AUD 0.42 -CAD 0.33 -CHF 0.27 -GBP 0.26 -DKK 0.26 -HKD 0.18 -NOK 0.13 -Others 0.34 0.00
Credit Ratings in %AAA 11.76AA+ 5.04AA 21.40A- 11.70BBB+ 47.60BB+ 2.50
Underlying portfolioCash 1.58Hedged equities idx futures 9.52Hedged equities forwards 88.90
Duration and YieldModified duration in years 6.09
Fund statistics3 years 5 years
Annualised volatility in % 3.74 3.85Information ratio 0.01 -0.04Tracking Error (Ex post) 2.97 2.48Maximum drawdown in % 2) -6.04 -6.042) Maximum drawdown is the most negative cumulative returnover a given time period.
Investment policyThe fund's investment objective is to achievea better return than the benchmark on arisk-adjusted basis. The fund syntheticallyreplicates the risk-return dimensions of atraditional bond investment (interest rates, creditand currency) using standard derivatives. Thanksto very liquid markets and low transaction costs,the fund has a high degree of flexibility in theimplementation of its strategy. The investmentstrategy consists of positioning the fund againstthe benchmark along the duration, maturities andcredit dimensions. The risk-return profile of thefund is similar to that of a traditional bond fund.
Fund facts
Unit class currency EUR
Bloomberg ticker CRRREEB LX
Net asset value (NAV) 126.24
Source: Lipper, a Reuters Company
Cre
dit S
uiss
e Fu
nd
1) Historical performance indications and financial market scenarios are no guarantee for current or future performance. Performance indications do not consider commissions levied at subscription and/orredemption.
The disclaimer mentioned at the end of this document also applies to this page.
147

March 30, 2012Switzerland
Credit Suisse Fund (Lux) Relative Return Engineered (Euro)Class B
Review previous quarter 3)
On the wake of the second 3-year LTRO, Q1has been very positive for risky assets. It wasthe best quarter for many equity markets since1998, even if the last couple of weeks showedsome weakness. Record mutual fund inflows intoa shrinking market also made Q1 the strongestquarter for European credit in at least a decade.The iTraxx Main CDS index tightened 47bps on
the quarter. Financials outperformed, with theiTraxx Senior Financial index tightening 58bps.
Peripheral government bond markets profitedfrom buying by domestic banks, with BTPsreturning 11.1% on the quarter. With +1.1%,Spain lagged the outperformance of theperiphery markets and is shaping up to become
the next European crisis hotspot. Coregovernment bonds were modestly negative inQ1. Treasuries and Gilts were down 1.3% and1.8%, while Bunds were around flat (+0.2%)on a total return basis. On the currency frontthe USD lost 2.9% against the EUR but gained7.2% against the JPY.
Outlook for the market 3)
The second 3-year long term refinancingoperation (LTRO) of the ECB acted like anadrenaline shock, tilting the markets back to arisk on modus. But cheap liquidity can onlysubmerge fundamental problems and lift all boatsfor a while, it is no cure for deeper solvency
problems. With central banks on hold for themoment and the effect of past liquidity shotssubsiding rapidly, markets could enter aconsolidation phase in Q2. Upcoming elections inFrance and Greece will add to overall uncertainty.Markets will remain volatile and continue trading
within wide ranges. After the sharp rally in Q1we would take some profits and reduce creditexposure, especially in financials. We are alsoturning more cautious on duration, with a slightlyshorter position than the benchmark.
Portfolio ManagementDaniele Paglia, Director, is a senior portfolio manager in the Fixed Income Total Return Strategy team. He is also responsible for fixedincome Swap products. Prior to joining CSAM in 2002, he spent three years as a quantitative fixed income analyst and portfolio managerat Zürcher Kantonalbank. Before that the worked for six years as a fixed income analyst at UBS in Zurich and London. He graduated fromthe University of Zurich (specialising in finance and operations research).
3) If not expressly indicated otherwise, all quantitative data contained in this comment is based on Lipper, Bloomberg or Datastream.
148
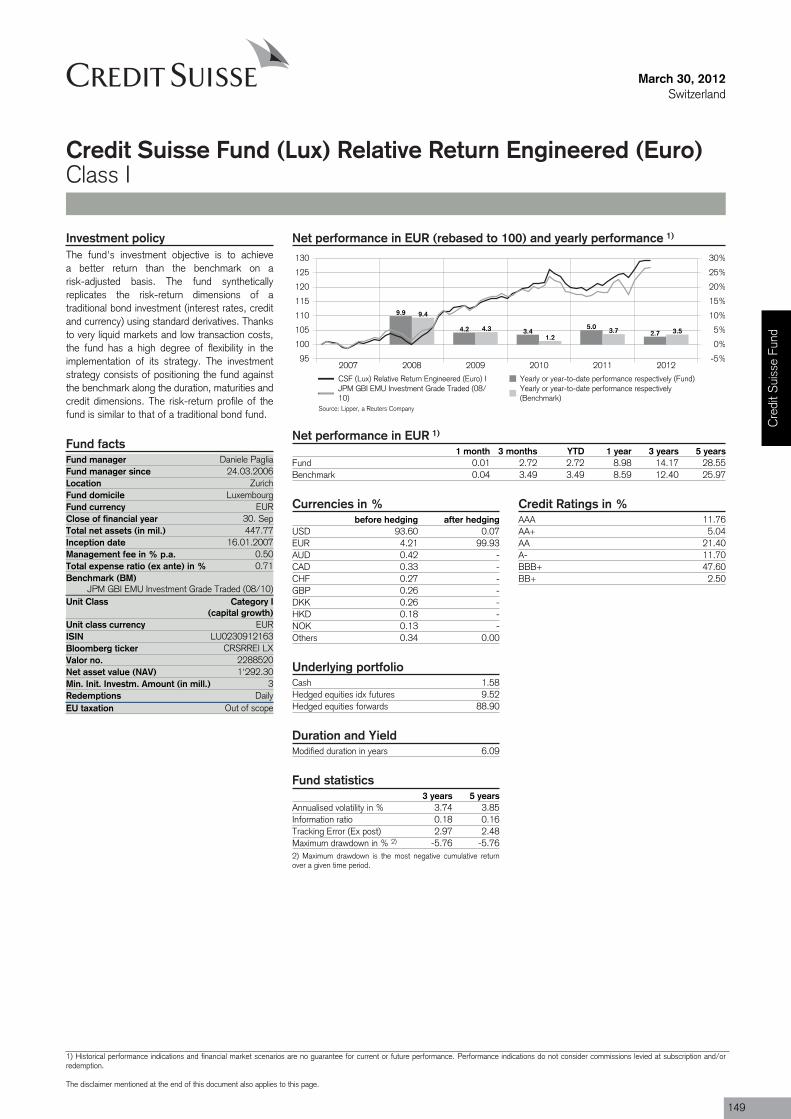
Fund manager Daniele PagliaFund manager since 24.03.2006Location ZurichFund domicile LuxembourgFund currency EURClose of financial year 30. SepTotal net assets (in mil.) 447.77Inception date 16.01.2007Management fee in % p.a. 0.50Total expense ratio (ex ante) in % 0.71Benchmark (BM)
JPM GBI EMU Investment Grade Traded (08/10)Unit Class Category I
(capital growth)
ISIN LU0230912163
Valor no. 2288520
Min. Init. Investm. Amount (in mill.) 3Redemptions DailyEU taxation Out of scope
March 30, 2012Switzerland
Credit Suisse Fund (Lux) Relative Return Engineered (Euro)Class I
Net performance in EUR (rebased to 100) and yearly performance 1)
2007 2008 2009 2010 2011 201295
100
105
110
115
120
125
130
-5%
0%
5%
10%
15%
20%
25%
30%
9.9
4.2 3.45.0
2.7
9.4
4.31.2
3.7 3.5
CSF (Lux) Relative Return Engineered (Euro) I Yearly or year-to-date performance respectively (Fund)JPM GBI EMU Investment Grade Traded (08/10)
Yearly or year-to-date performance respectively(Benchmark)
Net performance in EUR 1)
1 month 3 months YTD 1 year 3 years 5 yearsFund 0.01 2.72 2.72 8.98 14.17 28.55Benchmark 0.04 3.49 3.49 8.59 12.40 25.97
Currencies in %before hedging after hedging
USD 93.60 0.07EUR 4.21 99.93AUD 0.42 -CAD 0.33 -CHF 0.27 -GBP 0.26 -DKK 0.26 -HKD 0.18 -NOK 0.13 -Others 0.34 0.00
Credit Ratings in %AAA 11.76AA+ 5.04AA 21.40A- 11.70BBB+ 47.60BB+ 2.50
Underlying portfolioCash 1.58Hedged equities idx futures 9.52Hedged equities forwards 88.90
Duration and YieldModified duration in years 6.09
Fund statistics3 years 5 years
Annualised volatility in % 3.74 3.85Information ratio 0.18 0.16Tracking Error (Ex post) 2.97 2.48Maximum drawdown in % 2) -5.76 -5.762) Maximum drawdown is the most negative cumulative returnover a given time period.
Investment policyThe fund's investment objective is to achievea better return than the benchmark on arisk-adjusted basis. The fund syntheticallyreplicates the risk-return dimensions of atraditional bond investment (interest rates, creditand currency) using standard derivatives. Thanksto very liquid markets and low transaction costs,the fund has a high degree of flexibility in theimplementation of its strategy. The investmentstrategy consists of positioning the fund againstthe benchmark along the duration, maturities andcredit dimensions. The risk-return profile of thefund is similar to that of a traditional bond fund.
Fund facts
Unit class currency EUR
Bloomberg ticker CRSRREI LX
Net asset value (NAV) 1'292.30
Source: Lipper, a Reuters Company
Cre
dit S
uiss
e Fu
nd
1) Historical performance indications and financial market scenarios are no guarantee for current or future performance. Performance indications do not consider commissions levied at subscription and/orredemption.
The disclaimer mentioned at the end of this document also applies to this page.
149
March 30, 2012Switzerland
Credit Suisse Fund (Lux) Relative Return Engineered (Euro)Class I
Review previous quarter 3)
On the wake of the second 3-year LTRO, Q1has been very positive for risky assets. It wasthe best quarter for many equity markets since1998, even if the last couple of weeks showedsome weakness. Record mutual fund inflows intoa shrinking market also made Q1 the strongestquarter for European credit in at least a decade.The iTraxx Main CDS index tightened 47bps on
the quarter. Financials outperformed, with theiTraxx Senior Financial index tightening 58bps.
Peripheral government bond markets profitedfrom buying by domestic banks, with BTPsreturning 11.1% on the quarter. With +1.1%,Spain lagged the outperformance of theperiphery markets and is shaping up to become
the next European crisis hotspot. Coregovernment bonds were modestly negative inQ1. Treasuries and Gilts were down 1.3% and1.8%, while Bunds were around flat (+0.2%)on a total return basis. On the currency frontthe USD lost 2.9% against the EUR but gained7.2% against the JPY.
Outlook for the market 3)
The second 3-year long term refinancingoperation (LTRO) of the ECB acted like anadrenaline shock, tilting the markets back to arisk on modus. But cheap liquidity can onlysubmerge fundamental problems and lift all boatsfor a while, it is no cure for deeper solvency
problems. With central banks on hold for themoment and the effect of past liquidity shotssubsiding rapidly, markets could enter aconsolidation phase in Q2. Upcoming elections inFrance and Greece will add to overall uncertainty.Markets will remain volatile and continue trading
within wide ranges. After the sharp rally in Q1we would take some profits and reduce creditexposure, especially in financials. We are alsoturning more cautious on duration, with a slightlyshorter position than the benchmark.
Portfolio ManagementDaniele Paglia, Director, is a senior portfolio manager in the Fixed Income Total Return Strategy team. He is also responsible for fixedincome Swap products. Prior to joining CSAM in 2002, he spent three years as a quantitative fixed income analyst and portfolio managerat Zürcher Kantonalbank. Before that the worked for six years as a fixed income analyst at UBS in Zurich and London. He graduated fromthe University of Zurich (specialising in finance and operations research).
3) If not expressly indicated otherwise, all quantitative data contained in this comment is based on Lipper, Bloomberg or Datastream.
150
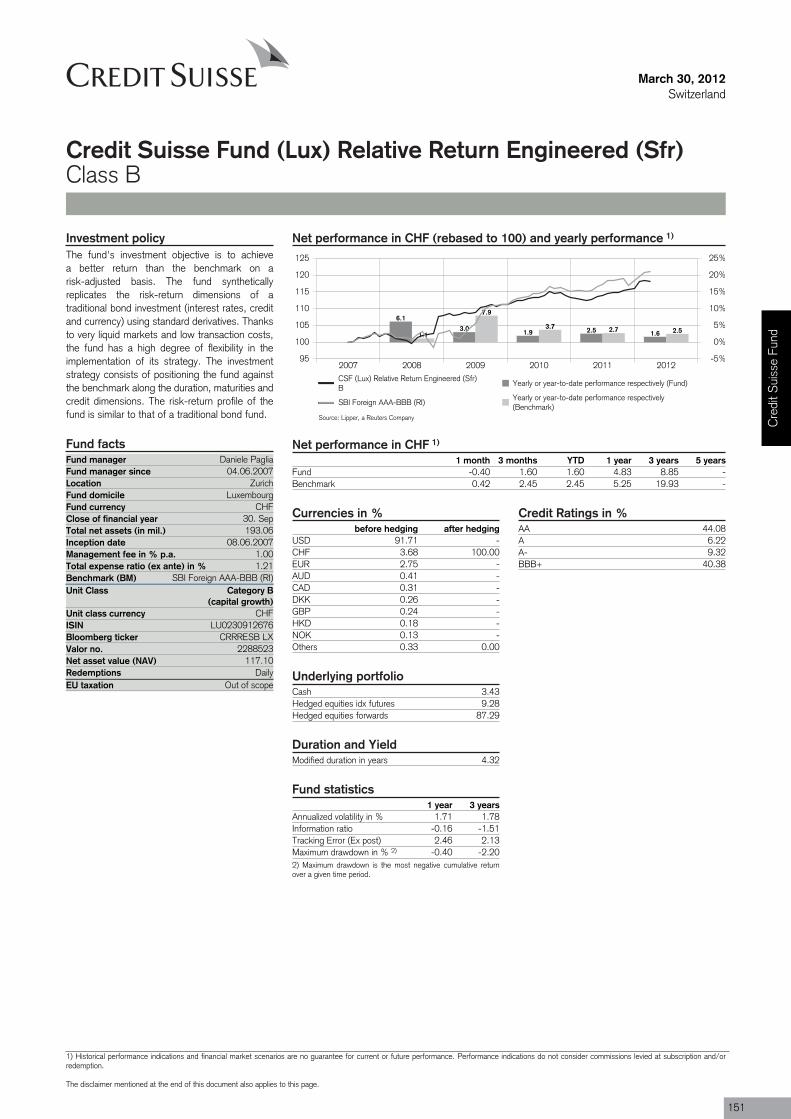
Fund manager Daniele PagliaFund manager since 04.06.2007Location ZurichFund domicile LuxembourgFund currency CHFClose of financial year 30. SepTotal net assets (in mil.) 193.06Inception date 08.06.2007Management fee in % p.a. 1.00Total expense ratio (ex ante) in % 1.21Benchmark (BM) SBI Foreign AAA-BBB (RI)Unit Class Category B
(capital growth)
ISIN LU0230912676
Valor no. 2288523
Redemptions DailyEU taxation Out of scope
March 30, 2012Switzerland
Credit Suisse Fund (Lux) Relative Return Engineered (Sfr)Class B
Net performance in CHF (rebased to 100) and yearly performance 1)
2007 2008 2009 2010 2011 201295
100
105
110
115
120
125
-5%
0%
5%
10%
15%
20%
25%
6.1
3.0 1.9 2.5 1.61.1
7.9
3.7 2.7 2.5
CSF (Lux) Relative Return Engineered (Sfr)B
Yearly or year-to-date performance respectively (Fund)
SBI Foreign AAA-BBB (RI)Yearly or year-to-date performance respectively(Benchmark)
Net performance in CHF 1)
1 month 3 months YTD 1 year 3 years 5 yearsFund -0.40 1.60 1.60 4.83 8.85 -Benchmark 0.42 2.45 2.45 5.25 19.93 -
Currencies in %before hedging after hedging
USD 91.71 -CHF 3.68 100.00EUR 2.75 -AUD 0.41 -CAD 0.31 -DKK 0.26 -GBP 0.24 -HKD 0.18 -NOK 0.13 -Others 0.33 0.00
Credit Ratings in %AA 44.08A 6.22A- 9.32BBB+ 40.38
Underlying portfolioCash 3.43Hedged equities idx futures 9.28Hedged equities forwards 87.29
Duration and YieldModified duration in years 4.32
Fund statistics1 year 3 years
Annualized volatility in % 1.71 1.78Information ratio -0.16 -1.51Tracking Error (Ex post) 2.46 2.13Maximum drawdown in % 2) -0.40 -2.202) Maximum drawdown is the most negative cumulative returnover a given time period.
Investment policyThe fund's investment objective is to achievea better return than the benchmark on arisk-adjusted basis. The fund syntheticallyreplicates the risk-return dimensions of atraditional bond investment (interest rates, creditand currency) using standard derivatives. Thanksto very liquid markets and low transaction costs,the fund has a high degree of flexibility in theimplementation of its strategy. The investmentstrategy consists of positioning the fund againstthe benchmark along the duration, maturities andcredit dimensions. The risk-return profile of thefund is similar to that of a traditional bond fund.
Fund facts
Unit class currency CHF
Bloomberg ticker CRRRESB LX
Net asset value (NAV) 117.10
Source: Lipper, a Reuters Company Cre
dit S
uiss
e Fu
nd
1) Historical performance indications and financial market scenarios are no guarantee for current or future performance. Performance indications do not consider commissions levied at subscription and/orredemption.
The disclaimer mentioned at the end of this document also applies to this page.
151

March 30, 2012Switzerland
Credit Suisse Fund (Lux) Relative Return Engineered (Sfr)Class B
Review previous quarter 3)
On the wake of the second 3-year LTRO, Q1has been very positive for risky assets. It wasthe best quarter for many equity markets since1998, even if the last couple of weeks showedsome weakness. Record mutual fund inflows intoa shrinking market also made Q1 the strongestquarter for European credit in at least a decade.The iTraxx Main CDS index tightened 47bps on
the quarter. Financials outperformed, with theiTraxx Senior Financial index tightening 58bps.
Peripheral government bond markets profitedfrom buying by domestic banks, with BTPsreturning 11.1% on the quarter. With +1.1%,Spain lagged the outperformance of theperiphery markets and is shaping up to become
the next European crisis hotspot. Coregovernment bonds were modestly negative inQ1. Treasuries and Gilts were down 1.3% and1.8%, while Bunds were around flat (+0.2%)on a total return basis. On the currency frontthe USD lost 2.9% against the EUR but gained7.2% against the JPY.
Outlook for the market 3)
The second 3-year long term refinancingoperation (LTRO) of the ECB acted like anadrenaline shock, tilting the markets back to arisk on modus. But cheap liquidity can onlysubmerge fundamental problems and lift all boatsfor a while, it is no cure for deeper solvency
problems. With central banks on hold for themoment and the effect of past liquidity shotssubsiding rapidly, markets could enter aconsolidation phase in Q2. Upcoming elections inFrance and Greece will add to overall uncertainty.Markets will remain volatile and continue trading
within wide ranges. After the sharp rally in Q1we would take some profits and reduce creditexposure, especially in financials. We are alsoturning more cautious on duration, with a slightlyshorter position than the benchmark.
Portfolio ManagementDaniele Paglia, Director, is a senior portfolio manager in the Fixed Income Total Return Strategy team. He is also responsible for fixedincome Swap products. Prior to joining CSAM in 2002, he spent three years as a quantitative fixed income analyst and portfolio managerat Zürcher Kantonalbank. Before that the worked for six years as a fixed income analyst at UBS in Zurich and London. He graduated fromthe University of Zurich (specialising in finance and operations research).
3) If not expressly indicated otherwise, all quantitative data contained in this comment is based on Lipper, Bloomberg or Datastream.
152
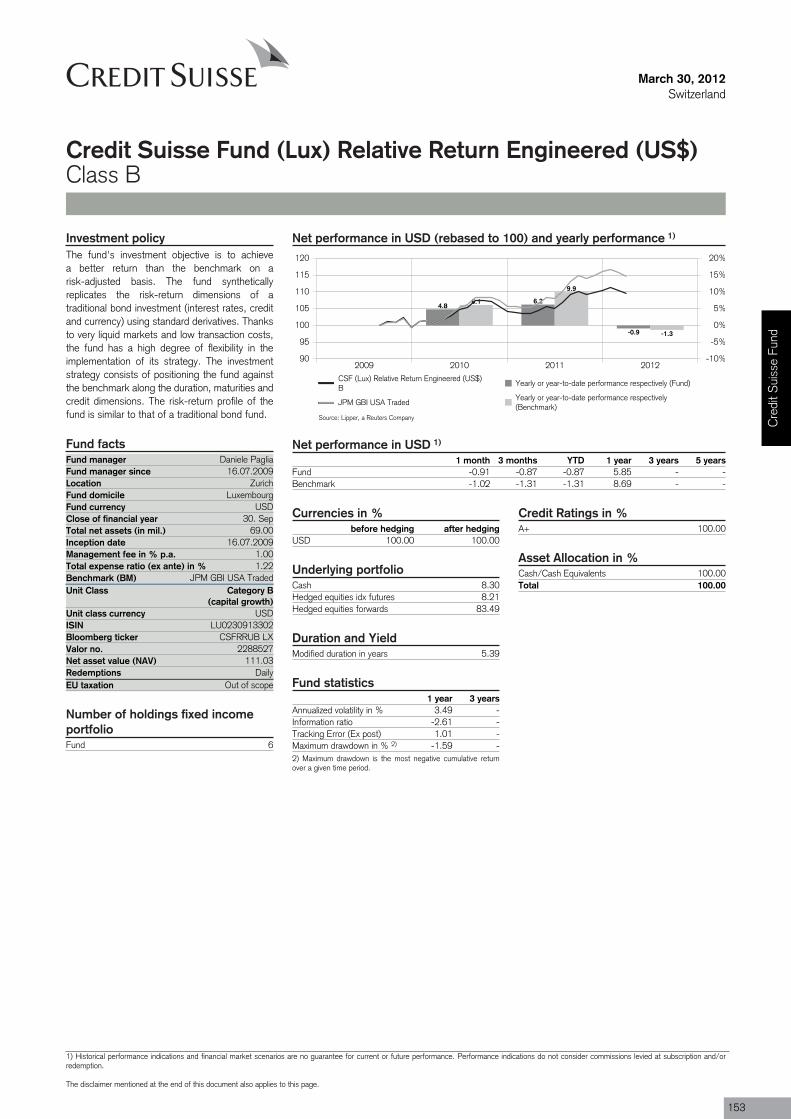
Fund manager Daniele PagliaFund manager since 16.07.2009Location ZurichFund domicile LuxembourgFund currency USDClose of financial year 30. SepTotal net assets (in mil.) 69.00Inception date 16.07.2009Management fee in % p.a. 1.00Total expense ratio (ex ante) in % 1.22Benchmark (BM) JPM GBI USA TradedUnit Class Category B
(capital growth)
ISIN LU0230913302
Valor no. 2288527
Redemptions DailyEU taxation Out of scope
Fund 6
March 30, 2012Switzerland
Credit Suisse Fund (Lux) Relative Return Engineered (US$)Class B
Net performance in USD (rebased to 100) and yearly performance 1)
2009 2010 2011 201290
95
100
105
110
115
120
-10%
-5%
0%
5%
10%
15%
20%
4.86.2
-0.9
6.1
9.9
-1.3
CSF (Lux) Relative Return Engineered (US$)B
Yearly or year-to-date performance respectively (Fund)
JPM GBI USA TradedYearly or year-to-date performance respectively(Benchmark)
Net performance in USD 1)
1 month 3 months YTD 1 year 3 years 5 yearsFund -0.91 -0.87 -0.87 5.85 - -Benchmark -1.02 -1.31 -1.31 8.69 - -
Currencies in %before hedging after hedging
USD 100.00 100.00
Credit Ratings in %A+ 100.00
Asset Allocation in %Cash/Cash Equivalents 100.00Total 100.00
Underlying portfolioCash 8.30Hedged equities idx futures 8.21Hedged equities forwards 83.49
Duration and YieldModified duration in years 5.39
Fund statistics1 year 3 years
Annualized volatility in % 3.49 -Information ratio -2.61 -Tracking Error (Ex post) 1.01 -Maximum drawdown in % 2) -1.59 -2) Maximum drawdown is the most negative cumulative returnover a given time period.
Investment policyThe fund's investment objective is to achievea better return than the benchmark on arisk-adjusted basis. The fund syntheticallyreplicates the risk-return dimensions of atraditional bond investment (interest rates, creditand currency) using standard derivatives. Thanksto very liquid markets and low transaction costs,the fund has a high degree of flexibility in theimplementation of its strategy. The investmentstrategy consists of positioning the fund againstthe benchmark along the duration, maturities andcredit dimensions. The risk-return profile of thefund is similar to that of a traditional bond fund.
Fund facts
Unit class currency USD
Bloomberg ticker CSFRRUB LX
Net asset value (NAV) 111.03
Number of holdings fixed incomeportfolio
Source: Lipper, a Reuters Company Cre
dit S
uiss
e Fu
nd
1) Historical performance indications and financial market scenarios are no guarantee for current or future performance. Performance indications do not consider commissions levied at subscription and/orredemption.
The disclaimer mentioned at the end of this document also applies to this page.
153

March 30, 2012Switzerland
Credit Suisse Fund (Lux) Relative Return Engineered (US$)Class B
Review previous quarter 3)
On On the wake of the second 3-year LTRO,Q1 has been very positive for risky assets. It wasthe best quarter for many equity markets since1998, even if the last couple of weeks showedsome weakness. Record mutual fund inflows intoa shrinking market also made Q1 the strongestquarter for European credit in at least a decade.The iTraxx Main CDS index tightened 47bps on
the quarter. Financials outperformed, with theiTraxx Senior Financial index tightening 58bps.
Peripheral government bond markets profitedfrom buying by domestic banks, with BTPsreturning 11.1% on the quarter. With +1.1%,Spain lagged the outperformance of theperiphery markets and is shaping up to become
the next European crisis hotspot. Coregovernment bonds were modestly negative inQ1. Treasuries and Gilts were down 1.3% and1.8%, while Bunds were around flat (+0.2%)on a total return basis. On the currency frontthe USD lost 2.9% against the EUR but gained7.2% against the JPY.
Outlook for the market 3)
The second 3-year long term refinancingoperation (LTRO) of the ECB acted like anadrenaline shock, tilting the markets back to arisk on modus. But cheap liquidity can onlysubmerge fundamental problems and lift all boatsfor a while, it is no cure for deeper solvency
problems. With central banks on hold for themoment and the effect of past liquidity shotssubsiding rapidly, markets could enter aconsolidation phase in Q2. Upcoming elections inFrance and Greece will add to overall uncertainty.Markets will remain volatile and continue trading
within wide ranges. After the sharp rally in Q1we would take some profits and reduce creditexposure, especially in financials. We are alsoturning more cautious on duration, with a slightlyshorter position than the benchmark.
Portfolio ManagementDaniele Paglia, Director, is a senior portfolio manager in the Fixed Income Total Return Strategy team. He is also responsible for fixedincome Swap products. Prior to joining CSAM in 2002, he spent three years as a quantitative fixed income analyst and portfolio managerat Zürcher Kantonalbank. Before that the worked for six years as a fixed income analyst at UBS in Zurich and London. He graduated fromthe University of Zurich (specialising in finance and operations research).
3) If not expressly indicated otherwise, all quantitative data contained in this comment is based on Lipper, Bloomberg or Datastream.
154
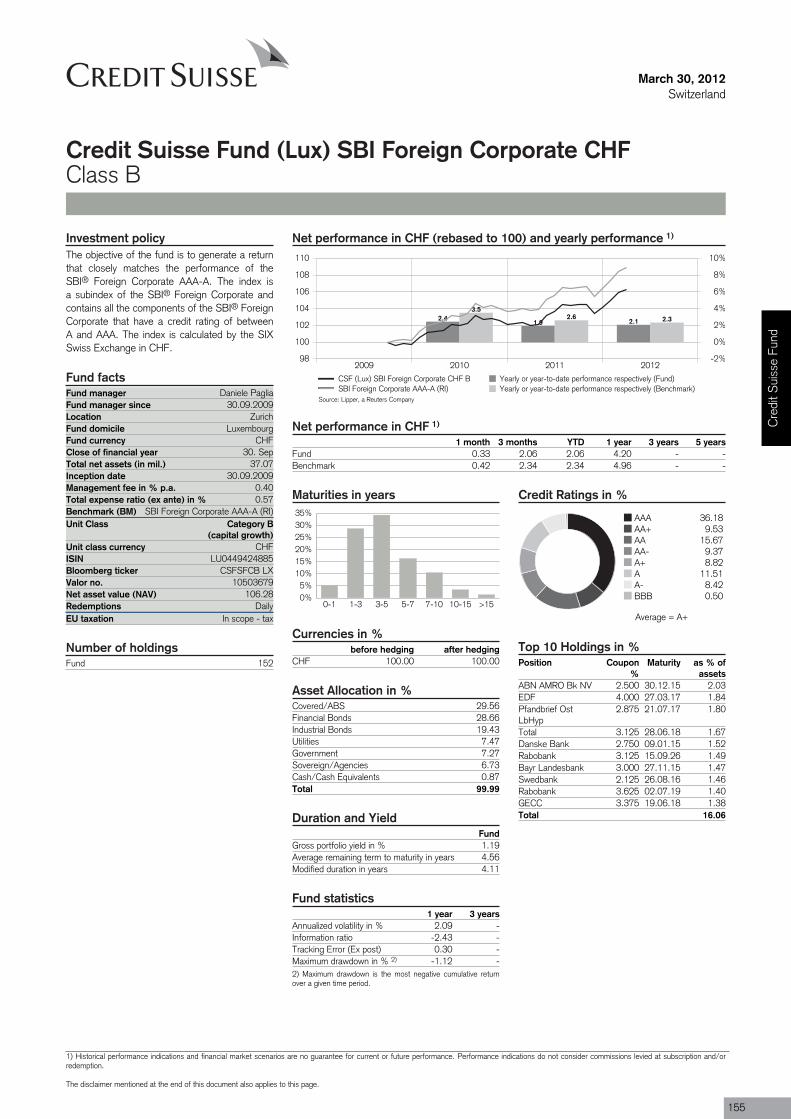
Fund manager Daniele PagliaFund manager since 30.09.2009Location ZurichFund domicile LuxembourgFund currency CHFClose of financial year 30. SepTotal net assets (in mil.) 37.07Inception date 30.09.2009Management fee in % p.a. 0.40Total expense ratio (ex ante) in % 0.57Benchmark (BM) SBI Foreign Corporate AAA-A (RI)Unit Class Category B
(capital growth)
ISIN LU0449424885
Valor no. 10503679
Redemptions DailyEU taxation In scope - tax
Fund 152
March 30, 2012Switzerland
Credit Suisse Fund (Lux) SBI Foreign Corporate CHFClass B
Net performance in CHF (rebased to 100) and yearly performance 1)
2009 2010 2011 201298
100
102
104
106
108
110
-2%
0%
2%
4%
6%
8%
10%
2.41.9 2.1
3.52.6 2.3
CSF (Lux) SBI Foreign Corporate CHF B Yearly or year-to-date performance respectively (Fund)SBI Foreign Corporate AAA-A (RI) Yearly or year-to-date performance respectively (Benchmark)
Net performance in CHF 1)
1 month 3 months YTD 1 year 3 years 5 yearsFund 0.33 2.06 2.06 4.20 - -Benchmark 0.42 2.34 2.34 4.96 - -
Maturities in years
0%5%
10%15%20%25%30%35%
0-1 1-3 3-5 5-7 7-10 10-15 >15
Currencies in %before hedging after hedging
CHF 100.00 100.00
Asset Allocation in %Covered/ABS 29.56Financial Bonds 28.66Industrial Bonds 19.43Utilities 7.47Government 7.27Sovereign/Agencies 6.73Cash/Cash Equivalents 0.87Total 99.99
Duration and YieldFund
Gross portfolio yield in % 1.19Average remaining term to maturity in years 4.56Modified duration in years 4.11
Fund statistics1 year 3 years
Annualized volatility in % 2.09 -Information ratio -2.43 -Tracking Error (Ex post) 0.30 -Maximum drawdown in % 2) -1.12 -2) Maximum drawdown is the most negative cumulative returnover a given time period.
Credit Ratings in %
AAA 36.18AA+ 9.53AA 15.67AA- 9.37A+ 8.82A 11.51A- 8.42BBB 0.50
Top 10 Holdings in %Position Coupon
%Maturity as % of
assetsABN AMRO Bk NV 2.500 30.12.15 2.03EDF 4.000 27.03.17 1.84Pfandbrief OstLbHyp
2.875 21.07.17 1.80
Total 3.125 28.06.18 1.67Danske Bank 2.750 09.01.15 1.52Rabobank 3.125 15.09.26 1.49Bayr Landesbank 3.000 27.11.15 1.47Swedbank 2.125 26.08.16 1.46Rabobank 3.625 02.07.19 1.40GECC 3.375 19.06.18 1.38Total 16.06
Investment policyThe objective of the fund is to generate a returnthat closely matches the performance of theSBI® Foreign Corporate AAA-A. The index isa subindex of the SBI® Foreign Corporate andcontains all the components of the SBI® ForeignCorporate that have a credit rating of betweenA and AAA. The index is calculated by the SIXSwiss Exchange in CHF.
Fund facts
Unit class currency CHF
Bloomberg ticker CSFSFCB LX
Net asset value (NAV) 106.28
Number of holdings
Source: Lipper, a Reuters Company
Average = A+
Cre
dit S
uiss
e Fu
nd
1) Historical performance indications and financial market scenarios are no guarantee for current or future performance. Performance indications do not consider commissions levied at subscription and/orredemption.
The disclaimer mentioned at the end of this document also applies to this page.
155
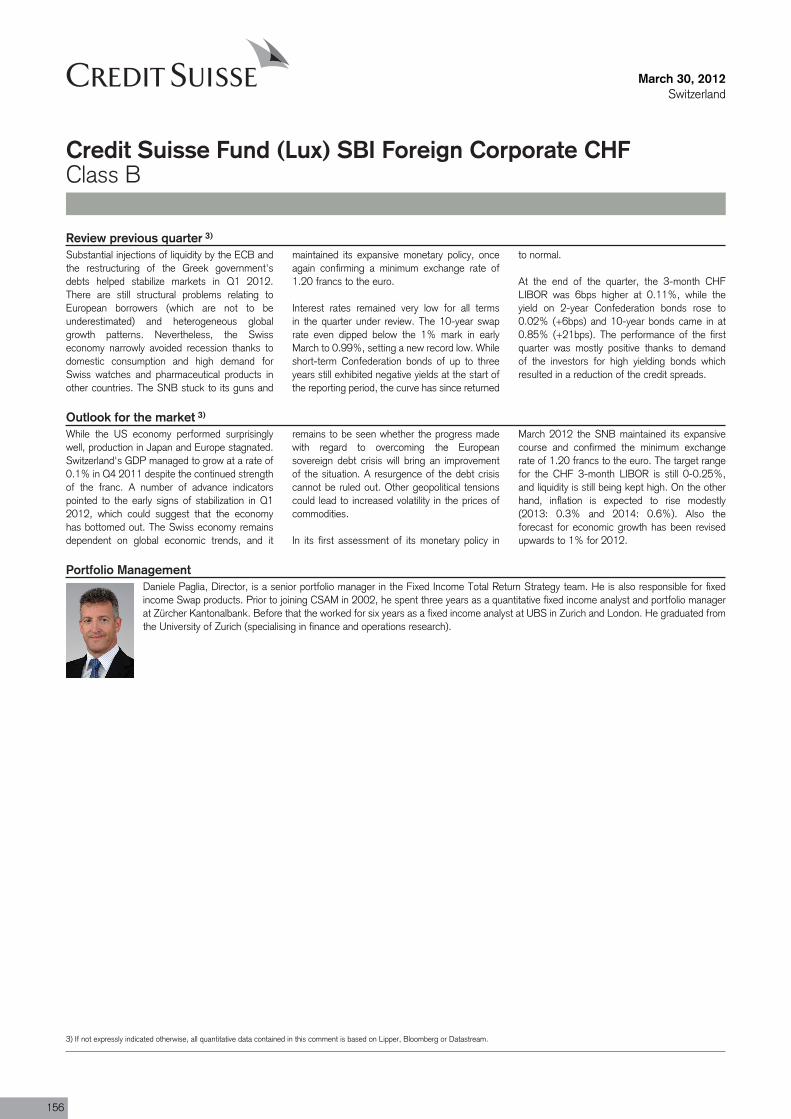
March 30, 2012Switzerland
Credit Suisse Fund (Lux) SBI Foreign Corporate CHFClass B
Review previous quarter 3)
Substantial injections of liquidity by the ECB andthe restructuring of the Greek government'sdebts helped stabilize markets in Q1 2012.There are still structural problems relating toEuropean borrowers (which are not to beunderestimated) and heterogeneous globalgrowth patterns. Nevertheless, the Swisseconomy narrowly avoided recession thanks todomestic consumption and high demand forSwiss watches and pharmaceutical products inother countries. The SNB stuck to its guns and
maintained its expansive monetary policy, onceagain confirming a minimum exchange rate of1.20 francs to the euro.
Interest rates remained very low for all termsin the quarter under review. The 10-year swaprate even dipped below the 1% mark in earlyMarch to 0.99%, setting a new record low. Whileshort-term Confederation bonds of up to threeyears still exhibited negative yields at the start ofthe reporting period, the curve has since returned
to normal.
At the end of the quarter, the 3-month CHFLIBOR was 6bps higher at 0.11%, while theyield on 2-year Confederation bonds rose to0.02% (+6bps) and 10-year bonds came in at0.85% (+21bps). The performance of the firstquarter was mostly positive thanks to demandof the investors for high yielding bonds whichresulted in a reduction of the credit spreads.
Outlook for the market 3)
While the US economy performed surprisinglywell, production in Japan and Europe stagnated.Switzerland's GDP managed to grow at a rate of0.1% in Q4 2011 despite the continued strengthof the franc. A number of advance indicatorspointed to the early signs of stabilization in Q12012, which could suggest that the economyhas bottomed out. The Swiss economy remainsdependent on global economic trends, and it
remains to be seen whether the progress madewith regard to overcoming the Europeansovereign debt crisis will bring an improvementof the situation. A resurgence of the debt crisiscannot be ruled out. Other geopolitical tensionscould lead to increased volatility in the prices ofcommodities.
In its first assessment of its monetary policy in
March 2012 the SNB maintained its expansivecourse and confirmed the minimum exchangerate of 1.20 francs to the euro. The target rangefor the CHF 3-month LIBOR is still 0-0.25%,and liquidity is still being kept high. On the otherhand, inflation is expected to rise modestly(2013: 0.3% and 2014: 0.6%). Also theforecast for economic growth has been revisedupwards to 1% for 2012.
Portfolio ManagementDaniele Paglia, Director, is a senior portfolio manager in the Fixed Income Total Return Strategy team. He is also responsible for fixedincome Swap products. Prior to joining CSAM in 2002, he spent three years as a quantitative fixed income analyst and portfolio managerat Zürcher Kantonalbank. Before that the worked for six years as a fixed income analyst at UBS in Zurich and London. He graduated fromthe University of Zurich (specialising in finance and operations research).
3) If not expressly indicated otherwise, all quantitative data contained in this comment is based on Lipper, Bloomberg or Datastream.
156
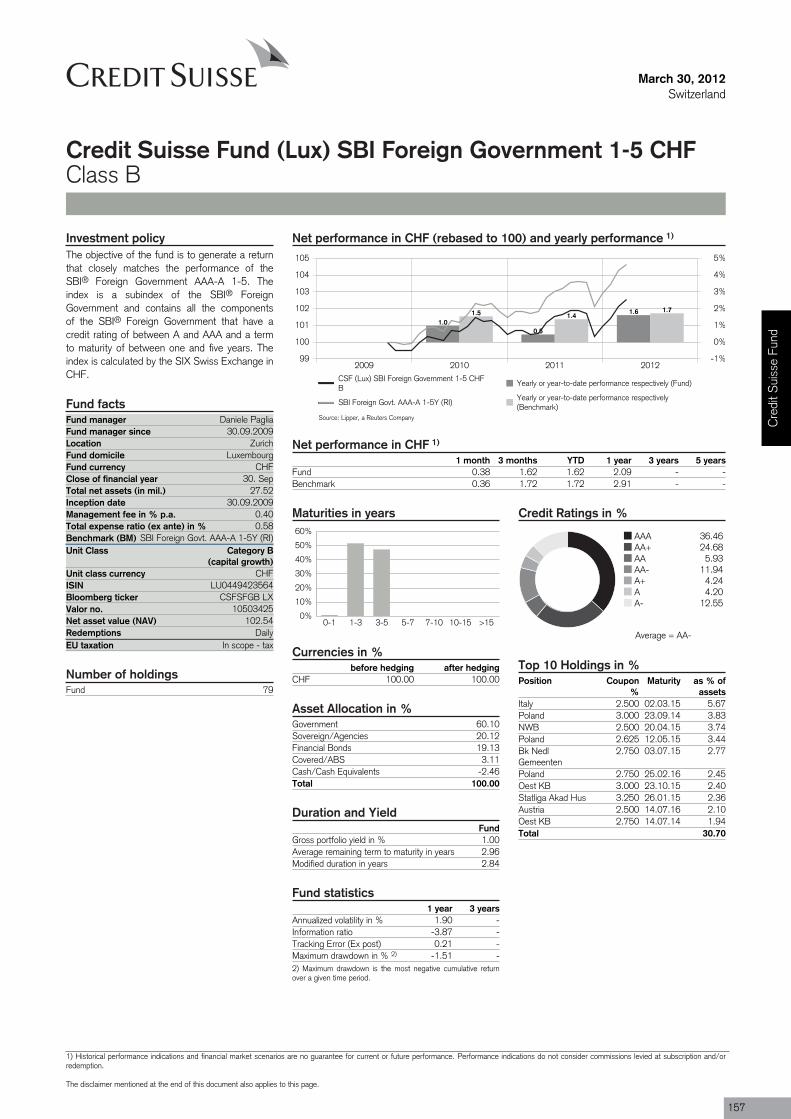
Fund manager Daniele PagliaFund manager since 30.09.2009Location ZurichFund domicile LuxembourgFund currency CHFClose of financial year 30. SepTotal net assets (in mil.) 27.52Inception date 30.09.2009Management fee in % p.a. 0.40Total expense ratio (ex ante) in % 0.58Benchmark (BM) SBI Foreign Govt. AAA-A 1-5Y (RI)Unit Class Category B
(capital growth)
ISIN LU0449423564
Valor no. 10503425
Redemptions DailyEU taxation In scope - tax
Fund 79
March 30, 2012Switzerland
Credit Suisse Fund (Lux) SBI Foreign Government 1-5 CHFClass B
Net performance in CHF (rebased to 100) and yearly performance 1)
2009 2010 2011 201299
100
101
102
103
104
105
-1%
0%
1%
2%
3%
4%
5%
1.00.5
1.61.5 1.41.7
CSF (Lux) SBI Foreign Government 1-5 CHFB
Yearly or year-to-date performance respectively (Fund)
SBI Foreign Govt. AAA-A 1-5Y (RI)Yearly or year-to-date performance respectively(Benchmark)
Net performance in CHF 1)
1 month 3 months YTD 1 year 3 years 5 yearsFund 0.38 1.62 1.62 2.09 - -Benchmark 0.36 1.72 1.72 2.91 - -
Maturities in years
0%
10%
20%
30%
40%
50%
60%
0-1 1-3 3-5 5-7 7-10 10-15 >15
Currencies in %before hedging after hedging
CHF 100.00 100.00
Asset Allocation in %Government 60.10Sovereign/Agencies 20.12Financial Bonds 19.13Covered/ABS 3.11Cash/Cash Equivalents -2.46Total 100.00
Duration and YieldFund
Gross portfolio yield in % 1.00Average remaining term to maturity in years 2.96Modified duration in years 2.84
Fund statistics1 year 3 years
Annualized volatility in % 1.90 -Information ratio -3.87 -Tracking Error (Ex post) 0.21 -Maximum drawdown in % 2) -1.51 -2) Maximum drawdown is the most negative cumulative returnover a given time period.
Credit Ratings in %
AAA 36.46AA+ 24.68AA 5.93AA- 11.94A+ 4.24A 4.20A- 12.55
Top 10 Holdings in %Position Coupon
%Maturity as % of
assetsItaly 2.500 02.03.15 5.67Poland 3.000 23.09.14 3.83NWB 2.500 20.04.15 3.74Poland 2.625 12.05.15 3.44Bk NedlGemeenten
2.750 03.07.15 2.77
Poland 2.750 25.02.16 2.45Oest KB 3.000 23.10.15 2.40Statliga Akad Hus 3.250 26.01.15 2.36Austria 2.500 14.07.16 2.10Oest KB 2.750 14.07.14 1.94Total 30.70
Investment policyThe objective of the fund is to generate a returnthat closely matches the performance of theSBI® Foreign Government AAA-A 1-5. Theindex is a subindex of the SBI® ForeignGovernment and contains all the componentsof the SBI® Foreign Government that have acredit rating of between A and AAA and a termto maturity of between one and five years. Theindex is calculated by the SIX Swiss Exchange inCHF.
Fund facts
Unit class currency CHF
Bloomberg ticker CSFSFGB LX
Net asset value (NAV) 102.54
Number of holdings
Source: Lipper, a Reuters Company
Average = AA-
Cre
dit S
uiss
e Fu
nd
1) Historical performance indications and financial market scenarios are no guarantee for current or future performance. Performance indications do not consider commissions levied at subscription and/orredemption.
The disclaimer mentioned at the end of this document also applies to this page.
157

March 30, 2012Switzerland
Credit Suisse Fund (Lux) SBI Foreign Government 1-5 CHFClass B
Review previous quarter 3)
Substantial injections of liquidity by the ECB andthe restructuring of the Greek government'sdebts helped stabilize markets in Q1 2012.There are still structural problems relating toEuropean borrowers (which are not to beunderestimated) and heterogeneous globalgrowth patterns. Nevertheless, the Swisseconomy narrowly avoided recession thanks todomestic consumption and high demand forSwiss watches and pharmaceutical products inother countries. The SNB stuck to its guns and
maintained its expansive monetary policy, onceagain confirming a minimum exchange rate of1.20 francs to the euro.
Interest rates remained very low for all termsin the quarter under review. The 10-year swaprate even dipped below the 1% mark in earlyMarch to 0.99%, setting a new record low. Whileshort-term Confederation bonds of up to threeyears still exhibited negative yields at the start ofthe reporting period, the curve has since returned
to normal.
At the end of the quarter, the 3-month CHFLIBOR was 6bps higher at 0.11%, while theyield on 2-year Confederation bonds rose to0.02% (+6bps) and 10-year bonds came in at0.85% (+21bps). The performance of the firstquarter was mostly positive thanks to demandof the investors for high yielding bonds whichresulted in a reduction of the credit spreads.
Outlook for the market 3)
While the US economy performed surprisinglywell, production in Japan and Europe stagnated.Switzerland's GDP managed to grow at a rate of0.1% in Q4 2011 despite the continued strengthof the franc. A number of advance indicatorspointed to the early signs of stabilization in Q12012, which could suggest that the economyhas bottomed out. The Swiss economy remainsdependent on global economic trends, and it
remains to be seen whether the progress madewith regard to overcoming the Europeansovereign debt crisis will bring an improvementof the situation. A resurgence of the debt crisiscannot be ruled out. Other geopolitical tensionscould lead to increased volatility in the prices ofcommodities.
In its first assessment of its monetary policy in
March 2012 the SNB maintained its expansivecourse and confirmed the minimum exchangerate of 1.20 francs to the euro. The target rangefor the CHF 3-month LIBOR is still 0-0.25%,and liquidity is still being kept high. On the otherhand, inflation is expected to rise modestly(2013: 0.3% and 2014: 0.6%). Also theforecast for economic growth has been revisedupwards to 1% for 2012.
Portfolio ManagementDaniele Paglia, Director, is a senior portfolio manager in the Fixed Income Total Return Strategy team. He is also responsible for fixedincome Swap products. Prior to joining CSAM in 2002, he spent three years as a quantitative fixed income analyst and portfolio managerat Zürcher Kantonalbank. Before that the worked for six years as a fixed income analyst at UBS in Zurich and London. He graduated fromthe University of Zurich (specialising in finance and operations research).
3) If not expressly indicated otherwise, all quantitative data contained in this comment is based on Lipper, Bloomberg or Datastream.
158
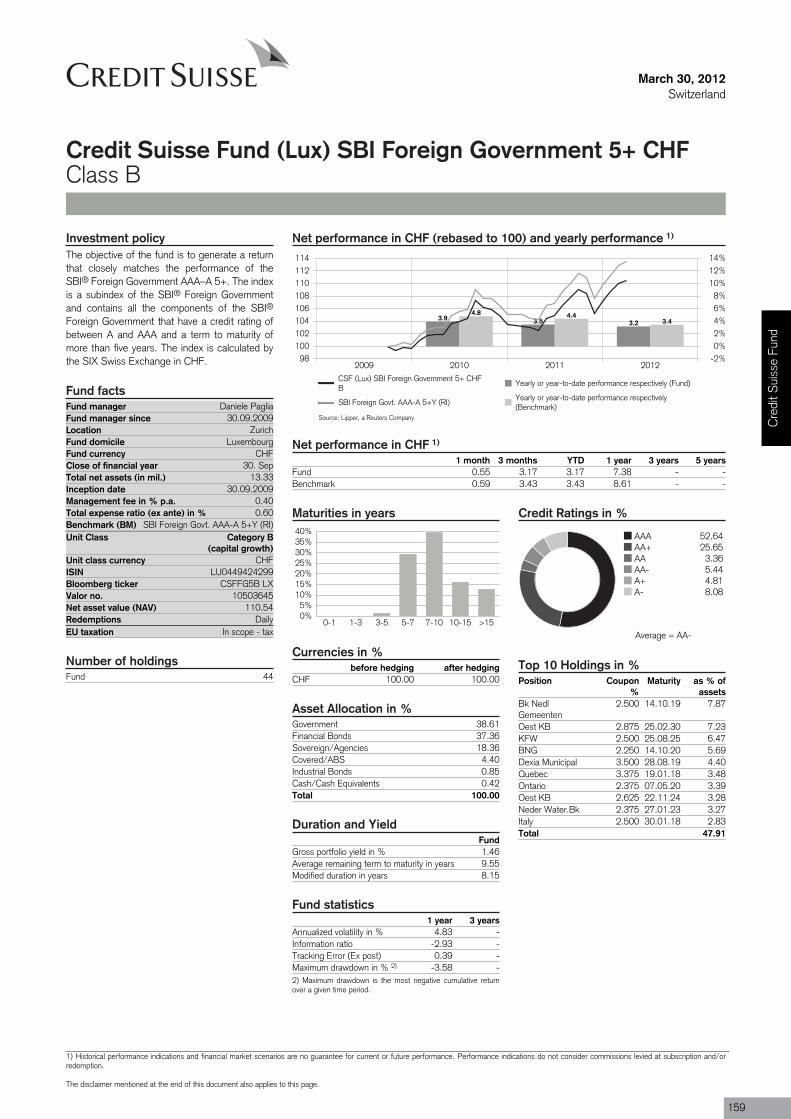
Fund manager Daniele PagliaFund manager since 30.09.2009Location ZurichFund domicile LuxembourgFund currency CHFClose of financial year 30. SepTotal net assets (in mil.) 13.33Inception date 30.09.2009Management fee in % p.a. 0.40Total expense ratio (ex ante) in % 0.60Benchmark (BM) SBI Foreign Govt. AAA-A 5+Y (RI)Unit Class Category B
(capital growth)
ISIN LU0449424299
Valor no. 10503645
Redemptions DailyEU taxation In scope - tax
Fund 44
March 30, 2012Switzerland
Credit Suisse Fund (Lux) SBI Foreign Government 5+ CHFClass B
Net performance in CHF (rebased to 100) and yearly performance 1)
2009 2010 2011 201298
100102104106108110112114
-2%0%2%4%6%8%
10%12%14%
3.9 3.5 3.2
4.8 4.43.4
CSF (Lux) SBI Foreign Government 5+ CHFB
Yearly or year-to-date performance respectively (Fund)
SBI Foreign Govt. AAA-A 5+Y (RI)Yearly or year-to-date performance respectively(Benchmark)
Net performance in CHF 1)
1 month 3 months YTD 1 year 3 years 5 yearsFund 0.55 3.17 3.17 7.38 - -Benchmark 0.59 3.43 3.43 8.61 - -
Maturities in years
0%5%
10%15%20%25%30%35%40%
0-1 1-3 3-5 5-7 7-10 10-15 >15
Currencies in %before hedging after hedging
CHF 100.00 100.00
Asset Allocation in %Government 38.61Financial Bonds 37.36Sovereign/Agencies 18.36Covered/ABS 4.40Industrial Bonds 0.85Cash/Cash Equivalents 0.42Total 100.00
Duration and YieldFund
Gross portfolio yield in % 1.46Average remaining term to maturity in years 9.55Modified duration in years 8.15
Fund statistics1 year 3 years
Annualized volatility in % 4.83 -Information ratio -2.93 -Tracking Error (Ex post) 0.39 -Maximum drawdown in % 2) -3.58 -2) Maximum drawdown is the most negative cumulative returnover a given time period.
Credit Ratings in %
AAA 52.64AA+ 25.65AA 3.36AA- 5.44A+ 4.81A- 8.08
Top 10 Holdings in %Position Coupon
%Maturity as % of
assetsBk NedlGemeenten
2.500 14.10.19 7.87
Oest KB 2.875 25.02.30 7.23KFW 2.500 25.08.25 6.47BNG 2.250 14.10.20 5.69Dexia Municipal 3.500 28.08.19 4.40Quebec 3.375 19.01.18 3.48Ontario 2.375 07.05.20 3.39Oest KB 2.625 22.11.24 3.28Neder Water.Bk 2.375 27.01.23 3.27Italy 2.500 30.01.18 2.83Total 47.91
Investment policyThe objective of the fund is to generate a returnthat closely matches the performance of theSBI® Foreign Government AAA–A 5+. The indexis a subindex of the SBI® Foreign Governmentand contains all the components of the SBI®Foreign Government that have a credit rating ofbetween A and AAA and a term to maturity ofmore than five years. The index is calculated bythe SIX Swiss Exchange in CHF.
Fund facts
Unit class currency CHF
Bloomberg ticker CSFFG5B LX
Net asset value (NAV) 110.54
Number of holdings
Source: Lipper, a Reuters Company
Average = AA-
Cre
dit S
uiss
e Fu
nd
1) Historical performance indications and financial market scenarios are no guarantee for current or future performance. Performance indications do not consider commissions levied at subscription and/orredemption.
The disclaimer mentioned at the end of this document also applies to this page.
159
March 30, 2012Switzerland
Credit Suisse Fund (Lux) SBI Foreign Government 5+ CHFClass B
Review previous quarter 3)
Substantial injections of liquidity by the ECB andthe restructuring of the Greek government'sdebts helped stabilize markets in Q1 2012.There are still structural problems relating toEuropean borrowers (which are not to beunderestimated) and heterogeneous globalgrowth patterns. Nevertheless, the Swisseconomy narrowly avoided recession thanks todomestic consumption and high demand forSwiss watches and pharmaceutical products inother countries. The SNB stuck to its guns and
maintained its expansive monetary policy, onceagain confirming a minimum exchange rate of1.20 francs to the euro.
Interest rates remained very low for all termsin the quarter under review. The 10-year swaprate even dipped below the 1% mark in earlyMarch to 0.99%, setting a new record low. Whileshort-term Confederation bonds of up to threeyears still exhibited negative yields at the start ofthe reporting period, the curve has since returned
to normal.
At the end of the quarter, the 3-month CHFLIBOR was 6bps higher at 0.11%, while theyield on 2-year Confederation bonds rose to0.02% (+6bps) and 10-year bonds came in at0.85% (+21bps). The performance of the firstquarter was mostly positive thanks to demandof the investors for high yielding bonds whichresulted in a reduction of the credit spreads.
Outlook for the market 3)
While the US economy performed surprisinglywell, production in Japan and Europe stagnated.Switzerland's GDP managed to grow at a rate of0.1% in Q4 2011 despite the continued strengthof the franc. A number of advance indicatorspointed to the early signs of stabilization in Q12012, which could suggest that the economyhas bottomed out. The Swiss economy remainsdependent on global economic trends, and it
remains to be seen whether the progress madewith regard to overcoming the Europeansovereign debt crisis will bring an improvementof the situation. A resurgence of the debt crisiscannot be ruled out. Other geopolitical tensionscould lead to increased volatility in the prices ofcommodities.
In its first assessment of its monetary policy in
March 2012 the SNB maintained its expansivecourse and confirmed the minimum exchangerate of 1.20 francs to the euro. The target rangefor the CHF 3-month LIBOR is still 0-0.25%,and liquidity is still being kept high. On the otherhand, inflation is expected to rise modestly(2013: 0.3% and 2014: 0.6%). Also theforecast for economic growth has been revisedupwards to 1% for 2012.
Portfolio ManagementDaniele Paglia, Director, is a senior portfolio manager in the Fixed Income Total Return Strategy team. He is also responsible for fixedincome Swap products. Prior to joining CSAM in 2002, he spent three years as a quantitative fixed income analyst and portfolio managerat Zürcher Kantonalbank. Before that the worked for six years as a fixed income analyst at UBS in Zurich and London. He graduated fromthe University of Zurich (specialising in finance and operations research).
3) If not expressly indicated otherwise, all quantitative data contained in this comment is based on Lipper, Bloomberg or Datastream.
160
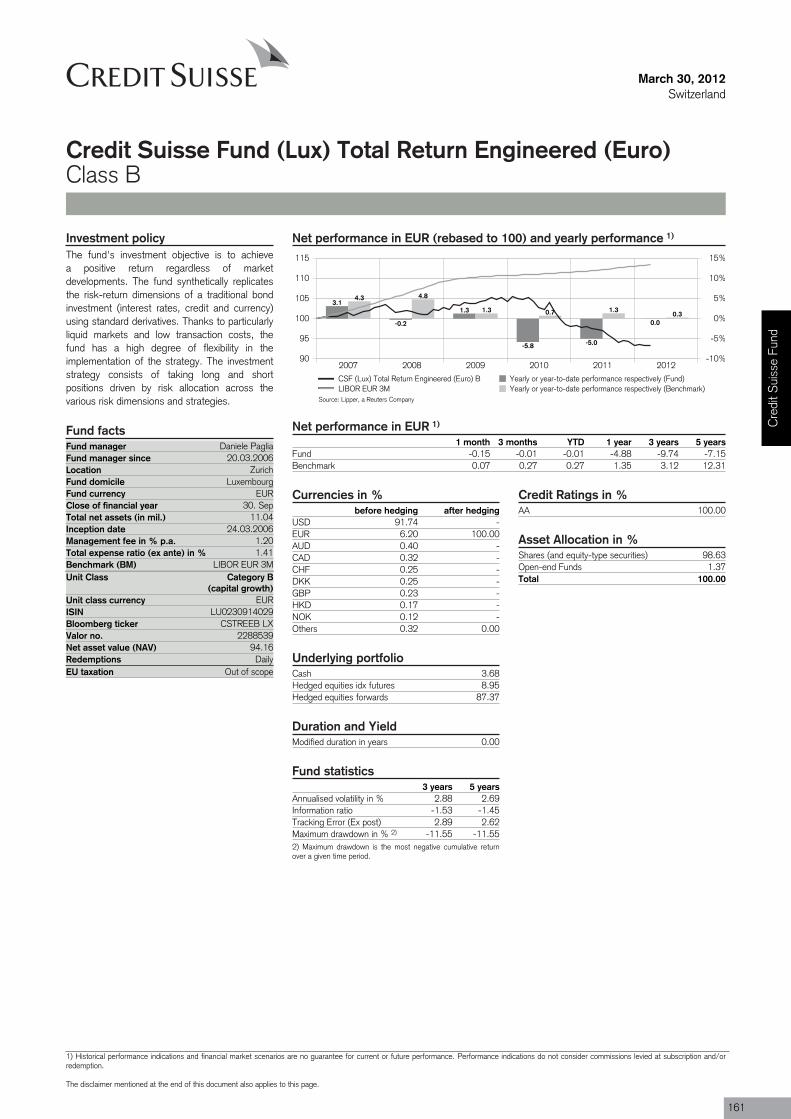
Fund manager Daniele PagliaFund manager since 20.03.2006Location ZurichFund domicile LuxembourgFund currency EURClose of financial year 30. SepTotal net assets (in mil.) 11.04Inception date 24.03.2006Management fee in % p.a. 1.20Total expense ratio (ex ante) in % 1.41Benchmark (BM) LIBOR EUR 3MUnit Class Category B
(capital growth)
ISIN LU0230914029
Valor no. 2288539
Redemptions DailyEU taxation Out of scope
March 30, 2012Switzerland
Credit Suisse Fund (Lux) Total Return Engineered (Euro)Class B
Net performance in EUR (rebased to 100) and yearly performance 1)
2007 2008 2009 2010 2011 201290
95
100
105
110
115
-10%
-5%
0%
5%
10%
15%
3.1
-0.2
1.3
-5.8 -5.0
0.0
4.3 4.8
1.3 0.7 1.30.3
CSF (Lux) Total Return Engineered (Euro) B Yearly or year-to-date performance respectively (Fund)LIBOR EUR 3M Yearly or year-to-date performance respectively (Benchmark)
Net performance in EUR 1)
1 month 3 months YTD 1 year 3 years 5 yearsFund -0.15 -0.01 -0.01 -4.88 -9.74 -7.15Benchmark 0.07 0.27 0.27 1.35 3.12 12.31
Currencies in %before hedging after hedging
USD 91.74 -EUR 6.20 100.00AUD 0.40 -CAD 0.32 -CHF 0.25 -DKK 0.25 -GBP 0.23 -HKD 0.17 -NOK 0.12 -Others 0.32 0.00
Credit Ratings in %AA 100.00
Asset Allocation in %Shares (and equity-type securities) 98.63Open-end Funds 1.37Total 100.00
Underlying portfolioCash 3.68Hedged equities idx futures 8.95Hedged equities forwards 87.37
Duration and YieldModified duration in years 0.00
Fund statistics3 years 5 years
Annualised volatility in % 2.88 2.69Information ratio -1.53 -1.45Tracking Error (Ex post) 2.89 2.62Maximum drawdown in % 2) -11.55 -11.552) Maximum drawdown is the most negative cumulative returnover a given time period.
Investment policyThe fund's investment objective is to achievea positive return regardless of marketdevelopments. The fund synthetically replicatesthe risk-return dimensions of a traditional bondinvestment (interest rates, credit and currency)using standard derivatives. Thanks to particularlyliquid markets and low transaction costs, thefund has a high degree of flexibility in theimplementation of the strategy. The investmentstrategy consists of taking long and shortpositions driven by risk allocation across thevarious risk dimensions and strategies.
Fund facts
Unit class currency EUR
Bloomberg ticker CSTREEB LX
Net asset value (NAV) 94.16
Source: Lipper, a Reuters Company
Cre
dit S
uiss
e Fu
nd
1) Historical performance indications and financial market scenarios are no guarantee for current or future performance. Performance indications do not consider commissions levied at subscription and/orredemption.
The disclaimer mentioned at the end of this document also applies to this page.
161
March 30, 2012Switzerland
Credit Suisse Fund (Lux) Total Return Engineered (Euro)Class B
Review previous quarter 3)
On the wake of the second 3-year LTRO, Q1has been very positive for risky assets. It wasthe best quarter for many equity markets since1998, even if the last couple of weeks showedsome weakness. Record mutual fund inflows intoa shrinking market also made Q1 the strongestquarter for European credit in at least a decade.The iTraxx Main CDS index tightened 47bps on
the quarter. Financials outperformed, with theiTraxx Senior Financial index tightening 58bps.
Peripheral government bond markets profitedfrom buying by domestic banks, with BTPsreturning 11.1% on the quarter. With +1.1%,Spain lagged the outperformance of theperiphery markets and is shaping up to become
the next European crisis hotspot. Coregovernment bonds were modestly negative inQ1. Treasuries and Gilts were down 1.3% and1.8%, while Bunds were around flat (+0.2%)on a total return basis. On the currency frontthe USD lost 2.9% against the EUR but gained7.2% against the JPY.
Outlook for the market 3)
The second 3-year long term refinancingoperation (LTRO) of the ECB acted like anadrenaline shock, tilting the markets back to arisk on modus. But cheap liquidity can onlysubmerge fundamental problems and lift all boatsfor a while, it is no cure for deeper solvencyproblems. With central banks on hold for themoment and the effect of past liquidity shots
subsiding rapidly, markets could enter aconsolidation phase in Q2. Upcoming elections inFrance and Greece will add to overall uncertainty.Markets will remain volatile and continue tradingwithin wide ranges. After the sharp rally in Q1we would take some profits and reduce creditexposure, especially in financials. We are alsoturning more cautious on duration, with a slightly
shorter position than the benchmark.
From Q2 2012 the fund will invest 100% ofits assets in the portable alpha strategy. Thisstrategy is also used in small proportions (upto 10%) for return enhancement in the RelativeReturn Engineered funds.
Portfolio ManagementDaniele Paglia, Director, is a senior portfolio manager in the Fixed Income Total Return Strategy team. He is also responsible for fixedincome Swap products. Prior to joining CSAM in 2002, he spent three years as a quantitative fixed income analyst and portfolio managerat Zürcher Kantonalbank. Before that the worked for six years as a fixed income analyst at UBS in Zurich and London. He graduated fromthe University of Zurich (specialising in finance and operations research).
3) If not expressly indicated otherwise, all quantitative data contained in this comment is based on Lipper, Bloomberg or Datastream.
162
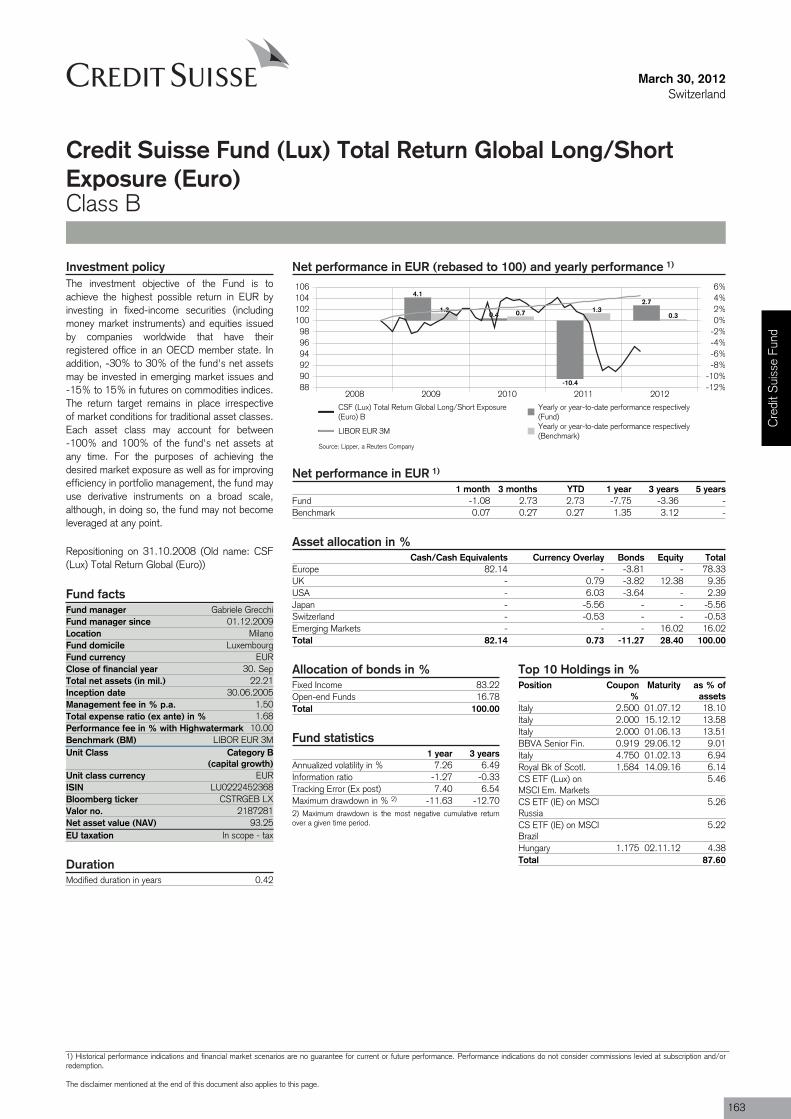
Fund manager Gabriele GrecchiFund manager since 01.12.2009Location MilanoFund domicile LuxembourgFund currency EURClose of financial year 30. SepTotal net assets (in mil.) 22.21Inception date 30.06.2005Management fee in % p.a. 1.50Total expense ratio (ex ante) in % 1.68Performance fee in % with Highwatermark 10.00Benchmark (BM) LIBOR EUR 3MUnit Class Category B
(capital growth)
ISIN LU0222452368
Valor no. 2187281
EU taxation In scope - tax
March 30, 2012Switzerland
Credit Suisse Fund (Lux) Total Return Global Long/ShortExposure (Euro)Class B
Net performance in EUR (rebased to 100) and yearly performance 1)
2008 2009 2010 2011 2012889092949698
100102104106
-12%-10%-8%-6%-4%-2%0%2%4%6%
4.1
0.4
-10.4
2.71.3 0.7 1.3
0.3
CSF (Lux) Total Return Global Long/Short Exposure(Euro) B
Yearly or year-to-date performance respectively(Fund)
LIBOR EUR 3MYearly or year-to-date performance respectively(Benchmark)
Net performance in EUR 1)
1 month 3 months YTD 1 year 3 years 5 yearsFund -1.08 2.73 2.73 -7.75 -3.36 -Benchmark 0.07 0.27 0.27 1.35 3.12 -
Asset allocation in %Cash/Cash Equivalents Currency Overlay Bonds Equity Total
Europe 82.14 - -3.81 - 78.33UK - 0.79 -3.82 12.38 9.35USA - 6.03 -3.64 - 2.39Japan - -5.56 - - -5.56Switzerland - -0.53 - - -0.53Emerging Markets - - - 16.02 16.02Total 82.14 0.73 -11.27 28.40 100.00
Investment policyThe investment objective of the Fund is toachieve the highest possible return in EUR byinvesting in fixed-income securities (includingmoney market instruments) and equities issuedby companies worldwide that have theirregistered office in an OECD member state. Inaddition, -30% to 30% of the fund's net assetsmay be invested in emerging market issues and-15% to 15% in futures on commodities indices.The return target remains in place irrespectiveof market conditions for traditional asset classes.Each asset class may account for between-100% and 100% of the fund's net assets atany time. For the purposes of achieving thedesired market exposure as well as for improvingefficiency in portfolio management, the fund mayuse derivative instruments on a broad scale,although, in doing so, the fund may not becomeleveraged at any point.
Repositioning on 31.10.2008 (Old name: CSF(Lux) Total Return Global (Euro))
Fund facts
Unit class currency EUR
Bloomberg ticker CSTRGEB LX
Net asset value (NAV) 93.25
DurationModified duration in years 0.42
Allocation of bonds in %Fixed Income 83.22Open-end Funds 16.78Total 100.00
Fund statistics1 year 3 years
Annualized volatility in % 7.26 6.49Information ratio -1.27 -0.33Tracking Error (Ex post) 7.40 6.54Maximum drawdown in % 2) -11.63 -12.702) Maximum drawdown is the most negative cumulative returnover a given time period.
Top 10 Holdings in %Position Coupon
%Maturity as % of
assetsItaly 2.500 01.07.12 18.10Italy 2.000 15.12.12 13.58Italy 2.000 01.06.13 13.51BBVA Senior Fin. 0.919 29.06.12 9.01Italy 4.750 01.02.13 6.94Royal Bk of Scotl. 1.584 14.09.16 6.14CS ETF (Lux) onMSCI Em. Markets
5.46
CS ETF (IE) on MSCIRussia
5.26
CS ETF (IE) on MSCIBrazil
5.22
Hungary 1.175 02.11.12 4.38Total 87.60
Source: Lipper, a Reuters Company
Cre
dit S
uiss
e Fu
nd
1) Historical performance indications and financial market scenarios are no guarantee for current or future performance. Performance indications do not consider commissions levied at subscription and/orredemption.
The disclaimer mentioned at the end of this document also applies to this page.
163
March 30, 2012Switzerland
Credit Suisse Fund (Lux) Total Return Global Long/ShortExposure (Euro)Class B
Review previous quarter 3)
World stock markets rocketed higher, especiallyin the first two months of the New Year, andare now up 35%–40% on average from their lowpoints hit in August 2011. Despite a short-termslowdown in economic activity, business-cycledata from the core regions reinforce our theorythat the macroeconomic situation is sustainablycontinuing to improve. This, coupled with
subsiding eurozone woes, abatingbanking-system troubles, the continued excellentshape of the corporate sector and thecentral-bank liquidity injections, led by the ECB,creates a substantially improved overall climate.
At the moment, however, the chances of furtherupside surprises have become more difficult.
Moreover, the market has already priced in someof these pleasing developments. Furthermore,the unpredictable situation in the Middle Eastand the substantial increase in the price of oilconstitute risk factors that shouldn’t beunderestimated. Greece remains an issue, asdo Portugal and Spain, even after the debtrestructuring deal.
Outlook for the market 3)
In anticipation of laterally consolidating ormoderately correcting stock markets, we decideda few weeks ago to take profits temporarily andto position ourselves neutrally as we await abetter entry opportunity. However, the macroand corporate fundamentals coupled with thevaluation component and the mountingperformance pressure on many investors whoare still positioned in cash continue to reinforceour confidence that we will see another up move
in stocks in the months ahead regardless of anynear-term corrections.
From a regional perspective, we believe thatsuperior growth and very sound corporate dataare the reason behind the significantoutperformance posted by the US markets.Hence, in the future we are leaning toward morecyclical and laggard markets such as theemerging economies (cyclicality and structural
advantages) and parts of Europe (catch-uppotential and valuation component).
Our positioning in the fixed-income sectorremains unchanged. In spite of the recent uptick,we consider the current yield levels in thetraditional bond markets unattractive, but we donot see a big risk of a further appreciable upwarddrift in yields given the steady demand.
Portfolio ManagementGabriele Grecchi joined Credit Suisse in December 2004. He works within the Multi Asset Class Solutions (MACS) team in Milan as aportfolio manager for balanced and total return products. Mr. Grecchi is focused on investment strategies and provides benchmarkoriented, Value-at-Risk, total return, and long/short solutions. He has also worked in Dubai supporting the local MACS team in setting upinvestment solutions for institutional clients in the region and promoting the local product specialist platform. Mr. Grecchi holds an MSc inInternational Economics & Finance from the Università degli Studi di Milano (Italy), a Master's Degree in Business Communication, and aBA in Communication Science from the Libera Università di Lingue e Comunicazione IULM (Italy).
3) If not expressly indicated otherwise, all quantitative data contained in this comment is based on Lipper, Bloomberg or Datastream.
164

Fund manager Gabriele GrecchiFund manager since 01.12.2009Location MilanoFund domicile LuxembourgFund currency EURClose of financial year 30. SepTotal net assets (in mil.) 22.21Inception date 22.08.2006Management fee in % p.a. 0.70Total expense ratio (ex ante) in % 0.90Performance fee in % with Highwatermark 10.00Benchmark (BM) LIBOR EUR 3MUnit Class Category I
(capital growth)
ISIN LU0222452954
Valor no. 2187286
Min. Init. Investm. Amount (in mill.) 3EU taxation In scope - tax
March 30, 2012Switzerland
Credit Suisse Fund (Lux) Total Return Global Long/ShortExposure (Euro)Class I
Net performance in EUR (rebased to 100) and yearly performance 1)
2008 2009 2010 2011 201285
90
95
100
105
110
-15%
-10%
-5%
0%
5%
10%
5.0
1.2
-9.8
2.91.3 0.7 1.3
0.3
CSF (Lux) Total Return Global Long/Short Exposure(Euro) I
Yearly or year-to-date performance respectively(Fund)
LIBOR EUR 3MYearly or year-to-date performance respectively(Benchmark)
Net performance in EUR 1)
1 month 3 months YTD 1 year 3 years 5 yearsFund -1.02 2.93 2.93 -7.04 -1.06 -Benchmark 0.07 0.27 0.27 1.35 3.12 -
Asset allocation in %Cash/Cash Equivalents Currency Overlay Bonds Equity Total
Europe 82.14 - -3.81 - 78.33UK - 0.79 -3.82 12.38 9.35USA - 6.03 -3.64 - 2.39Japan - -5.56 - - -5.56Switzerland - -0.53 - - -0.53Emerging Markets - - - 16.02 16.02Total 82.14 0.73 -11.27 28.40 100.00
Investment policyThe investment objective of the Fund is toachieve the highest possible return in EUR byinvesting in fixed-income securities (includingmoney market instruments) and equities issuedby companies worldwide that have theirregistered office in an OECD member state. Inaddition, -30% to 30% of the fund's net assetsmay be invested in emerging market issues and-15% to 15% in futures on commodities indices.The return target remains in place irrespectiveof market conditions for traditional asset classes.Each asset class may account for between-100% and 100% of the fund's net assets atany time. For the purposes of achieving thedesired market exposure as well as for improvingefficiency in portfolio management, the fund mayuse derivative instruments on a broad scale,although, in doing so, the fund may not becomeleveraged at any point.
Repositioning on 31.10.2008 (Old name: CSF(Lux) Total Return Global (Euro))
Fund facts
Unit class currency EUR
Bloomberg ticker CSTRGEI LX
Net asset value (NAV) 876.57
DurationModified duration in years 0.42
Allocation of bonds in %Fixed Income 83.22Open-end Funds 16.78Total 100.00
Fund statistics1 year 3 years
Annualized volatility in % 7.27 6.50Information ratio -1.17 -0.21Tracking Error (Ex post) 7.40 6.54Maximum drawdown in % 2) -11.25 -12.122) Maximum drawdown is the most negative cumulative returnover a given time period.
Top 10 Holdings in %Position Coupon
%Maturity as % of
assetsItaly 2.500 01.07.12 18.10Italy 2.000 15.12.12 13.58Italy 2.000 01.06.13 13.51BBVA Senior Fin. 0.919 29.06.12 9.01Italy 4.750 01.02.13 6.94Royal Bk of Scotl. 1.584 14.09.16 6.14CS ETF (Lux) onMSCI Em. Markets
5.46
CS ETF (IE) on MSCIRussia
5.26
CS ETF (IE) on MSCIBrazil
5.22
Hungary 1.175 02.11.12 4.38Total 87.60
Source: Lipper, a Reuters Company
Cre
dit S
uiss
e Fu
nd
1) Historical performance indications and financial market scenarios are no guarantee for current or future performance. Performance indications do not consider commissions levied at subscription and/orredemption.
The disclaimer mentioned at the end of this document also applies to this page.
165

March 30, 2012Switzerland
Credit Suisse Fund (Lux) Total Return Global Long/ShortExposure (Euro)Class I
Review previous quarter 3)
World stock markets rocketed higher, especiallyin the first two months of the New Year, andare now up 35%–40% on average from their lowpoints hit in August 2011. Despite a short-termslowdown in economic activity, business-cycledata from the core regions reinforce our theorythat the macroeconomic situation is sustainablycontinuing to improve. This, coupled with
subsiding eurozone woes, abatingbanking-system troubles, the continued excellentshape of the corporate sector and thecentral-bank liquidity injections, led by the ECB,creates a substantially improved overall climate.
At the moment, however, the chances of furtherupside surprises have become more difficult.
Moreover, the market has already priced in someof these pleasing developments. Furthermore,the unpredictable situation in the Middle Eastand the substantial increase in the price of oilconstitute risk factors that shouldn’t beunderestimated. Greece remains an issue, asdo Portugal and Spain, even after the debtrestructuring deal.
Outlook for the market 3)
In anticipation of laterally consolidating ormoderately correcting stock markets, we decideda few weeks ago to take profits temporarily andto position ourselves neutrally as we await abetter entry opportunity. However, the macroand corporate fundamentals coupled with thevaluation component and the mountingperformance pressure on many investors whoare still positioned in cash continue to reinforceour confidence that we will see another up move
in stocks in the months ahead regardless of anynear-term corrections.
From a regional perspective, we believe thatsuperior growth and very sound corporate dataare the reason behind the significantoutperformance posted by the US markets.Hence, in the future we are leaning toward morecyclical and laggard markets such as theemerging economies (cyclicality and structural
advantages) and parts of Europe (catch-uppotential and valuation component).
Our positioning in the fixed-income sectorremains unchanged. In spite of the recent uptick,we consider the current yield levels in thetraditional bond markets unattractive, but we donot see a big risk of a further appreciable upwarddrift in yields given the steady demand.
Portfolio ManagementGabriele Grecchi joined Credit Suisse in December 2004. He works within the Multi Asset Class Solutions (MACS) team in Milan as aportfolio manager for balanced and total return products. Mr. Grecchi is focused on investment strategies and provides benchmarkoriented, Value-at-Risk, total return, and long/short solutions. He has also worked in Dubai supporting the local MACS team in setting upinvestment solutions for institutional clients in the region and promoting the local product specialist platform. Mr. Grecchi holds an MSc inInternational Economics & Finance from the Università degli Studi di Milano (Italy), a Master's Degree in Business Communication, and aBA in Communication Science from the Libera Università di Lingue e Comunicazione IULM (Italy).
3) If not expressly indicated otherwise, all quantitative data contained in this comment is based on Lipper, Bloomberg or Datastream.
166
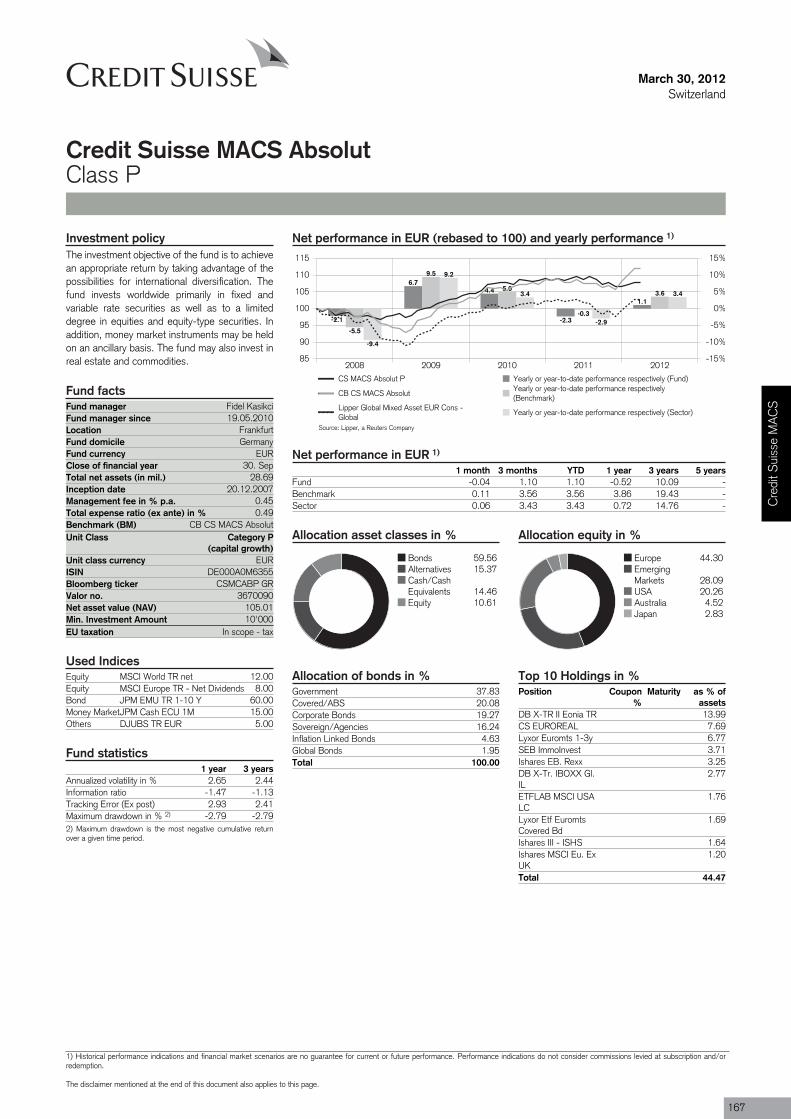
Fund manager Fidel KasikciFund manager since 19.05.2010Location FrankfurtFund domicile GermanyFund currency EURClose of financial year 30. SepTotal net assets (in mil.) 28.69Inception date 20.12.2007Management fee in % p.a. 0.45Total expense ratio (ex ante) in % 0.49Benchmark (BM) CB CS MACS AbsolutUnit Class Category P
(capital growth)
ISIN DE000A0M6355
Valor no. 3670090
Min. Investment Amount 10'000EU taxation In scope - tax
March 30, 2012Switzerland
Credit Suisse MACS AbsolutClass P
Net performance in EUR (rebased to 100) and yearly performance 1)
2008 2009 2010 2011 201285
90
95
100
105
110
115
-15%
-10%
-5%
0%
5%
10%
15%
-2.1
6.74.4
-2.3
1.1
-5.5
9.5
5.0
-0.3
3.6
-9.4
9.2
3.4
-2.9
3.4
CS MACS Absolut P Yearly or year-to-date performance respectively (Fund)
CB CS MACS AbsolutYearly or year-to-date performance respectively(Benchmark)
Lipper Global Mixed Asset EUR Cons -Global
Yearly or year-to-date performance respectively (Sector)
Net performance in EUR 1)
1 month 3 months YTD 1 year 3 years 5 yearsFund -0.04 1.10 1.10 -0.52 10.09 -Benchmark 0.11 3.56 3.56 3.86 19.43 -Sector 0.06 3.43 3.43 0.72 14.76 -
Allocation asset classes in %
Bonds 59.56Alternatives 15.37Cash/CashEquivalents 14.46Equity 10.61
Allocation equity in %
Europe 44.30EmergingMarkets 28.09USA 20.26Australia 4.52Japan 2.83
Investment policyThe investment objective of the fund is to achievean appropriate return by taking advantage of thepossibilities for international diversification. Thefund invests worldwide primarily in fixed andvariable rate securities as well as to a limiteddegree in equities and equity-type securities. Inaddition, money market instruments may be heldon an ancillary basis. The fund may also invest inreal estate and commodities.
Fund facts
Unit class currency EUR
Bloomberg ticker CSMCABP GR
Net asset value (NAV) 105.01
Used IndicesEquity MSCI World TR net 12.00Equity MSCI Europe TR - Net Dividends 8.00Bond JPM EMU TR 1-10 Y 60.00Money MarketJPM Cash ECU 1M 15.00Others DJUBS TR EUR 5.00
Fund statistics1 year 3 years
Annualized volatility in % 2.65 2.44Information ratio -1.47 -1.13Tracking Error (Ex post) 2.93 2.41Maximum drawdown in % 2) -2.79 -2.792) Maximum drawdown is the most negative cumulative returnover a given time period.
Allocation of bonds in %Government 37.83Covered/ABS 20.08Corporate Bonds 19.27Sovereign/Agencies 16.24Inflation Linked Bonds 4.63Global Bonds 1.95Total 100.00
Top 10 Holdings in %Position Coupon
%Maturity as % of
assetsDB X-TR II Eonia TR 13.99CS EUROREAL 7.69Lyxor Euromts 1-3y 6.77SEB ImmoInvest 3.71Ishares EB. Rexx 3.25DB X-Tr. IBOXX Gl.IL
2.77
ETFLAB MSCI USALC
1.76
Lyxor Etf EuromtsCovered Bd
1.69
Ishares III - ISHS 1.64Ishares MSCI Eu. ExUK
1.20
Total 44.47
Source: Lipper, a Reuters Company
Cre
dit S
uiss
e M
AC
S
1) Historical performance indications and financial market scenarios are no guarantee for current or future performance. Performance indications do not consider commissions levied at subscription and/orredemption.
The disclaimer mentioned at the end of this document also applies to this page.
167
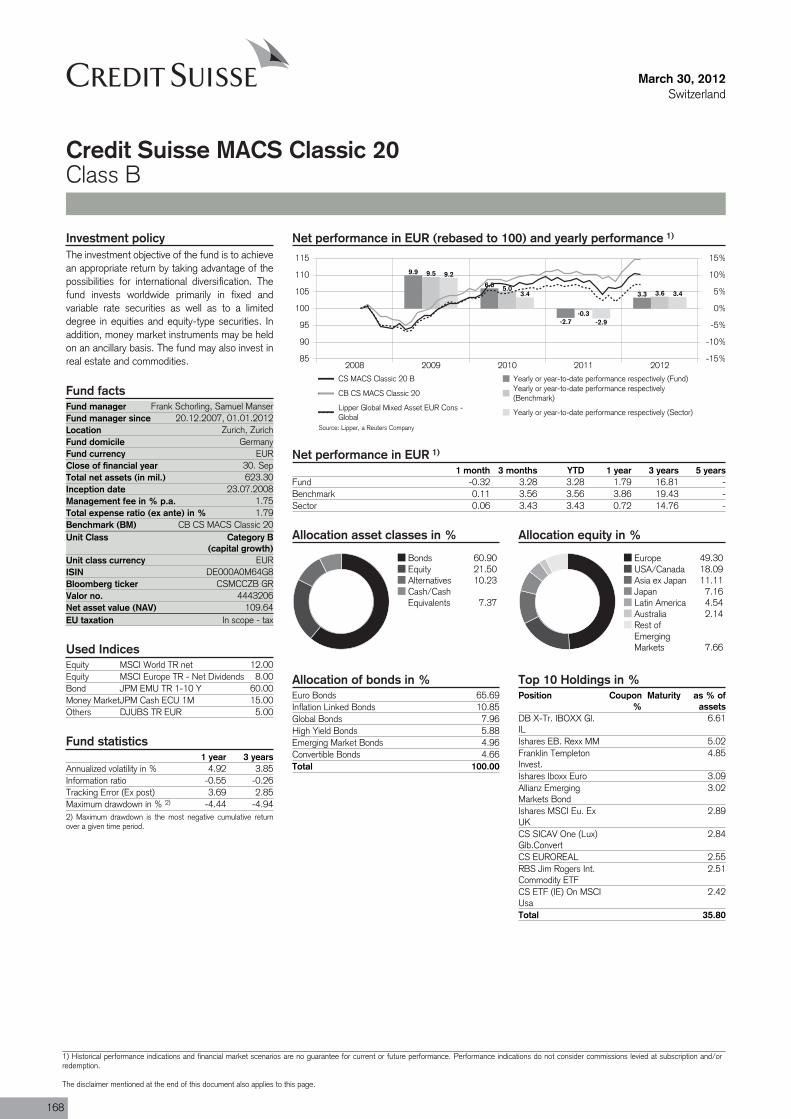
Fund manager Frank Schorling, Samuel ManserFund manager since 20.12.2007, 01.01.2012Location Zurich, ZurichFund domicile GermanyFund currency EURClose of financial year 30. SepTotal net assets (in mil.) 623.30Inception date 23.07.2008Management fee in % p.a. 1.75Total expense ratio (ex ante) in % 1.79Benchmark (BM) CB CS MACS Classic 20Unit Class Category B
(capital growth)
ISIN DE000A0M64G8
Valor no. 4443206
EU taxation In scope - tax
March 30, 2012Switzerland
Credit Suisse MACS Classic 20Class B
Net performance in EUR (rebased to 100) and yearly performance 1)
2008 2009 2010 2011 201285
90
95
100
105
110
115
-15%
-10%
-5%
0%
5%
10%
15%
9.9
6.0
-2.7
3.3
9.5
5.0
-0.3
3.6
9.2
3.4
-2.9
3.4
CS MACS Classic 20 B Yearly or year-to-date performance respectively (Fund)
CB CS MACS Classic 20Yearly or year-to-date performance respectively(Benchmark)
Lipper Global Mixed Asset EUR Cons -Global
Yearly or year-to-date performance respectively (Sector)
Net performance in EUR 1)
1 month 3 months YTD 1 year 3 years 5 yearsFund -0.32 3.28 3.28 1.79 16.81 -Benchmark 0.11 3.56 3.56 3.86 19.43 -Sector 0.06 3.43 3.43 0.72 14.76 -
Allocation asset classes in %
Bonds 60.90Equity 21.50Alternatives 10.23Cash/CashEquivalents 7.37
Allocation equity in %
Europe 49.30USA/Canada 18.09Asia ex Japan 11.11Japan 7.16Latin America 4.54Australia 2.14Rest ofEmergingMarkets 7.66
Investment policyThe investment objective of the fund is to achievean appropriate return by taking advantage of thepossibilities for international diversification. Thefund invests worldwide primarily in fixed andvariable rate securities as well as to a limiteddegree in equities and equity-type securities. Inaddition, money market instruments may be heldon an ancillary basis. The fund may also invest inreal estate and commodities.
Fund facts
Unit class currency EUR
Bloomberg ticker CSMCCZB GR
Net asset value (NAV) 109.64
Used IndicesEquity MSCI World TR net 12.00Equity MSCI Europe TR - Net Dividends 8.00Bond JPM EMU TR 1-10 Y 60.00Money MarketJPM Cash ECU 1M 15.00Others DJUBS TR EUR 5.00
Fund statistics1 year 3 years
Annualized volatility in % 4.92 3.85Information ratio -0.55 -0.26Tracking Error (Ex post) 3.69 2.85Maximum drawdown in % 2) -4.44 -4.942) Maximum drawdown is the most negative cumulative returnover a given time period.
Allocation of bonds in %Euro Bonds 65.69Inflation Linked Bonds 10.85Global Bonds 7.96High Yield Bonds 5.88Emerging Market Bonds 4.96Convertible Bonds 4.66Total 100.00
Top 10 Holdings in %Position Coupon
%Maturity as % of
assetsDB X-Tr. IBOXX Gl.IL
6.61
Ishares EB. Rexx MM 5.02Franklin TempletonInvest.
4.85
Ishares Iboxx Euro 3.09Allianz EmergingMarkets Bond
3.02
Ishares MSCI Eu. ExUK
2.89
CS SICAV One (Lux)Glb.Convert
2.84
CS EUROREAL 2.55RBS Jim Rogers Int.Commodity ETF
2.51
CS ETF (IE) On MSCIUsa
2.42
Total 35.80
Source: Lipper, a Reuters Company
168
1) Historical performance indications and financial market scenarios are no guarantee for current or future performance. Performance indications do not consider commissions levied at subscription and/orredemption.
The disclaimer mentioned at the end of this document also applies to this page.
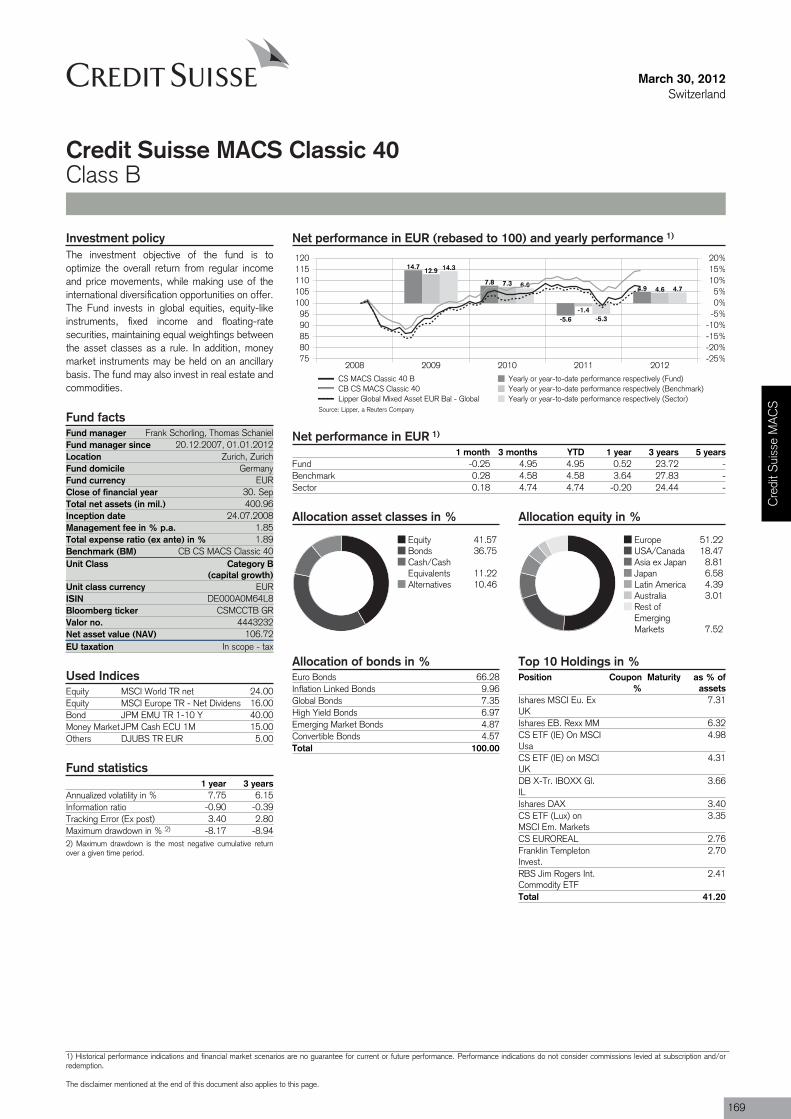
Fund manager Frank Schorling, Thomas SchanielFund manager since 20.12.2007, 01.01.2012Location Zurich, ZurichFund domicile GermanyFund currency EURClose of financial year 30. SepTotal net assets (in mil.) 400.96Inception date 24.07.2008Management fee in % p.a. 1.85Total expense ratio (ex ante) in % 1.89Benchmark (BM) CB CS MACS Classic 40Unit Class Category B
(capital growth)
ISIN DE000A0M64L8
Valor no. 4443232
EU taxation In scope - tax
March 30, 2012Switzerland
Credit Suisse MACS Classic 40Class B
Net performance in EUR (rebased to 100) and yearly performance 1)
2008 2009 2010 2011 20127580859095
100105110115120
-25%-20%-15%-10%-5%0%5%
10%15%20%
14.7
7.8
-5.6
4.9
12.9
7.3
-1.4
4.6
14.3
6.6
-5.3
4.7
CS MACS Classic 40 B Yearly or year-to-date performance respectively (Fund)CB CS MACS Classic 40 Yearly or year-to-date performance respectively (Benchmark)Lipper Global Mixed Asset EUR Bal - Global Yearly or year-to-date performance respectively (Sector)
Net performance in EUR 1)
1 month 3 months YTD 1 year 3 years 5 yearsFund -0.25 4.95 4.95 0.52 23.72 -Benchmark 0.28 4.58 4.58 3.64 27.83 -Sector 0.18 4.74 4.74 -0.20 24.44 -
Allocation asset classes in %
Equity 41.57Bonds 36.75Cash/CashEquivalents 11.22Alternatives 10.46
Allocation equity in %
Europe 51.22USA/Canada 18.47Asia ex Japan 8.81Japan 6.58Latin America 4.39Australia 3.01Rest ofEmergingMarkets 7.52
Investment policyThe investment objective of the fund is tooptimize the overall return from regular incomeand price movements, while making use of theinternational diversification opportunities on offer.The Fund invests in global equities, equity-likeinstruments, fixed income and floating-ratesecurities, maintaining equal weightings betweenthe asset classes as a rule. In addition, moneymarket instruments may be held on an ancillarybasis. The fund may also invest in real estate andcommodities.
Fund facts
Unit class currency EUR
Bloomberg ticker CSMCCTB GR
Net asset value (NAV) 106.72
Used IndicesEquity MSCI World TR net 24.00Equity MSCI Europe TR - Net Dividens 16.00Bond JPM EMU TR 1-10 Y 40.00Money Market JPM Cash ECU 1M 15.00Others DJUBS TR EUR 5.00
Fund statistics1 year 3 years
Annualized volatility in % 7.75 6.15Information ratio -0.90 -0.39Tracking Error (Ex post) 3.40 2.80Maximum drawdown in % 2) -8.17 -8.942) Maximum drawdown is the most negative cumulative returnover a given time period.
Allocation of bonds in %Euro Bonds 66.28Inflation Linked Bonds 9.96Global Bonds 7.35High Yield Bonds 6.97Emerging Market Bonds 4.87Convertible Bonds 4.57Total 100.00
Top 10 Holdings in %Position Coupon
%Maturity as % of
assetsIshares MSCI Eu. ExUK
7.31
Ishares EB. Rexx MM 6.32CS ETF (IE) On MSCIUsa
4.98
CS ETF (IE) on MSCIUK
4.31
DB X-Tr. IBOXX Gl.IL
3.66
Ishares DAX 3.40CS ETF (Lux) onMSCI Em. Markets
3.35
CS EUROREAL 2.76Franklin TempletonInvest.
2.70
RBS Jim Rogers Int.Commodity ETF
2.41
Total 41.20
Source: Lipper, a Reuters Company
Cre
dit S
uiss
e M
AC
S
1) Historical performance indications and financial market scenarios are no guarantee for current or future performance. Performance indications do not consider commissions levied at subscription and/orredemption.
The disclaimer mentioned at the end of this document also applies to this page.
169
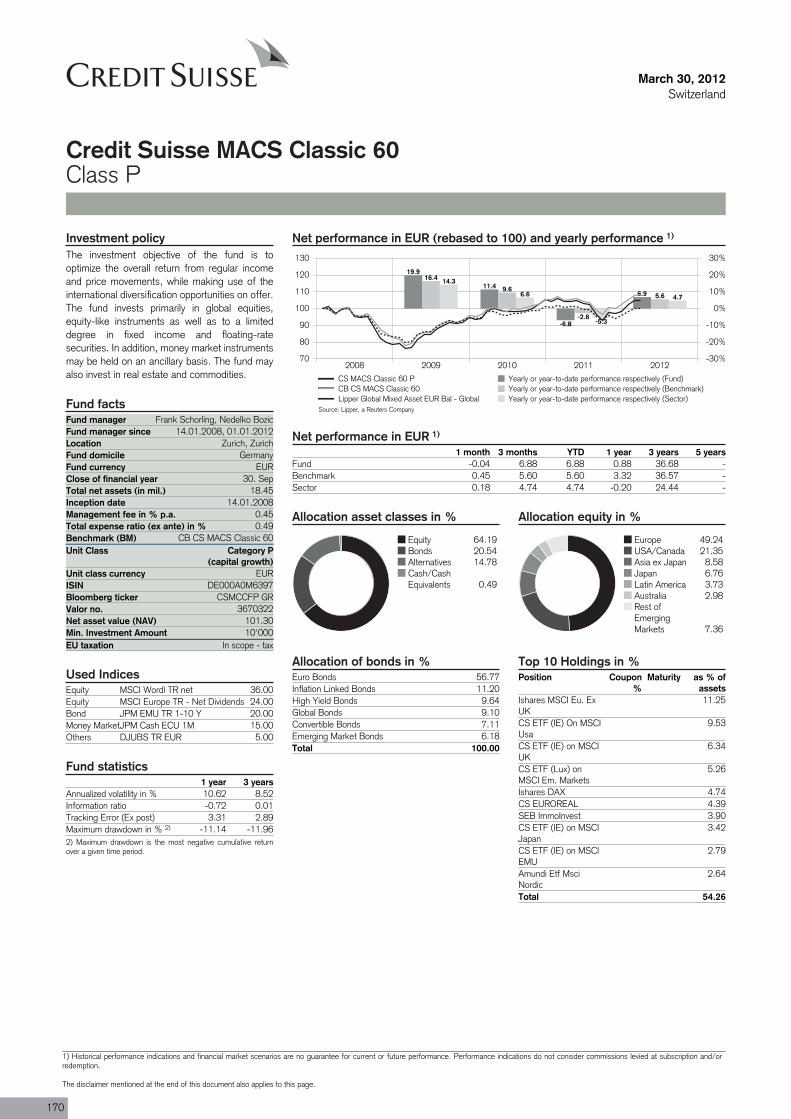
Fund manager Frank Schorling, Nedelko BozicFund manager since 14.01.2008, 01.01.2012Location Zurich, ZurichFund domicile GermanyFund currency EURClose of financial year 30. SepTotal net assets (in mil.) 18.45Inception date 14.01.2008Management fee in % p.a. 0.45Total expense ratio (ex ante) in % 0.49Benchmark (BM) CB CS MACS Classic 60Unit Class Category P
(capital growth)
ISIN DE000A0M6397
Valor no. 3670322
Min. Investment Amount 10'000EU taxation In scope - tax
March 30, 2012Switzerland
Credit Suisse MACS Classic 60Class P
Net performance in EUR (rebased to 100) and yearly performance 1)
2008 2009 2010 2011 201270
80
90
100
110
120
130
-30%
-20%
-10%
0%
10%
20%
30%
19.9
11.4
-6.8
6.9
16.4
9.6
-2.6
5.6
14.3
6.6
-5.3
4.7
CS MACS Classic 60 P Yearly or year-to-date performance respectively (Fund)CB CS MACS Classic 60 Yearly or year-to-date performance respectively (Benchmark)Lipper Global Mixed Asset EUR Bal - Global Yearly or year-to-date performance respectively (Sector)
Net performance in EUR 1)
1 month 3 months YTD 1 year 3 years 5 yearsFund -0.04 6.88 6.88 0.88 36.68 -Benchmark 0.45 5.60 5.60 3.32 36.57 -Sector 0.18 4.74 4.74 -0.20 24.44 -
Allocation asset classes in %
Equity 64.19Bonds 20.54Alternatives 14.78Cash/CashEquivalents 0.49
Allocation equity in %
Europe 49.24USA/Canada 21.35Asia ex Japan 8.58Japan 6.76Latin America 3.73Australia 2.98Rest ofEmergingMarkets 7.36
Investment policyThe investment objective of the fund is tooptimize the overall return from regular incomeand price movements, while making use of theinternational diversification opportunities on offer.The fund invests primarily in global equities,equity-like instruments as well as to a limiteddegree in fixed income and floating-ratesecurities. In addition, money market instrumentsmay be held on an ancillary basis. The fund mayalso invest in real estate and commodities.
Fund facts
Unit class currency EUR
Bloomberg ticker CSMCCFP GR
Net asset value (NAV) 101.30
Used IndicesEquity MSCI Wordl TR net 36.00Equity MSCI Europe TR - Net Dividends 24.00Bond JPM EMU TR 1-10 Y 20.00Money MarketJPM Cash ECU 1M 15.00Others DJUBS TR EUR 5.00
Fund statistics1 year 3 years
Annualized volatility in % 10.62 8.52Information ratio -0.72 0.01Tracking Error (Ex post) 3.31 2.89Maximum drawdown in % 2) -11.14 -11.962) Maximum drawdown is the most negative cumulative returnover a given time period.
Allocation of bonds in %Euro Bonds 56.77Inflation Linked Bonds 11.20High Yield Bonds 9.64Global Bonds 9.10Convertible Bonds 7.11Emerging Market Bonds 6.18Total 100.00
Top 10 Holdings in %Position Coupon
%Maturity as % of
assetsIshares MSCI Eu. ExUK
11.25
CS ETF (IE) On MSCIUsa
9.53
CS ETF (IE) on MSCIUK
6.34
CS ETF (Lux) onMSCI Em. Markets
5.26
Ishares DAX 4.74CS EUROREAL 4.39SEB ImmoInvest 3.90CS ETF (IE) on MSCIJapan
3.42
CS ETF (IE) on MSCIEMU
2.79
Amundi Etf MsciNordic
2.64
Total 54.26
Source: Lipper, a Reuters Company
170
1) Historical performance indications and financial market scenarios are no guarantee for current or future performance. Performance indications do not consider commissions levied at subscription and/orredemption.
The disclaimer mentioned at the end of this document also applies to this page.
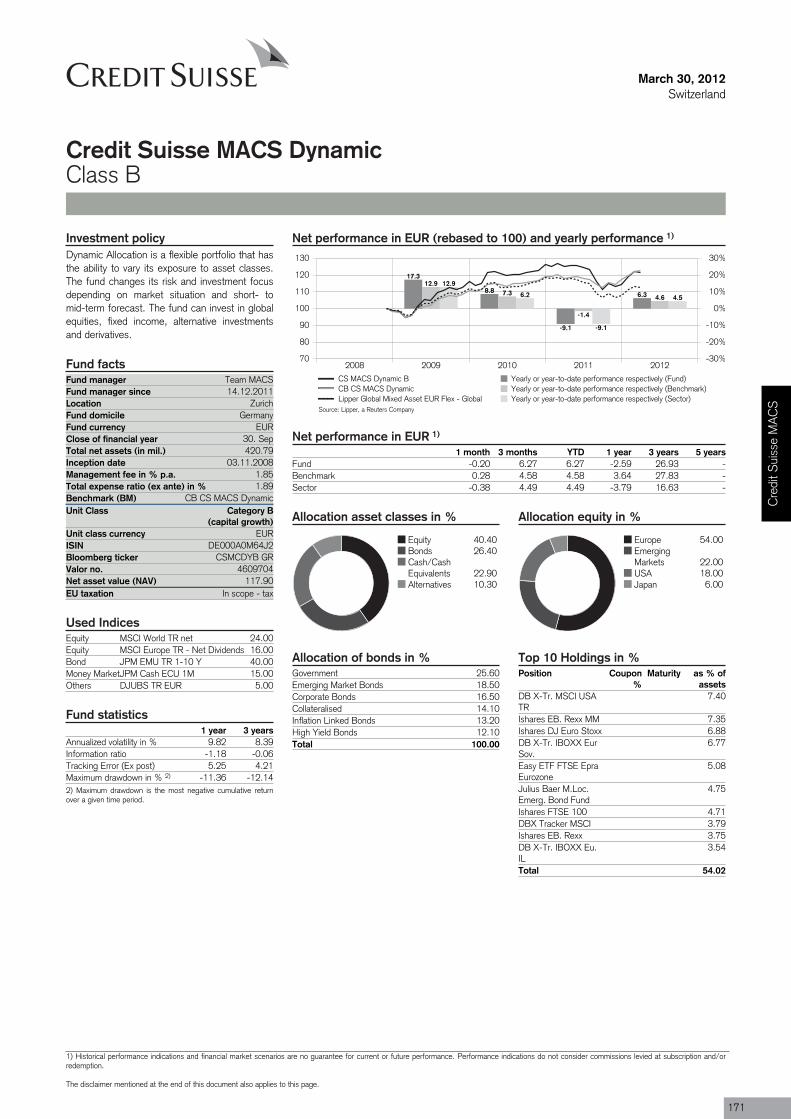
Fund manager Team MACSFund manager since 14.12.2011Location ZurichFund domicile GermanyFund currency EURClose of financial year 30. SepTotal net assets (in mil.) 420.79Inception date 03.11.2008Management fee in % p.a. 1.85Total expense ratio (ex ante) in % 1.89Benchmark (BM) CB CS MACS DynamicUnit Class Category B
(capital growth)
ISIN DE000A0M64J2
Valor no. 4609704
EU taxation In scope - tax
March 30, 2012Switzerland
Credit Suisse MACS DynamicClass B
Net performance in EUR (rebased to 100) and yearly performance 1)
2008 2009 2010 2011 201270
80
90
100
110
120
130
-30%
-20%
-10%
0%
10%
20%
30%
17.3
8.8
-9.1
6.3
12.97.3
-1.4
4.6
12.9
6.2
-9.1
4.5
CS MACS Dynamic B Yearly or year-to-date performance respectively (Fund)CB CS MACS Dynamic Yearly or year-to-date performance respectively (Benchmark)Lipper Global Mixed Asset EUR Flex - Global Yearly or year-to-date performance respectively (Sector)
Net performance in EUR 1)
1 month 3 months YTD 1 year 3 years 5 yearsFund -0.20 6.27 6.27 -2.59 26.93 -Benchmark 0.28 4.58 4.58 3.64 27.83 -Sector -0.38 4.49 4.49 -3.79 16.63 -
Allocation asset classes in %
Equity 40.40Bonds 26.40Cash/CashEquivalents 22.90Alternatives 10.30
Allocation equity in %
Europe 54.00EmergingMarkets 22.00USA 18.00Japan 6.00
Investment policyDynamic Allocation is a flexible portfolio that hasthe ability to vary its exposure to asset classes.The fund changes its risk and investment focusdepending on market situation and short- tomid-term forecast. The fund can invest in globalequities, fixed income, alternative investmentsand derivatives.
Fund facts
Unit class currency EUR
Bloomberg ticker CSMCDYB GR
Net asset value (NAV) 117.90
Used IndicesEquity MSCI World TR net 24.00Equity MSCI Europe TR - Net Dividends 16.00Bond JPM EMU TR 1-10 Y 40.00Money MarketJPM Cash ECU 1M 15.00Others DJUBS TR EUR 5.00
Fund statistics1 year 3 years
Annualized volatility in % 9.82 8.39Information ratio -1.18 -0.06Tracking Error (Ex post) 5.25 4.21Maximum drawdown in % 2) -11.36 -12.142) Maximum drawdown is the most negative cumulative returnover a given time period.
Allocation of bonds in %Government 25.60Emerging Market Bonds 18.50Corporate Bonds 16.50Collateralised 14.10Inflation Linked Bonds 13.20High Yield Bonds 12.10Total 100.00
Top 10 Holdings in %Position Coupon
%Maturity as % of
assetsDB X-Tr. MSCI USATR
7.40
Ishares EB. Rexx MM 7.35Ishares DJ Euro Stoxx 6.88DB X-Tr. IBOXX EurSov.
6.77
Easy ETF FTSE EpraEurozone
5.08
Julius Baer M.Loc.Emerg. Bond Fund
4.75
Ishares FTSE 100 4.71DBX Tracker MSCI 3.79Ishares EB. Rexx 3.75DB X-Tr. IBOXX Eu.IL
3.54
Total 54.02
Source: Lipper, a Reuters Company
Cre
dit S
uiss
e M
AC
S
1) Historical performance indications and financial market scenarios are no guarantee for current or future performance. Performance indications do not consider commissions levied at subscription and/orredemption.
The disclaimer mentioned at the end of this document also applies to this page.
171
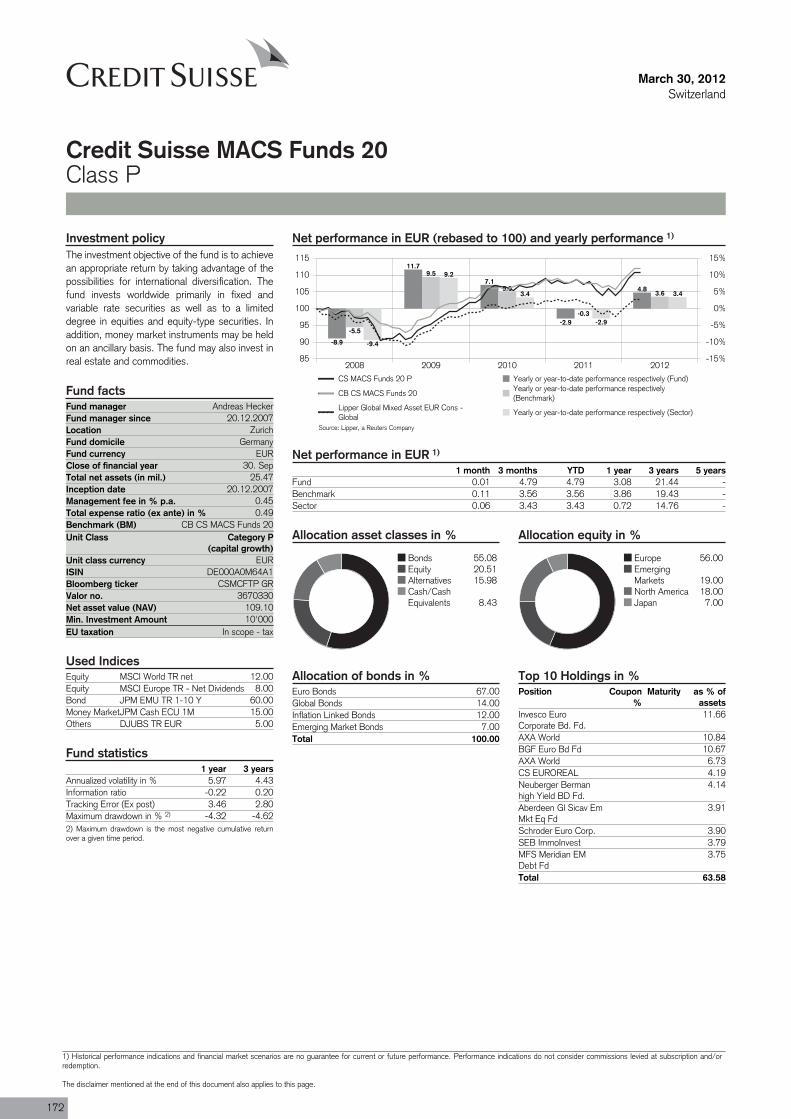
Fund manager Andreas HeckerFund manager since 20.12.2007Location ZurichFund domicile GermanyFund currency EURClose of financial year 30. SepTotal net assets (in mil.) 25.47Inception date 20.12.2007Management fee in % p.a. 0.45Total expense ratio (ex ante) in % 0.49Benchmark (BM) CB CS MACS Funds 20Unit Class Category P
(capital growth)
ISIN DE000A0M64A1
Valor no. 3670330
Min. Investment Amount 10'000EU taxation In scope - tax
March 30, 2012Switzerland
Credit Suisse MACS Funds 20Class P
Net performance in EUR (rebased to 100) and yearly performance 1)
2008 2009 2010 2011 201285
90
95
100
105
110
115
-15%
-10%
-5%
0%
5%
10%
15%
-8.9
11.7
7.1
-2.9
4.8
-5.5
9.5
5.0
-0.3
3.6
-9.4
9.2
3.4
-2.9
3.4
CS MACS Funds 20 P Yearly or year-to-date performance respectively (Fund)
CB CS MACS Funds 20Yearly or year-to-date performance respectively(Benchmark)
Lipper Global Mixed Asset EUR Cons -Global
Yearly or year-to-date performance respectively (Sector)
Net performance in EUR 1)
1 month 3 months YTD 1 year 3 years 5 yearsFund 0.01 4.79 4.79 3.08 21.44 -Benchmark 0.11 3.56 3.56 3.86 19.43 -Sector 0.06 3.43 3.43 0.72 14.76 -
Allocation asset classes in %
Bonds 55.08Equity 20.51Alternatives 15.98Cash/CashEquivalents 8.43
Allocation equity in %
Europe 56.00EmergingMarkets 19.00North America 18.00Japan 7.00
Investment policyThe investment objective of the fund is to achievean appropriate return by taking advantage of thepossibilities for international diversification. Thefund invests worldwide primarily in fixed andvariable rate securities as well as to a limiteddegree in equities and equity-type securities. Inaddition, money market instruments may be heldon an ancillary basis. The fund may also invest inreal estate and commodities.
Fund facts
Unit class currency EUR
Bloomberg ticker CSMCFTP GR
Net asset value (NAV) 109.10
Used IndicesEquity MSCI World TR net 12.00Equity MSCI Europe TR - Net Dividends 8.00Bond JPM EMU TR 1-10 Y 60.00Money MarketJPM Cash ECU 1M 15.00Others DJUBS TR EUR 5.00
Fund statistics1 year 3 years
Annualized volatility in % 5.97 4.43Information ratio -0.22 0.20Tracking Error (Ex post) 3.46 2.80Maximum drawdown in % 2) -4.32 -4.622) Maximum drawdown is the most negative cumulative returnover a given time period.
Allocation of bonds in %Euro Bonds 67.00Global Bonds 14.00Inflation Linked Bonds 12.00Emerging Market Bonds 7.00Total 100.00
Top 10 Holdings in %Position Coupon
%Maturity as % of
assetsInvesco EuroCorporate Bd. Fd.
11.66
AXA World 10.84BGF Euro Bd Fd 10.67AXA World 6.73CS EUROREAL 4.19Neuberger Bermanhigh Yield BD Fd.
4.14
Aberdeen Gl Sicav EmMkt Eq Fd
3.91
Schroder Euro Corp. 3.90SEB ImmoInvest 3.79MFS Meridian EMDebt Fd
3.75
Total 63.58
Source: Lipper, a Reuters Company
172
1) Historical performance indications and financial market scenarios are no guarantee for current or future performance. Performance indications do not consider commissions levied at subscription and/orredemption.
The disclaimer mentioned at the end of this document also applies to this page.
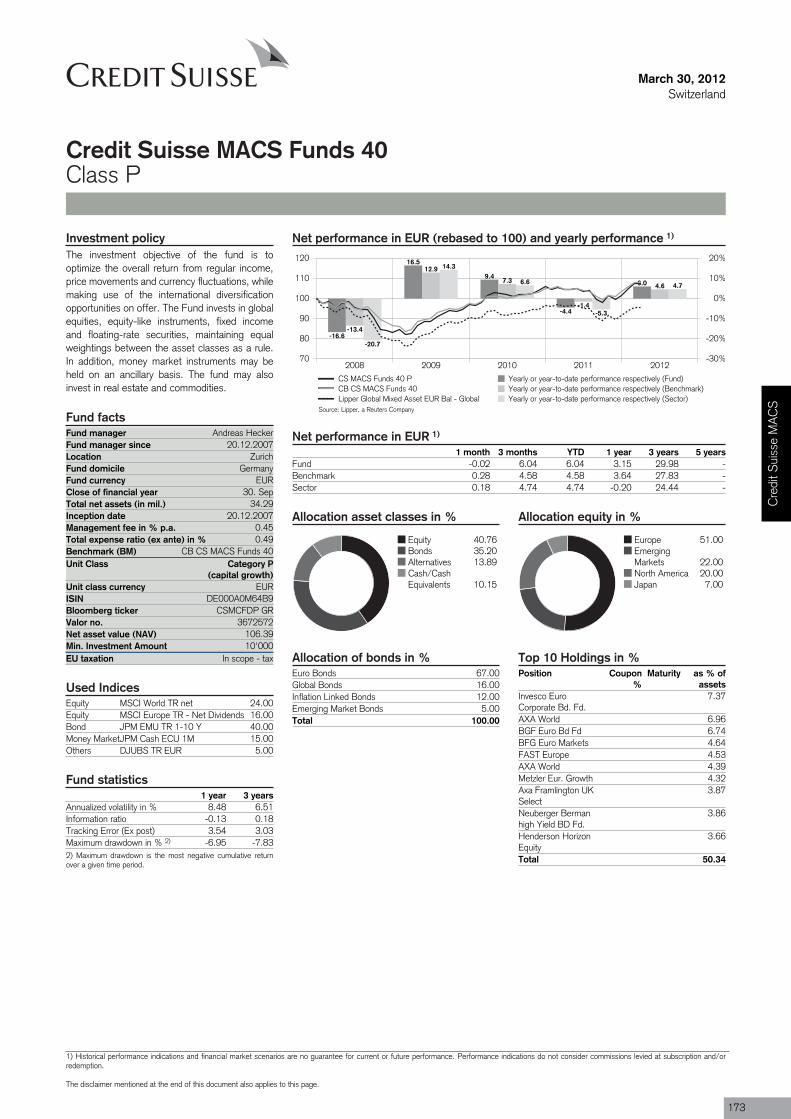
Fund manager Andreas HeckerFund manager since 20.12.2007Location ZurichFund domicile GermanyFund currency EURClose of financial year 30. SepTotal net assets (in mil.) 34.29Inception date 20.12.2007Management fee in % p.a. 0.45Total expense ratio (ex ante) in % 0.49Benchmark (BM) CB CS MACS Funds 40Unit Class Category P
(capital growth)
ISIN DE000A0M64B9
Valor no. 3672572
Min. Investment Amount 10'000EU taxation In scope - tax
March 30, 2012Switzerland
Credit Suisse MACS Funds 40Class P
Net performance in EUR (rebased to 100) and yearly performance 1)
2008 2009 2010 2011 201270
80
90
100
110
120
-30%
-20%
-10%
0%
10%
20%
-16.6
16.5
9.4
-4.4
6.0
-13.4
12.9
7.3
-1.4
4.6
-20.7
14.3
6.6
-5.3
4.7
CS MACS Funds 40 P Yearly or year-to-date performance respectively (Fund)CB CS MACS Funds 40 Yearly or year-to-date performance respectively (Benchmark)Lipper Global Mixed Asset EUR Bal - Global Yearly or year-to-date performance respectively (Sector)
Net performance in EUR 1)
1 month 3 months YTD 1 year 3 years 5 yearsFund -0.02 6.04 6.04 3.15 29.98 -Benchmark 0.28 4.58 4.58 3.64 27.83 -Sector 0.18 4.74 4.74 -0.20 24.44 -
Allocation asset classes in %
Equity 40.76Bonds 35.20Alternatives 13.89Cash/CashEquivalents 10.15
Allocation equity in %
Europe 51.00EmergingMarkets 22.00North America 20.00Japan 7.00
Investment policyThe investment objective of the fund is tooptimize the overall return from regular income,price movements and currency fluctuations, whilemaking use of the international diversificationopportunities on offer. The Fund invests in globalequities, equity-like instruments, fixed incomeand floating-rate securities, maintaining equalweightings between the asset classes as a rule.In addition, money market instruments may beheld on an ancillary basis. The fund may alsoinvest in real estate and commodities.
Fund facts
Unit class currency EUR
Bloomberg ticker CSMCFDP GR
Net asset value (NAV) 106.39
Used IndicesEquity MSCI World TR net 24.00Equity MSCI Europe TR - Net Dividends 16.00Bond JPM EMU TR 1-10 Y 40.00Money MarketJPM Cash ECU 1M 15.00Others DJUBS TR EUR 5.00
Fund statistics1 year 3 years
Annualized volatility in % 8.48 6.51Information ratio -0.13 0.18Tracking Error (Ex post) 3.54 3.03Maximum drawdown in % 2) -6.95 -7.832) Maximum drawdown is the most negative cumulative returnover a given time period.
Allocation of bonds in %Euro Bonds 67.00Global Bonds 16.00Inflation Linked Bonds 12.00Emerging Market Bonds 5.00Total 100.00
Top 10 Holdings in %Position Coupon
%Maturity as % of
assetsInvesco EuroCorporate Bd. Fd.
7.37
AXA World 6.96BGF Euro Bd Fd 6.74BFG Euro Markets 4.64FAST Europe 4.53AXA World 4.39Metzler Eur. Growth 4.32Axa Framlington UKSelect
3.87
Neuberger Bermanhigh Yield BD Fd.
3.86
Henderson HorizonEquity
3.66
Total 50.34
Source: Lipper, a Reuters Company
Cre
dit S
uiss
e M
AC
S
1) Historical performance indications and financial market scenarios are no guarantee for current or future performance. Performance indications do not consider commissions levied at subscription and/orredemption.
The disclaimer mentioned at the end of this document also applies to this page.
173
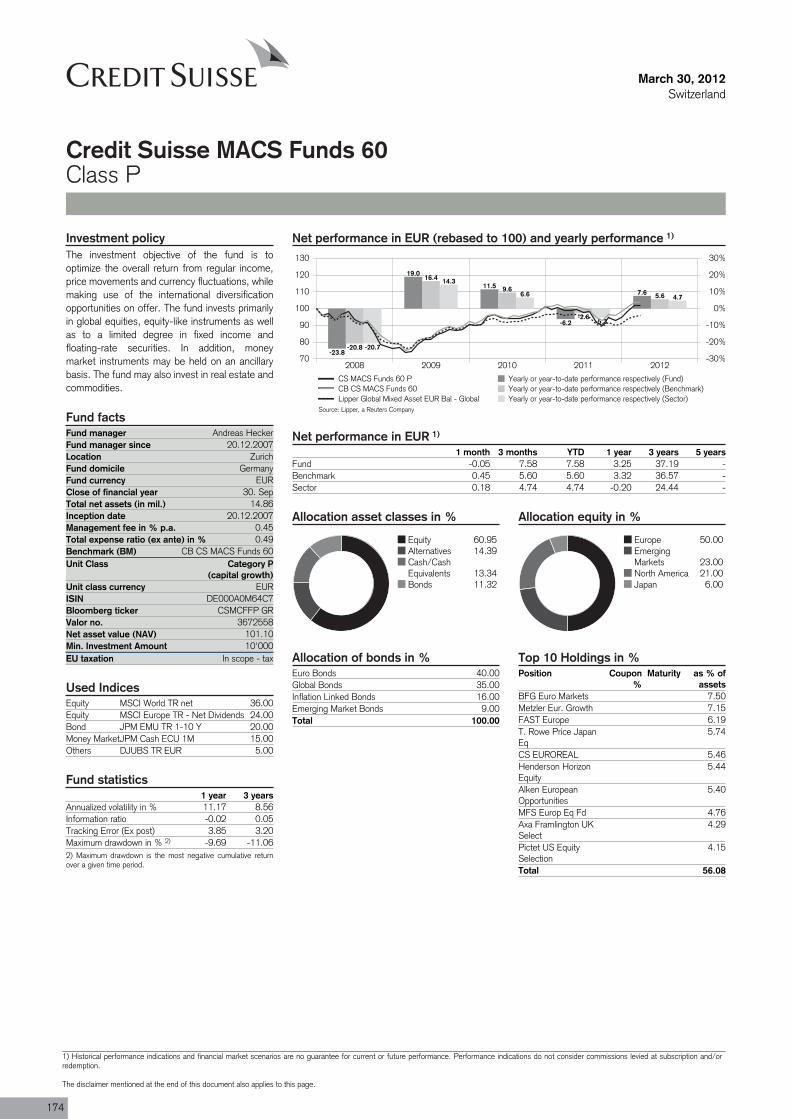
Fund manager Andreas HeckerFund manager since 20.12.2007Location ZurichFund domicile GermanyFund currency EURClose of financial year 30. SepTotal net assets (in mil.) 14.86Inception date 20.12.2007Management fee in % p.a. 0.45Total expense ratio (ex ante) in % 0.49Benchmark (BM) CB CS MACS Funds 60Unit Class Category P
(capital growth)
ISIN DE000A0M64C7
Valor no. 3672558
Min. Investment Amount 10'000EU taxation In scope - tax
March 30, 2012Switzerland
Credit Suisse MACS Funds 60Class P
Net performance in EUR (rebased to 100) and yearly performance 1)
2008 2009 2010 2011 201270
80
90
100
110
120
130
-30%
-20%
-10%
0%
10%
20%
30%
-23.8
19.0
11.5
-6.2
7.6
-20.8
16.4
9.6
-2.6
5.6
-20.7
14.3
6.6
-5.3
4.7
CS MACS Funds 60 P Yearly or year-to-date performance respectively (Fund)CB CS MACS Funds 60 Yearly or year-to-date performance respectively (Benchmark)Lipper Global Mixed Asset EUR Bal - Global Yearly or year-to-date performance respectively (Sector)
Net performance in EUR 1)
1 month 3 months YTD 1 year 3 years 5 yearsFund -0.05 7.58 7.58 3.25 37.19 -Benchmark 0.45 5.60 5.60 3.32 36.57 -Sector 0.18 4.74 4.74 -0.20 24.44 -
Allocation asset classes in %
Equity 60.95Alternatives 14.39Cash/CashEquivalents 13.34Bonds 11.32
Allocation equity in %
Europe 50.00EmergingMarkets 23.00North America 21.00Japan 6.00
Investment policyThe investment objective of the fund is tooptimize the overall return from regular income,price movements and currency fluctuations, whilemaking use of the international diversificationopportunities on offer. The fund invests primarilyin global equities, equity-like instruments as wellas to a limited degree in fixed income andfloating-rate securities. In addition, moneymarket instruments may be held on an ancillarybasis. The fund may also invest in real estate andcommodities.
Fund facts
Unit class currency EUR
Bloomberg ticker CSMCFFP GR
Net asset value (NAV) 101.10
Used IndicesEquity MSCI World TR net 36.00Equity MSCI Europe TR - Net Dividends 24.00Bond JPM EMU TR 1-10 Y 20.00Money MarketJPM Cash ECU 1M 15.00Others DJUBS TR EUR 5.00
Fund statistics1 year 3 years
Annualized volatility in % 11.17 8.56Information ratio -0.02 0.05Tracking Error (Ex post) 3.85 3.20Maximum drawdown in % 2) -9.69 -11.062) Maximum drawdown is the most negative cumulative returnover a given time period.
Allocation of bonds in %Euro Bonds 40.00Global Bonds 35.00Inflation Linked Bonds 16.00Emerging Market Bonds 9.00Total 100.00
Top 10 Holdings in %Position Coupon
%Maturity as % of
assetsBFG Euro Markets 7.50Metzler Eur. Growth 7.15FAST Europe 6.19T. Rowe Price JapanEq
5.74
CS EUROREAL 5.46Henderson HorizonEquity
5.44
Alken EuropeanOpportunities
5.40
MFS Europ Eq Fd 4.76Axa Framlington UKSelect
4.29
Pictet US EquitySelection
4.15
Total 56.08
Source: Lipper, a Reuters Company
174
1) Historical performance indications and financial market scenarios are no guarantee for current or future performance. Performance indications do not consider commissions levied at subscription and/orredemption.
The disclaimer mentioned at the end of this document also applies to this page.
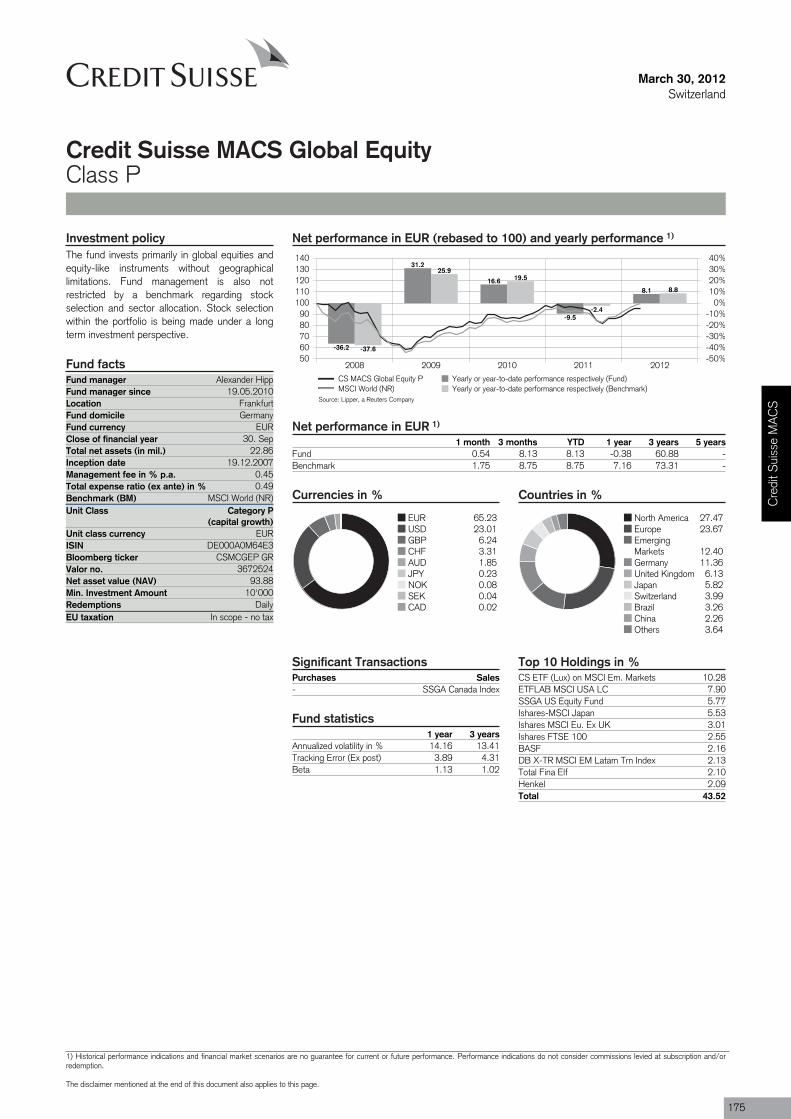
Purchases Sales- SSGA Canada Index
Fund manager Alexander HippFund manager since 19.05.2010Location FrankfurtFund domicile GermanyFund currency EURClose of financial year 30. SepTotal net assets (in mil.) 22.86Inception date 19.12.2007Management fee in % p.a. 0.45Total expense ratio (ex ante) in % 0.49Benchmark (BM) MSCI World (NR)Unit Class Category P
(capital growth)
ISIN DE000A0M64E3
Valor no. 3672524
Min. Investment Amount 10'000Redemptions DailyEU taxation In scope - no tax
March 30, 2012Switzerland
Credit Suisse MACS Global EquityClass P
Net performance in EUR (rebased to 100) and yearly performance 1)
2008 2009 2010 2011 20125060708090
100110120130140
-50%-40%-30%-20%-10%
0%10%20%30%40%
-36.2
31.2
16.6
-9.5
8.1
-37.6
25.919.5
-2.4
8.8
CS MACS Global Equity P Yearly or year-to-date performance respectively (Fund)MSCI World (NR) Yearly or year-to-date performance respectively (Benchmark)
Net performance in EUR 1)
1 month 3 months YTD 1 year 3 years 5 yearsFund 0.54 8.13 8.13 -0.38 60.88 -Benchmark 1.75 8.75 8.75 7.16 73.31 -
Currencies in %
EUR 65.23USD 23.01GBP 6.24CHF 3.31AUD 1.85JPY 0.23NOK 0.08SEK 0.04CAD 0.02
Countries in %
North America 27.47Europe 23.67EmergingMarkets 12.40Germany 11.36United Kingdom 6.13Japan 5.82Switzerland 3.99Brazil 3.26China 2.26Others 3.64
Significant Transactions
Fund statistics1 year 3 years
Annualized volatility in % 14.16 13.41Tracking Error (Ex post) 3.89 4.31Beta 1.13 1.02
Top 10 Holdings in %CS ETF (Lux) on MSCI Em. Markets 10.28ETFLAB MSCI USA LC 7.90SSGA US Equity Fund 5.77Ishares-MSCI Japan 5.53Ishares MSCI Eu. Ex UK 3.01Ishares FTSE 100 2.55BASF 2.16DB X-TR MSCI EM Latam Trn Index 2.13Total Fina Elf 2.10Henkel 2.09Total 43.52
Investment policyThe fund invests primarily in global equities andequity-like instruments without geographicallimitations. Fund management is also notrestricted by a benchmark regarding stockselection and sector allocation. Stock selectionwithin the portfolio is being made under a longterm investment perspective.
Fund facts
Unit class currency EUR
Bloomberg ticker CSMCGEP GR
Net asset value (NAV) 93.88
Source: Lipper, a Reuters Company
Cre
dit S
uiss
e M
AC
S
1) Historical performance indications and financial market scenarios are no guarantee for current or future performance. Performance indications do not consider commissions levied at subscription and/orredemption.
The disclaimer mentioned at the end of this document also applies to this page.
175
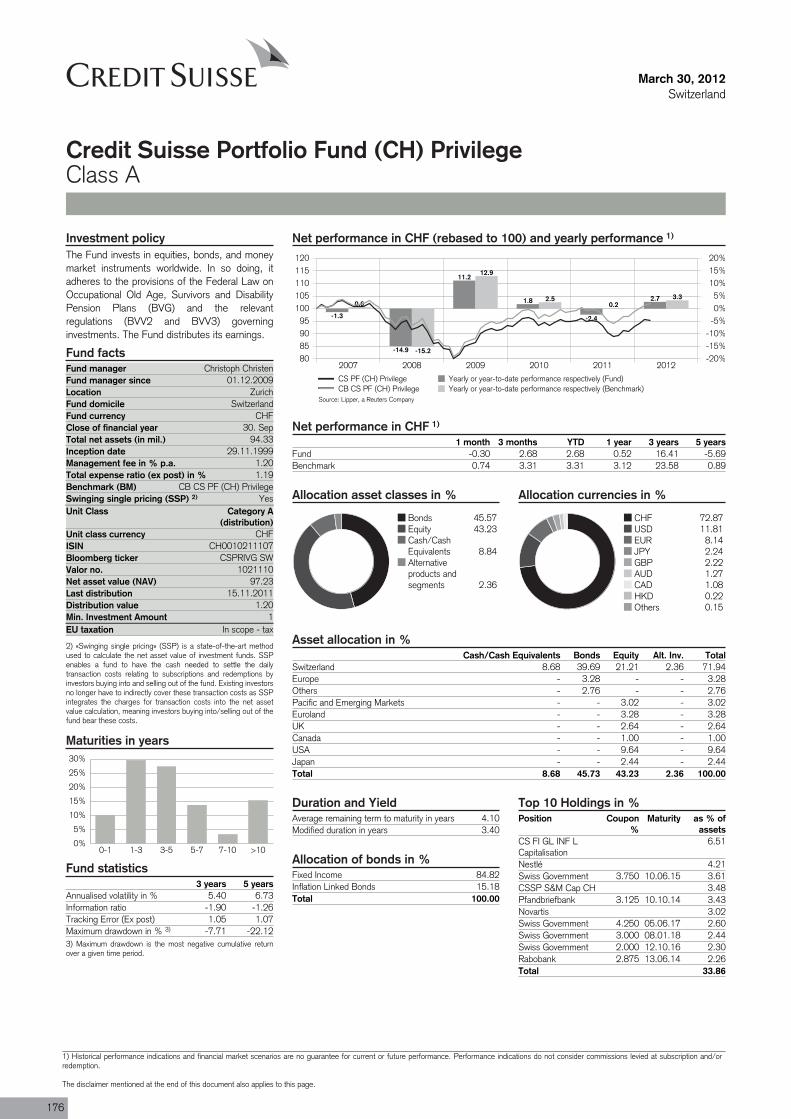
Fund manager Christoph ChristenFund manager since 01.12.2009Location ZurichFund domicile SwitzerlandFund currency CHFClose of financial year 30. SepTotal net assets (in mil.) 94.33Inception date 29.11.1999Management fee in % p.a. 1.20Total expense ratio (ex post) in % 1.19Benchmark (BM) CB CS PF (CH) PrivilegeSwinging single pricing (SSP) 2) YesUnit Class Category A
(distribution)
ISIN CH0010211107
Valor no. 1021110
Last distribution 15.11.2011Distribution value 1.20Min. Investment Amount 1EU taxation In scope - tax
March 30, 2012Switzerland
Credit Suisse Portfolio Fund (CH) PrivilegeClass A
Net performance in CHF (rebased to 100) and yearly performance 1)
2007 2008 2009 2010 2011 201280859095
100105110115120
-20%-15%-10%-5%0%5%
10%15%20%
-1.3
-14.9
11.2
1.8
-2.4
2.70.6
-15.2
12.9
2.50.2
3.3
CS PF (CH) Privilege Yearly or year-to-date performance respectively (Fund)CB CS PF (CH) Privilege Yearly or year-to-date performance respectively (Benchmark)
Net performance in CHF 1)
1 month 3 months YTD 1 year 3 years 5 yearsFund -0.30 2.68 2.68 0.52 16.41 -5.69Benchmark 0.74 3.31 3.31 3.12 23.58 0.89
Allocation asset classes in %
Bonds 45.57Equity 43.23Cash/CashEquivalents 8.84Alternativeproducts andsegments 2.36
Allocation currencies in %
CHF 72.87USD 11.81EUR 8.14JPY 2.24GBP 2.22AUD 1.27CAD 1.08HKD 0.22Others 0.15
Asset allocation in %Cash/Cash Equivalents Bonds Equity Alt. Inv. Total
Switzerland 8.68 39.69 21.21 2.36 71.94Europe - 3.28 - - 3.28Others - 2.76 - - 2.76Pacific and Emerging Markets - - 3.02 - 3.02Euroland - - 3.28 - 3.28UK - - 2.64 - 2.64Canada - - 1.00 - 1.00USA - - 9.64 - 9.64Japan - - 2.44 - 2.44Total 8.68 45.73 43.23 2.36 100.00
Investment policyThe Fund invests in equities, bonds, and moneymarket instruments worldwide. In so doing, itadheres to the provisions of the Federal Law onOccupational Old Age, Survivors and DisabilityPension Plans (BVG) and the relevantregulations (BVV2 and BVV3) governinginvestments. The Fund distributes its earnings.
Fund facts
Unit class currency CHF
Bloomberg ticker CSPRIVG SW
Net asset value (NAV) 97.23
2) «Swinging single pricing» (SSP) is a state-of-the-art methodused to calculate the net asset value of investment funds. SSPenables a fund to have the cash needed to settle the dailytransaction costs relating to subscriptions and redemptions byinvestors buying into and selling out of the fund. Existing investorsno longer have to indirectly cover these transaction costs as SSPintegrates the charges for transaction costs into the net assetvalue calculation, meaning investors buying into/selling out of thefund bear these costs.
Maturities in years
0%
5%
10%
15%
20%
25%
30%
0-1 1-3 3-5 5-7 7-10 >10
Fund statistics3 years 5 years
Annualised volatility in % 5.40 6.73Information ratio -1.90 -1.26Tracking Error (Ex post) 1.05 1.07Maximum drawdown in % 3) -7.71 -22.123) Maximum drawdown is the most negative cumulative returnover a given time period.
Duration and YieldAverage remaining term to maturity in years 4.10Modified duration in years 3.40
Allocation of bonds in %Fixed Income 84.82Inflation Linked Bonds 15.18Total 100.00
Top 10 Holdings in %Position Coupon
%Maturity as % of
assetsCS FI GL INF LCapitalisation
6.51
Nestlé 4.21Swiss Government 3.750 10.06.15 3.61CSSP S&M Cap CH 3.48Pfandbriefbank 3.125 10.10.14 3.43Novartis 3.02Swiss Government 4.250 05.06.17 2.60Swiss Government 3.000 08.01.18 2.44Swiss Government 2.000 12.10.16 2.30Rabobank 2.875 13.06.14 2.26Total 33.86
Source: Lipper, a Reuters Company
176
1) Historical performance indications and financial market scenarios are no guarantee for current or future performance. Performance indications do not consider commissions levied at subscription and/orredemption.
The disclaimer mentioned at the end of this document also applies to this page.

March 30, 2012Switzerland
Credit Suisse Portfolio Fund (CH) PrivilegeClass A
Review previous quarter 4)
The first quarter of 2012 was again marked bythe debt situation in the eurozone, albeit this timeon a rather positive note. Government bonds ofItaly and Spain recovered some of their losses,whereas the German, French and some otherbond markets stayed at their low levels. Thegeneral mood could be summarized as “risk on”.
Economic indicators were pointing to a slightacceleration in economic growth, but were stillrather soft. This moved commodity prices up,especially oil. Equity markets also saw an
uptrend in prices. In the currency markets thepeg in EUR/CHF set by the SNB in earlySeptember at 1.20 held. It seems that Japanhas taken a similar course as the SNB and as aconsequence the JPY weakened considerably.
The eurozone showed growth in Q4 2011 of-0.3%, which was in line with expectations andthe unemployment rate increased above 10%.Greece, Italy and Spain entered into recessionduring Q4, so growth rates for the eurozone willbe low in Q1 2012. In the US growth accelerated
to 3% in Q4. House prices stabilized at lowerlevels but new building is still lagging.
Switzerland showed lower GDP growth in Q4 of0.1%, due to the strong Swiss franc dampeningforeign demand. Private consumption is stillrobust, but seems to be losing momentum. Theunemployment rate is stabilizing at low levels.The CPI and PPI are lower than before, with theCPI turning negative y-o-y.
Outlook for the market 4)
At a global level the growth picture still lookssolid. This includes the intact growth trends inAsia. Accordingly, we believe the risk of globalrecession to be moderate, but existing, though
growth in the mature markets is likely to remainvery low. We expect to remain underweightedbonds as well as duration and favor some creditexposure. Equities for the time being are held
at a light overweight, with key overweights inemerging markets and the UK.
Portfolio ManagementChristoph Christen, Assistant Vice President, is Senior Portfolio Manager for Multi Asset Class Solutions in Asset Management. Aftercompleting his commercial banking apprenticeship at Credit Suisse in Zurich, he worked for Refco Inc. in foreign exchange trading. Since2007 he has been Co-Portfolio Manager for the CSA Mixta BVG Funds and the Credit Suisse Portfolio Funds Income, Balanced andGrowth. Since 2009 he has also been responsible for the Credit Suisse Portfolio Fund (CH) Privilege. Mr. Christen graduated as aneconomist SEBA. C
redi
t Sui
sse
Por
tfolio
Fun
d
4) If not expressly indicated otherwise, all quantitative data contained in this comment is based on Lipper, Bloomberg or Datastream.
177
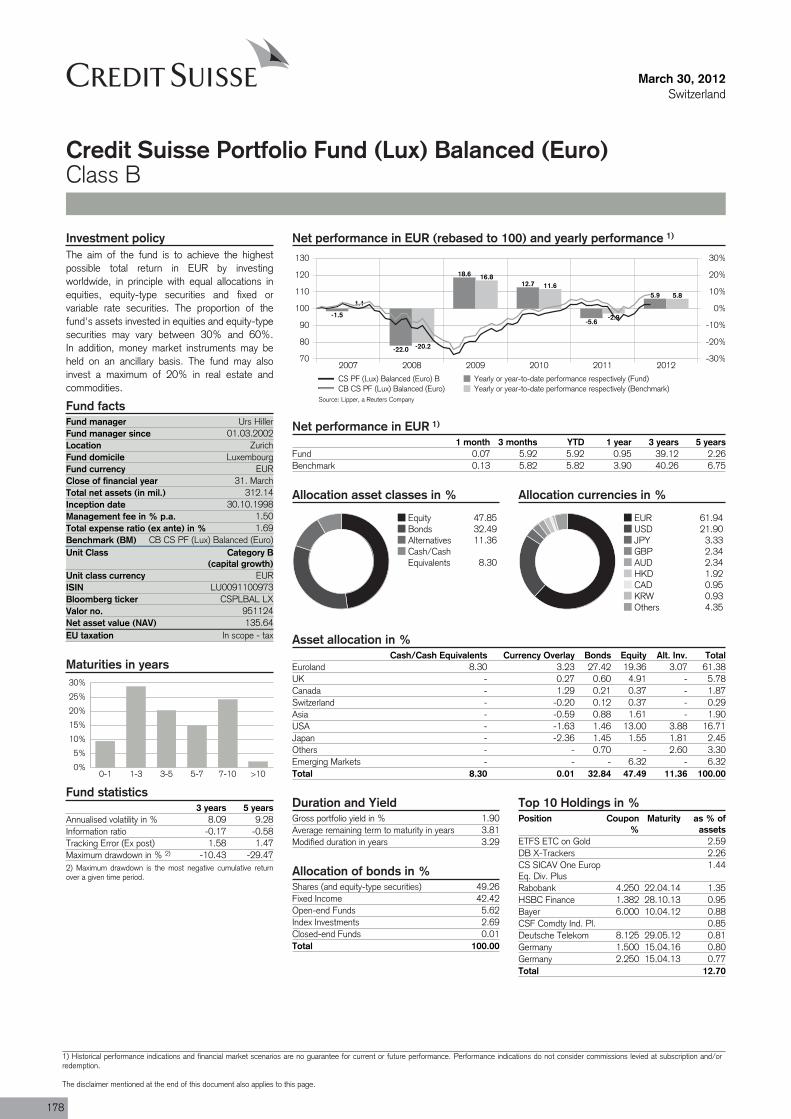
Fund manager Urs HillerFund manager since 01.03.2002Location ZurichFund domicile LuxembourgFund currency EURClose of financial year 31. MarchTotal net assets (in mil.) 312.14Inception date 30.10.1998Management fee in % p.a. 1.50Total expense ratio (ex ante) in % 1.69Benchmark (BM) CB CS PF (Lux) Balanced (Euro)Unit Class Category B
(capital growth)
ISIN LU0091100973
Valor no. 951124
EU taxation In scope - tax
March 30, 2012Switzerland
Credit Suisse Portfolio Fund (Lux) Balanced (Euro)Class B
Net performance in EUR (rebased to 100) and yearly performance 1)
2007 2008 2009 2010 2011 201270
80
90
100
110
120
130
-30%
-20%
-10%
0%
10%
20%
30%
-1.5
-22.0
18.612.7
-5.6
5.91.1
-20.2
16.811.6
-2.9
5.8
CS PF (Lux) Balanced (Euro) B Yearly or year-to-date performance respectively (Fund)CB CS PF (Lux) Balanced (Euro) Yearly or year-to-date performance respectively (Benchmark)
Net performance in EUR 1)
1 month 3 months YTD 1 year 3 years 5 yearsFund 0.07 5.92 5.92 0.95 39.12 2.26Benchmark 0.13 5.82 5.82 3.90 40.26 6.75
Allocation asset classes in %
Equity 47.85Bonds 32.49Alternatives 11.36Cash/CashEquivalents 8.30
Allocation currencies in %
EUR 61.94USD 21.90JPY 3.33GBP 2.34AUD 2.34HKD 1.92CAD 0.95KRW 0.93Others 4.35
Asset allocation in %Cash/Cash Equivalents Currency Overlay Bonds Equity Alt. Inv. Total
Euroland 8.30 3.23 27.42 19.36 3.07 61.38UK - 0.27 0.60 4.91 - 5.78Canada - 1.29 0.21 0.37 - 1.87Switzerland - -0.20 0.12 0.37 - 0.29Asia - -0.59 0.88 1.61 - 1.90USA - -1.63 1.46 13.00 3.88 16.71Japan - -2.36 1.45 1.55 1.81 2.45Others - - 0.70 - 2.60 3.30Emerging Markets - - - 6.32 - 6.32Total 8.30 0.01 32.84 47.49 11.36 100.00
Investment policyThe aim of the fund is to achieve the highestpossible total return in EUR by investingworldwide, in principle with equal allocations inequities, equity-type securities and fixed orvariable rate securities. The proportion of thefund's assets invested in equities and equity-typesecurities may vary between 30% and 60%.In addition, money market instruments may beheld on an ancillary basis. The fund may alsoinvest a maximum of 20% in real estate andcommodities.
Fund facts
Unit class currency EUR
Bloomberg ticker CSPLBAL LX
Net asset value (NAV) 135.64
Maturities in years
0%
5%
10%
15%
20%
25%
30%
0-1 1-3 3-5 5-7 7-10 >10
Fund statistics3 years 5 years
Annualised volatility in % 8.09 9.28Information ratio -0.17 -0.58Tracking Error (Ex post) 1.58 1.47Maximum drawdown in % 2) -10.43 -29.472) Maximum drawdown is the most negative cumulative returnover a given time period.
Duration and YieldGross portfolio yield in % 1.90Average remaining term to maturity in years 3.81Modified duration in years 3.29
Allocation of bonds in %Shares (and equity-type securities) 49.26Fixed Income 42.42Open-end Funds 5.62Index Investments 2.69Closed-end Funds 0.01Total 100.00
Top 10 Holdings in %Position Coupon
%Maturity as % of
assetsETFS ETC on Gold 2.59DB X-Trackers 2.26CS SICAV One EuropEq. Div. Plus
1.44
Rabobank 4.250 22.04.14 1.35HSBC Finance 1.382 28.10.13 0.95Bayer 6.000 10.04.12 0.88CSF Comdty Ind. Pl. 0.85Deutsche Telekom 8.125 29.05.12 0.81Germany 1.500 15.04.16 0.80Germany 2.250 15.04.13 0.77Total 12.70
Source: Lipper, a Reuters Company
178
1) Historical performance indications and financial market scenarios are no guarantee for current or future performance. Performance indications do not consider commissions levied at subscription and/orredemption.
The disclaimer mentioned at the end of this document also applies to this page.
March 30, 2012Switzerland
Credit Suisse Portfolio Fund (Lux) Balanced (Euro)Class B
Review previous quarter 3)
Newsflow on the economy in March was mostlygood. The employment report for January wasbetter than expected with a gain of 227,000 innon-farm payrolls (expectation was +210,000).The number for January was revised up to284,000 (was 243,000 before). Theunemployment rate was reported unchanged at8.3%. Consumer confidence gained to 70.8from 61.1 a month earlier. Initial jobless numberscame in at 354,200 and were lower than inFebruary (356,000). Capacity utilization washigher at 78.7% and durable goods orders wereup by 2.2%, after a drop of 4%. The ISMnon-manufacturing report came in higher at 57.3(was 56.8 before). The PPI report showed
inflation at a y-o-y base of +3.3% vs. 4.1%before. The Chicago Purchasing Manager Indexwas lower at 62.2 from 64 a month earlier. Oilprices were higher and traded in a rangebetween USD 120.97 to USD 128.40/barrel.
The ECB held interest rates at 1%. Theeurozone PPI at 3.7% y-o-y was lower (was4.3%). CPI at 2.7% y-o-y was unchanged. TheZEW survey was better at +11 from -8.1 amonth earlier. The unemployment rate in theeurozone was higher at 10.7%.
Equity market performance was mixed in March.The best market was the US (+4.05%), followed
by Japan (+3.70%) and Switzerland (+2.05%).The worst markets were Hong Kong (-5.18%),followed by emerging markets (-3.52%) and theUK (-1.75%).
Bond markets were mixed. The best marketswere the eurozone (+1.90%) and Australia(+0.85%), the worst markets were the UK(-1.40%) and the US (-0.73%). Commoditieswere down by 4.13%. Global real estate was upby 0.77%, while gold lost 1.68%. The JPY wasvery weak against all major currencies.
Outlook for the market 3)
We are slightly overweight in equities as an assetclass, with key overweights in emerging marketsand the UK. We are underweight the US andJapan and are strongly underweight in
Switzerland. Bonds overall are underweighted.We are slightly short duration in most markets.Global real estate is slightly overweight, while weare also overweight commodities (including gold).
As for currencies, we are practically neutral, withminimal over or underweights.
Portfolio ManagementMr Hiller graduated from the Business School of Zurich with a B.A. in Economics. He is a Certified EFFAS Financial Analyst. He joinedCredit Suisse Group in 1994 as a portfolio manager for Swiss Volksbank's Portfolio Funds. Since 1997 he has been a member of theCredit Suisse Portfolio Fund (Lux) management team.
Cre
dit S
uiss
e P
ortfo
lio F
und
3) If not expressly indicated otherwise, all quantitative data contained in this comment is based on Lipper, Bloomberg or Datastream.
179
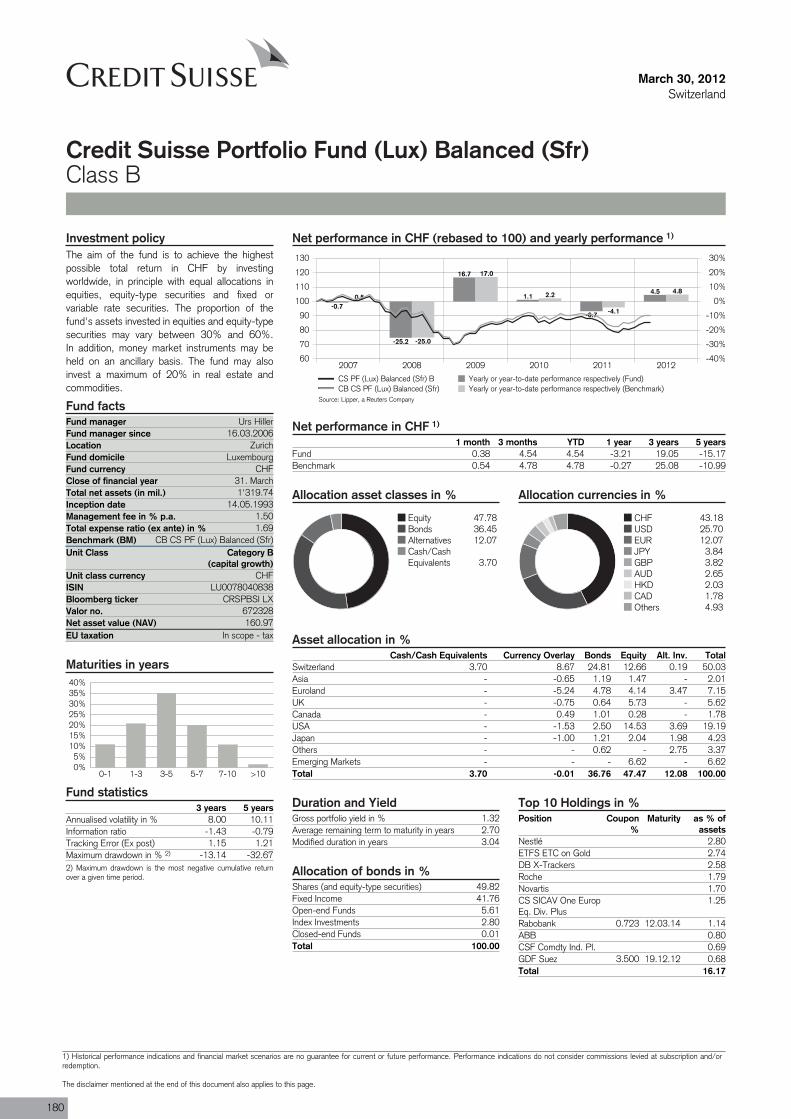
Fund manager Urs HillerFund manager since 16.03.2006Location ZurichFund domicile LuxembourgFund currency CHFClose of financial year 31. MarchTotal net assets (in mil.) 1'319.74Inception date 14.05.1993Management fee in % p.a. 1.50Total expense ratio (ex ante) in % 1.69Benchmark (BM) CB CS PF (Lux) Balanced (Sfr)Unit Class Category B
(capital growth)
ISIN LU0078040838
Valor no. 672328
EU taxation In scope - tax
March 30, 2012Switzerland
Credit Suisse Portfolio Fund (Lux) Balanced (Sfr)Class B
Net performance in CHF (rebased to 100) and yearly performance 1)
2007 2008 2009 2010 2011 201260
70
80
90
100
110
120
130
-40%
-30%
-20%
-10%
0%
10%
20%
30%
-0.7
-25.2
16.7
1.1
-6.7
4.50.5
-25.0
17.0
2.2
-4.1
4.8
CS PF (Lux) Balanced (Sfr) B Yearly or year-to-date performance respectively (Fund)CB CS PF (Lux) Balanced (Sfr) Yearly or year-to-date performance respectively (Benchmark)
Net performance in CHF 1)
1 month 3 months YTD 1 year 3 years 5 yearsFund 0.38 4.54 4.54 -3.21 19.05 -15.17Benchmark 0.54 4.78 4.78 -0.27 25.08 -10.99
Allocation asset classes in %
Equity 47.78Bonds 36.45Alternatives 12.07Cash/CashEquivalents 3.70
Allocation currencies in %
CHF 43.18USD 25.70EUR 12.07JPY 3.84GBP 3.82AUD 2.65HKD 2.03CAD 1.78Others 4.93
Asset allocation in %Cash/Cash Equivalents Currency Overlay Bonds Equity Alt. Inv. Total
Switzerland 3.70 8.67 24.81 12.66 0.19 50.03Asia - -0.65 1.19 1.47 - 2.01Euroland - -5.24 4.78 4.14 3.47 7.15UK - -0.75 0.64 5.73 - 5.62Canada - 0.49 1.01 0.28 - 1.78USA - -1.53 2.50 14.53 3.69 19.19Japan - -1.00 1.21 2.04 1.98 4.23Others - - 0.62 - 2.75 3.37Emerging Markets - - - 6.62 - 6.62Total 3.70 -0.01 36.76 47.47 12.08 100.00
Investment policyThe aim of the fund is to achieve the highestpossible total return in CHF by investingworldwide, in principle with equal allocations inequities, equity-type securities and fixed orvariable rate securities. The proportion of thefund's assets invested in equities and equity-typesecurities may vary between 30% and 60%.In addition, money market instruments may beheld on an ancillary basis. The fund may alsoinvest a maximum of 20% in real estate andcommodities.
Fund facts
Unit class currency CHF
Bloomberg ticker CRSPBSI LX
Net asset value (NAV) 160.97
Maturities in years
0%5%
10%15%20%25%30%35%40%
0-1 1-3 3-5 5-7 7-10 >10
Fund statistics3 years 5 years
Annualised volatility in % 8.00 10.11Information ratio -1.43 -0.79Tracking Error (Ex post) 1.15 1.21Maximum drawdown in % 2) -13.14 -32.672) Maximum drawdown is the most negative cumulative returnover a given time period.
Duration and YieldGross portfolio yield in % 1.32Average remaining term to maturity in years 2.70Modified duration in years 3.04
Allocation of bonds in %Shares (and equity-type securities) 49.82Fixed Income 41.76Open-end Funds 5.61Index Investments 2.80Closed-end Funds 0.01Total 100.00
Top 10 Holdings in %Position Coupon
%Maturity as % of
assetsNestlé 2.80ETFS ETC on Gold 2.74DB X-Trackers 2.58Roche 1.79Novartis 1.70CS SICAV One EuropEq. Div. Plus
1.25
Rabobank 0.723 12.03.14 1.14ABB 0.80CSF Comdty Ind. Pl. 0.69GDF Suez 3.500 19.12.12 0.68Total 16.17
Source: Lipper, a Reuters Company
180
1) Historical performance indications and financial market scenarios are no guarantee for current or future performance. Performance indications do not consider commissions levied at subscription and/orredemption.
The disclaimer mentioned at the end of this document also applies to this page.
March 30, 2012Switzerland
Credit Suisse Portfolio Fund (Lux) Balanced (Sfr)Class B
Review previous quarter 3)
Newsflow on the economy in March was mostlygood. The employment report for January wasbetter than expected with a gain of 227,000 innon-farm payrolls (expectation was +210,000).The number for January was revised up to284,000 (was 243,000 before). Theunemployment rate was reported unchanged at8.3%. Consumer confidence gained to 70.8from 61.1 a month earlier. Initial jobless numberscame in at 354,200 and were lower than inFebruary (356,000). Capacity utilization washigher at 78.7% and durable goods orders wereup by 2.2%, after a drop of 4%. The ISMnon-manufacturing report came in higher at 57.3
(was 56.8 before). The PPI report showedinflation at a y-o-y base of +3.3% vs. 4.1%before. The Chicago Purchasing Manager Indexwas lower at 62.2 from 64 a month earlier. Oilprices were higher and traded in a rangebetween USD 120.97 to USD 128.40/barrel.
The ECB held interest rates at 1%. Theeurozone PPI at 3.7% y-o-y was lower (was4.3%). CPI at 2.7% y-o-y was unchanged. TheZEW survey was better at +11 from -8.1 amonth earlier. The unemployment rate in theeurozone was higher at 10.7%.
Equity market performance was mixed in March.The best market was the US (+4.05%), followedby Japan (+3.70%) and Switzerland (+2.05%).The worst markets were Hong Kong (-5.18%),followed by emerging markets (-3.52%) and theUK (-1.75%).
Bond markets were mixed. The best marketswere the eurozone (+1.90%) and Australia(+0.85%), the worst markets were the UK(-1.40%) and the US (-0.73%). Commoditieswere down by 4.13%. Global real estate was upby 0.77%, while gold lost 1.68%. The JPY wasvery weak against all major currencies.
Outlook for the market 3)
We are slightly overweight in equities as an assetclass, with key overweights in emerging marketsand the UK. We are underweight the US andJapan and are strongly underweight in
Switzerland. Bonds overall are underweighted.We are slightly short duration in most markets.Global real estate is slightly overweight, while weare also overweight commodities (including gold).
As for currencies, we are practically neutral, withminimal over or underweights.
Portfolio ManagementMr Hiller graduated from the Business School of Zurich with a B.A. in Economics. He is a Certified EFFAS Financial Analyst. He joinedCredit Suisse Group in 1994 as a portfolio manager for Swiss Volksbank's Portfolio Funds. Since 1997 he has been a member of theCredit Suisse Portfolio Fund (Lux) management team. C
redi
t Sui
sse
Por
tfolio
Fun
d
3) If not expressly indicated otherwise, all quantitative data contained in this comment is based on Lipper, Bloomberg or Datastream.
181
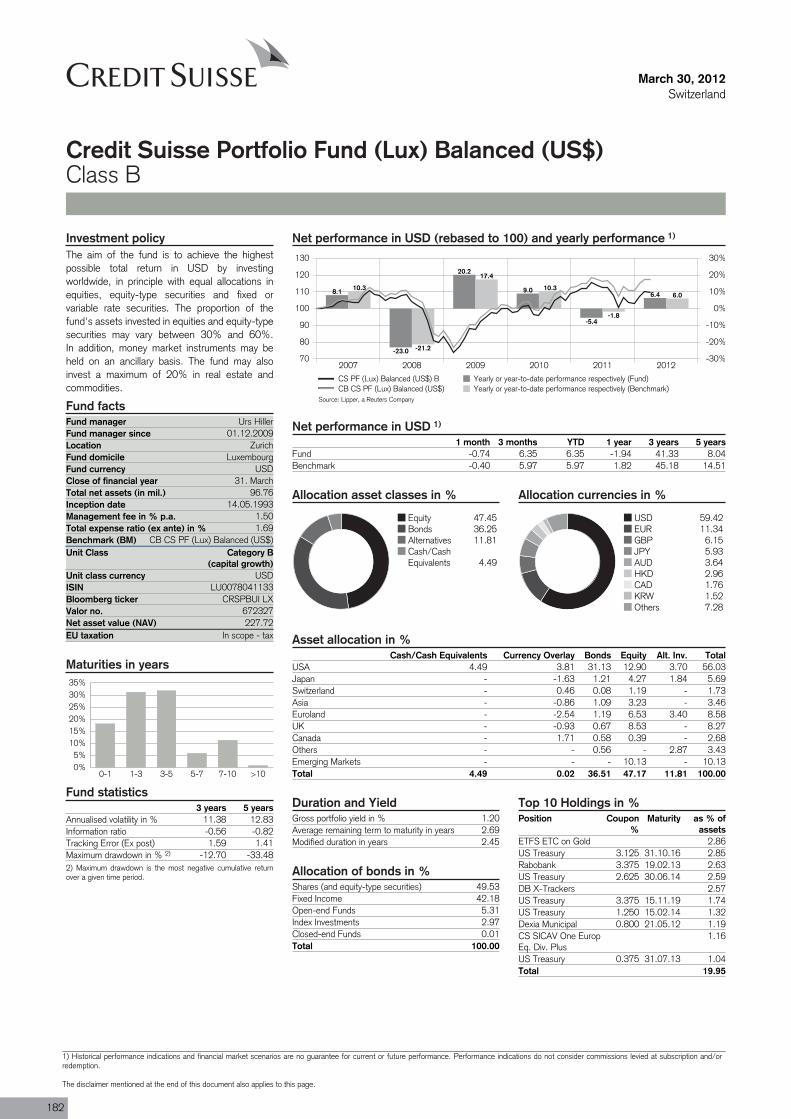
Fund manager Urs HillerFund manager since 01.12.2009Location ZurichFund domicile LuxembourgFund currency USDClose of financial year 31. MarchTotal net assets (in mil.) 96.76Inception date 14.05.1993Management fee in % p.a. 1.50Total expense ratio (ex ante) in % 1.69Benchmark (BM) CB CS PF (Lux) Balanced (US$)Unit Class Category B
(capital growth)
ISIN LU0078041133
Valor no. 672327
EU taxation In scope - tax
March 30, 2012Switzerland
Credit Suisse Portfolio Fund (Lux) Balanced (US$)Class B
Net performance in USD (rebased to 100) and yearly performance 1)
2007 2008 2009 2010 2011 201270
80
90
100
110
120
130
-30%
-20%
-10%
0%
10%
20%
30%
8.1
-23.0
20.2
9.0
-5.4
6.410.3
-21.2
17.4
10.3
-1.8
6.0
CS PF (Lux) Balanced (US$) B Yearly or year-to-date performance respectively (Fund)CB CS PF (Lux) Balanced (US$) Yearly or year-to-date performance respectively (Benchmark)
Net performance in USD 1)
1 month 3 months YTD 1 year 3 years 5 yearsFund -0.74 6.35 6.35 -1.94 41.33 8.04Benchmark -0.40 5.97 5.97 1.82 45.18 14.51
Allocation asset classes in %
Equity 47.45Bonds 36.25Alternatives 11.81Cash/CashEquivalents 4.49
Allocation currencies in %
USD 59.42EUR 11.34GBP 6.15JPY 5.93AUD 3.64HKD 2.96CAD 1.76KRW 1.52Others 7.28
Asset allocation in %Cash/Cash Equivalents Currency Overlay Bonds Equity Alt. Inv. Total
USA 4.49 3.81 31.13 12.90 3.70 56.03Japan - -1.63 1.21 4.27 1.84 5.69Switzerland - 0.46 0.08 1.19 - 1.73Asia - -0.86 1.09 3.23 - 3.46Euroland - -2.54 1.19 6.53 3.40 8.58UK - -0.93 0.67 8.53 - 8.27Canada - 1.71 0.58 0.39 - 2.68Others - - 0.56 - 2.87 3.43Emerging Markets - - - 10.13 - 10.13Total 4.49 0.02 36.51 47.17 11.81 100.00
Investment policyThe aim of the fund is to achieve the highestpossible total return in USD by investingworldwide, in principle with equal allocations inequities, equity-type securities and fixed orvariable rate securities. The proportion of thefund's assets invested in equities and equity-typesecurities may vary between 30% and 60%.In addition, money market instruments may beheld on an ancillary basis. The fund may alsoinvest a maximum of 20% in real estate andcommodities.
Fund facts
Unit class currency USD
Bloomberg ticker CRSPBUI LX
Net asset value (NAV) 227.72
Maturities in years
0%5%
10%15%20%25%30%35%
0-1 1-3 3-5 5-7 7-10 >10
Fund statistics3 years 5 years
Annualised volatility in % 11.38 12.83Information ratio -0.56 -0.82Tracking Error (Ex post) 1.59 1.41Maximum drawdown in % 2) -12.70 -33.482) Maximum drawdown is the most negative cumulative returnover a given time period.
Duration and YieldGross portfolio yield in % 1.20Average remaining term to maturity in years 2.69Modified duration in years 2.45
Allocation of bonds in %Shares (and equity-type securities) 49.53Fixed Income 42.18Open-end Funds 5.31Index Investments 2.97Closed-end Funds 0.01Total 100.00
Top 10 Holdings in %Position Coupon
%Maturity as % of
assetsETFS ETC on Gold 2.86US Treasury 3.125 31.10.16 2.85Rabobank 3.375 19.02.13 2.63US Treasury 2.625 30.06.14 2.59DB X-Trackers 2.57US Treasury 3.375 15.11.19 1.74US Treasury 1.250 15.02.14 1.32Dexia Municipal 0.800 21.05.12 1.19CS SICAV One EuropEq. Div. Plus
1.16
US Treasury 0.375 31.07.13 1.04Total 19.95
Source: Lipper, a Reuters Company
182
1) Historical performance indications and financial market scenarios are no guarantee for current or future performance. Performance indications do not consider commissions levied at subscription and/orredemption.
The disclaimer mentioned at the end of this document also applies to this page.

March 30, 2012Switzerland
Credit Suisse Portfolio Fund (Lux) Balanced (US$)Class B
Review previous quarter 3)
Newsflow on the economy in March was mostlygood. The employment report for January wasbetter than expected with a gain of 227,000 innon-farm payrolls (expectation was +210,000).The number for January was revised up to284,000 (was 243,000 before). Theunemployment rate was reported unchanged at8.3%. Consumer confidence gained to 70.8from 61.1 a month earlier. Initial jobless numberscame in at 354,200 and were lower than inFebruary (356,000). Capacity utilization washigher at 78.7% and durable goods orders wereup by 2.2%, after a drop of 4%. The ISMnon-manufacturing report came in higher at 57.3
(was 56.8 before). The PPI report showedinflation at a y-o-y base of +3.3% vs. 4.1%before. The Chicago Purchasing Manager Indexwas lower at 62.2 from 64 a month earlier. Oilprices were higher and traded in a rangebetween USD 120.97 to USD 128.40/barrel.
The ECB held interest rates at 1%. Theeurozone PPI at 3.7% y-o-y was lower (was4.3%). CPI at 2.7% y-o-y was unchanged. TheZEW survey was better at +11 from -8.1 amonth earlier. The unemployment rate in theeurozone was higher at 10.7%.
Equity market performance was mixed in March.The best market was the US (+4.05%), followedby Japan (+3.70%) and Switzerland (+2.05%).The worst markets were Hong Kong (-5.18%),followed by emerging markets (-3.52%) and theUK (-1.75%).
Bond markets were mixed. The best marketswere the eurozone (+1.90%) and Australia(+0.85%), the worst markets were the UK(-1.40%) and the US (-0.73%). Commoditieswere down by 4.13%. Global real estate was upby 0.77%, while gold lost 1.68%. The JPY wasvery weak against all major currencies.
Outlook for the market 3)
We are slightly overweight in equities as an assetclass, with key overweights in emerging marketsand the UK. We are underweight the US andJapan and are strongly underweight in
Switzerland. Bonds overall are underweighted.We are slightly short duration in most markets.Global real estate is slightly overweight, while weare also overweight commodities (including gold).
As for currencies, we are practically neutral, withminimal over or underweights.
Portfolio ManagementMr Hiller graduated from the Business School of Zurich with a B.A. in Economics. He is a Certified EFFAS Financial Analyst. He joinedCredit Suisse Group in 1994 as a portfolio manager for Swiss Volksbank's Portfolio Funds. Since 1997 he has been a member of theCredit Suisse Portfolio Fund (Lux) management team. C
redi
t Sui
sse
Por
tfolio
Fun
d
3) If not expressly indicated otherwise, all quantitative data contained in this comment is based on Lipper, Bloomberg or Datastream.
183
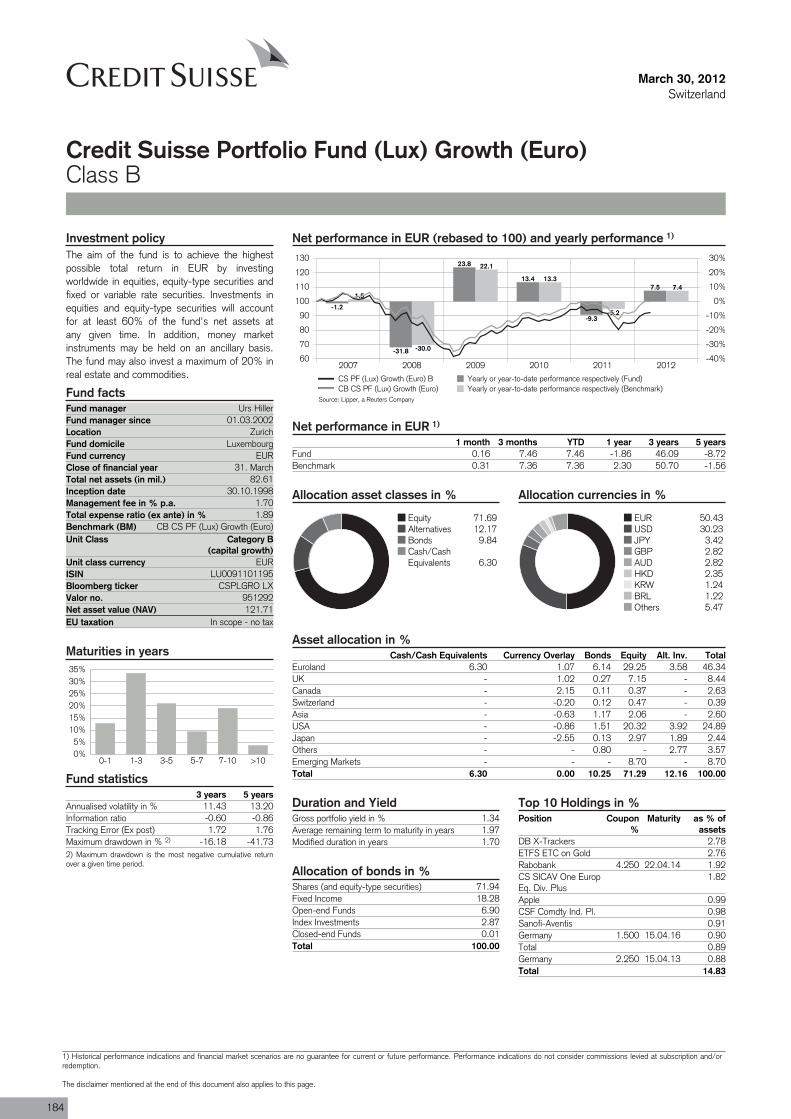
Fund manager Urs HillerFund manager since 01.03.2002Location ZurichFund domicile LuxembourgFund currency EURClose of financial year 31. MarchTotal net assets (in mil.) 82.61Inception date 30.10.1998Management fee in % p.a. 1.70Total expense ratio (ex ante) in % 1.89Benchmark (BM) CB CS PF (Lux) Growth (Euro)Unit Class Category B
(capital growth)
ISIN LU0091101195
Valor no. 951292
EU taxation In scope - no tax
March 30, 2012Switzerland
Credit Suisse Portfolio Fund (Lux) Growth (Euro)Class B
Net performance in EUR (rebased to 100) and yearly performance 1)
2007 2008 2009 2010 2011 201260
70
80
90
100
110
120
130
-40%
-30%
-20%
-10%
0%
10%
20%
30%
-1.2
-31.8
23.8
13.4
-9.3
7.51.5
-30.0
22.1
13.3
-5.2
7.4
CS PF (Lux) Growth (Euro) B Yearly or year-to-date performance respectively (Fund)CB CS PF (Lux) Growth (Euro) Yearly or year-to-date performance respectively (Benchmark)
Net performance in EUR 1)
1 month 3 months YTD 1 year 3 years 5 yearsFund 0.16 7.46 7.46 -1.86 46.09 -8.72Benchmark 0.31 7.36 7.36 2.30 50.70 -1.56
Allocation asset classes in %
Equity 71.69Alternatives 12.17Bonds 9.84Cash/CashEquivalents 6.30
Allocation currencies in %
EUR 50.43USD 30.23JPY 3.42GBP 2.82AUD 2.82HKD 2.35KRW 1.24BRL 1.22Others 5.47
Asset allocation in %Cash/Cash Equivalents Currency Overlay Bonds Equity Alt. Inv. Total
Euroland 6.30 1.07 6.14 29.25 3.58 46.34UK - 1.02 0.27 7.15 - 8.44Canada - 2.15 0.11 0.37 - 2.63Switzerland - -0.20 0.12 0.47 - 0.39Asia - -0.63 1.17 2.06 - 2.60USA - -0.86 1.51 20.32 3.92 24.89Japan - -2.55 0.13 2.97 1.89 2.44Others - - 0.80 - 2.77 3.57Emerging Markets - - - 8.70 - 8.70Total 6.30 0.00 10.25 71.29 12.16 100.00
Investment policyThe aim of the fund is to achieve the highestpossible total return in EUR by investingworldwide in equities, equity-type securities andfixed or variable rate securities. Investments inequities and equity-type securities will accountfor at least 60% of the fund's net assets atany given time. In addition, money marketinstruments may be held on an ancillary basis.The fund may also invest a maximum of 20% inreal estate and commodities.
Fund facts
Unit class currency EUR
Bloomberg ticker CSPLGRO LX
Net asset value (NAV) 121.71
Maturities in years
0%5%
10%15%20%25%30%35%
0-1 1-3 3-5 5-7 7-10 >10
Fund statistics3 years 5 years
Annualised volatility in % 11.43 13.20Information ratio -0.60 -0.86Tracking Error (Ex post) 1.72 1.76Maximum drawdown in % 2) -16.18 -41.732) Maximum drawdown is the most negative cumulative returnover a given time period.
Duration and YieldGross portfolio yield in % 1.34Average remaining term to maturity in years 1.97Modified duration in years 1.70
Allocation of bonds in %Shares (and equity-type securities) 71.94Fixed Income 18.28Open-end Funds 6.90Index Investments 2.87Closed-end Funds 0.01Total 100.00
Top 10 Holdings in %Position Coupon
%Maturity as % of
assetsDB X-Trackers 2.78ETFS ETC on Gold 2.76Rabobank 4.250 22.04.14 1.92CS SICAV One EuropEq. Div. Plus
1.82
Apple 0.99CSF Comdty Ind. Pl. 0.98Sanofi-Aventis 0.91Germany 1.500 15.04.16 0.90Total 0.89Germany 2.250 15.04.13 0.88Total 14.83
Source: Lipper, a Reuters Company
184
1) Historical performance indications and financial market scenarios are no guarantee for current or future performance. Performance indications do not consider commissions levied at subscription and/orredemption.
The disclaimer mentioned at the end of this document also applies to this page.

March 30, 2012Switzerland
Credit Suisse Portfolio Fund (Lux) Growth (Euro)Class B
Review previous quarter 3)
Newsflow on the economy in March was mostlygood. The employment report for January wasbetter than expected with a gain of 227,000 innon-farm payrolls (expectation was +210,000).The number for January was revised up to284,000 (was 243,000 before). Theunemployment rate was reported unchanged at8.3%. Consumer confidence gained to 70.8from 61.1 a month earlier. Initial jobless numberscame in at 354,200 and were lower than inFebruary (356,000). Capacity utilization washigher at 78.7% and durable goods orders wereup by 2.2%, after a drop of 4%. The ISMnon-manufacturing report came in higher at 57.3
(was 56.8 before). The PPI report showedinflation at a y-o-y base of +3.3% vs. 4.1%before. The Chicago Purchasing Manager Indexwas lower at 62.2 from 64 a month earlier. Oilprices were higher and traded in a rangebetween USD 120.97 to USD 128.40/barrel.
The ECB held interest rates at 1%. Theeurozone PPI at 3.7% y-o-y was lower (was4.3%). CPI at 2.7% y-o-y was unchanged. TheZEW survey was better at +11 from -8.1 amonth earlier. The unemployment rate in theeurozone was higher at 10.7%.
Equity market performance was mixed in March.The best market was the US (+4.05%), followedby Japan (+3.70%) and Switzerland (+2.05%).The worst markets were Hong Kong (-5.18%),followed by emerging markets (-3.52%) and theUK (-1.75%).
Bond markets were mixed. The best marketswere the eurozone (+1.90%) and Australia(+0.85%), the worst markets were the UK(-1.40%) and the US (-0.73%). Commoditieswere down by 4.13%. Global real estate was upby 0.77%, while gold lost 1.68%. The JPY wasvery weak against all major currencies.
Outlook for the market 3)
We are slightly overweight in equities as an assetclass, with key overweights in emerging marketsand the UK. We are underweight the US andJapan and are strongly underweight in
Switzerland. Bonds overall are underweighted.We are slightly short duration in most markets.Global real estate is slightly overweight, while weare also overweight commodities (including gold).
As for currencies, we are practically neutral, withminimal over or underweights.
Portfolio ManagementMr Hiller graduated from the Business School of Zurich with a B.A. in Economics. He is a Certified EFFAS Financial Analyst. He joinedCredit Suisse Group in 1994 as a portfolio manager for Swiss Volksbank's Portfolio Funds. Since 1997 he has been a member of theCredit Suisse Portfolio Fund (Lux) management team. C
redi
t Sui
sse
Por
tfolio
Fun
d
3) If not expressly indicated otherwise, all quantitative data contained in this comment is based on Lipper, Bloomberg or Datastream.
185
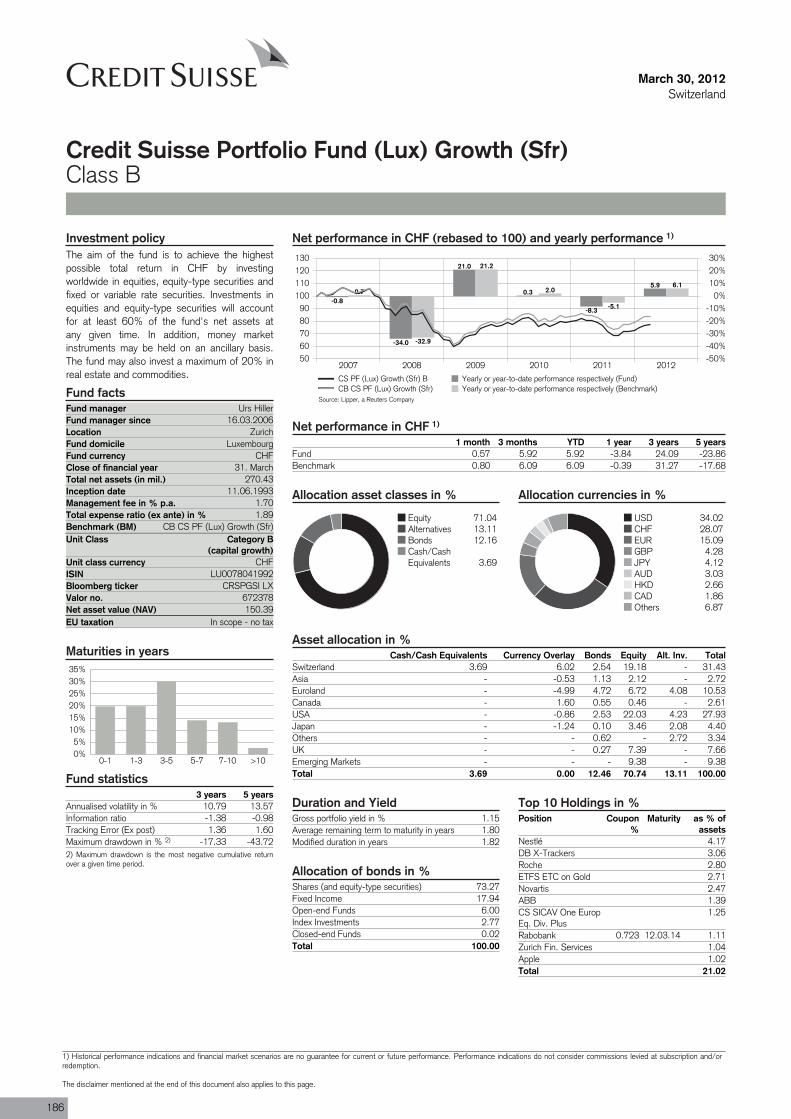
Fund manager Urs HillerFund manager since 16.03.2006Location ZurichFund domicile LuxembourgFund currency CHFClose of financial year 31. MarchTotal net assets (in mil.) 270.43Inception date 11.06.1993Management fee in % p.a. 1.70Total expense ratio (ex ante) in % 1.89Benchmark (BM) CB CS PF (Lux) Growth (Sfr)Unit Class Category B
(capital growth)
ISIN LU0078041992
Valor no. 672378
EU taxation In scope - no tax
March 30, 2012Switzerland
Credit Suisse Portfolio Fund (Lux) Growth (Sfr)Class B
Net performance in CHF (rebased to 100) and yearly performance 1)
2007 2008 2009 2010 2011 20125060708090
100110120130
-50%-40%-30%-20%-10%
0%10%20%30%
-0.8
-34.0
21.0
0.3
-8.3
5.90.7
-32.9
21.2
2.0
-5.1
6.1
CS PF (Lux) Growth (Sfr) B Yearly or year-to-date performance respectively (Fund)CB CS PF (Lux) Growth (Sfr) Yearly or year-to-date performance respectively (Benchmark)
Net performance in CHF 1)
1 month 3 months YTD 1 year 3 years 5 yearsFund 0.57 5.92 5.92 -3.84 24.09 -23.86Benchmark 0.80 6.09 6.09 -0.39 31.27 -17.68
Allocation asset classes in %
Equity 71.04Alternatives 13.11Bonds 12.16Cash/CashEquivalents 3.69
Allocation currencies in %
USD 34.02CHF 28.07EUR 15.09GBP 4.28JPY 4.12AUD 3.03HKD 2.66CAD 1.86Others 6.87
Asset allocation in %Cash/Cash Equivalents Currency Overlay Bonds Equity Alt. Inv. Total
Switzerland 3.69 6.02 2.54 19.18 - 31.43Asia - -0.53 1.13 2.12 - 2.72Euroland - -4.99 4.72 6.72 4.08 10.53Canada - 1.60 0.55 0.46 - 2.61USA - -0.86 2.53 22.03 4.23 27.93Japan - -1.24 0.10 3.46 2.08 4.40Others - - 0.62 - 2.72 3.34UK - - 0.27 7.39 - 7.66Emerging Markets - - - 9.38 - 9.38Total 3.69 0.00 12.46 70.74 13.11 100.00
Investment policyThe aim of the fund is to achieve the highestpossible total return in CHF by investingworldwide in equities, equity-type securities andfixed or variable rate securities. Investments inequities and equity-type securities will accountfor at least 60% of the fund's net assets atany given time. In addition, money marketinstruments may be held on an ancillary basis.The fund may also invest a maximum of 20% inreal estate and commodities.
Fund facts
Unit class currency CHF
Bloomberg ticker CRSPGSI LX
Net asset value (NAV) 150.39
Maturities in years
0%5%
10%15%20%25%30%35%
0-1 1-3 3-5 5-7 7-10 >10
Fund statistics3 years 5 years
Annualised volatility in % 10.79 13.57Information ratio -1.38 -0.98Tracking Error (Ex post) 1.36 1.60Maximum drawdown in % 2) -17.33 -43.722) Maximum drawdown is the most negative cumulative returnover a given time period.
Duration and YieldGross portfolio yield in % 1.15Average remaining term to maturity in years 1.80Modified duration in years 1.82
Allocation of bonds in %Shares (and equity-type securities) 73.27Fixed Income 17.94Open-end Funds 6.00Index Investments 2.77Closed-end Funds 0.02Total 100.00
Top 10 Holdings in %Position Coupon
%Maturity as % of
assetsNestlé 4.17DB X-Trackers 3.06Roche 2.80ETFS ETC on Gold 2.71Novartis 2.47ABB 1.39CS SICAV One EuropEq. Div. Plus
1.25
Rabobank 0.723 12.03.14 1.11Zurich Fin. Services 1.04Apple 1.02Total 21.02
Source: Lipper, a Reuters Company
186
1) Historical performance indications and financial market scenarios are no guarantee for current or future performance. Performance indications do not consider commissions levied at subscription and/orredemption.
The disclaimer mentioned at the end of this document also applies to this page.
March 30, 2012Switzerland
Credit Suisse Portfolio Fund (Lux) Growth (Sfr)Class B
Review previous quarter 3)
Newsflow on the economy in March was mostlygood. The employment report for January wasbetter than expected with a gain of 227,000 innon-farm payrolls (expectation was +210,000).The number for January was revised up to284,000 (was 243,000 before). Theunemployment rate was reported unchanged at8.3%. Consumer confidence gained to 70.8from 61.1 a month earlier. Initial jobless numberscame in at 354,200 and were lower than inFebruary (356,000). Capacity utilization washigher at 78.7% and durable goods orders wereup by 2.2%, after a drop of 4%. The ISMnon-manufacturing report came in higher at 57.3
(was 56.8 before). The PPI report showedinflation at a y-o-y base of +3.3% vs. 4.1%before. The Chicago Purchasing Manager Indexwas lower at 62.2 from 64 a month earlier. Oilprices were higher and traded in a rangebetween USD 120.97 to USD 128.40/barrel.
The ECB held interest rates at 1%. Theeurozone PPI at 3.7% y-o-y was lower (was4.3%). CPI at 2.7% y-o-y was unchanged. TheZEW survey was better at +11 from -8.1 amonth earlier. The unemployment rate in theeurozone was higher at 10.7%.
Equity market performance was mixed in March.The best market was the US (+4.05%), followedby Japan (+3.70%) and Switzerland (+2.05%).The worst markets were Hong Kong (-5.18%),followed by emerging markets (-3.52%) and theUK (-1.75%).
Bond markets were mixed. The best marketswere the eurozone (+1.90%) and Australia(+0.85%), the worst markets were the UK(-1.40%) and the US (-0.73%). Commoditieswere down by 4.13%. Global real estate was upby 0.77%, while gold lost 1.68%. The JPY wasvery weak against all major currencies.
Outlook for the market 3)
We are slightly overweight in equities as an assetclass, with key overweights in emerging marketsand the UK. We are underweight the US andJapan and are strongly underweight in
Switzerland. Bonds overall are underweighted.We are slightly short duration in most markets.Global real estate is slightly overweight, while weare also overweight commodities (including gold).
As for currencies, we are practically neutral, withminimal over or underweights.
Portfolio ManagementMr Hiller graduated from the Business School of Zurich with a B.A. in Economics. He is a Certified EFFAS Financial Analyst. He joinedCredit Suisse Group in 1994 as a portfolio manager for Swiss Volksbank's Portfolio Funds. Since 1997 he has been a member of theCredit Suisse Portfolio Fund (Lux) management team. C
redi
t Sui
sse
Por
tfolio
Fun
d
3) If not expressly indicated otherwise, all quantitative data contained in this comment is based on Lipper, Bloomberg or Datastream.
187
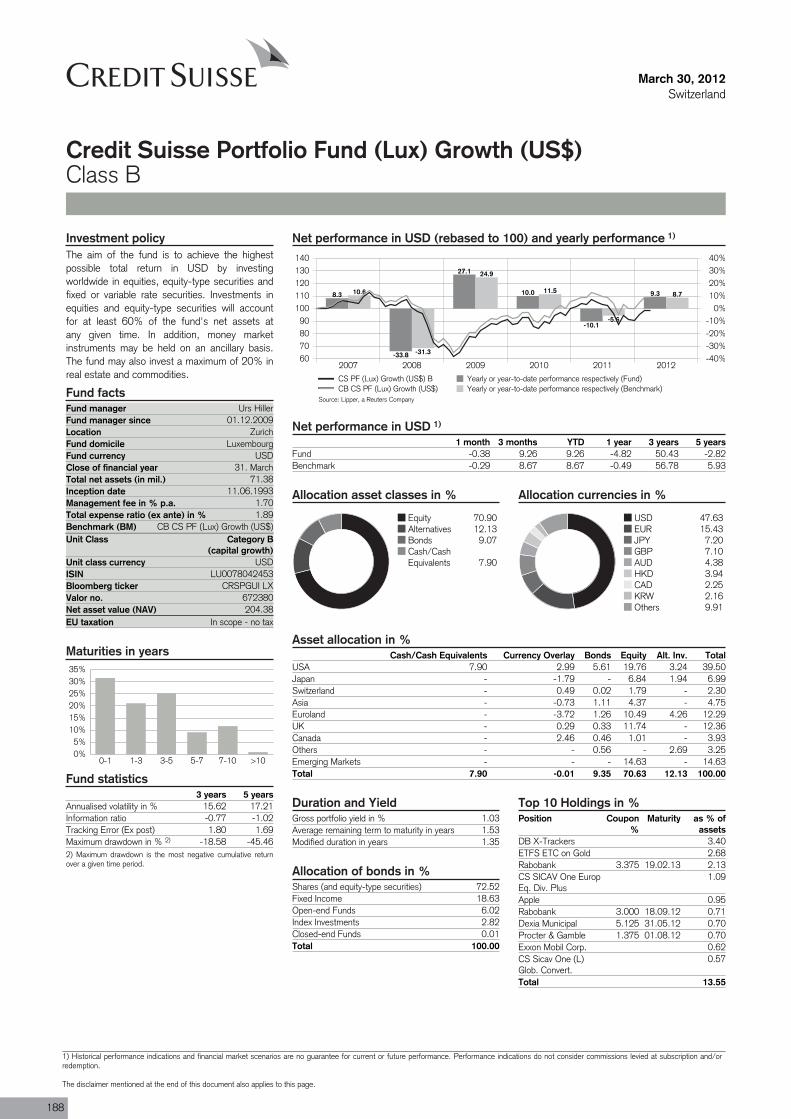
Fund manager Urs HillerFund manager since 01.12.2009Location ZurichFund domicile LuxembourgFund currency USDClose of financial year 31. MarchTotal net assets (in mil.) 71.38Inception date 11.06.1993Management fee in % p.a. 1.70Total expense ratio (ex ante) in % 1.89Benchmark (BM) CB CS PF (Lux) Growth (US$)Unit Class Category B
(capital growth)
ISIN LU0078042453
Valor no. 672380
EU taxation In scope - no tax
March 30, 2012Switzerland
Credit Suisse Portfolio Fund (Lux) Growth (US$)Class B
Net performance in USD (rebased to 100) and yearly performance 1)
2007 2008 2009 2010 2011 201260708090
100110120130140
-40%-30%-20%-10%
0%10%20%30%40%
8.3
-33.8
27.1
10.0
-10.1
9.310.6
-31.3
24.9
11.5
-5.6
8.7
CS PF (Lux) Growth (US$) B Yearly or year-to-date performance respectively (Fund)CB CS PF (Lux) Growth (US$) Yearly or year-to-date performance respectively (Benchmark)
Net performance in USD 1)
1 month 3 months YTD 1 year 3 years 5 yearsFund -0.38 9.26 9.26 -4.82 50.43 -2.82Benchmark -0.29 8.67 8.67 -0.49 56.78 5.93
Allocation asset classes in %
Equity 70.90Alternatives 12.13Bonds 9.07Cash/CashEquivalents 7.90
Allocation currencies in %
USD 47.63EUR 15.43JPY 7.20GBP 7.10AUD 4.38HKD 3.94CAD 2.25KRW 2.16Others 9.91
Asset allocation in %Cash/Cash Equivalents Currency Overlay Bonds Equity Alt. Inv. Total
USA 7.90 2.99 5.61 19.76 3.24 39.50Japan - -1.79 - 6.84 1.94 6.99Switzerland - 0.49 0.02 1.79 - 2.30Asia - -0.73 1.11 4.37 - 4.75Euroland - -3.72 1.26 10.49 4.26 12.29UK - 0.29 0.33 11.74 - 12.36Canada - 2.46 0.46 1.01 - 3.93Others - - 0.56 - 2.69 3.25Emerging Markets - - - 14.63 - 14.63Total 7.90 -0.01 9.35 70.63 12.13 100.00
Investment policyThe aim of the fund is to achieve the highestpossible total return in USD by investingworldwide in equities, equity-type securities andfixed or variable rate securities. Investments inequities and equity-type securities will accountfor at least 60% of the fund's net assets atany given time. In addition, money marketinstruments may be held on an ancillary basis.The fund may also invest a maximum of 20% inreal estate and commodities.
Fund facts
Unit class currency USD
Bloomberg ticker CRSPGUI LX
Net asset value (NAV) 204.38
Maturities in years
0%5%
10%15%20%25%30%35%
0-1 1-3 3-5 5-7 7-10 >10
Fund statistics3 years 5 years
Annualised volatility in % 15.62 17.21Information ratio -0.77 -1.02Tracking Error (Ex post) 1.80 1.69Maximum drawdown in % 2) -18.58 -45.462) Maximum drawdown is the most negative cumulative returnover a given time period.
Duration and YieldGross portfolio yield in % 1.03Average remaining term to maturity in years 1.53Modified duration in years 1.35
Allocation of bonds in %Shares (and equity-type securities) 72.52Fixed Income 18.63Open-end Funds 6.02Index Investments 2.82Closed-end Funds 0.01Total 100.00
Top 10 Holdings in %Position Coupon
%Maturity as % of
assetsDB X-Trackers 3.40ETFS ETC on Gold 2.68Rabobank 3.375 19.02.13 2.13CS SICAV One EuropEq. Div. Plus
1.09
Apple 0.95Rabobank 3.000 18.09.12 0.71Dexia Municipal 5.125 31.05.12 0.70Procter & Gamble 1.375 01.08.12 0.70Exxon Mobil Corp. 0.62CS Sicav One (L)Glob. Convert.
0.57
Total 13.55
Source: Lipper, a Reuters Company
188
1) Historical performance indications and financial market scenarios are no guarantee for current or future performance. Performance indications do not consider commissions levied at subscription and/orredemption.
The disclaimer mentioned at the end of this document also applies to this page.

March 30, 2012Switzerland
Credit Suisse Portfolio Fund (Lux) Growth (US$)Class B
Review previous quarter 3)
Newsflow on the economy in March was mostlygood. The employment report for January wasbetter than expected with a gain of 227,000 innon-farm payrolls (expectation was +210,000).The number for January was revised up to284,000 (was 243,000 before). Theunemployment rate was reported unchanged at8.3%. Consumer confidence gained to 70.8from 61.1 a month earlier. Initial jobless numberscame in at 354,200 and were lower than inFebruary (356,000). Capacity utilization washigher at 78.7% and durable goods orders wereup by 2.2%, after a drop of 4%. The ISMnon-manufacturing report came in higher at 57.3
(was 56.8 before). The PPI report showedinflation at a y-o-y base of +3.3% vs. 4.1%before. The Chicago Purchasing Manager Indexwas lower at 62.2 from 64 a month earlier. Oilprices were higher and traded in a rangebetween USD 120.97 to USD 128.40/barrel.
The ECB held interest rates at 1%. Theeurozone PPI at 3.7% y-o-y was lower (was4.3%). CPI at 2.7% y-o-y was unchanged. TheZEW survey was better at +11 from -8.1 amonth earlier. The unemployment rate in theeurozone was higher at 10.7%.
Equity market performance was mixed in March.The best market was the US (+4.05%), followedby Japan (+3.70%) and Switzerland (+2.05%).The worst markets were Hong Kong (-5.18%),followed by emerging markets (-3.52%) and theUK (-1.75%).
Bond markets were mixed. The best marketswere the eurozone (+1.90%) and Australia(+0.85%), the worst markets were the UK(-1.40%) and the US (-0.73%). Commoditieswere down by 4.13%. Global real estate was upby 0.77%, while gold lost 1.68%. The JPY wasvery weak against all major currencies.
Outlook for the market 3)
We are slightly overweight in equities as an assetclass, with key overweights in emerging marketsand the UK. We are underweight the US andJapan and are strongly underweight in
Switzerland. Bonds overall are underweighted.We are slightly short duration in most markets.Global real estate is slightly overweight, while weare also overweight commodities (including gold).
As for currencies, we are practically neutral, withminimal over or underweights.
Portfolio ManagementMr Hiller graduated from the Business School of Zurich with a B.A. in Economics. He is a Certified EFFAS Financial Analyst. He joinedCredit Suisse Group in 1994 as a portfolio manager for Swiss Volksbank's Portfolio Funds. Since 1997 he has been a member of theCredit Suisse Portfolio Fund (Lux) management team. C
redi
t Sui
sse
Por
tfolio
Fun
d
3) If not expressly indicated otherwise, all quantitative data contained in this comment is based on Lipper, Bloomberg or Datastream.
189
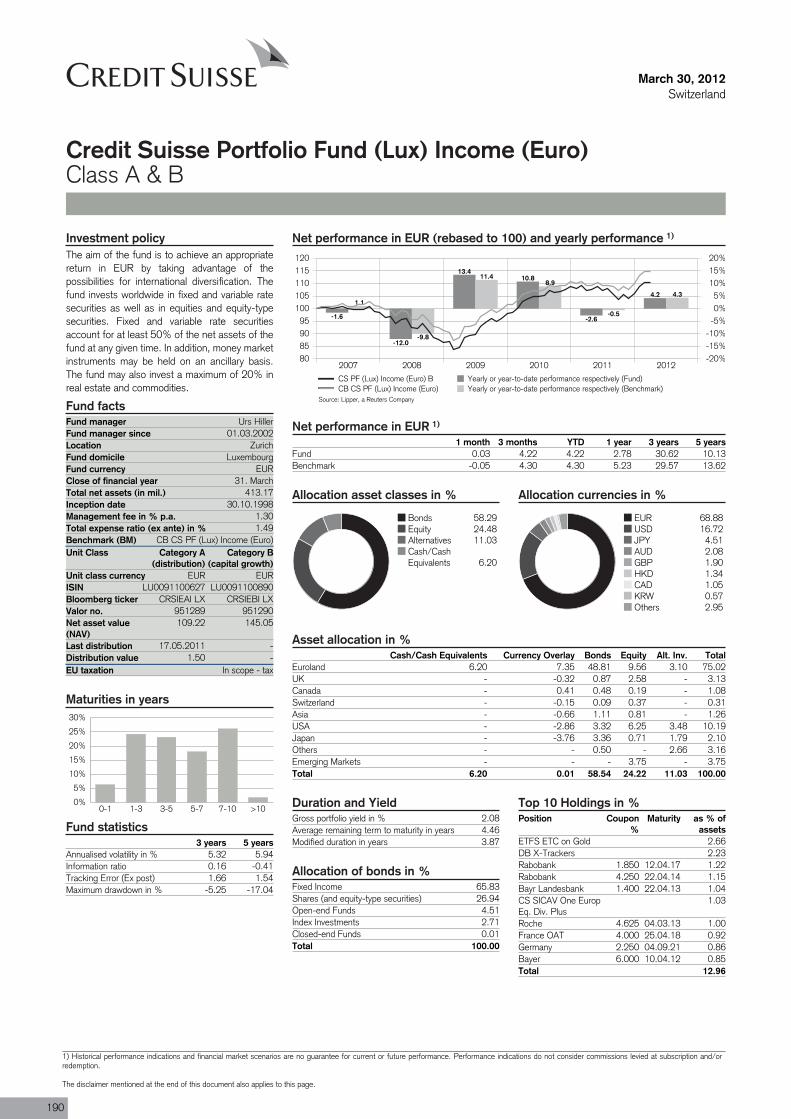
Fund manager Urs HillerFund manager since 01.03.2002Location ZurichFund domicile LuxembourgFund currency EURClose of financial year 31. MarchTotal net assets (in mil.) 413.17Inception date 30.10.1998Management fee in % p.a. 1.30Total expense ratio (ex ante) in % 1.49Benchmark (BM) CB CS PF (Lux) Income (Euro)Unit Class Category A
(distribution)
ISIN LU0091100627
Valor no. 951289
Last distribution 17.05.2011Distribution value 1.50EU taxation In scope - tax
March 30, 2012Switzerland
Credit Suisse Portfolio Fund (Lux) Income (Euro)Class A & B
Net performance in EUR (rebased to 100) and yearly performance 1)
2007 2008 2009 2010 2011 201280859095
100105110115120
-20%-15%-10%-5%0%5%
10%15%20%
-1.6
-12.0
13.410.8
-2.6
4.21.1
-9.8
11.48.9
-0.5
4.3
CS PF (Lux) Income (Euro) B Yearly or year-to-date performance respectively (Fund)CB CS PF (Lux) Income (Euro) Yearly or year-to-date performance respectively (Benchmark)
Net performance in EUR 1)
1 month 3 months YTD 1 year 3 years 5 yearsFund 0.03 4.22 4.22 2.78 30.62 10.13Benchmark -0.05 4.30 4.30 5.23 29.57 13.62
Allocation asset classes in %
Bonds 58.29Equity 24.48Alternatives 11.03Cash/CashEquivalents 6.20
Allocation currencies in %
EUR 68.88USD 16.72JPY 4.51AUD 2.08GBP 1.90HKD 1.34CAD 1.05KRW 0.57Others 2.95
Asset allocation in %Cash/Cash Equivalents Currency Overlay Bonds Equity Alt. Inv. Total
Euroland 6.20 7.35 48.81 9.56 3.10 75.02UK - -0.32 0.87 2.58 - 3.13Canada - 0.41 0.48 0.19 - 1.08Switzerland - -0.15 0.09 0.37 - 0.31Asia - -0.66 1.11 0.81 - 1.26USA - -2.86 3.32 6.25 3.48 10.19Japan - -3.76 3.36 0.71 1.79 2.10Others - - 0.50 - 2.66 3.16Emerging Markets - - - 3.75 - 3.75Total 6.20 0.01 58.54 24.22 11.03 100.00
Investment policyThe aim of the fund is to achieve an appropriatereturn in EUR by taking advantage of thepossibilities for international diversification. Thefund invests worldwide in fixed and variable ratesecurities as well as in equities and equity-typesecurities. Fixed and variable rate securitiesaccount for at least 50% of the net assets of thefund at any given time. In addition, money marketinstruments may be held on an ancillary basis.The fund may also invest a maximum of 20% inreal estate and commodities.
Fund facts
Category B(capital growth)
Unit class currency EUR EURLU0091100890
Bloomberg ticker CRSIEAI LX CRSIEBI LX951290
Net asset value(NAV)
109.22 145.05
--
Maturities in years
0%
5%
10%
15%
20%
25%
30%
0-1 1-3 3-5 5-7 7-10 >10
Fund statistics3 years 5 years
Annualised volatility in % 5.32 5.94Information ratio 0.16 -0.41Tracking Error (Ex post) 1.66 1.54Maximum drawdown in % -5.25 -17.04
Duration and YieldGross portfolio yield in % 2.08Average remaining term to maturity in years 4.46Modified duration in years 3.87
Allocation of bonds in %Fixed Income 65.83Shares (and equity-type securities) 26.94Open-end Funds 4.51Index Investments 2.71Closed-end Funds 0.01Total 100.00
Top 10 Holdings in %Position Coupon
%Maturity as % of
assetsETFS ETC on Gold 2.66DB X-Trackers 2.23Rabobank 1.850 12.04.17 1.22Rabobank 4.250 22.04.14 1.15Bayr Landesbank 1.400 22.04.13 1.04CS SICAV One EuropEq. Div. Plus
1.03
Roche 4.625 04.03.13 1.00France OAT 4.000 25.04.18 0.92Germany 2.250 04.09.21 0.86Bayer 6.000 10.04.12 0.85Total 12.96
Source: Lipper, a Reuters Company
190
1) Historical performance indications and financial market scenarios are no guarantee for current or future performance. Performance indications do not consider commissions levied at subscription and/orredemption.
The disclaimer mentioned at the end of this document also applies to this page.

March 30, 2012Switzerland
Credit Suisse Portfolio Fund (Lux) Income (Euro)Class A & B
Review previous quarter 2)
Newsflow on the economy in March was mostlygood. The employment report for January wasbetter than expected with a gain of 227,000 innon-farm payrolls (expectation was +210,000).The number for January was revised up to284,000 (was 243,000 before). Theunemployment rate was reported unchanged at8.3%. Consumer confidence gained to 70.8from 61.1 a month earlier. Initial jobless numberscame in at 354,200 and were lower than inFebruary (356,000). Capacity utilization washigher at 78.7% and durable goods orders wereup by 2.2%, after a drop of 4%. The ISMnon-manufacturing report came in higher at 57.3
(was 56.8 before). The PPI report showedinflation at a y-o-y base of +3.3% vs. 4.1%before. The Chicago Purchasing Manager Indexwas lower at 62.2 from 64 a month earlier. Oilprices were higher and traded in a rangebetween USD 120.97 to USD 128.40/barrel.
The ECB held interest rates at 1%. Theeurozone PPI at 3.7% y-o-y was lower (was4.3%). CPI at 2.7% y-o-y was unchanged. TheZEW survey was better at +11 from -8.1 amonth earlier. The unemployment rate in theeurozone was higher at 10.7%.
Equity market performance was mixed in March.The best market was the US (+4.05%), followedby Japan (+3.70%) and Switzerland (+2.05%).The worst markets were Hong Kong (-5.18%),followed by emerging markets (-3.52%) and theUK (-1.75%).
Bond markets were mixed. The best marketswere the eurozone (+1.90%) and Australia(+0.85%), the worst markets were the UK(-1.40%) and the US (-0.73%). Commoditieswere down by 4.13%. Global real estate was upby 0.77%, while gold lost 1.68%. The JPY wasvery weak against all major currencies.
Outlook for the market 2)
We are slightly overweight in equities as an assetclass, with key overweights in emerging marketsand the UK. We are underweight the US andJapan and are strongly underweight in
Switzerland. Bonds overall are underweighted.We are slightly short duration in most markets.Global real estate is slightly overweight, while weare also overweight commodities (including gold).
As for currencies, we are practically neutral, withminimal over or underweights.
Portfolio ManagementMr Hiller graduated from the Business School of Zurich with a B.A. in Economics. He is a Certified EFFAS Financial Analyst. He joinedCredit Suisse Group in 1994 as a portfolio manager for Swiss Volksbank's Portfolio Funds. Since 1997 he has been a member of theCredit Suisse Portfolio Fund (Lux) management team. C
redi
t Sui
sse
Por
tfolio
Fun
d
2) If not expressly indicated otherwise, all quantitative data contained in this comment is based on Lipper, Bloomberg or Datastream.
191
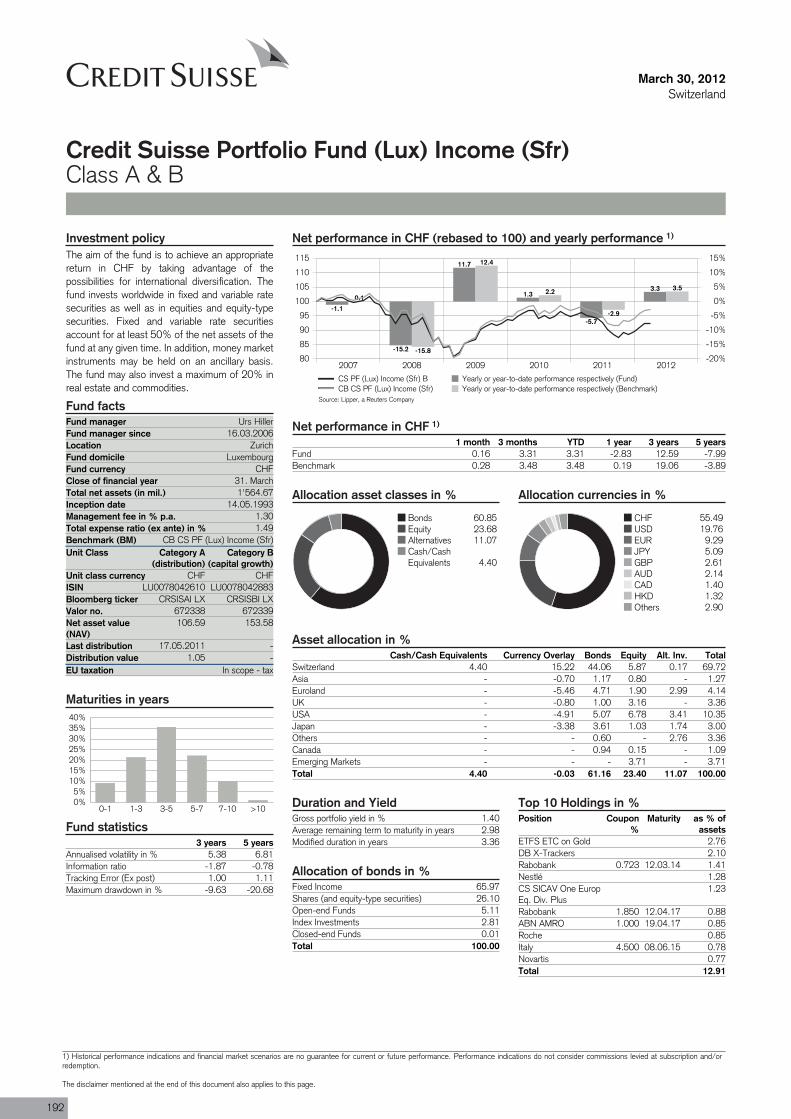
Fund manager Urs HillerFund manager since 16.03.2006Location ZurichFund domicile LuxembourgFund currency CHFClose of financial year 31. MarchTotal net assets (in mil.) 1'564.67Inception date 14.05.1993Management fee in % p.a. 1.30Total expense ratio (ex ante) in % 1.49Benchmark (BM) CB CS PF (Lux) Income (Sfr)Unit Class Category A
(distribution)
ISIN LU0078042610
Valor no. 672338
Last distribution 17.05.2011Distribution value 1.05EU taxation In scope - tax
March 30, 2012Switzerland
Credit Suisse Portfolio Fund (Lux) Income (Sfr)Class A & B
Net performance in CHF (rebased to 100) and yearly performance 1)
2007 2008 2009 2010 2011 201280
85
90
95
100
105
110
115
-20%
-15%
-10%
-5%
0%
5%
10%
15%
-1.1
-15.2
11.7
1.3
-5.7
3.30.1
-15.8
12.4
2.2
-2.9
3.5
CS PF (Lux) Income (Sfr) B Yearly or year-to-date performance respectively (Fund)CB CS PF (Lux) Income (Sfr) Yearly or year-to-date performance respectively (Benchmark)
Net performance in CHF 1)
1 month 3 months YTD 1 year 3 years 5 yearsFund 0.16 3.31 3.31 -2.83 12.59 -7.99Benchmark 0.28 3.48 3.48 0.19 19.06 -3.89
Allocation asset classes in %
Bonds 60.85Equity 23.68Alternatives 11.07Cash/CashEquivalents 4.40
Allocation currencies in %
CHF 55.49USD 19.76EUR 9.29JPY 5.09GBP 2.61AUD 2.14CAD 1.40HKD 1.32Others 2.90
Asset allocation in %Cash/Cash Equivalents Currency Overlay Bonds Equity Alt. Inv. Total
Switzerland 4.40 15.22 44.06 5.87 0.17 69.72Asia - -0.70 1.17 0.80 - 1.27Euroland - -5.46 4.71 1.90 2.99 4.14UK - -0.80 1.00 3.16 - 3.36USA - -4.91 5.07 6.78 3.41 10.35Japan - -3.38 3.61 1.03 1.74 3.00Others - - 0.60 - 2.76 3.36Canada - - 0.94 0.15 - 1.09Emerging Markets - - - 3.71 - 3.71Total 4.40 -0.03 61.16 23.40 11.07 100.00
Investment policyThe aim of the fund is to achieve an appropriatereturn in CHF by taking advantage of thepossibilities for international diversification. Thefund invests worldwide in fixed and variable ratesecurities as well as in equities and equity-typesecurities. Fixed and variable rate securitiesaccount for at least 50% of the net assets of thefund at any given time. In addition, money marketinstruments may be held on an ancillary basis.The fund may also invest a maximum of 20% inreal estate and commodities.
Fund facts
Category B(capital growth)
Unit class currency CHF CHFLU0078042883
Bloomberg ticker CRSISAI LX CRSISBI LX672339
Net asset value(NAV)
106.59 153.58
--
Maturities in years
0%5%
10%15%20%25%30%35%40%
0-1 1-3 3-5 5-7 7-10 >10
Fund statistics3 years 5 years
Annualised volatility in % 5.38 6.81Information ratio -1.87 -0.78Tracking Error (Ex post) 1.00 1.11Maximum drawdown in % -9.63 -20.68
Duration and YieldGross portfolio yield in % 1.40Average remaining term to maturity in years 2.98Modified duration in years 3.36
Allocation of bonds in %Fixed Income 65.97Shares (and equity-type securities) 26.10Open-end Funds 5.11Index Investments 2.81Closed-end Funds 0.01Total 100.00
Top 10 Holdings in %Position Coupon
%Maturity as % of
assetsETFS ETC on Gold 2.76DB X-Trackers 2.10Rabobank 0.723 12.03.14 1.41Nestlé 1.28CS SICAV One EuropEq. Div. Plus
1.23
Rabobank 1.850 12.04.17 0.88ABN AMRO 1.000 19.04.17 0.85Roche 0.85Italy 4.500 08.06.15 0.78Novartis 0.77Total 12.91
Source: Lipper, a Reuters Company
192
1) Historical performance indications and financial market scenarios are no guarantee for current or future performance. Performance indications do not consider commissions levied at subscription and/orredemption.
The disclaimer mentioned at the end of this document also applies to this page.

March 30, 2012Switzerland
Credit Suisse Portfolio Fund (Lux) Income (Sfr)Class A & B
Review previous quarter 2)
Newsflow on the economy in March was mostlygood. The employment report for January wasbetter than expected with a gain of 227,000 innon-farm payrolls (expectation was +210,000).The number for January was revised up to284,000 (was 243,000 before). Theunemployment rate was reported unchanged at8.3%. Consumer confidence gained to 70.8from 61.1 a month earlier. Initial jobless numberscame in at 354,200 and were lower than inFebruary (356,000). Capacity utilization washigher at 78.7% and durable goods orders wereup by 2.2%, after a drop of 4%. The ISMnon-manufacturing report came in higher at 57.3
(was 56.8 before). The PPI report showedinflation at a y-o-y base of +3.3% vs. 4.1%before. The Chicago Purchasing Manager Indexwas lower at 62.2 from 64 a month earlier. Oilprices were higher and traded in a rangebetween USD 120.97 to USD 128.40/barrel.
The ECB held interest rates at 1%. Theeurozone PPI at 3.7% y-o-y was lower (was4.3%). CPI at 2.7% y-o-y was unchanged. TheZEW survey was better at +11 from -8.1 amonth earlier. The unemployment rate in theeurozone was higher at 10.7%.
Equity market performance was mixed in March.The best market was the US (+4.05%), followedby Japan (+3.70%) and Switzerland (+2.05%).The worst markets were Hong Kong (-5.18%),followed by emerging markets (-3.52%) and theUK (-1.75%).
Bond markets were mixed. The best marketswere the eurozone (+1.90%) and Australia(+0.85%), the worst markets were the UK(-1.40%) and the US (-0.73%). Commoditieswere down by 4.13%. Global real estate was upby 0.77%, while gold lost 1.68%. The JPY wasvery weak against all major currencies.
Outlook for the market 2)
We are slightly overweight in equities as an assetclass, with key overweights in emerging marketsand the UK. We are underweight the US andJapan and are strongly underweight in
Switzerland. Bonds overall are underweighted.We are slightly short duration in most markets.Global real estate is slightly overweight, while weare also overweight commodities (including gold).
As for currencies, we are practically neutral, withminimal over or underweights.
Portfolio ManagementMr Hiller graduated from the Business School of Zurich with a B.A. in Economics. He is a Certified EFFAS Financial Analyst. He joinedCredit Suisse Group in 1994 as a portfolio manager for Swiss Volksbank's Portfolio Funds. Since 1997 he has been a member of theCredit Suisse Portfolio Fund (Lux) management team. C
redi
t Sui
sse
Por
tfolio
Fun
d
2) If not expressly indicated otherwise, all quantitative data contained in this comment is based on Lipper, Bloomberg or Datastream.
193
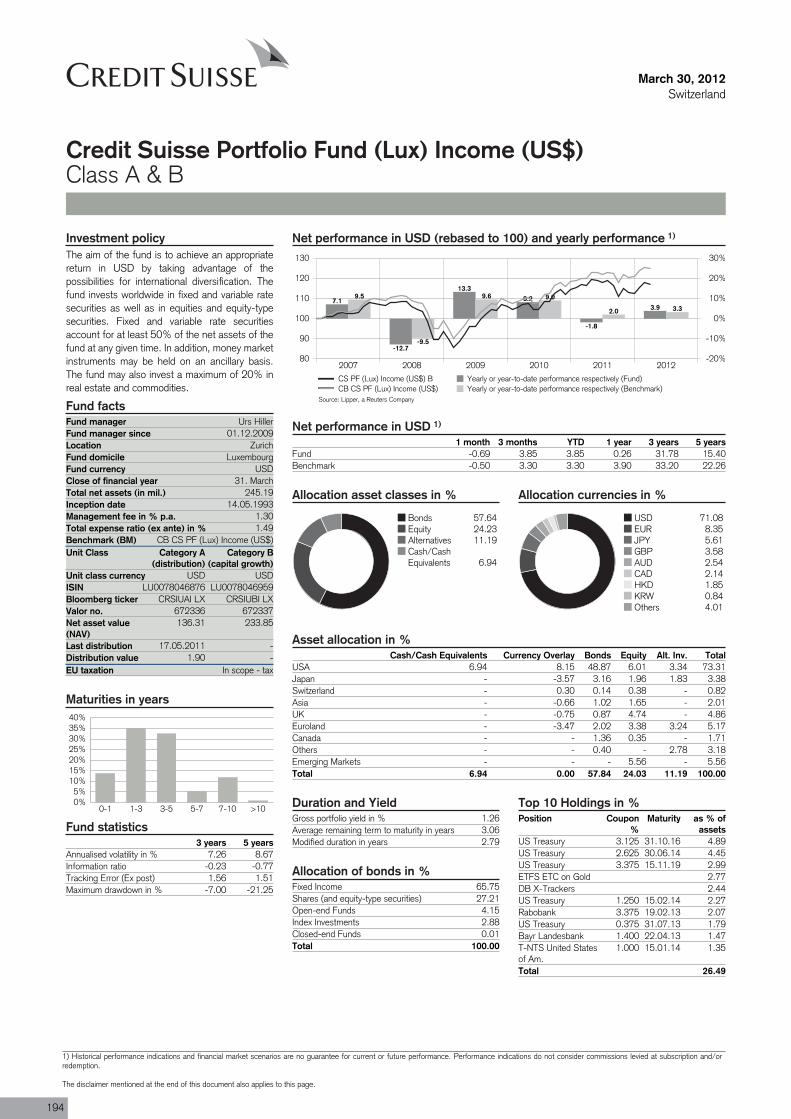
Fund manager Urs HillerFund manager since 01.12.2009Location ZurichFund domicile LuxembourgFund currency USDClose of financial year 31. MarchTotal net assets (in mil.) 245.19Inception date 14.05.1993Management fee in % p.a. 1.30Total expense ratio (ex ante) in % 1.49Benchmark (BM) CB CS PF (Lux) Income (US$)Unit Class Category A
(distribution)
ISIN LU0078046876
Valor no. 672336
Last distribution 17.05.2011Distribution value 1.90EU taxation In scope - tax
March 30, 2012Switzerland
Credit Suisse Portfolio Fund (Lux) Income (US$)Class A & B
Net performance in USD (rebased to 100) and yearly performance 1)
2007 2008 2009 2010 2011 201280
90
100
110
120
130
-20%
-10%
0%
10%
20%
30%
7.1
-12.7
13.38.2
-1.8
3.9
9.5
-9.5
9.6 9.0
2.0 3.3
CS PF (Lux) Income (US$) B Yearly or year-to-date performance respectively (Fund)CB CS PF (Lux) Income (US$) Yearly or year-to-date performance respectively (Benchmark)
Net performance in USD 1)
1 month 3 months YTD 1 year 3 years 5 yearsFund -0.69 3.85 3.85 0.26 31.78 15.40Benchmark -0.50 3.30 3.30 3.90 33.20 22.26
Allocation asset classes in %
Bonds 57.64Equity 24.23Alternatives 11.19Cash/CashEquivalents 6.94
Allocation currencies in %
USD 71.08EUR 8.35JPY 5.61GBP 3.58AUD 2.54CAD 2.14HKD 1.85KRW 0.84Others 4.01
Asset allocation in %Cash/Cash Equivalents Currency Overlay Bonds Equity Alt. Inv. Total
USA 6.94 8.15 48.87 6.01 3.34 73.31Japan - -3.57 3.16 1.96 1.83 3.38Switzerland - 0.30 0.14 0.38 - 0.82Asia - -0.66 1.02 1.65 - 2.01UK - -0.75 0.87 4.74 - 4.86Euroland - -3.47 2.02 3.38 3.24 5.17Canada - - 1.36 0.35 - 1.71Others - - 0.40 - 2.78 3.18Emerging Markets - - - 5.56 - 5.56Total 6.94 0.00 57.84 24.03 11.19 100.00
Investment policyThe aim of the fund is to achieve an appropriatereturn in USD by taking advantage of thepossibilities for international diversification. Thefund invests worldwide in fixed and variable ratesecurities as well as in equities and equity-typesecurities. Fixed and variable rate securitiesaccount for at least 50% of the net assets of thefund at any given time. In addition, money marketinstruments may be held on an ancillary basis.The fund may also invest a maximum of 20% inreal estate and commodities.
Fund facts
Category B(capital growth)
Unit class currency USD USDLU0078046959
Bloomberg ticker CRSIUAI LX CRSIUBI LX672337
Net asset value(NAV)
136.31 233.85
--
Maturities in years
0%5%
10%15%20%25%30%35%40%
0-1 1-3 3-5 5-7 7-10 >10
Fund statistics3 years 5 years
Annualised volatility in % 7.26 8.67Information ratio -0.23 -0.77Tracking Error (Ex post) 1.56 1.51Maximum drawdown in % -7.00 -21.25
Duration and YieldGross portfolio yield in % 1.26Average remaining term to maturity in years 3.06Modified duration in years 2.79
Allocation of bonds in %Fixed Income 65.75Shares (and equity-type securities) 27.21Open-end Funds 4.15Index Investments 2.88Closed-end Funds 0.01Total 100.00
Top 10 Holdings in %Position Coupon
%Maturity as % of
assetsUS Treasury 3.125 31.10.16 4.89US Treasury 2.625 30.06.14 4.45US Treasury 3.375 15.11.19 2.99ETFS ETC on Gold 2.77DB X-Trackers 2.44US Treasury 1.250 15.02.14 2.27Rabobank 3.375 19.02.13 2.07US Treasury 0.375 31.07.13 1.79Bayr Landesbank 1.400 22.04.13 1.47T-NTS United Statesof Am.
1.000 15.01.14 1.35
Total 26.49
Source: Lipper, a Reuters Company
194
1) Historical performance indications and financial market scenarios are no guarantee for current or future performance. Performance indications do not consider commissions levied at subscription and/orredemption.
The disclaimer mentioned at the end of this document also applies to this page.

March 30, 2012Switzerland
Credit Suisse Portfolio Fund (Lux) Income (US$)Class A & B
Review previous quarter 2)
Newsflow on the economy in March was mostlygood. The employment report for January wasbetter than expected with a gain of 227,000 innon-farm payrolls (expectation was +210,000).The number for January was revised up to284,000 (was 243,000 before). Theunemployment rate was reported unchanged at8.3%. Consumer confidence gained to 70.8from 61.1 a month earlier. Initial jobless numberscame in at 354,200 and were lower than inFebruary (356,000). Capacity utilization washigher at 78.7% and durable goods orders wereup by 2.2%, after a drop of 4%. The ISMnon-manufacturing report came in higher at 57.3
(was 56.8 before). The PPI report showedinflation at a y-o-y base of +3.3% vs. 4.1%before. The Chicago Purchasing Manager Indexwas lower at 62.2 from 64 a month earlier. Oilprices were higher and traded in a rangebetween USD 120.97 to USD 128.40/barrel.
The ECB held interest rates at 1%. Theeurozone PPI at 3.7% y-o-y was lower (was4.3%). CPI at 2.7% y-o-y was unchanged. TheZEW survey was better at +11 from -8.1 amonth earlier. The unemployment rate in theeurozone was higher at 10.7%.
Equity market performance was mixed in March.The best market was the US (+4.05%), followedby Japan (+3.70%) and Switzerland (+2.05%).The worst markets were Hong Kong (-5.18%),followed by emerging markets (-3.52%) and theUK (-1.75%).
Bond markets were mixed. The best marketswere the eurozone (+1.90%) and Australia(+0.85%), the worst markets were the UK(-1.40%) and the US (-0.73%). Commoditieswere down by 4.13%. Global real estate was upby 0.77%, while gold lost 1.68%. The JPY wasvery weak against all major currencies.
Outlook for the market 2)
We are slightly overweight in equities as an assetclass, with key overweights in emerging marketsand the UK. We are underweight the US andJapan and are strongly underweight in
Switzerland. Bonds overall are underweighted.We are slightly short duration in most markets.Global real estate is slightly overweight, while weare also overweight commodities (including gold).
As for currencies, we are practically neutral, withminimal over or underweights.
Portfolio ManagementMr Hiller graduated from the Business School of Zurich with a B.A. in Economics. He is a Certified EFFAS Financial Analyst. He joinedCredit Suisse Group in 1994 as a portfolio manager for Swiss Volksbank's Portfolio Funds. Since 1997 he has been a member of theCredit Suisse Portfolio Fund (Lux) management team. C
redi
t Sui
sse
Por
tfolio
Fun
d
2) If not expressly indicated otherwise, all quantitative data contained in this comment is based on Lipper, Bloomberg or Datastream.
195
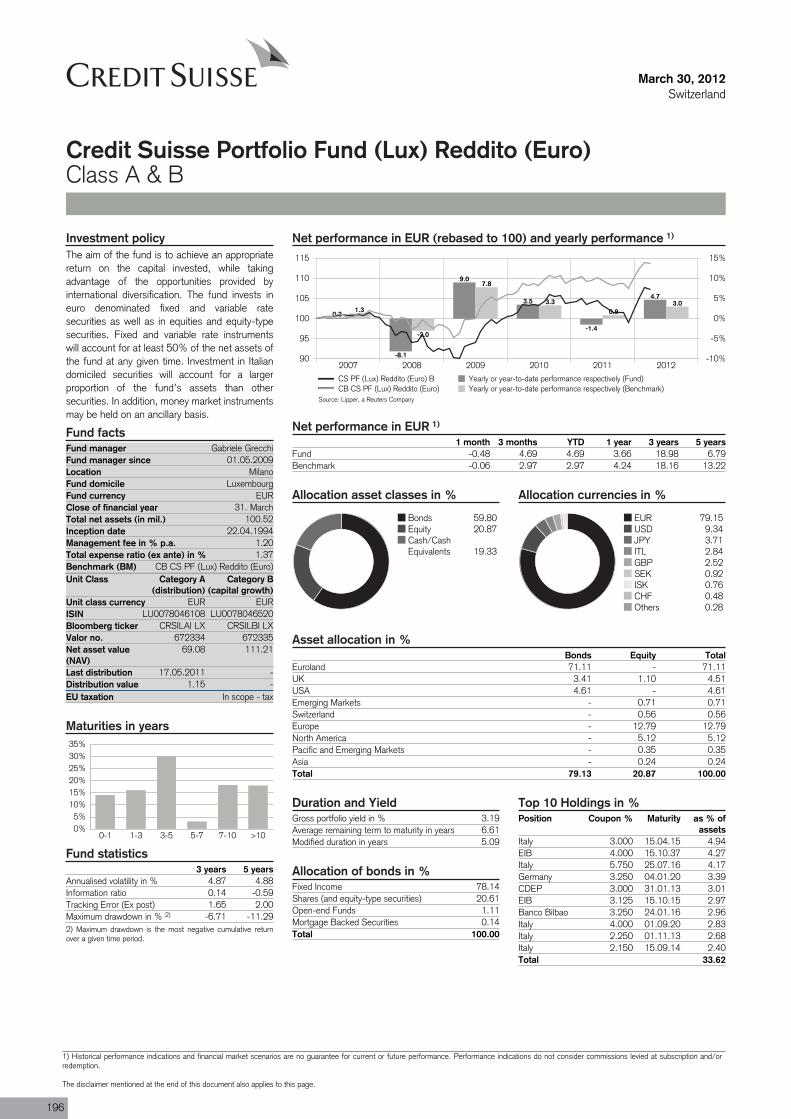
Fund manager Gabriele GrecchiFund manager since 01.05.2009Location MilanoFund domicile LuxembourgFund currency EURClose of financial year 31. MarchTotal net assets (in mil.) 100.52Inception date 22.04.1994Management fee in % p.a. 1.20Total expense ratio (ex ante) in % 1.37Benchmark (BM) CB CS PF (Lux) Reddito (Euro)Unit Class Category A
(distribution)
ISIN LU0078046108
Valor no. 672334
Last distribution 17.05.2011Distribution value 1.15EU taxation In scope - tax
March 30, 2012Switzerland
Credit Suisse Portfolio Fund (Lux) Reddito (Euro)Class A & B
Net performance in EUR (rebased to 100) and yearly performance 1)
2007 2008 2009 2010 2011 201290
95
100
105
110
115
-10%
-5%
0%
5%
10%
15%
0.3
-8.1
9.0
3.5
-1.4
4.7
1.3
-3.0
7.8
3.30.9
3.0
CS PF (Lux) Reddito (Euro) B Yearly or year-to-date performance respectively (Fund)CB CS PF (Lux) Reddito (Euro) Yearly or year-to-date performance respectively (Benchmark)
Net performance in EUR 1)
1 month 3 months YTD 1 year 3 years 5 yearsFund -0.48 4.69 4.69 3.66 18.98 6.79Benchmark -0.06 2.97 2.97 4.24 18.16 13.22
Allocation asset classes in %
Bonds 59.80Equity 20.87Cash/CashEquivalents 19.33
Allocation currencies in %
EUR 79.15USD 9.34JPY 3.71ITL 2.84GBP 2.52SEK 0.92ISK 0.76CHF 0.48Others 0.28
Asset allocation in %Bonds Equity Total
Euroland 71.11 - 71.11UK 3.41 1.10 4.51USA 4.61 - 4.61Emerging Markets - 0.71 0.71Switzerland - 0.56 0.56Europe - 12.79 12.79North America - 5.12 5.12Pacific and Emerging Markets - 0.35 0.35Asia - 0.24 0.24Total 79.13 20.87 100.00
Investment policyThe aim of the fund is to achieve an appropriatereturn on the capital invested, while takingadvantage of the opportunities provided byinternational diversification. The fund invests ineuro denominated fixed and variable ratesecurities as well as in equities and equity-typesecurities. Fixed and variable rate instrumentswill account for at least 50% of the net assets ofthe fund at any given time. Investment in Italiandomiciled securities will account for a largerproportion of the fund’s assets than othersecurities. In addition, money market instrumentsmay be held on an ancillary basis.
Fund facts
Category B(capital growth)
Unit class currency EUR EURLU0078046520
Bloomberg ticker CRSILAI LX CRSILBI LX672335
Net asset value(NAV)
69.08 111.21
--
Maturities in years
0%5%
10%15%20%25%30%35%
0-1 1-3 3-5 5-7 7-10 >10
Fund statistics3 years 5 years
Annualised volatility in % 4.87 4.88Information ratio 0.14 -0.59Tracking Error (Ex post) 1.65 2.00Maximum drawdown in % 2) -6.71 -11.292) Maximum drawdown is the most negative cumulative returnover a given time period.
Duration and YieldGross portfolio yield in % 3.19Average remaining term to maturity in years 6.61Modified duration in years 5.09
Allocation of bonds in %Fixed Income 78.14Shares (and equity-type securities) 20.61Open-end Funds 1.11Mortgage Backed Securities 0.14Total 100.00
Top 10 Holdings in %Position Coupon % Maturity as % of
assetsItaly 3.000 15.04.15 4.94EIB 4.000 15.10.37 4.27Italy 5.750 25.07.16 4.17Germany 3.250 04.01.20 3.39CDEP 3.000 31.01.13 3.01EIB 3.125 15.10.15 2.97Banco Bilbao 3.250 24.01.16 2.96Italy 4.000 01.09.20 2.83Italy 2.250 01.11.13 2.68Italy 2.150 15.09.14 2.40Total 33.62
Source: Lipper, a Reuters Company
196
1) Historical performance indications and financial market scenarios are no guarantee for current or future performance. Performance indications do not consider commissions levied at subscription and/orredemption.
The disclaimer mentioned at the end of this document also applies to this page.
March 30, 2012Switzerland
Credit Suisse Portfolio Fund (Lux) Reddito (Euro)Class A & B
Review previous quarter 3)
World stock markets rocketed higher especiallyin the first two months of the new year and arenow up 35%–40% on average from their lowpoints hit in August 2011. Despite a short-termslowdown in economic activity, business-cycledata from the core regions reinforce our theorythat the macroeconomic situation is sustainablycontinuing to improve. This, coupled with
subsiding euro-zone woes, abatingbanking-system troubles, the continued excellentshape of the corporate sector and thecentral-bank liquidity injections led by theEuropean Central Bank (ECB), creates asubstantially improved overall climate.At the moment, however, the chances of furtherupside surprises have become more difficult.
Moreover, the market has already priced in someof these pleasing developments. Furthermore,the unpredictable situation in the Middle Eastand the substantial increase in the price of oilconstitute risk factors that shouldn’t beunderestimated. Greece remains an issue, asdo Portugal and Spain, even after the debtrestructuring deal.
Outlook for the market 3)
In anticipation of laterally consolidating ormoderately correcting stock markets, we decideda few weeks ago to take profits temporarily andto position ourselves neutrally as we await abetter entry opportunity. However, the macroand corporate fundamentals coupled with thevaluation component and the mountingperformance pressure on many investors whoare still positioned in cash continue to reinforce
our confidence that we will see another upmovein stocks in the months ahead regardless of anynear-term corrections.From a regional perspective, we believe thatsuperior growth and very sound corporate dataare the reason behind the significantoutperformance posted by the US markets.Hence, in the future we are leaning toward morecyclical and laggard markets such as the
emerging economies (cyclicality and structuraladvantages) and parts of Europe (catch-uppotential and valuation component).Our positioning in the fixed-income sectorremains unchanged. In spite of the recent uptick,we consider the current yield levels in thetraditional bond markets unattractive, but we donot see a big risk of a further appreciable upwarddrift in yields given the steady demand.
Portfolio ManagementGabriele Grecchi joined Credit Suisse in December 2004. He works within the Multi Asset Class Solutions (MACS) team in Milan as aportfolio manager for balanced and total return products. Mr. Grecchi is focused on investment strategies and provides benchmarkoriented, Value-at-Risk, total return, and long/short solutions. He has also worked in Dubai supporting the local MACS team in setting upinvestment solutions for institutional clients in the region and promoting the local product specialist platform. Mr. Grecchi holds an MSc inInternational Economics & Finance from the Università degli Studi di Milano (Italy), a Master's Degree in Business Communication, and aBA in Communication Science from the Libera Università di Lingue e Comunicazione IULM (Italy).
Cre
dit S
uiss
e P
ortfo
lio F
und
3) If not expressly indicated otherwise, all quantitative data contained in this comment is based on Lipper, Bloomberg or Datastream.
197
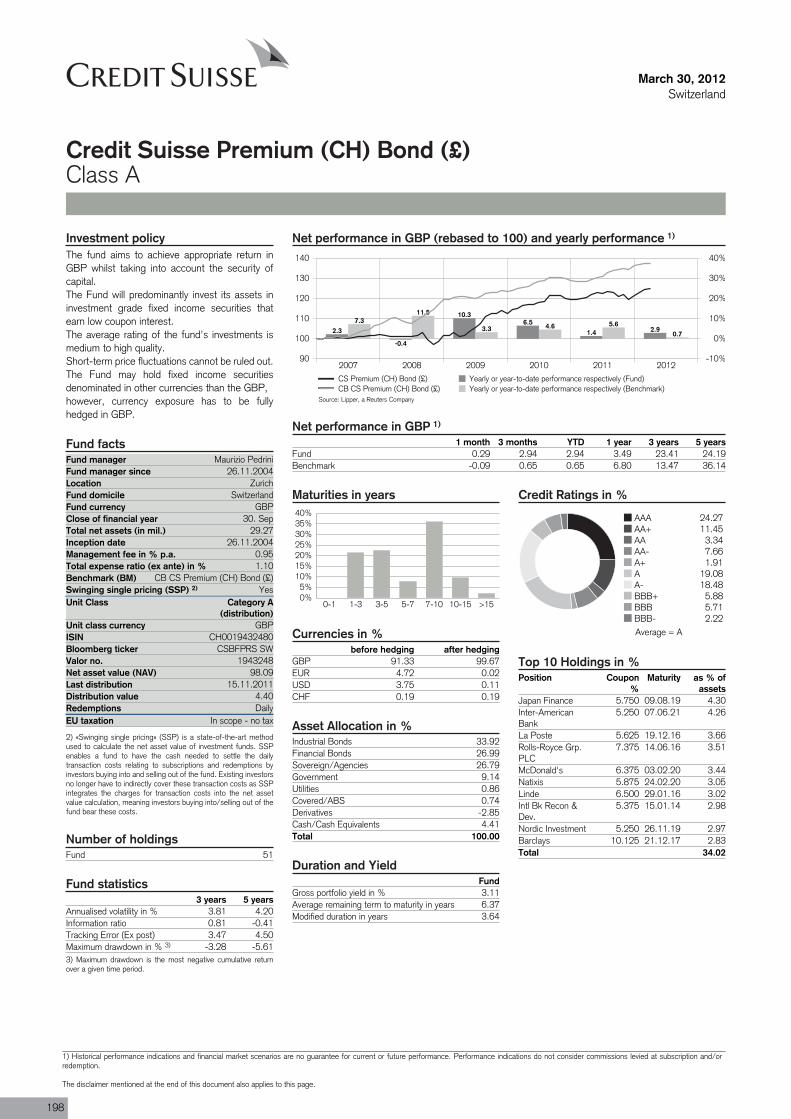
Fund manager Maurizio PedriniFund manager since 26.11.2004Location ZurichFund domicile SwitzerlandFund currency GBPClose of financial year 30. SepTotal net assets (in mil.) 29.27Inception date 26.11.2004Management fee in % p.a. 0.95Total expense ratio (ex ante) in % 1.10Benchmark (BM) CB CS Premium (CH) Bond (£)Swinging single pricing (SSP) 2) YesUnit Class Category A
(distribution)
ISIN CH0019432480
Valor no. 1943248
Last distribution 15.11.2011Distribution value 4.40Redemptions DailyEU taxation In scope - no tax
Fund 51
March 30, 2012Switzerland
Credit Suisse Premium (CH) Bond (£)Class A
Net performance in GBP (rebased to 100) and yearly performance 1)
2007 2008 2009 2010 2011 201290
100
110
120
130
140
-10%
0%
10%
20%
30%
40%
2.3
-0.4
10.36.5
1.4 2.97.3
11.5
3.3 4.6 5.60.7
CS Premium (CH) Bond (£) Yearly or year-to-date performance respectively (Fund)CB CS Premium (CH) Bond (£) Yearly or year-to-date performance respectively (Benchmark)
Net performance in GBP 1)
1 month 3 months YTD 1 year 3 years 5 yearsFund 0.29 2.94 2.94 3.49 23.41 24.19Benchmark -0.09 0.65 0.65 6.80 13.47 36.14
Maturities in years
0%5%
10%15%20%25%30%35%40%
0-1 1-3 3-5 5-7 7-10 10-15 >15
Currencies in %before hedging after hedging
GBP 91.33 99.67EUR 4.72 0.02USD 3.75 0.11CHF 0.19 0.19
Asset Allocation in %Industrial Bonds 33.92Financial Bonds 26.99Sovereign/Agencies 26.79Government 9.14Utilities 0.86Covered/ABS 0.74Derivatives -2.85Cash/Cash Equivalents 4.41Total 100.00
Duration and YieldFund
Gross portfolio yield in % 3.11Average remaining term to maturity in years 6.37Modified duration in years 3.64
Credit Ratings in %
AAA 24.27AA+ 11.45AA 3.34AA- 7.66A+ 1.91A 19.08A- 18.48BBB+ 5.88BBB 5.71BBB- 2.22
Top 10 Holdings in %Position Coupon
%Maturity as % of
assetsJapan Finance 5.750 09.08.19 4.30Inter-AmericanBank
5.250 07.06.21 4.26
La Poste 5.625 19.12.16 3.66Rolls-Royce Grp.PLC
7.375 14.06.16 3.51
McDonald's 6.375 03.02.20 3.44Natixis 5.875 24.02.20 3.05Linde 6.500 29.01.16 3.02Intl Bk Recon &Dev.
5.375 15.01.14 2.98
Nordic Investment 5.250 26.11.19 2.97Barclays 10.125 21.12.17 2.83Total 34.02
Investment policyThe fund aims to achieve appropriate return inGBP whilst taking into account the security ofcapital.The Fund will predominantly invest its assets ininvestment grade fixed income securities thatearn low coupon interest.The average rating of the fund's investments ismedium to high quality.Short-term price fluctuations cannot be ruled out.The Fund may hold fixed income securitiesdenominated in other currencies than the GBP,however, currency exposure has to be fullyhedged in GBP.
Fund facts
Unit class currency GBP
Bloomberg ticker CSBFPRS SW
Net asset value (NAV) 98.09
2) «Swinging single pricing» (SSP) is a state-of-the-art methodused to calculate the net asset value of investment funds. SSPenables a fund to have the cash needed to settle the dailytransaction costs relating to subscriptions and redemptions byinvestors buying into and selling out of the fund. Existing investorsno longer have to indirectly cover these transaction costs as SSPintegrates the charges for transaction costs into the net assetvalue calculation, meaning investors buying into/selling out of thefund bear these costs.
Number of holdings
Fund statistics3 years 5 years
Annualised volatility in % 3.81 4.20Information ratio 0.81 -0.41Tracking Error (Ex post) 3.47 4.50Maximum drawdown in % 3) -3.28 -5.613) Maximum drawdown is the most negative cumulative returnover a given time period.
Source: Lipper, a Reuters Company
Average = A
198
1) Historical performance indications and financial market scenarios are no guarantee for current or future performance. Performance indications do not consider commissions levied at subscription and/orredemption.
The disclaimer mentioned at the end of this document also applies to this page.

March 30, 2012Switzerland
Credit Suisse Premium (CH) Bond (£)Class A
Review previous quarter 4)
Substantial liquidity injections by the ECB (LTROI and LTRO II) and the restructuring of the Greekgovernment debt helped to stabilize markets inQ1 2012. Risky assets strongly outperformedgovernments bonds in general and peripheralgovernment bonds of the euro area also surgedin price. Q1 2012 was therefore one of thestrongest in recent history. Credit spreadstightened as measured by the iTraxx EuropeMain Index (5yrs) from 173bps to 125bps andin the US from 120bps to 92bps (CDX IG 5yrs).Interest rates in the US climbed higher on theback of improving economic data. The US yield
curve steepened as the differential between 2yrsand 10yrs maturities increased by 15pbs to179bps.
Unlike in the US, yield changes in the eurozoneresembled the picture of a butterfly as the shortend and the long end gapped higher while themiddle of the curve (6yrs -12 yrs) was lower.Spain got back into the spotlight after thegovernment warned that the budget deficit will behigher than originally forecasted in 2011. Also,demand was lower than expected at one of itsgovernment debt auctions. One of the key issues
in Europe is still that in order to reduce theirbudget deficits, governments need to introduceausterity measures which may cause civil unrestand a negative GDP growth rate. LTRO’s havereduced the liquidity issue for banks. However,many banks in Europe remain weakly capitalized.One of the bright spots are the high growth ratesof emerging market countries. Even as Chinahas declared that it will target a lower growth rateunder its new five-year plan, investors continueto be attracted by the higher interest rates andearnings growth of Asian and Latin Americaneconomies.
Outlook for the market 4)
The Fed announced that it does not expect torevise its monetary policy anytime soon. Therecovery of the US economy remains protractedbut recently exceeded the expectations of themarket. In particular, the labor market has beenmore dynamic as more jobs were created in Q1and the jobless rate dropped to 8.2%.Manufacturing also suggested that the USeconomy continues to be on a slow butcontinuous growth path. There are virtually noinflationary forces that could lead the Fed toincrease interest rates within a year. Interestrates will likely stay at the current level for some
time in the US which in turn may hurt emergingmarkets because their currencies are likely toappreciate versus the USD. In order to remaincompetitive, countries such as Brazil and otherfast growing economies need to replace moreexpensive labor with capital and encouragedomestic consumption. What does this mean forcredit spreads and interest rates?
For the first time since last year the score ofour interest rate factor model turned negative asthe more friendly fundamental picture suggestshigher yields going forward. The technical input
also changed to negative due to an overboughtsituation in the short term. The behavioral inputalso neutralized because of the recent strongflattening of yield curves in Europe. We willtherefore reduce our duration in the portfoliostowards a shorter position than the benchmark.In corporate bonds we recommend issuers witha good credit profile and would increase thediversification in the portfolio as even somefrequent issuers have become expensive. Aconsolidation period seems likely after the strongrally in the first quarter.
Portfolio ManagementMaurizio Pedrini is a Managing Director of Credit Suisse's Asset Management business, based in Zurich. He is Global Co-Head FixedIncome, focusing on retail funds and institutional products. He joined Credit Suisse in 1998. Prior to this he was Head of Bond Researchand Bond Fund Management at UBS Private Banking. Maurizio has more than 17 years of professional experience in the fixed income andforeign exchange business. Maurizio holds a Master's degree from the University of Zurich (specializing in Finance and Monetary Theory)and is a Certified EFFAS Financial Ana-lyst. He is a visiting lecturer at the University of Zurich for the EFFAS Financial Analyst studycourse and at the University of Applied Sciences Northwestern Switzerland on various fixed income topics. Maurizio is a member of theSwiss Bond Commission.
Cre
dit S
uiss
e P
rem
ium
4) If not expressly indicated otherwise, all quantitative data contained in this comment is based on Lipper, Bloomberg or Datastream.
199
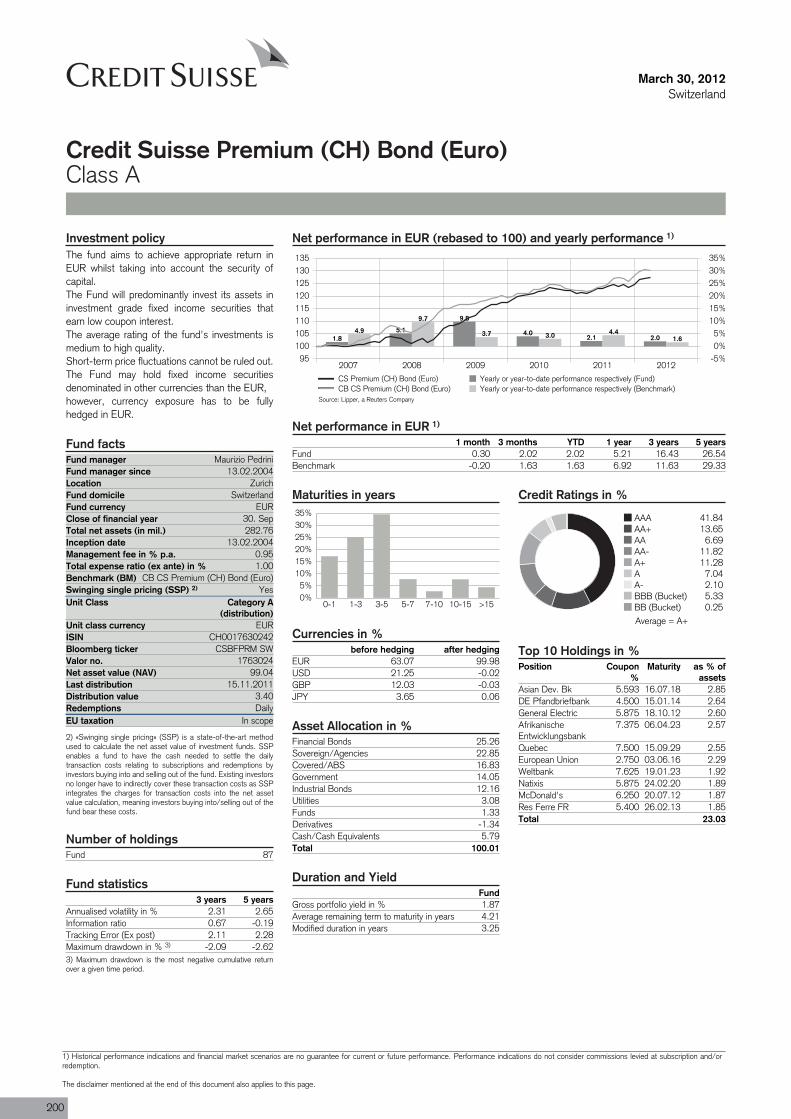
Fund manager Maurizio PedriniFund manager since 13.02.2004Location ZurichFund domicile SwitzerlandFund currency EURClose of financial year 30. SepTotal net assets (in mil.) 282.76Inception date 13.02.2004Management fee in % p.a. 0.95Total expense ratio (ex ante) in % 1.00Benchmark (BM) CB CS Premium (CH) Bond (Euro)Swinging single pricing (SSP) 2) YesUnit Class Category A
(distribution)
ISIN CH0017630242
Valor no. 1763024
Last distribution 15.11.2011Distribution value 3.40Redemptions DailyEU taxation In scope
Fund 87
March 30, 2012Switzerland
Credit Suisse Premium (CH) Bond (Euro)Class A
Net performance in EUR (rebased to 100) and yearly performance 1)
2007 2008 2009 2010 2011 201295
100105110115120125130135
-5%0%5%
10%15%20%25%30%35%
1.85.1
9.8
4.02.1 2.0
4.9
9.7
3.7 3.0 4.41.6
CS Premium (CH) Bond (Euro) Yearly or year-to-date performance respectively (Fund)CB CS Premium (CH) Bond (Euro) Yearly or year-to-date performance respectively (Benchmark)
Net performance in EUR 1)
1 month 3 months YTD 1 year 3 years 5 yearsFund 0.30 2.02 2.02 5.21 16.43 26.54Benchmark -0.20 1.63 1.63 6.92 11.63 29.33
Maturities in years
0%5%
10%15%20%25%30%35%
0-1 1-3 3-5 5-7 7-10 10-15 >15
Currencies in %before hedging after hedging
EUR 63.07 99.98USD 21.25 -0.02GBP 12.03 -0.03JPY 3.65 0.06
Asset Allocation in %Financial Bonds 25.26Sovereign/Agencies 22.85Covered/ABS 16.83Government 14.05Industrial Bonds 12.16Utilities 3.08Funds 1.33Derivatives -1.34Cash/Cash Equivalents 5.79Total 100.01
Duration and YieldFund
Gross portfolio yield in % 1.87Average remaining term to maturity in years 4.21Modified duration in years 3.25
Credit Ratings in %
AAA 41.84AA+ 13.65AA 6.69AA- 11.82A+ 11.28A 7.04A- 2.10BBB (Bucket) 5.33BB (Bucket) 0.25
Top 10 Holdings in %Position Coupon
%Maturity as % of
assetsAsian Dev. Bk 5.593 16.07.18 2.85DE Pfandbriefbank 4.500 15.01.14 2.64General Electric 5.875 18.10.12 2.60AfrikanischeEntwicklungsbank
7.375 06.04.23 2.57
Quebec 7.500 15.09.29 2.55European Union 2.750 03.06.16 2.29Weltbank 7.625 19.01.23 1.92Natixis 5.875 24.02.20 1.89McDonald's 6.250 20.07.12 1.87Res Ferre FR 5.400 26.02.13 1.85Total 23.03
Investment policyThe fund aims to achieve appropriate return inEUR whilst taking into account the security ofcapital.The Fund will predominantly invest its assets ininvestment grade fixed income securities thatearn low coupon interest.The average rating of the fund's investments ismedium to high quality.Short-term price fluctuations cannot be ruled out.The Fund may hold fixed income securitiesdenominated in other currencies than the EUR,however, currency exposure has to be fullyhedged in EUR.
Fund facts
Unit class currency EUR
Bloomberg ticker CSBFPRM SW
Net asset value (NAV) 99.04
2) «Swinging single pricing» (SSP) is a state-of-the-art methodused to calculate the net asset value of investment funds. SSPenables a fund to have the cash needed to settle the dailytransaction costs relating to subscriptions and redemptions byinvestors buying into and selling out of the fund. Existing investorsno longer have to indirectly cover these transaction costs as SSPintegrates the charges for transaction costs into the net assetvalue calculation, meaning investors buying into/selling out of thefund bear these costs.
Number of holdings
Fund statistics3 years 5 years
Annualised volatility in % 2.31 2.65Information ratio 0.67 -0.19Tracking Error (Ex post) 2.11 2.28Maximum drawdown in % 3) -2.09 -2.623) Maximum drawdown is the most negative cumulative returnover a given time period.
Source: Lipper, a Reuters Company
Average = A+
200
1) Historical performance indications and financial market scenarios are no guarantee for current or future performance. Performance indications do not consider commissions levied at subscription and/orredemption.
The disclaimer mentioned at the end of this document also applies to this page.
March 30, 2012Switzerland
Credit Suisse Premium (CH) Bond (Euro)Class A
Review previous quarter 4)
Substantial liquidity injections by the ECB (LTROI and LTRO II) and the restructuring of the Greekgovernment debt helped to stabilize markets inQ1 2012. Risky assets strongly outperformedgovernments bonds in general and peripheralgovernment bonds of the euro area also surgedin price. Q1 2012 was therefore one of thestrongest in recent history. Credit spreadstightened as measured by the iTraxx EuropeMain Index (5yrs) from 173bps to 125bps andin the US from 120bps to 92bps (CDX IG 5yrs).Interest rates in the US climbed higher on theback of improving economic data. The US yield
curve steepened as the differential between 2yrsand 10yrs maturities increased by 15pbs to179bps.
Unlike in the US, yield changes in the eurozoneresembled the picture of a butterfly as the shortend and the long end gapped higher while themiddle of the curve (6yrs -12 yrs) was lower.Spain got back into the spotlight after thegovernment warned that the budget deficit will behigher than originally forecasted in 2011. Also,demand was lower than expected at one of itsgovernment debt auctions. One of the key issuesin Europe is still that in order to reduce their
budget deficits, governments need to introduceausterity measures which may cause civil unrestand a negative GDP growth rate. LTRO’s havereduced the liquidity issue for banks. However,many banks in Europe remain weakly capitalized.One of the bright spots are the high growth ratesof emerging market countries. Even as Chinahas declared that it will target a lower growth rateunder its new five-year plan, investors continueto be attracted by the higher interest rates andearnings growth of Asian and Latin Americaneconomies.
Outlook for the market 4)
The Fed announced that it does not expect torevise its monetary policy anytime soon. Therecovery of the US economy remains protractedbut recently exceeded the expectations of themarket. In particular, the labor market has beenmore dynamic as more jobs were created in Q1and the jobless rate dropped to 8.2%.Manufacturing also suggested that the USeconomy continues to be on a slow butcontinuous growth path. There are virtually noinflationary forces that could lead the Fed toincrease interest rates within a year. Interestrates will likely stay at the current level for some
time in the US which in turn may hurt emergingmarkets because their currencies are likely toappreciate versus the USD. In order to remaincompetitive, countries such as Brazil and otherfast growing economies need to replace moreexpensive labor with capital and encouragedomestic consumption. What does this mean forcredit spreads and interest rates?
For the first time since last year the score ofour interest rate factor model turned negative asthe more friendly fundamental picture suggestshigher yields going forward. The technical input
also changed to negative due to an overboughtsituation in the short term. The behavioral inputalso neutralized because of the recent strongflattening of yield curves in Europe. We willtherefore reduce our duration in the portfoliostowards a shorter position than the benchmark.In corporate bonds we recommend issuers witha good credit profile and would increase thediversification in the portfolio as even somefrequent issuers have become expensive. Aconsolidation period seems likely after the strongrally in the first quarter.
Portfolio ManagementMaurizio Pedrini is a Managing Director of Credit Suisse's Asset Management business, based in Zurich. He is Global Co-Head FixedIncome, focusing on retail funds and institutional products. He joined Credit Suisse in 1998. Prior to this he was Head of Bond Researchand Bond Fund Management at UBS Private Banking. Maurizio has more than 17 years of professional experience in the fixed income andforeign exchange business. Maurizio holds a Master's degree from the University of Zurich (specializing in Finance and Monetary Theory)and is a Certified EFFAS Financial Ana-lyst. He is a visiting lecturer at the University of Zurich for the EFFAS Financial Analyst studycourse and at the University of Applied Sciences Northwestern Switzerland on various fixed income topics. Maurizio is a member of theSwiss Bond Commission.
Cre
dit S
uiss
e P
rem
ium
4) If not expressly indicated otherwise, all quantitative data contained in this comment is based on Lipper, Bloomberg or Datastream.
201
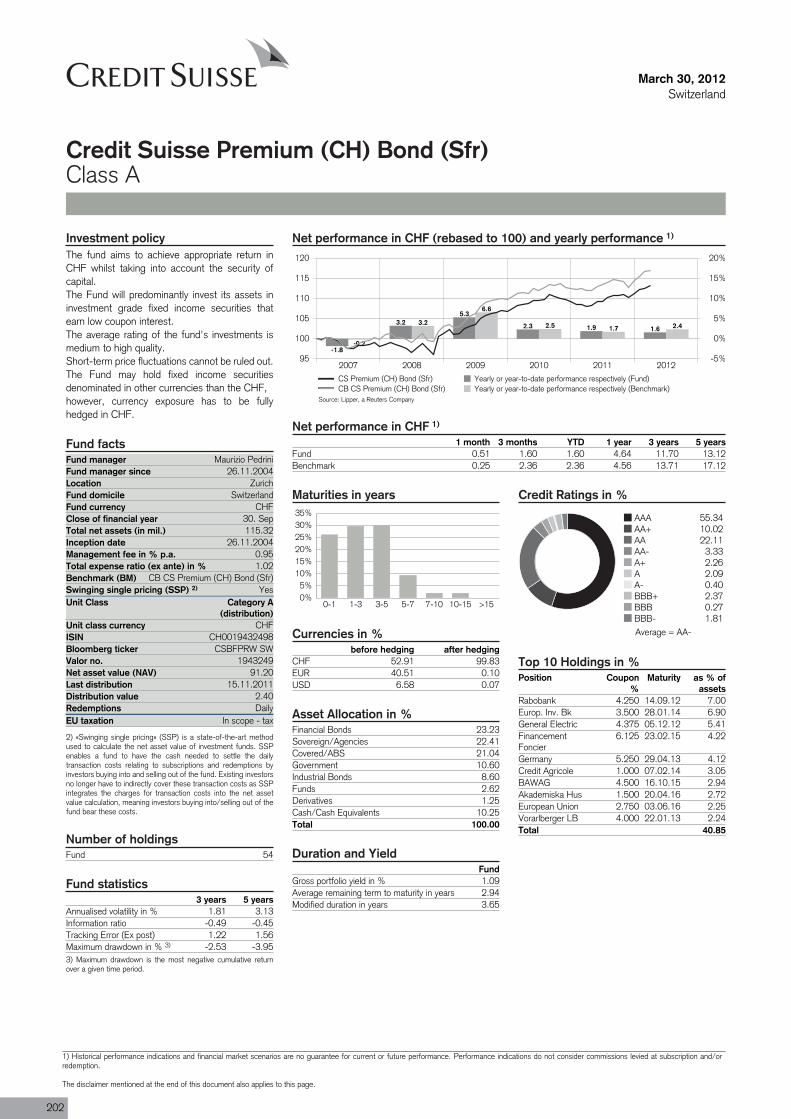
Fund manager Maurizio PedriniFund manager since 26.11.2004Location ZurichFund domicile SwitzerlandFund currency CHFClose of financial year 30. SepTotal net assets (in mil.) 115.32Inception date 26.11.2004Management fee in % p.a. 0.95Total expense ratio (ex ante) in % 1.02Benchmark (BM) CB CS Premium (CH) Bond (Sfr)Swinging single pricing (SSP) 2) YesUnit Class Category A
(distribution)
ISIN CH0019432498
Valor no. 1943249
Last distribution 15.11.2011Distribution value 2.40Redemptions DailyEU taxation In scope - tax
Fund 54
March 30, 2012Switzerland
Credit Suisse Premium (CH) Bond (Sfr)Class A
Net performance in CHF (rebased to 100) and yearly performance 1)
2007 2008 2009 2010 2011 201295
100
105
110
115
120
-5%
0%
5%
10%
15%
20%
-1.8
3.25.3
2.3 1.9 1.6
-0.2
3.2
6.6
2.5 1.7 2.4
CS Premium (CH) Bond (Sfr) Yearly or year-to-date performance respectively (Fund)CB CS Premium (CH) Bond (Sfr) Yearly or year-to-date performance respectively (Benchmark)
Net performance in CHF 1)
1 month 3 months YTD 1 year 3 years 5 yearsFund 0.51 1.60 1.60 4.64 11.70 13.12Benchmark 0.25 2.36 2.36 4.56 13.71 17.12
Maturities in years
0%5%
10%15%20%25%30%35%
0-1 1-3 3-5 5-7 7-10 10-15 >15
Currencies in %before hedging after hedging
CHF 52.91 99.83EUR 40.51 0.10USD 6.58 0.07
Asset Allocation in %Financial Bonds 23.23Sovereign/Agencies 22.41Covered/ABS 21.04Government 10.60Industrial Bonds 8.60Funds 2.62Derivatives 1.25Cash/Cash Equivalents 10.25Total 100.00
Duration and YieldFund
Gross portfolio yield in % 1.09Average remaining term to maturity in years 2.94Modified duration in years 3.65
Credit Ratings in %
AAA 55.34AA+ 10.02AA 22.11AA- 3.33A+ 2.26A 2.09A- 0.40BBB+ 2.37BBB 0.27BBB- 1.81
Top 10 Holdings in %Position Coupon
%Maturity as % of
assetsRabobank 4.250 14.09.12 7.00Europ. Inv. Bk 3.500 28.01.14 6.90General Electric 4.375 05.12.12 5.41FinancementFoncier
6.125 23.02.15 4.22
Germany 5.250 29.04.13 4.12Credit Agricole 1.000 07.02.14 3.05BAWAG 4.500 16.10.15 2.94Akademiska Hus 1.500 20.04.16 2.72European Union 2.750 03.06.16 2.25Vorarlberger LB 4.000 22.01.13 2.24Total 40.85
Investment policyThe fund aims to achieve appropriate return inCHF whilst taking into account the security ofcapital.The Fund will predominantly invest its assets ininvestment grade fixed income securities thatearn low coupon interest.The average rating of the fund's investments ismedium to high quality.Short-term price fluctuations cannot be ruled out.The Fund may hold fixed income securitiesdenominated in other currencies than the CHF,however, currency exposure has to be fullyhedged in CHF.
Fund facts
Unit class currency CHF
Bloomberg ticker CSBFPRW SW
Net asset value (NAV) 91.20
2) «Swinging single pricing» (SSP) is a state-of-the-art methodused to calculate the net asset value of investment funds. SSPenables a fund to have the cash needed to settle the dailytransaction costs relating to subscriptions and redemptions byinvestors buying into and selling out of the fund. Existing investorsno longer have to indirectly cover these transaction costs as SSPintegrates the charges for transaction costs into the net assetvalue calculation, meaning investors buying into/selling out of thefund bear these costs.
Number of holdings
Fund statistics3 years 5 years
Annualised volatility in % 1.81 3.13Information ratio -0.49 -0.45Tracking Error (Ex post) 1.22 1.56Maximum drawdown in % 3) -2.53 -3.953) Maximum drawdown is the most negative cumulative returnover a given time period.
Source: Lipper, a Reuters Company
Average = AA-
202
1) Historical performance indications and financial market scenarios are no guarantee for current or future performance. Performance indications do not consider commissions levied at subscription and/orredemption.
The disclaimer mentioned at the end of this document also applies to this page.
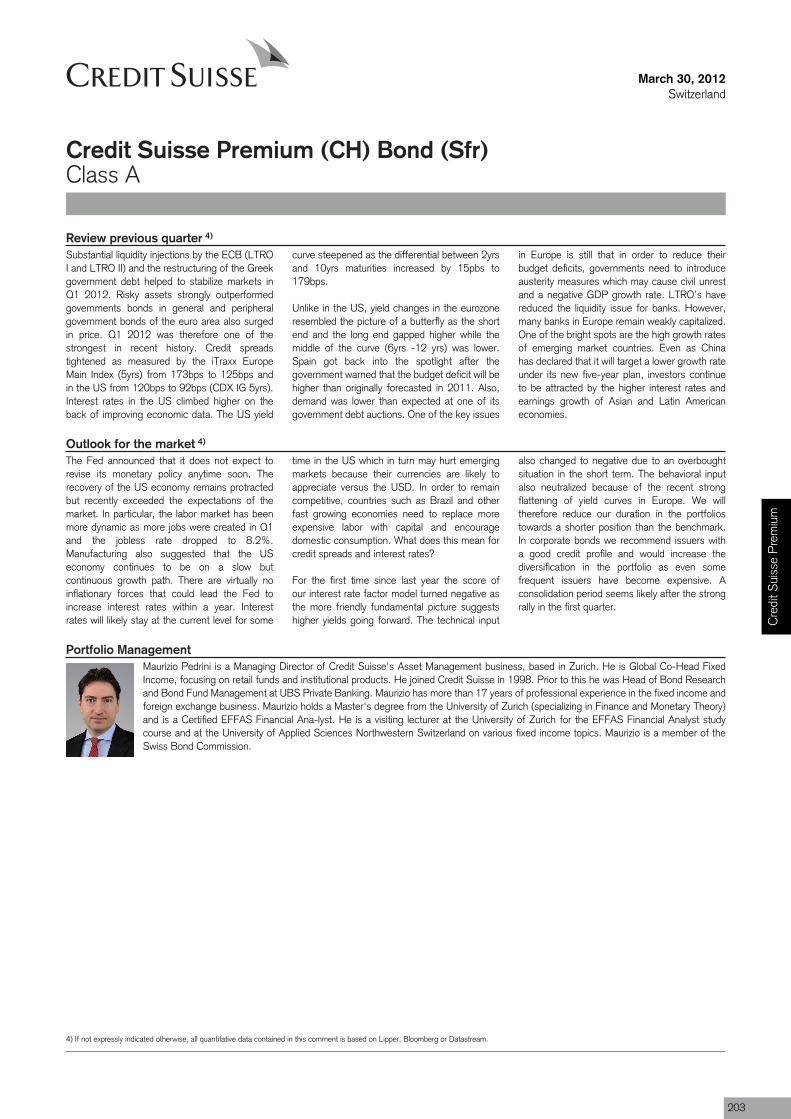
March 30, 2012Switzerland
Credit Suisse Premium (CH) Bond (Sfr)Class A
Review previous quarter 4)
Substantial liquidity injections by the ECB (LTROI and LTRO II) and the restructuring of the Greekgovernment debt helped to stabilize markets inQ1 2012. Risky assets strongly outperformedgovernments bonds in general and peripheralgovernment bonds of the euro area also surgedin price. Q1 2012 was therefore one of thestrongest in recent history. Credit spreadstightened as measured by the iTraxx EuropeMain Index (5yrs) from 173bps to 125bps andin the US from 120bps to 92bps (CDX IG 5yrs).Interest rates in the US climbed higher on theback of improving economic data. The US yield
curve steepened as the differential between 2yrsand 10yrs maturities increased by 15pbs to179bps.
Unlike in the US, yield changes in the eurozoneresembled the picture of a butterfly as the shortend and the long end gapped higher while themiddle of the curve (6yrs -12 yrs) was lower.Spain got back into the spotlight after thegovernment warned that the budget deficit will behigher than originally forecasted in 2011. Also,demand was lower than expected at one of itsgovernment debt auctions. One of the key issues
in Europe is still that in order to reduce theirbudget deficits, governments need to introduceausterity measures which may cause civil unrestand a negative GDP growth rate. LTRO’s havereduced the liquidity issue for banks. However,many banks in Europe remain weakly capitalized.One of the bright spots are the high growth ratesof emerging market countries. Even as Chinahas declared that it will target a lower growth rateunder its new five-year plan, investors continueto be attracted by the higher interest rates andearnings growth of Asian and Latin Americaneconomies.
Outlook for the market 4)
The Fed announced that it does not expect torevise its monetary policy anytime soon. Therecovery of the US economy remains protractedbut recently exceeded the expectations of themarket. In particular, the labor market has beenmore dynamic as more jobs were created in Q1and the jobless rate dropped to 8.2%.Manufacturing also suggested that the USeconomy continues to be on a slow butcontinuous growth path. There are virtually noinflationary forces that could lead the Fed toincrease interest rates within a year. Interestrates will likely stay at the current level for some
time in the US which in turn may hurt emergingmarkets because their currencies are likely toappreciate versus the USD. In order to remaincompetitive, countries such as Brazil and otherfast growing economies need to replace moreexpensive labor with capital and encouragedomestic consumption. What does this mean forcredit spreads and interest rates?
For the first time since last year the score ofour interest rate factor model turned negative asthe more friendly fundamental picture suggestshigher yields going forward. The technical input
also changed to negative due to an overboughtsituation in the short term. The behavioral inputalso neutralized because of the recent strongflattening of yield curves in Europe. We willtherefore reduce our duration in the portfoliostowards a shorter position than the benchmark.In corporate bonds we recommend issuers witha good credit profile and would increase thediversification in the portfolio as even somefrequent issuers have become expensive. Aconsolidation period seems likely after the strongrally in the first quarter.
Portfolio ManagementMaurizio Pedrini is a Managing Director of Credit Suisse's Asset Management business, based in Zurich. He is Global Co-Head FixedIncome, focusing on retail funds and institutional products. He joined Credit Suisse in 1998. Prior to this he was Head of Bond Researchand Bond Fund Management at UBS Private Banking. Maurizio has more than 17 years of professional experience in the fixed income andforeign exchange business. Maurizio holds a Master's degree from the University of Zurich (specializing in Finance and Monetary Theory)and is a Certified EFFAS Financial Ana-lyst. He is a visiting lecturer at the University of Zurich for the EFFAS Financial Analyst studycourse and at the University of Applied Sciences Northwestern Switzerland on various fixed income topics. Maurizio is a member of theSwiss Bond Commission.
Cre
dit S
uiss
e P
rem
ium
4) If not expressly indicated otherwise, all quantitative data contained in this comment is based on Lipper, Bloomberg or Datastream.
203
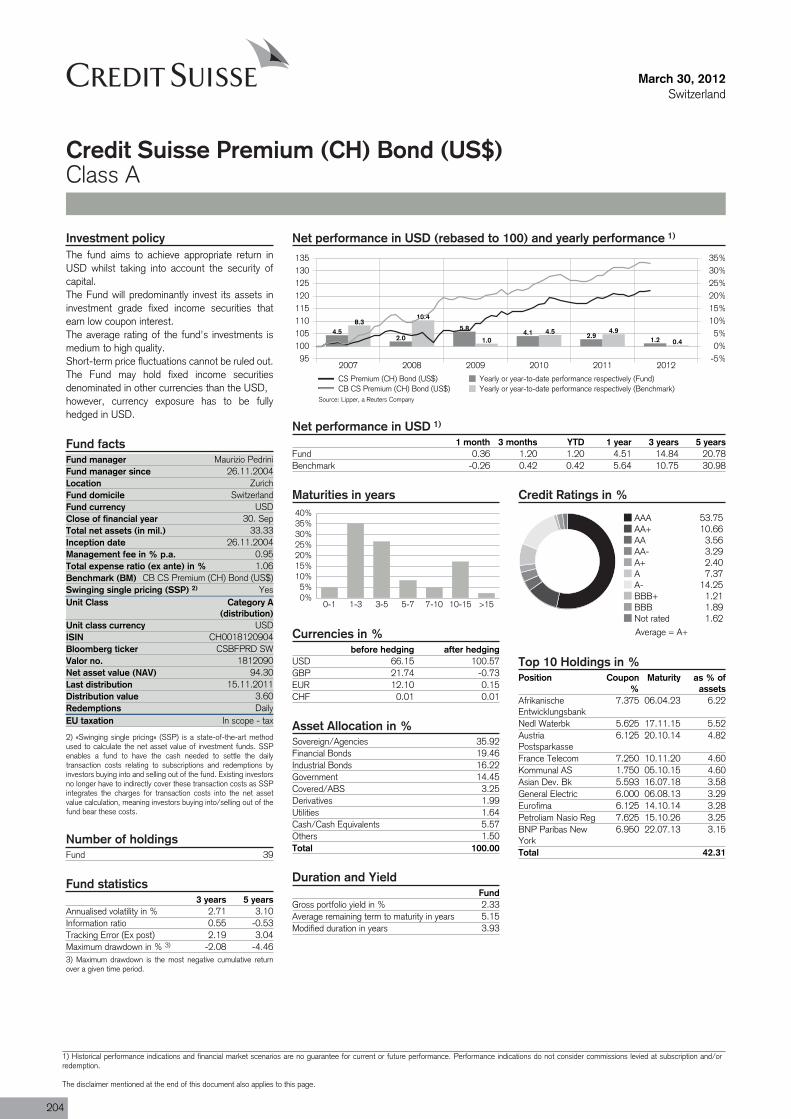
Fund manager Maurizio PedriniFund manager since 26.11.2004Location ZurichFund domicile SwitzerlandFund currency USDClose of financial year 30. SepTotal net assets (in mil.) 33.33Inception date 26.11.2004Management fee in % p.a. 0.95Total expense ratio (ex ante) in % 1.06Benchmark (BM) CB CS Premium (CH) Bond (US$)Swinging single pricing (SSP) 2) YesUnit Class Category A
(distribution)
ISIN CH0018120904
Valor no. 1812090
Last distribution 15.11.2011Distribution value 3.60Redemptions DailyEU taxation In scope - tax
Fund 39
March 30, 2012Switzerland
Credit Suisse Premium (CH) Bond (US$)Class A
Net performance in USD (rebased to 100) and yearly performance 1)
2007 2008 2009 2010 2011 201295
100105110115120125130135
-5%0%5%
10%15%20%25%30%35%
4.52.0
5.84.1 2.9
1.2
8.310.4
1.04.5 4.9
0.4
CS Premium (CH) Bond (US$) Yearly or year-to-date performance respectively (Fund)CB CS Premium (CH) Bond (US$) Yearly or year-to-date performance respectively (Benchmark)
Net performance in USD 1)
1 month 3 months YTD 1 year 3 years 5 yearsFund 0.36 1.20 1.20 4.51 14.84 20.78Benchmark -0.26 0.42 0.42 5.64 10.75 30.98
Maturities in years
0%5%
10%15%20%25%30%35%40%
0-1 1-3 3-5 5-7 7-10 10-15 >15
Currencies in %before hedging after hedging
USD 66.15 100.57GBP 21.74 -0.73EUR 12.10 0.15CHF 0.01 0.01
Asset Allocation in %Sovereign/Agencies 35.92Financial Bonds 19.46Industrial Bonds 16.22Government 14.45Covered/ABS 3.25Derivatives 1.99Utilities 1.64Cash/Cash Equivalents 5.57Others 1.50Total 100.00
Duration and YieldFund
Gross portfolio yield in % 2.33Average remaining term to maturity in years 5.15Modified duration in years 3.93
Credit Ratings in %
AAA 53.75AA+ 10.66AA 3.56AA- 3.29A+ 2.40A 7.37A- 14.25BBB+ 1.21BBB 1.89Not rated 1.62
Top 10 Holdings in %Position Coupon
%Maturity as % of
assetsAfrikanischeEntwicklungsbank
7.375 06.04.23 6.22
Nedl Waterbk 5.625 17.11.15 5.52AustriaPostsparkasse
6.125 20.10.14 4.82
France Telecom 7.250 10.11.20 4.60Kommunal AS 1.750 05.10.15 4.60Asian Dev. Bk 5.593 16.07.18 3.58General Electric 6.000 06.08.13 3.29Eurofima 6.125 14.10.14 3.28Petroliam Nasio Reg 7.625 15.10.26 3.25BNP Paribas NewYork
6.950 22.07.13 3.15
Total 42.31
Investment policyThe fund aims to achieve appropriate return inUSD whilst taking into account the security ofcapital.The Fund will predominantly invest its assets ininvestment grade fixed income securities thatearn low coupon interest.The average rating of the fund's investments ismedium to high quality.Short-term price fluctuations cannot be ruled out.The Fund may hold fixed income securitiesdenominated in other currencies than the USD,however, currency exposure has to be fullyhedged in USD.
Fund facts
Unit class currency USD
Bloomberg ticker CSBFPRD SW
Net asset value (NAV) 94.30
2) «Swinging single pricing» (SSP) is a state-of-the-art methodused to calculate the net asset value of investment funds. SSPenables a fund to have the cash needed to settle the dailytransaction costs relating to subscriptions and redemptions byinvestors buying into and selling out of the fund. Existing investorsno longer have to indirectly cover these transaction costs as SSPintegrates the charges for transaction costs into the net assetvalue calculation, meaning investors buying into/selling out of thefund bear these costs.
Number of holdings
Fund statistics3 years 5 years
Annualised volatility in % 2.71 3.10Information ratio 0.55 -0.53Tracking Error (Ex post) 2.19 3.04Maximum drawdown in % 3) -2.08 -4.463) Maximum drawdown is the most negative cumulative returnover a given time period.
Source: Lipper, a Reuters Company
Average = A+
204
1) Historical performance indications and financial market scenarios are no guarantee for current or future performance. Performance indications do not consider commissions levied at subscription and/orredemption.
The disclaimer mentioned at the end of this document also applies to this page.

March 30, 2012Switzerland
Credit Suisse Premium (CH) Bond (US$)Class A
Review previous quarter 4)
Substantial liquidity injections by the ECB (LTROI and LTRO II) and the restructuring of the Greekgovernment debt helped to stabilize markets inQ1 2012. Risky assets strongly outperformedgovernments bonds in general and peripheralgovernment bonds of the euro area also surgedin price. Q1 2012 was therefore one of thestrongest in recent history. Credit spreadstightened as measured by the iTraxx EuropeMain Index (5yrs) from 173bps to 125bps andin the US from 120bps to 92bps (CDX IG 5yrs).Interest rates in the US climbed higher on theback of improving economic data. The US yield
curve steepened as the differential between 2yrsand 10yrs maturities increased by 15pbs to179bps.
Unlike in the US, yield changes in the eurozoneresembled the picture of a butterfly as the shortend and the long end gapped higher while themiddle of the curve (6yrs -12 yrs) was lower.Spain got back into the spotlight after thegovernment warned that the budget deficit will behigher than originally forecasted in 2011. Also,demand was lower than expected at one of itsgovernment debt auctions. One of the key issuesin Europe is still that in order to reduce their
budget deficits, governments need to introduceausterity measures which may cause civil unrestand a negative GDP growth rate. LTRO’s havereduced the liquidity issue for banks. However,many banks in Europe remain weakly capitalized.One of the bright spots are the high growth ratesof emerging market countries. Even as Chinahas declared that it will target a lower growth rateunder its new five-year plan, investors continueto be attracted by the higher interest rates andearnings growth of Asian and Latin Americaneconomies.
Outlook for the market 4)
The Fed announced that it does not expect torevise its monetary policy anytime soon. Therecovery of the US economy remains protractedbut recently exceeded the expectations of themarket. In particular, the labor market has beenmore dynamic as more jobs were created in Q1and the jobless rate dropped to 8.2%.Manufacturing also suggested that the USeconomy continues to be on a slow butcontinuous growth path. There are virtually noinflationary forces that could lead the Fed toincrease interest rates within a year. Interestrates will likely stay at the current level for some
time in the US which in turn may hurt emergingmarkets because their currencies are likely toappreciate versus the USD. In order to remaincompetitive, countries such as Brazil and otherfast growing economies need to replace moreexpensive labor with capital and encouragedomestic consumption. What does this mean forcredit spreads and interest rates?
For the first time since last year the score ofour interest rate factor model turned negative asthe more friendly fundamental picture suggestshigher yields going forward. The technical input
also changed to negative due to an overboughtsituation in the short term. The behavioral inputalso neutralized because of the recent strongflattening of yield curves in Europe. We willtherefore reduce our duration in the portfoliostowards a shorter position than the benchmark.In corporate bonds we recommend issuers witha good credit profile and would increase thediversification in the portfolio as even somefrequent issuers have become expensive. Aconsolidation period seems likely after the strongrally in the first quarter.
Portfolio ManagementMaurizio Pedrini is a Managing Director of Credit Suisse's Asset Management business, based in Zurich. He is Global Co-Head FixedIncome, focusing on retail funds and institutional products. He joined Credit Suisse in 1998. Prior to this he was Head of Bond Researchand Bond Fund Management at UBS Private Banking. Maurizio has more than 17 years of professional experience in the fixed income andforeign exchange business. Maurizio holds a Master's degree from the University of Zurich (specializing in Finance and Monetary Theory)and is a Certified EFFAS Financial Ana-lyst. He is a visiting lecturer at the University of Zurich for the EFFAS Financial Analyst studycourse and at the University of Applied Sciences Northwestern Switzerland on various fixed income topics. Maurizio is a member of theSwiss Bond Commission.
Cre
dit S
uiss
e P
rem
ium
4) If not expressly indicated otherwise, all quantitative data contained in this comment is based on Lipper, Bloomberg or Datastream.
205
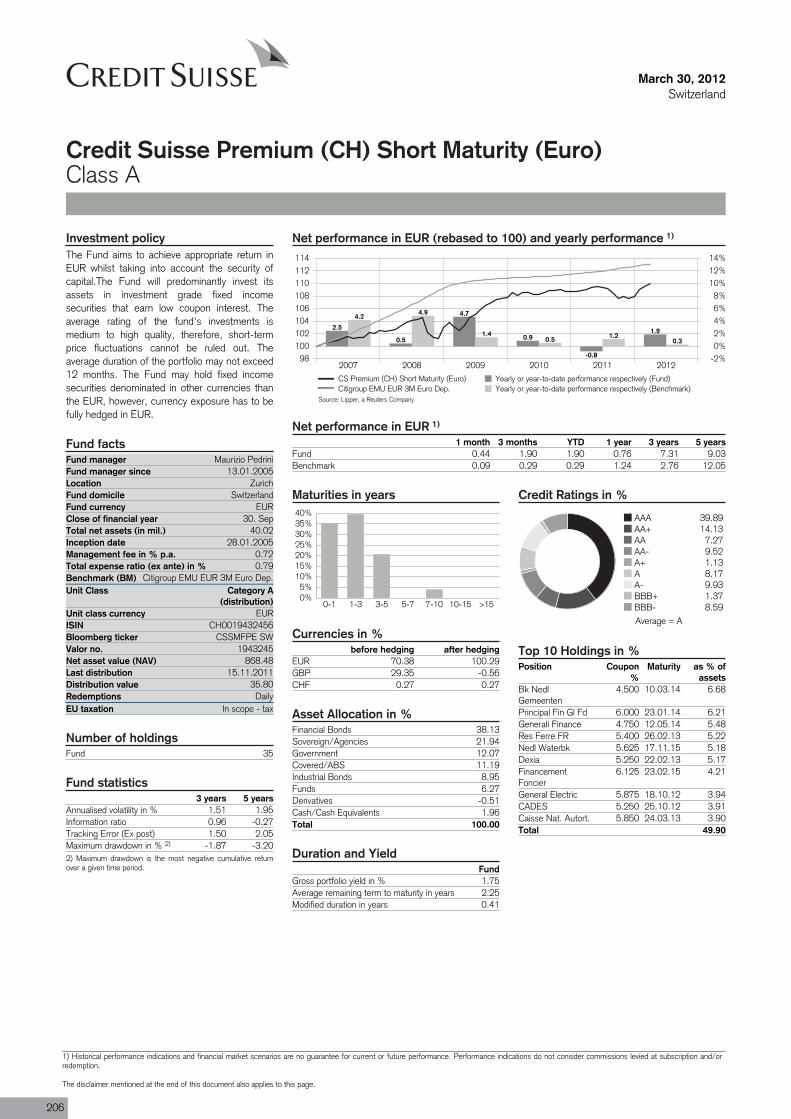
Fund manager Maurizio PedriniFund manager since 13.01.2005Location ZurichFund domicile SwitzerlandFund currency EURClose of financial year 30. SepTotal net assets (in mil.) 40.02Inception date 28.01.2005Management fee in % p.a. 0.72Total expense ratio (ex ante) in % 0.79Benchmark (BM) Citigroup EMU EUR 3M Euro Dep.Unit Class Category A
(distribution)
ISIN CH0019432456
Valor no. 1943245
Last distribution 15.11.2011Distribution value 35.80Redemptions DailyEU taxation In scope - tax
Fund 35
March 30, 2012Switzerland
Credit Suisse Premium (CH) Short Maturity (Euro)Class A
Net performance in EUR (rebased to 100) and yearly performance 1)
2007 2008 2009 2010 2011 201298
100102104106108110112114
-2%0%2%4%6%8%
10%12%14%
2.5
0.5
4.7
0.9
-0.8
1.9
4.24.9
1.40.5 1.2
0.3
CS Premium (CH) Short Maturity (Euro) Yearly or year-to-date performance respectively (Fund)Citigroup EMU EUR 3M Euro Dep. Yearly or year-to-date performance respectively (Benchmark)
Net performance in EUR 1)
1 month 3 months YTD 1 year 3 years 5 yearsFund 0.44 1.90 1.90 0.76 7.31 9.03Benchmark 0.09 0.29 0.29 1.24 2.76 12.05
Maturities in years
0%5%
10%15%20%25%30%35%40%
0-1 1-3 3-5 5-7 7-10 10-15 >15
Currencies in %before hedging after hedging
EUR 70.38 100.29GBP 29.35 -0.56CHF 0.27 0.27
Asset Allocation in %Financial Bonds 38.13Sovereign/Agencies 21.94Government 12.07Covered/ABS 11.19Industrial Bonds 8.95Funds 6.27Derivatives -0.51Cash/Cash Equivalents 1.96Total 100.00
Duration and YieldFund
Gross portfolio yield in % 1.75Average remaining term to maturity in years 2.25Modified duration in years 0.41
Credit Ratings in %
AAA 39.89AA+ 14.13AA 7.27AA- 9.52A+ 1.13A 8.17A- 9.93BBB+ 1.37BBB- 8.59
Top 10 Holdings in %Position Coupon
%Maturity as % of
assetsBk NedlGemeenten
4.500 10.03.14 6.68
Principal Fin Gl Fd 6.000 23.01.14 6.21Generali Finance 4.750 12.05.14 5.48Res Ferre FR 5.400 26.02.13 5.22Nedl Waterbk 5.625 17.11.15 5.18Dexia 5.250 22.02.13 5.17FinancementFoncier
6.125 23.02.15 4.21
General Electric 5.875 18.10.12 3.94CADES 5.250 25.10.12 3.91Caisse Nat. Autort. 5.850 24.03.13 3.90Total 49.90
Investment policyThe Fund aims to achieve appropriate return inEUR whilst taking into account the security ofcapital.The Fund will predominantly invest itsassets in investment grade fixed incomesecurities that earn low coupon interest. Theaverage rating of the fund's investments ismedium to high quality, therefore, short-termprice fluctuations cannot be ruled out. Theaverage duration of the portfolio may not exceed12 months. The Fund may hold fixed incomesecurities denominated in other currencies thanthe EUR, however, currency exposure has to befully hedged in EUR.
Fund facts
Unit class currency EUR
Bloomberg ticker CSSMFPE SW
Net asset value (NAV) 868.48
Number of holdings
Fund statistics3 years 5 years
Annualised volatility in % 1.51 1.95Information ratio 0.96 -0.27Tracking Error (Ex post) 1.50 2.05Maximum drawdown in % 2) -1.87 -3.202) Maximum drawdown is the most negative cumulative returnover a given time period.
Source: Lipper, a Reuters Company
Average = A
206
1) Historical performance indications and financial market scenarios are no guarantee for current or future performance. Performance indications do not consider commissions levied at subscription and/orredemption.
The disclaimer mentioned at the end of this document also applies to this page.
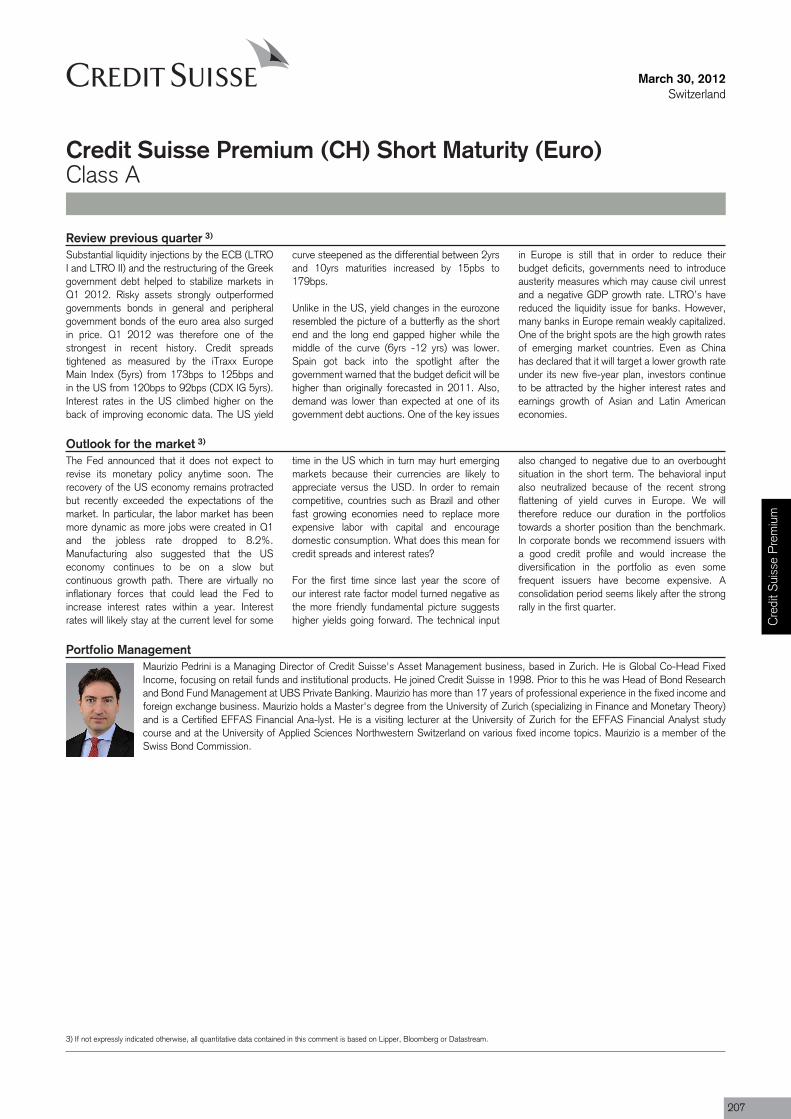
March 30, 2012Switzerland
Credit Suisse Premium (CH) Short Maturity (Euro)Class A
Review previous quarter 3)
Substantial liquidity injections by the ECB (LTROI and LTRO II) and the restructuring of the Greekgovernment debt helped to stabilize markets inQ1 2012. Risky assets strongly outperformedgovernments bonds in general and peripheralgovernment bonds of the euro area also surgedin price. Q1 2012 was therefore one of thestrongest in recent history. Credit spreadstightened as measured by the iTraxx EuropeMain Index (5yrs) from 173bps to 125bps andin the US from 120bps to 92bps (CDX IG 5yrs).Interest rates in the US climbed higher on theback of improving economic data. The US yield
curve steepened as the differential between 2yrsand 10yrs maturities increased by 15pbs to179bps.
Unlike in the US, yield changes in the eurozoneresembled the picture of a butterfly as the shortend and the long end gapped higher while themiddle of the curve (6yrs -12 yrs) was lower.Spain got back into the spotlight after thegovernment warned that the budget deficit will behigher than originally forecasted in 2011. Also,demand was lower than expected at one of itsgovernment debt auctions. One of the key issues
in Europe is still that in order to reduce theirbudget deficits, governments need to introduceausterity measures which may cause civil unrestand a negative GDP growth rate. LTRO’s havereduced the liquidity issue for banks. However,many banks in Europe remain weakly capitalized.One of the bright spots are the high growth ratesof emerging market countries. Even as Chinahas declared that it will target a lower growth rateunder its new five-year plan, investors continueto be attracted by the higher interest rates andearnings growth of Asian and Latin Americaneconomies.
Outlook for the market 3)
The Fed announced that it does not expect torevise its monetary policy anytime soon. Therecovery of the US economy remains protractedbut recently exceeded the expectations of themarket. In particular, the labor market has beenmore dynamic as more jobs were created in Q1and the jobless rate dropped to 8.2%.Manufacturing also suggested that the USeconomy continues to be on a slow butcontinuous growth path. There are virtually noinflationary forces that could lead the Fed toincrease interest rates within a year. Interestrates will likely stay at the current level for some
time in the US which in turn may hurt emergingmarkets because their currencies are likely toappreciate versus the USD. In order to remaincompetitive, countries such as Brazil and otherfast growing economies need to replace moreexpensive labor with capital and encouragedomestic consumption. What does this mean forcredit spreads and interest rates?
For the first time since last year the score ofour interest rate factor model turned negative asthe more friendly fundamental picture suggestshigher yields going forward. The technical input
also changed to negative due to an overboughtsituation in the short term. The behavioral inputalso neutralized because of the recent strongflattening of yield curves in Europe. We willtherefore reduce our duration in the portfoliostowards a shorter position than the benchmark.In corporate bonds we recommend issuers witha good credit profile and would increase thediversification in the portfolio as even somefrequent issuers have become expensive. Aconsolidation period seems likely after the strongrally in the first quarter.
Portfolio ManagementMaurizio Pedrini is a Managing Director of Credit Suisse's Asset Management business, based in Zurich. He is Global Co-Head FixedIncome, focusing on retail funds and institutional products. He joined Credit Suisse in 1998. Prior to this he was Head of Bond Researchand Bond Fund Management at UBS Private Banking. Maurizio has more than 17 years of professional experience in the fixed income andforeign exchange business. Maurizio holds a Master's degree from the University of Zurich (specializing in Finance and Monetary Theory)and is a Certified EFFAS Financial Ana-lyst. He is a visiting lecturer at the University of Zurich for the EFFAS Financial Analyst studycourse and at the University of Applied Sciences Northwestern Switzerland on various fixed income topics. Maurizio is a member of theSwiss Bond Commission.
Cre
dit S
uiss
e P
rem
ium
3) If not expressly indicated otherwise, all quantitative data contained in this comment is based on Lipper, Bloomberg or Datastream.
207
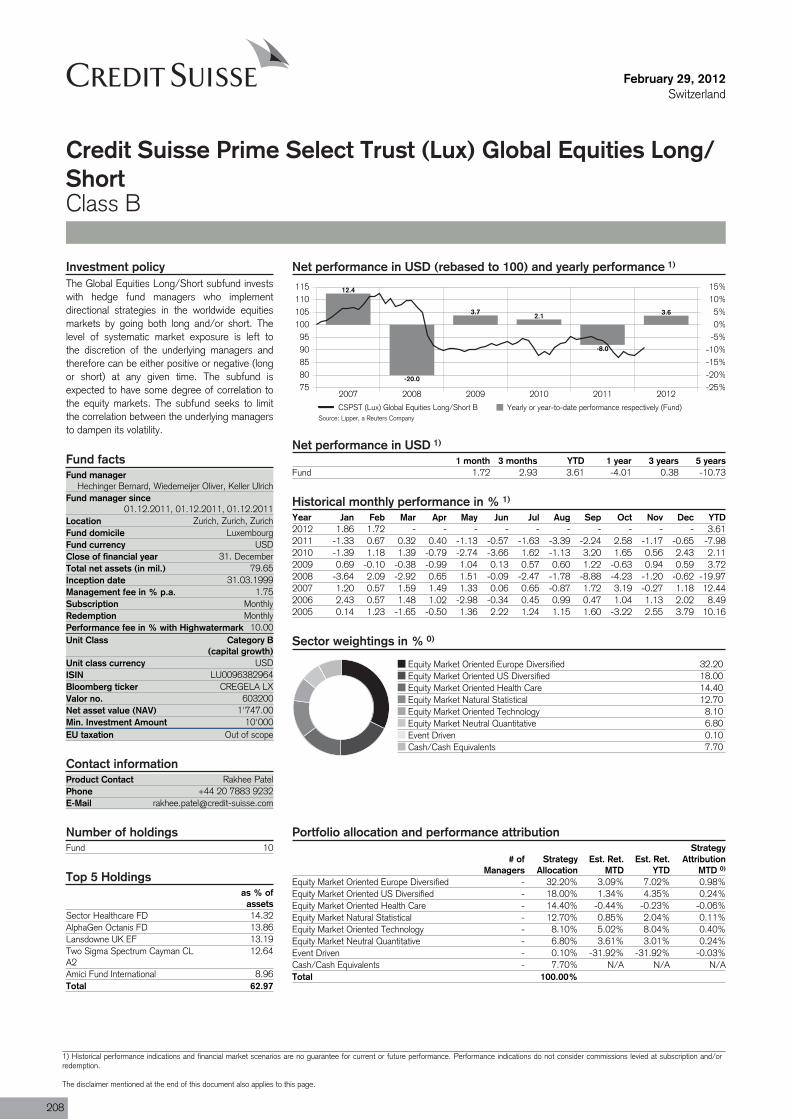
Fund managerHechinger Bernard, Wiedemeijer Oliver, Keller Ulrich
Fund manager since01.12.2011, 01.12.2011, 01.12.2011
Location Zurich, Zurich, ZurichFund domicile LuxembourgFund currency USDClose of financial year 31. DecemberTotal net assets (in mil.) 79.65Inception date 31.03.1999Management fee in % p.a. 1.75Subscription MonthlyRedemption MonthlyPerformance fee in % with Highwatermark 10.00Unit Class Category B
(capital growth)
ISIN LU0096382964
Valor no. 603200
Min. Investment Amount 10'000EU taxation Out of scope
Product Contact Rakhee PatelPhone +44 20 7883 9232
Fund 10
February 29, 2012Switzerland
Credit Suisse Prime Select Trust (Lux) Global Equities Long/ShortClass B
Net performance in USD (rebased to 100) and yearly performance 1)
2007 2008 2009 2010 2011 20127580859095
100105110115
-25%-20%-15%-10%-5%0%5%
10%15%12.4
-20.0
3.7 2.1
-8.0
3.6
CSPST (Lux) Global Equities Long/Short B Yearly or year-to-date performance respectively (Fund)
Net performance in USD 1)
1 month 3 months YTD 1 year 3 years 5 yearsFund 1.72 2.93 3.61 -4.01 0.38 -10.73
Historical monthly performance in % 1)
Year Jan Feb Mar Apr May Jun Jul Aug Sep Oct Nov Dec YTD2012 1.86 1.72 - - - - - - - - - - 3.612011 -1.33 0.67 0.32 0.40 -1.13 -0.57 -1.63 -3.39 -2.24 2.58 -1.17 -0.65 -7.982010 -1.39 1.18 1.39 -0.79 -2.74 -3.66 1.62 -1.13 3.20 1.65 0.56 2.43 2.112009 0.69 -0.10 -0.38 -0.99 1.04 0.13 0.57 0.60 1.22 -0.63 0.94 0.59 3.722008 -3.64 2.09 -2.92 0.65 1.51 -0.09 -2.47 -1.78 -8.88 -4.23 -1.20 -0.62 -19.972007 1.20 0.57 1.59 1.49 1.33 0.06 0.65 -0.87 1.72 3.19 -0.27 1.18 12.442006 2.43 0.57 1.48 1.02 -2.98 -0.34 0.45 0.99 0.47 1.04 1.13 2.02 8.492005 0.14 1.23 -1.65 -0.50 1.36 2.22 1.24 1.15 1.60 -3.22 2.55 3.79 10.16
Investment policyThe Global Equities Long/Short subfund investswith hedge fund managers who implementdirectional strategies in the worldwide equitiesmarkets by going both long and/or short. Thelevel of systematic market exposure is left tothe discretion of the underlying managers andtherefore can be either positive or negative (longor short) at any given time. The subfund isexpected to have some degree of correlation tothe equity markets. The subfund seeks to limitthe correlation between the underlying managersto dampen its volatility.
Fund facts
Unit class currency USD
Bloomberg ticker CREGELA LX
Net asset value (NAV) 1'747.00
Contact information
E-Mail [email protected]
Sector weightings in % 0)
Equity Market Oriented Europe Diversified 32.20Equity Market Oriented US Diversified 18.00Equity Market Oriented Health Care 14.40Equity Market Natural Statistical 12.70Equity Market Oriented Technology 8.10Equity Market Neutral Quantitative 6.80Event Driven 0.10Cash/Cash Equivalents 7.70
Portfolio allocation and performance attribution
# ofManagers
StrategyAllocation
Est. Ret.MTD
Est. Ret.YTD
StrategyAttribution
MTD 0)
Equity Market Oriented Europe Diversified - 32.20% 3.09% 7.02% 0.98%Equity Market Oriented US Diversified - 18.00% 1.34% 4.35% 0.24%Equity Market Oriented Health Care - 14.40% -0.44% -0.23% -0.06%Equity Market Natural Statistical - 12.70% 0.85% 2.04% 0.11%Equity Market Oriented Technology - 8.10% 5.02% 8.04% 0.40%Equity Market Neutral Quantitative - 6.80% 3.61% 3.01% 0.24%Event Driven - 0.10% -31.92% -31.92% -0.03%Cash/Cash Equivalents - 7.70% N/A N/A N/ATotal 100.00%
Number of holdings
Top 5 Holdingsas % of
assetsSector Healthcare FD 14.32AlphaGen Octanis FD 13.86Lansdowne UK EF 13.19Two Sigma Spectrum Cayman CLA2
12.64
Amici Fund International 8.96Total 62.97
Source: Lipper, a Reuters Company
208
1) Historical performance indications and financial market scenarios are no guarantee for current or future performance. Performance indications do not consider commissions levied at subscription and/orredemption.
The disclaimer mentioned at the end of this document also applies to this page.
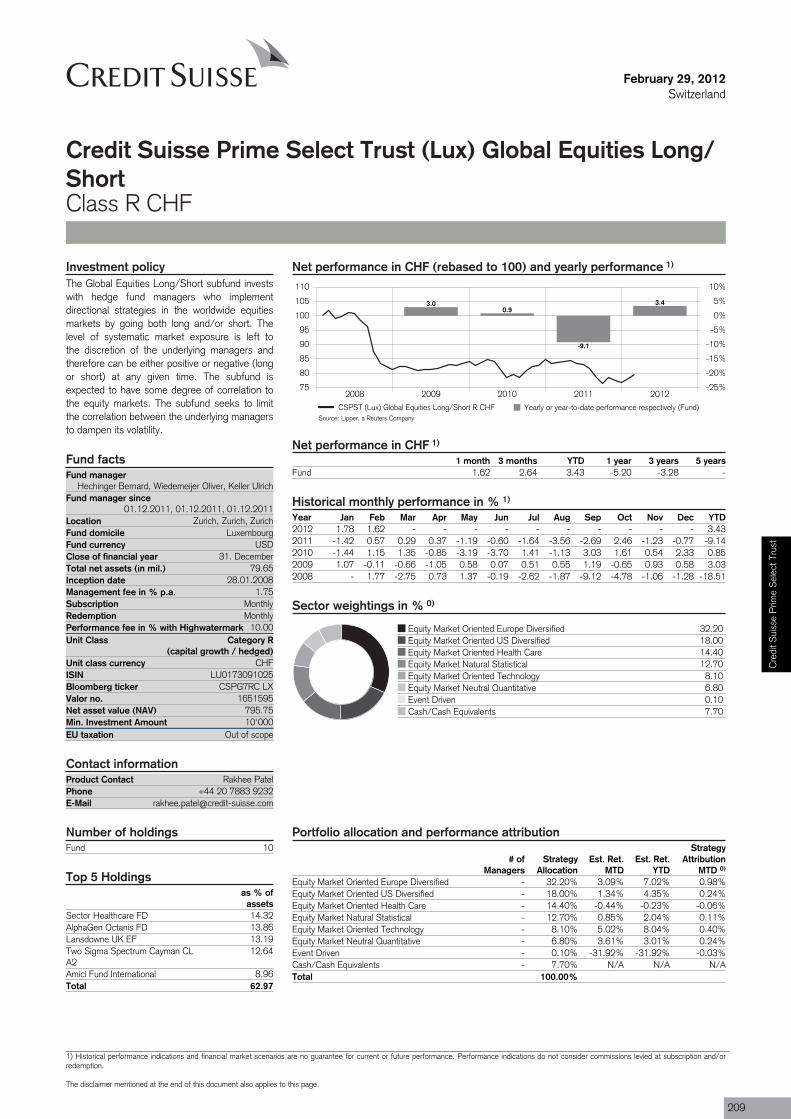
Fund managerHechinger Bernard, Wiedemeijer Oliver, Keller Ulrich
Fund manager since01.12.2011, 01.12.2011, 01.12.2011
Location Zurich, Zurich, ZurichFund domicile LuxembourgFund currency USDClose of financial year 31. DecemberTotal net assets (in mil.) 79.65Inception date 28.01.2008Management fee in % p.a. 1.75Subscription MonthlyRedemption MonthlyPerformance fee in % with Highwatermark 10.00Unit Class Category R
(capital growth / hedged)
ISIN LU0173091025
Valor no. 1651595
Min. Investment Amount 10'000EU taxation Out of scope
Product Contact Rakhee PatelPhone +44 20 7883 9232
Fund 10
February 29, 2012Switzerland
Credit Suisse Prime Select Trust (Lux) Global Equities Long/ShortClass R CHF
Net performance in CHF (rebased to 100) and yearly performance 1)
2008 2009 2010 2011 201275
80
85
90
95
100
105
110
-25%
-20%
-15%
-10%
-5%
0%
5%
10%
3.00.9
-9.1
3.4
CSPST (Lux) Global Equities Long/Short R CHF Yearly or year-to-date performance respectively (Fund)
Net performance in CHF 1)
1 month 3 months YTD 1 year 3 years 5 yearsFund 1.62 2.64 3.43 -5.20 -3.28 -
Historical monthly performance in % 1)
Year Jan Feb Mar Apr May Jun Jul Aug Sep Oct Nov Dec YTD2012 1.78 1.62 - - - - - - - - - - 3.432011 -1.42 0.57 0.29 0.37 -1.19 -0.60 -1.64 -3.56 -2.69 2.46 -1.23 -0.77 -9.142010 -1.44 1.15 1.35 -0.85 -3.19 -3.70 1.41 -1.13 3.03 1.61 0.54 2.33 0.852009 1.07 -0.11 -0.66 -1.05 0.58 0.07 0.51 0.55 1.19 -0.65 0.93 0.58 3.032008 - 1.77 -2.75 0.73 1.37 -0.19 -2.62 -1.87 -9.12 -4.78 -1.06 -1.28 -18.51
Investment policyThe Global Equities Long/Short subfund investswith hedge fund managers who implementdirectional strategies in the worldwide equitiesmarkets by going both long and/or short. Thelevel of systematic market exposure is left tothe discretion of the underlying managers andtherefore can be either positive or negative (longor short) at any given time. The subfund isexpected to have some degree of correlation tothe equity markets. The subfund seeks to limitthe correlation between the underlying managersto dampen its volatility.
Fund facts
Unit class currency CHF
Bloomberg ticker CSPG7RC LX
Net asset value (NAV) 795.75
Contact information
E-Mail [email protected]
Sector weightings in % 0)
Equity Market Oriented Europe Diversified 32.20Equity Market Oriented US Diversified 18.00Equity Market Oriented Health Care 14.40Equity Market Natural Statistical 12.70Equity Market Oriented Technology 8.10Equity Market Neutral Quantitative 6.80Event Driven 0.10Cash/Cash Equivalents 7.70
Portfolio allocation and performance attribution
# ofManagers
StrategyAllocation
Est. Ret.MTD
Est. Ret.YTD
StrategyAttribution
MTD 0)
Equity Market Oriented Europe Diversified - 32.20% 3.09% 7.02% 0.98%Equity Market Oriented US Diversified - 18.00% 1.34% 4.35% 0.24%Equity Market Oriented Health Care - 14.40% -0.44% -0.23% -0.06%Equity Market Natural Statistical - 12.70% 0.85% 2.04% 0.11%Equity Market Oriented Technology - 8.10% 5.02% 8.04% 0.40%Equity Market Neutral Quantitative - 6.80% 3.61% 3.01% 0.24%Event Driven - 0.10% -31.92% -31.92% -0.03%Cash/Cash Equivalents - 7.70% N/A N/A N/ATotal 100.00%
Number of holdings
Top 5 Holdingsas % of
assetsSector Healthcare FD 14.32AlphaGen Octanis FD 13.86Lansdowne UK EF 13.19Two Sigma Spectrum Cayman CLA2
12.64
Amici Fund International 8.96Total 62.97
Source: Lipper, a Reuters Company
Cre
dit S
uiss
e P
rime
Sel
ect T
rust
1) Historical performance indications and financial market scenarios are no guarantee for current or future performance. Performance indications do not consider commissions levied at subscription and/orredemption.
The disclaimer mentioned at the end of this document also applies to this page.
209

Fund managerHechinger Bernard, Wiedemeijer Oliver, Keller Ulrich
Fund manager since01.12.2011, 01.12.2011, 01.12.2011
Location Zurich, Zurich, ZurichFund domicile LuxembourgFund currency USDClose of financial year 31. DecemberTotal net assets (in mil.) 79.65Inception date 28.08.2006Management fee in % p.a. 1.75Subscription MonthlyRedemption MonthlyPerformance fee in % with Highwatermark 10.00Unit Class Category R
(capital growth / hedged)
ISIN LU0173093401
Valor no. 1651607
Min. Investment Amount 10'000EU taxation Out of scope
Product Contact Rakhee PatelPhone +44 20 7883 9232
Fund 10
February 29, 2012Switzerland
Credit Suisse Prime Select Trust (Lux) Global Equities Long/ShortClass R EUR
Net performance in EUR (rebased to 100) and yearly performance 1)
2007 2008 2009 2010 2011 20127580859095
100105110115
-25%-20%-15%-10%-5%0%5%
10%15%
10.9
-20.3
3.90.9
-7.7
3.6
CSPST (Lux) Global Equities Long/Short R EUR Yearly or year-to-date performance respectively (Fund)
Net performance in EUR 1)
1 month 3 months YTD 1 year 3 years 5 yearsFund 1.65 2.89 3.56 -3.95 -0.45 -12.79
Historical monthly performance in % 1)
Year Jan Feb Mar Apr May Jun Jul Aug Sep Oct Nov Dec YTD2012 1.88 1.65 - - - - - - - - - - 3.562011 -1.00 0.51 0.31 0.38 -1.03 -0.51 -1.59 -3.32 -2.40 2.56 -1.13 -0.65 -7.712010 -1.44 1.18 1.40 -0.83 -3.22 -3.55 1.32 -1.10 2.75 1.63 0.67 2.36 0.952009 0.72 -0.05 -0.37 -0.99 1.03 0.15 0.57 0.59 1.22 -0.62 0.98 0.61 3.882008 -3.69 2.16 -2.68 0.75 1.61 0.08 -2.40 -1.80 -9.23 -5.08 -1.10 -0.58 -20.342007 1.06 0.47 1.47 1.37 1.20 -0.05 0.56 -0.98 1.55 3.04 -0.32 1.11 10.922006 - - - - - - - - 0.32 1.20 1.26 1.33 4.18
Investment policyThe Global Equities Long/Short subfund investswith hedge fund managers who implementdirectional strategies in the worldwide equitiesmarkets by going both long and/or short. Thelevel of systematic market exposure is left tothe discretion of the underlying managers andtherefore can be either positive or negative (longor short) at any given time. The subfund isexpected to have some degree of correlation tothe equity markets. The subfund seeks to limitthe correlation between the underlying managersto dampen its volatility.
Fund facts
Unit class currency EUR
Bloomberg ticker GREGLSH LX
Net asset value (NAV) 922.40
Contact information
E-Mail [email protected]
Sector weightings in % 0)
Equity Market Oriented Europe Diversified 32.20Equity Market Oriented US Diversified 18.00Equity Market Oriented Health Care 14.40Equity Market Natural Statistical 12.70Equity Market Oriented Technology 8.10Equity Market Neutral Quantitative 6.80Event Driven 0.10Cash/Cash Equivalents 7.70
Portfolio allocation and performance attribution
# ofManagers
StrategyAllocation
Est. Ret.MTD
Est. Ret.YTD
StrategyAttribution
MTD 0)
Equity Market Oriented Europe Diversified - 32.20% 3.09% 7.02% 0.98%Equity Market Oriented US Diversified - 18.00% 1.34% 4.35% 0.24%Equity Market Oriented Health Care - 14.40% -0.44% -0.23% -0.06%Equity Market Natural Statistical - 12.70% 0.85% 2.04% 0.11%Equity Market Oriented Technology - 8.10% 5.02% 8.04% 0.40%Equity Market Neutral Quantitative - 6.80% 3.61% 3.01% 0.24%Event Driven - 0.10% -31.92% -31.92% -0.03%Cash/Cash Equivalents - 7.70% N/A N/A N/ATotal 100.00%
Number of holdings
Top 5 Holdingsas % of
assetsSector Healthcare FD 14.32AlphaGen Octanis FD 13.86Lansdowne UK EF 13.19Two Sigma Spectrum Cayman CLA2
12.64
Amici Fund International 8.96Total 62.97
Source: Lipper, a Reuters Company
210
1) Historical performance indications and financial market scenarios are no guarantee for current or future performance. Performance indications do not consider commissions levied at subscription and/orredemption.
The disclaimer mentioned at the end of this document also applies to this page.
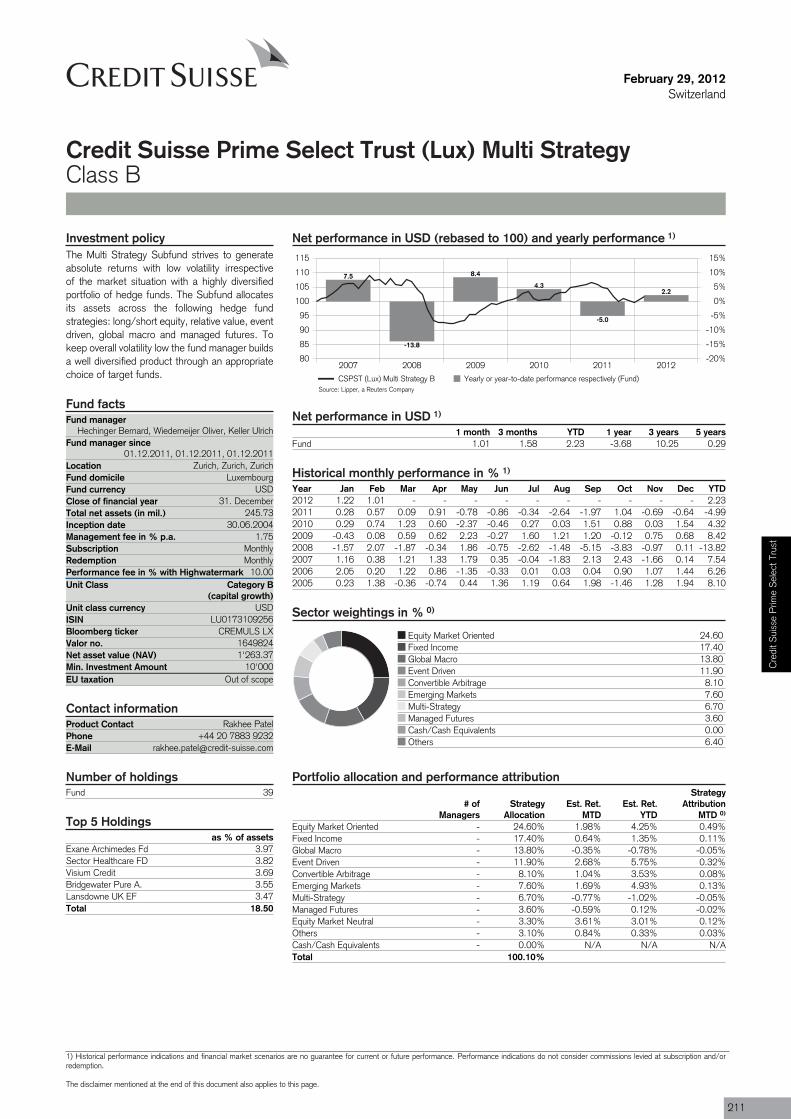
Fund managerHechinger Bernard, Wiedemeijer Oliver, Keller Ulrich
Fund manager since01.12.2011, 01.12.2011, 01.12.2011
Location Zurich, Zurich, ZurichFund domicile LuxembourgFund currency USDClose of financial year 31. DecemberTotal net assets (in mil.) 245.73Inception date 30.06.2004Management fee in % p.a. 1.75Subscription MonthlyRedemption MonthlyPerformance fee in % with Highwatermark 10.00Unit Class Category B
(capital growth)
ISIN LU0173109256
Valor no. 1649824
Min. Investment Amount 10'000EU taxation Out of scope
Product Contact Rakhee PatelPhone +44 20 7883 9232
Fund 39
February 29, 2012Switzerland
Credit Suisse Prime Select Trust (Lux) Multi StrategyClass B
Net performance in USD (rebased to 100) and yearly performance 1)
2007 2008 2009 2010 2011 201280
85
90
95
100
105
110
115
-20%
-15%
-10%
-5%
0%
5%
10%
15%
7.5
-13.8
8.4
4.3
-5.0
2.2
CSPST (Lux) Multi Strategy B Yearly or year-to-date performance respectively (Fund)
Net performance in USD 1)
1 month 3 months YTD 1 year 3 years 5 yearsFund 1.01 1.58 2.23 -3.68 10.25 0.29
Historical monthly performance in % 1)
Year Jan Feb Mar Apr May Jun Jul Aug Sep Oct Nov Dec YTD2012 1.22 1.01 - - - - - - - - - - 2.232011 0.28 0.57 0.09 0.91 -0.78 -0.86 -0.34 -2.64 -1.97 1.04 -0.69 -0.64 -4.992010 0.29 0.74 1.23 0.60 -2.37 -0.46 0.27 0.03 1.51 0.88 0.03 1.54 4.322009 -0.43 0.08 0.59 0.62 2.23 -0.27 1.60 1.21 1.20 -0.12 0.75 0.68 8.422008 -1.57 2.07 -1.87 -0.34 1.86 -0.75 -2.62 -1.48 -5.15 -3.83 -0.97 0.11 -13.822007 1.16 0.38 1.21 1.33 1.79 0.35 -0.04 -1.83 2.13 2.43 -1.66 0.14 7.542006 2.05 0.20 1.22 0.86 -1.35 -0.33 0.01 0.03 0.04 0.90 1.07 1.44 6.262005 0.23 1.38 -0.36 -0.74 0.44 1.36 1.19 0.64 1.98 -1.46 1.28 1.94 8.10
Investment policyThe Multi Strategy Subfund strives to generateabsolute returns with low volatility irrespectiveof the market situation with a highly diversifiedportfolio of hedge funds. The Subfund allocatesits assets across the following hedge fundstrategies: long/short equity, relative value, eventdriven, global macro and managed futures. Tokeep overall volatility low the fund manager buildsa well diversified product through an appropriatechoice of target funds.
Fund facts
Unit class currency USD
Bloomberg ticker CREMULS LX
Net asset value (NAV) 1'263.37
Contact information
E-Mail [email protected]
Sector weightings in % 0)
Equity Market Oriented 24.60Fixed Income 17.40Global Macro 13.80Event Driven 11.90Convertible Arbitrage 8.10Emerging Markets 7.60Multi-Strategy 6.70Managed Futures 3.60Cash/Cash Equivalents 0.00Others 6.40
Portfolio allocation and performance attribution
# ofManagers
StrategyAllocation
Est. Ret.MTD
Est. Ret.YTD
StrategyAttribution
MTD 0)
Equity Market Oriented - 24.60% 1.98% 4.25% 0.49%Fixed Income - 17.40% 0.64% 1.35% 0.11%Global Macro - 13.80% -0.35% -0.78% -0.05%Event Driven - 11.90% 2.68% 5.75% 0.32%Convertible Arbitrage - 8.10% 1.04% 3.53% 0.08%Emerging Markets - 7.60% 1.69% 4.93% 0.13%Multi-Strategy - 6.70% -0.77% -1.02% -0.05%Managed Futures - 3.60% -0.59% 0.12% -0.02%Equity Market Neutral - 3.30% 3.61% 3.01% 0.12%Others - 3.10% 0.84% 0.33% 0.03%Cash/Cash Equivalents - 0.00% N/A N/A N/ATotal 100.10%
Number of holdings
Top 5 Holdingsas % of assets
Exane Archimedes Fd 3.97Sector Healthcare FD 3.82Visium Credit 3.69Bridgewater Pure A. 3.55Lansdowne UK EF 3.47Total 18.50
Source: Lipper, a Reuters Company
Cre
dit S
uiss
e P
rime
Sel
ect T
rust
1) Historical performance indications and financial market scenarios are no guarantee for current or future performance. Performance indications do not consider commissions levied at subscription and/orredemption.
The disclaimer mentioned at the end of this document also applies to this page.
211
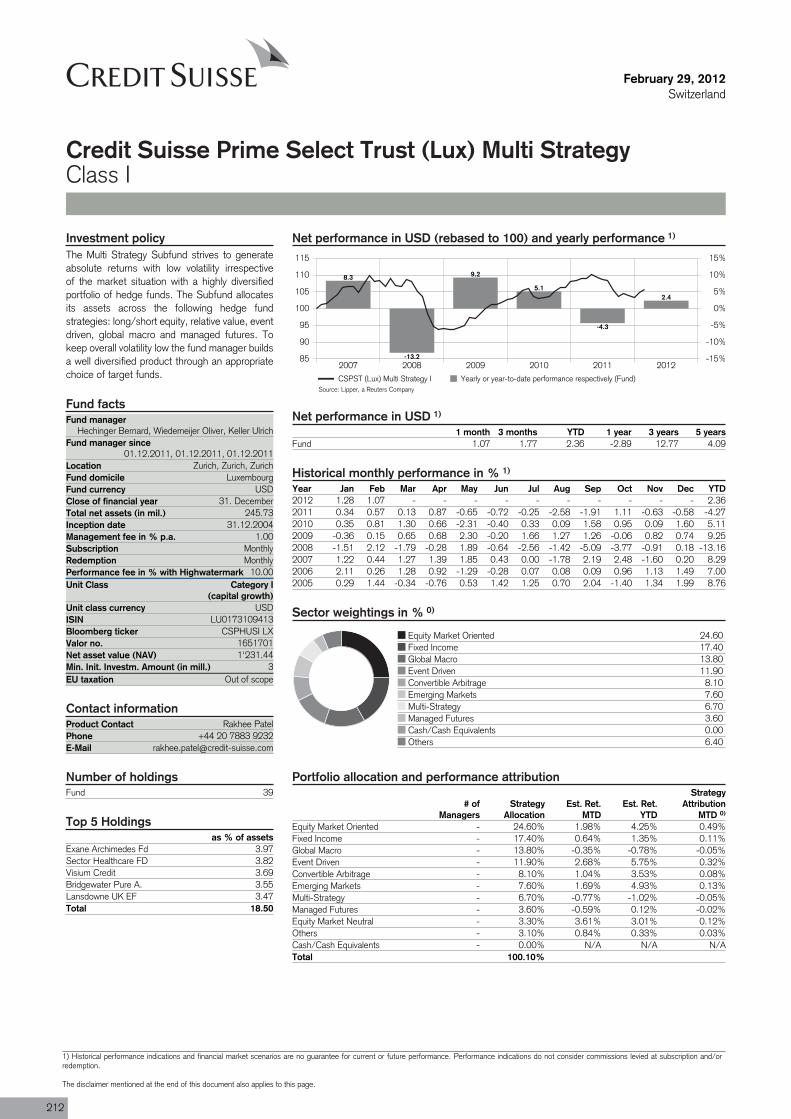
Fund managerHechinger Bernard, Wiedemeijer Oliver, Keller Ulrich
Fund manager since01.12.2011, 01.12.2011, 01.12.2011
Location Zurich, Zurich, ZurichFund domicile LuxembourgFund currency USDClose of financial year 31. DecemberTotal net assets (in mil.) 245.73Inception date 31.12.2004Management fee in % p.a. 1.00Subscription MonthlyRedemption MonthlyPerformance fee in % with Highwatermark 10.00Unit Class Category I
(capital growth)
ISIN LU0173109413
Valor no. 1651701
Min. Init. Investm. Amount (in mill.) 3EU taxation Out of scope
Product Contact Rakhee PatelPhone +44 20 7883 9232
Fund 39
February 29, 2012Switzerland
Credit Suisse Prime Select Trust (Lux) Multi StrategyClass I
Net performance in USD (rebased to 100) and yearly performance 1)
2007 2008 2009 2010 2011 201285
90
95
100
105
110
115
-15%
-10%
-5%
0%
5%
10%
15%
8.3
-13.2
9.2
5.1
-4.3
2.4
CSPST (Lux) Multi Strategy I Yearly or year-to-date performance respectively (Fund)
Net performance in USD 1)
1 month 3 months YTD 1 year 3 years 5 yearsFund 1.07 1.77 2.36 -2.89 12.77 4.09
Historical monthly performance in % 1)
Year Jan Feb Mar Apr May Jun Jul Aug Sep Oct Nov Dec YTD2012 1.28 1.07 - - - - - - - - - - 2.362011 0.34 0.57 0.13 0.87 -0.65 -0.72 -0.25 -2.58 -1.91 1.11 -0.63 -0.58 -4.272010 0.35 0.81 1.30 0.66 -2.31 -0.40 0.33 0.09 1.58 0.95 0.09 1.60 5.112009 -0.36 0.15 0.65 0.68 2.30 -0.20 1.66 1.27 1.26 -0.06 0.82 0.74 9.252008 -1.51 2.12 -1.79 -0.28 1.89 -0.64 -2.56 -1.42 -5.09 -3.77 -0.91 0.18 -13.162007 1.22 0.44 1.27 1.39 1.85 0.43 0.00 -1.78 2.19 2.48 -1.60 0.20 8.292006 2.11 0.26 1.28 0.92 -1.29 -0.28 0.07 0.08 0.09 0.96 1.13 1.49 7.002005 0.29 1.44 -0.34 -0.76 0.53 1.42 1.25 0.70 2.04 -1.40 1.34 1.99 8.76
Investment policyThe Multi Strategy Subfund strives to generateabsolute returns with low volatility irrespectiveof the market situation with a highly diversifiedportfolio of hedge funds. The Subfund allocatesits assets across the following hedge fundstrategies: long/short equity, relative value, eventdriven, global macro and managed futures. Tokeep overall volatility low the fund manager buildsa well diversified product through an appropriatechoice of target funds.
Fund facts
Unit class currency USD
Bloomberg ticker CSPHUSI LX
Net asset value (NAV) 1'231.44
Contact information
E-Mail [email protected]
Sector weightings in % 0)
Equity Market Oriented 24.60Fixed Income 17.40Global Macro 13.80Event Driven 11.90Convertible Arbitrage 8.10Emerging Markets 7.60Multi-Strategy 6.70Managed Futures 3.60Cash/Cash Equivalents 0.00Others 6.40
Portfolio allocation and performance attribution
# ofManagers
StrategyAllocation
Est. Ret.MTD
Est. Ret.YTD
StrategyAttribution
MTD 0)
Equity Market Oriented - 24.60% 1.98% 4.25% 0.49%Fixed Income - 17.40% 0.64% 1.35% 0.11%Global Macro - 13.80% -0.35% -0.78% -0.05%Event Driven - 11.90% 2.68% 5.75% 0.32%Convertible Arbitrage - 8.10% 1.04% 3.53% 0.08%Emerging Markets - 7.60% 1.69% 4.93% 0.13%Multi-Strategy - 6.70% -0.77% -1.02% -0.05%Managed Futures - 3.60% -0.59% 0.12% -0.02%Equity Market Neutral - 3.30% 3.61% 3.01% 0.12%Others - 3.10% 0.84% 0.33% 0.03%Cash/Cash Equivalents - 0.00% N/A N/A N/ATotal 100.10%
Number of holdings
Top 5 Holdingsas % of assets
Exane Archimedes Fd 3.97Sector Healthcare FD 3.82Visium Credit 3.69Bridgewater Pure A. 3.55Lansdowne UK EF 3.47Total 18.50
Source: Lipper, a Reuters Company
212
1) Historical performance indications and financial market scenarios are no guarantee for current or future performance. Performance indications do not consider commissions levied at subscription and/orredemption.
The disclaimer mentioned at the end of this document also applies to this page.
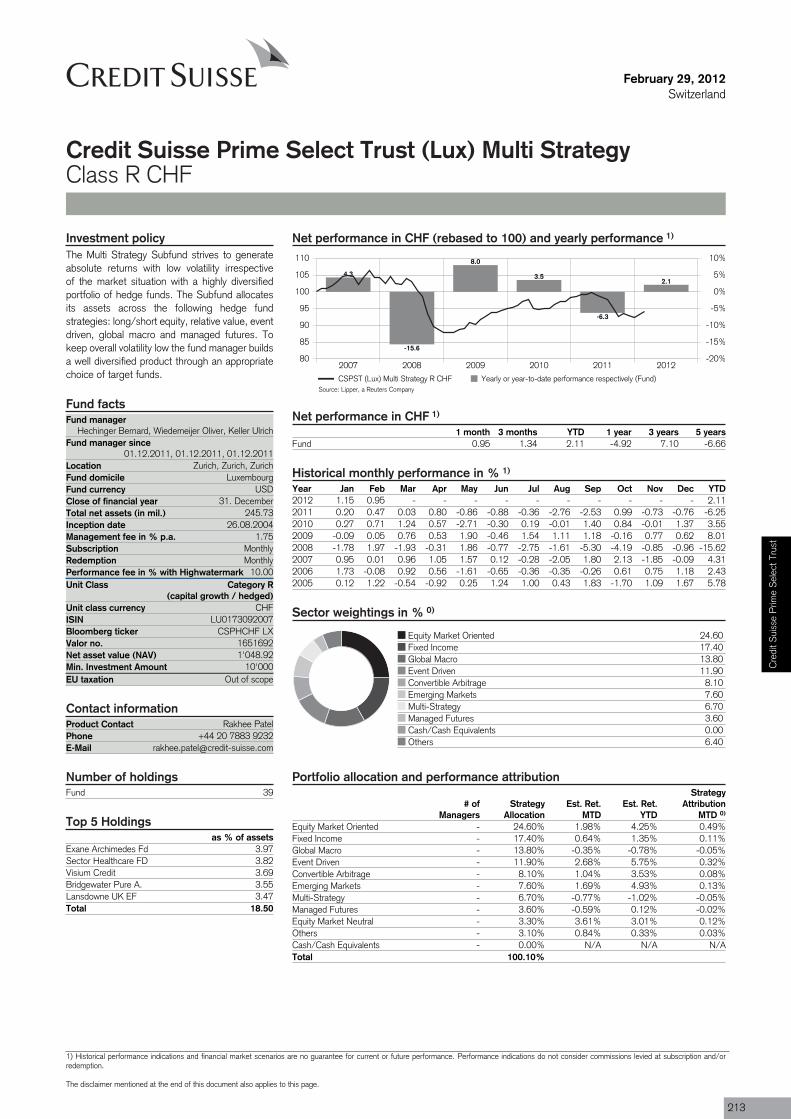
Fund managerHechinger Bernard, Wiedemeijer Oliver, Keller Ulrich
Fund manager since01.12.2011, 01.12.2011, 01.12.2011
Location Zurich, Zurich, ZurichFund domicile LuxembourgFund currency USDClose of financial year 31. DecemberTotal net assets (in mil.) 245.73Inception date 26.08.2004Management fee in % p.a. 1.75Subscription MonthlyRedemption MonthlyPerformance fee in % with Highwatermark 10.00Unit Class Category R
(capital growth / hedged)
ISIN LU0173092007
Valor no. 1651692
Min. Investment Amount 10'000EU taxation Out of scope
Product Contact Rakhee PatelPhone +44 20 7883 9232
Fund 39
February 29, 2012Switzerland
Credit Suisse Prime Select Trust (Lux) Multi StrategyClass R CHF
Net performance in CHF (rebased to 100) and yearly performance 1)
2007 2008 2009 2010 2011 201280
85
90
95
100
105
110
-20%
-15%
-10%
-5%
0%
5%
10%
4.3
-15.6
8.0
3.5
-6.3
2.1
CSPST (Lux) Multi Strategy R CHF Yearly or year-to-date performance respectively (Fund)
Net performance in CHF 1)
1 month 3 months YTD 1 year 3 years 5 yearsFund 0.95 1.34 2.11 -4.92 7.10 -6.66
Historical monthly performance in % 1)
Year Jan Feb Mar Apr May Jun Jul Aug Sep Oct Nov Dec YTD2012 1.15 0.95 - - - - - - - - - - 2.112011 0.20 0.47 0.03 0.80 -0.86 -0.88 -0.36 -2.76 -2.53 0.99 -0.73 -0.76 -6.252010 0.27 0.71 1.24 0.57 -2.71 -0.30 0.19 -0.01 1.40 0.84 -0.01 1.37 3.552009 -0.09 0.05 0.76 0.53 1.90 -0.46 1.54 1.11 1.18 -0.16 0.77 0.62 8.012008 -1.78 1.97 -1.93 -0.31 1.86 -0.77 -2.75 -1.61 -5.30 -4.19 -0.85 -0.96 -15.622007 0.95 0.01 0.96 1.05 1.57 0.12 -0.28 -2.05 1.80 2.13 -1.85 -0.09 4.312006 1.73 -0.08 0.92 0.56 -1.61 -0.65 -0.36 -0.35 -0.26 0.61 0.75 1.18 2.432005 0.12 1.22 -0.54 -0.92 0.25 1.24 1.00 0.43 1.83 -1.70 1.09 1.67 5.78
Investment policyThe Multi Strategy Subfund strives to generateabsolute returns with low volatility irrespectiveof the market situation with a highly diversifiedportfolio of hedge funds. The Subfund allocatesits assets across the following hedge fundstrategies: long/short equity, relative value, eventdriven, global macro and managed futures. Tokeep overall volatility low the fund manager buildsa well diversified product through an appropriatechoice of target funds.
Fund facts
Unit class currency CHF
Bloomberg ticker CSPHCHF LX
Net asset value (NAV) 1'048.92
Contact information
E-Mail [email protected]
Sector weightings in % 0)
Equity Market Oriented 24.60Fixed Income 17.40Global Macro 13.80Event Driven 11.90Convertible Arbitrage 8.10Emerging Markets 7.60Multi-Strategy 6.70Managed Futures 3.60Cash/Cash Equivalents 0.00Others 6.40
Portfolio allocation and performance attribution
# ofManagers
StrategyAllocation
Est. Ret.MTD
Est. Ret.YTD
StrategyAttribution
MTD 0)
Equity Market Oriented - 24.60% 1.98% 4.25% 0.49%Fixed Income - 17.40% 0.64% 1.35% 0.11%Global Macro - 13.80% -0.35% -0.78% -0.05%Event Driven - 11.90% 2.68% 5.75% 0.32%Convertible Arbitrage - 8.10% 1.04% 3.53% 0.08%Emerging Markets - 7.60% 1.69% 4.93% 0.13%Multi-Strategy - 6.70% -0.77% -1.02% -0.05%Managed Futures - 3.60% -0.59% 0.12% -0.02%Equity Market Neutral - 3.30% 3.61% 3.01% 0.12%Others - 3.10% 0.84% 0.33% 0.03%Cash/Cash Equivalents - 0.00% N/A N/A N/ATotal 100.10%
Number of holdings
Top 5 Holdingsas % of assets
Exane Archimedes Fd 3.97Sector Healthcare FD 3.82Visium Credit 3.69Bridgewater Pure A. 3.55Lansdowne UK EF 3.47Total 18.50
Source: Lipper, a Reuters Company
Cre
dit S
uiss
e P
rime
Sel
ect T
rust
1) Historical performance indications and financial market scenarios are no guarantee for current or future performance. Performance indications do not consider commissions levied at subscription and/orredemption.
The disclaimer mentioned at the end of this document also applies to this page.
213
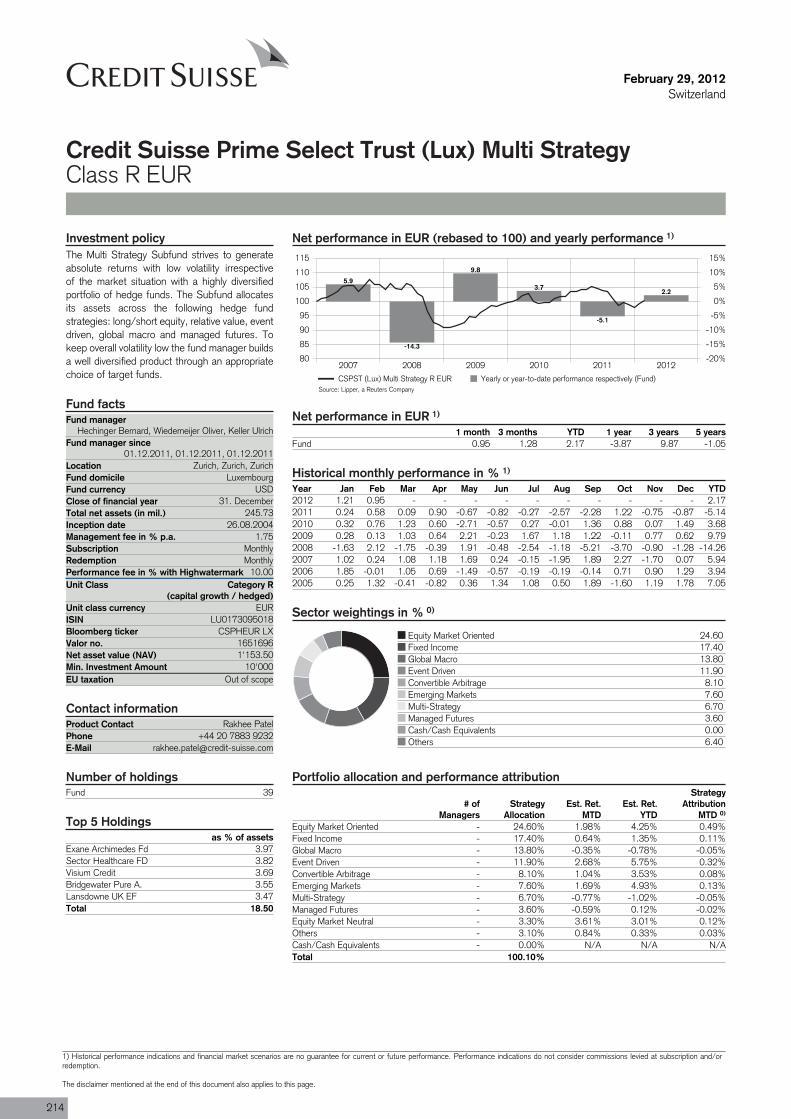
Fund managerHechinger Bernard, Wiedemeijer Oliver, Keller Ulrich
Fund manager since01.12.2011, 01.12.2011, 01.12.2011
Location Zurich, Zurich, ZurichFund domicile LuxembourgFund currency USDClose of financial year 31. DecemberTotal net assets (in mil.) 245.73Inception date 26.08.2004Management fee in % p.a. 1.75Subscription MonthlyRedemption MonthlyPerformance fee in % with Highwatermark 10.00Unit Class Category R
(capital growth / hedged)
ISIN LU0173095018
Valor no. 1651696
Min. Investment Amount 10'000EU taxation Out of scope
Product Contact Rakhee PatelPhone +44 20 7883 9232
Fund 39
February 29, 2012Switzerland
Credit Suisse Prime Select Trust (Lux) Multi StrategyClass R EUR
Net performance in EUR (rebased to 100) and yearly performance 1)
2007 2008 2009 2010 2011 201280
85
90
95
100
105
110
115
-20%
-15%
-10%
-5%
0%
5%
10%
15%
5.9
-14.3
9.8
3.7
-5.1
2.2
CSPST (Lux) Multi Strategy R EUR Yearly or year-to-date performance respectively (Fund)
Net performance in EUR 1)
1 month 3 months YTD 1 year 3 years 5 yearsFund 0.95 1.28 2.17 -3.87 9.87 -1.05
Historical monthly performance in % 1)
Year Jan Feb Mar Apr May Jun Jul Aug Sep Oct Nov Dec YTD2012 1.21 0.95 - - - - - - - - - - 2.172011 0.24 0.58 0.09 0.90 -0.67 -0.82 -0.27 -2.57 -2.28 1.22 -0.75 -0.87 -5.142010 0.32 0.76 1.23 0.60 -2.71 -0.57 0.27 -0.01 1.36 0.88 0.07 1.49 3.682009 0.28 0.13 1.03 0.64 2.21 -0.23 1.67 1.18 1.22 -0.11 0.77 0.62 9.792008 -1.63 2.12 -1.75 -0.39 1.91 -0.48 -2.54 -1.18 -5.21 -3.70 -0.90 -1.28 -14.262007 1.02 0.24 1.08 1.18 1.69 0.24 -0.15 -1.95 1.89 2.27 -1.70 0.07 5.942006 1.85 -0.01 1.05 0.69 -1.49 -0.57 -0.19 -0.19 -0.14 0.71 0.90 1.29 3.942005 0.25 1.32 -0.41 -0.82 0.36 1.34 1.08 0.50 1.89 -1.60 1.19 1.78 7.05
Investment policyThe Multi Strategy Subfund strives to generateabsolute returns with low volatility irrespectiveof the market situation with a highly diversifiedportfolio of hedge funds. The Subfund allocatesits assets across the following hedge fundstrategies: long/short equity, relative value, eventdriven, global macro and managed futures. Tokeep overall volatility low the fund manager buildsa well diversified product through an appropriatechoice of target funds.
Fund facts
Unit class currency EUR
Bloomberg ticker CSPHEUR LX
Net asset value (NAV) 1'153.50
Contact information
E-Mail [email protected]
Sector weightings in % 0)
Equity Market Oriented 24.60Fixed Income 17.40Global Macro 13.80Event Driven 11.90Convertible Arbitrage 8.10Emerging Markets 7.60Multi-Strategy 6.70Managed Futures 3.60Cash/Cash Equivalents 0.00Others 6.40
Portfolio allocation and performance attribution
# ofManagers
StrategyAllocation
Est. Ret.MTD
Est. Ret.YTD
StrategyAttribution
MTD 0)
Equity Market Oriented - 24.60% 1.98% 4.25% 0.49%Fixed Income - 17.40% 0.64% 1.35% 0.11%Global Macro - 13.80% -0.35% -0.78% -0.05%Event Driven - 11.90% 2.68% 5.75% 0.32%Convertible Arbitrage - 8.10% 1.04% 3.53% 0.08%Emerging Markets - 7.60% 1.69% 4.93% 0.13%Multi-Strategy - 6.70% -0.77% -1.02% -0.05%Managed Futures - 3.60% -0.59% 0.12% -0.02%Equity Market Neutral - 3.30% 3.61% 3.01% 0.12%Others - 3.10% 0.84% 0.33% 0.03%Cash/Cash Equivalents - 0.00% N/A N/A N/ATotal 100.10%
Number of holdings
Top 5 Holdingsas % of assets
Exane Archimedes Fd 3.97Sector Healthcare FD 3.82Visium Credit 3.69Bridgewater Pure A. 3.55Lansdowne UK EF 3.47Total 18.50
Source: Lipper, a Reuters Company
214
1) Historical performance indications and financial market scenarios are no guarantee for current or future performance. Performance indications do not consider commissions levied at subscription and/orredemption.
The disclaimer mentioned at the end of this document also applies to this page.
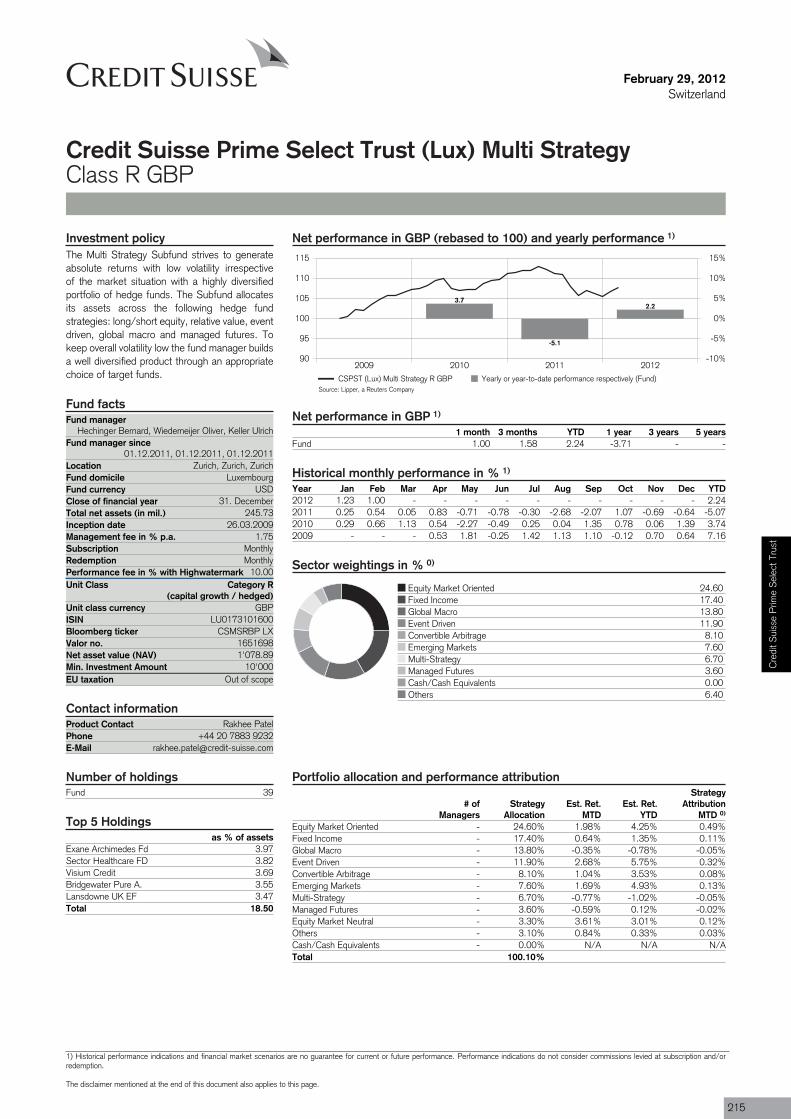
Fund managerHechinger Bernard, Wiedemeijer Oliver, Keller Ulrich
Fund manager since01.12.2011, 01.12.2011, 01.12.2011
Location Zurich, Zurich, ZurichFund domicile LuxembourgFund currency USDClose of financial year 31. DecemberTotal net assets (in mil.) 245.73Inception date 26.03.2009Management fee in % p.a. 1.75Subscription MonthlyRedemption MonthlyPerformance fee in % with Highwatermark 10.00Unit Class Category R
(capital growth / hedged)
ISIN LU0173101600
Valor no. 1651698
Min. Investment Amount 10'000EU taxation Out of scope
Product Contact Rakhee PatelPhone +44 20 7883 9232
Fund 39
February 29, 2012Switzerland
Credit Suisse Prime Select Trust (Lux) Multi StrategyClass R GBP
Net performance in GBP (rebased to 100) and yearly performance 1)
2009 2010 2011 201290
95
100
105
110
115
-10%
-5%
0%
5%
10%
15%
3.7
-5.1
2.2
CSPST (Lux) Multi Strategy R GBP Yearly or year-to-date performance respectively (Fund)
Net performance in GBP 1)
1 month 3 months YTD 1 year 3 years 5 yearsFund 1.00 1.58 2.24 -3.71 - -
Historical monthly performance in % 1)
Year Jan Feb Mar Apr May Jun Jul Aug Sep Oct Nov Dec YTD2012 1.23 1.00 - - - - - - - - - - 2.242011 0.25 0.54 0.05 0.83 -0.71 -0.78 -0.30 -2.68 -2.07 1.07 -0.69 -0.64 -5.072010 0.29 0.66 1.13 0.54 -2.27 -0.49 0.25 0.04 1.35 0.78 0.06 1.39 3.742009 - - - 0.53 1.81 -0.25 1.42 1.13 1.10 -0.12 0.70 0.64 7.16
Investment policyThe Multi Strategy Subfund strives to generateabsolute returns with low volatility irrespectiveof the market situation with a highly diversifiedportfolio of hedge funds. The Subfund allocatesits assets across the following hedge fundstrategies: long/short equity, relative value, eventdriven, global macro and managed futures. Tokeep overall volatility low the fund manager buildsa well diversified product through an appropriatechoice of target funds.
Fund facts
Unit class currency GBP
Bloomberg ticker CSMSRBP LX
Net asset value (NAV) 1'078.89
Contact information
E-Mail [email protected]
Sector weightings in % 0)
Equity Market Oriented 24.60Fixed Income 17.40Global Macro 13.80Event Driven 11.90Convertible Arbitrage 8.10Emerging Markets 7.60Multi-Strategy 6.70Managed Futures 3.60Cash/Cash Equivalents 0.00Others 6.40
Portfolio allocation and performance attribution
# ofManagers
StrategyAllocation
Est. Ret.MTD
Est. Ret.YTD
StrategyAttribution
MTD 0)
Equity Market Oriented - 24.60% 1.98% 4.25% 0.49%Fixed Income - 17.40% 0.64% 1.35% 0.11%Global Macro - 13.80% -0.35% -0.78% -0.05%Event Driven - 11.90% 2.68% 5.75% 0.32%Convertible Arbitrage - 8.10% 1.04% 3.53% 0.08%Emerging Markets - 7.60% 1.69% 4.93% 0.13%Multi-Strategy - 6.70% -0.77% -1.02% -0.05%Managed Futures - 3.60% -0.59% 0.12% -0.02%Equity Market Neutral - 3.30% 3.61% 3.01% 0.12%Others - 3.10% 0.84% 0.33% 0.03%Cash/Cash Equivalents - 0.00% N/A N/A N/ATotal 100.10%
Number of holdings
Top 5 Holdingsas % of assets
Exane Archimedes Fd 3.97Sector Healthcare FD 3.82Visium Credit 3.69Bridgewater Pure A. 3.55Lansdowne UK EF 3.47Total 18.50
Source: Lipper, a Reuters Company
Cre
dit S
uiss
e P
rime
Sel
ect T
rust
1) Historical performance indications and financial market scenarios are no guarantee for current or future performance. Performance indications do not consider commissions levied at subscription and/orredemption.
The disclaimer mentioned at the end of this document also applies to this page.
215
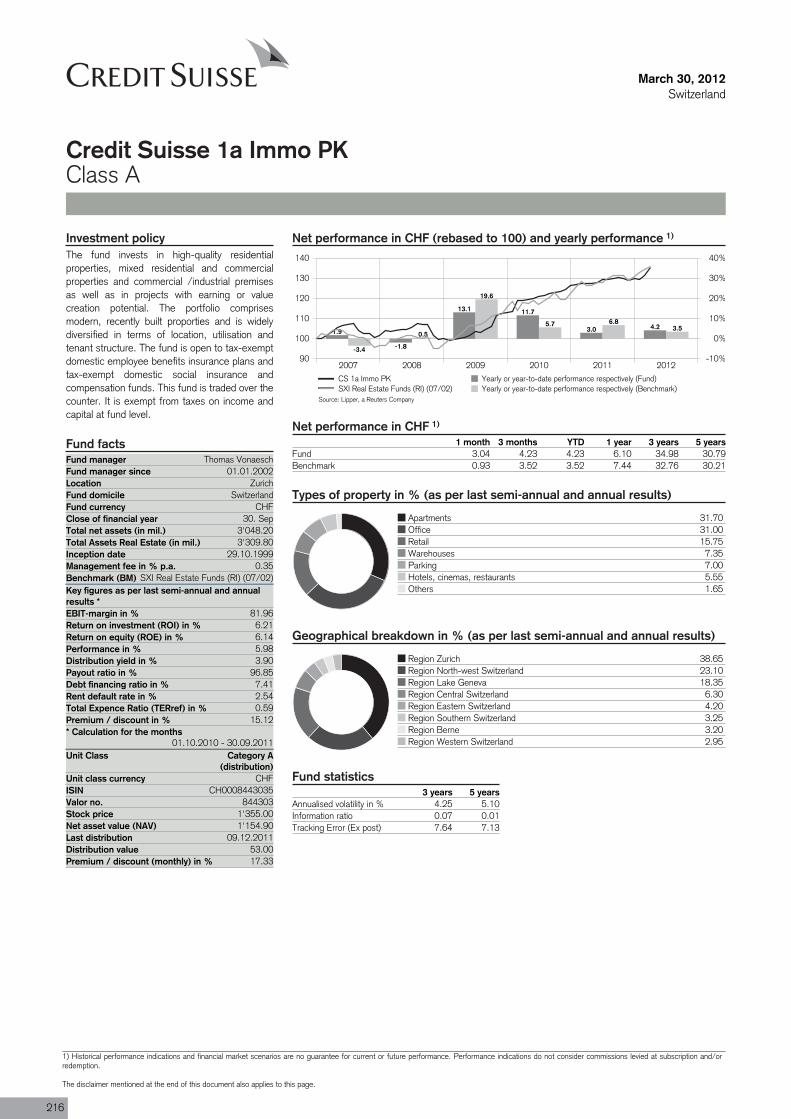
Fund manager Thomas VonaeschFund manager since 01.01.2002Location ZurichFund domicile SwitzerlandFund currency CHFClose of financial year 30. SepTotal net assets (in mil.) 3'048.20Total Assets Real Estate (in mil.) 3'309.80Inception date 29.10.1999Management fee in % p.a. 0.35Benchmark (BM) SXI Real Estate Funds (RI) (07/02)
Return on investment (ROI) in % 6.21Return on equity (ROE) in % 6.14Performance in %Distribution yield in % 3.90Payout ratio in % 96.85Debt financing ratio in % 7.41Rent default rate in % 2.54
Premium / discount in % 15.12* Calculation for the months
01.10.2010 - 30.09.2011Unit Class Category A
(distribution)Unit class currency CHFISIN CH0008443035Valor no. 844303Stock price 1'355.00
Last distribution 09.12.2011Distribution value 53.00Premium / discount (monthly) in % 17.33
March 30, 2012Switzerland
Credit Suisse 1a Immo PKClass A
Net performance in CHF (rebased to 100) and yearly performance 1)
2007 2008 2009 2010 2011 201290
100
110
120
130
140
-10%
0%
10%
20%
30%
40%
1.9
-1.8
13.1 11.7
3.0 4.2
-3.4
0.5
19.6
5.7 6.83.5
CS 1a Immo PK Yearly or year-to-date performance respectively (Fund)SXI Real Estate Funds (RI) (07/02) Yearly or year-to-date performance respectively (Benchmark)
Net performance in CHF 1)
1 month 3 months YTD 1 year 3 years 5 yearsFund 3.04 4.23 4.23 6.10 34.98 30.79Benchmark 0.93 3.52 3.52 7.44 32.76 30.21
Types of property in % (as per last semi-annual and annual results)
Apartments 31.70Office 31.00Retail 15.75Warehouses 7.35Parking 7.00Hotels, cinemas, restaurants 5.55Others 1.65
Geographical breakdown in % (as per last semi-annual and annual results)
Region Zurich 38.65Region North-west Switzerland 23.10Region Lake Geneva 18.35Region Central Switzerland 6.30Region Eastern Switzerland 4.20Region Southern Switzerland 3.25Region Berne 3.20Region Western Switzerland 2.95
Fund statistics3 years 5 years
Annualised volatility in % 4.25 5.10Information ratio 0.07 0.01Tracking Error (Ex post) 7.64 7.13
Investment policyThe fund invests in high-quality residentialproperties, mixed residential and commercialproperties and commercial /industrial premisesas well as in projects with earning or valuecreation potential. The portfolio comprisesmodern, recently built proporties and is widelydiversified in terms of location, utilisation andtenant structure. The fund is open to tax-exemptdomestic employee benefits insurance plans andtax-exempt domestic social insurance andcompensation funds. This fund is traded over thecounter. It is exempt from taxes on income andcapital at fund level.
Fund facts
Key figures as per last semi-annual and annualresults *EBIT-margin in % 81.96
5.98
Total Expence Ratio (TERref) in % 0.59
Net asset value (NAV) 1'154.90
Source: Lipper, a Reuters Company
216
1) Historical performance indications and financial market scenarios are no guarantee for current or future performance. Performance indications do not consider commissions levied at subscription and/orredemption.
The disclaimer mentioned at the end of this document also applies to this page.
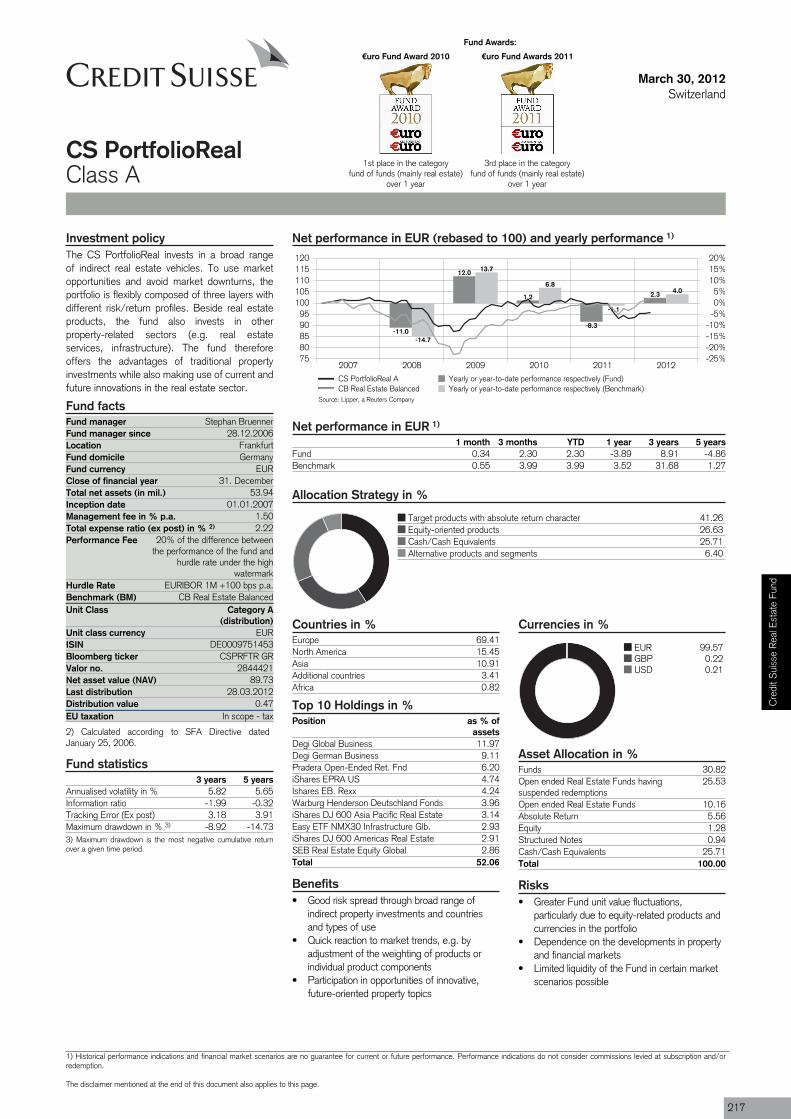
Fund manager Stephan BruennerFund manager since 28.12.2006Location FrankfurtFund domicile GermanyFund currency EURClose of financial year 31. DecemberTotal net assets (in mil.) 53.94Inception date 01.01.2007Management fee in % p.a. 1.50Total expense ratio (ex post) in % 2) 2.22Performance Fee 20% of the difference between
the performance of the fund andhurdle rate under the high
watermarkHurdle Rate EURIBOR 1M +100 bps p.a.Benchmark (BM) CB Real Estate BalancedUnit Class Category A
(distribution)
ISIN DE0009751453
Valor no. 2844421
Last distribution 28.03.2012Distribution value 0.47EU taxation In scope - tax
March 30, 2012Switzerland
CS PortfolioRealClass A
Net performance in EUR (rebased to 100) and yearly performance 1)
2007 2008 2009 2010 2011 20127580859095
100105110115120
-25%-20%-15%-10%-5%0%5%
10%15%20%
-11.0
12.0
1.2
-8.3
2.3
-14.7
13.7
6.8
-1.1
4.0
CS PortfolioReal A Yearly or year-to-date performance respectively (Fund)CB Real Estate Balanced Yearly or year-to-date performance respectively (Benchmark)
Net performance in EUR 1)
1 month 3 months YTD 1 year 3 years 5 yearsFund 0.34 2.30 2.30 -3.89 8.91 -4.86Benchmark 0.55 3.99 3.99 3.52 31.68 1.27
Allocation Strategy in %
Target products with absolute return character 41.26Equity-oriented products 26.63Cash/Cash Equivalents 25.71Alternative products and segments 6.40
Countries in %Europe 69.41North America 15.45Asia 10.91Additional countries 3.41Africa 0.82
Top 10 Holdings in %Position as % of
assetsDegi Global Business 11.97Degi German Business 9.11Pradera Open-Ended Ret. Fnd 6.20iShares EPRA US 4.74Ishares EB. Rexx 4.24Warburg Henderson Deutschland Fonds 3.96iShares DJ 600 Asia Pacific Real Estate 3.14Easy ETF NMX30 Infrastructure Glb. 2.93iShares DJ 600 Americas Real Estate 2.91SEB Real Estate Equity Global 2.86Total 52.06
Benefits• Good risk spread through broad range of
indirect property investments and countriesand types of use
• Quick reaction to market trends, e.g. byadjustment of the weighting of products orindividual product components
• Participation in opportunities of innovative,future-oriented property topics
Currencies in %
EUR 99.57GBP 0.22USD 0.21
Asset Allocation in %Funds 30.82Open ended Real Estate Funds havingsuspended redemptions
25.53
Open ended Real Estate Funds 10.16Absolute Return 5.56Equity 1.28Structured Notes 0.94Cash/Cash Equivalents 25.71Total 100.00
Risks• Greater Fund unit value fluctuations,
particularly due to equity-related products andcurrencies in the portfolio
• Dependence on the developments in propertyand financial markets
• Limited liquidity of the Fund in certain marketscenarios possible
Investment policyThe CS PortfolioReal invests in a broad rangeof indirect real estate vehicles. To use marketopportunities and avoid market downturns, theportfolio is flexibly composed of three layers withdifferent risk/return profiles. Beside real estateproducts, the fund also invests in otherproperty-related sectors (e.g. real estateservices, infrastructure). The fund thereforeoffers the advantages of traditional propertyinvestments while also making use of current andfuture innovations in the real estate sector.
Fund facts
Unit class currency EUR
Bloomberg ticker CSPRFTR GR
Net asset value (NAV) 89.73
2) Calculated according to SFA Directive datedJanuary 25, 2006.
Fund statistics3 years 5 years
Annualised volatility in % 5.82 5.65Information ratio -1.99 -0.32Tracking Error (Ex post) 3.18 3.91Maximum drawdown in % 3) -8.92 -14.733) Maximum drawdown is the most negative cumulative returnover a given time period.
Source: Lipper, a Reuters Company
Fund Awards:
€uro Fund Award 2010 €uro Fund Awards 2011
1st place in the categoryfund of funds (mainly real estate)
over 1 year
3rd place in the categoryfund of funds (mainly real estate)
over 1 year
Cre
dit S
uiss
e R
eal E
stat
e Fu
nd
1) Historical performance indications and financial market scenarios are no guarantee for current or future performance. Performance indications do not consider commissions levied at subscription and/orredemption.
The disclaimer mentioned at the end of this document also applies to this page.
217
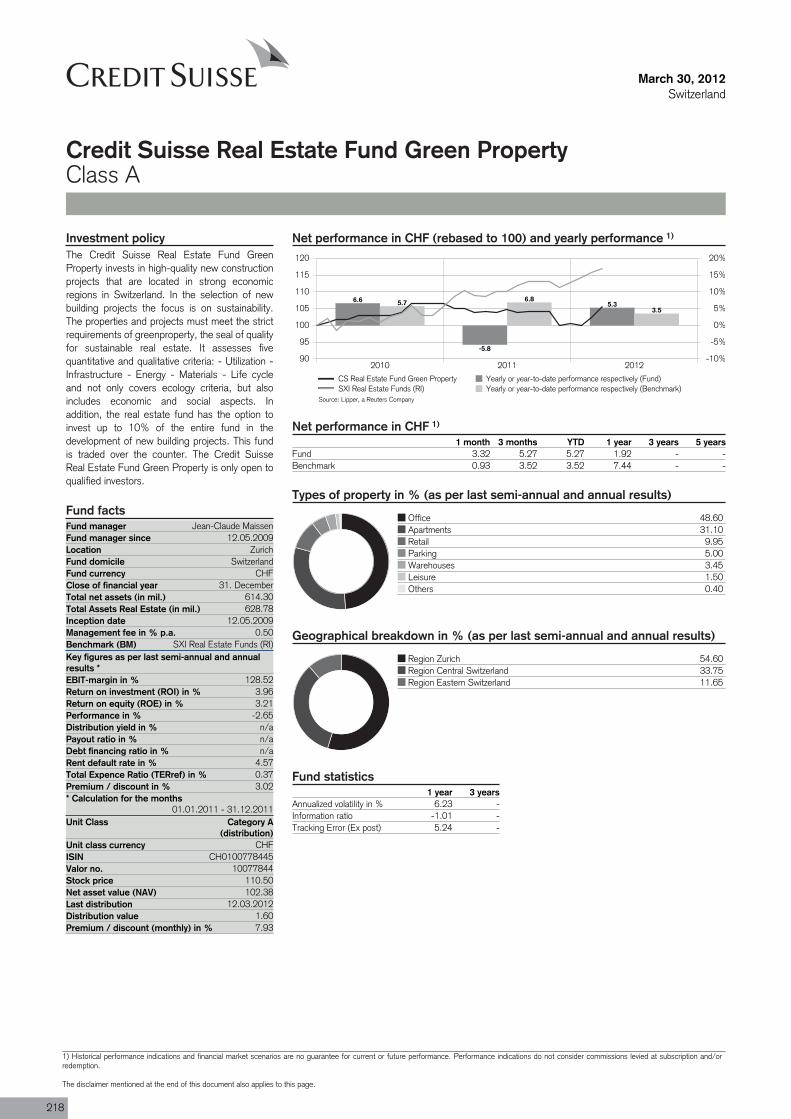
Fund manager Jean-Claude MaissenFund manager since 12.05.2009Location ZurichFund domicile SwitzerlandFund currency CHFClose of financial year 31. DecemberTotal net assets (in mil.) 614.30Total Assets Real Estate (in mil.) 628.78Inception date 12.05.2009Management fee in % p.a. 0.50Benchmark (BM) SXI Real Estate Funds (RI)
Return on investment (ROI) in % 3.96Return on equity (ROE) in % 3.21Performance in % -2.65Distribution yield in % n/aPayout ratio in % n/aDebt financing ratio in % n/aRent default rate in % 4.57
Premium / discount in % 3.02* Calculation for the months
01.01.2011 - 31.12.2011Unit Class Category A
(distribution)Unit class currency CHFISIN CH0100778445Valor no. 10077844Stock price 110.50
Last distribution 12.03.2012Distribution value 1.60Premium / discount (monthly) in % 7.93
March 30, 2012Switzerland
Credit Suisse Real Estate Fund Green PropertyClass A
Net performance in CHF (rebased to 100) and yearly performance 1)
2010 2011 201290
95
100
105
110
115
120
-10%
-5%
0%
5%
10%
15%
20%
6.6
-5.8
5.35.7 6.8
3.5
CS Real Estate Fund Green Property Yearly or year-to-date performance respectively (Fund)SXI Real Estate Funds (RI) Yearly or year-to-date performance respectively (Benchmark)
Net performance in CHF 1)
1 month 3 months YTD 1 year 3 years 5 yearsFund 3.32 5.27 5.27 1.92 - -Benchmark 0.93 3.52 3.52 7.44 - -
Types of property in % (as per last semi-annual and annual results)
Office 48.60Apartments 31.10Retail 9.95Parking 5.00Warehouses 3.45Leisure 1.50Others 0.40
Geographical breakdown in % (as per last semi-annual and annual results)
Region Zurich 54.60Region Central Switzerland 33.75Region Eastern Switzerland 11.65
Fund statistics1 year 3 years
Annualized volatility in % 6.23 -Information ratio -1.01 -Tracking Error (Ex post) 5.24 -
Investment policyThe Credit Suisse Real Estate Fund GreenProperty invests in high-quality new constructionprojects that are located in strong economicregions in Switzerland. In the selection of newbuilding projects the focus is on sustainability.The properties and projects must meet the strictrequirements of greenproperty, the seal of qualityfor sustainable real estate. It assesses fivequantitative and qualitative criteria: - Utilization -Infrastructure - Energy - Materials - Life cycleand not only covers ecology criteria, but alsoincludes economic and social aspects. Inaddition, the real estate fund has the option toinvest up to 10% of the entire fund in thedevelopment of new building projects. This fundis traded over the counter. The Credit SuisseReal Estate Fund Green Property is only open toqualified investors.
Fund facts
Key figures as per last semi-annual and annualresults *EBIT-margin in % 128.52
Total Expence Ratio (TERref) in % 0.37
Net asset value (NAV) 102.38
Source: Lipper, a Reuters Company
218
1) Historical performance indications and financial market scenarios are no guarantee for current or future performance. Performance indications do not consider commissions levied at subscription and/orredemption.
The disclaimer mentioned at the end of this document also applies to this page.
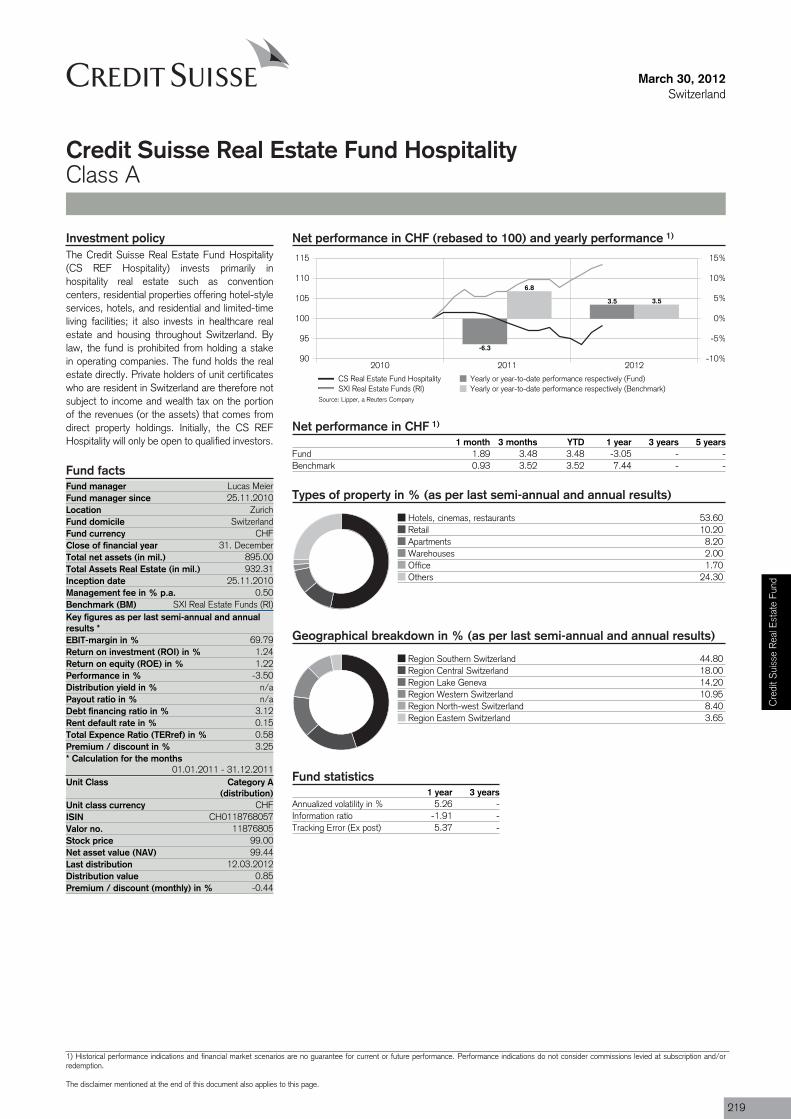
Fund manager Lucas MeierFund manager since 25.11.2010Location ZurichFund domicile SwitzerlandFund currency CHFClose of financial year 31. DecemberTotal net assets (in mil.) 895.00Total Assets Real Estate (in mil.) 932.31Inception date 25.11.2010Management fee in % p.a. 0.50Benchmark (BM) SXI Real Estate Funds (RI)
Return on investment (ROI) in % 1.24Return on equity (ROE) in % 1.22Performance in % -3.50Distribution yield in % n/aPayout ratio in % n/aDebt financing ratio in % 3.12Rent default rate in % 0.15
Premium / discount in % 3.25* Calculation for the months
01.01.2011 - 31.12.2011Unit Class Category A
(distribution)Unit class currency CHFISIN CH0118768057Valor no. 11876805Stock price 99.00
Last distribution 12.03.2012Distribution value 0.85Premium / discount (monthly) in % -0.44
March 30, 2012Switzerland
Credit Suisse Real Estate Fund HospitalityClass A
Net performance in CHF (rebased to 100) and yearly performance 1)
2010 2011 201290
95
100
105
110
115
-10%
-5%
0%
5%
10%
15%
-6.3
3.5
6.8
3.5
CS Real Estate Fund Hospitality Yearly or year-to-date performance respectively (Fund)SXI Real Estate Funds (RI) Yearly or year-to-date performance respectively (Benchmark)
Net performance in CHF 1)
1 month 3 months YTD 1 year 3 years 5 yearsFund 1.89 3.48 3.48 -3.05 - -Benchmark 0.93 3.52 3.52 7.44 - -
Types of property in % (as per last semi-annual and annual results)
Hotels, cinemas, restaurants 53.60Retail 10.20Apartments 8.20Warehouses 2.00Office 1.70Others 24.30
Geographical breakdown in % (as per last semi-annual and annual results)
Region Southern Switzerland 44.80Region Central Switzerland 18.00Region Lake Geneva 14.20Region Western Switzerland 10.95Region North-west Switzerland 8.40Region Eastern Switzerland 3.65
Fund statistics1 year 3 years
Annualized volatility in % 5.26 -Information ratio -1.91 -Tracking Error (Ex post) 5.37 -
Investment policyThe Credit Suisse Real Estate Fund Hospitality(CS REF Hospitality) invests primarily inhospitality real estate such as conventioncenters, residential properties offering hotel-styleservices, hotels, and residential and limited-timeliving facilities; it also invests in healthcare realestate and housing throughout Switzerland. Bylaw, the fund is prohibited from holding a stakein operating companies. The fund holds the realestate directly. Private holders of unit certificateswho are resident in Switzerland are therefore notsubject to income and wealth tax on the portionof the revenues (or the assets) that comes fromdirect property holdings. Initially, the CS REFHospitality will only be open to qualified investors.
Fund facts
Key figures as per last semi-annual and annualresults *EBIT-margin in % 69.79
Total Expence Ratio (TERref) in % 0.58
Net asset value (NAV) 99.44
Source: Lipper, a Reuters Company
Cre
dit S
uiss
e R
eal E
stat
e Fu
nd
1) Historical performance indications and financial market scenarios are no guarantee for current or future performance. Performance indications do not consider commissions levied at subscription and/orredemption.
The disclaimer mentioned at the end of this document also applies to this page.
219
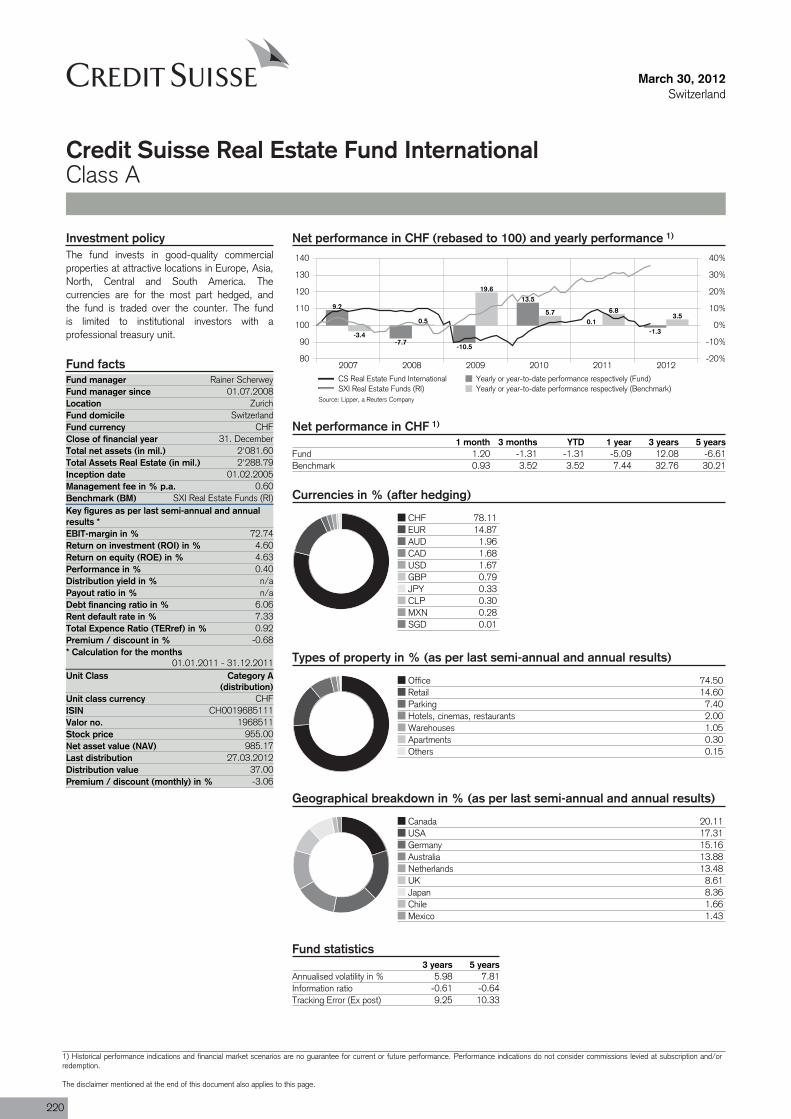
Fund manager Rainer ScherweyFund manager since 01.07.2008Location ZurichFund domicile SwitzerlandFund currency CHFClose of financial year 31. DecemberTotal net assets (in mil.) 2'081.60Total Assets Real Estate (in mil.) 2'288.79Inception date 01.02.2005Management fee in % p.a. 0.60Benchmark (BM) SXI Real Estate Funds (RI)
Return on investment (ROI) in % 4.60Return on equity (ROE) in % 4.63Performance in % 0.40Distribution yield in % n/aPayout ratio in % n/aDebt financing ratio in % 6.06Rent default rate in % 7.33
Premium / discount in % -0.68* Calculation for the months
01.01.2011 - 31.12.2011Unit Class Category A
(distribution)Unit class currency CHFISIN CH0019685111Valor no. 1968511Stock price 955.00
Last distribution 27.03.2012Distribution value 37.00Premium / discount (monthly) in % -3.06
March 30, 2012Switzerland
Credit Suisse Real Estate Fund InternationalClass A
Net performance in CHF (rebased to 100) and yearly performance 1)
2007 2008 2009 2010 2011 201280
90
100
110
120
130
140
-20%
-10%
0%
10%
20%
30%
40%
9.2
-7.7-10.5
13.5
0.1-1.3-3.4
0.5
19.6
5.7 6.83.5
CS Real Estate Fund International Yearly or year-to-date performance respectively (Fund)SXI Real Estate Funds (RI) Yearly or year-to-date performance respectively (Benchmark)
Net performance in CHF 1)
1 month 3 months YTD 1 year 3 years 5 yearsFund 1.20 -1.31 -1.31 -5.09 12.08 -6.61Benchmark 0.93 3.52 3.52 7.44 32.76 30.21
Currencies in % (after hedging)
CHF 78.11EUR 14.87AUD 1.96CAD 1.68USD 1.67GBP 0.79JPY 0.33CLP 0.30MXN 0.28SGD 0.01
Types of property in % (as per last semi-annual and annual results)
Office 74.50Retail 14.60Parking 7.40Hotels, cinemas, restaurants 2.00Warehouses 1.05Apartments 0.30Others 0.15
Geographical breakdown in % (as per last semi-annual and annual results)
Canada 20.11USA 17.31Germany 15.16Australia 13.88Netherlands 13.48UK 8.61Japan 8.36Chile 1.66Mexico 1.43
Fund statistics3 years 5 years
Annualised volatility in % 5.98 7.81Information ratio -0.61 -0.64Tracking Error (Ex post) 9.25 10.33
Investment policyThe fund invests in good-quality commercialproperties at attractive locations in Europe, Asia,North, Central and South America. Thecurrencies are for the most part hedged, andthe fund is traded over the counter. The fundis limited to institutional investors with aprofessional treasury unit.
Fund facts
Key figures as per last semi-annual and annualresults *EBIT-margin in % 72.74
Total Expence Ratio (TERref) in % 0.92
Net asset value (NAV) 985.17
Source: Lipper, a Reuters Company
220
1) Historical performance indications and financial market scenarios are no guarantee for current or future performance. Performance indications do not consider commissions levied at subscription and/orredemption.
The disclaimer mentioned at the end of this document also applies to this page.
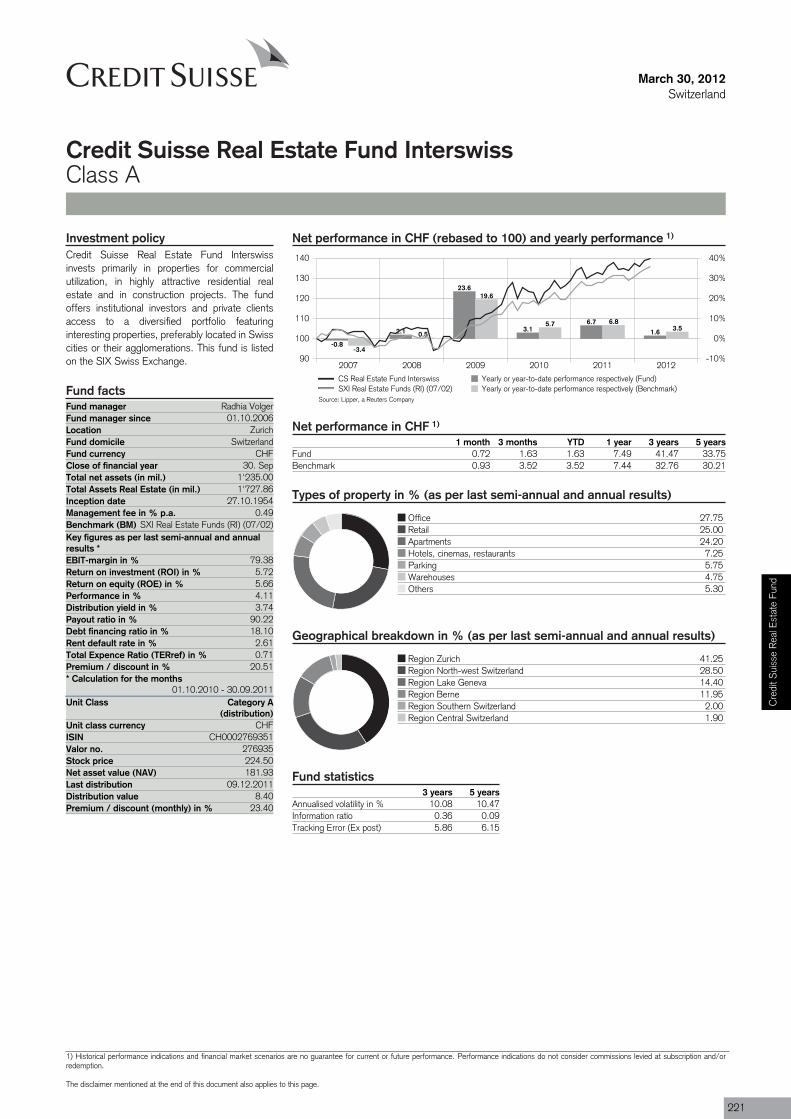
Fund manager Radhia VolgerFund manager since 01.10.2006Location ZurichFund domicile SwitzerlandFund currency CHFClose of financial year 30. SepTotal net assets (in mil.) 1'235.00Total Assets Real Estate (in mil.) 1'727.86Inception date 27.10.1954Management fee in % p.a. 0.49Benchmark (BM) SXI Real Estate Funds (RI) (07/02)
Return on investment (ROI) in % 5.72Return on equity (ROE) in % 5.66Performance in %Distribution yield in % 3.74Payout ratio in % 90.22Debt financing ratio in % 18.10Rent default rate in % 2.61
Premium / discount in % 20.51* Calculation for the months
01.10.2010 - 30.09.2011Unit Class Category A
(distribution)Unit class currency CHFISIN CH0002769351Valor no. 276935Stock price 224.50
Last distribution 09.12.2011Distribution value 8.40Premium / discount (monthly) in % 23.40
March 30, 2012Switzerland
Credit Suisse Real Estate Fund InterswissClass A
Net performance in CHF (rebased to 100) and yearly performance 1)
2007 2008 2009 2010 2011 201290
100
110
120
130
140
-10%
0%
10%
20%
30%
40%
-0.8
2.1
23.6
3.16.7
1.6
-3.4
0.5
19.6
5.7 6.83.5
CS Real Estate Fund Interswiss Yearly or year-to-date performance respectively (Fund)SXI Real Estate Funds (RI) (07/02) Yearly or year-to-date performance respectively (Benchmark)
Net performance in CHF 1)
1 month 3 months YTD 1 year 3 years 5 yearsFund 0.72 1.63 1.63 7.49 41.47 33.75Benchmark 0.93 3.52 3.52 7.44 32.76 30.21
Types of property in % (as per last semi-annual and annual results)
Office 27.75Retail 25.00Apartments 24.20Hotels, cinemas, restaurants 7.25Parking 5.75Warehouses 4.75Others 5.30
Geographical breakdown in % (as per last semi-annual and annual results)
Region Zurich 41.25Region North-west Switzerland 28.50Region Lake Geneva 14.40Region Berne 11.95Region Southern Switzerland 2.00Region Central Switzerland 1.90
Fund statistics3 years 5 years
Annualised volatility in % 10.08 10.47Information ratio 0.36 0.09Tracking Error (Ex post) 5.86 6.15
Investment policyCredit Suisse Real Estate Fund Interswissinvests primarily in properties for commercialutilization, in highly attractive residential realestate and in construction projects. The fundoffers institutional investors and private clientsaccess to a diversified portfolio featuringinteresting properties, preferably located in Swisscities or their agglomerations. This fund is listedon the SIX Swiss Exchange.
Fund facts
Key figures as per last semi-annual and annualresults *EBIT-margin in % 79.38
4.11
Total Expence Ratio (TERref) in % 0.71
Net asset value (NAV) 181.93
Source: Lipper, a Reuters Company
Cre
dit S
uiss
e R
eal E
stat
e Fu
nd
1) Historical performance indications and financial market scenarios are no guarantee for current or future performance. Performance indications do not consider commissions levied at subscription and/orredemption.
The disclaimer mentioned at the end of this document also applies to this page.
221
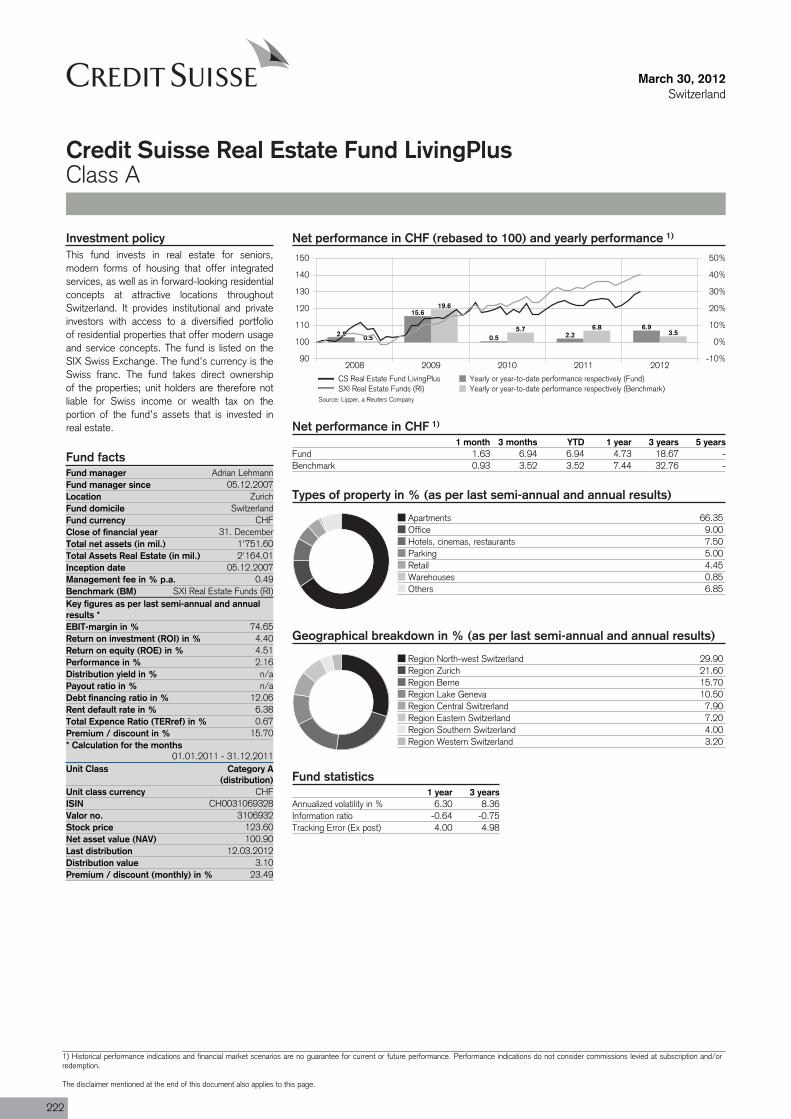
Fund manager Adrian LehmannFund manager since 05.12.2007Location ZurichFund domicile SwitzerlandFund currency CHFClose of financial year 31. DecemberTotal net assets (in mil.) 1'751.60Total Assets Real Estate (in mil.) 2'164.01Inception date 05.12.2007Management fee in % p.a. 0.49Benchmark (BM) SXI Real Estate Funds (RI)
Return on investment (ROI) in % 4.40Return on equity (ROE) in % 4.51Performance in % 2.16Distribution yield in % n/aPayout ratio in % n/aDebt financing ratio in % 12.06Rent default rate in % 6.38
Premium / discount in % 15.70* Calculation for the months
01.01.2011 - 31.12.2011Unit Class Category A
(distribution)Unit class currency CHFISIN CH0031069328Valor no. 3106932Stock price 123.60
Last distribution 12.03.2012Distribution value 3.10Premium / discount (monthly) in % 23.49
March 30, 2012Switzerland
Credit Suisse Real Estate Fund LivingPlusClass A
Net performance in CHF (rebased to 100) and yearly performance 1)
2008 2009 2010 2011 201290
100
110
120
130
140
150
-10%
0%
10%
20%
30%
40%
50%
2.9
15.6
0.5 2.26.9
0.5
19.6
5.7 6.83.5
CS Real Estate Fund LivingPlus Yearly or year-to-date performance respectively (Fund)SXI Real Estate Funds (RI) Yearly or year-to-date performance respectively (Benchmark)
Net performance in CHF 1)
1 month 3 months YTD 1 year 3 years 5 yearsFund 1.63 6.94 6.94 4.73 18.67 -Benchmark 0.93 3.52 3.52 7.44 32.76 -
Types of property in % (as per last semi-annual and annual results)
Apartments 66.35Office 9.00Hotels, cinemas, restaurants 7.50Parking 5.00Retail 4.45Warehouses 0.85Others 6.85
Geographical breakdown in % (as per last semi-annual and annual results)
Region North-west Switzerland 29.90Region Zurich 21.60Region Berne 15.70Region Lake Geneva 10.50Region Central Switzerland 7.90Region Eastern Switzerland 7.20Region Southern Switzerland 4.00Region Western Switzerland 3.20
Fund statistics1 year 3 years
Annualized volatility in % 6.30 8.36Information ratio -0.64 -0.75Tracking Error (Ex post) 4.00 4.98
Investment policyThis fund invests in real estate for seniors,modern forms of housing that offer integratedservices, as well as in forward-looking residentialconcepts at attractive locations throughoutSwitzerland. It provides institutional and privateinvestors with access to a diversified portfolioof residential properties that offer modern usageand service concepts. The fund is listed on theSIX Swiss Exchange. The fund’s currency is theSwiss franc. The fund takes direct ownershipof the properties; unit holders are therefore notliable for Swiss income or wealth tax on theportion of the fund’s assets that is invested inreal estate.
Fund facts
Key figures as per last semi-annual and annualresults *EBIT-margin in % 74.65
Total Expence Ratio (TERref) in % 0.67
Net asset value (NAV) 100.90
Source: Lipper, a Reuters Company
222
1) Historical performance indications and financial market scenarios are no guarantee for current or future performance. Performance indications do not consider commissions levied at subscription and/orredemption.
The disclaimer mentioned at the end of this document also applies to this page.
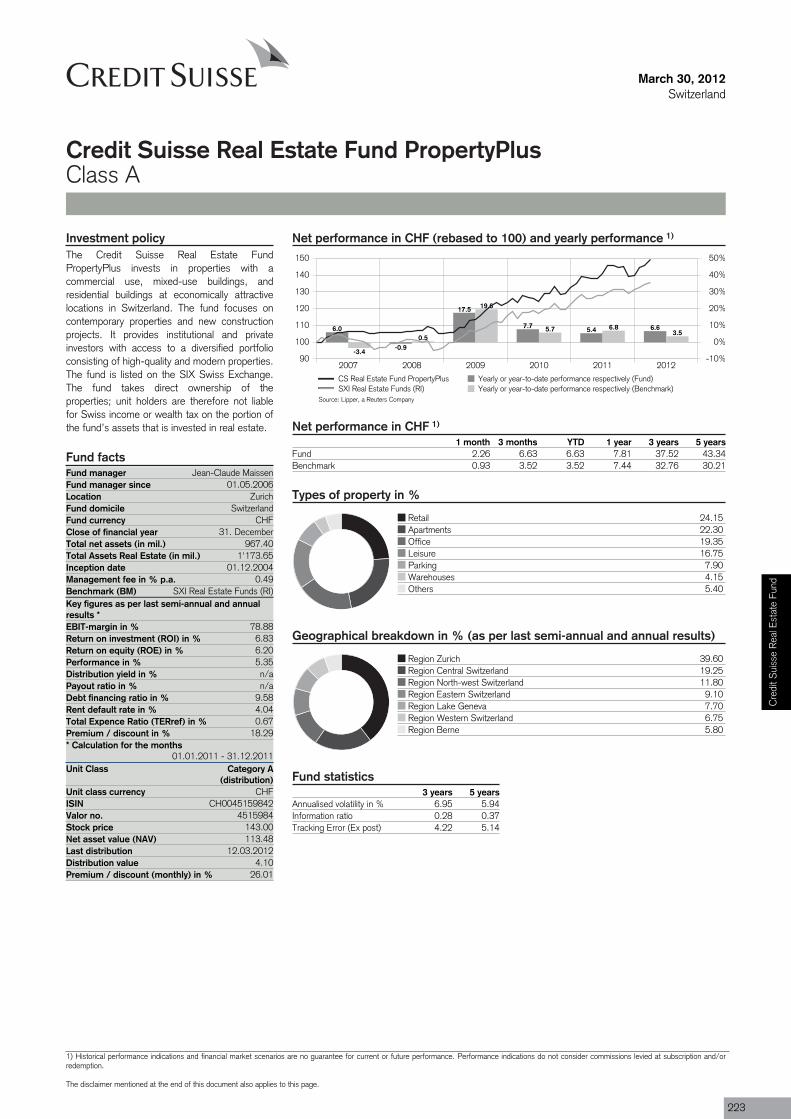
Fund manager Jean-Claude MaissenFund manager since 01.05.2006Location ZurichFund domicile SwitzerlandFund currency CHFClose of financial year 31. DecemberTotal net assets (in mil.) 967.40Total Assets Real Estate (in mil.) 1'173.65Inception date 01.12.2004Management fee in % p.a. 0.49Benchmark (BM) SXI Real Estate Funds (RI)
Return on investment (ROI) in % 6.83Return on equity (ROE) in % 6.20Performance in % 5.35Distribution yield in % n/aPayout ratio in % n/aDebt financing ratio in % 9.58Rent default rate in % 4.04
Premium / discount in % 18.29* Calculation for the months
01.01.2011 - 31.12.2011Unit Class Category A
(distribution)Unit class currency CHFISIN CH0045159842Valor no. 4515984Stock price 143.00
Last distribution 12.03.2012Distribution value 4.10Premium / discount (monthly) in % 26.01
March 30, 2012Switzerland
Credit Suisse Real Estate Fund PropertyPlusClass A
Net performance in CHF (rebased to 100) and yearly performance 1)
2007 2008 2009 2010 2011 201290
100
110
120
130
140
150
-10%
0%
10%
20%
30%
40%
50%
6.0
-0.9
17.5
7.7 5.4 6.6
-3.4
0.5
19.6
5.7 6.83.5
CS Real Estate Fund PropertyPlus Yearly or year-to-date performance respectively (Fund)SXI Real Estate Funds (RI) Yearly or year-to-date performance respectively (Benchmark)
Net performance in CHF 1)
1 month 3 months YTD 1 year 3 years 5 yearsFund 2.26 6.63 6.63 7.81 37.52 43.34Benchmark 0.93 3.52 3.52 7.44 32.76 30.21
Types of property in %
Retail 24.15Apartments 22.30Office 19.35Leisure 16.75Parking 7.90Warehouses 4.15Others 5.40
Geographical breakdown in % (as per last semi-annual and annual results)
Region Zurich 39.60Region Central Switzerland 19.25Region North-west Switzerland 11.80Region Eastern Switzerland 9.10Region Lake Geneva 7.70Region Western Switzerland 6.75Region Berne 5.80
Fund statistics3 years 5 years
Annualised volatility in % 6.95 5.94Information ratio 0.28 0.37Tracking Error (Ex post) 4.22 5.14
Investment policyThe Credit Suisse Real Estate FundPropertyPlus invests in properties with acommercial use, mixed-use buildings, andresidential buildings at economically attractivelocations in Switzerland. The fund focuses oncontemporary properties and new constructionprojects. It provides institutional and privateinvestors with access to a diversified portfolioconsisting of high-quality and modern properties.The fund is listed on the SIX Swiss Exchange.The fund takes direct ownership of theproperties; unit holders are therefore not liablefor Swiss income or wealth tax on the portion ofthe fund’s assets that is invested in real estate.
Fund facts
Key figures as per last semi-annual and annualresults *EBIT-margin in % 78.88
Total Expence Ratio (TERref) in % 0.67
Net asset value (NAV) 113.48
Source: Lipper, a Reuters Company
Cre
dit S
uiss
e R
eal E
stat
e Fu
nd
1) Historical performance indications and financial market scenarios are no guarantee for current or future performance. Performance indications do not consider commissions levied at subscription and/orredemption.
The disclaimer mentioned at the end of this document also applies to this page.
223
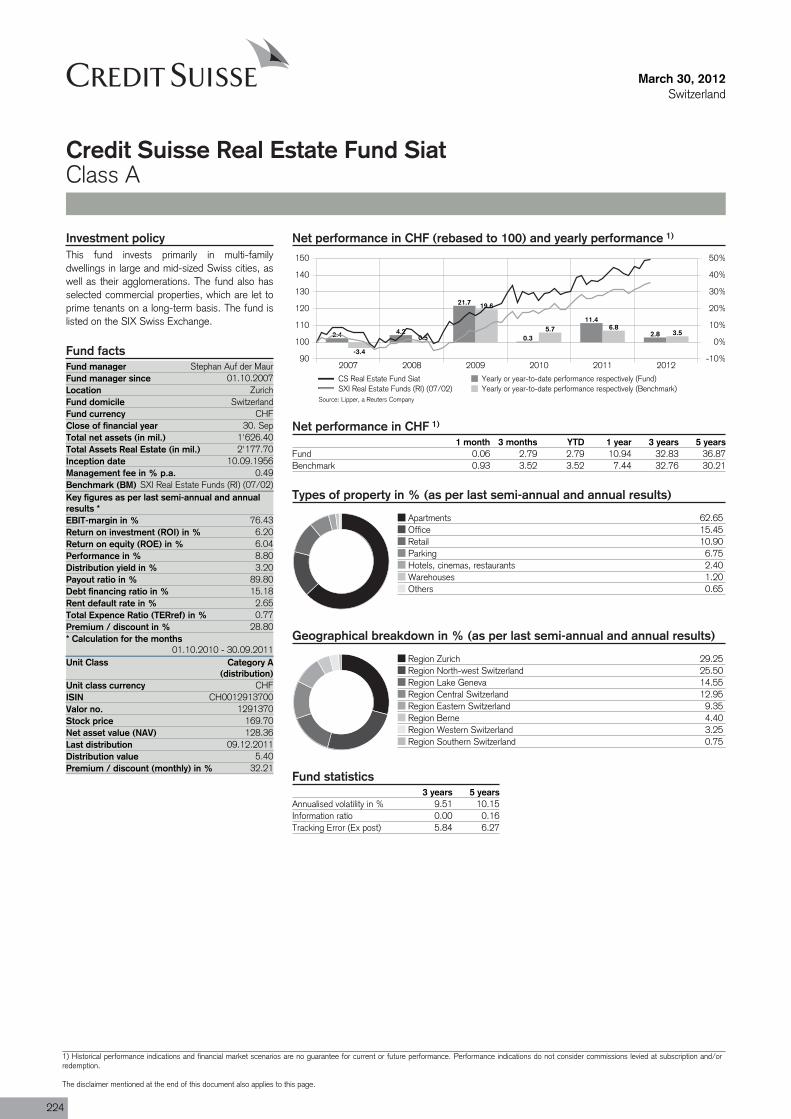
Fund manager Stephan Auf der MaurFund manager since 01.10.2007Location ZurichFund domicile SwitzerlandFund currency CHFClose of financial year 30. SepTotal net assets (in mil.) 1'626.40Total Assets Real Estate (in mil.) 2'177.70Inception date 10.09.1956Management fee in % p.a. 0.49Benchmark (BM) SXI Real Estate Funds (RI) (07/02)
Return on investment (ROI) in % 6.20Return on equity (ROE) in % 6.04Performance in %Distribution yield in % 3.20Payout ratio in % 89.80Debt financing ratio in % 15.18Rent default rate in % 2.65
Premium / discount in % 28.80* Calculation for the months
01.10.2010 - 30.09.2011Unit Class Category A
(distribution)Unit class currency CHFISIN CH0012913700Valor no. 1291370Stock price 169.70
Last distribution 09.12.2011Distribution value 5.40Premium / discount (monthly) in % 32.21
March 30, 2012Switzerland
Credit Suisse Real Estate Fund SiatClass A
Net performance in CHF (rebased to 100) and yearly performance 1)
2007 2008 2009 2010 2011 201290
100
110
120
130
140
150
-10%
0%
10%
20%
30%
40%
50%
2.4 4.2
21.7
0.3
11.4
2.8
-3.4
0.5
19.6
5.7 6.83.5
CS Real Estate Fund Siat Yearly or year-to-date performance respectively (Fund)SXI Real Estate Funds (RI) (07/02) Yearly or year-to-date performance respectively (Benchmark)
Net performance in CHF 1)
1 month 3 months YTD 1 year 3 years 5 yearsFund 0.06 2.79 2.79 10.94 32.83 36.87Benchmark 0.93 3.52 3.52 7.44 32.76 30.21
Types of property in % (as per last semi-annual and annual results)
Apartments 62.65Office 15.45Retail 10.90Parking 6.75Hotels, cinemas, restaurants 2.40Warehouses 1.20Others 0.65
Geographical breakdown in % (as per last semi-annual and annual results)
Region Zurich 29.25Region North-west Switzerland 25.50Region Lake Geneva 14.55Region Central Switzerland 12.95Region Eastern Switzerland 9.35Region Berne 4.40Region Western Switzerland 3.25Region Southern Switzerland 0.75
Fund statistics3 years 5 years
Annualised volatility in % 9.51 10.15Information ratio 0.00 0.16Tracking Error (Ex post) 5.84 6.27
Investment policyThis fund invests primarily in multi-familydwellings in large and mid-sized Swiss cities, aswell as their agglomerations. The fund also hasselected commercial properties, which are let toprime tenants on a long-term basis. The fund islisted on the SIX Swiss Exchange.
Fund facts
Key figures as per last semi-annual and annualresults *EBIT-margin in % 76.43
8.80
Total Expence Ratio (TERref) in % 0.77
Net asset value (NAV) 128.36
Source: Lipper, a Reuters Company
224
1) Historical performance indications and financial market scenarios are no guarantee for current or future performance. Performance indications do not consider commissions levied at subscription and/orredemption.
The disclaimer mentioned at the end of this document also applies to this page.
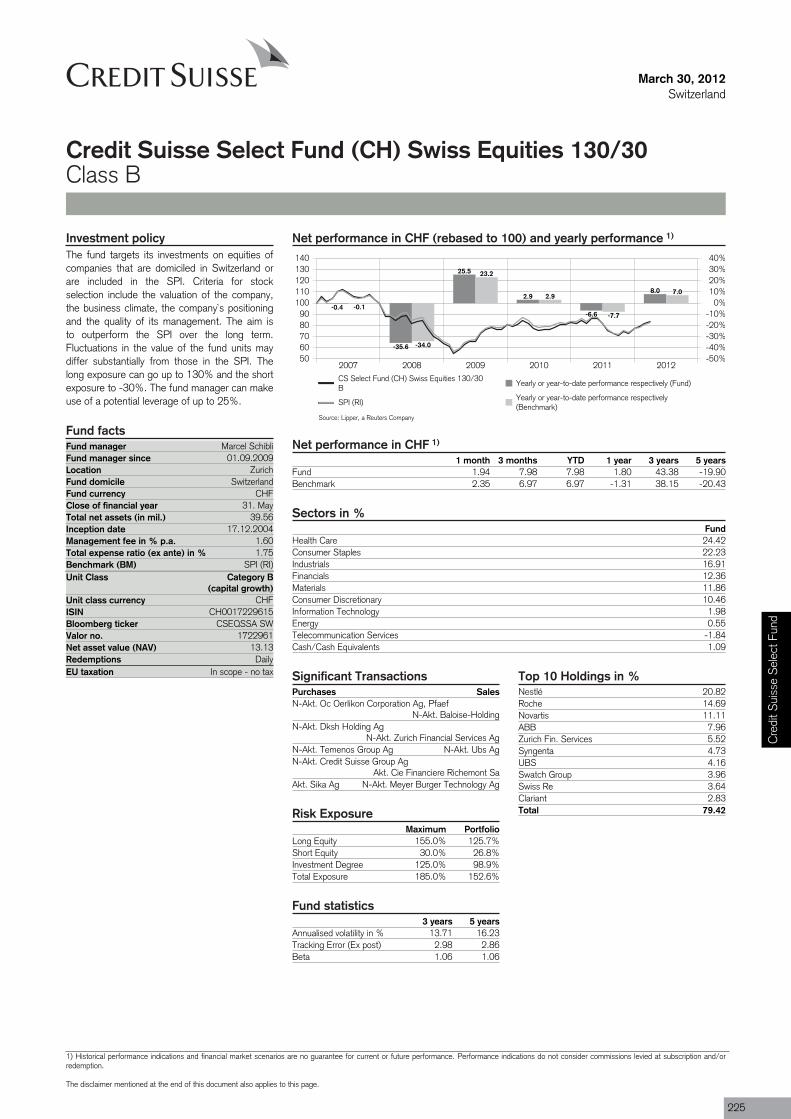
Purchases SalesN-Akt. Oc Oerlikon Corporation Ag, Pfaef
N-Akt. Baloise-HoldingN-Akt. Dksh Holding Ag
N-Akt. Zurich Financial Services AgN-Akt. Temenos Group Ag N-Akt. Ubs AgN-Akt. Credit Suisse Group Ag
Akt. Cie Financiere Richemont SaAkt. Sika Ag N-Akt. Meyer Burger Technology Ag
Fund manager Marcel SchibliFund manager since 01.09.2009Location ZurichFund domicile SwitzerlandFund currency CHFClose of financial year 31. MayTotal net assets (in mil.) 39.56Inception date 17.12.2004Management fee in % p.a. 1.60Total expense ratio (ex ante) in % 1.75Benchmark (BM) SPI (RI)Unit Class Category B
(capital growth)
ISIN CH0017229615
Valor no. 1722961
Redemptions DailyEU taxation In scope - no tax
March 30, 2012Switzerland
Credit Suisse Select Fund (CH) Swiss Equities 130/30Class B
Net performance in CHF (rebased to 100) and yearly performance 1)
2007 2008 2009 2010 2011 20125060708090
100110120130140
-50%-40%-30%-20%-10%
0%10%20%30%40%
-0.4
-35.6
25.5
2.9
-6.6
8.0
-0.1
-34.0
23.2
2.9
-7.7
7.0
CS Select Fund (CH) Swiss Equities 130/30B
Yearly or year-to-date performance respectively (Fund)
SPI (RI)Yearly or year-to-date performance respectively(Benchmark)
Net performance in CHF 1)
1 month 3 months YTD 1 year 3 years 5 yearsFund 1.94 7.98 7.98 1.80 43.38 -19.90Benchmark 2.35 6.97 6.97 -1.31 38.15 -20.43
Sectors in %Fund
Health Care 24.42Consumer Staples 22.23Industrials 16.91Financials 12.36Materials 11.86Consumer Discretionary 10.46Information Technology 1.98Energy 0.55Telecommunication Services -1.84Cash/Cash Equivalents 1.09
Top 10 Holdings in %Nestlé 20.82Roche 14.69Novartis 11.11ABB 7.96Zurich Fin. Services 5.52Syngenta 4.73UBS 4.16Swatch Group 3.96Swiss Re 3.64Clariant 2.83Total 79.42
Significant Transactions
Risk ExposureMaximum Portfolio
Long Equity 155.0% 125.7%Short Equity 30.0% 26.8%Investment Degree 125.0% 98.9%Total Exposure 185.0% 152.6%
Fund statistics3 years 5 years
Annualised volatility in % 13.71 16.23Tracking Error (Ex post) 2.98 2.86Beta 1.06 1.06
Investment policyThe fund targets its investments on equities ofcompanies that are domiciled in Switzerland orare included in the SPI. Criteria for stockselection include the valuation of the company,the business climate, the company`s positioningand the quality of its management. The aim isto outperform the SPI over the long term.Fluctuations in the value of the fund units maydiffer substantially from those in the SPI. Thelong exposure can go up to 130% and the shortexposure to -30%. The fund manager can makeuse of a potential leverage of up to 25%.
Fund facts
Unit class currency CHF
Bloomberg ticker CSEQSSA SW
Net asset value (NAV) 13.13
Source: Lipper, a Reuters Company
Cre
dit S
uiss
e S
elec
t Fun
d
1) Historical performance indications and financial market scenarios are no guarantee for current or future performance. Performance indications do not consider commissions levied at subscription and/orredemption.
The disclaimer mentioned at the end of this document also applies to this page.
225
March 30, 2012Switzerland
Credit Suisse Select Fund (CH) Swiss Equities 130/30Class B
Review previous quarter 2)
The Swiss equity market (as measured by theSPI) rebounded by almost 7% during the firstquarter driven by a strong performance by thebanks and insurance companies (i.e. UBS,Credit Suisse, Swiss Re, Zurich Insurance) aswell as the cyclical cluster (i.e. Sulzer, Clariant,Forbo). The Swiss Small+Midcap Index(SPISMC) gained 8.9%. The traded volume andthe volatility of the Swiss stock market was lowduring the quarter. The macroeconomic newsflow improved, especially regarding the US, butEurope as a whole shows very few signs of aneconomic recovery so far. Only the European
debt problem seems to be solved for themoment. During the first quarter most of theSwiss companies reported solid results for 2011,but the outlook given for 2012 was relativelycautious in some cases.
Positive performance contributions came fromthe cyclical cluster and the insurances as wellas from some short positions. A negativecontribution came from the underweight inbanks. The overweight positions in Gategroup,Clariant, Sulzer and Forbo as well as theunderweights in Novartis and Straumann had a
positive impact on the portfolio performance. Theunderweight in Transocean, Holcim and Adeccoas well as the overweight in Logitech affectedthe performance negatively.
We considerably reduced the underweight in thebanks (i.e. Credit Suisse) and also increased theoverweight in cyclical companies (i.e. Forbo, OCOerlikon). On the other hand we slightly reducedthe overweight in insurance and we increased theunderweight in the defensive cluster.
Outlook for the market 2)
Our macro scenario of a slowly recovering worldeconomy was corroborated again in March. Inthe US, which is already in a moderatelyadvanced stage of the economic cycle, wedetect a broadening of the upturn. Alongsidethe steadily improving employment market, thespotlight has now also turned to the bottomforming in the housing market, which is veryimportant for the overall economy. This, coupledwith a noticeable increase in aggregate wages,has significantly improved the outlook forpersonal consumption. This means that theexport sector is now being joined by a second,
strongly supportive pillar. But given the expectedfiscal-policy headwind, it is still questionablewhether the US economy can continue growingat the current brisk annualized pace of about3-4%. Nevertheless, a firm pedestal ofeconomic activity is in place, and it can continueemitting forceful impulses for the globaleconomy. This also goes for the sustainedimprovement in the economic climate inemerging market countries.
We are nonetheless proceeding on theassumption that the headwinds described will
have only very short-lived consequences for themarkets. From a valuation standpoint, most ofthe undervaluations have been corrected.However, stocks remain inexpensively valued inhistorical comparison, especially relative tobonds. Sentiment has improved, but is still along way from euphoria. Institutional investorswith non-benchmarked portfolios are still holdingtiny equity allocations. We expect the economicupturn to continue, albeit at a moderate pace.The Swiss Equity Market stands at a P/E of 12.4and a risk premium of 7.2%, which still reflectsan undervaluation based on historic contexts.
Portfolio ManagementMr Schibli obtained a bank apprenticeship at Swiss Bank Corporation before working in the securities department (including a traineeshipin London) for six years. In 1983 he joined the Gewerbebank, becoming Head of Trading/Investment advising/emission in 1987. Prior tojoining the Swiss equities sales team at Credit Suisse First Boston, he was Head of the Swiss equities sales team in another major Swissbank. He finally joined the advisory and execution desk at CSAM in 1997. Since April 2000 he has been a Portfolio Manager for Swissequities.
2) If not expressly indicated otherwise, all quantitative data contained in this comment is based on Lipper, Bloomberg or Datastream.
226
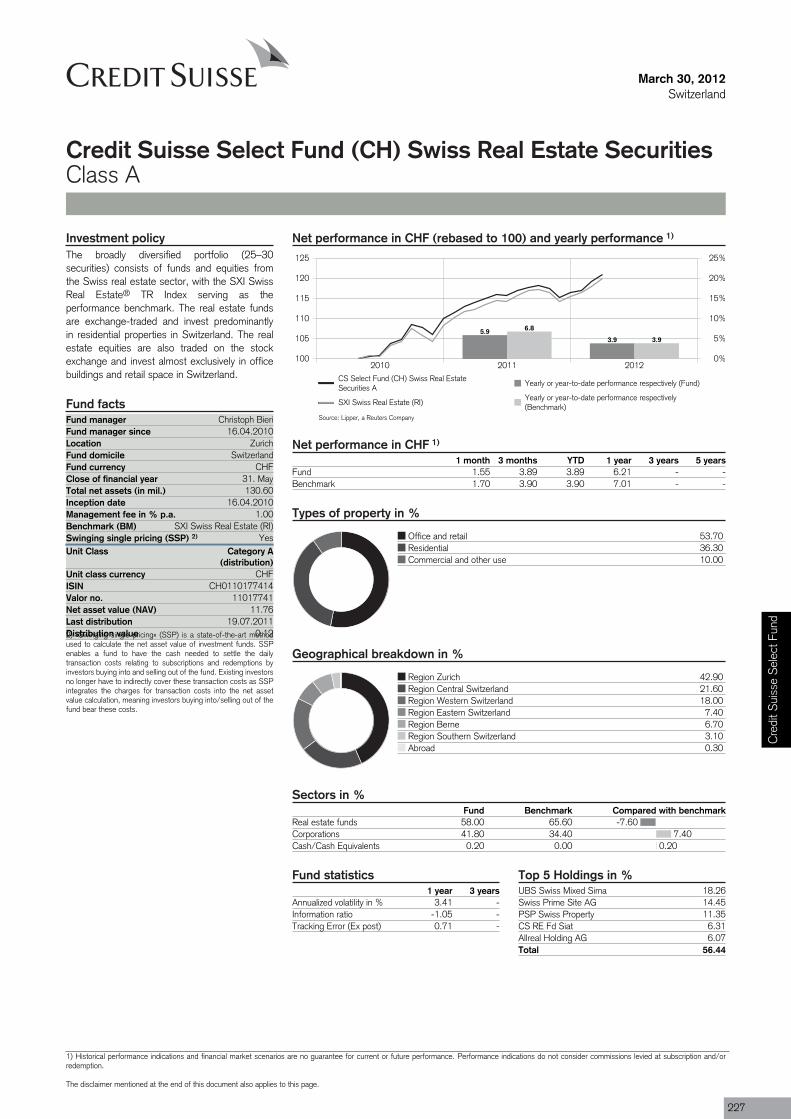
-7.607.40
0.20
Fund manager Christoph BieriFund manager since 16.04.2010Location ZurichFund domicile SwitzerlandFund currency CHFClose of financial year 31. MayTotal net assets (in mil.) 130.60Inception date 16.04.2010Management fee in % p.a. 1.00Benchmark (BM) SXI Swiss Real Estate (RI)Swinging single pricing (SSP) 2) YesUnit Class Category A
(distribution)Unit class currency CHFISIN CH0110177414Valor no. 11017741
Last distribution 19.07.2011Distribution value 0.12
March 30, 2012Switzerland
Credit Suisse Select Fund (CH) Swiss Real Estate SecuritiesClass A
Net performance in CHF (rebased to 100) and yearly performance 1)
2010 2011 2012100
105
110
115
120
125
0%
5%
10%
15%
20%
25%
5.93.9
6.8
3.9
CS Select Fund (CH) Swiss Real EstateSecurities A
Yearly or year-to-date performance respectively (Fund)
SXI Swiss Real Estate (RI)Yearly or year-to-date performance respectively(Benchmark)
Net performance in CHF 1)
1 month 3 months YTD 1 year 3 years 5 yearsFund 1.55 3.89 3.89 6.21 - -Benchmark 1.70 3.90 3.90 7.01 - -
Types of property in %
Office and retail 53.70Residential 36.30Commercial and other use 10.00
Geographical breakdown in %
Region Zurich 42.90Region Central Switzerland 21.60Region Western Switzerland 18.00Region Eastern Switzerland 7.40Region Berne 6.70Region Southern Switzerland 3.10Abroad 0.30
Sectors in %Fund Benchmark Compared with benchmark
Real estate funds 58.00 65.60Corporations 41.80 34.40Cash/Cash Equivalents 0.20 0.00
Fund statistics1 year 3 years
Annualized volatility in % 3.41 -Information ratio -1.05 -Tracking Error (Ex post) 0.71 -
Top 5 Holdings in %UBS Swiss Mixed Sima 18.26Swiss Prime Site AG 14.45PSP Swiss Property 11.35CS RE Fd Siat 6.31Allreal Holding AG 6.07Total 56.44
Investment policyThe broadly diversified portfolio (25–30securities) consists of funds and equities fromthe Swiss real estate sector, with the SXI SwissReal Estate® TR Index serving as theperformance benchmark. The real estate fundsare exchange-traded and invest predominantlyin residential properties in Switzerland. The realestate equities are also traded on the stockexchange and invest almost exclusively in officebuildings and retail space in Switzerland.
Fund facts
Net asset value (NAV) 11.76
2) «Swinging single pricing» (SSP) is a state-of-the-art methodused to calculate the net asset value of investment funds. SSPenables a fund to have the cash needed to settle the dailytransaction costs relating to subscriptions and redemptions byinvestors buying into and selling out of the fund. Existing investorsno longer have to indirectly cover these transaction costs as SSPintegrates the charges for transaction costs into the net assetvalue calculation, meaning investors buying into/selling out of thefund bear these costs.
Source: Lipper, a Reuters Company
Cre
dit S
uiss
e S
elec
t Fun
d
1) Historical performance indications and financial market scenarios are no guarantee for current or future performance. Performance indications do not consider commissions levied at subscription and/orredemption.
The disclaimer mentioned at the end of this document also applies to this page.
227

March 30, 2012Switzerland
Credit Suisse Select Fund (CH) Swiss Real Estate SecuritiesClass A
Review previous quarter 3)
Strong economic data from the US and asolution for Greece to decrease their debtsupported the recovery of equity markets. Firstsigns of an end of the historical low interestrate environment moved rates mainly for longerdurations almost 30bps higher. At the end of thequarter, the yield on 10 year Swiss government
bonds amounted to 0.9% in comparison to 0.7%at year end.
Swiss real estate investments also had a positivestart into the year. Real estate funds as well asreal estate companies published very convincingannual reports. They could present high
appreciation and lower vacancy rates on their realestate portfolios. In addition, for some companieswe even saw an increase in distributions dueto the strong results. The real estate funds hada performance of 3.5% in the quarter and thereal estate companies were even better with anincrease of 5%.
Outlook for the market 3)
The Swiss economy grew last year by 1.9%, butwith a decreasing business trend. The definitionof a minimum level for the EUR/CHF 1.20 hadwithout doubt a positive effect for exportcompanies and increased their planningcertainty. The latest development showedalready more optimistic forecasts for 2012. Weexpect that interest rates in Switzerland willremain at a very low level during the next month.The 10 year Swiss government bonds could
increase to a yield of 1.3% to 1.5% during thenext 12 months. This is still a positive scenariofor real estate investments.
Demand for residential property will, in ouropinion, remain extraordinarily high in 2012thanks to robust immigration and the persistenceof low mortgage interest rates. The Swiss officeproperty market has coped well with theeconomic turbulence of the past three years.
Given the modest employment trends in theclassic office sectors, the fact that no meaningfuloversupply developed during 2010/11 can beseen as evidence of sound planning.Nevertheless the well-stocked pipeline of largeprojects could lead to increasing vacancies in theurban centers in the German-speaking part ofSwitzerland. Overall, indirect Swiss real estateremains an attractive investment in the comingmonth.
Portfolio ManagementChristoph Bieri received his master's degree in economics and business administration from the University of Berne in 1990 and holds areal estate agent certificate from the canton of Berne. After his studies he worked for 3 years at the Swiss Federal Bureau for Statistics,managing various projects. From 1994 to 1999 Christoph Bieri spent 5 years at Zurcher Kantonalbank as a financial analyst covering theSwiss banking and property sector as well co-managing the banks structured Swiss equity portfolios. During this time he also received hiscertification as an EFFAS financial analyst. In 1999 he took a job at Banca del Gottardo, where he was responsible for setting up the Swissequity research team. Christoph Bieri joined the CSAM Swiss equity team as portfolio manager in 2002.
3) If not expressly indicated otherwise, all quantitative data contained in this comment is based on Lipper, Bloomberg or Datastream.
228
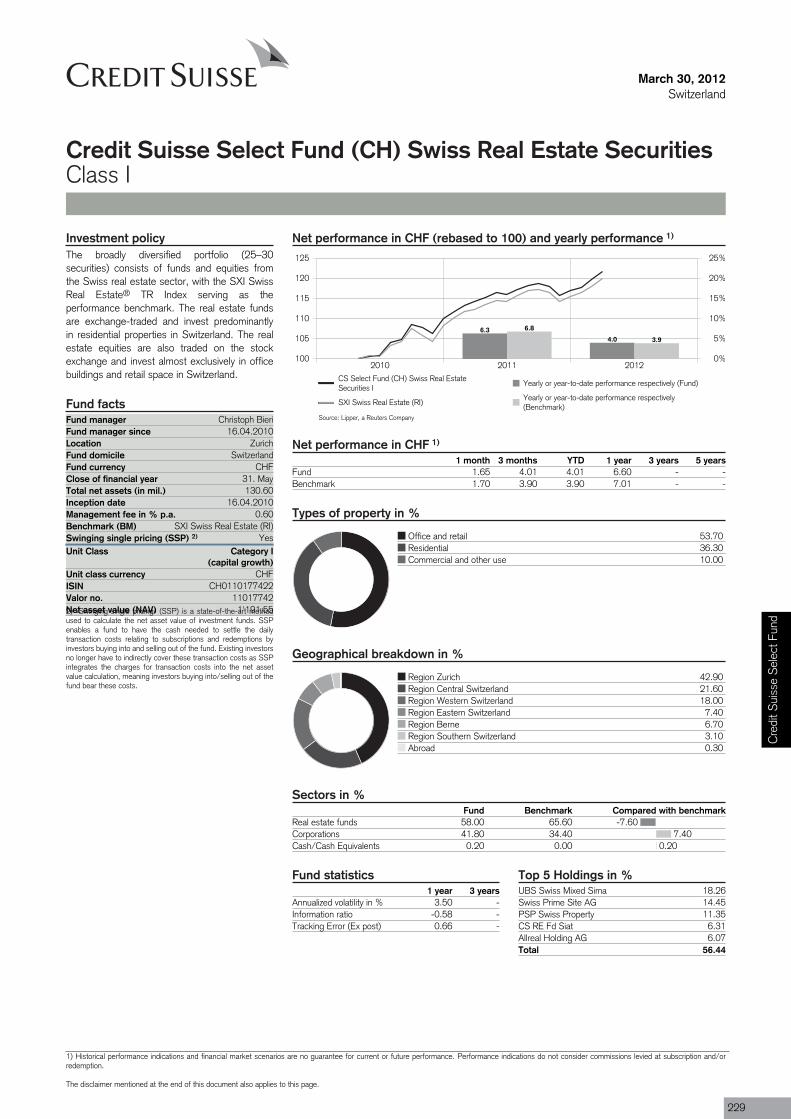
-7.607.40
0.20
Fund manager Christoph BieriFund manager since 16.04.2010Location ZurichFund domicile SwitzerlandFund currency CHFClose of financial year 31. MayTotal net assets (in mil.) 130.60Inception date 16.04.2010Management fee in % p.a. 0.60Benchmark (BM) SXI Swiss Real Estate (RI)Swinging single pricing (SSP) 2) YesUnit Class Category I
(capital growth)Unit class currency CHFISIN CH0110177422Valor no. 11017742
March 30, 2012Switzerland
Credit Suisse Select Fund (CH) Swiss Real Estate SecuritiesClass I
Net performance in CHF (rebased to 100) and yearly performance 1)
2010 2011 2012100
105
110
115
120
125
0%
5%
10%
15%
20%
25%
6.34.0
6.8
3.9
CS Select Fund (CH) Swiss Real EstateSecurities I
Yearly or year-to-date performance respectively (Fund)
SXI Swiss Real Estate (RI)Yearly or year-to-date performance respectively(Benchmark)
Net performance in CHF 1)
1 month 3 months YTD 1 year 3 years 5 yearsFund 1.65 4.01 4.01 6.60 - -Benchmark 1.70 3.90 3.90 7.01 - -
Types of property in %
Office and retail 53.70Residential 36.30Commercial and other use 10.00
Geographical breakdown in %
Region Zurich 42.90Region Central Switzerland 21.60Region Western Switzerland 18.00Region Eastern Switzerland 7.40Region Berne 6.70Region Southern Switzerland 3.10Abroad 0.30
Sectors in %Fund Benchmark Compared with benchmark
Real estate funds 58.00 65.60Corporations 41.80 34.40Cash/Cash Equivalents 0.20 0.00
Fund statistics1 year 3 years
Annualized volatility in % 3.50 -Information ratio -0.58 -Tracking Error (Ex post) 0.66 -
Top 5 Holdings in %UBS Swiss Mixed Sima 18.26Swiss Prime Site AG 14.45PSP Swiss Property 11.35CS RE Fd Siat 6.31Allreal Holding AG 6.07Total 56.44
Investment policyThe broadly diversified portfolio (25–30securities) consists of funds and equities fromthe Swiss real estate sector, with the SXI SwissReal Estate® TR Index serving as theperformance benchmark. The real estate fundsare exchange-traded and invest predominantlyin residential properties in Switzerland. The realestate equities are also traded on the stockexchange and invest almost exclusively in officebuildings and retail space in Switzerland.
Fund facts
Net asset value (NAV) 1'191.552) «Swinging single pricing» (SSP) is a state-of-the-art methodused to calculate the net asset value of investment funds. SSPenables a fund to have the cash needed to settle the dailytransaction costs relating to subscriptions and redemptions byinvestors buying into and selling out of the fund. Existing investorsno longer have to indirectly cover these transaction costs as SSPintegrates the charges for transaction costs into the net assetvalue calculation, meaning investors buying into/selling out of thefund bear these costs.
Source: Lipper, a Reuters Company
Cre
dit S
uiss
e S
elec
t Fun
d
1) Historical performance indications and financial market scenarios are no guarantee for current or future performance. Performance indications do not consider commissions levied at subscription and/orredemption.
The disclaimer mentioned at the end of this document also applies to this page.
229

March 30, 2012Switzerland
Credit Suisse Select Fund (CH) Swiss Real Estate SecuritiesClass I
Review previous quarter 3)
Strong economic data from the US and asolution for Greece to decrease their debtsupported the recovery of equity markets. Firstsigns of an end of the historical low interestrate environment moved rates mainly for longerdurations almost 30bps higher. At the end of thequarter, the yield on 10 year Swiss government
bonds amounted to 0.9% in comparison to 0.7%at year end.
Swiss real estate investments also had a positivestart into the year. Real estate funds as well asreal estate companies published very convincingannual reports. They could present high
appreciation and lower vacancy rates on their realestate portfolios. In addition, for some companieswe even saw an increase in distributions dueto the strong results. The real estate funds hada performance of 3.5% in the quarter and thereal estate companies were even better with anincrease of 5%.
Outlook for the market 3)
The Swiss economy grew last year by 1.9%, butwith a decreasing business trend. The definitionof a minimum level for the EUR/CHF 1.20 hadwithout doubt a positive effect for exportcompanies and increased their planningcertainty. The latest development showedalready more optimistic forecasts for 2012. Weexpect that interest rates in Switzerland willremain at a very low level during the next month.The 10 year Swiss government bonds could
increase to a yield of 1.3% to 1.5% during thenext 12 months. This is still a positive scenariofor real estate investments.
Demand for residential property will, in ouropinion, remain extraordinarily high in 2012thanks to robust immigration and the persistenceof low mortgage interest rates. The Swiss officeproperty market has coped well with theeconomic turbulence of the past three years.
Given the modest employment trends in theclassic office sectors, the fact that no meaningfuloversupply developed during 2010/11 can beseen as evidence of sound planning.Nevertheless the well-stocked pipeline of largeprojects could lead to increasing vacancies in theurban centers in the German-speaking part ofSwitzerland. Overall, indirect Swiss real estateremains an attractive investment in the comingmonth.
Portfolio ManagementChristoph Bieri received his master's degree in economics and business administration from the University of Berne in 1990 and holds areal estate agent certificate from the canton of Berne. After his studies he worked for 3 years at the Swiss Federal Bureau for Statistics,managing various projects. From 1994 to 1999 Christoph Bieri spent 5 years at Zurcher Kantonalbank as a financial analyst covering theSwiss banking and property sector as well co-managing the banks structured Swiss equity portfolios. During this time he also received hiscertification as an EFFAS financial analyst. In 1999 he took a job at Banca del Gottardo, where he was responsible for setting up the Swissequity research team. Christoph Bieri joined the CSAM Swiss equity team as portfolio manager in 2002.
3) If not expressly indicated otherwise, all quantitative data contained in this comment is based on Lipper, Bloomberg or Datastream.
230
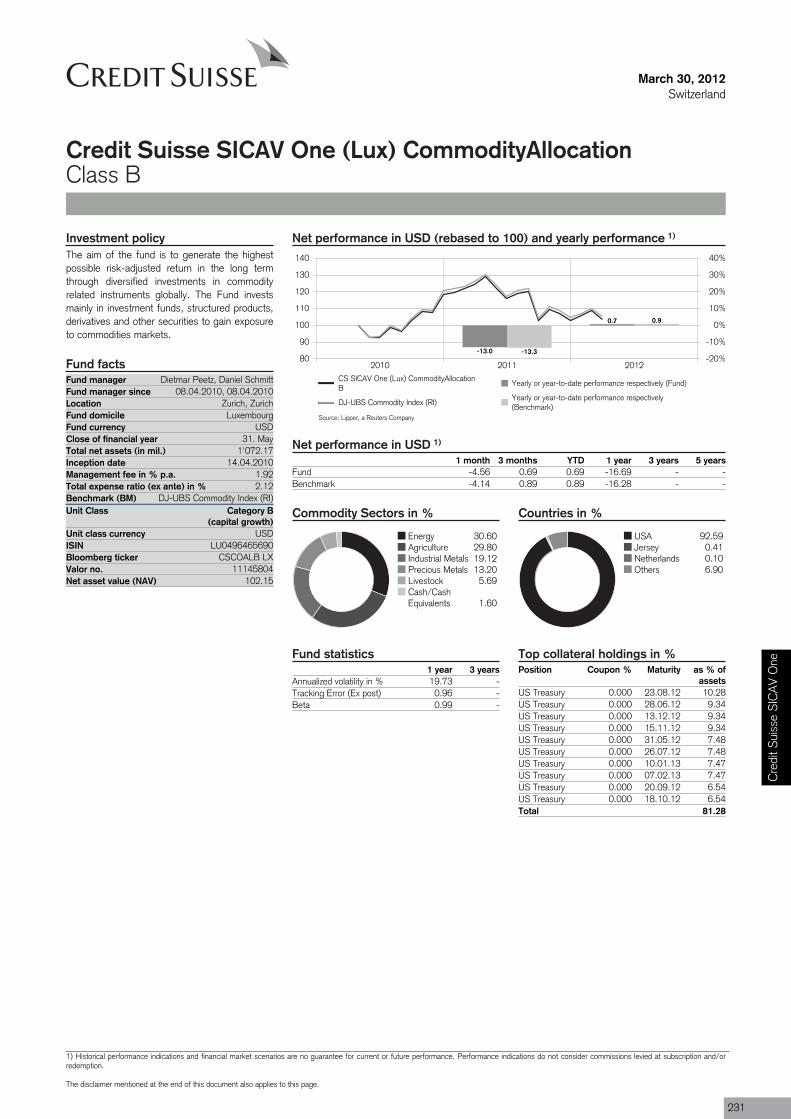
Fund manager Dietmar Peetz, Daniel SchmittFund manager since 08.04.2010, 08.04.2010Location Zurich, ZurichFund domicile LuxembourgFund currency USDClose of financial year 31. MayTotal net assets (in mil.) 1'072.17Inception date 14.04.2010Management fee in % p.a. 1.92Total expense ratio (ex ante) in % 2.12Benchmark (BM) DJ-UBS Commodity Index (RI)Unit Class Category B
(capital growth)
ISIN LU0496465690
Valor no. 11145804
March 30, 2012Switzerland
Credit Suisse SICAV One (Lux) CommodityAllocationClass B
Net performance in USD (rebased to 100) and yearly performance 1)
2010 2011 201280
90
100
110
120
130
140
-20%
-10%
0%
10%
20%
30%
40%
-13.0
0.7
-13.3
0.9
CS SICAV One (Lux) CommodityAllocationB
Yearly or year-to-date performance respectively (Fund)
DJ-UBS Commodity Index (RI)Yearly or year-to-date performance respectively(Benchmark)
Net performance in USD 1)
1 month 3 months YTD 1 year 3 years 5 yearsFund -4.56 0.69 0.69 -16.69 - -Benchmark -4.14 0.89 0.89 -16.28 - -
Commodity Sectors in %
Energy 30.60Agriculture 29.80Industrial Metals 19.12Precious Metals 13.20Livestock 5.69Cash/CashEquivalents 1.60
Countries in %
USA 92.59Jersey 0.41Netherlands 0.10Others 6.90
Fund statistics1 year 3 years
Annualized volatility in % 19.73 -Tracking Error (Ex post) 0.96 -Beta 0.99 -
Top collateral holdings in %Position Coupon % Maturity as % of
assetsUS Treasury 0.000 23.08.12 10.28US Treasury 0.000 28.06.12 9.34US Treasury 0.000 13.12.12 9.34US Treasury 0.000 15.11.12 9.34US Treasury 0.000 31.05.12 7.48US Treasury 0.000 26.07.12 7.48US Treasury 0.000 10.01.13 7.47US Treasury 0.000 07.02.13 7.47US Treasury 0.000 20.09.12 6.54US Treasury 0.000 18.10.12 6.54Total 81.28
Investment policyThe aim of the fund is to generate the highestpossible risk-adjusted return in the long termthrough diversified investments in commodityrelated instruments globally. The Fund investsmainly in investment funds, structured products,derivatives and other securities to gain exposureto commodities markets.
Fund facts
Unit class currency USD
Bloomberg ticker CSCOALB LX
Net asset value (NAV) 102.15
Source: Lipper, a Reuters Company
Cre
dit S
uiss
e S
ICA
V O
ne
1) Historical performance indications and financial market scenarios are no guarantee for current or future performance. Performance indications do not consider commissions levied at subscription and/orredemption.
The disclaimer mentioned at the end of this document also applies to this page.
231

March 30, 2012Switzerland
Credit Suisse SICAV One (Lux) CommodityAllocationClass B
Review previous quarter 2)
During Q1 2012, the DJ-UBS TR had a mixedperformance. After a good run until end ofFebruary the index had to give up most of itsgains as fear of global economic slowdown cutinto commodity prices. The index finished thequarter +0.89%. In the same period, the dollarindex was down almost 1.5% and the MSCIWorld gained 10.94%. The biggest positivedrivers in the index were DJ-UBS PreciousMetals (+8.49%), DJ-UBS Industrial Metals(+5.75%) and DJ-UBS Agriculture Index(+3.16%). On the negative side stood DJ-UBSLivestock (-5.19%) and DJ-UBS Energy(-6.11%).
The energy sector again showed a verydispersed performance picture: DJ-UBSUnleaded Gasoline finished the quarter up19.43%, making it the best performing sector,clearly outperforming DJ-UBS Heating Oil(+10.83%). DJ-UBS Crude finished the quarterup 3.04%. The most disappointing performancecame again from DJ-UBS NatGas with the indexclosing the quarter -36.96% due to oversupply.
Sector dispersion was also high in industrialmetals. Positive performance was seen inDJ-UBS Tin (+18.52%), Copper (+11.11%),Zinc (+7.73%) and Aluminum (+3.26%). On theother side stood Lead (-0.65%) and Nickel
(-5.22%). In the agriculture space we sawpositive returns for Soybean (+15.37%), Sugar(+9.81%), Cocoa (+4.85%) and Cotton(+0.34%). The other sectors saw price declines:Coffee (-20.44%), Corn (-1.11%), and Wheat(-0.02%).
Within the precious metals sector, all sectorswhere up: Platinum (+17.01%), Silver(+16.15%) and Gold (+6.35%). The onlyexception was Palladium which finished thequarter -0.13%, reversing its strong pricemomentum in the previous quarter.
Outlook for the market 2)
In line with our commodity research analyst view,we continue to expect sector price dispersionto be a key feature for the remainder of 2012.Commodity-specific fundamentals will dominatethe price action. On the flip side, tail risks such
as an escalation of the Middle East tensionsor a severe China hard landing still exist andcould lead to turmoil in the commodity markets.However, these potential events could alsocreate interesting outperformance opportunities
in individual commodities when market volatilityhas led commodity prices far from theirfundamental values.
Portfolio ManagementDr. Dietmar Peetz is a Senior Portfolio Manager with more than 14 years experience in financial markets covering commodities, fixedincome, equity and derivatives. He joined Credit Suisse Asset Management from FVS AG in Germany, where he was responsible fordeveloping and implementing risk optimized portfolios using absolute return strategies. Prior to FVS Dr. Peetz worked at Commercial Bankof Cologne in Portfolio Management, Treasury and Trading, with a focus on financial engineering and proprietary trading. Dr. Peetzgraduated from the University of Applied Sciences in Cologne, Germany and from the University of Reading, UK, with a Master of Sciencein International Banking. He completed his PhD thesis in 2007 from the University of Kassel, Germany.
2) If not expressly indicated otherwise, all quantitative data contained in this comment is based on Lipper, Bloomberg or Datastream.
232

Fund manager Dietmar Peetz, Daniel SchmittFund manager since 08.04.2010, 08.04.2010Location Zurich, ZurichFund domicile LuxembourgFund currency USDClose of financial year 31. MayTotal net assets (in mil.) 1'072.17Inception date 14.04.2010Management fee in % p.a. 1.92Total expense ratio (ex ante) in % 2.12Benchmark (BM)
DJ-UBS Commodity Index (RI) (Hedged into CHF)Unit Class Category R
(capital growth / hedged)
ISIN LU0499371648
Valor no. 11183148
March 30, 2012Switzerland
Credit Suisse SICAV One (Lux) CommodityAllocationClass R CHF
Net performance in CHF (rebased to 100) and yearly performance 1)
2010 2011 201280
90
100
110
120
130
-20%
-10%
0%
10%
20%
30%
-13.8
0.5
-16.2
0.7
CS SICAV One (Lux) CommodityAllocation RCHF
Yearly or year-to-date performance respectively (Fund)
DJ-UBS Commodity Index (RI) (Hedged intoCHF)
Yearly or year-to-date performance respectively(Benchmark)
Net performance in CHF 1)
1 month 3 months YTD 1 year 3 years 5 yearsFund -4.65 0.48 0.48 -17.51 - -Benchmark -4.18 0.66 0.66 -19.14 - -
Commodity Sectors in %
Energy 30.60Agriculture 29.80Industrial Metals 19.12Precious Metals 13.20Livestock 5.69Cash/CashEquivalents 1.60
Countries in %
USA 92.59Jersey 0.41Netherlands 0.10Others 6.90
Fund statistics1 year 3 years
Annualized volatility in % 20.35 -Tracking Error (Ex post) 2.27 -Beta 0.95 -
Top collateral holdings in %Position Coupon % Maturity as % of
assetsUS Treasury 0.000 23.08.12 10.28US Treasury 0.000 28.06.12 9.34US Treasury 0.000 13.12.12 9.34US Treasury 0.000 15.11.12 9.34US Treasury 0.000 31.05.12 7.48US Treasury 0.000 26.07.12 7.48US Treasury 0.000 10.01.13 7.47US Treasury 0.000 07.02.13 7.47US Treasury 0.000 20.09.12 6.54US Treasury 0.000 18.10.12 6.54Total 81.28
Investment policyThe aim of the fund is to generate the highestpossible risk-adjusted return in the long termthrough diversified investments in commodityrelated instruments globally. The Fund investsmainly in investment funds, structured products,derivatives and other securities to gain exposureto commodities markets.
Fund facts
Unit class currency CHF
Bloomberg ticker CSCALCR LX
Net asset value (NAV) 99.14
Source: Lipper, a Reuters Company
Cre
dit S
uiss
e S
ICA
V O
ne
1) Historical performance indications and financial market scenarios are no guarantee for current or future performance. Performance indications do not consider commissions levied at subscription and/orredemption.
The disclaimer mentioned at the end of this document also applies to this page.
233
March 30, 2012Switzerland
Credit Suisse SICAV One (Lux) CommodityAllocationClass R CHF
Review previous quarter 2)
During Q1 2012, the DJ-UBS TR had a mixedperformance. After a good run until end ofFebruary the index had to give up most of itsgains as fear of global economic slowdown cutinto commodity prices. The index finished thequarter +0.89%. In the same period, the dollarindex was down almost 1.5% and the MSCIWorld gained 10.94%. The biggest positivedrivers in the index were DJ-UBS PreciousMetals (+8.49%), DJ-UBS Industrial Metals(+5.75%) and DJ-UBS Agriculture Index(+3.16%). On the negative side stood DJ-UBSLivestock (-5.19%) and DJ-UBS Energy(-6.11%).
The energy sector again showed a verydispersed performance picture: DJ-UBSUnleaded Gasoline finished the quarter up19.43%, making it the best performing sector,clearly outperforming DJ-UBS Heating Oil(+10.83%). DJ-UBS Crude finished the quarterup 3.04%. The most disappointing performancecame again from DJ-UBS NatGas with the indexclosing the quarter -36.96% due to oversupply.
Sector dispersion was also high in industrialmetals. Positive performance was seen inDJ-UBS Tin (+18.52%), Copper (+11.11%),Zinc (+7.73%) and Aluminum (+3.26%). On theother side stood Lead (-0.65%) and Nickel
(-5.22%). In the agriculture space we sawpositive returns for Soybean (+15.37%), Sugar(+9.81%), Cocoa (+4.85%) and Cotton(+0.34%). The other sectors saw price declines:Coffee (-20.44%), Corn (-1.11%), and Wheat(-0.02%).
Within the precious metals sector, all sectorswhere up: Platinum (+17.01%), Silver(+16.15%) and Gold (+6.35%). The onlyexception was Palladium which finished thequarter -0.13%, reversing its strong pricemomentum in the previous quarter.
Outlook for the market 2)
In line with our commodity research analyst view,we continue to expect sector price dispersionto be a key feature for the remainder of 2012.Commodity-specific fundamentals will dominatethe price action. On the flip side, tail risks such
as an escalation of the Middle East tensionsor a severe China hard landing still exist andcould lead to turmoil in the commodity markets.However, these potential events could alsocreate interesting outperformance opportunities
in individual commodities when market volatilityhas led commodity prices far from theirfundamental values.
Portfolio ManagementDr. Dietmar Peetz is a Senior Portfolio Manager with more than 14 years experience in financial markets covering commodities, fixedincome, equity and derivatives. He joined Credit Suisse Asset Management from FVS AG in Germany, where he was responsible fordeveloping and implementing risk optimized portfolios using absolute return strategies. Prior to FVS Dr. Peetz worked at Commercial Bankof Cologne in Portfolio Management, Treasury and Trading, with a focus on financial engineering and proprietary trading. Dr. Peetzgraduated from the University of Applied Sciences in Cologne, Germany and from the University of Reading, UK, with a Master of Sciencein International Banking. He completed his PhD thesis in 2007 from the University of Kassel, Germany.
2) If not expressly indicated otherwise, all quantitative data contained in this comment is based on Lipper, Bloomberg or Datastream.
234
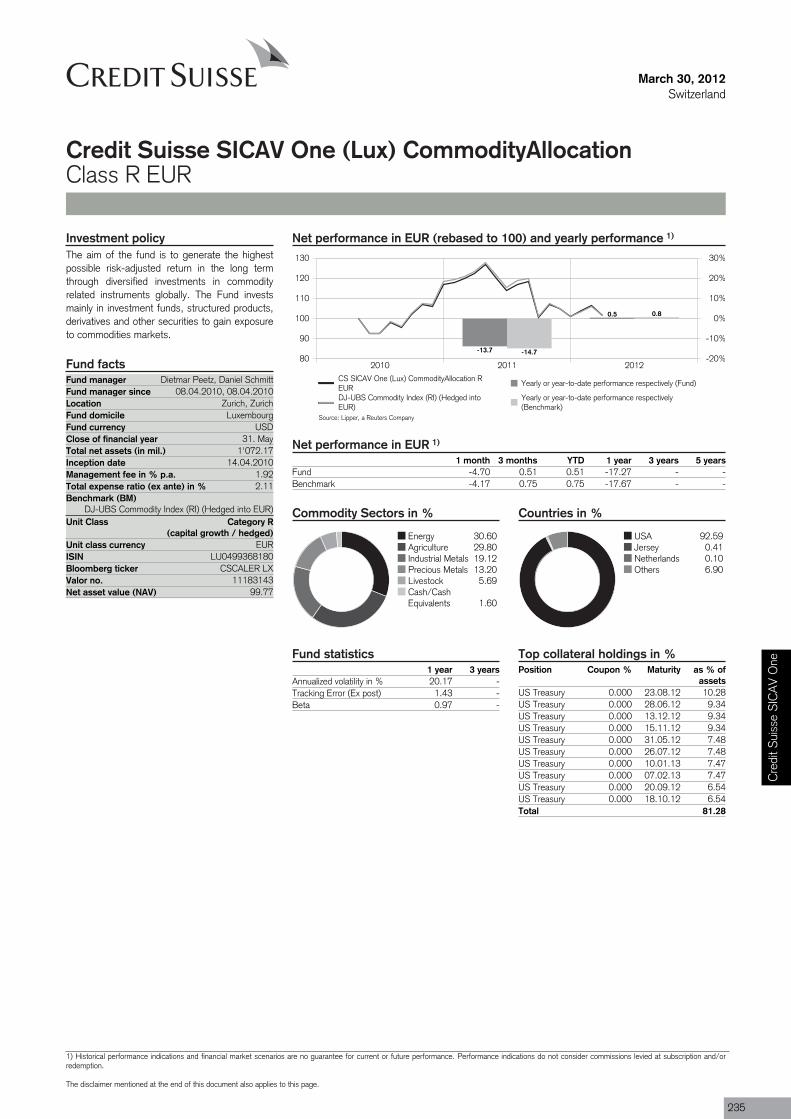
Fund manager Dietmar Peetz, Daniel SchmittFund manager since 08.04.2010, 08.04.2010Location Zurich, ZurichFund domicile LuxembourgFund currency USDClose of financial year 31. MayTotal net assets (in mil.) 1'072.17Inception date 14.04.2010Management fee in % p.a. 1.92Total expense ratio (ex ante) in % 2.11Benchmark (BM)
DJ-UBS Commodity Index (RI) (Hedged into EUR)Unit Class Category R
(capital growth / hedged)
ISIN LU0499368180
Valor no. 11183143
March 30, 2012Switzerland
Credit Suisse SICAV One (Lux) CommodityAllocationClass R EUR
Net performance in EUR (rebased to 100) and yearly performance 1)
2010 2011 201280
90
100
110
120
130
-20%
-10%
0%
10%
20%
30%
-13.7
0.5
-14.7
0.8
CS SICAV One (Lux) CommodityAllocation REUR
Yearly or year-to-date performance respectively (Fund)
DJ-UBS Commodity Index (RI) (Hedged intoEUR)
Yearly or year-to-date performance respectively(Benchmark)
Net performance in EUR 1)
1 month 3 months YTD 1 year 3 years 5 yearsFund -4.70 0.51 0.51 -17.27 - -Benchmark -4.17 0.75 0.75 -17.67 - -
Commodity Sectors in %
Energy 30.60Agriculture 29.80Industrial Metals 19.12Precious Metals 13.20Livestock 5.69Cash/CashEquivalents 1.60
Countries in %
USA 92.59Jersey 0.41Netherlands 0.10Others 6.90
Fund statistics1 year 3 years
Annualized volatility in % 20.17 -Tracking Error (Ex post) 1.43 -Beta 0.97 -
Top collateral holdings in %Position Coupon % Maturity as % of
assetsUS Treasury 0.000 23.08.12 10.28US Treasury 0.000 28.06.12 9.34US Treasury 0.000 13.12.12 9.34US Treasury 0.000 15.11.12 9.34US Treasury 0.000 31.05.12 7.48US Treasury 0.000 26.07.12 7.48US Treasury 0.000 10.01.13 7.47US Treasury 0.000 07.02.13 7.47US Treasury 0.000 20.09.12 6.54US Treasury 0.000 18.10.12 6.54Total 81.28
Investment policyThe aim of the fund is to generate the highestpossible risk-adjusted return in the long termthrough diversified investments in commodityrelated instruments globally. The Fund investsmainly in investment funds, structured products,derivatives and other securities to gain exposureto commodities markets.
Fund facts
Unit class currency EUR
Bloomberg ticker CSCALER LX
Net asset value (NAV) 99.77
Source: Lipper, a Reuters Company
Cre
dit S
uiss
e S
ICA
V O
ne
1) Historical performance indications and financial market scenarios are no guarantee for current or future performance. Performance indications do not consider commissions levied at subscription and/orredemption.
The disclaimer mentioned at the end of this document also applies to this page.
235

March 30, 2012Switzerland
Credit Suisse SICAV One (Lux) CommodityAllocationClass R EUR
Review previous quarter 2)
During Q1 2012, the DJ-UBS TR had a mixedperformance. After a good run until end ofFebruary the index had to give up most of itsgains as fear of global economic slowdown cutinto commodity prices. The index finished thequarter +0.89%. In the same period, the dollarindex was down almost 1.5% and the MSCIWorld gained 10.94%. The biggest positivedrivers in the index were DJ-UBS PreciousMetals (+8.49%), DJ-UBS Industrial Metals(+5.75%) and DJ-UBS Agriculture Index(+3.16%). On the negative side stood DJ-UBSLivestock (-5.19%) and DJ-UBS Energy(-6.11%).
The energy sector again showed a verydispersed performance picture: DJ-UBSUnleaded Gasoline finished the quarter up19.43%, making it the best performing sector,clearly outperforming DJ-UBS Heating Oil(+10.83%). DJ-UBS Crude finished the quarterup 3.04%. The most disappointing performancecame again from DJ-UBS NatGas with the indexclosing the quarter -36.96% due to oversupply.
Sector dispersion was also high in industrialmetals. Positive performance was seen inDJ-UBS Tin (+18.52%), Copper (+11.11%),Zinc (+7.73%) and Aluminum (+3.26%). On theother side stood Lead (-0.65%) and Nickel
(-5.22%). In the agriculture space we sawpositive returns for Soybean (+15.37%), Sugar(+9.81%), Cocoa (+4.85%) and Cotton(+0.34%). The other sectors saw price declines:Coffee (-20.44%), Corn (-1.11%), and Wheat(-0.02%).
Within the precious metals sector, all sectorswhere up: Platinum (+17.01%), Silver(+16.15%) and Gold (+6.35%). The onlyexception was Palladium which finished thequarter -0.13%, reversing its strong pricemomentum in the previous quarter.
Outlook for the market 2)
In line with our commodity research analyst view,we continue to expect sector price dispersionto be a key feature for the remainder of 2012.Commodity-specific fundamentals will dominatethe price action. On the flip side, tail risks such
as an escalation of the Middle East tensionsor a severe China hard landing still exist andcould lead to turmoil in the commodity markets.However, these potential events could alsocreate interesting outperformance opportunities
in individual commodities when market volatilityhas led commodity prices far from theirfundamental values.
Portfolio ManagementDr. Dietmar Peetz is a Senior Portfolio Manager with more than 14 years experience in financial markets covering commodities, fixedincome, equity and derivatives. He joined Credit Suisse Asset Management from FVS AG in Germany, where he was responsible fordeveloping and implementing risk optimized portfolios using absolute return strategies. Prior to FVS Dr. Peetz worked at Commercial Bankof Cologne in Portfolio Management, Treasury and Trading, with a focus on financial engineering and proprietary trading. Dr. Peetzgraduated from the University of Applied Sciences in Cologne, Germany and from the University of Reading, UK, with a Master of Sciencein International Banking. He completed his PhD thesis in 2007 from the University of Kassel, Germany.
2) If not expressly indicated otherwise, all quantitative data contained in this comment is based on Lipper, Bloomberg or Datastream.
236

6.07-11.67
2.771.530.720.54
-3.50-2.88
1.725.55
Purchases SalesSAMSUNG TECHWIN
HYUNDAI DEPARTMENT STORECHEUNG KONG HOLDINGS
SUN HUNG KAI PROPERTIESBELLE INTERNATIONAL HOLDINGS
CHINA TELECOM hHYUNDAI HEAVY INDUSTRIES
SIMPLO TECHNOLOGYHSBC GIF INDIAN EQUITY ac
CATCHER TECHNOLOGY
Fund manager Ivan GohFund manager since 01.02.2012Location SingaporeFund domicile LuxembourgFund currency USDClose of financial year 31. MayTotal net assets (in mil.) 30.97Inception date 29.01.2010Management fee in % p.a. 1.92Total expense ratio (ex ante) in % 2.01Benchmark (BM) MSCI AC Asia ex Japan (NR)Unit Class Category B
(capital growth)
ISIN LU0456267094
Valor no. 10627684
Redemptions DailyEU taxation In scope - tax
March 30, 2012Switzerland
Credit Suisse SICAV One (Lux) Equity Asian DragonClass B
Net performance in USD (rebased to 100) and yearly performance 1)
2010 2011 201270
80
90
100
110
120
130
140
-30%
-20%
-10%
0%
10%
20%
30%
40%
-25.5
8.6
-17.3
13.7
CS SICAV One (Lux) Equity Asian Dragon B Yearly or year-to-date performance respectively (Fund)MSCI AC Asia ex Japan (NR) Yearly or year-to-date performance respectively (Benchmark)
Net performance in USD 1)
1 month 3 months YTD 1 year 3 years 5 yearsFund -3.70 8.57 8.57 -18.39 - -Benchmark -3.14 13.71 13.71 -7.05 - -
Sectors in %Fund Benchmark Compared with benchmark
Information Technology 24.93 18.86Financials 17.97 29.64Consumer Discretionary 12.57 9.80Industrials 11.58 10.05Energy 8.31 7.59Materials 8.19 7.65Telecommunication Services 2.98 6.48Consumer Staples 2.51 5.39Cash/Cash Equivalents 1.72 -Others 9.24 3.69
Currencies in %
HKD 38.24KRW 23.10TWD 15.90USD 10.26SGD 5.36THB 4.18IDR 2.95CHF 0.01
Countries in %
China 27.09South Korea 21.68Taiwan 14.63Hong Kong 12.72India 8.77Singapore 4.83Thailand 4.17Indonesia 2.95Malaysia 1.45Others 1.72
Significant Transactions Top 10 Holdings in %Samsung Electronics 5.17HSBC GIF Indian Eq. 3.19Taiwan Semicon 3.04China Const. Bank 2.98Hon Hai Precision 2.82ICBC 2.82AIA Group Limited 2.37Cnooc LTD 2.24NCsoft Corp 2.15China Shenhua Energy 2.10Total 28.88
Investment policyThe aim of the fund is to achieve the highestpossible risk adjusted return in USD whileinvesting in companies domiciled in Asia exJapan or in companies who carry out the bulk oftheir business activities in this region.
Fund facts
Unit class currency USD
Bloomberg ticker CSEQADB LX
Net asset value (NAV) 9.63
Fund statistics1 year 3 years
Annualized volatility in % 25.96 -Tracking Error (Ex post) 6.76 -Beta 0.96 -
Source: Lipper, a Reuters Company
Cre
dit S
uiss
e S
ICA
V O
ne
1) Historical performance indications and financial market scenarios are no guarantee for current or future performance. Performance indications do not consider commissions levied at subscription and/orredemption.
The disclaimer mentioned at the end of this document also applies to this page.
237

March 30, 2012Switzerland
Credit Suisse SICAV One (Lux) Equity Asian DragonClass B
Review previous quarter 2)
The MSCI Asia ex-Japan Index surged to astrong 17.2% return year-to-February but pulledback slightly in March to return 13.4% for Q12012. While a rebound was expected, the speedand strength of the up-move was unexpected.Up till mid-February, the most evident factor thathad lifted markets was the USD10-12bn worthof inflows into regional markets, encouraged byan improvement in the European sovereign debtmarkets. This was in turn triggered by thesuccess of the ECB’s LTRO program inNovember 2011 and the strong likelihood thatmarket cash levels were higher than usual atend-2011. Subsequently, positivemacroeconomic data from the US, such as labor
and housing data, as well as from Asia, suchas two months of solid China PMI, catalyzed themarket higher.
The market consolidation that began in Marchwas not unexpected and was triggered by themuted commentary by the Chinese governmentat the end of the National People’s Congressand the potential return of inflationary pressurecaused by higher energy prices. In a sign thatexpectations may well have run ahead of realityin the short-term, the market reacted negativelyto the poor Q4 2011 earnings reports by HongKong listed companies in March, in sharpcontrast to the quickness by which it brushed
aside similar negative reports by Korean andTaiwanese companies in January/February.
On the political front, while the result of theTaiwanese elections in January was withinexpectation, the push by the newly electedgovernment to enact a capital gains tax createdmarket volatility. Additionally, the Bo Xilai(Communist Party Chief of Chongqing Province)scandal in China stoked fears of civil unrests,though the impact fell mostly on the A-sharemarket with only minor spillover effect onH-shares.
Outlook for the market 2)
The continuation of mixed macroeconomic datais likely to remain in the short-term in our view.Already, the Chinese government hasannounced weaker than expected Q1 2012GDP growth of 8.1% in early April, against aconsensus expectation of 8.4%. While industrialproduction appeared to have accelerated inMarch, fixed asset investment seemed to remainon the downtrend. Meanwhile, India’s growthoutlook continues to be a cause for concern, asare its twin deficits (fiscal and current account).
We believe these mixed signals are likely to be
temporary. A reacceleration of economic growthin H2 2012 remains on the cards. Since latelast year, central banks across the region havebeen in easing mode and it is quite likely that thesimulative effects from these policies will becomeincreasingly perceptible over the next couple ofmonths. We highlight the RRR cuts in China,the interest rate cuts in Indonesia, as well aspotential cuts in India. Industrial activity has alsoremained fairly stable across the region over thequarter.
Seasonality is likely to slowly add to economic
momentum as we progress into spring, from apick-up in construction activity (higher materialdemand), maintenance shut-downs (betterdemand-supply balance), to even theapproaching London Olympics (pick up inadvertising). Longer term, economicfundamentals continue to look constructive.Central banks remain dovish and political risk islow. Considering the rapid and sharp surge inreturns year to date, this pause is healthy in ourview and will allow economic fundamentals tocatch up with the market.
Portfolio ManagementIvan Goh is Vice President and Senior Portfolio Manager. He has over 15 years of experience in the investment industry. Prior to joining CS, he was PortfolioManager for the Japanese market at Legg Mason. Earlier, Ivan was part of a top ranked global technology team and was based in Japan covering thepan-Asian technology sector. At Credit Suisse, Ivan covers the Asian Equity markets with a focus on South Korea and assists in the coverage of other NorthAsian markets. He holds a Bachelor of Business Administration (Hons) and is a Chartered Financial Analyst (CFA Institute).
2) If not expressly indicated otherwise, all quantitative data contained in this comment is based on Lipper, Bloomberg or Datastream.
238
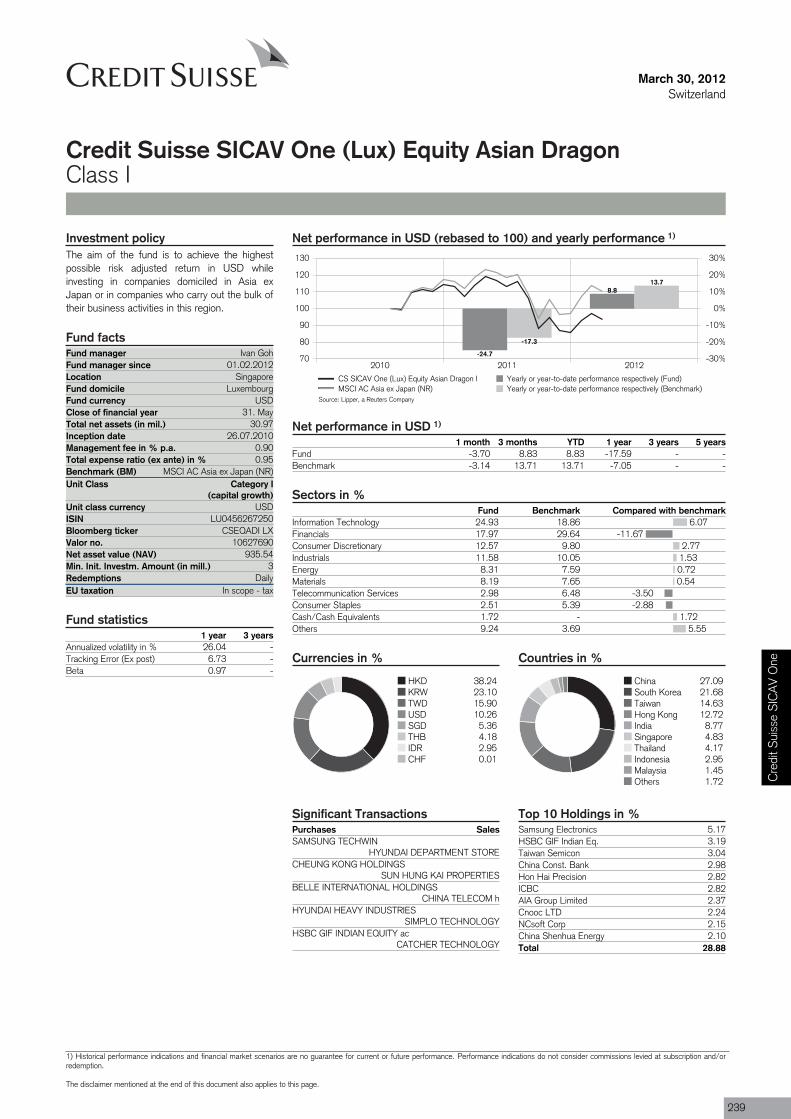
6.07-11.67
2.771.530.720.54
-3.50-2.88
1.725.55
Purchases SalesSAMSUNG TECHWIN
HYUNDAI DEPARTMENT STORECHEUNG KONG HOLDINGS
SUN HUNG KAI PROPERTIESBELLE INTERNATIONAL HOLDINGS
CHINA TELECOM hHYUNDAI HEAVY INDUSTRIES
SIMPLO TECHNOLOGYHSBC GIF INDIAN EQUITY ac
CATCHER TECHNOLOGY
Fund manager Ivan GohFund manager since 01.02.2012Location SingaporeFund domicile LuxembourgFund currency USDClose of financial year 31. MayTotal net assets (in mil.) 30.97Inception date 26.07.2010Management fee in % p.a. 0.90Total expense ratio (ex ante) in % 0.95Benchmark (BM) MSCI AC Asia ex Japan (NR)Unit Class Category I
(capital growth)
ISIN LU0456267250
Valor no. 10627690
Min. Init. Investm. Amount (in mill.) 3Redemptions DailyEU taxation In scope - tax
March 30, 2012Switzerland
Credit Suisse SICAV One (Lux) Equity Asian DragonClass I
Net performance in USD (rebased to 100) and yearly performance 1)
2010 2011 201270
80
90
100
110
120
130
-30%
-20%
-10%
0%
10%
20%
30%
-24.7
8.8
-17.3
13.7
CS SICAV One (Lux) Equity Asian Dragon I Yearly or year-to-date performance respectively (Fund)MSCI AC Asia ex Japan (NR) Yearly or year-to-date performance respectively (Benchmark)
Net performance in USD 1)
1 month 3 months YTD 1 year 3 years 5 yearsFund -3.70 8.83 8.83 -17.59 - -Benchmark -3.14 13.71 13.71 -7.05 - -
Sectors in %Fund Benchmark Compared with benchmark
Information Technology 24.93 18.86Financials 17.97 29.64Consumer Discretionary 12.57 9.80Industrials 11.58 10.05Energy 8.31 7.59Materials 8.19 7.65Telecommunication Services 2.98 6.48Consumer Staples 2.51 5.39Cash/Cash Equivalents 1.72 -Others 9.24 3.69
Currencies in %
HKD 38.24KRW 23.10TWD 15.90USD 10.26SGD 5.36THB 4.18IDR 2.95CHF 0.01
Countries in %
China 27.09South Korea 21.68Taiwan 14.63Hong Kong 12.72India 8.77Singapore 4.83Thailand 4.17Indonesia 2.95Malaysia 1.45Others 1.72
Significant Transactions Top 10 Holdings in %Samsung Electronics 5.17HSBC GIF Indian Eq. 3.19Taiwan Semicon 3.04China Const. Bank 2.98Hon Hai Precision 2.82ICBC 2.82AIA Group Limited 2.37Cnooc LTD 2.24NCsoft Corp 2.15China Shenhua Energy 2.10Total 28.88
Investment policyThe aim of the fund is to achieve the highestpossible risk adjusted return in USD whileinvesting in companies domiciled in Asia exJapan or in companies who carry out the bulk oftheir business activities in this region.
Fund facts
Unit class currency USD
Bloomberg ticker CSEQADI LX
Net asset value (NAV) 935.54
Fund statistics1 year 3 years
Annualized volatility in % 26.04 -Tracking Error (Ex post) 6.73 -Beta 0.97 -
Source: Lipper, a Reuters Company
Cre
dit S
uiss
e S
ICA
V O
ne
1) Historical performance indications and financial market scenarios are no guarantee for current or future performance. Performance indications do not consider commissions levied at subscription and/orredemption.
The disclaimer mentioned at the end of this document also applies to this page.
239
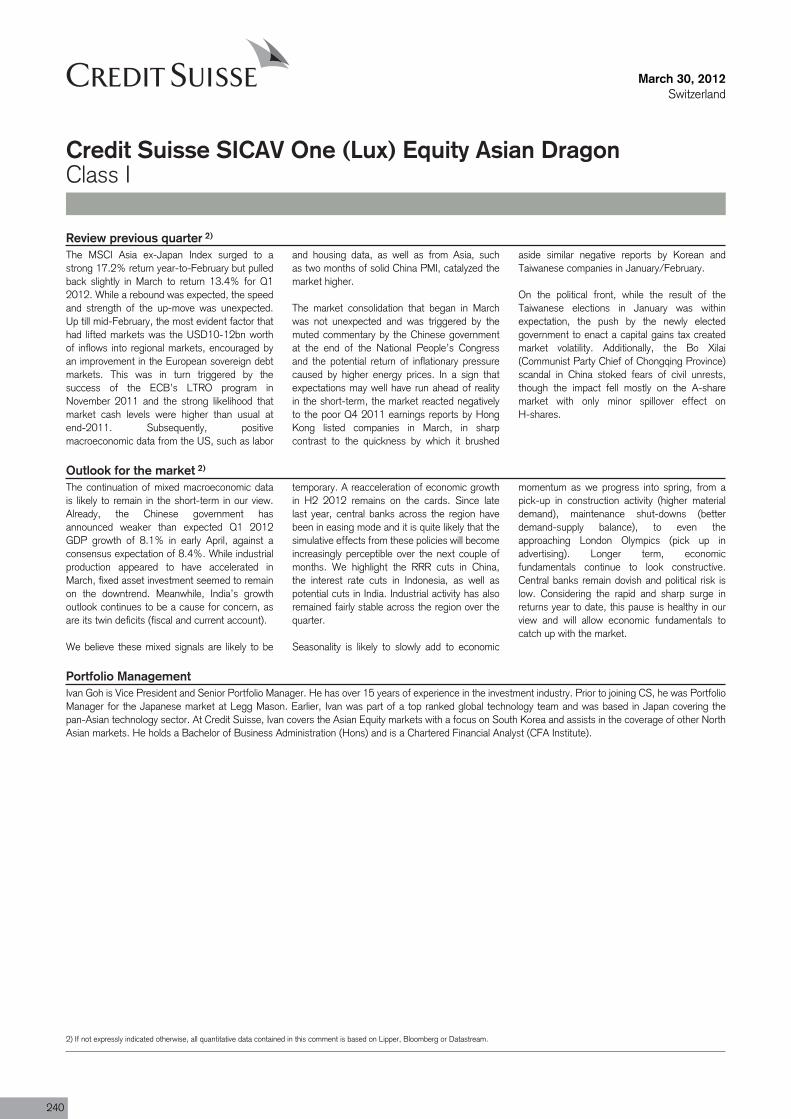
March 30, 2012Switzerland
Credit Suisse SICAV One (Lux) Equity Asian DragonClass I
Review previous quarter 2)
The MSCI Asia ex-Japan Index surged to astrong 17.2% return year-to-February but pulledback slightly in March to return 13.4% for Q12012. While a rebound was expected, the speedand strength of the up-move was unexpected.Up till mid-February, the most evident factor thathad lifted markets was the USD10-12bn worthof inflows into regional markets, encouraged byan improvement in the European sovereign debtmarkets. This was in turn triggered by thesuccess of the ECB’s LTRO program inNovember 2011 and the strong likelihood thatmarket cash levels were higher than usual atend-2011. Subsequently, positivemacroeconomic data from the US, such as labor
and housing data, as well as from Asia, suchas two months of solid China PMI, catalyzed themarket higher.
The market consolidation that began in Marchwas not unexpected and was triggered by themuted commentary by the Chinese governmentat the end of the National People’s Congressand the potential return of inflationary pressurecaused by higher energy prices. In a sign thatexpectations may well have run ahead of realityin the short-term, the market reacted negativelyto the poor Q4 2011 earnings reports by HongKong listed companies in March, in sharpcontrast to the quickness by which it brushed
aside similar negative reports by Korean andTaiwanese companies in January/February.
On the political front, while the result of theTaiwanese elections in January was withinexpectation, the push by the newly electedgovernment to enact a capital gains tax createdmarket volatility. Additionally, the Bo Xilai(Communist Party Chief of Chongqing Province)scandal in China stoked fears of civil unrests,though the impact fell mostly on the A-sharemarket with only minor spillover effect onH-shares.
Outlook for the market 2)
The continuation of mixed macroeconomic datais likely to remain in the short-term in our view.Already, the Chinese government hasannounced weaker than expected Q1 2012GDP growth of 8.1% in early April, against aconsensus expectation of 8.4%. While industrialproduction appeared to have accelerated inMarch, fixed asset investment seemed to remainon the downtrend. Meanwhile, India’s growthoutlook continues to be a cause for concern, asare its twin deficits (fiscal and current account).
We believe these mixed signals are likely to be
temporary. A reacceleration of economic growthin H2 2012 remains on the cards. Since latelast year, central banks across the region havebeen in easing mode and it is quite likely that thesimulative effects from these policies will becomeincreasingly perceptible over the next couple ofmonths. We highlight the RRR cuts in China,the interest rate cuts in Indonesia, as well aspotential cuts in India. Industrial activity has alsoremained fairly stable across the region over thequarter.
Seasonality is likely to slowly add to economic
momentum as we progress into spring, from apick-up in construction activity (higher materialdemand), maintenance shut-downs (betterdemand-supply balance), to even theapproaching London Olympics (pick up inadvertising). Longer term, economicfundamentals continue to look constructive.Central banks remain dovish and political risk islow. Considering the rapid and sharp surge inreturns year to date, this pause is healthy in ourview and will allow economic fundamentals tocatch up with the market.
Portfolio ManagementIvan Goh is Vice President and Senior Portfolio Manager. He has over 15 years of experience in the investment industry. Prior to joining CS, he was PortfolioManager for the Japanese market at Legg Mason. Earlier, Ivan was part of a top ranked global technology team and was based in Japan covering thepan-Asian technology sector. At Credit Suisse, Ivan covers the Asian Equity markets with a focus on South Korea and assists in the coverage of other NorthAsian markets. He holds a Bachelor of Business Administration (Hons) and is a Chartered Financial Analyst (CFA Institute).
2) If not expressly indicated otherwise, all quantitative data contained in this comment is based on Lipper, Bloomberg or Datastream.
240
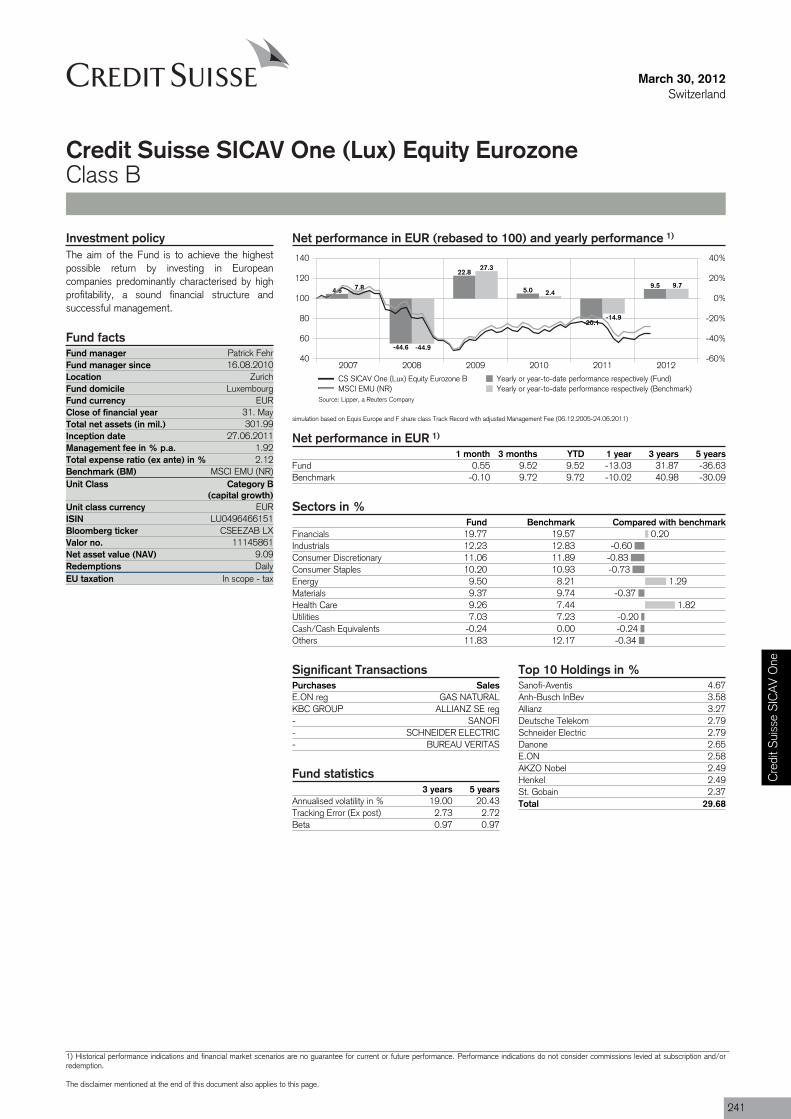
0.20-0.60
-0.83-0.73
1.29-0.37
1.82-0.20-0.24-0.34
Purchases SalesE.ON reg GAS NATURALKBC GROUP ALLIANZ SE reg- SANOFI- SCHNEIDER ELECTRIC- BUREAU VERITAS
Fund manager Patrick FehrFund manager since 16.08.2010Location ZurichFund domicile LuxembourgFund currency EURClose of financial year 31. MayTotal net assets (in mil.) 301.99Inception date 27.06.2011Management fee in % p.a. 1.92Total expense ratio (ex ante) in % 2.12Benchmark (BM) MSCI EMU (NR)Unit Class Category B
(capital growth)
ISIN LU0496466151
Valor no. 11145861
Redemptions DailyEU taxation In scope - tax
March 30, 2012Switzerland
Credit Suisse SICAV One (Lux) Equity EurozoneClass B
Net performance in EUR (rebased to 100) and yearly performance 1)
2007 2008 2009 2010 2011 201240
60
80
100
120
140
-60%
-40%
-20%
0%
20%
40%
4.6
-44.6
22.8
5.0
-20.1
9.57.8
-44.9
27.3
2.4
-14.9
9.7
CS SICAV One (Lux) Equity Eurozone B Yearly or year-to-date performance respectively (Fund)MSCI EMU (NR) Yearly or year-to-date performance respectively (Benchmark)
simulation based on Equis Europe and F share class Track Record with adjusted Management Fee (06.12.2005-24.06.2011)
Net performance in EUR 1)
1 month 3 months YTD 1 year 3 years 5 yearsFund 0.55 9.52 9.52 -13.03 31.87 -36.63Benchmark -0.10 9.72 9.72 -10.02 40.98 -30.09
Sectors in %Fund Benchmark Compared with benchmark
Financials 19.77 19.57Industrials 12.23 12.83Consumer Discretionary 11.06 11.89Consumer Staples 10.20 10.93Energy 9.50 8.21Materials 9.37 9.74Health Care 9.26 7.44Utilities 7.03 7.23Cash/Cash Equivalents -0.24 0.00Others 11.83 12.17
Top 10 Holdings in %Sanofi-Aventis 4.67Anh-Busch InBev 3.58Allianz 3.27Deutsche Telekom 2.79Schneider Electric 2.79Danone 2.65E.ON 2.58AKZO Nobel 2.49Henkel 2.49St. Gobain 2.37Total 29.68
Significant Transactions
Fund statistics3 years 5 years
Annualised volatility in % 19.00 20.43Tracking Error (Ex post) 2.73 2.72Beta 0.97 0.97
Investment policyThe aim of the Fund is to achieve the highestpossible return by investing in Europeancompanies predominantly characterised by highprofitability, a sound financial structure andsuccessful management.
Fund facts
Unit class currency EUR
Bloomberg ticker CSEEZAB LX
Net asset value (NAV) 9.09
Source: Lipper, a Reuters Company
Cre
dit S
uiss
e S
ICA
V O
ne
1) Historical performance indications and financial market scenarios are no guarantee for current or future performance. Performance indications do not consider commissions levied at subscription and/orredemption.
The disclaimer mentioned at the end of this document also applies to this page.
241

March 30, 2012Switzerland
Credit Suisse SICAV One (Lux) Equity EurozoneClass B
Review previous quarter 2)
European stocks rose 9.7% in Q1 2012. TheCS Sicav One Lux Equity Eurozone rose 9.8%over the same period, slightly outpacing theregional benchmark. In Q1, the marketscontinued to recover from the lows of theprevious year. While the economic backdrop didnot materially improve over the period, the mainpositive factor was the announcement of thesecond long-term refinancing operation (LTRO)by the ECB. The European monetary authoritypumped an additional EUR 530bn into thebanking system granting banks 3-year cheaper
funding and easing liquidity needs. Thistranslated into a declining risk aversion andboosted confidence in equity markets. Discountrates for risky assets dropped as a result of theECB intervention.
Financial institutions have been recycling capitalby buying sovereign debt with cheaper funding.For example, the sovereign credit spreads of Italyand Spain relative to those of Germany almosthalved in a matter of three months. However,towards the end of the quarter, risk concerns
re-emerged and sovereign credit spreads beganto edge up.
During the quarter, the best performing sectorswere Information Technology and ConsumerDiscretionary. The worst performing sectorswere Telecom Services and Energy. Stockselection in the Industrials, Telecom Services andConsumer Staples sectors contributed positivelyto the overall outperformance over the quarter.
Outlook for the market 2)
With the exception of the US, economicindicators around the world have deterioratedover the past months. However, this has beenlargely discounted in share prices and improvingliquidity through ECB intervention has boostedrecent equity performance. Looking ahead, afew signs of reverting risks are emerging. Fiscaltightening in Southern Europe will trim expectedEuropean economic growth in 2012. France willface elections in Q2 and political uncertaintycould be a cause of market volatility in theshort-term. Fiscal weakness and highindebtedness in Southern Europe continue to bea cause of concern for the markets. The ongoing
discussions regarding the need to raise thefirewall to protect European indebted countriesfrom adverse effects of higher debt costs couldtrigger some market jitters. According toconsensus expectations, the Eurozone GDPshould contract 0.4% in 2012 and rebound to1.05% in 2013.
In terms of corporate earnings, deceleratingeconomic activity in Europe and China couldbecome a hurdle to meet earnings expectationsin Q2. However, equity valuations remain withinreasonable ranges. As in the previous months,changes in risk aversion rather than
fundamentals could be the main driver of equityprices in the short-term. Our portfolio is investedin quality stocks and companies with moderatecyclical exposure. These characteristics are likelyto be an asset during a period of below-averagegrowth until a new economic cycle emerges. Wehave currently overweight positions in Healthcareand Energy, two highly cash-generative sectors,and underweight positions in Financials andConsumer Staples. The former faces risksrelated to market volatility, the latter offers lessupside than other defensive sectors on valuationgrounds.
Portfolio ManagementPatrick Fehr is Head of European Equities in MACS. He joined Credit Suisse in February 2001 from Bank Vontobel where he was a seniorportfolio manager for European Equities. Prior to that, Mr Fehr worked already at Credit Suisse in the Private Banking unit. Mr Fehr hasmore than 11 years of investment experience and is a Certified European Financial Analyst.
2) If not expressly indicated otherwise, all quantitative data contained in this comment is based on Lipper, Bloomberg or Datastream.
242

0.20-0.60
-0.83-0.73
1.29-0.37
1.82-0.20-0.24-0.34
Purchases SalesE.ON reg GAS NATURALKBC GROUP ALLIANZ SE reg- SANOFI- SCHNEIDER ELECTRIC- BUREAU VERITAS
Fund manager Patrick FehrFund manager since 16.08.2010Location ZurichFund domicile LuxembourgFund currency EURClose of financial year 31. MayTotal net assets (in mil.) 301.99Inception date 27.06.2011Management fee in % p.a. 0.70Total expense ratio (ex ante) in % 0.96Benchmark (BM) MSCI EMU (NR)Unit Class Category I
(capital growth)
ISIN LU0496466318
Valor no. 11145872
Redemptions DailyEU taxation In scope - tax
March 30, 2012Switzerland
Credit Suisse SICAV One (Lux) Equity EurozoneClass I
Net performance in EUR (rebased to 100) and yearly performance 1)
2007 2008 2009 2010 2011 201240
60
80
100
120
140
-60%
-40%
-20%
0%
20%
40%
6.0
-43.8
24.4
6.4
-19.0
9.87.8
-44.9
27.3
2.4
-14.9
9.7
CS SICAV One (Lux) Equity Eurozone I Yearly or year-to-date performance respectively (Fund)MSCI EMU (NR) Yearly or year-to-date performance respectively (Benchmark)
simulation based on Equis Europe and F share class Track Record with adjusted Management Fee (06.12.2005-24.06.2011)
Net performance in EUR 1)
1 month 3 months YTD 1 year 3 years 5 yearsFund 0.67 9.78 9.78 -11.96 37.03 -32.45Benchmark -0.10 9.72 9.72 -10.02 40.98 -30.09
Sectors in %Fund Benchmark Compared with benchmark
Financials 19.77 19.57Industrials 12.23 12.83Consumer Discretionary 11.06 11.89Consumer Staples 10.20 10.93Energy 9.50 8.21Materials 9.37 9.74Health Care 9.26 7.44Utilities 7.03 7.23Cash/Cash Equivalents -0.24 0.00Others 11.83 12.17
Top 10 Holdings in %Sanofi-Aventis 4.67Anh-Busch InBev 3.58Allianz 3.27Deutsche Telekom 2.79Schneider Electric 2.79Danone 2.65E.ON 2.58AKZO Nobel 2.49Henkel 2.49St. Gobain 2.37Total 29.68
Significant Transactions
Fund statistics3 years 5 years
Annualised volatility in % 19.03 20.46Tracking Error (Ex post) 2.73 2.72Beta 0.97 0.97
Investment policyThe aim of the Fund is to achieve the highestpossible return by investing in Europeancompanies predominantly characterised by highprofitability, a sound financial structure andsuccessful management.
Fund facts
Unit class currency EUR
Bloomberg ticker CSEEZAI LX
Net asset value (NAV) 917.24
Source: Lipper, a Reuters Company
Cre
dit S
uiss
e S
ICA
V O
ne
1) Historical performance indications and financial market scenarios are no guarantee for current or future performance. Performance indications do not consider commissions levied at subscription and/orredemption.
The disclaimer mentioned at the end of this document also applies to this page.
243
March 30, 2012Switzerland
Credit Suisse SICAV One (Lux) Equity EurozoneClass I
Review previous quarter 2)
European stocks rose 9.7% in Q1 2012. TheCS Sicav One Lux Equity Eurozone rose 9.8%over the same period, slightly outpacing theregional benchmark. In Q1, the marketscontinued to recover from the lows of theprevious year. While the economic backdrop didnot materially improve over the period, the mainpositive factor was the announcement of thesecond long-term refinancing operation (LTRO)by the ECB. The European monetary authoritypumped an additional EUR 530bn into thebanking system granting banks 3-year cheaper
funding and easing liquidity needs. Thistranslated into a declining risk aversion andboosted confidence in equity markets. Discountrates for risky assets dropped as a result of theECB intervention.
Financial institutions have been recycling capitalby buying sovereign debt with cheaper funding.For example, the sovereign credit spreads of Italyand Spain relative to those of Germany almosthalved in a matter of three months. However,towards the end of the quarter, risk concerns
re-emerged and sovereign credit spreads beganto edge up.
During the quarter, the best performing sectorswere Information Technology and ConsumerDiscretionary. The worst performing sectorswere Telecom Services and Energy. Stockselection in the Industrials, Telecom Services andConsumer Staples sectors contributed positivelyto the overall outperformance over the quarter.
Outlook for the market 2)
With the exception of the US, economicindicators around the world have deterioratedover the past months. However, this has beenlargely discounted in share prices and improvingliquidity through ECB intervention has boostedrecent equity performance. Looking ahead, afew signs of reverting risks are emerging. Fiscaltightening in Southern Europe will trim expectedEuropean economic growth in 2012. France willface elections in Q2 and political uncertaintycould be a cause of market volatility in theshort-term. Fiscal weakness and highindebtedness in Southern Europe continue to bea cause of concern for the markets. The ongoing
discussions regarding the need to raise thefirewall to protect European indebted countriesfrom adverse effects of higher debt costs couldtrigger some market jitters. According toconsensus expectations, the Eurozone GDPshould contract 0.4% in 2012 and rebound to1.05% in 2013.
In terms of corporate earnings, deceleratingeconomic activity in Europe and China couldbecome a hurdle to meet earnings expectationsin Q2. However, equity valuations remain withinreasonable ranges. As in the previous months,changes in risk aversion rather than
fundamentals could be the main driver of equityprices in the short-term. Our portfolio is investedin quality stocks and companies with moderatecyclical exposure. These characteristics are likelyto be an asset during a period of below-averagegrowth until a new economic cycle emerges. Wehave currently overweight positions in Healthcareand Energy, two highly cash-generative sectors,and underweight positions in Financials andConsumer Staples. The former faces risksrelated to market volatility, the latter offers lessupside than other defensive sectors on valuationgrounds.
Portfolio ManagementPatrick Fehr is Head of European Equities in MACS. He joined Credit Suisse in February 2001 from Bank Vontobel where he was a seniorportfolio manager for European Equities. Prior to that, Mr Fehr worked already at Credit Suisse in the Private Banking unit. Mr Fehr hasmore than 11 years of investment experience and is a Certified European Financial Analyst.
2) If not expressly indicated otherwise, all quantitative data contained in this comment is based on Lipper, Bloomberg or Datastream.
244
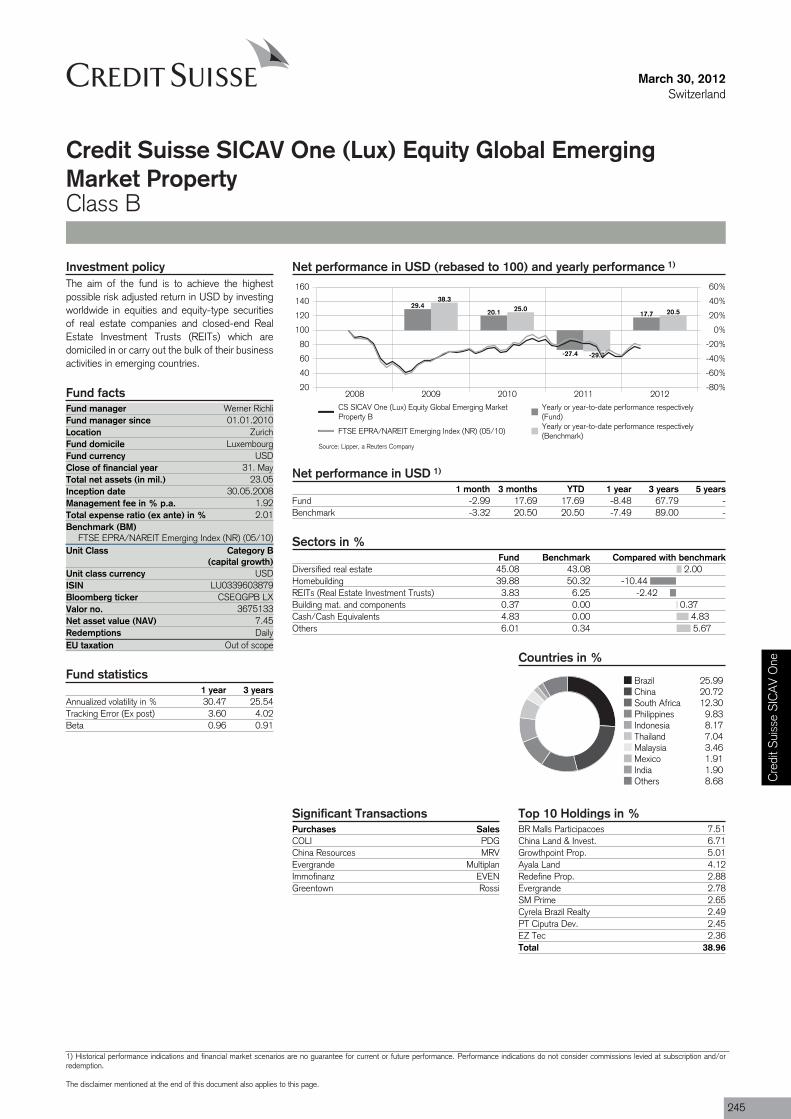
2.00-10.44
-2.420.37
4.835.67
Purchases SalesCOLI PDGChina Resources MRVEvergrande MultiplanImmofinanz EVENGreentown Rossi
Fund manager Werner RichliFund manager since 01.01.2010Location ZurichFund domicile LuxembourgFund currency USDClose of financial year 31. MayTotal net assets (in mil.) 23.05Inception date 30.05.2008Management fee in % p.a. 1.92Total expense ratio (ex ante) in % 2.01Benchmark (BM)
FTSE EPRA/NAREIT Emerging Index (NR) (05/10)Unit Class Category B
(capital growth)
ISIN LU0339603879
Valor no. 3675133
Redemptions DailyEU taxation Out of scope
March 30, 2012Switzerland
Credit Suisse SICAV One (Lux) Equity Global EmergingMarket PropertyClass B
Net performance in USD (rebased to 100) and yearly performance 1)
2008 2009 2010 2011 201220
40
60
80
100
120
140
160
-80%
-60%
-40%
-20%
0%
20%
40%
60%
29.420.1
-27.4
17.7
38.325.0
-29.3
20.5
CS SICAV One (Lux) Equity Global Emerging MarketProperty B
Yearly or year-to-date performance respectively(Fund)
FTSE EPRA/NAREIT Emerging Index (NR) (05/10)Yearly or year-to-date performance respectively(Benchmark)
Net performance in USD 1)
1 month 3 months YTD 1 year 3 years 5 yearsFund -2.99 17.69 17.69 -8.48 67.79 -Benchmark -3.32 20.50 20.50 -7.49 89.00 -
Sectors in %Fund Benchmark Compared with benchmark
Diversified real estate 45.08 43.08Homebuilding 39.88 50.32REITs (Real Estate Investment Trusts) 3.83 6.25Building mat. and components 0.37 0.00Cash/Cash Equivalents 4.83 0.00Others 6.01 0.34
Countries in %
Brazil 25.99China 20.72South Africa 12.30Philippines 9.83Indonesia 8.17Thailand 7.04Malaysia 3.46Mexico 1.91India 1.90Others 8.68
Significant Transactions Top 10 Holdings in %BR Malls Participacoes 7.51China Land & Invest. 6.71Growthpoint Prop. 5.01Ayala Land 4.12Redefine Prop. 2.88Evergrande 2.78SM Prime 2.65Cyrela Brazil Realty 2.49PT Ciputra Dev. 2.45EZ Tec 2.36Total 38.96
Investment policyThe aim of the fund is to achieve the highestpossible risk adjusted return in USD by investingworldwide in equities and equity-type securitiesof real estate companies and closed-end RealEstate Investment Trusts (REITs) which aredomiciled in or carry out the bulk of their businessactivities in emerging countries.
Fund facts
Unit class currency USD
Bloomberg ticker CSEQGPB LX
Net asset value (NAV) 7.45
Fund statistics1 year 3 years
Annualized volatility in % 30.47 25.54Tracking Error (Ex post) 3.60 4.02Beta 0.96 0.91
Source: Lipper, a Reuters Company
Cre
dit S
uiss
e S
ICA
V O
ne
1) Historical performance indications and financial market scenarios are no guarantee for current or future performance. Performance indications do not consider commissions levied at subscription and/orredemption.
The disclaimer mentioned at the end of this document also applies to this page.
245

March 30, 2012Switzerland
Credit Suisse SICAV One (Lux) Equity Global EmergingMarket PropertyClass B
Review previous quarter 2)
During Q1 2012, emerging market real estatestocks rallied. The EPRA Emerging Index (allfigures in US terms) ended the period with a gainof +18.7% (Q4 2011 +0.08%), outperformingthe MSCI Emerging Index, which was up 13.9%.In tandem with better PMI data and thecommitment of the European leaders to fightthe euro crisis, investors worldwide started totake more risks and picked up emerging marketstocks again. Furthermore, shrinking CPI figuresenabled central banks to ease their monetarypolicies.
Best performing countries were Turkey (+36%),the Philippines (+35%) and India (+30%); theweakest markets were Poland (+12%), SouthAfrica (+12%), and Malaysia (+9%). As ofMarch 19, the market capitalization of thebenchmark increased by more than 30%, asmainly the Hong Kong listed Chinese companieswhich invest in mainland China, have beentransferred from the Developed Index to theEmerging Index. China now has the secondlargest weight in the index with 24%, behindBrazil with 26% and ahead of South Africa with13%.
The fund underperformed the benchmark by-286bps (previous quarter +137bps) due to theunderweight of Brazilian homebuilders PDG andMRV, as well as of the Chinese heavyweightsCOLI and China Resources. Top contributors tothe fund’s performance were the overweightpositions in the Brazilian homebuilders EZ andHelbor, the Indonesian company Alam Sutera,as well as the underweight positions in SP Setia(Malaysia), DLF (India), Evergrande andSino-Ocean Land (both China).
Outlook for the market 2)
The long-term trends for emerging propertiesremain favorable. Demographic developmentssuch as increasing working age population, GDPgrowth of generally above 5%, increasingwealth, as well as lower private and public debtcompared to developed markets, are all favorablelong-term drivers for housing and commercialreal estate. In China, the macro data shouldbottom out in Q2. The BoC started to reduce
the reserve requirements for banks to achievea soft landing. In light of the commitment ofthe Chinese authorities to further cooling downthe housing market, the chance for rate cutsis somehow low, especially taking the surge inhousehold mortgages in Q1 into account.
Due to shrinking consumer inflation at thebeginning of the year and mainly the subdued
GDP growth in recent months, we expect furtherinterest rate cuts in Brazil. We forecast likewisefor Mexico, India, the Philippines and Thailand.The fund management has an overweightposition in Asia, at the expense of EMEA,whereby the biggest exposures are in Indonesia,the Philippines and Thailand.
Portfolio ManagementWerner Richli is Portfolio Manager and Senior Investment Professional for real estate securities. Mr. Richli was previously an equity analystat Credit Suisse’s Investment Banking Division (Credit Suisse First Boston) covering European real estate stocks. Prior to this role, heanalyzed building materials, construction and utility stocks and was involved in several Initial Public Offerings. Mr. Richli joined Credit Suissein 1987. Mr. Richli is earned the CIIA designation and received a Master’s Degree in Business Administration from the University of Zurich,Switzerland.
2) If not expressly indicated otherwise, all quantitative data contained in this comment is based on Lipper, Bloomberg or Datastream.
246
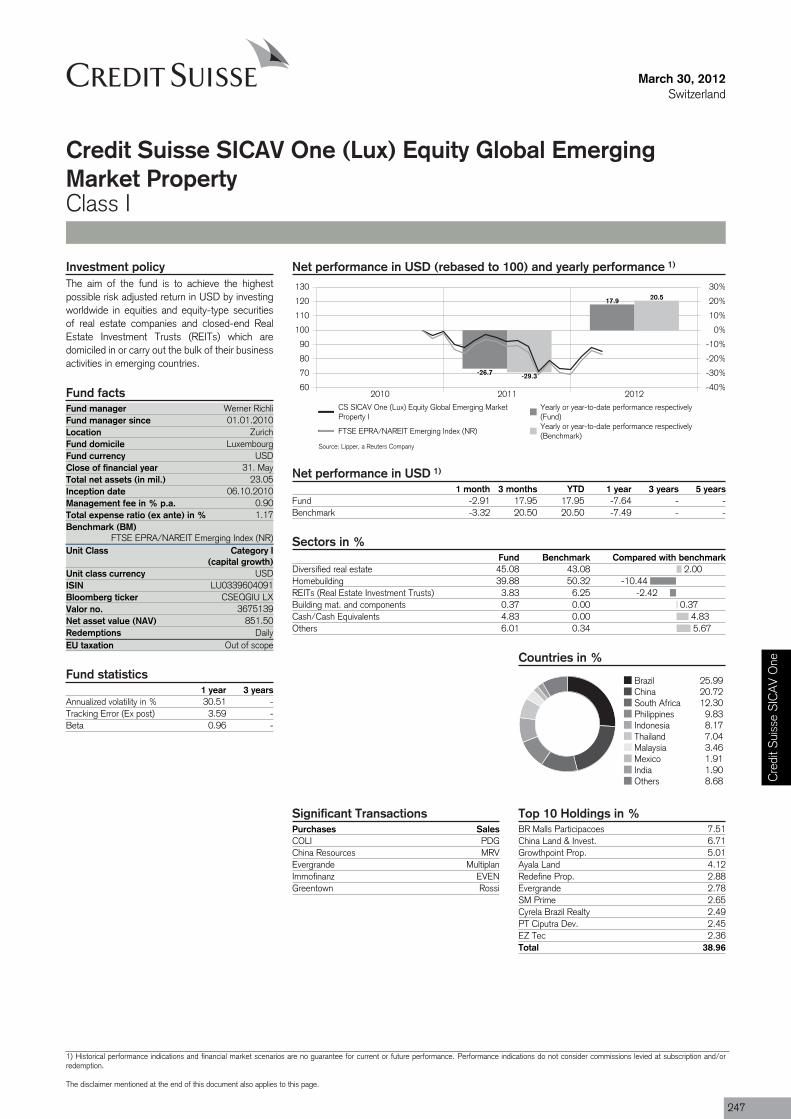
2.00-10.44
-2.420.37
4.835.67
Purchases SalesCOLI PDGChina Resources MRVEvergrande MultiplanImmofinanz EVENGreentown Rossi
Fund manager Werner RichliFund manager since 01.01.2010Location ZurichFund domicile LuxembourgFund currency USDClose of financial year 31. MayTotal net assets (in mil.) 23.05Inception date 06.10.2010Management fee in % p.a. 0.90Total expense ratio (ex ante) in % 1.17Benchmark (BM)
FTSE EPRA/NAREIT Emerging Index (NR)Unit Class Category I
(capital growth)
ISIN LU0339604091
Valor no. 3675139
Redemptions DailyEU taxation Out of scope
March 30, 2012Switzerland
Credit Suisse SICAV One (Lux) Equity Global EmergingMarket PropertyClass I
Net performance in USD (rebased to 100) and yearly performance 1)
2010 2011 201260
70
80
90
100
110
120
130
-40%
-30%
-20%
-10%
0%
10%
20%
30%
-26.7
17.9
-29.3
20.5
CS SICAV One (Lux) Equity Global Emerging MarketProperty I
Yearly or year-to-date performance respectively(Fund)
FTSE EPRA/NAREIT Emerging Index (NR)Yearly or year-to-date performance respectively(Benchmark)
Net performance in USD 1)
1 month 3 months YTD 1 year 3 years 5 yearsFund -2.91 17.95 17.95 -7.64 - -Benchmark -3.32 20.50 20.50 -7.49 - -
Sectors in %Fund Benchmark Compared with benchmark
Diversified real estate 45.08 43.08Homebuilding 39.88 50.32REITs (Real Estate Investment Trusts) 3.83 6.25Building mat. and components 0.37 0.00Cash/Cash Equivalents 4.83 0.00Others 6.01 0.34
Countries in %
Brazil 25.99China 20.72South Africa 12.30Philippines 9.83Indonesia 8.17Thailand 7.04Malaysia 3.46Mexico 1.91India 1.90Others 8.68
Significant Transactions Top 10 Holdings in %BR Malls Participacoes 7.51China Land & Invest. 6.71Growthpoint Prop. 5.01Ayala Land 4.12Redefine Prop. 2.88Evergrande 2.78SM Prime 2.65Cyrela Brazil Realty 2.49PT Ciputra Dev. 2.45EZ Tec 2.36Total 38.96
Investment policyThe aim of the fund is to achieve the highestpossible risk adjusted return in USD by investingworldwide in equities and equity-type securitiesof real estate companies and closed-end RealEstate Investment Trusts (REITs) which aredomiciled in or carry out the bulk of their businessactivities in emerging countries.
Fund facts
Unit class currency USD
Bloomberg ticker CSEQGIU LX
Net asset value (NAV) 851.50
Fund statistics1 year 3 years
Annualized volatility in % 30.51 -Tracking Error (Ex post) 3.59 -Beta 0.96 -
Source: Lipper, a Reuters Company
Cre
dit S
uiss
e S
ICA
V O
ne
1) Historical performance indications and financial market scenarios are no guarantee for current or future performance. Performance indications do not consider commissions levied at subscription and/orredemption.
The disclaimer mentioned at the end of this document also applies to this page.
247
March 30, 2012Switzerland
Credit Suisse SICAV One (Lux) Equity Global EmergingMarket PropertyClass I
Review previous quarter 2)
During Q1 2012, emerging market real estatestocks rallied. The EPRA Emerging Index (allfigures in US terms) ended the period with a gainof +18.7% (Q4 2011 +0.08%), outperformingthe MSCI Emerging Index, which was up 13.9%.In tandem with better PMI data and thecommitment of the European leaders to fightthe euro crisis, investors worldwide started totake more risks and picked up emerging marketstocks again. Furthermore, shrinking CPI figuresenabled central banks to ease their monetarypolicies.
Best performing countries were Turkey (+36%),the Philippines (+35%) and India (+30%); theweakest markets were Poland (+12%), SouthAfrica (+12%), and Malaysia (+9%). As ofMarch 19, the market capitalization of thebenchmark increased by more than 30%, asmainly the Hong Kong listed Chinese companieswhich invest in mainland China, have beentransferred from the Developed Index to theEmerging Index. China now has the secondlargest weight in the index with 24%, behindBrazil with 26% and ahead of South Africa with13%.
The fund underperformed the benchmark by-286bps (previous quarter +137bps) due to theunderweight of Brazilian homebuilders PDG andMRV, as well as of the Chinese heavyweightsCOLI and China Resources. Top contributors tothe fund’s performance were the overweightpositions in the Brazilian homebuilders EZ andHelbor, the Indonesian company Alam Sutera,as well as the underweight positions in SP Setia(Malaysia), DLF (India), Evergrande andSino-Ocean Land (both China).
Outlook for the market 2)
The long-term trends for emerging propertiesremain favorable. Demographic developmentssuch as increasing working age population, GDPgrowth of generally above 5%, increasingwealth, as well as lower private and public debtcompared to developed markets, are all favorablelong-term drivers for housing and commercialreal estate. In China, the macro data shouldbottom out in Q2. The BoC started to reduce
the reserve requirements for banks to achievea soft landing. In light of the commitment ofthe Chinese authorities to further cooling downthe housing market, the chance for rate cutsis somehow low, especially taking the surge inhousehold mortgages in Q1 into account.
Due to shrinking consumer inflation at thebeginning of the year and mainly the subdued
GDP growth in recent months, we expect furtherinterest rate cuts in Brazil. We forecast likewisefor Mexico, India, the Philippines and Thailand.The fund management has an overweightposition in Asia, at the expense of EMEA,whereby the biggest exposures are in Indonesia,the Philippines and Thailand.
Portfolio ManagementWerner Richli is Portfolio Manager and Senior Investment Professional for real estate securities. Mr. Richli was previously an equity analystat Credit Suisse’s Investment Banking Division (Credit Suisse First Boston) covering European real estate stocks. Prior to this role, heanalyzed building materials, construction and utility stocks and was involved in several Initial Public Offerings. Mr. Richli joined Credit Suissein 1987. Mr. Richli is earned the CIIA designation and received a Master’s Degree in Business Administration from the University of Zurich,Switzerland.
2) If not expressly indicated otherwise, all quantitative data contained in this comment is based on Lipper, Bloomberg or Datastream.
248
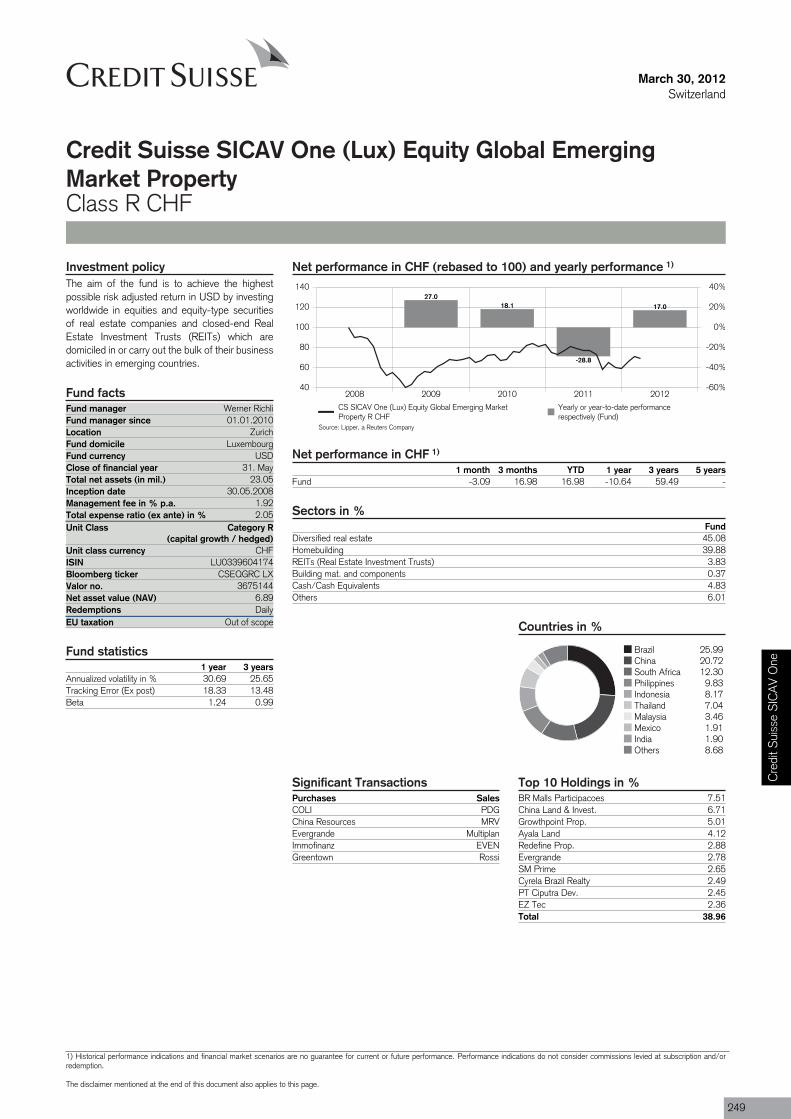
Purchases SalesCOLI PDGChina Resources MRVEvergrande MultiplanImmofinanz EVENGreentown Rossi
Fund manager Werner RichliFund manager since 01.01.2010Location ZurichFund domicile LuxembourgFund currency USDClose of financial year 31. MayTotal net assets (in mil.) 23.05Inception date 30.05.2008Management fee in % p.a. 1.92Total expense ratio (ex ante) in % 2.05Unit Class Category R
(capital growth / hedged)
ISIN LU0339604174
Valor no. 3675144
Redemptions DailyEU taxation Out of scope
March 30, 2012Switzerland
Credit Suisse SICAV One (Lux) Equity Global EmergingMarket PropertyClass R CHF
Net performance in CHF (rebased to 100) and yearly performance 1)
2008 2009 2010 2011 201240
60
80
100
120
140
-60%
-40%
-20%
0%
20%
40%27.0
18.1
-28.8
17.0
CS SICAV One (Lux) Equity Global Emerging MarketProperty R CHF
Yearly or year-to-date performancerespectively (Fund)
Net performance in CHF 1)
1 month 3 months YTD 1 year 3 years 5 yearsFund -3.09 16.98 16.98 -10.64 59.49 -
Sectors in %Fund
Diversified real estate 45.08Homebuilding 39.88REITs (Real Estate Investment Trusts) 3.83Building mat. and components 0.37Cash/Cash Equivalents 4.83Others 6.01
Countries in %
Brazil 25.99China 20.72South Africa 12.30Philippines 9.83Indonesia 8.17Thailand 7.04Malaysia 3.46Mexico 1.91India 1.90Others 8.68
Significant Transactions Top 10 Holdings in %BR Malls Participacoes 7.51China Land & Invest. 6.71Growthpoint Prop. 5.01Ayala Land 4.12Redefine Prop. 2.88Evergrande 2.78SM Prime 2.65Cyrela Brazil Realty 2.49PT Ciputra Dev. 2.45EZ Tec 2.36Total 38.96
Investment policyThe aim of the fund is to achieve the highestpossible risk adjusted return in USD by investingworldwide in equities and equity-type securitiesof real estate companies and closed-end RealEstate Investment Trusts (REITs) which aredomiciled in or carry out the bulk of their businessactivities in emerging countries.
Fund facts
Unit class currency CHF
Bloomberg ticker CSEQGRC LX
Net asset value (NAV) 6.89
Fund statistics1 year 3 years
Annualized volatility in % 30.69 25.65Tracking Error (Ex post) 18.33 13.48Beta 1.24 0.99
Source: Lipper, a Reuters Company
Cre
dit S
uiss
e S
ICA
V O
ne
1) Historical performance indications and financial market scenarios are no guarantee for current or future performance. Performance indications do not consider commissions levied at subscription and/orredemption.
The disclaimer mentioned at the end of this document also applies to this page.
249

March 30, 2012Switzerland
Credit Suisse SICAV One (Lux) Equity Global EmergingMarket PropertyClass R CHF
Review previous quarter 2)
During Q1 2012, emerging market real estatestocks rallied. The EPRA Emerging Index (allfigures in US terms) ended the period with a gainof +18.7% (Q4 2011 +0.08%), outperformingthe MSCI Emerging Index, which was up 13.9%.In tandem with better PMI data and thecommitment of the European leaders to fightthe euro crisis, investors worldwide started totake more risks and picked up emerging marketstocks again. Furthermore, shrinking CPI figuresenabled central banks to ease their monetarypolicies.
Best performing countries were Turkey (+36%),the Philippines (+35%) and India (+30%); theweakest markets were Poland (+12%), SouthAfrica (+12%), and Malaysia (+9%). As ofMarch 19, the market capitalization of thebenchmark increased by more than 30%, asmainly the Hong Kong listed Chinese companieswhich invest in mainland China, have beentransferred from the Developed Index to theEmerging Index. China now has the secondlargest weight in the index with 24%, behindBrazil with 26% and ahead of South Africa with13%.
The fund underperformed the benchmark by-286bps (previous quarter +137bps) due to theunderweight of Brazilian homebuilders PDG andMRV, as well as of the Chinese heavyweightsCOLI and China Resources. Top contributors tothe fund’s performance were the overweightpositions in the Brazilian homebuilders EZ andHelbor, the Indonesian company Alam Sutera,as well as the underweight positions in SP Setia(Malaysia), DLF (India), Evergrande andSino-Ocean Land (both China).
Outlook for the market 2)
The long-term trends for emerging propertiesremain favorable. Demographic developmentssuch as increasing working age population, GDPgrowth of generally above 5%, increasingwealth, as well as lower private and public debtcompared to developed markets, are all favorablelong-term drivers for housing and commercialreal estate. In China, the macro data shouldbottom out in Q2. The BoC started to reduce
the reserve requirements for banks to achievea soft landing. In light of the commitment ofthe Chinese authorities to further cooling downthe housing market, the chance for rate cutsis somehow low, especially taking the surge inhousehold mortgages in Q1 into account.
Due to shrinking consumer inflation at thebeginning of the year and mainly the subdued
GDP growth in recent months, we expect furtherinterest rate cuts in Brazil. We forecast likewisefor Mexico, India, the Philippines and Thailand.The fund management has an overweightposition in Asia, at the expense of EMEA,whereby the biggest exposures are in Indonesia,the Philippines and Thailand.
Portfolio ManagementWerner Richli is Portfolio Manager and Senior Investment Professional for real estate securities. Mr. Richli was previously an equity analystat Credit Suisse’s Investment Banking Division (Credit Suisse First Boston) covering European real estate stocks. Prior to this role, heanalyzed building materials, construction and utility stocks and was involved in several Initial Public Offerings. Mr. Richli joined Credit Suissein 1987. Mr. Richli is earned the CIIA designation and received a Master’s Degree in Business Administration from the University of Zurich,Switzerland.
2) If not expressly indicated otherwise, all quantitative data contained in this comment is based on Lipper, Bloomberg or Datastream.
250
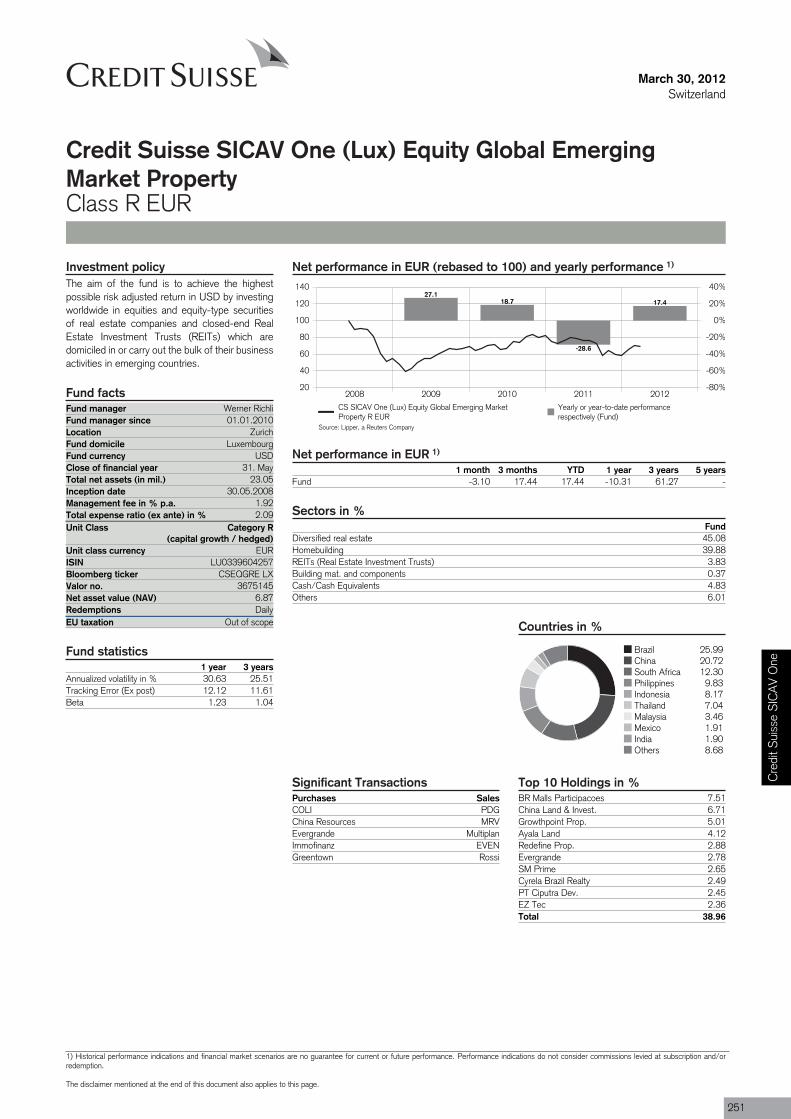
Purchases SalesCOLI PDGChina Resources MRVEvergrande MultiplanImmofinanz EVENGreentown Rossi
Fund manager Werner RichliFund manager since 01.01.2010Location ZurichFund domicile LuxembourgFund currency USDClose of financial year 31. MayTotal net assets (in mil.) 23.05Inception date 30.05.2008Management fee in % p.a. 1.92Total expense ratio (ex ante) in % 2.09Unit Class Category R
(capital growth / hedged)
ISIN LU0339604257
Valor no. 3675145
Redemptions DailyEU taxation Out of scope
March 30, 2012Switzerland
Credit Suisse SICAV One (Lux) Equity Global EmergingMarket PropertyClass R EUR
Net performance in EUR (rebased to 100) and yearly performance 1)
2008 2009 2010 2011 201220
40
60
80
100
120
140
-80%
-60%
-40%
-20%
0%
20%
40%27.1
18.7
-28.6
17.4
CS SICAV One (Lux) Equity Global Emerging MarketProperty R EUR
Yearly or year-to-date performancerespectively (Fund)
Net performance in EUR 1)
1 month 3 months YTD 1 year 3 years 5 yearsFund -3.10 17.44 17.44 -10.31 61.27 -
Sectors in %Fund
Diversified real estate 45.08Homebuilding 39.88REITs (Real Estate Investment Trusts) 3.83Building mat. and components 0.37Cash/Cash Equivalents 4.83Others 6.01
Countries in %
Brazil 25.99China 20.72South Africa 12.30Philippines 9.83Indonesia 8.17Thailand 7.04Malaysia 3.46Mexico 1.91India 1.90Others 8.68
Significant Transactions Top 10 Holdings in %BR Malls Participacoes 7.51China Land & Invest. 6.71Growthpoint Prop. 5.01Ayala Land 4.12Redefine Prop. 2.88Evergrande 2.78SM Prime 2.65Cyrela Brazil Realty 2.49PT Ciputra Dev. 2.45EZ Tec 2.36Total 38.96
Investment policyThe aim of the fund is to achieve the highestpossible risk adjusted return in USD by investingworldwide in equities and equity-type securitiesof real estate companies and closed-end RealEstate Investment Trusts (REITs) which aredomiciled in or carry out the bulk of their businessactivities in emerging countries.
Fund facts
Unit class currency EUR
Bloomberg ticker CSEQGRE LX
Net asset value (NAV) 6.87
Fund statistics1 year 3 years
Annualized volatility in % 30.63 25.51Tracking Error (Ex post) 12.12 11.61Beta 1.23 1.04
Source: Lipper, a Reuters Company
Cre
dit S
uiss
e S
ICA
V O
ne
1) Historical performance indications and financial market scenarios are no guarantee for current or future performance. Performance indications do not consider commissions levied at subscription and/orredemption.
The disclaimer mentioned at the end of this document also applies to this page.
251

March 30, 2012Switzerland
Credit Suisse SICAV One (Lux) Equity Global EmergingMarket PropertyClass R EUR
Review previous quarter 2)
During Q1 2012, emerging market real estatestocks rallied. The EPRA Emerging Index (allfigures in US terms) ended the period with a gainof +18.7% (Q4 2011 +0.08%), outperformingthe MSCI Emerging Index, which was up 13.9%.In tandem with better PMI data and thecommitment of the European leaders to fightthe euro crisis, investors worldwide started totake more risks and picked up emerging marketstocks again. Furthermore, shrinking CPI figuresenabled central banks to ease their monetarypolicies.
Best performing countries were Turkey (+36%),the Philippines (+35%) and India (+30%); theweakest markets were Poland (+12%), SouthAfrica (+12%), and Malaysia (+9%). As ofMarch 19, the market capitalization of thebenchmark increased by more than 30%, asmainly the Hong Kong listed Chinese companieswhich invest in mainland China, have beentransferred from the Developed Index to theEmerging Index. China now has the secondlargest weight in the index with 24%, behindBrazil with 26% and ahead of South Africa with13%.
The fund underperformed the benchmark by-286bps (previous quarter +137bps) due to theunderweight of Brazilian homebuilders PDG andMRV, as well as of the Chinese heavyweightsCOLI and China Resources. Top contributors tothe fund’s performance were the overweightpositions in the Brazilian homebuilders EZ andHelbor, the Indonesian company Alam Sutera,as well as the underweight positions in SP Setia(Malaysia), DLF (India), Evergrande andSino-Ocean Land (both China).
Outlook for the market 2)
The long-term trends for emerging propertiesremain favorable. Demographic developmentssuch as increasing working age population, GDPgrowth of generally above 5%, increasingwealth, as well as lower private and public debtcompared to developed markets, are all favorablelong-term drivers for housing and commercialreal estate. In China, the macro data shouldbottom out in Q2. The BoC started to reduce
the reserve requirements for banks to achievea soft landing. In light of the commitment ofthe Chinese authorities to further cooling downthe housing market, the chance for rate cutsis somehow low, especially taking the surge inhousehold mortgages in Q1 into account.
Due to shrinking consumer inflation at thebeginning of the year and mainly the subdued
GDP growth in recent months, we expect furtherinterest rate cuts in Brazil. We forecast likewisefor Mexico, India, the Philippines and Thailand.The fund management has an overweightposition in Asia, at the expense of EMEA,whereby the biggest exposures are in Indonesia,the Philippines and Thailand.
Portfolio ManagementWerner Richli is Portfolio Manager and Senior Investment Professional for real estate securities. Mr. Richli was previously an equity analystat Credit Suisse’s Investment Banking Division (Credit Suisse First Boston) covering European real estate stocks. Prior to this role, heanalyzed building materials, construction and utility stocks and was involved in several Initial Public Offerings. Mr. Richli joined Credit Suissein 1987. Mr. Richli is earned the CIIA designation and received a Master’s Degree in Business Administration from the University of Zurich,Switzerland.
2) If not expressly indicated otherwise, all quantitative data contained in this comment is based on Lipper, Bloomberg or Datastream.
252
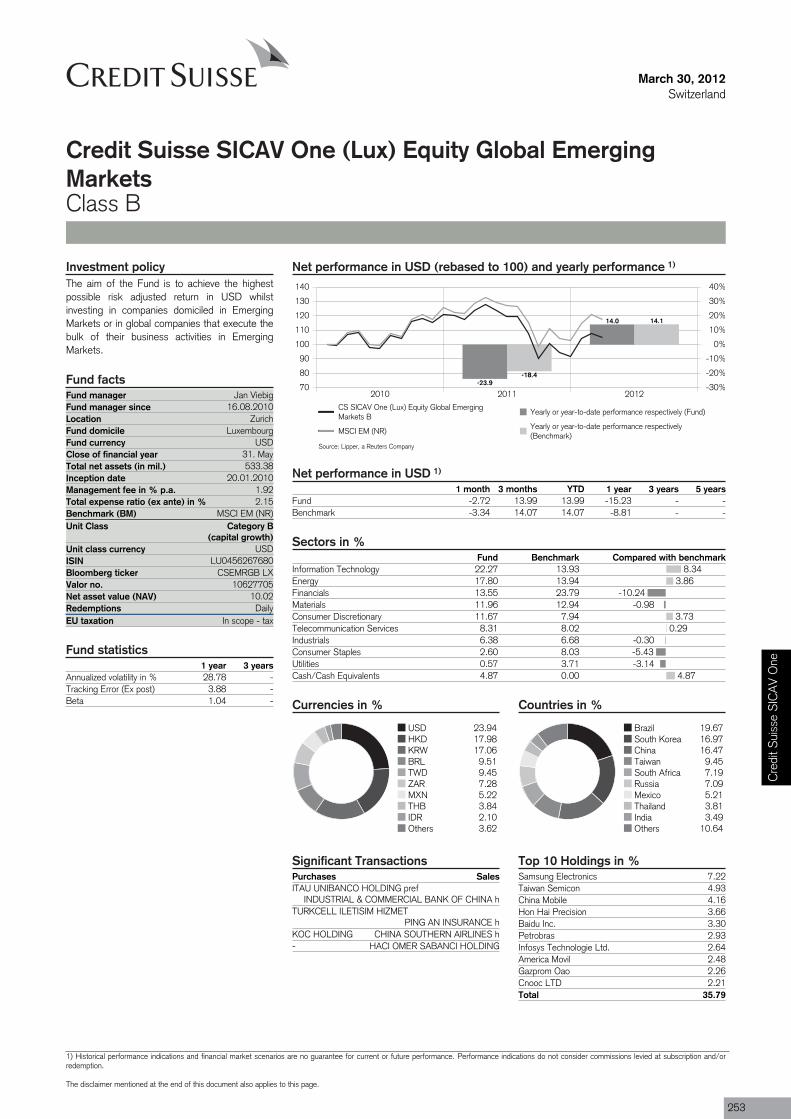
8.343.86
-10.24-0.98
3.730.29
-0.30-5.43-3.14
4.87
Purchases SalesITAU UNIBANCO HOLDING pref
INDUSTRIAL & COMMERCIAL BANK OF CHINA hTURKCELL ILETISIM HIZMET
PING AN INSURANCE hKOC HOLDING CHINA SOUTHERN AIRLINES h- HACI OMER SABANCI HOLDING
Fund manager Jan ViebigFund manager since 16.08.2010Location ZurichFund domicile LuxembourgFund currency USDClose of financial year 31. MayTotal net assets (in mil.) 533.38Inception date 20.01.2010Management fee in % p.a. 1.92Total expense ratio (ex ante) in % 2.15Benchmark (BM) MSCI EM (NR)Unit Class Category B
(capital growth)
ISIN LU0456267680
Valor no. 10627705
Redemptions DailyEU taxation In scope - tax
March 30, 2012Switzerland
Credit Suisse SICAV One (Lux) Equity Global EmergingMarketsClass B
Net performance in USD (rebased to 100) and yearly performance 1)
2010 2011 201270
80
90
100
110
120
130
140
-30%
-20%
-10%
0%
10%
20%
30%
40%
-23.9
14.0
-18.4
14.1
CS SICAV One (Lux) Equity Global EmergingMarkets B
Yearly or year-to-date performance respectively (Fund)
MSCI EM (NR)Yearly or year-to-date performance respectively(Benchmark)
Net performance in USD 1)
1 month 3 months YTD 1 year 3 years 5 yearsFund -2.72 13.99 13.99 -15.23 - -Benchmark -3.34 14.07 14.07 -8.81 - -
Sectors in %Fund Benchmark Compared with benchmark
Information Technology 22.27 13.93Energy 17.80 13.94Financials 13.55 23.79Materials 11.96 12.94Consumer Discretionary 11.67 7.94Telecommunication Services 8.31 8.02Industrials 6.38 6.68Consumer Staples 2.60 8.03Utilities 0.57 3.71Cash/Cash Equivalents 4.87 0.00
Currencies in %
USD 23.94HKD 17.98KRW 17.06BRL 9.51TWD 9.45ZAR 7.28MXN 5.22THB 3.84IDR 2.10Others 3.62
Countries in %
Brazil 19.67South Korea 16.97China 16.47Taiwan 9.45South Africa 7.19Russia 7.09Mexico 5.21Thailand 3.81India 3.49Others 10.64
Significant Transactions Top 10 Holdings in %Samsung Electronics 7.22Taiwan Semicon 4.93China Mobile 4.16Hon Hai Precision 3.66Baidu Inc. 3.30Petrobras 2.93Infosys Technologie Ltd. 2.64America Movil 2.48Gazprom Oao 2.26Cnooc LTD 2.21Total 35.79
Investment policyThe aim of the Fund is to achieve the highestpossible risk adjusted return in USD whilstinvesting in companies domiciled in EmergingMarkets or in global companies that execute thebulk of their business activities in EmergingMarkets.
Fund facts
Unit class currency USD
Bloomberg ticker CSEMRGB LX
Net asset value (NAV) 10.02
Fund statistics1 year 3 years
Annualized volatility in % 28.78 -Tracking Error (Ex post) 3.88 -Beta 1.04 -
Source: Lipper, a Reuters Company
Cre
dit S
uiss
e S
ICA
V O
ne
1) Historical performance indications and financial market scenarios are no guarantee for current or future performance. Performance indications do not consider commissions levied at subscription and/orredemption.
The disclaimer mentioned at the end of this document also applies to this page.
253

March 30, 2012Switzerland
Credit Suisse SICAV One (Lux) Equity Global EmergingMarketsClass B
Review previous quarter 2)
The fund outperformed its benchmark in Q12012. The reasons for the outperformance aremostly stock-specific. One of our largestpositions, Samsung Electronics, increasedsubstantially due to higher smartphoneshipments, an improving operating margin and ahigher DRAM profitability. Baidu and TSMC alsocontributed to the positive performance. Not onlyin China and India, but also in Brazil, monetarypolicy was very supportive. The Brazilian centralbank stated that the Selic will stabilize at lower
levels (8.75%). At the end of the quarter we solda few positions.
It is worth noting that the BRICs underperformedthe broader emerging markets universesubstantially in March 2012. Markets inIndonesia and the Philippines gained in March,while China (-6.9%), Brazil( -6.7%) and Russia(-5.8%) were all lower. India also dropped by-5.4% in March.
We are clearly in a consolidation phase.Structurally, emerging markets look much morepromising than developed markets (lower fiscaldebt, higher growth, falling inflation). However,risk premia have decreased substantially in thefirst two months of 2012, and growth in Chinais slowing. Risks in peripheral Europe remainhigh. It is safe to assume that markets couldconsolidate at these higher levels. As a result, wehave decreased directional risks in the fund.
Outlook for the market 2)
In Q1 2012 emerging markets increasedsubstantially. In USD terms, they increased by13.6%, outperforming developed markets, whichwere 10.9% higher. According to the CreditSuisse Price-to-Book/Return-on-Equity (PB/ROE) model, equities in Russia, China and Brazilstill look attractively valued. In October 2011, theHang Seng China Index dropped to 8,100. Atthis time, many investors assumed that Chinawould experience a "hard landing" and feared
that Chinese property developers and banksmight experience significant financial stress. Infact, the market has increased substantially (theHSCEI currently trades above 10,600).
Risk premia have dropped both in equity andfixed income markets. The Credit Suisse RiskAppetite Index has increased from "panic levels"in October 2011 to euphoria very quickly. Webelieve that the market is in a very late stage of
a risk-on rally. Given the problems in peripheralEurope and slowing growth in China, theprobability has increased that markets willconsolidate at these levels. We have reduced thedirectional systematic risk in the fund accordinglyby selling a few positions. The Chinese centralbank has room to further support credit growth.The Indian central bank has also injected liquidityby lowering the cash reserve ratio to 4.75%.
Portfolio ManagementJan Viebig is Head of Emerging Market Equities Team of Credit Suisse Asset Management. Mr Viebig joined Credit Suisse AssetManagement in August 2010. Prior to that, Mr Viebig worked at DWS Investment GmbH (Deutsche Bank Group) as a Senior PortfolioManager and as a lecturer at the University of Bremen. At DWS, he managed a China fund, a India fund, pan-Asian funds and global long/ short equity funds. For his performance, he received several performance awards, including two European Performance Awards fromHedge Fund Review (HFR). Mr Viebig holds a diploma and a PhD degree from the University of the Armed Forces in Munich, a Master ofInternational Management (Post-MBA) degree from Thunderbird, School of Global Management. He has recently finished his Habilitation.He published several books and articles in peer-reviewed journals and is a Chartered Financial Analyst.
2) If not expressly indicated otherwise, all quantitative data contained in this comment is based on Lipper, Bloomberg or Datastream.
254

8.343.86
-10.24-0.98
3.730.29
-0.30-5.43-3.14
4.87
Purchases SalesITAU UNIBANCO HOLDING pref
INDUSTRIAL & COMMERCIAL BANK OF CHINA hTURKCELL ILETISIM HIZMET
PING AN INSURANCE hKOC HOLDING CHINA SOUTHERN AIRLINES h- HACI OMER SABANCI HOLDING
Fund manager Jan ViebigFund manager since 16.08.2010Location ZurichFund domicile LuxembourgFund currency USDClose of financial year 31. MayTotal net assets (in mil.) 533.38Inception date 01.02.2010Management fee in % p.a. 0.90Total expense ratio (ex ante) in % 1.13Benchmark (BM) MSCI EM (NR)Unit Class Category I
(capital growth)
ISIN LU0456267847
Valor no. 10627709
Min. Init. Investm. Amount (in mill.) 3Redemptions DailyEU taxation In scope - tax
March 30, 2012Switzerland
Credit Suisse SICAV One (Lux) Equity Global EmergingMarketsClass I
Net performance in USD (rebased to 100) and yearly performance 1)
2010 2011 201270
80
90
100
110
120
130
140
-30%
-20%
-10%
0%
10%
20%
30%
40%
-23.1
14.3
-18.4
14.1
CS SICAV One (Lux) Equity Global EmergingMarkets I
Yearly or year-to-date performance respectively (Fund)
MSCI EM (NR)Yearly or year-to-date performance respectively(Benchmark)
Net performance in USD 1)
1 month 3 months YTD 1 year 3 years 5 yearsFund -2.61 14.29 14.29 -14.30 - -Benchmark -3.34 14.07 14.07 -8.81 - -
Sectors in %Fund Benchmark Compared with benchmark
Information Technology 22.27 13.93Energy 17.80 13.94Financials 13.55 23.79Materials 11.96 12.94Consumer Discretionary 11.67 7.94Telecommunication Services 8.31 8.02Industrials 6.38 6.68Consumer Staples 2.60 8.03Utilities 0.57 3.71Cash/Cash Equivalents 4.87 0.00
Currencies in %
USD 23.94HKD 17.98KRW 17.06BRL 9.51TWD 9.45ZAR 7.28MXN 5.22THB 3.84IDR 2.10Others 3.62
Countries in %
Brazil 19.67South Korea 16.97China 16.47Taiwan 9.45South Africa 7.19Russia 7.09Mexico 5.21Thailand 3.81India 3.49Others 10.64
Significant Transactions Top 10 Holdings in %Samsung Electronics 7.22Taiwan Semicon 4.93China Mobile 4.16Hon Hai Precision 3.66Baidu Inc. 3.30Petrobras 2.93Infosys Technologie Ltd. 2.64America Movil 2.48Gazprom Oao 2.26Cnooc LTD 2.21Total 35.79
Investment policyThe aim of the Fund is to achieve the highestpossible risk adjusted return in USD whilstinvesting in companies domiciled in EmergingMarkets or in global companies that execute thebulk of their business activities in EmergingMarkets.
Fund facts
Unit class currency USD
Bloomberg ticker CSEMRGI LX
Net asset value (NAV) 1'055.54
Fund statistics1 year 3 years
Annualized volatility in % 28.76 -Tracking Error (Ex post) 3.91 -Beta 1.03 -
Source: Lipper, a Reuters Company
Cre
dit S
uiss
e S
ICA
V O
ne
1) Historical performance indications and financial market scenarios are no guarantee for current or future performance. Performance indications do not consider commissions levied at subscription and/orredemption.
The disclaimer mentioned at the end of this document also applies to this page.
255
March 30, 2012Switzerland
Credit Suisse SICAV One (Lux) Equity Global EmergingMarketsClass I
Review previous quarter 2)
The fund outperformed its benchmark in Q12012. The reasons for the outperformance aremostly stock-specific. One of our largestpositions, Samsung Electronics, increasedsubstantially due to higher smartphoneshipments, an improving operating margin and ahigher DRAM profitability. Baidu and TSMC alsocontributed to the positive performance. Not onlyin China and India, but also in Brazil, monetarypolicy was very supportive. The Brazilian centralbank stated that the Selic will stabilize at lower
levels (8.75%). At the end of the quarter we solda few positions.
It is worth noting that the BRICs underperformedthe broader emerging markets universesubstantially in March 2012. Markets inIndonesia and the Philippines gained in March,while China (-6.9%), Brazil( -6.7%) and Russia(-5.8%) were all lower. India also dropped by-5.4% in March.
We are clearly in a consolidation phase.Structurally, emerging markets look much morepromising than developed markets (lower fiscaldebt, higher growth, falling inflation). However,risk premia have decreased substantially in thefirst two months of 2012, and growth in Chinais slowing. Risks in peripheral Europe remainhigh. It is safe to assume that markets couldconsolidate at these higher levels. As a result, wehave decreased directional risks in the fund.
Outlook for the market 2)
In Q1 2012 emerging markets increasedsubstantially. In USD terms, they increased by13.6%, outperforming developed markets, whichwere 10.9% higher. According to the CreditSuisse Price-to-Book/Return-on-Equity (PB/ROE) model, equities in Russia, China and Brazilstill look attractively valued. In October 2011, theHang Seng China Index dropped to 8,100. Atthis time, many investors assumed that Chinawould experience a "hard landing" and feared
that Chinese property developers and banksmight experience significant financial stress. Infact, the market has increased substantially (theHSCEI currently trades above 10,600).
Risk premia have dropped both in equity andfixed income markets. The Credit Suisse RiskAppetite Index has increased from "panic levels"in October 2011 to euphoria very quickly. Webelieve that the market is in a very late stage of
a risk-on rally. Given the problems in peripheralEurope and slowing growth in China, theprobability has increased that markets willconsolidate at these levels. We have reduced thedirectional systematic risk in the fund accordinglyby selling a few positions. The Chinese centralbank has room to further support credit growth.The Indian central bank has also injected liquidityby lowering the cash reserve ratio to 4.75%.
Portfolio ManagementJan Viebig is Head of Emerging Market Equities Team of Credit Suisse Asset Management. Mr Viebig joined Credit Suisse AssetManagement in August 2010. Prior to that, Mr Viebig worked at DWS Investment GmbH (Deutsche Bank Group) as a Senior PortfolioManager and as a lecturer at the University of Bremen. At DWS, he managed a China fund, a India fund, pan-Asian funds and global long/ short equity funds. For his performance, he received several performance awards, including two European Performance Awards fromHedge Fund Review (HFR). Mr Viebig holds a diploma and a PhD degree from the University of the Armed Forces in Munich, a Master ofInternational Management (Post-MBA) degree from Thunderbird, School of Global Management. He has recently finished his Habilitation.He published several books and articles in peer-reviewed journals and is a Chartered Financial Analyst.
2) If not expressly indicated otherwise, all quantitative data contained in this comment is based on Lipper, Bloomberg or Datastream.
256
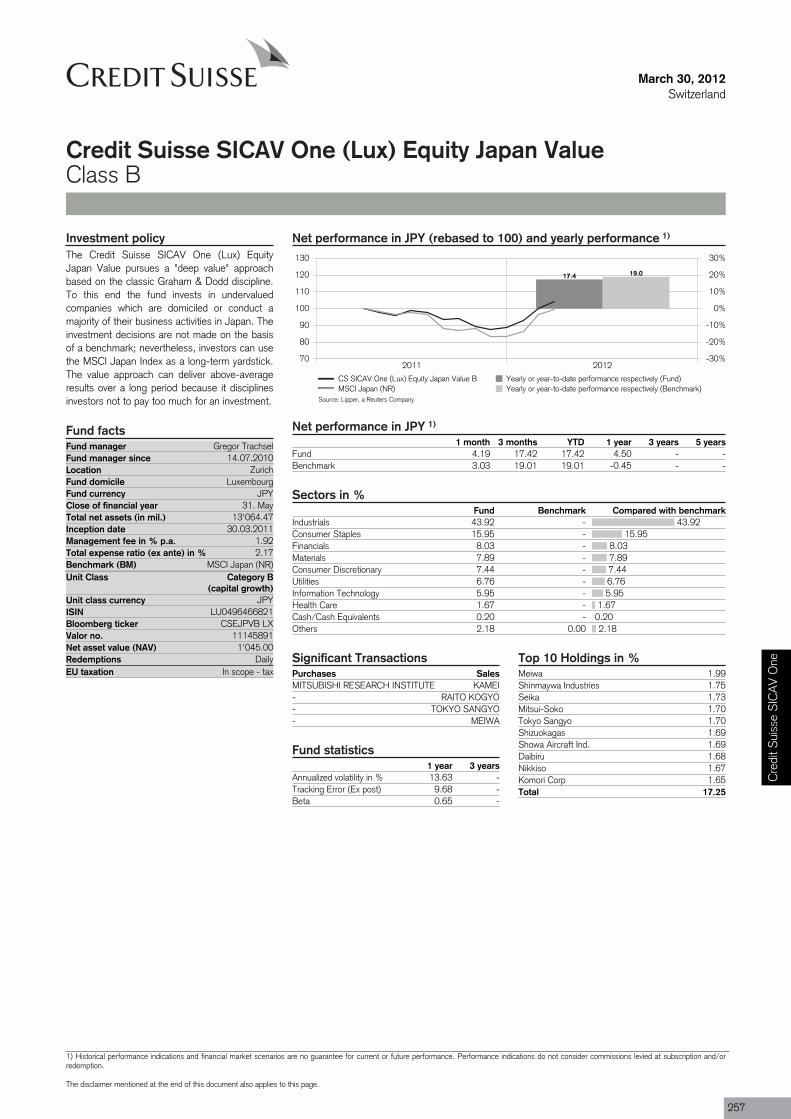
43.9215.95
8.037.897.446.765.95
1.670.202.18
Purchases SalesMITSUBISHI RESEARCH INSTITUTE KAMEI- RAITO KOGYO- TOKYO SANGYO- MEIWA
Fund manager Gregor TrachselFund manager since 14.07.2010Location ZurichFund domicile LuxembourgFund currency JPYClose of financial year 31. MayTotal net assets (in mil.) 13'064.47Inception date 30.03.2011Management fee in % p.a. 1.92Total expense ratio (ex ante) in % 2.17Benchmark (BM) MSCI Japan (NR)Unit Class Category B
(capital growth)
ISIN LU0496466821
Valor no. 11145891
Redemptions DailyEU taxation In scope - tax
March 30, 2012Switzerland
Credit Suisse SICAV One (Lux) Equity Japan ValueClass B
Net performance in JPY (rebased to 100) and yearly performance 1)
2011 201270
80
90
100
110
120
130
-30%
-20%
-10%
0%
10%
20%
30%
17.4 19.0
CS SICAV One (Lux) Equity Japan Value B Yearly or year-to-date performance respectively (Fund)MSCI Japan (NR) Yearly or year-to-date performance respectively (Benchmark)
Net performance in JPY 1)
1 month 3 months YTD 1 year 3 years 5 yearsFund 4.19 17.42 17.42 4.50 - -Benchmark 3.03 19.01 19.01 -0.45 - -
Sectors in %Fund Benchmark Compared with benchmark
Industrials 43.92 -Consumer Staples 15.95 -Financials 8.03 -Materials 7.89 -Consumer Discretionary 7.44 -Utilities 6.76 -Information Technology 5.95 -Health Care 1.67 -Cash/Cash Equivalents 0.20 -Others 2.18 0.00
Top 10 Holdings in %Meiwa 1.99Shinmaywa Industries 1.75Seika 1.73Mitsui-Soko 1.70Tokyo Sangyo 1.70Shizuokagas 1.69Showa Aircraft Ind. 1.69Daibiru 1.68Nikkiso 1.67Komori Corp 1.65Total 17.25
Significant Transactions
Fund statistics1 year 3 years
Annualized volatility in % 13.63 -Tracking Error (Ex post) 9.68 -Beta 0.65 -
Investment policyThe Credit Suisse SICAV One (Lux) EquityJapan Value pursues a "deep value" approachbased on the classic Graham & Dodd discipline.To this end the fund invests in undervaluedcompanies which are domiciled or conduct amajority of their business activities in Japan. Theinvestment decisions are not made on the basisof a benchmark; nevertheless, investors can usethe MSCI Japan Index as a long-term yardstick.The value approach can deliver above-averageresults over a long period because it disciplinesinvestors not to pay too much for an investment.
Fund facts
Unit class currency JPY
Bloomberg ticker CSEJPVB LX
Net asset value (NAV) 1'045.00
Source: Lipper, a Reuters Company
Cre
dit S
uiss
e S
ICA
V O
ne
1) Historical performance indications and financial market scenarios are no guarantee for current or future performance. Performance indications do not consider commissions levied at subscription and/orredemption.
The disclaimer mentioned at the end of this document also applies to this page.
257
March 30, 2012Switzerland
Credit Suisse SICAV One (Lux) Equity Japan ValueClass B
Review previous quarter 2)
Performance: Net asset value (F-shares) rose by17.78% in Q1 2012. Since the Fund becameresponsibility of the Value Team on July 14,2010, it has generated a total net return of11.21%.
Transactions: Portfolio activity was very lowduring the reporting period. We started to builda new position in an IT services business. Noholdings were sold.
Corporate actions / mergers and acquisitions:There were no major events affecting ourportfolio companies.
Commentary: Perhaps interesting to note is thatthe Fund did quite well during the reportingperiod despite being heavily underrepresented inthe sectors and industries that lead the market’smove to the upside in the face of the weakening
JPY, notably the large exporters in consumerelectronics and automobiles.
There were no noteworthy issues which mayhave impacted portfolio strategy or structure inQ1 2012. For more topics and issues, pleaseconsult the separate quarterly commentary onthe global strategy.
Outlook for the market 2)
The medium- to long-term strategy (5-10 years)followed by the Fund places its emphasis on fourmain investment situations:
First, we select companies in industries whosemargins get temporarily squeezed by rising inputcosts (chemicals, packaging and foodprocessors, among others). With a time lag, theshrewd competitors in this space typically findways to apply stringent cost control and/or adjustpricing to a level that will restore, or at leastapproach, historic margins.
Second, we select companies experiencingcyclical weakness triggered by the
macroeconomic slowdown (e.g., machinery,engineering and commercial services). For theinvestor who is willing to look patiently over thecourse of an entire cycle, as we are, somebusinesses now appear too cheap given theirentrenched market positions and healthy balancesheets.
Third, we select companies in industries facingstructural issues that require a fundamentaltransformation in strategy and execution (e.g.,traditional media, advertising services, basicmaterials, certain utility services). Here, themarket now and then tends to over-discount thevalue of legacy-burdened incumbents while
placing heavy bets on newcomers with a cleanslate. Taking history as a guide, sometimes itturns out that late-movers with deep pocketsmay in the end prevail against an aggressive newentrant.
Last but not least, at these prices we also likeselect owners of land (forestry, agriculture, realestate). These equities have sold off due to theslump in global real estate finance. However,we believe that their long-term benefits asinflation-protected assets far outweigh thoseshorter-term concerns.
Portfolio ManagementGregor P. Trachsel, Director, is in charge of Value Investments within the Global Equity Team in Zurich. He joined Credit Suisse in 2008from M.M. Warburg Bank (Switzerland) Ltd. Zurich, where he was investment manager for value-based equity portfolios. Prior to that, heheld several positions in the Banking industry as investment manager and buy-side analyst. He holds an MBA from the Columbia UniversityGraduate School of Business, New York, in Accounting (Security Analysis) and Finance (Money Management).
2) If not expressly indicated otherwise, all quantitative data contained in this comment is based on Lipper, Bloomberg or Datastream.
258

0.45-0.83
0.57-0.23
-0.53-0.29-0.41
1.590.13
-0.45
Purchases SalesISHARES DJ EURO STOXX 50
ISHARES DJ EURO STOXX 50RECKITT BENCKISER GROUP DIAGEOUNITED BUSINESS MEDIA new
ROYAL DUTCH SHELL aPROSIEBEN SAT.1 MEDIA pref NESTLE regDAIMLER reg BHP BILLITON
Fund manager Felix Maag, Nicola NolèFund manager since 09.09.2009, 01.04.2011Location Zurich, ZurichFund domicile LuxembourgFund currency EURClose of financial year 31. MayTotal net assets (in mil.) 224.88Inception date 09.09.2009Management fee in % p.a. 1.60Total expense ratio (ex ante) in % 1.86Benchmark (BM) MSCI Europe (NR)Unit Class Category A
(distribution)
ISIN LU0439729285
Valor no. 10348225
Last distribution 14.12.2011Distribution value 0.08Redemptions DailyEU taxation In scope - no tax
March 30, 2012Switzerland
Credit Suisse SICAV One (Lux) European Equity DividendPlusClass A & B
Net performance in EUR (rebased to 100) and yearly performance 1)
2009 2010 2011 201280
90
100
110
120
130
140
-20%
-10%
0%
10%
20%
30%
40%
7.8
-6.5
5.611.1
-8.1
7.9
CS SICAV One (Lux) European Equity DividendPlus B
Yearly or year-to-date performance respectively (Fund)
MSCI Europe (NR)Yearly or year-to-date performance respectively(Benchmark)
Net performance in EUR 1)
1 month 3 months YTD 1 year 3 years 5 yearsFund -0.26 5.59 5.59 -1.05 - -Benchmark -0.14 7.87 7.87 -1.48 - -
Sectors in %Fund Benchmark Compared with benchmark
Financials 19.55 19.10Consumer Staples 13.21 14.04Energy 12.35 11.78Health Care 11.10 11.33Industrials 10.36 10.89Materials 9.56 9.85Consumer Discretionary 8.39 8.80Telecommunication Services 7.99 6.40Cash/Cash Equivalents 0.13 0.00Others 7.36 7.81
Currencies in %
EUR 42.75GBP 33.50CHF 13.91NOK 4.88SEK 4.54CZK 0.34USD 0.08
Countries in %
United Kingdom 33.21Switzerland 13.83France 13.70Germany 11.08Netherlands 10.66Norway 4.87Sweden 4.40Italy 3.58Finland 2.56Others 2.10
Top 10 Holdings in %Nestlé 4.35Royal Dutch Shell 'A' 4.20BHP Billiton 3.47HSBC Holdings 3.06GlaxoSmithKline 2.99Roche 2.92British Am. Tobacco 2.69BASF 2.49Vodafone 2.38Total Fina Elf 2.30Total 30.85
Significant Transactions
Investment policyThe subfund invests in a broadly diversifiedEuropean equity portfolio that can be expected toyield above-average dividends.
Fund facts
Category B(capital growth)
Unit class currency EUR EURLU0439729368
Bloomberg ticker CSEUEQALX
CSEUEQB LX
10348228Net asset value(NAV)
10.88 11.33
--
Daily
Fund statistics1 year 3 years
Annualized volatility in % 13.85 -Tracking Error (Ex post) 3.31 -Beta 0.83 -
Source: Lipper, a Reuters Company
Cre
dit S
uiss
e S
ICA
V O
ne
1) Historical performance indications and financial market scenarios are no guarantee for current or future performance. Performance indications do not consider commissions levied at subscription and/orredemption.
The disclaimer mentioned at the end of this document also applies to this page.
259
March 30, 2012Switzerland
Credit Suisse SICAV One (Lux) European Equity DividendPlusClass A & B
Review previous quarter 2)
The past quarter has marked a good start forthe average equity investor into the New Year. Infact, many equity markets have posted the bestfirst quarter in terms of performance since 1998,even though there was a soft patch towards theend of the reporting period. Financial marketshave been supported by the ECB offering anunlimited 3 year long term financing operation(LTRO) for European banks. The offering whichtook place in December 2011 and February2012 helped to reduce the tail risk in the financialsystem. Further, improving macro data in the USindicating stabilization in the labor and housing
markets and additional rescue funds for Greecelifted investors’ mood. However, in March globalmacro data was mixed at best with disappointingChina and euro area PMIs, potentially followedby a mixed US one. Corporate earnings wereroughly in line with expectations in Europe andthe US but disappointed on aggregate in Asia.
In terms of sectors, there was a classical rotationduring the quarter. In fact, the more defensivesectors – which used to be the winners in thelast year – lagged considerably the more cyclicalsectors during this reporting period. Accordingly,
the sectors Consumer Discretionary, IT andFinancials performed best as those sectorsbenefitted the most from the extra liquidityinjections provided by the European and the UScentral banks. On the other hand Energy andHealthcare were the most out-of-favor sectors.
The environment described above as a tendencywas more favorable for low yielding stocks. Infact the quintiles with the lower yielding stocksquite markedly outperformed the benchmark’sperformance.
Outlook for the market 2)
There has been a host of supportive equitymarket development of late. Nevertheless, wewould not expect the global equity market tomove significantly higher near-term. There is nowsignificantly less room for improvement,suggesting the rally is past the “fast money”stage. Meanwhile, US economic data has comein somewhat soggier relative to expectations oflate. Next, although tail-risks in Europe havedeclined, the region is by no means “out of thewoods”. Further risks are a property-inducedhard landing in China and an oil supply shock.
Therefore, in the near term, we expect global
equity bourses will remain in the currentcorrection phase. However, we would look to buydips. Our economists believe that a soft landingin China is on the cards, Europe will manageto muddle through and US real GDP growth in2012 will amount to a respectable 2.1%. Againstthis backdrop, and considering we believe profitmargins are unlikely to turn sharply lower, theimplication is that the corporate earnings uptrendwill remain intact. Bottom line: Following a periodof consolidation, we believe the global equitymarket has room to move higher on a 6 to 12month view.
We continue to take relatively small sector bets,running overweights in defensive areas such asTelecommunication Services and Utilities, as wellas in Energy. We are neutral in Financials andunderweight the remaining sectors.Given our view that, in the medium term equityreturns, although positive, could be range bound,dividend income will remain in focus as the mostimportant component of total return.Furthermore, we expect a benign environmentfor high dividend yield investing, as dividendyields compare very favorably to corporate bondyields in many sectors.
Portfolio ManagementDr. Felix Maag, Director, is a Senior Portfolio Manager on the MACS Global Equity team. He graduated from the University of St. Gallenwith a master’s degree in business administration and economics in 1995. He subsequently worked as a research assistant at the SwissInstitute of Banking and Finance at the University of St. Gallen. He earned his doctorate in finance from the University of St. Gallen in1999. From 1999 to 2001 Felix Maag worked as a portfolio manager for Swiss Equity Mandates in the Asset Management division ofCredit Suisse. Since August 2001, he has been a portfolio manager for global equities and currently heads the Global Dividend team. FelixMaag worked in the Equity Research department of Credit Suisse Asset Management New York from March to August 2002. He is aChartered Financial Analyst (CFA).
2) If not expressly indicated otherwise, all quantitative data contained in this comment is based on Lipper, Bloomberg or Datastream.
260
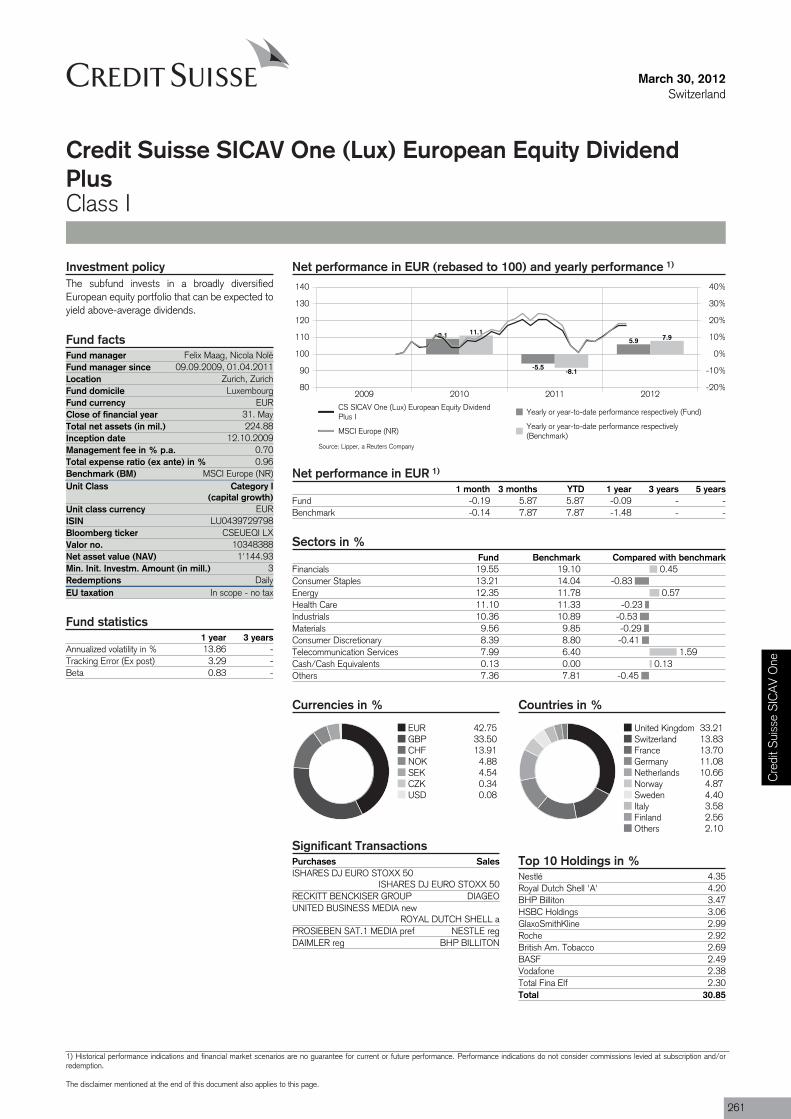
0.45-0.83
0.57-0.23
-0.53-0.29-0.41
1.590.13
-0.45
Purchases SalesISHARES DJ EURO STOXX 50
ISHARES DJ EURO STOXX 50RECKITT BENCKISER GROUP DIAGEOUNITED BUSINESS MEDIA new
ROYAL DUTCH SHELL aPROSIEBEN SAT.1 MEDIA pref NESTLE regDAIMLER reg BHP BILLITON
Fund manager Felix Maag, Nicola NolèFund manager since 09.09.2009, 01.04.2011Location Zurich, ZurichFund domicile LuxembourgFund currency EURClose of financial year 31. MayTotal net assets (in mil.) 224.88Inception date 12.10.2009Management fee in % p.a. 0.70Total expense ratio (ex ante) in % 0.96Benchmark (BM) MSCI Europe (NR)Unit Class Category I
(capital growth)
ISIN LU0439729798
Valor no. 10348388
Min. Init. Investm. Amount (in mill.) 3Redemptions DailyEU taxation In scope - no tax
March 30, 2012Switzerland
Credit Suisse SICAV One (Lux) European Equity DividendPlusClass I
Net performance in EUR (rebased to 100) and yearly performance 1)
2009 2010 2011 201280
90
100
110
120
130
140
-20%
-10%
0%
10%
20%
30%
40%
9.1
-5.5
5.911.1
-8.1
7.9
CS SICAV One (Lux) European Equity DividendPlus I
Yearly or year-to-date performance respectively (Fund)
MSCI Europe (NR)Yearly or year-to-date performance respectively(Benchmark)
Net performance in EUR 1)
1 month 3 months YTD 1 year 3 years 5 yearsFund -0.19 5.87 5.87 -0.09 - -Benchmark -0.14 7.87 7.87 -1.48 - -
Sectors in %Fund Benchmark Compared with benchmark
Financials 19.55 19.10Consumer Staples 13.21 14.04Energy 12.35 11.78Health Care 11.10 11.33Industrials 10.36 10.89Materials 9.56 9.85Consumer Discretionary 8.39 8.80Telecommunication Services 7.99 6.40Cash/Cash Equivalents 0.13 0.00Others 7.36 7.81
Currencies in %
EUR 42.75GBP 33.50CHF 13.91NOK 4.88SEK 4.54CZK 0.34USD 0.08
Countries in %
United Kingdom 33.21Switzerland 13.83France 13.70Germany 11.08Netherlands 10.66Norway 4.87Sweden 4.40Italy 3.58Finland 2.56Others 2.10
Top 10 Holdings in %Nestlé 4.35Royal Dutch Shell 'A' 4.20BHP Billiton 3.47HSBC Holdings 3.06GlaxoSmithKline 2.99Roche 2.92British Am. Tobacco 2.69BASF 2.49Vodafone 2.38Total Fina Elf 2.30Total 30.85
Significant Transactions
Investment policyThe subfund invests in a broadly diversifiedEuropean equity portfolio that can be expected toyield above-average dividends.
Fund facts
Unit class currency EUR
Bloomberg ticker CSEUEQI LX
Net asset value (NAV) 1'144.93
Fund statistics1 year 3 years
Annualized volatility in % 13.86 -Tracking Error (Ex post) 3.29 -Beta 0.83 -
Source: Lipper, a Reuters Company
Cre
dit S
uiss
e S
ICA
V O
ne
1) Historical performance indications and financial market scenarios are no guarantee for current or future performance. Performance indications do not consider commissions levied at subscription and/orredemption.
The disclaimer mentioned at the end of this document also applies to this page.
261

March 30, 2012Switzerland
Credit Suisse SICAV One (Lux) European Equity DividendPlusClass I
Review previous quarter 2)
The past quarter has marked a good start forthe average equity investor into the New Year. Infact, many equity markets have posted the bestfirst quarter in terms of performance since 1998,even though there was a soft patch towards theend of the reporting period. Financial marketshave been supported by the ECB offering anunlimited 3 year long term financing operation(LTRO) for European banks. The offering whichtook place in December 2011 and February2012 helped to reduce the tail risk in the financialsystem. Further, improving macro data in the USindicating stabilization in the labor and housing
markets and additional rescue funds for Greecelifted investors’ mood. However, in March globalmacro data was mixed at best with disappointingChina and euro area PMIs, potentially followedby a mixed US one. Corporate earnings wereroughly in line with expectations in Europe andthe US but disappointed on aggregate in Asia.
In terms of sectors, there was a classical rotationduring the quarter. In fact, the more defensivesectors – which used to be the winners in thelast year – lagged considerably the more cyclicalsectors during this reporting period. Accordingly,
the sectors Consumer Discretionary, IT andFinancials performed best as those sectorsbenefitted the most from the extra liquidityinjections provided by the European and the UScentral banks. On the other hand Energy andHealthcare were the most out-of-favor sectors.
The environment described above as a tendencywas more favorable for low yielding stocks. Infact the quintiles with the lower yielding stocksquite markedly outperformed the benchmark’sperformance.
Outlook for the market 2)
There has been a host of supportive equitymarket development of late. Nevertheless, wewould not expect the global equity market tomove significantly higher near-term. There is nowsignificantly less room for improvement,suggesting the rally is past the “fast money”stage. Meanwhile, US economic data has comein somewhat soggier relative to expectations oflate. Next, although tail-risks in Europe havedeclined, the region is by no means “out of thewoods”. Further risks are a property-inducedhard landing in China and an oil supply shock.
Therefore, in the near term, we expect global
equity bourses will remain in the currentcorrection phase. However, we would look to buydips. Our economists believe that a soft landingin China is on the cards, Europe will manageto muddle through and US real GDP growth in2012 will amount to a respectable 2.1%. Againstthis backdrop, and considering we believe profitmargins are unlikely to turn sharply lower, theimplication is that the corporate earnings uptrendwill remain intact. Bottom line: Following a periodof consolidation, we believe the global equitymarket has room to move higher on a 6 to 12month view.
We continue to take relatively small sector bets,running overweights in defensive areas such asTelecommunication Services and Utilities, as wellas in Energy. We are neutral in Financials andunderweight the remaining sectors.Given our view that, in the medium term equityreturns, although positive, could be range bound,dividend income will remain in focus as the mostimportant component of total return.Furthermore, we expect a benign environmentfor high dividend yield investing, as dividendyields compare very favorably to corporate bondyields in many sectors.
Portfolio ManagementDr. Felix Maag, Director, is a Senior Portfolio Manager on the MACS Global Equity team. He graduated from the University of St. Gallenwith a master’s degree in business administration and economics in 1995. He subsequently worked as a research assistant at the SwissInstitute of Banking and Finance at the University of St. Gallen. He earned his doctorate in finance from the University of St. Gallen in1999. From 1999 to 2001 Felix Maag worked as a portfolio manager for Swiss Equity Mandates in the Asset Management division ofCredit Suisse. Since August 2001, he has been a portfolio manager for global equities and currently heads the Global Dividend team. FelixMaag worked in the Equity Research department of Credit Suisse Asset Management New York from March to August 2002. He is aChartered Financial Analyst (CFA).
2) If not expressly indicated otherwise, all quantitative data contained in this comment is based on Lipper, Bloomberg or Datastream.
262
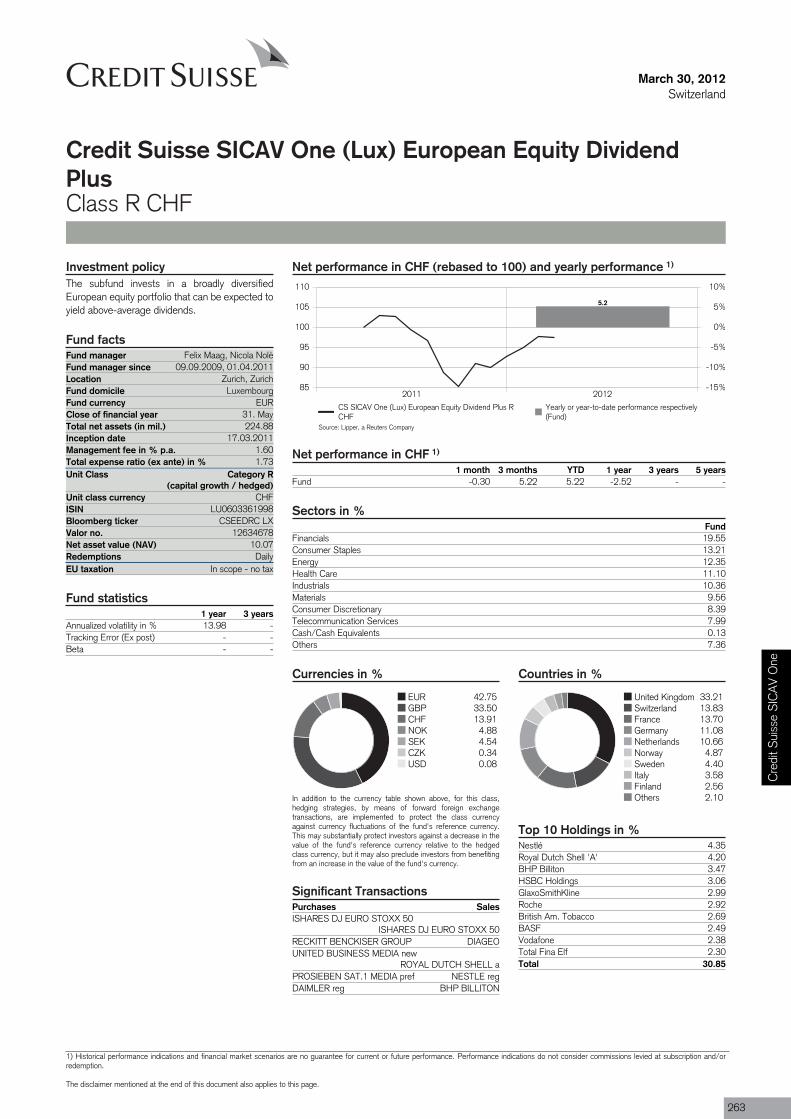
Purchases SalesISHARES DJ EURO STOXX 50
ISHARES DJ EURO STOXX 50RECKITT BENCKISER GROUP DIAGEOUNITED BUSINESS MEDIA new
ROYAL DUTCH SHELL aPROSIEBEN SAT.1 MEDIA pref NESTLE regDAIMLER reg BHP BILLITON
Fund manager Felix Maag, Nicola NolèFund manager since 09.09.2009, 01.04.2011Location Zurich, ZurichFund domicile LuxembourgFund currency EURClose of financial year 31. MayTotal net assets (in mil.) 224.88Inception date 17.03.2011Management fee in % p.a. 1.60Total expense ratio (ex ante) in % 1.73Unit Class Category R
(capital growth / hedged)
ISIN LU0603361998
Valor no. 12634678
Redemptions DailyEU taxation In scope - no tax
March 30, 2012Switzerland
Credit Suisse SICAV One (Lux) European Equity DividendPlusClass R CHF
Net performance in CHF (rebased to 100) and yearly performance 1)
2011 201285
90
95
100
105
110
-15%
-10%
-5%
0%
5%
10%
5.2
CS SICAV One (Lux) European Equity Dividend Plus RCHF
Yearly or year-to-date performance respectively(Fund)
Net performance in CHF 1)
1 month 3 months YTD 1 year 3 years 5 yearsFund -0.30 5.22 5.22 -2.52 - -
Sectors in %Fund
Financials 19.55Consumer Staples 13.21Energy 12.35Health Care 11.10Industrials 10.36Materials 9.56Consumer Discretionary 8.39Telecommunication Services 7.99Cash/Cash Equivalents 0.13Others 7.36
Currencies in %
EUR 42.75GBP 33.50CHF 13.91NOK 4.88SEK 4.54CZK 0.34USD 0.08
In addition to the currency table shown above, for this class,hedging strategies, by means of forward foreign exchangetransactions, are implemented to protect the class currencyagainst currency fluctuations of the fund's reference currency.This may substantially protect investors against a decrease in thevalue of the fund's reference currency relative to the hedgedclass currency, but it may also preclude investors from benefitingfrom an increase in the value of the fund's currency.
Countries in %
United Kingdom 33.21Switzerland 13.83France 13.70Germany 11.08Netherlands 10.66Norway 4.87Sweden 4.40Italy 3.58Finland 2.56Others 2.10
Top 10 Holdings in %Nestlé 4.35Royal Dutch Shell 'A' 4.20BHP Billiton 3.47HSBC Holdings 3.06GlaxoSmithKline 2.99Roche 2.92British Am. Tobacco 2.69BASF 2.49Vodafone 2.38Total Fina Elf 2.30Total 30.85
Significant Transactions
Investment policyThe subfund invests in a broadly diversifiedEuropean equity portfolio that can be expected toyield above-average dividends.
Fund facts
Unit class currency CHF
Bloomberg ticker CSEEDRC LX
Net asset value (NAV) 10.07
Fund statistics1 year 3 years
Annualized volatility in % 13.98 -Tracking Error (Ex post) - -Beta - -
Source: Lipper, a Reuters Company
Cre
dit S
uiss
e S
ICA
V O
ne
1) Historical performance indications and financial market scenarios are no guarantee for current or future performance. Performance indications do not consider commissions levied at subscription and/orredemption.
The disclaimer mentioned at the end of this document also applies to this page.
263

March 30, 2012Switzerland
Credit Suisse SICAV One (Lux) European Equity DividendPlusClass R CHF
Review previous quarter 2)
The past quarter has marked a good start forthe average equity investor into the New Year. Infact, many equity markets have posted the bestfirst quarter in terms of performance since 1998,even though there was a soft patch towards theend of the reporting period. Financial marketshave been supported by the ECB offering anunlimited 3 year long term financing operation(LTRO) for European banks. The offering whichtook place in December 2011 and February2012 helped to reduce the tail risk in the financialsystem. Further, improving macro data in the USindicating stabilization in the labor and housing
markets and additional rescue funds for Greecelifted investors’ mood. However, in March globalmacro data was mixed at best with disappointingChina and euro area PMIs, potentially followedby a mixed US one. Corporate earnings wereroughly in line with expectations in Europe andthe US but disappointed on aggregate in Asia.
In terms of sectors, there was a classical rotationduring the quarter. In fact, the more defensivesectors – which used to be the winners in thelast year – lagged considerably the more cyclicalsectors during this reporting period. Accordingly,
the sectors Consumer Discretionary, IT andFinancials performed best as those sectorsbenefitted the most from the extra liquidityinjections provided by the European and the UScentral banks. On the other hand Energy andHealthcare were the most out-of-favor sectors.
The environment described above as a tendencywas more favorable for low yielding stocks. Infact the quintiles with the lower yielding stocksquite markedly outperformed the benchmark’sperformance.
Outlook for the market 2)
There has been a host of supportive equitymarket development of late. Nevertheless, wewould not expect the global equity market tomove significantly higher near-term. There is nowsignificantly less room for improvement,suggesting the rally is past the “fast money”stage. Meanwhile, US economic data has comein somewhat soggier relative to expectations oflate. Next, although tail-risks in Europe havedeclined, the region is by no means “out of thewoods”. Further risks are a property-inducedhard landing in China and an oil supply shock.
Therefore, in the near term, we expect global
equity bourses will remain in the currentcorrection phase. However, we would look to buydips. Our economists believe that a soft landingin China is on the cards, Europe will manageto muddle through and US real GDP growth in2012 will amount to a respectable 2.1%. Againstthis backdrop, and considering we believe profitmargins are unlikely to turn sharply lower, theimplication is that the corporate earnings uptrendwill remain intact. Bottom line: Following a periodof consolidation, we believe the global equitymarket has room to move higher on a 6 to 12month view.
We continue to take relatively small sector bets,running overweights in defensive areas such asTelecommunication Services and Utilities, as wellas in Energy. We are neutral in Financials andunderweight the remaining sectors.Given our view that, in the medium term equityreturns, although positive, could be range bound,dividend income will remain in focus as the mostimportant component of total return.Furthermore, we expect a benign environmentfor high dividend yield investing, as dividendyields compare very favorably to corporate bondyields in many sectors.
Portfolio ManagementDr. Felix Maag, Director, is a Senior Portfolio Manager on the MACS Global Equity team. He graduated from the University of St. Gallenwith a master’s degree in business administration and economics in 1995. He subsequently worked as a research assistant at the SwissInstitute of Banking and Finance at the University of St. Gallen. He earned his doctorate in finance from the University of St. Gallen in1999. From 1999 to 2001 Felix Maag worked as a portfolio manager for Swiss Equity Mandates in the Asset Management division ofCredit Suisse. Since August 2001, he has been a portfolio manager for global equities and currently heads the Global Dividend team. FelixMaag worked in the Equity Research department of Credit Suisse Asset Management New York from March to August 2002. He is aChartered Financial Analyst (CFA).
2) If not expressly indicated otherwise, all quantitative data contained in this comment is based on Lipper, Bloomberg or Datastream.
264
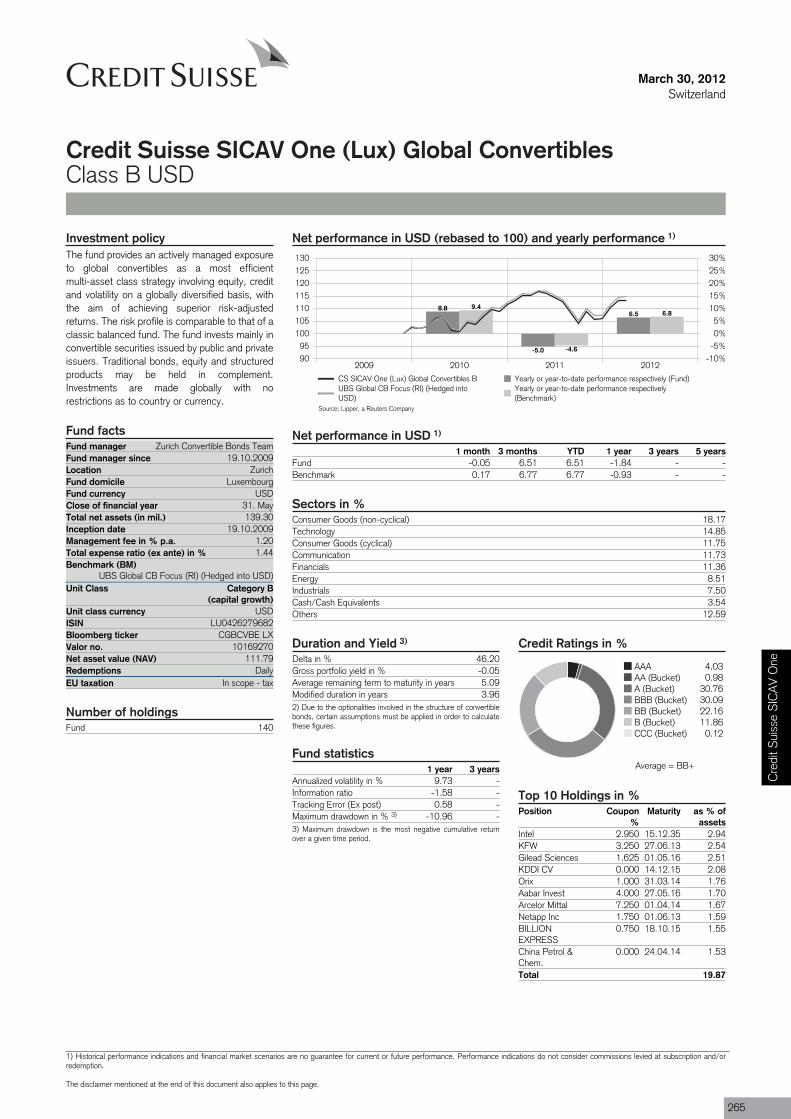
Fund manager Zurich Convertible Bonds TeamFund manager since 19.10.2009Location ZurichFund domicile LuxembourgFund currency USDClose of financial year 31. MayTotal net assets (in mil.) 139.30Inception date 19.10.2009Management fee in % p.a. 1.20Total expense ratio (ex ante) in % 1.44Benchmark (BM)
UBS Global CB Focus (RI) (Hedged into USD)Unit Class Category B
(capital growth)
ISIN LU0426279682
Valor no. 10169270
Redemptions DailyEU taxation In scope - tax
Fund 140
March 30, 2012Switzerland
Credit Suisse SICAV One (Lux) Global ConvertiblesClass B USD
Net performance in USD (rebased to 100) and yearly performance 1)
2009 2010 2011 20129095
100105110115120125130
-10%-5%0%5%
10%15%20%25%30%
8.8
-5.0
6.59.4
-4.6
6.8
CS SICAV One (Lux) Global Convertibles B Yearly or year-to-date performance respectively (Fund)UBS Global CB Focus (RI) (Hedged intoUSD)
Yearly or year-to-date performance respectively(Benchmark)
Net performance in USD 1)
1 month 3 months YTD 1 year 3 years 5 yearsFund -0.05 6.51 6.51 -1.84 - -Benchmark 0.17 6.77 6.77 -0.93 - -
Sectors in %Consumer Goods (non-cyclical) 18.17Technology 14.85Consumer Goods (cyclical) 11.75Communication 11.73Financials 11.36Energy 8.51Industrials 7.50Cash/Cash Equivalents 3.54Others 12.59
Credit Ratings in %
AAA 4.03AA (Bucket) 0.98A (Bucket) 30.76BBB (Bucket) 30.09BB (Bucket) 22.16B (Bucket) 11.86CCC (Bucket) 0.12
Top 10 Holdings in %Position Coupon
%Maturity as % of
assetsIntel 2.950 15.12.35 2.94KFW 3.250 27.06.13 2.54Gilead Sciences 1.625 01.05.16 2.51KDDI CV 0.000 14.12.15 2.08Orix 1.000 31.03.14 1.76Aabar Invest 4.000 27.05.16 1.70Arcelor Mittal 7.250 01.04.14 1.67Netapp Inc 1.750 01.06.13 1.59BILLIONEXPRESS
0.750 18.10.15 1.55
China Petrol &Chem.
0.000 24.04.14 1.53
Total 19.87
Duration and Yield 3)
Delta in % 46.20Gross portfolio yield in % -0.05Average remaining term to maturity in years 5.09Modified duration in years 3.962) Due to the optionalities involved in the structure of convertiblebonds, certain assumptions must be applied in order to calculatethese figures.
Fund statistics1 year 3 years
Annualized volatility in % 9.73 -Information ratio -1.58 -Tracking Error (Ex post) 0.58 -Maximum drawdown in % 3) -10.96 -3) Maximum drawdown is the most negative cumulative returnover a given time period.
Investment policyThe fund provides an actively managed exposureto global convertibles as a most efficientmulti-asset class strategy involving equity, creditand volatility on a globally diversified basis, withthe aim of achieving superior risk-adjustedreturns. The risk profile is comparable to that of aclassic balanced fund. The fund invests mainly inconvertible securities issued by public and privateissuers. Traditional bonds, equity and structuredproducts may be held in complement.Investments are made globally with norestrictions as to country or currency.
Fund facts
Unit class currency USD
Bloomberg ticker CGBCVBE LX
Net asset value (NAV) 111.79
Number of holdings
Source: Lipper, a Reuters Company
Average = BB+C
redi
t Sui
sse
SIC
AV
One
1) Historical performance indications and financial market scenarios are no guarantee for current or future performance. Performance indications do not consider commissions levied at subscription and/orredemption.
The disclaimer mentioned at the end of this document also applies to this page.
265

March 30, 2012Switzerland
Credit Suisse SICAV One (Lux) Global ConvertiblesClass B USD
Review previous quarter 4)
Global convertibles had a great start to the yearand returned 8.8% in Q1 2012 (currencyhedged), whereas the investment grade part ofthe universe showed a return of 5.7%. Thispositive performance was mainly attributed tostrong global equity markets and further spreadtightening.
In general, the investment environment improvedand rising investor sentiment gave equity marketsthe needed support for growth. Since themassive interventions by the ECB, financial
system stability has improved and the downsiderisk to the global economy has been reduced. Inthe US, with the unemployment rate remainingstable at 8.3% and unemployment benefit claimsfalling to the lowest level since April 2008,consumer confidence reached thesecond-highest level in four years and retail salesclimbed by most in five months. On the otherhand, inflation rose in February the most in 10months, mainly driven by gasoline prices.
In the BRIC countries (especially China and
India), stimulating monetary policy improved theoutlook for risky assets and equity marketscontinued to rise in light of the momentum builtup in December. With regards to convertiblessector performances, all were in positive territory.The highest contributions came fromTechnology, Industrial Goods and Healthcare,whereas Food & Beverage, Chemicals and Retailwere more or less flat. Convertibles primarymarket activity of USD 8.8bn in March, thehighest since June 2011, brought the totalissuance in the first quarter to USD 15.1bn.
Outlook for the market 4)
The economic climate remains supportive, butoverbought market conditions are impairing thenear-term technical picture. We are proceedingon the assumption that the headwinds(technicals, euro area crisis and geopoliticalrisks) will have only very short-livedconsequences for the markets.
We have a positive medium-term stance on
stocks and would therefore take advantage ofshare price setbacks to increase the exposure insome convertibles. On the regional side, we stillfavor the US due to its defensive characteristicsand its further improving fundamentals, whereasour view on Japan is neutral. We still likeemerging markets in the long-term due to theirpositive fundamentals and growth prospects, butare cautious in the short-term.
In general, global valuations and sentiment haveimproved and we expect a robust earningsseason ahead. We remain neutrally positioned interms of equity sensitivity across all convertibleproducts, looking for alpha generation oncompany selection level.
Portfolio ManagementThe portfolio is managed by a team of experienced investment professionals who are based in Zurich. The fund is managed according to the team's view onsecurity selection, equity sectors, equity sensitivity, credit, and duration. The team includes several portfolio managers who contribute to the co-managementof the fund according to their area of expertise.
4) If not expressly indicated otherwise, all quantitative data contained in this comment is based on Lipper, Bloomberg or Datastream.
266

Fund manager Zurich Convertible Bonds TeamFund manager since 19.10.2009Location ZurichFund domicile LuxembourgFund currency USDClose of financial year 31. MayTotal net assets (in mil.) 139.30Inception date 13.11.2009Management fee in % p.a. 1.20Total expense ratio (ex ante) in % 1.44Benchmark (BM)
UBS Global CB Focus (RI) (Hedged into CHF)Unit Class Category R
(capital growth / hedged)
ISIN LU0457025020
Valor no. 10639345
Redemptions DailyEU taxation In scope - tax
Fund 140
March 30, 2012Switzerland
Credit Suisse SICAV One (Lux) Global ConvertiblesClass R CHF
Net performance in CHF (rebased to 100) and yearly performance 1)
2009 2010 2011 20129095
100105110115120125130
-10%-5%0%5%
10%15%20%25%30%
7.8
-5.8
6.29.0
-4.8
6.7
CS SICAV One (Lux) Global Convertibles RCHF
Yearly or year-to-date performance respectively (Fund)
UBS Global CB Focus (RI) (Hedged into CHF)Yearly or year-to-date performance respectively(Benchmark)
Net performance in CHF 1)
1 month 3 months YTD 1 year 3 years 5 yearsFund -0.13 6.24 6.24 -2.89 - -Benchmark 0.13 6.69 6.69 -1.24 - -
Sectors in %Consumer Goods (non-cyclical) 18.17Technology 14.85Consumer Goods (cyclical) 11.75Communication 11.73Financials 11.36Energy 8.51Industrials 7.50Cash/Cash Equivalents 3.54Others 12.59
Credit Ratings in %
AAA 4.03AA (Bucket) 0.98A (Bucket) 30.76BBB (Bucket) 30.09BB (Bucket) 22.16B (Bucket) 11.86CCC (Bucket) 0.12
Top 10 Holdings in %Position Coupon
%Maturity as % of
assetsIntel 2.950 15.12.35 2.94KFW 3.250 27.06.13 2.54Gilead Sciences 1.625 01.05.16 2.51KDDI CV 0.000 14.12.15 2.08Orix 1.000 31.03.14 1.76Aabar Invest 4.000 27.05.16 1.70Arcelor Mittal 7.250 01.04.14 1.67Netapp Inc 1.750 01.06.13 1.59BILLIONEXPRESS
0.750 18.10.15 1.55
China Petrol &Chem.
0.000 24.04.14 1.53
Total 19.87
Duration and Yield 3)
Delta in % 46.20Gross portfolio yield in % -0.05Average remaining term to maturity in years 5.09Modified duration in years 3.962) Due to the optionalities involved in the structure of convertiblebonds, certain assumptions must be applied in order to calculatethese figures.
Fund statistics1 year 3 years
Annualized volatility in % 9.71 -Information ratio -3.72 -Tracking Error (Ex post) 0.45 -Maximum drawdown in % 3) -11.27 -3) Maximum drawdown is the most negative cumulative returnover a given time period.
Investment policyThe fund provides an actively managed exposureto global convertibles as a most efficientmulti-asset class strategy involving equity, creditand volatility on a globally diversified basis, withthe aim of achieving superior risk-adjustedreturns. The risk profile is comparable to that of aclassic balanced fund. The fund invests mainly inconvertible securities issued by public and privateissuers. Traditional bonds, equity and structuredproducts may be held in complement.Investments are made globally with norestrictions as to country or currency.
Fund facts
Unit class currency CHF
Bloomberg ticker CGBCVRC LX
Net asset value (NAV) 110.42
Number of holdings
Source: Lipper, a Reuters Company
Average = BB+ Cre
dit S
uiss
e S
ICA
V O
ne
1) Historical performance indications and financial market scenarios are no guarantee for current or future performance. Performance indications do not consider commissions levied at subscription and/orredemption.
The disclaimer mentioned at the end of this document also applies to this page.
267

March 30, 2012Switzerland
Credit Suisse SICAV One (Lux) Global ConvertiblesClass R CHF
Review previous quarter 4)
Global convertibles had a great start to the yearand returned 8.8% in Q1 2012 (currencyhedged), whereas the investment grade part ofthe universe showed a return of 5.7%. Thispositive performance was mainly attributed tostrong global equity markets and further spreadtightening.
In general, the investment environment improvedand rising investor sentiment gave equity marketsthe needed support for growth. Since themassive interventions by the ECB, financial
system stability has improved and the downsiderisk to the global economy has been reduced. Inthe US, with the unemployment rate remainingstable at 8.3% and unemployment benefit claimsfalling to the lowest level since April 2008,consumer confidence reached thesecond-highest level in four years and retail salesclimbed by most in five months. On the otherhand, inflation rose in February the most in 10months, mainly driven by gasoline prices.
In the BRIC countries (especially China and
India), stimulating monetary policy improved theoutlook for risky assets and equity marketscontinued to rise in light of the momentum builtup in December. With regards to convertiblessector performances, all were in positive territory.The highest contributions came fromTechnology, Industrial Goods and Healthcare,whereas Food & Beverage, Chemicals and Retailwere more or less flat. Convertibles primarymarket activity of USD 8.8bn in March, thehighest since June 2011, brought the totalissuance in the first quarter to USD 15.1bn.
Outlook for the market 4)
The economic climate remains supportive, butoverbought market conditions are impairing thenear-term technical picture. We are proceedingon the assumption that the headwinds(technicals, euro area crisis and geopoliticalrisks) will have only very short-livedconsequences for the markets.
We have a positive medium-term stance on
stocks and would therefore take advantage ofshare price setbacks to increase the exposure insome convertibles. On the regional side, we stillfavor the US due to its defensive characteristicsand its further improving fundamentals, whereasour view on Japan is neutral. We still likeemerging markets in the long-term due to theirpositive fundamentals and growth prospects, butare cautious in the short-term.
In general, global valuations and sentiment haveimproved and we expect a robust earningsseason ahead. We remain neutrally positioned interms of equity sensitivity across all convertibleproducts, looking for alpha generation oncompany selection level.
Portfolio ManagementThe portfolio is managed by a team of experienced investment professionals who are based in Zurich. The fund is managed according to the team's view onsecurity selection, equity sectors, equity sensitivity, credit, and duration. The team includes several portfolio managers who contribute to the co-managementof the fund according to their area of expertise.
4) If not expressly indicated otherwise, all quantitative data contained in this comment is based on Lipper, Bloomberg or Datastream.
268

Fund manager Zurich Convertible Bonds TeamFund manager since 19.10.2009Location ZurichFund domicile LuxembourgFund currency USDClose of financial year 31. MayTotal net assets (in mil.) 139.30Inception date 27.10.2009Management fee in % p.a. 1.20Total expense ratio (ex ante) in % 1.44Benchmark (BM)
UBS Global CB Focus (RI) (Hedged into EUR)Unit Class Category R
(capital growth / hedged)
ISIN LU0457025293
Valor no. 10639347
Redemptions DailyEU taxation In scope - tax
Fund 140
March 30, 2012Switzerland
Credit Suisse SICAV One (Lux) Global ConvertiblesClass R EUR
Net performance in EUR (rebased to 100) and yearly performance 1)
2009 2010 2011 20129095
100105110115120125130
-10%-5%0%5%
10%15%20%25%30%
8.3
-5.3
6.59.2
-4.2
6.8
CS SICAV One (Lux) Global Convertibles REUR
Yearly or year-to-date performance respectively (Fund)
UBS Global CB Focus (RI) (Hedged into EUR)Yearly or year-to-date performance respectively(Benchmark)
Net performance in EUR 1)
1 month 3 months YTD 1 year 3 years 5 yearsFund -0.14 6.47 6.47 -2.09 - -Benchmark 0.16 6.79 6.79 -0.61 - -
Sectors in %Consumer Goods (non-cyclical) 18.17Technology 14.85Consumer Goods (cyclical) 11.75Communication 11.73Financials 11.36Energy 8.51Industrials 7.50Cash/Cash Equivalents 3.54Others 12.59
Credit Ratings in %
AAA 4.03AA (Bucket) 0.98A (Bucket) 30.76BBB (Bucket) 30.09BB (Bucket) 22.16B (Bucket) 11.86CCC (Bucket) 0.12
Top 10 Holdings in %Position Coupon
%Maturity as % of
assetsIntel 2.950 15.12.35 2.94KFW 3.250 27.06.13 2.54Gilead Sciences 1.625 01.05.16 2.51KDDI CV 0.000 14.12.15 2.08Orix 1.000 31.03.14 1.76Aabar Invest 4.000 27.05.16 1.70Arcelor Mittal 7.250 01.04.14 1.67Netapp Inc 1.750 01.06.13 1.59BILLIONEXPRESS
0.750 18.10.15 1.55
China Petrol &Chem.
0.000 24.04.14 1.53
Total 19.87
Duration and Yield 3)
Delta in % 46.20Gross portfolio yield in % -0.05Average remaining term to maturity in years 5.09Modified duration in years 3.962) Due to the optionalities involved in the structure of convertiblebonds, certain assumptions must be applied in order to calculatethese figures.
Fund statistics1 year 3 years
Annualized volatility in % 9.73 -Information ratio -3.60 -Tracking Error (Ex post) 0.42 -Maximum drawdown in % 3) -10.91 -3) Maximum drawdown is the most negative cumulative returnover a given time period.
Investment policyThe fund provides an actively managed exposureto global convertibles as a most efficientmulti-asset class strategy involving equity, creditand volatility on a globally diversified basis, withthe aim of achieving superior risk-adjustedreturns. The risk profile is comparable to that of aclassic balanced fund. The fund invests mainly inconvertible securities issued by public and privateissuers. Traditional bonds, equity and structuredproducts may be held in complement.Investments are made globally with norestrictions as to country or currency.
Fund facts
Unit class currency EUR
Bloomberg ticker CGBCVRE LX
Net asset value (NAV) 112.86
Number of holdings
Source: Lipper, a Reuters Company
Average = BB+ Cre
dit S
uiss
e S
ICA
V O
ne
1) Historical performance indications and financial market scenarios are no guarantee for current or future performance. Performance indications do not consider commissions levied at subscription and/orredemption.
The disclaimer mentioned at the end of this document also applies to this page.
269
March 30, 2012Switzerland
Credit Suisse SICAV One (Lux) Global ConvertiblesClass R EUR
Review previous quarter 4)
Global convertibles had a great start to the yearand returned 8.8% in Q1 2012 (currencyhedged), whereas the investment grade part ofthe universe showed a return of 5.7%. Thispositive performance was mainly attributed tostrong global equity markets and further spreadtightening.
In general, the investment environment improvedand rising investor sentiment gave equity marketsthe needed support for growth. Since themassive interventions by the ECB, financial
system stability has improved and the downsiderisk to the global economy has been reduced. Inthe US, with the unemployment rate remainingstable at 8.3% and unemployment benefit claimsfalling to the lowest level since April 2008,consumer confidence reached thesecond-highest level in four years and retail salesclimbed by most in five months. On the otherhand, inflation rose in February the most in 10months, mainly driven by gasoline prices.
In the BRIC countries (especially China and
India), stimulating monetary policy improved theoutlook for risky assets and equity marketscontinued to rise in light of the momentum builtup in December. With regards to convertiblessector performances, all were in positive territory.The highest contributions came fromTechnology, Industrial Goods and Healthcare,whereas Food & Beverage, Chemicals and Retailwere more or less flat. Convertibles primarymarket activity of USD 8.8bn in March, thehighest since June 2011, brought the totalissuance in the first quarter to USD 15.1bn.
Outlook for the market 4)
The economic climate remains supportive, butoverbought market conditions are impairing thenear-term technical picture. We are proceedingon the assumption that the headwinds(technicals, euro area crisis and geopoliticalrisks) will have only very short-livedconsequences for the markets.
We have a positive medium-term stance on
stocks and would therefore take advantage ofshare price setbacks to increase the exposure insome convertibles. On the regional side, we stillfavor the US due to its defensive characteristicsand its further improving fundamentals, whereasour view on Japan is neutral. We still likeemerging markets in the long-term due to theirpositive fundamentals and growth prospects, butare cautious in the short-term.
In general, global valuations and sentiment haveimproved and we expect a robust earningsseason ahead. We remain neutrally positioned interms of equity sensitivity across all convertibleproducts, looking for alpha generation oncompany selection level.
Portfolio ManagementThe portfolio is managed by a team of experienced investment professionals who are based in Zurich. The fund is managed according to the team's view onsecurity selection, equity sectors, equity sensitivity, credit, and duration. The team includes several portfolio managers who contribute to the co-managementof the fund according to their area of expertise.
4) If not expressly indicated otherwise, all quantitative data contained in this comment is based on Lipper, Bloomberg or Datastream.
270
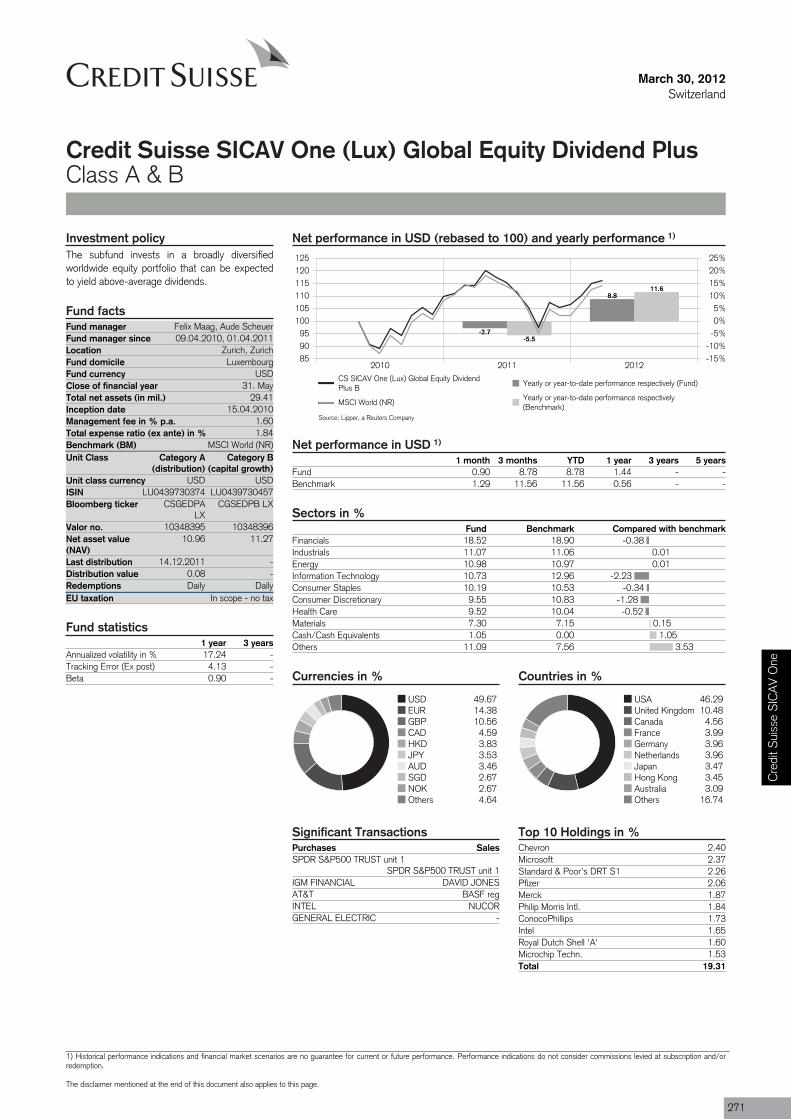
-0.380.010.01
-2.23-0.34
-1.28-0.52
0.151.05
3.53
Purchases SalesSPDR S&P500 TRUST unit 1
SPDR S&P500 TRUST unit 1IGM FINANCIAL DAVID JONESAT&T BASF regINTEL NUCORGENERAL ELECTRIC -
Fund manager Felix Maag, Aude ScheuerFund manager since 09.04.2010, 01.04.2011Location Zurich, ZurichFund domicile LuxembourgFund currency USDClose of financial year 31. MayTotal net assets (in mil.) 29.41Inception date 15.04.2010Management fee in % p.a. 1.60Total expense ratio (ex ante) in % 1.84Benchmark (BM) MSCI World (NR)Unit Class Category A
(distribution)
ISIN LU0439730374
Valor no. 10348395
Last distribution 14.12.2011Distribution value 0.08Redemptions DailyEU taxation In scope - no tax
March 30, 2012Switzerland
Credit Suisse SICAV One (Lux) Global Equity Dividend PlusClass A & B
Net performance in USD (rebased to 100) and yearly performance 1)
2010 2011 2012859095
100105110115120125
-15%-10%-5%0%5%
10%15%20%25%
-2.7
8.8
-5.5
11.6
CS SICAV One (Lux) Global Equity DividendPlus B
Yearly or year-to-date performance respectively (Fund)
MSCI World (NR)Yearly or year-to-date performance respectively(Benchmark)
Net performance in USD 1)
1 month 3 months YTD 1 year 3 years 5 yearsFund 0.90 8.78 8.78 1.44 - -Benchmark 1.29 11.56 11.56 0.56 - -
Sectors in %Fund Benchmark Compared with benchmark
Financials 18.52 18.90Industrials 11.07 11.06Energy 10.98 10.97Information Technology 10.73 12.96Consumer Staples 10.19 10.53Consumer Discretionary 9.55 10.83Health Care 9.52 10.04Materials 7.30 7.15Cash/Cash Equivalents 1.05 0.00Others 11.09 7.56
Currencies in %
USD 49.67EUR 14.38GBP 10.56CAD 4.59HKD 3.83JPY 3.53AUD 3.46SGD 2.67NOK 2.67Others 4.64
Countries in %
USA 46.29United Kingdom 10.48Canada 4.56France 3.99Germany 3.96Netherlands 3.96Japan 3.47Hong Kong 3.45Australia 3.09Others 16.74
Top 10 Holdings in %Chevron 2.40Microsoft 2.37Standard & Poor's DRT S1 2.26Pfizer 2.06Merck 1.87Philip Morris Intl. 1.84ConocoPhillips 1.73Intel 1.65Royal Dutch Shell 'A' 1.60Microchip Techn. 1.53Total 19.31
Significant Transactions
Investment policyThe subfund invests in a broadly diversifiedworldwide equity portfolio that can be expectedto yield above-average dividends.
Fund facts
Category B(capital growth)
Unit class currency USD USDLU0439730457
Bloomberg ticker CSGEDPALX
CGSEDPB LX
10348396Net asset value(NAV)
10.96 11.27
--
Daily
Fund statistics1 year 3 years
Annualized volatility in % 17.24 -Tracking Error (Ex post) 4.13 -Beta 0.90 -
Source: Lipper, a Reuters Company
Cre
dit S
uiss
e S
ICA
V O
ne
1) Historical performance indications and financial market scenarios are no guarantee for current or future performance. Performance indications do not consider commissions levied at subscription and/orredemption.
The disclaimer mentioned at the end of this document also applies to this page.
271
March 30, 2012Switzerland
Credit Suisse SICAV One (Lux) Global Equity Dividend PlusClass A & B
Review previous quarter 2)
The past quarter has marked a good start forthe average equity investor into the New Year. Infact, many equity markets have posted the bestfirst quarter in terms of performance since 1998,even though there was a soft patch towards theend of the reporting period. Financial marketshave been supported by the ECB offering anunlimited 3 year long term financing operation(LTRO) for European banks. The offering whichtook place in December 2011 and February2012 helped to reduce the tail risk in the financialsystem. Further, improving macro data in the USindicating stabilization in the labor and housing
markets and additional rescue funds for Greecelifted investors’ mood. However, in March globalmacro data was mixed at best with disappointingChina and euro area PMIs, potentially followedby a mixed US one. Corporate earnings wereroughly in line with expectations in Europe andthe US but disappointed on aggregate in Asia.
In terms of sectors, there was a classical rotationduring the quarter. In fact, the more defensivesectors – which used to be the winners in thelast year – lagged considerably the more cyclicalsectors during this reporting period. Accordingly,
the sectors Consumer Discretionary, IT andFinancials performed best as those sectorsbenefitted the most from the extra liquidityinjections provided by the European and the UScentral banks. On the other hand,Telecommunication Services and Utilities werethe most out-of-favor sectors.
The environment described above as a tendencywas more favorable for low yielding stocks. Infact the quintiles with the lower yielding stocksquite markedly outperformed the benchmark’sperformance.
Outlook for the market 2)
There has been a host of supportive equitymarket development of late. Nevertheless, wewould not expect the global equity market tomove significantly higher near-term. There is nowsignificantly less room for improvement,suggesting the rally is past the “fast money”stage. Meanwhile, US economic data has comein somewhat soggier relative to expectations oflate. Next, although tail-risks in Europe havedeclined, the region is by no means “out of thewoods”. Further risks are a property-inducedhard landing in China and an oil supply shock.
Therefore, in the near term, we expect global
equity bourses will remain in the currentcorrection phase. However, we would look to buydips. Our economists believe that a soft landingin China is on the cards, Europe will manageto muddle through and US real GDP growth in2012 will amount to a respectable 2.1%. Againstthis backdrop, and considering we believe profitmargins are unlikely to turn sharply lower, theimplication is that the corporate earnings uptrendwill remain intact. Bottom line: Following a periodof consolidation, we believe the global equitymarket has room to move higher on a 6 to 12month view.
We continue to take relatively small sector bets,running overweights in defensive areas such asTelecommunication Services and Utilities, as wellas in more cyclical sectors as Energy, Industrialsand Materials.
Given our view that, in the medium term equityreturns, although positive, could be range bound,dividend income will remain in focus as the mostimportant component of total return.Furthermore, dividend yields compare veryfavourably to corporate bond yields in manysectors.
Portfolio ManagementDr. Felix Maag, Director, is a Senior Portfolio Manager on the MACS Global Equity team. He graduated from the University of St. Gallenwith a master’s degree in business administration and economics in 1995. He subsequently worked as a research assistant at the SwissInstitute of Banking and Finance at the University of St. Gallen. He earned his doctorate in finance from the University of St. Gallen in1999. From 1999 to 2001 Felix Maag worked as a portfolio manager for Swiss Equity Mandates in the Asset Management division ofCredit Suisse. Since August 2001, he has been a portfolio manager for global equities and currently heads the Global Dividend team. FelixMaag worked in the Equity Research department of Credit Suisse Asset Management New York from March to August 2002. He is aChartered Financial Analyst (CFA).
2) If not expressly indicated otherwise, all quantitative data contained in this comment is based on Lipper, Bloomberg or Datastream.
272
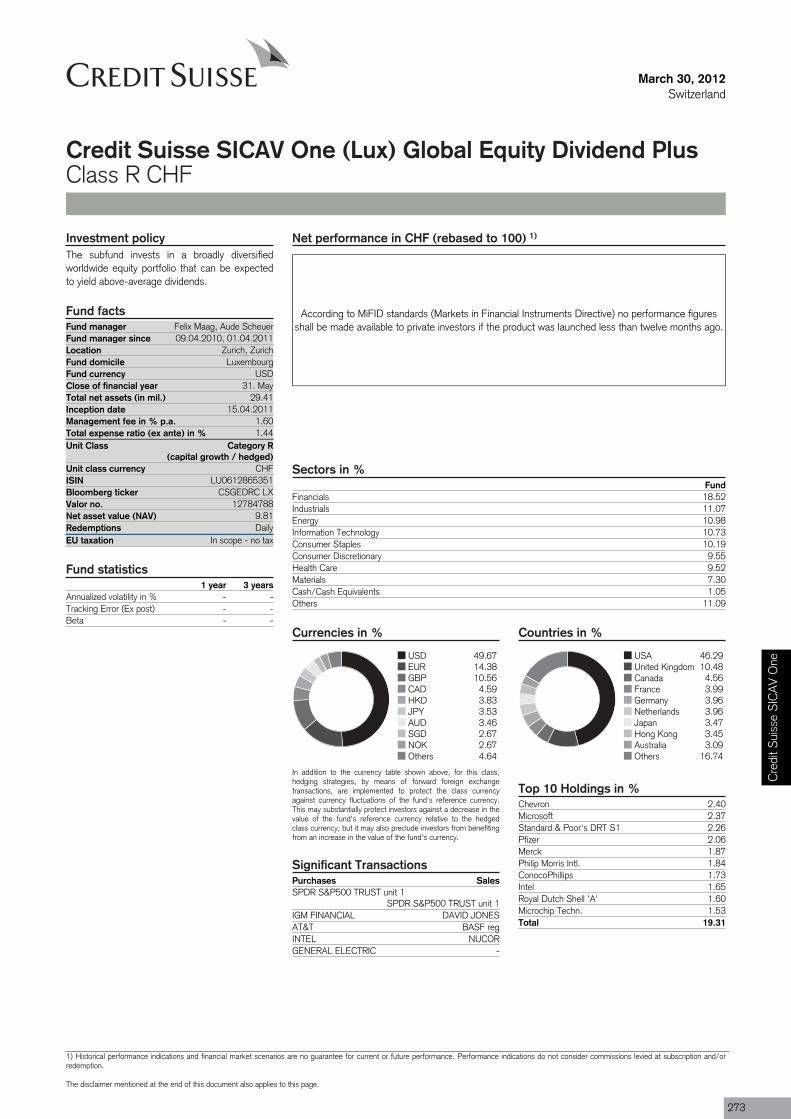
Purchases SalesSPDR S&P500 TRUST unit 1
SPDR S&P500 TRUST unit 1IGM FINANCIAL DAVID JONESAT&T BASF regINTEL NUCORGENERAL ELECTRIC -
Fund manager Felix Maag, Aude ScheuerFund manager since 09.04.2010, 01.04.2011Location Zurich, ZurichFund domicile LuxembourgFund currency USDClose of financial year 31. MayTotal net assets (in mil.) 29.41Inception date 15.04.2011Management fee in % p.a. 1.60Total expense ratio (ex ante) in % 1.44Unit Class Category R
(capital growth / hedged)
ISIN LU0612865351
Valor no. 12784788
Redemptions DailyEU taxation In scope - no tax
March 30, 2012Switzerland
Credit Suisse SICAV One (Lux) Global Equity Dividend PlusClass R CHF
Net performance in CHF (rebased to 100) 1)
According to MiFID standards (Markets in Financial Instruments Directive) no performance figuresshall be made available to private investors if the product was launched less than twelve months ago.
Sectors in %Fund
Financials 18.52Industrials 11.07Energy 10.98Information Technology 10.73Consumer Staples 10.19Consumer Discretionary 9.55Health Care 9.52Materials 7.30Cash/Cash Equivalents 1.05Others 11.09
Currencies in %
USD 49.67EUR 14.38GBP 10.56CAD 4.59HKD 3.83JPY 3.53AUD 3.46SGD 2.67NOK 2.67Others 4.64
In addition to the currency table shown above, for this class,hedging strategies, by means of forward foreign exchangetransactions, are implemented to protect the class currencyagainst currency fluctuations of the fund's reference currency.This may substantially protect investors against a decrease in thevalue of the fund's reference currency relative to the hedgedclass currency, but it may also preclude investors from benefitingfrom an increase in the value of the fund's currency.
Countries in %
USA 46.29United Kingdom 10.48Canada 4.56France 3.99Germany 3.96Netherlands 3.96Japan 3.47Hong Kong 3.45Australia 3.09Others 16.74
Top 10 Holdings in %Chevron 2.40Microsoft 2.37Standard & Poor's DRT S1 2.26Pfizer 2.06Merck 1.87Philip Morris Intl. 1.84ConocoPhillips 1.73Intel 1.65Royal Dutch Shell 'A' 1.60Microchip Techn. 1.53Total 19.31
Significant Transactions
Investment policyThe subfund invests in a broadly diversifiedworldwide equity portfolio that can be expectedto yield above-average dividends.
Fund facts
Unit class currency CHF
Bloomberg ticker CSGEDRC LX
Net asset value (NAV) 9.81
Fund statistics1 year 3 years
Annualized volatility in % - -Tracking Error (Ex post) - -Beta - -
Cre
dit S
uiss
e S
ICA
V O
ne
1) Historical performance indications and financial market scenarios are no guarantee for current or future performance. Performance indications do not consider commissions levied at subscription and/orredemption.
The disclaimer mentioned at the end of this document also applies to this page.
273
March 30, 2012Switzerland
Credit Suisse SICAV One (Lux) Global Equity Dividend PlusClass R CHF
Review previous quarter 2)
The past quarter has marked a good start forthe average equity investor into the New Year. Infact, many equity markets have posted the bestfirst quarter in terms of performance since 1998,even though there was a soft patch towards theend of the reporting period. Financial marketshave been supported by the ECB offering anunlimited 3 year long term financing operation(LTRO) for European banks. The offering whichtook place in December 2011 and February2012 helped to reduce the tail risk in the financialsystem. Further, improving macro data in the USindicating stabilization in the labor and housing
markets and additional rescue funds for Greecelifted investors’ mood. However, in March globalmacro data was mixed at best with disappointingChina and euro area PMIs, potentially followedby a mixed US one. Corporate earnings wereroughly in line with expectations in Europe andthe US but disappointed on aggregate in Asia.
In terms of sectors, there was a classical rotationduring the quarter. In fact, the more defensivesectors – which used to be the winners in thelast year – lagged considerably the more cyclicalsectors during this reporting period. Accordingly,
the sectors Consumer Discretionary, IT andFinancials performed best as those sectorsbenefitted the most from the extra liquidityinjections provided by the European and the UScentral banks. On the other hand,Telecommunication Services and Utilities werethe most out-of-favor sectors.
The environment described above as a tendencywas more favorable for low yielding stocks. Infact the quintiles with the lower yielding stocksquite markedly outperformed the benchmark’sperformance.
Outlook for the market 2)
There has been a host of supportive equitymarket development of late. Nevertheless, wewould not expect the global equity market tomove significantly higher near-term. There is nowsignificantly less room for improvement,suggesting the rally is past the “fast money”stage. Meanwhile, US economic data has comein somewhat soggier relative to expectations oflate. Next, although tail-risks in Europe havedeclined, the region is by no means “out of thewoods”. Further risks are a property-inducedhard landing in China and an oil supply shock.
Therefore, in the near term, we expect global
equity bourses will remain in the currentcorrection phase. However, we would look to buydips. Our economists believe that a soft landingin China is on the cards, Europe will manageto muddle through and US real GDP growth in2012 will amount to a respectable 2.1%. Againstthis backdrop, and considering we believe profitmargins are unlikely to turn sharply lower, theimplication is that the corporate earnings uptrendwill remain intact. Bottom line: Following a periodof consolidation, we believe the global equitymarket has room to move higher on a 6 to 12month view.
We continue to take relatively small sector bets,running overweights in defensive areas such asTelecommunication Services and Utilities, as wellas in more cyclical sectors as Energy, Industrialsand Materials.
Given our view that, in the medium term equityreturns, although positive, could be range bound,dividend income will remain in focus as the mostimportant component of total return.Furthermore, dividend yields compare veryfavourably to corporate bond yields in manysectors.
Portfolio ManagementDr. Felix Maag, Director, is a Senior Portfolio Manager on the MACS Global Equity team. He graduated from the University of St. Gallenwith a master’s degree in business administration and economics in 1995. He subsequently worked as a research assistant at the SwissInstitute of Banking and Finance at the University of St. Gallen. He earned his doctorate in finance from the University of St. Gallen in1999. From 1999 to 2001 Felix Maag worked as a portfolio manager for Swiss Equity Mandates in the Asset Management division ofCredit Suisse. Since August 2001, he has been a portfolio manager for global equities and currently heads the Global Dividend team. FelixMaag worked in the Equity Research department of Credit Suisse Asset Management New York from March to August 2002. He is aChartered Financial Analyst (CFA).
2) If not expressly indicated otherwise, all quantitative data contained in this comment is based on Lipper, Bloomberg or Datastream.
274
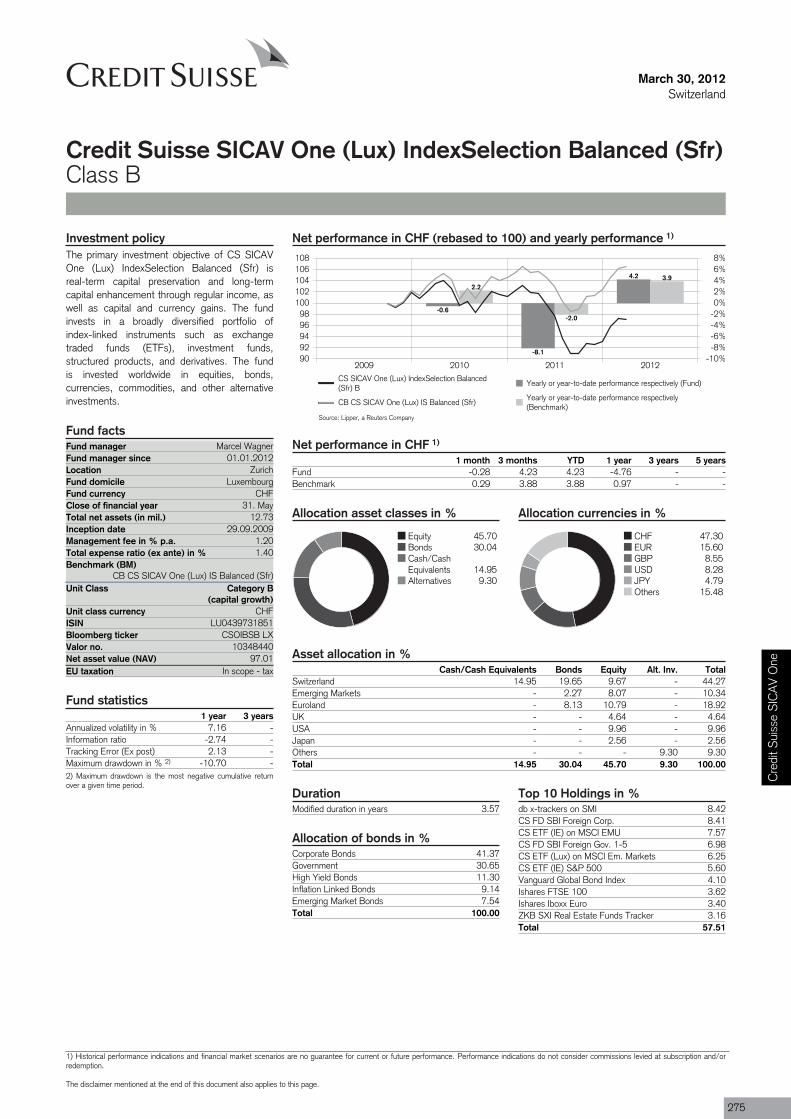
Fund manager Marcel WagnerFund manager since 01.01.2012Location ZurichFund domicile LuxembourgFund currency CHFClose of financial year 31. MayTotal net assets (in mil.) 12.73Inception date 29.09.2009Management fee in % p.a. 1.20Total expense ratio (ex ante) in % 1.40Benchmark (BM)
CB CS SICAV One (Lux) IS Balanced (Sfr)Unit Class Category B
(capital growth)
ISIN LU0439731851
Valor no. 10348440
EU taxation In scope - tax
March 30, 2012Switzerland
Credit Suisse SICAV One (Lux) IndexSelection Balanced (Sfr)Class B
Net performance in CHF (rebased to 100) and yearly performance 1)
2009 2010 2011 20129092949698
100102104106108
-10%-8%-6%-4%-2%0%2%4%6%8%
-0.6
-8.1
4.2
2.2
-2.0
3.9
CS SICAV One (Lux) IndexSelection Balanced(Sfr) B
Yearly or year-to-date performance respectively (Fund)
CB CS SICAV One (Lux) IS Balanced (Sfr)Yearly or year-to-date performance respectively(Benchmark)
Net performance in CHF 1)
1 month 3 months YTD 1 year 3 years 5 yearsFund -0.28 4.23 4.23 -4.76 - -Benchmark 0.29 3.88 3.88 0.97 - -
Allocation asset classes in %
Equity 45.70Bonds 30.04Cash/CashEquivalents 14.95Alternatives 9.30
Allocation currencies in %
CHF 47.30EUR 15.60GBP 8.55USD 8.28JPY 4.79Others 15.48
Asset allocation in %Cash/Cash Equivalents Bonds Equity Alt. Inv. Total
Switzerland 14.95 19.65 9.67 - 44.27Emerging Markets - 2.27 8.07 - 10.34Euroland - 8.13 10.79 - 18.92UK - - 4.64 - 4.64USA - - 9.96 - 9.96Japan - - 2.56 - 2.56Others - - - 9.30 9.30Total 14.95 30.04 45.70 9.30 100.00
Investment policyThe primary investment objective of CS SICAVOne (Lux) IndexSelection Balanced (Sfr) isreal-term capital preservation and long-termcapital enhancement through regular income, aswell as capital and currency gains. The fundinvests in a broadly diversified portfolio ofindex-linked instruments such as exchangetraded funds (ETFs), investment funds,structured products, and derivatives. The fundis invested worldwide in equities, bonds,currencies, commodities, and other alternativeinvestments.
Fund facts
Unit class currency CHF
Bloomberg ticker CSOIBSB LX
Net asset value (NAV) 97.01
Fund statistics1 year 3 years
Annualized volatility in % 7.16 -Information ratio -2.74 -Tracking Error (Ex post) 2.13 -Maximum drawdown in % 2) -10.70 -2) Maximum drawdown is the most negative cumulative returnover a given time period.
DurationModified duration in years 3.57
Allocation of bonds in %Corporate Bonds 41.37Government 30.65High Yield Bonds 11.30Inflation Linked Bonds 9.14Emerging Market Bonds 7.54Total 100.00
Top 10 Holdings in %db x-trackers on SMI 8.42CS FD SBI Foreign Corp. 8.41CS ETF (IE) on MSCI EMU 7.57CS FD SBI Foreign Gov. 1-5 6.98CS ETF (Lux) on MSCI Em. Markets 6.25CS ETF (IE) S&P 500 5.60Vanguard Global Bond Index 4.10Ishares FTSE 100 3.62Ishares Iboxx Euro 3.40ZKB SXI Real Estate Funds Tracker 3.16Total 57.51
Source: Lipper, a Reuters Company
Cre
dit S
uiss
e S
ICA
V O
ne
1) Historical performance indications and financial market scenarios are no guarantee for current or future performance. Performance indications do not consider commissions levied at subscription and/orredemption.
The disclaimer mentioned at the end of this document also applies to this page.
275
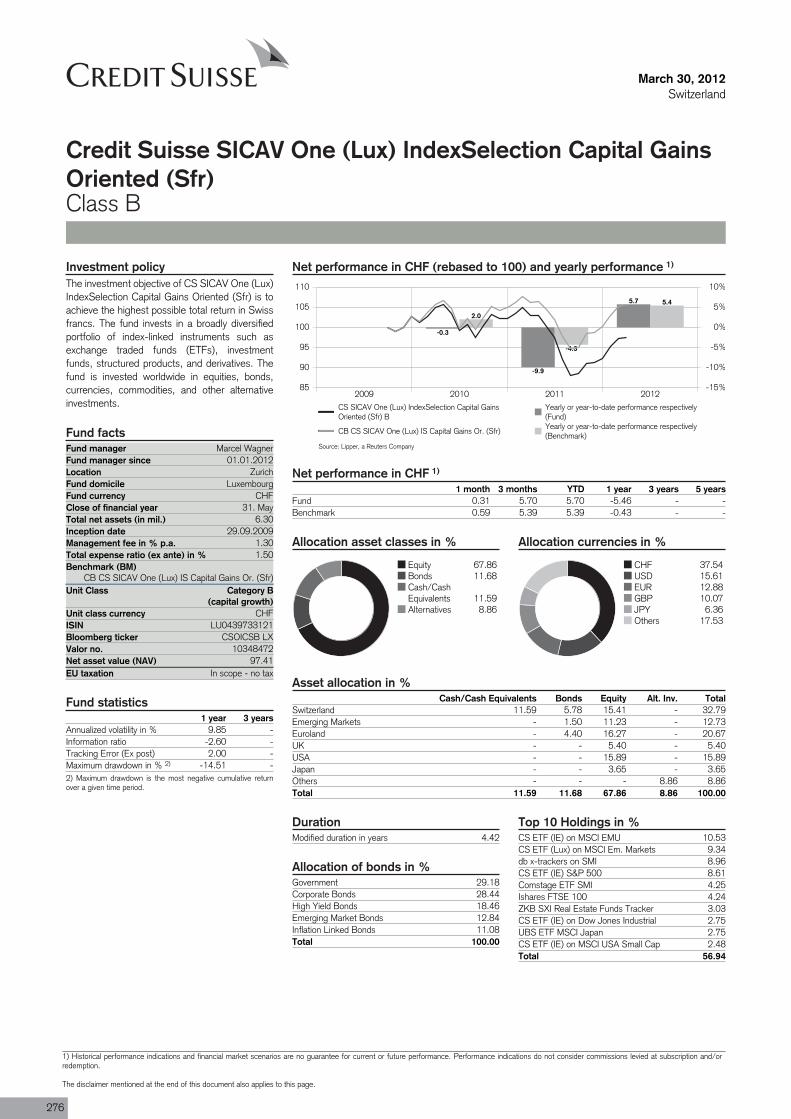
Fund manager Marcel WagnerFund manager since 01.01.2012Location ZurichFund domicile LuxembourgFund currency CHFClose of financial year 31. MayTotal net assets (in mil.) 6.30Inception date 29.09.2009Management fee in % p.a. 1.30Total expense ratio (ex ante) in % 1.50Benchmark (BM)
CB CS SICAV One (Lux) IS Capital Gains Or. (Sfr)Unit Class Category B
(capital growth)
ISIN LU0439733121
Valor no. 10348472
EU taxation In scope - no tax
March 30, 2012Switzerland
Credit Suisse SICAV One (Lux) IndexSelection Capital GainsOriented (Sfr)Class B
Net performance in CHF (rebased to 100) and yearly performance 1)
2009 2010 2011 201285
90
95
100
105
110
-15%
-10%
-5%
0%
5%
10%
-0.3
-9.9
5.7
2.0
-4.3
5.4
CS SICAV One (Lux) IndexSelection Capital GainsOriented (Sfr) B
Yearly or year-to-date performance respectively(Fund)
CB CS SICAV One (Lux) IS Capital Gains Or. (Sfr)Yearly or year-to-date performance respectively(Benchmark)
Net performance in CHF 1)
1 month 3 months YTD 1 year 3 years 5 yearsFund 0.31 5.70 5.70 -5.46 - -Benchmark 0.59 5.39 5.39 -0.43 - -
Allocation asset classes in %
Equity 67.86Bonds 11.68Cash/CashEquivalents 11.59Alternatives 8.86
Allocation currencies in %
CHF 37.54USD 15.61EUR 12.88GBP 10.07JPY 6.36Others 17.53
Asset allocation in %Cash/Cash Equivalents Bonds Equity Alt. Inv. Total
Switzerland 11.59 5.78 15.41 - 32.79Emerging Markets - 1.50 11.23 - 12.73Euroland - 4.40 16.27 - 20.67UK - - 5.40 - 5.40USA - - 15.89 - 15.89Japan - - 3.65 - 3.65Others - - - 8.86 8.86Total 11.59 11.68 67.86 8.86 100.00
Investment policyThe investment objective of CS SICAV One (Lux)IndexSelection Capital Gains Oriented (Sfr) is toachieve the highest possible total return in Swissfrancs. The fund invests in a broadly diversifiedportfolio of index-linked instruments such asexchange traded funds (ETFs), investmentfunds, structured products, and derivatives. Thefund is invested worldwide in equities, bonds,currencies, commodities, and other alternativeinvestments.
Fund facts
Unit class currency CHF
Bloomberg ticker CSOICSB LX
Net asset value (NAV) 97.41
Fund statistics1 year 3 years
Annualized volatility in % 9.85 -Information ratio -2.60 -Tracking Error (Ex post) 2.00 -Maximum drawdown in % 2) -14.51 -2) Maximum drawdown is the most negative cumulative returnover a given time period.
DurationModified duration in years 4.42
Allocation of bonds in %Government 29.18Corporate Bonds 28.44High Yield Bonds 18.46Emerging Market Bonds 12.84Inflation Linked Bonds 11.08Total 100.00
Top 10 Holdings in %CS ETF (IE) on MSCI EMU 10.53CS ETF (Lux) on MSCI Em. Markets 9.34db x-trackers on SMI 8.96CS ETF (IE) S&P 500 8.61Comstage ETF SMI 4.25Ishares FTSE 100 4.24ZKB SXI Real Estate Funds Tracker 3.03CS ETF (IE) on Dow Jones Industrial 2.75UBS ETF MSCI Japan 2.75CS ETF (IE) on MSCI USA Small Cap 2.48Total 56.94
Source: Lipper, a Reuters Company
276
1) Historical performance indications and financial market scenarios are no guarantee for current or future performance. Performance indications do not consider commissions levied at subscription and/orredemption.
The disclaimer mentioned at the end of this document also applies to this page.
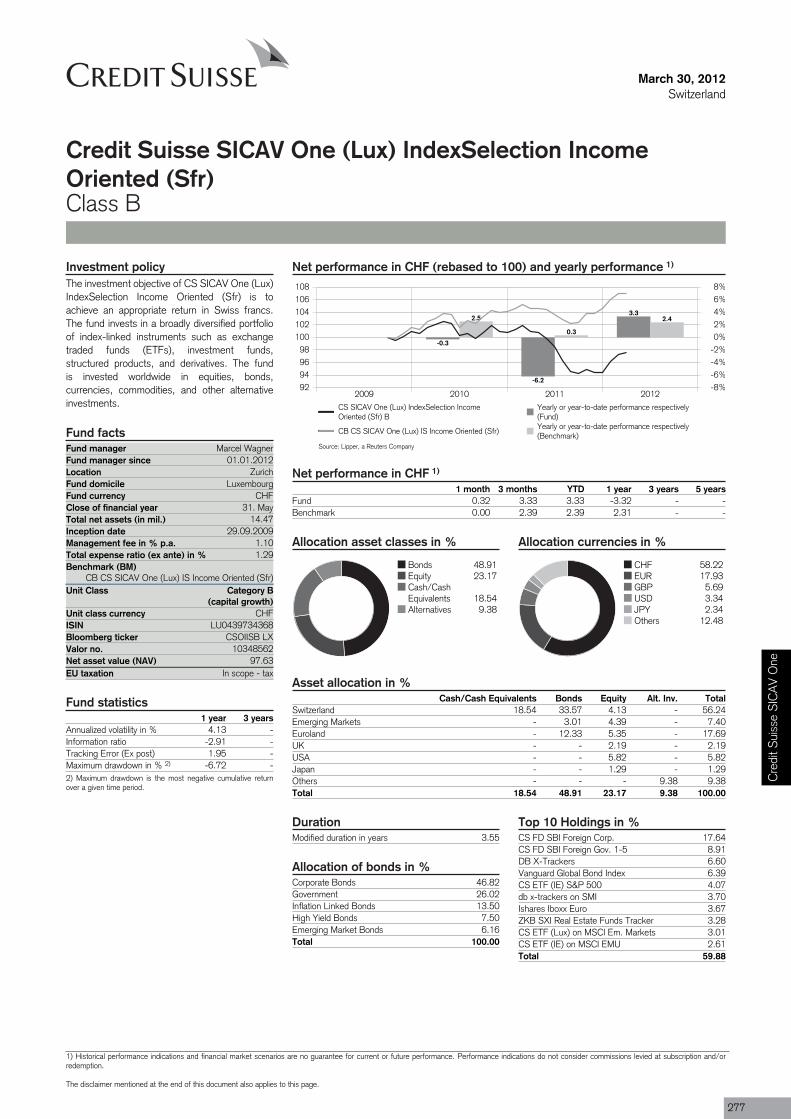
Fund manager Marcel WagnerFund manager since 01.01.2012Location ZurichFund domicile LuxembourgFund currency CHFClose of financial year 31. MayTotal net assets (in mil.) 14.47Inception date 29.09.2009Management fee in % p.a. 1.10Total expense ratio (ex ante) in % 1.29Benchmark (BM)
CB CS SICAV One (Lux) IS Income Oriented (Sfr)Unit Class Category B
(capital growth)
ISIN LU0439734368
Valor no. 10348562
EU taxation In scope - tax
March 30, 2012Switzerland
Credit Suisse SICAV One (Lux) IndexSelection IncomeOriented (Sfr)Class B
Net performance in CHF (rebased to 100) and yearly performance 1)
2009 2010 2011 201292949698
100102104106108
-8%-6%-4%-2%0%2%4%6%8%
-0.3
-6.2
3.32.5
0.3
2.4
CS SICAV One (Lux) IndexSelection IncomeOriented (Sfr) B
Yearly or year-to-date performance respectively(Fund)
CB CS SICAV One (Lux) IS Income Oriented (Sfr)Yearly or year-to-date performance respectively(Benchmark)
Net performance in CHF 1)
1 month 3 months YTD 1 year 3 years 5 yearsFund 0.32 3.33 3.33 -3.32 - -Benchmark 0.00 2.39 2.39 2.31 - -
Allocation asset classes in %
Bonds 48.91Equity 23.17Cash/CashEquivalents 18.54Alternatives 9.38
Allocation currencies in %
CHF 58.22EUR 17.93GBP 5.69USD 3.34JPY 2.34Others 12.48
Asset allocation in %Cash/Cash Equivalents Bonds Equity Alt. Inv. Total
Switzerland 18.54 33.57 4.13 - 56.24Emerging Markets - 3.01 4.39 - 7.40Euroland - 12.33 5.35 - 17.69UK - - 2.19 - 2.19USA - - 5.82 - 5.82Japan - - 1.29 - 1.29Others - - - 9.38 9.38Total 18.54 48.91 23.17 9.38 100.00
Investment policyThe investment objective of CS SICAV One (Lux)IndexSelection Income Oriented (Sfr) is toachieve an appropriate return in Swiss francs.The fund invests in a broadly diversified portfolioof index-linked instruments such as exchangetraded funds (ETFs), investment funds,structured products, and derivatives. The fundis invested worldwide in equities, bonds,currencies, commodities, and other alternativeinvestments.
Fund facts
Unit class currency CHF
Bloomberg ticker CSOIISB LX
Net asset value (NAV) 97.63
Fund statistics1 year 3 years
Annualized volatility in % 4.13 -Information ratio -2.91 -Tracking Error (Ex post) 1.95 -Maximum drawdown in % 2) -6.72 -2) Maximum drawdown is the most negative cumulative returnover a given time period.
DurationModified duration in years 3.55
Allocation of bonds in %Corporate Bonds 46.82Government 26.02Inflation Linked Bonds 13.50High Yield Bonds 7.50Emerging Market Bonds 6.16Total 100.00
Top 10 Holdings in %CS FD SBI Foreign Corp. 17.64CS FD SBI Foreign Gov. 1-5 8.91DB X-Trackers 6.60Vanguard Global Bond Index 6.39CS ETF (IE) S&P 500 4.07db x-trackers on SMI 3.70Ishares Iboxx Euro 3.67ZKB SXI Real Estate Funds Tracker 3.28CS ETF (Lux) on MSCI Em. Markets 3.01CS ETF (IE) on MSCI EMU 2.61Total 59.88
Source: Lipper, a Reuters Company
Cre
dit S
uiss
e S
ICA
V O
ne
1) Historical performance indications and financial market scenarios are no guarantee for current or future performance. Performance indications do not consider commissions levied at subscription and/orredemption.
The disclaimer mentioned at the end of this document also applies to this page.
277
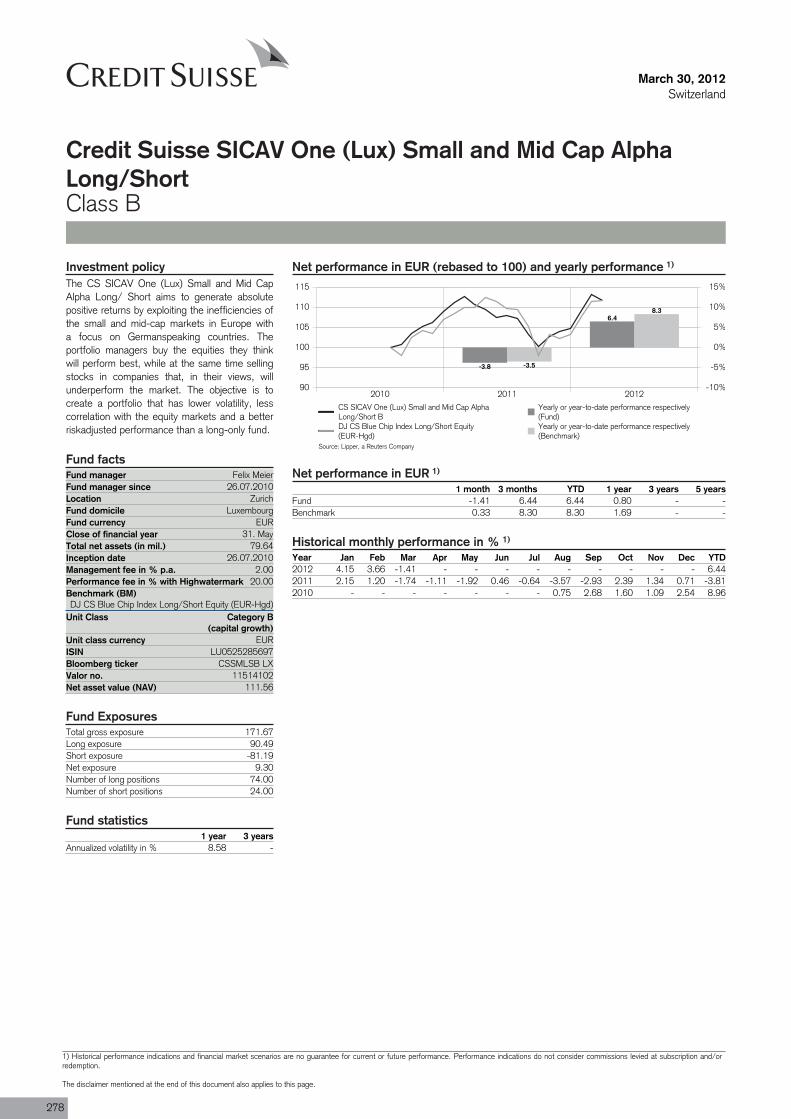
Fund manager Felix MeierFund manager since 26.07.2010Location ZurichFund domicile LuxembourgFund currency EURClose of financial year 31. MayTotal net assets (in mil.) 79.64Inception date 26.07.2010Management fee in % p.a. 2.00Performance fee in % with Highwatermark 20.00Benchmark (BM)DJ CS Blue Chip Index Long/Short Equity (EUR-Hgd)
Unit Class Category B(capital growth)
ISIN LU0525285697
Valor no. 11514102
March 30, 2012Switzerland
Credit Suisse SICAV One (Lux) Small and Mid Cap AlphaLong/ShortClass B
Net performance in EUR (rebased to 100) and yearly performance 1)
2010 2011 201290
95
100
105
110
115
-10%
-5%
0%
5%
10%
15%
-3.8
6.4
-3.5
8.3
CS SICAV One (Lux) Small and Mid Cap AlphaLong/Short B
Yearly or year-to-date performance respectively(Fund)
DJ CS Blue Chip Index Long/Short Equity(EUR-Hgd)
Yearly or year-to-date performance respectively(Benchmark)
Net performance in EUR 1)
1 month 3 months YTD 1 year 3 years 5 yearsFund -1.41 6.44 6.44 0.80 - -Benchmark 0.33 8.30 8.30 1.69 - -
Historical monthly performance in % 1)
Year Jan Feb Mar Apr May Jun Jul Aug Sep Oct Nov Dec YTD2012 4.15 3.66 -1.41 - - - - - - - - - 6.442011 2.15 1.20 -1.74 -1.11 -1.92 0.46 -0.64 -3.57 -2.93 2.39 1.34 0.71 -3.812010 - - - - - - - 0.75 2.68 1.60 1.09 2.54 8.96
Investment policyThe CS SICAV One (Lux) Small and Mid CapAlpha Long/ Short aims to generate absolutepositive returns by exploiting the inefficiencies ofthe small and mid-cap markets in Europe witha focus on Germanspeaking countries. Theportfolio managers buy the equities they thinkwill perform best, while at the same time sellingstocks in companies that, in their views, willunderperform the market. The objective is tocreate a portfolio that has lower volatility, lesscorrelation with the equity markets and a betterriskadjusted performance than a long-only fund.
Fund facts
Unit class currency EUR
Bloomberg ticker CSSMLSB LX
Net asset value (NAV) 111.56
Fund ExposuresTotal gross exposure 171.67Long exposure 90.49Short exposure -81.19Net exposure 9.30Number of long positions 74.00Number of short positions 24.00
Fund statistics1 year 3 years
Annualized volatility in % 8.58 -
Source: Lipper, a Reuters Company
278
1) Historical performance indications and financial market scenarios are no guarantee for current or future performance. Performance indications do not consider commissions levied at subscription and/orredemption.
The disclaimer mentioned at the end of this document also applies to this page.

Net Exposure Countries
-6% -4% -2% 0% 2% 4% 6% 8% 10% 12%
United KingdomAustriaFrance
GibraltarDenmark
ItalyBelgium
GermanySpain
JerseyLuxembourgSwitzerland
SwedenFinland
Netherlands
9.96%
3.26%
1.88%
1.16%
0.93%
0.59%
0.31%
0.13%
0.00%
0.00%
-0.40%
-0.76%
-0.89%
-1.57%
-5.29%
Allocation by Country in %Long Short Net
Austria 3.26 0.00 3.26Belgium 1.41 -1.10 0.31Denmark 0.93 0.00 0.93Finland 0.00 -1.57 -1.57France 1.88 0.00 1.88Germany 66.27 -66.14 0.13Gibraltar 1.16 - 1.16Italy 1.64 -1.05 0.59Jersey 0.00 0.00 0.00Luxembourg - -0.40 -0.40Netherlands 3.22 -8.51 -5.29Spain 0.00 0.00 0.00Sweden 0.74 -1.62 -0.89Switzerland 0.03 -0.79 -0.76United Kingdom 9.96 - 9.96
Allocation by Sector in %Long Short Net
Consumer Discretionary 28.45 -18.49 9.95Consumer Staples 2.39 -2.64 -0.25Energy 0.88 -0.32 0.56Financials 11.60 -8.55 3.05Health Care 4.28 -7.02 -2.73Industrials 22.05 -27.32 -5.27Information Technology 9.27 -3.56 5.70Materials 10.51 -11.56 -1.05Telecommunication Services 1.06 -1.00 0.07Utilities 0.00 -0.72 -0.72
Net Exposure Sectors
-6% -4% -2% 0% 2% 4% 6% 8% 10% 12%
Consumer Discretionary
Information Technology
Financials
Energy
Telecommunication Services
Consumer Staples
Utilities
Materials
Health Care
Industrials
9.95%
5.70%
3.05%
0.56%
0.07%
-0.25%
-0.72%
-1.05%
-2.73%
-5.27%
Cre
dit S
uiss
e S
ICA
V O
ne
1) Historical performance indications and financial market scenarios are no guarantee for current or future performance. Performance indications do not consider commissions levied at subscription and/orredemption.
The disclaimer mentioned at the end of this document also applies to this page.
279
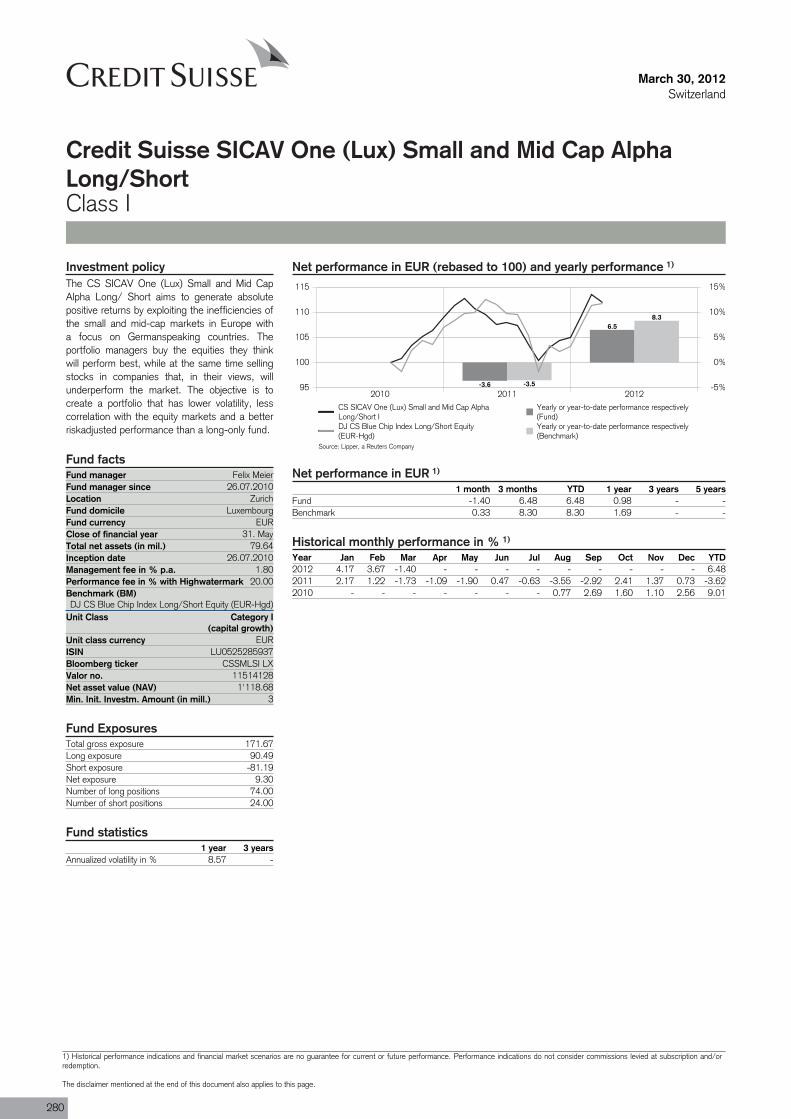
Fund manager Felix MeierFund manager since 26.07.2010Location ZurichFund domicile LuxembourgFund currency EURClose of financial year 31. MayTotal net assets (in mil.) 79.64Inception date 26.07.2010Management fee in % p.a. 1.80Performance fee in % with Highwatermark 20.00Benchmark (BM)DJ CS Blue Chip Index Long/Short Equity (EUR-Hgd)
Unit Class Category I(capital growth)
ISIN LU0525285937
Valor no. 11514128
Min. Init. Investm. Amount (in mill.) 3
March 30, 2012Switzerland
Credit Suisse SICAV One (Lux) Small and Mid Cap AlphaLong/ShortClass I
Net performance in EUR (rebased to 100) and yearly performance 1)
2010 2011 201295
100
105
110
115
-5%
0%
5%
10%
15%
-3.6
6.5
-3.5
8.3
CS SICAV One (Lux) Small and Mid Cap AlphaLong/Short I
Yearly or year-to-date performance respectively(Fund)
DJ CS Blue Chip Index Long/Short Equity(EUR-Hgd)
Yearly or year-to-date performance respectively(Benchmark)
Net performance in EUR 1)
1 month 3 months YTD 1 year 3 years 5 yearsFund -1.40 6.48 6.48 0.98 - -Benchmark 0.33 8.30 8.30 1.69 - -
Historical monthly performance in % 1)
Year Jan Feb Mar Apr May Jun Jul Aug Sep Oct Nov Dec YTD2012 4.17 3.67 -1.40 - - - - - - - - - 6.482011 2.17 1.22 -1.73 -1.09 -1.90 0.47 -0.63 -3.55 -2.92 2.41 1.37 0.73 -3.622010 - - - - - - - 0.77 2.69 1.60 1.10 2.56 9.01
Investment policyThe CS SICAV One (Lux) Small and Mid CapAlpha Long/ Short aims to generate absolutepositive returns by exploiting the inefficiencies ofthe small and mid-cap markets in Europe witha focus on Germanspeaking countries. Theportfolio managers buy the equities they thinkwill perform best, while at the same time sellingstocks in companies that, in their views, willunderperform the market. The objective is tocreate a portfolio that has lower volatility, lesscorrelation with the equity markets and a betterriskadjusted performance than a long-only fund.
Fund facts
Unit class currency EUR
Bloomberg ticker CSSMLSI LX
Net asset value (NAV) 1'118.68
Fund ExposuresTotal gross exposure 171.67Long exposure 90.49Short exposure -81.19Net exposure 9.30Number of long positions 74.00Number of short positions 24.00
Fund statistics1 year 3 years
Annualized volatility in % 8.57 -
Source: Lipper, a Reuters Company
280
1) Historical performance indications and financial market scenarios are no guarantee for current or future performance. Performance indications do not consider commissions levied at subscription and/orredemption.
The disclaimer mentioned at the end of this document also applies to this page.
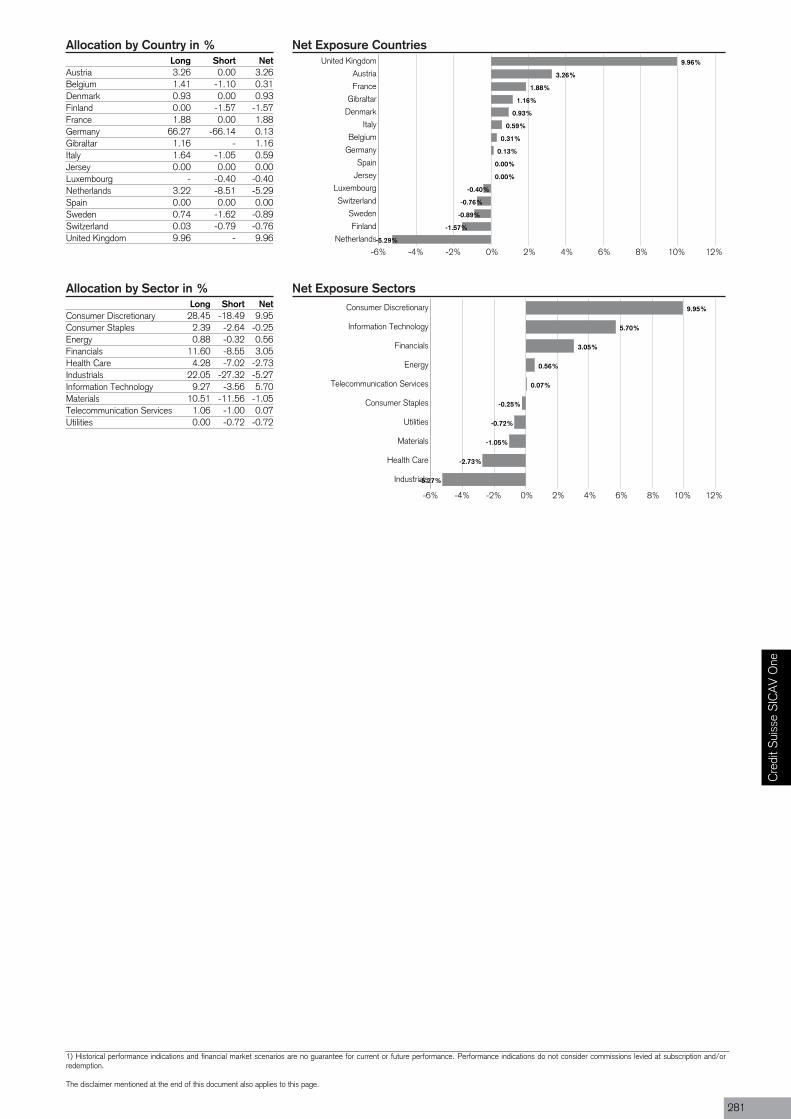
Net Exposure Countries
-6% -4% -2% 0% 2% 4% 6% 8% 10% 12%
United KingdomAustriaFrance
GibraltarDenmark
ItalyBelgium
GermanySpain
JerseyLuxembourgSwitzerland
SwedenFinland
Netherlands
9.96%
3.26%
1.88%
1.16%
0.93%
0.59%
0.31%
0.13%
0.00%
0.00%
-0.40%
-0.76%
-0.89%
-1.57%
-5.29%
Allocation by Country in %Long Short Net
Austria 3.26 0.00 3.26Belgium 1.41 -1.10 0.31Denmark 0.93 0.00 0.93Finland 0.00 -1.57 -1.57France 1.88 0.00 1.88Germany 66.27 -66.14 0.13Gibraltar 1.16 - 1.16Italy 1.64 -1.05 0.59Jersey 0.00 0.00 0.00Luxembourg - -0.40 -0.40Netherlands 3.22 -8.51 -5.29Spain 0.00 0.00 0.00Sweden 0.74 -1.62 -0.89Switzerland 0.03 -0.79 -0.76United Kingdom 9.96 - 9.96
Allocation by Sector in %Long Short Net
Consumer Discretionary 28.45 -18.49 9.95Consumer Staples 2.39 -2.64 -0.25Energy 0.88 -0.32 0.56Financials 11.60 -8.55 3.05Health Care 4.28 -7.02 -2.73Industrials 22.05 -27.32 -5.27Information Technology 9.27 -3.56 5.70Materials 10.51 -11.56 -1.05Telecommunication Services 1.06 -1.00 0.07Utilities 0.00 -0.72 -0.72
Net Exposure Sectors
-6% -4% -2% 0% 2% 4% 6% 8% 10% 12%
Consumer Discretionary
Information Technology
Financials
Energy
Telecommunication Services
Consumer Staples
Utilities
Materials
Health Care
Industrials
9.95%
5.70%
3.05%
0.56%
0.07%
-0.25%
-0.72%
-1.05%
-2.73%
-5.27%
Cre
dit S
uiss
e S
ICA
V O
ne
1) Historical performance indications and financial market scenarios are no guarantee for current or future performance. Performance indications do not consider commissions levied at subscription and/orredemption.
The disclaimer mentioned at the end of this document also applies to this page.
281
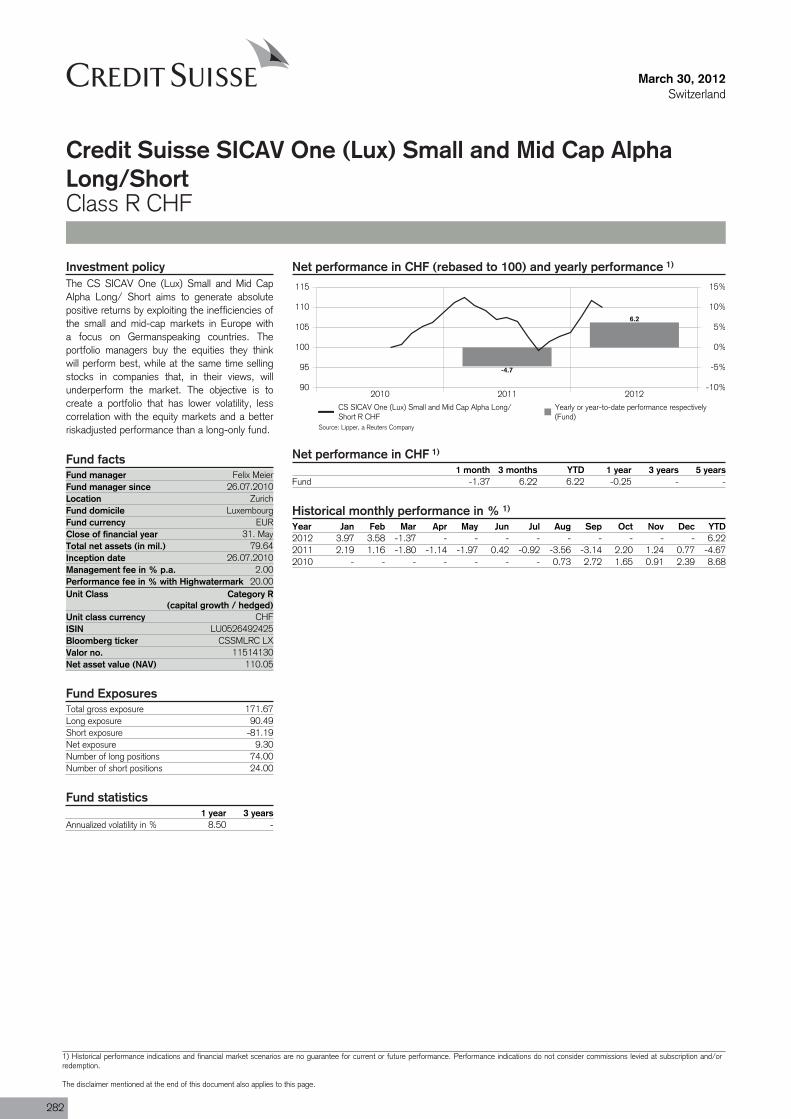
Fund manager Felix MeierFund manager since 26.07.2010Location ZurichFund domicile LuxembourgFund currency EURClose of financial year 31. MayTotal net assets (in mil.) 79.64Inception date 26.07.2010Management fee in % p.a. 2.00Performance fee in % with Highwatermark 20.00Unit Class Category R
(capital growth / hedged)
ISIN LU0526492425
Valor no. 11514130
March 30, 2012Switzerland
Credit Suisse SICAV One (Lux) Small and Mid Cap AlphaLong/ShortClass R CHF
Net performance in CHF (rebased to 100) and yearly performance 1)
2010 2011 201290
95
100
105
110
115
-10%
-5%
0%
5%
10%
15%
-4.7
6.2
CS SICAV One (Lux) Small and Mid Cap Alpha Long/Short R CHF
Yearly or year-to-date performance respectively(Fund)
Net performance in CHF 1)
1 month 3 months YTD 1 year 3 years 5 yearsFund -1.37 6.22 6.22 -0.25 - -
Historical monthly performance in % 1)
Year Jan Feb Mar Apr May Jun Jul Aug Sep Oct Nov Dec YTD2012 3.97 3.58 -1.37 - - - - - - - - - 6.222011 2.19 1.16 -1.80 -1.14 -1.97 0.42 -0.92 -3.56 -3.14 2.20 1.24 0.77 -4.672010 - - - - - - - 0.73 2.72 1.65 0.91 2.39 8.68
Investment policyThe CS SICAV One (Lux) Small and Mid CapAlpha Long/ Short aims to generate absolutepositive returns by exploiting the inefficiencies ofthe small and mid-cap markets in Europe witha focus on Germanspeaking countries. Theportfolio managers buy the equities they thinkwill perform best, while at the same time sellingstocks in companies that, in their views, willunderperform the market. The objective is tocreate a portfolio that has lower volatility, lesscorrelation with the equity markets and a betterriskadjusted performance than a long-only fund.
Fund facts
Unit class currency CHF
Bloomberg ticker CSSMLRC LX
Net asset value (NAV) 110.05
Fund ExposuresTotal gross exposure 171.67Long exposure 90.49Short exposure -81.19Net exposure 9.30Number of long positions 74.00Number of short positions 24.00
Fund statistics1 year 3 years
Annualized volatility in % 8.50 -
Source: Lipper, a Reuters Company
282
1) Historical performance indications and financial market scenarios are no guarantee for current or future performance. Performance indications do not consider commissions levied at subscription and/orredemption.
The disclaimer mentioned at the end of this document also applies to this page.

Net Exposure Countries
-6% -4% -2% 0% 2% 4% 6% 8% 10% 12%
United KingdomAustriaFrance
GibraltarDenmark
ItalyBelgium
GermanySpain
JerseyLuxembourgSwitzerland
SwedenFinland
Netherlands
9.96%
3.26%
1.88%
1.16%
0.93%
0.59%
0.31%
0.13%
0.00%
0.00%
-0.40%
-0.76%
-0.89%
-1.57%
-5.29%
Allocation by Country in %Long Short Net
Austria 3.26 0.00 3.26Belgium 1.41 -1.10 0.31Denmark 0.93 0.00 0.93Finland 0.00 -1.57 -1.57France 1.88 0.00 1.88Germany 66.27 -66.14 0.13Gibraltar 1.16 - 1.16Italy 1.64 -1.05 0.59Jersey 0.00 0.00 0.00Luxembourg - -0.40 -0.40Netherlands 3.22 -8.51 -5.29Spain 0.00 0.00 0.00Sweden 0.74 -1.62 -0.89Switzerland 0.03 -0.79 -0.76United Kingdom 9.96 - 9.96
Allocation by Sector in %Long Short Net
Consumer Discretionary 28.45 -18.49 9.95Consumer Staples 2.39 -2.64 -0.25Energy 0.88 -0.32 0.56Financials 11.60 -8.55 3.05Health Care 4.28 -7.02 -2.73Industrials 22.05 -27.32 -5.27Information Technology 9.27 -3.56 5.70Materials 10.51 -11.56 -1.05Telecommunication Services 1.06 -1.00 0.07Utilities 0.00 -0.72 -0.72
Net Exposure Sectors
-6% -4% -2% 0% 2% 4% 6% 8% 10% 12%
Consumer Discretionary
Information Technology
Financials
Energy
Telecommunication Services
Consumer Staples
Utilities
Materials
Health Care
Industrials
9.95%
5.70%
3.05%
0.56%
0.07%
-0.25%
-0.72%
-1.05%
-2.73%
-5.27%
Cre
dit S
uiss
e S
ICA
V O
ne
1) Historical performance indications and financial market scenarios are no guarantee for current or future performance. Performance indications do not consider commissions levied at subscription and/orredemption.
The disclaimer mentioned at the end of this document also applies to this page.
283
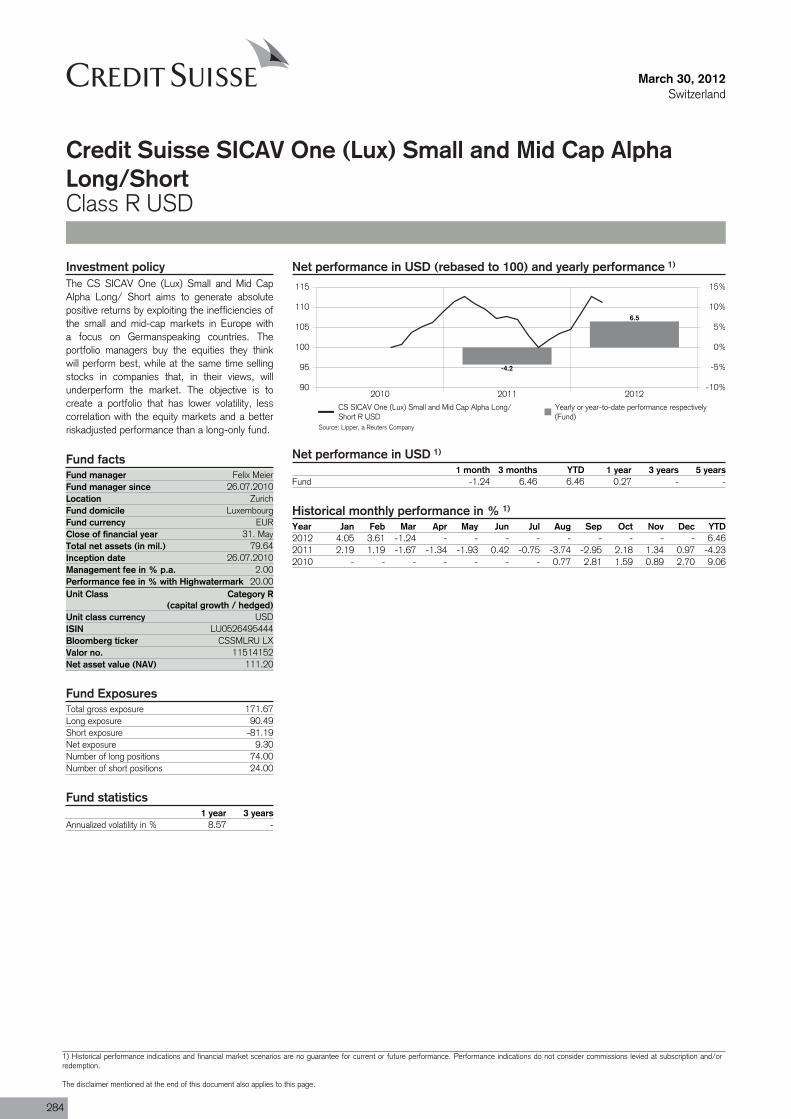
Fund manager Felix MeierFund manager since 26.07.2010Location ZurichFund domicile LuxembourgFund currency EURClose of financial year 31. MayTotal net assets (in mil.) 79.64Inception date 26.07.2010Management fee in % p.a. 2.00Performance fee in % with Highwatermark 20.00Unit Class Category R
(capital growth / hedged)
ISIN LU0526495444
Valor no. 11514152
March 30, 2012Switzerland
Credit Suisse SICAV One (Lux) Small and Mid Cap AlphaLong/ShortClass R USD
Net performance in USD (rebased to 100) and yearly performance 1)
2010 2011 201290
95
100
105
110
115
-10%
-5%
0%
5%
10%
15%
-4.2
6.5
CS SICAV One (Lux) Small and Mid Cap Alpha Long/Short R USD
Yearly or year-to-date performance respectively(Fund)
Net performance in USD 1)
1 month 3 months YTD 1 year 3 years 5 yearsFund -1.24 6.46 6.46 0.27 - -
Historical monthly performance in % 1)
Year Jan Feb Mar Apr May Jun Jul Aug Sep Oct Nov Dec YTD2012 4.05 3.61 -1.24 - - - - - - - - - 6.462011 2.19 1.19 -1.67 -1.34 -1.93 0.42 -0.75 -3.74 -2.95 2.18 1.34 0.97 -4.232010 - - - - - - - 0.77 2.81 1.59 0.89 2.70 9.06
Investment policyThe CS SICAV One (Lux) Small and Mid CapAlpha Long/ Short aims to generate absolutepositive returns by exploiting the inefficiencies ofthe small and mid-cap markets in Europe witha focus on Germanspeaking countries. Theportfolio managers buy the equities they thinkwill perform best, while at the same time sellingstocks in companies that, in their views, willunderperform the market. The objective is tocreate a portfolio that has lower volatility, lesscorrelation with the equity markets and a betterriskadjusted performance than a long-only fund.
Fund facts
Unit class currency USD
Bloomberg ticker CSSMLRU LX
Net asset value (NAV) 111.20
Fund ExposuresTotal gross exposure 171.67Long exposure 90.49Short exposure -81.19Net exposure 9.30Number of long positions 74.00Number of short positions 24.00
Fund statistics1 year 3 years
Annualized volatility in % 8.57 -
Source: Lipper, a Reuters Company
284
1) Historical performance indications and financial market scenarios are no guarantee for current or future performance. Performance indications do not consider commissions levied at subscription and/orredemption.
The disclaimer mentioned at the end of this document also applies to this page.

Net Exposure Countries
-6% -4% -2% 0% 2% 4% 6% 8% 10% 12%
United KingdomAustriaFrance
GibraltarDenmark
ItalyBelgium
GermanySpain
JerseyLuxembourgSwitzerland
SwedenFinland
Netherlands
9.96%
3.26%
1.88%
1.16%
0.93%
0.59%
0.31%
0.13%
0.00%
0.00%
-0.40%
-0.76%
-0.89%
-1.57%
-5.29%
Allocation by Country in %Long Short Net
Austria 3.26 0.00 3.26Belgium 1.41 -1.10 0.31Denmark 0.93 0.00 0.93Finland 0.00 -1.57 -1.57France 1.88 0.00 1.88Germany 66.27 -66.14 0.13Gibraltar 1.16 - 1.16Italy 1.64 -1.05 0.59Jersey 0.00 0.00 0.00Luxembourg - -0.40 -0.40Netherlands 3.22 -8.51 -5.29Spain 0.00 0.00 0.00Sweden 0.74 -1.62 -0.89Switzerland 0.03 -0.79 -0.76United Kingdom 9.96 - 9.96
Allocation by Sector in %Long Short Net
Consumer Discretionary 28.45 -18.49 9.95Consumer Staples 2.39 -2.64 -0.25Energy 0.88 -0.32 0.56Financials 11.60 -8.55 3.05Health Care 4.28 -7.02 -2.73Industrials 22.05 -27.32 -5.27Information Technology 9.27 -3.56 5.70Materials 10.51 -11.56 -1.05Telecommunication Services 1.06 -1.00 0.07Utilities 0.00 -0.72 -0.72
Net Exposure Sectors
-6% -4% -2% 0% 2% 4% 6% 8% 10% 12%
Consumer Discretionary
Information Technology
Financials
Energy
Telecommunication Services
Consumer Staples
Utilities
Materials
Health Care
Industrials
9.95%
5.70%
3.05%
0.56%
0.07%
-0.25%
-0.72%
-1.05%
-2.73%
-5.27%
Cre
dit S
uiss
e S
ICA
V O
ne
1) Historical performance indications and financial market scenarios are no guarantee for current or future performance. Performance indications do not consider commissions levied at subscription and/orredemption.
The disclaimer mentioned at the end of this document also applies to this page.
285
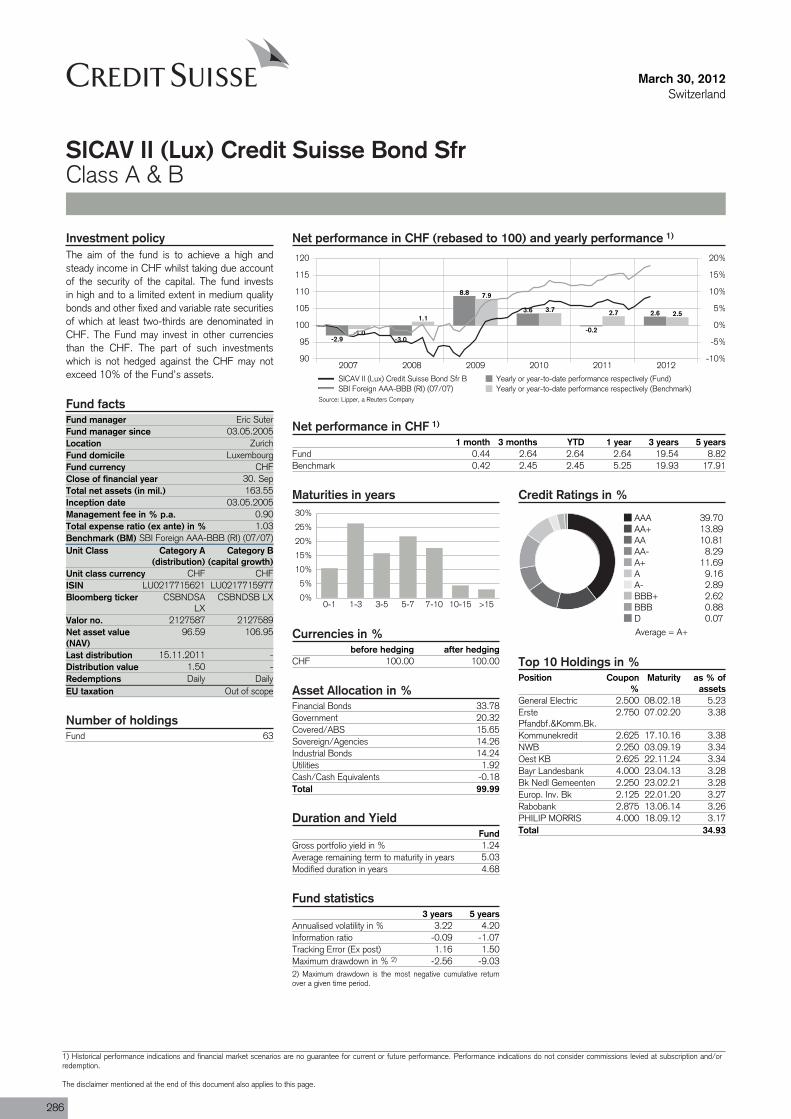
Fund manager Eric SuterFund manager since 03.05.2005Location ZurichFund domicile LuxembourgFund currency CHFClose of financial year 30. SepTotal net assets (in mil.) 163.55Inception date 03.05.2005Management fee in % p.a. 0.90Total expense ratio (ex ante) in % 1.03Benchmark (BM) SBI Foreign AAA-BBB (RI) (07/07)Unit Class Category A
(distribution)
ISIN LU0217715621
Valor no. 2127587
Last distribution 15.11.2011Distribution value 1.50Redemptions DailyEU taxation Out of scope
Fund 63
March 30, 2012Switzerland
SICAV II (Lux) Credit Suisse Bond SfrClass A & B
Net performance in CHF (rebased to 100) and yearly performance 1)
2007 2008 2009 2010 2011 201290
95
100
105
110
115
120
-10%
-5%
0%
5%
10%
15%
20%
-2.9 -3.0
8.8
3.6
-0.2
2.6
-1.0
1.1
7.9
3.7 2.7 2.5
SICAV II (Lux) Credit Suisse Bond Sfr B Yearly or year-to-date performance respectively (Fund)SBI Foreign AAA-BBB (RI) (07/07) Yearly or year-to-date performance respectively (Benchmark)
Net performance in CHF 1)
1 month 3 months YTD 1 year 3 years 5 yearsFund 0.44 2.64 2.64 2.64 19.54 8.82Benchmark 0.42 2.45 2.45 5.25 19.93 17.91
Maturities in years
0%
5%
10%
15%
20%
25%
30%
0-1 1-3 3-5 5-7 7-10 10-15 >15
Currencies in %before hedging after hedging
CHF 100.00 100.00
Asset Allocation in %Financial Bonds 33.78Government 20.32Covered/ABS 15.65Sovereign/Agencies 14.26Industrial Bonds 14.24Utilities 1.92Cash/Cash Equivalents -0.18Total 99.99
Duration and YieldFund
Gross portfolio yield in % 1.24Average remaining term to maturity in years 5.03Modified duration in years 4.68
Fund statistics3 years 5 years
Annualised volatility in % 3.22 4.20Information ratio -0.09 -1.07Tracking Error (Ex post) 1.16 1.50Maximum drawdown in % 2) -2.56 -9.032) Maximum drawdown is the most negative cumulative returnover a given time period.
Credit Ratings in %
AAA 39.70AA+ 13.89AA 10.81AA- 8.29A+ 11.69A 9.16A- 2.89BBB+ 2.62BBB 0.88D 0.07
Top 10 Holdings in %Position Coupon
%Maturity as % of
assetsGeneral Electric 2.500 08.02.18 5.23ErstePfandbf.&Komm.Bk.
2.750 07.02.20 3.38
Kommunekredit 2.625 17.10.16 3.38NWB 2.250 03.09.19 3.34Oest KB 2.625 22.11.24 3.34Bayr Landesbank 4.000 23.04.13 3.28Bk Nedl Gemeenten 2.250 23.02.21 3.28Europ. Inv. Bk 2.125 22.01.20 3.27Rabobank 2.875 13.06.14 3.26PHILIP MORRIS 4.000 18.09.12 3.17Total 34.93
Investment policyThe aim of the fund is to achieve a high andsteady income in CHF whilst taking due accountof the security of the capital. The fund investsin high and to a limited extent in medium qualitybonds and other fixed and variable rate securitiesof which at least two-thirds are denominated inCHF. The Fund may invest in other currenciesthan the CHF. The part of such investmentswhich is not hedged against the CHF may notexceed 10% of the Fund’s assets.
Fund facts
Category B(capital growth)
Unit class currency CHF CHFLU0217715977
Bloomberg ticker CSBNDSALX
CSBNDSB LX
2127589Net asset value(NAV)
96.59 106.95
--
Daily
Number of holdings
Source: Lipper, a Reuters Company
Average = A+
286
1) Historical performance indications and financial market scenarios are no guarantee for current or future performance. Performance indications do not consider commissions levied at subscription and/orredemption.
The disclaimer mentioned at the end of this document also applies to this page.

March 30, 2012Switzerland
SICAV II (Lux) Credit Suisse Bond SfrClass A & B
Review previous quarter 3)
Substantial injections of liquidity by the ECB andthe restructuring of the Greek government'sdebts helped stabilize markets in Q1 2012.There are still structural problems relating toEuropean borrowers (which are not to beunderestimated) and heterogeneous globalgrowth patterns. Nevertheless, the Swisseconomy narrowly avoided recession thanks todomestic consumption and high demand forSwiss watches and pharmaceutical products inother countries. The SNB stuck to its guns and
maintained its expansive monetary policy, onceagain confirming a minimum exchange rate of1.20 francs to the euro.
Interest rates remained very low for all termsin the quarter under review. The 10-year swaprate even dipped below the 1% mark in earlyMarch to 0.99%, setting a new record low. Whileshort-term Confederation bonds of up to threeyears still exhibited negative yields at the start ofthe reporting period, the curve has since returned
to normal.
At the end of the quarter, the 3-month CHFLIBOR was 6bps higher at 0.11%, while theyield on 2-year Confederation bonds rose to0.02% (+6bps) and 10-year bonds came in at0.85% (+21bps). The performance of the firstquarter was mostly positive thanks to demandof the investors for high yielding bonds whichresulted in a reduction of the credit spreads.
Outlook for the market 3)
While the US economy performed surprisinglywell, production in Japan and Europe stagnated.Switzerland's GDP managed to grow at a rateof 0.1% in Q4 2011 despite the continuousstrength of the Swiss franc. A number of leadingindicators are showing early signs of stabilization,which could suggest that the economy hasbottomed out. The Swiss economy is dependenton global economic trends, and it remains to beseen whether the progress made with regard toovercoming the European sovereign debt crisiswill bring a lasting improvement to the situation.That said, a resurgence of the debt crisis cannot
be ruled out. Other geopolitical tensions couldlead to increased volatility in commodity prices. Inits first assessment of monetary policy in March2012 the SNB maintained its expansive courseand confirmed the minimum exchange rate of1.20 francs to the euro. The target range forthe CHF 3-month LIBOR is still 0-0.25%, andliquidity is still being kept high. On the otherhand, inflation is expected to rise modestly(2013: 0.3% and 2014: 0.6%). Also, theforecast for economic growth has been revisedupwards to 1% for 2012.
For the first time since last year the score ofour interest rate factor model turned negative asthe more friendly fundamental picture suggestshigher yields going forward. The technical inputalso changed to negative due to an overboughtsituation in the short term. The behavioral inputalso neutralized because of the recent strongflattening of the yield curve. We will reduce ourduration in the portfolios towards a shorterposition than the benchmark. We recommendtop quality issues and would increase thediversification in the portfolio as even somefrequent issuers have become expensive.
Portfolio ManagementEric Suter, Director, is a senior portfolio manager. He heads the Swiss Fixed Income Team and is responsible for the Swiss Fixed Incomeinvestment decision process. Eric joined CS Group in 1983 and worked in trading, product development and structuring of fixed incomeproducts. In 1995 he moved to fixed income asset management. He received a Bachelor in Business Administration from the KaderschuleZurich (KSZ), is a Certified International Investment Analyst (CIIA) and a member of the Swiss Bond Commission. Eric Suter, Director,leitet das Schweizer Franken Obligationen Team und ist verantwortlich für den Schweizer Franken Anlageprozess. Er stiess 1983 zur CSGroup und arbeitete im Handel, der Produkteentwicklung sowie in der Strukturierung von Zinsprodukten. 1995 wechselte er insObligationen Portfolio Management. Hr. Suter hat einen Abschluss in Betriebsökonomie der Kaderschule Zürich (KSZ), ist dipl.Finanzanalytiker und Vermögensverwalter (AZEK) sowie Mitglied der Schweizer Obligationenkommission (OKS).
Eric Suter, Director, dirige l'équipe Obligations CHF. Il a rejoint le CS Group en 1983 et a travaillé dans la vente, le développement produits ainsi que lastructuration de produits obligataires. En 1995, il est passé dans le domaine Portfolio Management Obligations. E. Suter dispose de diplômes en économied'entreprise de l'Ecole de cadres de Zurich (KSZ), d'analyste financier et gestionnaire de fortune (CFPI) et est membre de la Commission Suisse desObligations (OKS).
Cre
dit S
uiss
e S
ICA
V II
3) If not expressly indicated otherwise, all quantitative data contained in this comment is based on Lipper, Bloomberg or Datastream.
287

Fund manager Convertible Bonds TeamFund manager since 01.08.2008Location ZurichFund domicile LuxembourgFund currency USDClose of financial year 30. SepTotal net assets (in mil.) 81.57Inception date 12.10.2007Management fee in % p.a. 1.20Total expense ratio (ex ante) in % 1.36Benchmark (BM)UBS Global CB Focus Inv.Gr. (RI) (USD-Hgd) (12/09)Unit Class Category B
(capital growth)
ISIN LU0315566785
Valor no. 3323024
Redemptions DailyEU taxation Out of scope
Fund 48
March 30, 2012Switzerland
SICAV II (Lux) Credit Suisse Global ConvertiblesClass B USD
Net performance in USD (rebased to 100) and yearly performance 1)
2007 2008 2009 2010 2011 20125060708090
100110120130
-50%-40%-30%-20%-10%
0%10%20%30%
-26.4
20.5
4.6
-3.4
5.3
-33.8
24.5
5.1
-2.1
5.7
SICAV II (Lux) Credit Suisse Global ConvertiblesB
Yearly or year-to-date performance respectively (Fund)
UBS Global CB Focus Inv.Gr. (RI) (USD-Hgd)(12/09)
Yearly or year-to-date performance respectively(Benchmark)
Net performance in USD 1)
1 month 3 months YTD 1 year 3 years 5 yearsFund -0.15 5.32 5.32 0.05 36.08 -Benchmark 0.11 5.73 5.73 1.68 37.70 -
Sectors in %Consumer Goods (non-cyclical) 21.86Technology 14.59Financials 14.42Consumer Goods (cyclical) 9.03Basic Materials 8.55Industrials 6.84Communication 6.69Cash/Cash Equivalents 4.01Others 14.00
Credit Ratings in %
AAA 5.38AA (Bucket) 3.50A (Bucket) 50.17BBB (Bucket) 39.93BB (Bucket) 1.02
Top 10 Holdings in %Position Coupon % Maturity as % of
assetsOrix 1.000 31.03.14 5.64Amgen 0.375 01.02.13 5.46Medtronic 1.625 15.04.13 4.42Lukoil Intl. Fin. 2.625 16.06.15 4.16Arcelor Mittal 7.250 01.04.14 3.91Intel 2.950 15.12.35 3.88Aeon 0.300 22.11.13 3.69Microsoft 0.000 15.06.13 3.40Gilead Sciences 1.000 01.05.14 3.37KFW 3.250 27.06.13 3.30Total 41.23
Duration and Yield 3)
Delta in % 42.30Gross portfolio yield in % -2.54Average remaining term to maturity in years 4.02Modified duration in years 3.352) Due to the optionalities involved in the structure of convertiblebonds, certain assumptions must be applied in order to calculatethese figures.
Fund statistics1 year 3 years
Annualized volatility in % 7.16 8.00Information ratio -3.25 -0.31Tracking Error (Ex post) 0.50 1.29Maximum drawdown in % 3) -7.29 -7.523) Maximum drawdown is the most negative cumulative returnover a given time period.
Investment policyThe fund provides an actively managed defensiveexposure to global convertibles as a mostefficient multi-asset class strategy involvingequity, credit and volatility on a globally diversifiedbasis, with the aim of achieving superiorrisk-adjusted returns. The risk profile iscomparable to that of a corporate bond fund.The fund invests mainly in convertible securitiesissued by public and private issuers. Traditionalbonds, equity and structured products may beheld in complement. Investments are madeglobally with no restrictions as to country orcurrency.
Fund facts
Unit class currency USD
Bloomberg ticker CS2GLCB LX
Net asset value (NAV) 93.23
Number of holdings
Source: Lipper, a Reuters Company
Average = BBB
288
1) Historical performance indications and financial market scenarios are no guarantee for current or future performance. Performance indications do not consider commissions levied at subscription and/orredemption.
The disclaimer mentioned at the end of this document also applies to this page.

March 30, 2012Switzerland
SICAV II (Lux) Credit Suisse Global ConvertiblesClass B USD
Review previous quarter 4)
Global convertibles had a great start to the yearand returned 8.8% in Q1 2012 (currencyhedged), whereas the investment grade part ofthe universe showed a return of 5.7%. Thispositive performance was mainly attributed tostrong global equity markets and further spreadtightening.
In general, the investment environment improvedand rising investor sentiment gave equity marketsthe needed support for growth. Since themassive interventions by the ECB, financial
system stability has improved and the downsiderisk to the global economy has been reduced. Inthe US, with the unemployment rate remainingstable at 8.3% and unemployment benefit claimsfalling to the lowest level since April 2008,consumer confidence reached thesecond-highest level in four years and retail salesclimbed by most in five months. On the otherhand, inflation rose in February the most in 10months, mainly driven by gasoline prices.
In the BRIC countries (especially China and
India), stimulating monetary policy improved theoutlook for risky assets and equity marketscontinued to rise in light of the momentum builtup in December. With regards to convertiblessector performances, all were in positive territory.The highest contributions came fromTechnology, Industrial Goods and Healthcare,whereas Food & Beverage, Chemicals and Retailwere more or less flat. Convertibles primarymarket activity of USD 8.8bn in March, thehighest since June 2011, brought the totalissuance in the first quarter to USD 15.1bn.
Outlook for the market 4)
The economic climate remains supportive, butoverbought market conditions are impairing thenear-term technical picture. We are proceedingon the assumption that the headwinds(technicals, euro area crisis and geopoliticalrisks) will have only very short-livedconsequences for the markets.
We have a positive medium-term stance on
stocks and would therefore take advantage ofshare price setbacks to increase the exposure insome convertibles. On the regional side, we stillfavor the US due to its defensive characteristicsand its further improving fundamentals, whereasour view on Japan is neutral. We still likeemerging markets in the long-term due to theirpositive fundamentals and growth prospects, butare cautious in the short-term.
In general, global valuations and sentiment haveimproved and we expect a robust earningsseason ahead. We remain neutrally positioned interms of equity sensitivity across all convertibleproducts, looking for alpha generation oncompany selection level.
Portfolio ManagementThe portfolio is managed by a team of experienced investment professionals who are based in Zurich. The fund is managed according to the team's view onsecurity selection, equity sectors, equity sensitivity, credit, and duration. The team includes several portfolio managers who contribute to the co-managementof the fund according to their area of expertise.
Cre
dit S
uiss
e S
ICA
V II
4) If not expressly indicated otherwise, all quantitative data contained in this comment is based on Lipper, Bloomberg or Datastream.
289

Fund manager Convertible Bonds TeamFund manager since 01.08.2008Location ZurichFund domicile LuxembourgFund currency USDClose of financial year 30. SepTotal net assets (in mil.) 81.57Inception date 12.10.2007Management fee in % p.a. 1.20Total expense ratio (ex ante) in % 1.35Benchmark (BM)UBS Global CB Focus Inv.Gr. (RI) (CHF-Hgd) (12/09)Unit Class Category R
(capital growth / hedged)
ISIN LU0315567320
Valor no. 3323045
Redemptions DailyEU taxation Out of scope
Fund 48
March 30, 2012Switzerland
SICAV II (Lux) Credit Suisse Global ConvertiblesClass R CHF
Net performance in CHF (rebased to 100) and yearly performance 1)
2007 2008 2009 2010 2011 201260
70
80
90
100
110
120
130
-40%
-30%
-20%
-10%
0%
10%
20%
30%
-27.0
18.6
3.5
-4.1
5.2
SICAV II (Lux) Credit Suisse Global Convertibles RCHF
Yearly or year-to-date performance respectively(Fund)
Net performance in CHF 1)
1 month 3 months YTD 1 year 3 years 5 yearsFund -0.20 5.16 5.16 -0.73 32.14 -Benchmark 0.08 5.64 5.64 1.42 - -
Sectors in %Consumer Goods (non-cyclical) 21.86Technology 14.59Financials 14.42Consumer Goods (cyclical) 9.03Basic Materials 8.55Industrials 6.84Communication 6.69Cash/Cash Equivalents 4.01Others 14.00
Credit Ratings in %
AAA 5.38AA (Bucket) 3.50A (Bucket) 50.17BBB (Bucket) 39.93BB (Bucket) 1.02
Top 10 Holdings in %Position Coupon % Maturity as % of
assetsOrix 1.000 31.03.14 5.64Amgen 0.375 01.02.13 5.46Medtronic 1.625 15.04.13 4.42Lukoil Intl. Fin. 2.625 16.06.15 4.16Arcelor Mittal 7.250 01.04.14 3.91Intel 2.950 15.12.35 3.88Aeon 0.300 22.11.13 3.69Microsoft 0.000 15.06.13 3.40Gilead Sciences 1.000 01.05.14 3.37KFW 3.250 27.06.13 3.30Total 41.23
Duration and Yield 3)
Delta in % 42.30Gross portfolio yield in % -2.54Average remaining term to maturity in years 4.02Modified duration in years 3.352) Due to the optionalities involved in the structure of convertiblebonds, certain assumptions must be applied in order to calculatethese figures.
Fund statistics1 year 3 years
Annualized volatility in % 7.14 7.95Information ratio -4.81 -Tracking Error (Ex post) 0.45 -Maximum drawdown in % 3) -7.48 -7.763) Maximum drawdown is the most negative cumulative returnover a given time period.
Investment policyThe fund provides an actively managed defensiveexposure to global convertibles as a mostefficient multi-asset class strategy involvingequity, credit and volatility on a globally diversifiedbasis, with the aim of achieving superiorrisk-adjusted returns. The risk profile iscomparable to that of a corporate bond fund.The fund invests mainly in convertible securitiesissued by public and private issuers. Traditionalbonds, equity and structured products may beheld in complement. Investments are madeglobally with no restrictions as to country orcurrency.
Fund facts
Unit class currency CHF
Bloomberg ticker CS2GLRC LX
Net asset value (NAV) 88.68
Number of holdings
Source: Lipper, a Reuters Company
Average = BBB
290
1) Historical performance indications and financial market scenarios are no guarantee for current or future performance. Performance indications do not consider commissions levied at subscription and/orredemption.
The disclaimer mentioned at the end of this document also applies to this page.

March 30, 2012Switzerland
SICAV II (Lux) Credit Suisse Global ConvertiblesClass R CHF
Review previous quarter 4)
Global convertibles had a great start to the yearand returned 8.8% in Q1 2012 (currencyhedged), whereas the investment grade part ofthe universe showed a return of 5.7%. Thispositive performance was mainly attributed tostrong global equity markets and further spreadtightening.
In general, the investment environment improvedand rising investor sentiment gave equity marketsthe needed support for growth. Since themassive interventions by the ECB, financial
system stability has improved and the downsiderisk to the global economy has been reduced. Inthe US, with the unemployment rate remainingstable at 8.3% and unemployment benefit claimsfalling to the lowest level since April 2008,consumer confidence reached thesecond-highest level in four years and retail salesclimbed by most in five months. On the otherhand, inflation rose in February the most in 10months, mainly driven by gasoline prices.
In the BRIC countries (especially China and
India), stimulating monetary policy improved theoutlook for risky assets and equity marketscontinued to rise in light of the momentum builtup in December. With regards to convertiblessector performances, all were in positive territory.The highest contributions came fromTechnology, Industrial Goods and Healthcare,whereas Food & Beverage, Chemicals and Retailwere more or less flat. Convertibles primarymarket activity of USD 8.8bn in March, thehighest since June 2011, brought the totalissuance in the first quarter to USD 15.1bn.
Outlook for the market 4)
The economic climate remains supportive, butoverbought market conditions are impairing thenear-term technical picture. We are proceedingon the assumption that the headwinds(technicals, euro area crisis and geopoliticalrisks) will have only very short-livedconsequences for the markets.
We have a positive medium-term stance on
stocks and would therefore take advantage ofshare price setbacks to increase the exposure insome convertibles. On the regional side, we stillfavor the US due to its defensive characteristicsand its further improving fundamentals, whereasour view on Japan is neutral. We still likeemerging markets in the long-term due to theirpositive fundamentals and growth prospects, butare cautious in the short-term.
In general, global valuations and sentiment haveimproved and we expect a robust earningsseason ahead. We remain neutrally positioned interms of equity sensitivity across all convertibleproducts, looking for alpha generation oncompany selection level.
Portfolio ManagementThe portfolio is managed by a team of experienced investment professionals who are based in Zurich. The fund is managed according to the team's view onsecurity selection, equity sectors, equity sensitivity, credit, and duration. The team includes several portfolio managers who contribute to the co-managementof the fund according to their area of expertise.
Cre
dit S
uiss
e S
ICA
V II
4) If not expressly indicated otherwise, all quantitative data contained in this comment is based on Lipper, Bloomberg or Datastream.
291
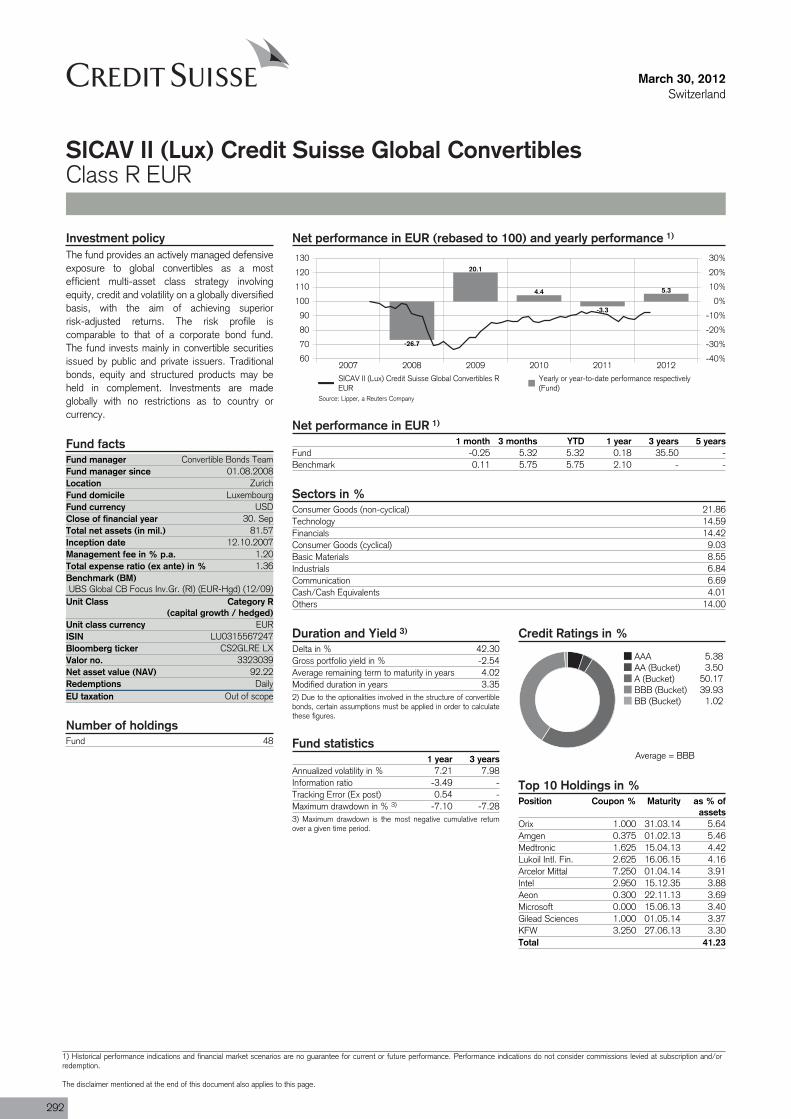
Fund manager Convertible Bonds TeamFund manager since 01.08.2008Location ZurichFund domicile LuxembourgFund currency USDClose of financial year 30. SepTotal net assets (in mil.) 81.57Inception date 12.10.2007Management fee in % p.a. 1.20Total expense ratio (ex ante) in % 1.36Benchmark (BM)UBS Global CB Focus Inv.Gr. (RI) (EUR-Hgd) (12/09)
Unit Class Category R(capital growth / hedged)
ISIN LU0315567247
Valor no. 3323039
Redemptions DailyEU taxation Out of scope
Fund 48
March 30, 2012Switzerland
SICAV II (Lux) Credit Suisse Global ConvertiblesClass R EUR
Net performance in EUR (rebased to 100) and yearly performance 1)
2007 2008 2009 2010 2011 201260
70
80
90
100
110
120
130
-40%
-30%
-20%
-10%
0%
10%
20%
30%
-26.7
20.1
4.4
-3.3
5.3
SICAV II (Lux) Credit Suisse Global Convertibles REUR
Yearly or year-to-date performance respectively(Fund)
Net performance in EUR 1)
1 month 3 months YTD 1 year 3 years 5 yearsFund -0.25 5.32 5.32 0.18 35.50 -Benchmark 0.11 5.75 5.75 2.10 - -
Sectors in %Consumer Goods (non-cyclical) 21.86Technology 14.59Financials 14.42Consumer Goods (cyclical) 9.03Basic Materials 8.55Industrials 6.84Communication 6.69Cash/Cash Equivalents 4.01Others 14.00
Credit Ratings in %
AAA 5.38AA (Bucket) 3.50A (Bucket) 50.17BBB (Bucket) 39.93BB (Bucket) 1.02
Top 10 Holdings in %Position Coupon % Maturity as % of
assetsOrix 1.000 31.03.14 5.64Amgen 0.375 01.02.13 5.46Medtronic 1.625 15.04.13 4.42Lukoil Intl. Fin. 2.625 16.06.15 4.16Arcelor Mittal 7.250 01.04.14 3.91Intel 2.950 15.12.35 3.88Aeon 0.300 22.11.13 3.69Microsoft 0.000 15.06.13 3.40Gilead Sciences 1.000 01.05.14 3.37KFW 3.250 27.06.13 3.30Total 41.23
Duration and Yield 3)
Delta in % 42.30Gross portfolio yield in % -2.54Average remaining term to maturity in years 4.02Modified duration in years 3.352) Due to the optionalities involved in the structure of convertiblebonds, certain assumptions must be applied in order to calculatethese figures.
Fund statistics1 year 3 years
Annualized volatility in % 7.21 7.98Information ratio -3.49 -Tracking Error (Ex post) 0.54 -Maximum drawdown in % 3) -7.10 -7.283) Maximum drawdown is the most negative cumulative returnover a given time period.
Investment policyThe fund provides an actively managed defensiveexposure to global convertibles as a mostefficient multi-asset class strategy involvingequity, credit and volatility on a globally diversifiedbasis, with the aim of achieving superiorrisk-adjusted returns. The risk profile iscomparable to that of a corporate bond fund.The fund invests mainly in convertible securitiesissued by public and private issuers. Traditionalbonds, equity and structured products may beheld in complement. Investments are madeglobally with no restrictions as to country orcurrency.
Fund facts
Unit class currency EUR
Bloomberg ticker CS2GLRE LX
Net asset value (NAV) 92.22
Number of holdings
Source: Lipper, a Reuters Company
Average = BBB
292
1) Historical performance indications and financial market scenarios are no guarantee for current or future performance. Performance indications do not consider commissions levied at subscription and/orredemption.
The disclaimer mentioned at the end of this document also applies to this page.
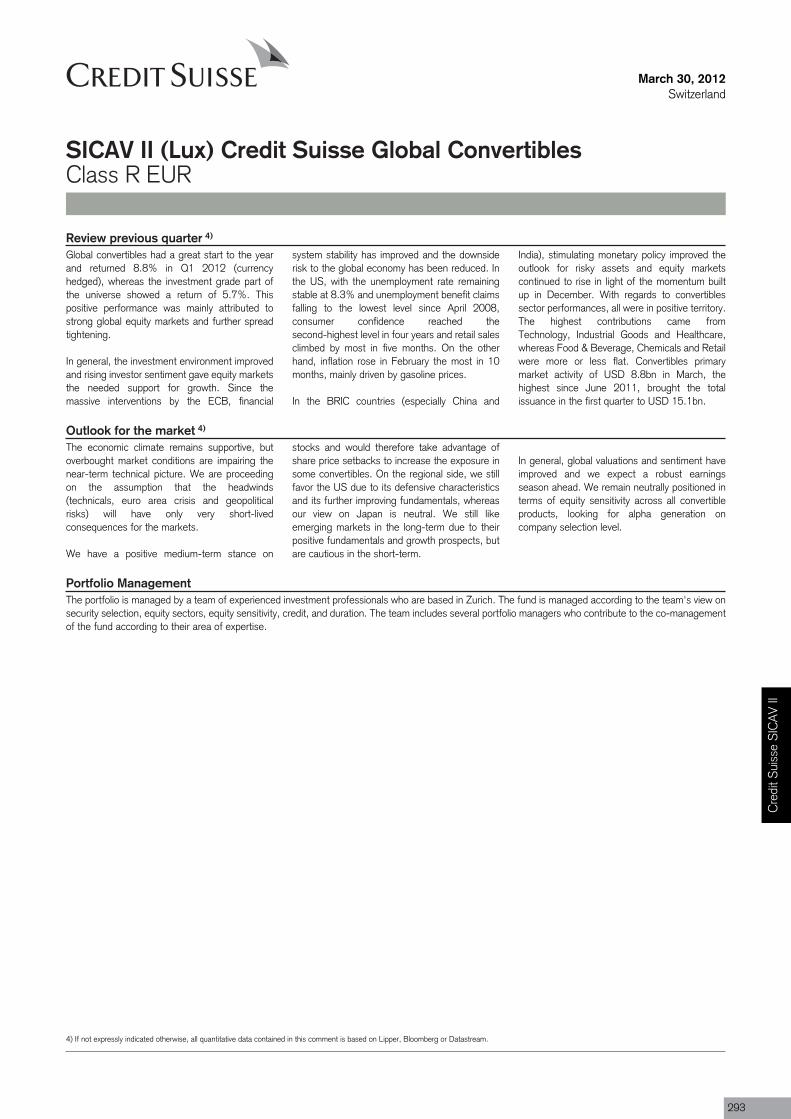
March 30, 2012Switzerland
SICAV II (Lux) Credit Suisse Global ConvertiblesClass R EUR
Review previous quarter 4)
Global convertibles had a great start to the yearand returned 8.8% in Q1 2012 (currencyhedged), whereas the investment grade part ofthe universe showed a return of 5.7%. Thispositive performance was mainly attributed tostrong global equity markets and further spreadtightening.
In general, the investment environment improvedand rising investor sentiment gave equity marketsthe needed support for growth. Since themassive interventions by the ECB, financial
system stability has improved and the downsiderisk to the global economy has been reduced. Inthe US, with the unemployment rate remainingstable at 8.3% and unemployment benefit claimsfalling to the lowest level since April 2008,consumer confidence reached thesecond-highest level in four years and retail salesclimbed by most in five months. On the otherhand, inflation rose in February the most in 10months, mainly driven by gasoline prices.
In the BRIC countries (especially China and
India), stimulating monetary policy improved theoutlook for risky assets and equity marketscontinued to rise in light of the momentum builtup in December. With regards to convertiblessector performances, all were in positive territory.The highest contributions came fromTechnology, Industrial Goods and Healthcare,whereas Food & Beverage, Chemicals and Retailwere more or less flat. Convertibles primarymarket activity of USD 8.8bn in March, thehighest since June 2011, brought the totalissuance in the first quarter to USD 15.1bn.
Outlook for the market 4)
The economic climate remains supportive, butoverbought market conditions are impairing thenear-term technical picture. We are proceedingon the assumption that the headwinds(technicals, euro area crisis and geopoliticalrisks) will have only very short-livedconsequences for the markets.
We have a positive medium-term stance on
stocks and would therefore take advantage ofshare price setbacks to increase the exposure insome convertibles. On the regional side, we stillfavor the US due to its defensive characteristicsand its further improving fundamentals, whereasour view on Japan is neutral. We still likeemerging markets in the long-term due to theirpositive fundamentals and growth prospects, butare cautious in the short-term.
In general, global valuations and sentiment haveimproved and we expect a robust earningsseason ahead. We remain neutrally positioned interms of equity sensitivity across all convertibleproducts, looking for alpha generation oncompany selection level.
Portfolio ManagementThe portfolio is managed by a team of experienced investment professionals who are based in Zurich. The fund is managed according to the team's view onsecurity selection, equity sectors, equity sensitivity, credit, and duration. The team includes several portfolio managers who contribute to the co-managementof the fund according to their area of expertise.
Cre
dit S
uiss
e S
ICA
V II
4) If not expressly indicated otherwise, all quantitative data contained in this comment is based on Lipper, Bloomberg or Datastream.
293
Fund manager Alexandre BouchardyFund manager since 01.05.2007Location ZurichFund domicile LuxembourgFund currency EURClose of financial year 30. SepTotal net assets (in mil.) 99.72Inception date 24.06.2005Management fee in % p.a. 1.00Total expense ratio (ex ante) in % 1.15Benchmark (BM)
Barclays Euro Govt. Infl-Linked 1-10Y (RI) (09/07)Unit Class Category A
(distribution)
ISIN LU0217709491
Valor no. 2127616
Last distribution 15.11.2011Distribution value 1.50Redemptions DailyEU taxation Out of scope
Fund 57
March 30, 2012Switzerland
SICAV II (Lux) Credit Suisse Inflation Linked Bonds (Euro)Class A & B
Net performance in EUR (rebased to 100) and yearly performance 1)
2007 2008 2009 2010 2011 201295
100
105
110
115
120
125
130
-5%
0%
5%
10%
15%
20%
25%
30%
2.04.0
7.0
0.2 0.72.4
4.8 5.37.0
2.1 1.3
5.6
SICAV II (Lux) Credit Suisse Inflation Linked Bonds(Euro) B
Yearly or year-to-date performance respectively(Fund)
Barclays Euro Govt. Infl-Linked 1-10Y (RI) (09/07)Yearly or year-to-date performance respectively(Benchmark)
Net performance in EUR 1)
1 month 3 months YTD 1 year 3 years 5 yearsFund -0.03 2.44 2.44 3.39 8.50 17.62Benchmark 0.35 5.63 5.63 5.90 14.80 28.30
Maturities in years
0%
5%
10%
15%
20%
25%
30%
0-1 1-3 3-5 5-7 7-10 10-15 >15
Currencies in %before hedging after hedging
EUR 99.99 99.99USD 0.01 0.01
Asset Allocation in %Government Bonds / Agency Bonds 70.58Corporate Bonds 13.68Financial Bonds 10.17Cash/Cash Equivalents 1.55Others 4.01Total 100.00
Duration and YieldFund
Gross portfolio yield in % 0.97Average remaining term to maturity in years 5.39Modified duration in years 4.48
Fund statistics3 years 5 years
Annualised volatility in % 3.34 3.54Information ratio -0.78 -0.78Tracking Error (Ex post) 2.41 2.24Maximum drawdown in % 2) -4.81 -4.812) Maximum drawdown is the most negative cumulative returnover a given time period.
Credit Ratings in %
AAA 60.17AA+ 2.36AA 3.49AA- 6.23A+ 7.25A 2.53A- 15.03BBB+ 2.42BBB- 0.53
Top 10 Holdings in %Position Coupon % Maturity as % of
assetsGermany 2.250 15.04.13 9.52Germany 1.500 15.04.16 8.95Finnish Governm. 4.375 04.07.19 4.87Buoni Poliennali 2.350 15.09.35 4.38Netherlands 4.000 15.07.19 4.16Spain 3.000 30.04.15 4.16Italy 2.100 15.09.21 4.15Belgium 3.750 28.09.20 3.22Finland 3.125 15.09.14 2.75France OAT 2.500 25.07.13 2.55Total 48.71
Investment policyThe aim of the fund is to achieve aninflation-protected steady return in EUR. Thefund invests worldwide at least two-thirds of itsnet assets, in accordance with the principle ofrisk-spreading, in medium to high qualityinflation-linked debt securities, includingsynthetically constructed inflation-linked debtsecurities. The Fund may invest in othercurrencies than the EUR. The part of suchinvestments which is not hedged against theEUR may not exceed 10% of the Fund’s assets.
Fund facts
Category B(capital growth)
Unit class currency EUR EURLU0217709657
Bloomberg ticker CSILBEALX
CSILBEB LX
2127617Net asset value(NAV)
104.26 116.95
--
Daily
Number of holdings
Source: Lipper, a Reuters Company
Average = A+
294
1) Historical performance indications and financial market scenarios are no guarantee for current or future performance. Performance indications do not consider commissions levied at subscription and/orredemption.
The disclaimer mentioned at the end of this document also applies to this page.
March 30, 2012Switzerland
SICAV II (Lux) Credit Suisse Inflation Linked Bonds (Euro)Class A & B
Review previous quarter 3)
Inflation-linked bonds’ returns were positive inQ1, the overall index returned 1.2% (hedgedin USD). The quarter was characterized by, yetagain, strong differences across countries.Indeed, the best performing market was Europewith a return of 6.2%, followed by Japan (2.4%)and the US (0.8%). Helped by the positivesentiment impact of the ECB’s 3 year LTROs,Italy alone managed to return an impressive14%, by far erasing the losses of the previousquarter. France profited as well from the positivesentiment and returned 3.7%, while Germanymanaged a still decent 1.2%. The worstperforming markets were Sweden (-1.6%), the
UK (-1.4%) and Canada (-1.4%) which sufferedfrom the recent rates increase, especially at thelong-end of the curve. Compared to nominalbonds, inflation-linked bonds outperformed byalmost 2% as inflation expectations rose on theback of high energy prices and improvedeconomic data.
In absolute terms, the fund returned 2.72%gross of fees (2.43% net). While the decreasein real rates contributed positively, it was partiallyoffset by a negative inflation accrual of -0.4%.Relative to benchmark, the fund underperformedby -2.92% gross of fees (-3.2% net). Duration/
curve management was positive as we held anoverweight at the very long end of the curve(30y). Market allocation however was negative.Indeed, our structural* underweight in France andItaly contributed negatively as both countriesperformed strongly.
*France and Italy have weights of respectively47% and 27% in the benchmark. Fordiversification purposes, we will not hold suchan exposure in these countries. Thus, we arerunning a structural underweight.
Outlook for the market 3)
On the inflation side, headline CPI for Februaryincreased by 2.9% y-o-y in the US and by 2.7%y-o-y in Europe, whereas core indices increasedby 2.2% y-o-y and 1.5% y-o-y respectively.Against the background of reduced politicaltension in the Middle East, oil prices havestabilized and retraced from their peaks reachedearlier in March. Some relief on the headlinemeasure of CPI could therefore be expected inthe coming quarters. Regarding the core
measure of inflation, it is likely to remain subduedin Europe amid tepid growth as well as fiscal andprivate sector deleveraging. In the US, however,rental inflation has been the key component ofthe steady increase in core inflation and is likelyto increase further, albeit at a more moderatepace.
In terms of strategy, we have continued ourdiversification strategy. Indeed, we have profited
from better levels in order to reduce ourallocation to Italy and France while increasingit in Belgium. Furthermore, we increased ourexposure to core corporates, especially in thetelecommunication and insurance sectors.Finally, we have reduced both our real interestrate and inflation duration by selling long-datedGerman nominal bonds. Going forward, we arelooking at pursuing this diversification strategy byreducing our exposure to France especially.
Portfolio ManagementAlexandre Bouchardy, Director, is a senior portfolio manager in the International Fixed Income team. He joined CSAM in 2002. Previouslyhe gained first experience in asset management at two different companies in Geneva and Paris. Mr. Bouchardy graduated from theUniversity of Lausanne specialising in economics and finance.
Cre
dit S
uiss
e S
ICA
V II
3) If not expressly indicated otherwise, all quantitative data contained in this comment is based on Lipper, Bloomberg or Datastream.
295
Fund manager Eric SuterFund manager since 02.05.2005Location ZurichFund domicile LuxembourgFund currency CHFClose of financial year 30. SepTotal net assets (in mil.) 411.00Inception date 02.05.2005Management fee in % p.a. 0.05Total expense ratio (ex ante) in % 0.11Benchmark (BM) Citigroup CHF 3M Euro Dep.Unit Class Category B
(capital growth)
ISIN LU0217718484
Valor no. 2127903
Redemptions DailyEU taxation Out of scope
Fund 63
March 30, 2012Switzerland
SICAV II (Lux) Credit Suisse Money Market SfrClass B
Net performance in CHF (rebased to 100) and yearly performance 1)
2007 2008 2009 2010 2011 201299
100101102103104105106107
-1%0%1%2%3%4%5%6%7%
1.6 1.30.7
0.10.0
0.1
2.4 2.7
0.5 0.2 0.2 0.0
SICAV II (Lux) Credit Suisse Money Market SfrB
Yearly or year-to-date performance respectively (Fund)
Citigroup CHF 3M Euro Dep.Yearly or year-to-date performance respectively(Benchmark)
Net performance in CHF 1)
1 month 3 months YTD 1 year 3 years 5 yearsFund 0.02 0.10 0.10 0.00 0.78 3.48Benchmark 0.00 0.02 0.02 0.17 0.68 5.62
Maturities in months
0%2%4%6%8%
10%12%14%16%18%20%
0-1 1-2 2-3 3-6 6-9 9-12 >12
Currencies in %before hedging after hedging
CHF 100.00 100.00
Asset Allocation in %Commercial Paper 28.94Covered/ABS 17.55Financial Bonds 13.85Government 6.80Sovereign/Agencies 6.75Industrial Bonds 5.81Certificates of Deposit 4.62Utilities 0.74Cash/Cash Equivalents 8.36Others 6.57Total 99.99
Fund statistics3 years 5 years
Annualised volatility in % 0.24 0.27Information ratio 0.14 -1.58Tracking Error (Ex post) 0.24 0.26Maximum drawdown in % 2) -0.28 -0.282) Maximum drawdown is the most negative cumulative returnover a given time period.
Credit Ratings in %
AAA 27.35AA+ 10.68AA 7.74AA- 10.44A-1+ 12.73A-1 23.89Not rated 7.17
Duration and YieldFund
Gross portfolio yield in % 0.22Average remaining term to maturity in days 161Modified duration (days) 95
Top 10 Holdings in %Position Coupon
%Maturity as % of
assetsABN AMRO Bk NV 29.05.12 2.92BPCE 21.05.12 2.92ECP Abbey Nat. 21.05.12 2.92LB Hessen-Thu 05.04.12 2.92Lloyds TSB 09.05.12 2.92SOCIETEGENERALE
11.06.12 2.92
Nestlé 1.250 24.04.12 2.68Pohjola BK. 14.06.12 2.68Banque et C.Eparg.
16.07.12 2.67
BGL BNP Paribas 21.06.12 2.67Total 28.22
Investment policyThe aim of the fund is to achieve a high andsteady income in Swiss francs whilst taking intoaccount the security and stability of the capital.The fund invests at least two-thirds of its assetsin Swiss franc denominated money marketinstruments as well as in short-dated fixedinterest and variable rate paper with first classborrower ratings. The Fund may hold fixedincome securities denominated in othercurrencies than the CHF, however, currencyexposure has to be fully hedged in CHF.
Fund facts
Unit class currency CHF
Bloomberg ticker CSMMSFB LX
Net asset value (NAV) 1'048.02
Number of holdings
Source: Lipper, a Reuters Company
Average = AA
296
1) Historical performance indications and financial market scenarios are no guarantee for current or future performance. Performance indications do not consider commissions levied at subscription and/orredemption.
The disclaimer mentioned at the end of this document also applies to this page.
March 30, 2012Switzerland
SICAV II (Lux) Credit Suisse Money Market SfrClass B
Review previous quarter 3)
Substantial injections of liquidity by the ECB andthe restructuring of the Greek government'sdebts helped stabilize markets in Q1 2012.There are still structural problems relating toEuropean borrowers (which are not to beunderestimated) and heterogeneous globalgrowth patterns. Nevertheless, the Swisseconomy narrowly avoided recession thanks todomestic consumption and high demand forSwiss watches and pharmaceutical products inother countries. The SNB stuck to its guns and
maintained its expansive monetary policy, onceagain confirming a minimum exchange rate of1.20 francs to the euro.
Interest rates remained very low for all termsin the quarter under review. The 10-year swaprate even dipped below the 1% mark in earlyMarch to 0.99%, setting a new record low. Whileshort-term Confederation bonds of up to threeyears still exhibited negative yields at the start ofthe reporting period, the curve has since returned
to normal.
At the end of the quarter, the 3-month CHFLIBOR was 6bps higher at 0.11%, while theyield on 2-year Confederation bonds rose to0.02% (+6bps) and 10-year bonds came in at0.85% (+21bps). The performance of the firstquarter was mostly positive thanks to demandof the investors for high yielding bonds whichresulted in a reduction of the credit spreads.
Outlook for the market 3)
While the US economy performed surprisinglywell, production in Japan and Europe stagnated.Switzerland's GDP managed to grow at a rateof 0.1% in Q4 2011 despite the continuousstrength of the Swiss franc. A number of leadingindicators are showing early signs of stabilization,which could suggest that the economy hasbottomed out. The Swiss economy is dependenton global economic trends, and it remains to beseen whether the progress made with regard toovercoming the European sovereign debt crisiswill bring a lasting improvement to the situation.That said, a resurgence of the debt crisis cannot
be ruled out. Other geopolitical tensions couldlead to increased volatility in commodity prices. Inits first assessment of monetary policy in March2012 the SNB maintained its expansive courseand confirmed the minimum exchange rate of1.20 francs to the euro. The target range forthe CHF 3-month LIBOR is still 0-0.25%, andliquidity is still being kept high. On the otherhand, inflation is expected to rise modestly(2013: 0.3% and 2014: 0.6%). Also, theforecast for economic growth has been revisedupwards to 1% for 2012.
For the first time since last year the score ofour interest rate factor model turned negative asthe more friendly fundamental picture suggestshigher yields going forward. The technical inputalso changed to negative due to an overboughtsituation in the short term. The behavioral inputalso neutralized because of the recent strongflattening of the yield curve. We will reduce ourduration in the portfolios towards a shorterposition than the benchmark. We recommendtop quality issues and would increase thediversification in the portfolio as even somefrequent issuers have become expensive.
Portfolio ManagementEric Suter, Director, is a senior portfolio manager. He heads the Swiss Fixed Income Team and is responsible for the Swiss Fixed Incomeinvestment decision process. Eric joined CS Group in 1983 and worked in trading, product development and structuring of fixed incomeproducts. In 1995 he moved to fixed income asset management. He received a Bachelor in Business Administration from the KaderschuleZurich (KSZ), is a Certified International Investment Analyst (CIIA) and a member of the Swiss Bond Commission. Eric Suter, Director,leitet das Schweizer Franken Obligationen Team und ist verantwortlich für den Schweizer Franken Anlageprozess. Er stiess 1983 zur CSGroup und arbeitete im Handel, der Produkteentwicklung sowie in der Strukturierung von Zinsprodukten. 1995 wechselte er insObligationen Portfolio Management. Hr. Suter hat einen Abschluss in Betriebsökonomie der Kaderschule Zürich (KSZ), ist dipl.Finanzanalytiker und Vermögensverwalter (AZEK) sowie Mitglied der Schweizer Obligationenkommission (OKS).
Eric Suter, Director, dirige l'équipe Obligations CHF. Il a rejoint le CS Group en 1983 et a travaillé dans la vente, le développement produits ainsi que lastructuration de produits obligataires. En 1995, il est passé dans le domaine Portfolio Management Obligations. E. Suter dispose de diplômes en économied'entreprise de l'Ecole de cadres de Zurich (KSZ), d'analyste financier et gestionnaire de fortune (CFPI) et est membre de la Commission Suisse desObligations (OKS).
Cre
dit S
uiss
e S
ICA
V II
3) If not expressly indicated otherwise, all quantitative data contained in this comment is based on Lipper, Bloomberg or Datastream.
297
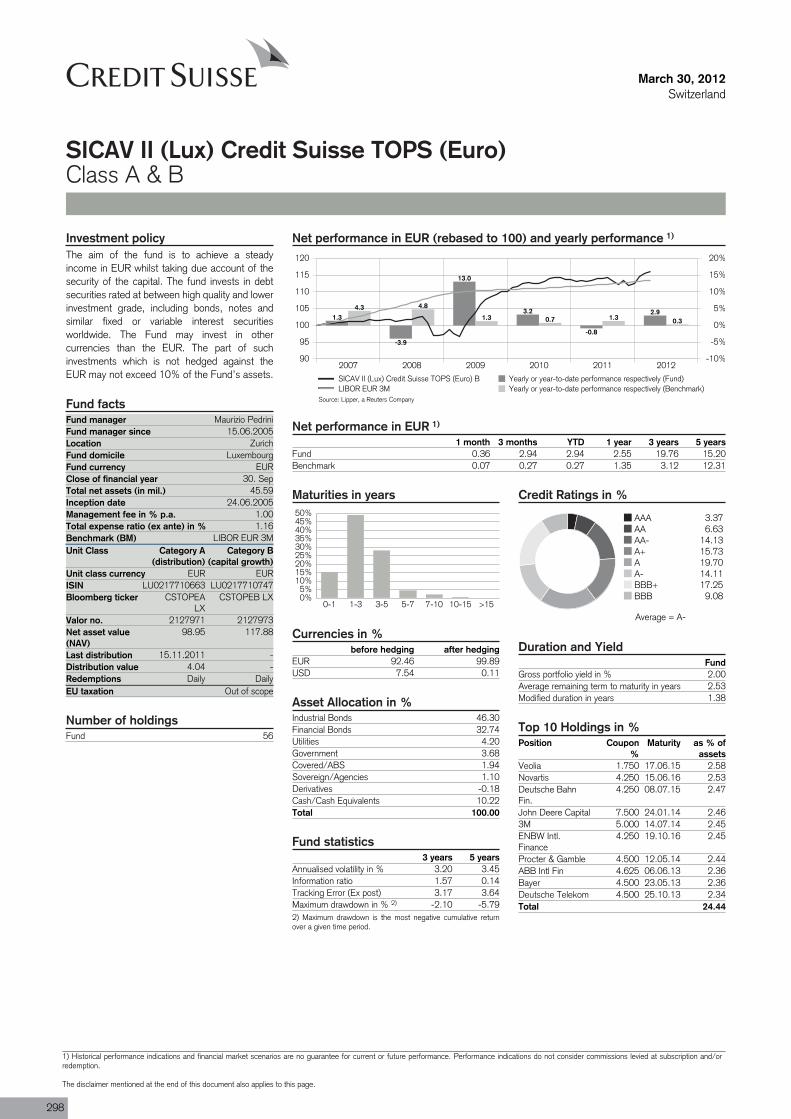
Fund manager Maurizio PedriniFund manager since 15.06.2005Location ZurichFund domicile LuxembourgFund currency EURClose of financial year 30. SepTotal net assets (in mil.) 45.59Inception date 24.06.2005Management fee in % p.a. 1.00Total expense ratio (ex ante) in % 1.16Benchmark (BM) LIBOR EUR 3MUnit Class Category A
(distribution)
ISIN LU0217710663
Valor no. 2127971
Last distribution 15.11.2011Distribution value 4.04Redemptions DailyEU taxation Out of scope
Fund 56
March 30, 2012Switzerland
SICAV II (Lux) Credit Suisse TOPS (Euro)Class A & B
Net performance in EUR (rebased to 100) and yearly performance 1)
2007 2008 2009 2010 2011 201290
95
100
105
110
115
120
-10%
-5%
0%
5%
10%
15%
20%
1.3
-3.9
13.0
3.2
-0.8
2.94.3 4.8
1.3 0.7 1.3 0.3
SICAV II (Lux) Credit Suisse TOPS (Euro) B Yearly or year-to-date performance respectively (Fund)LIBOR EUR 3M Yearly or year-to-date performance respectively (Benchmark)
Net performance in EUR 1)
1 month 3 months YTD 1 year 3 years 5 yearsFund 0.36 2.94 2.94 2.55 19.76 15.20Benchmark 0.07 0.27 0.27 1.35 3.12 12.31
Maturities in years
0%5%
10%15%20%25%30%35%40%45%50%
0-1 1-3 3-5 5-7 7-10 10-15 >15
Currencies in %before hedging after hedging
EUR 92.46 99.89USD 7.54 0.11
Asset Allocation in %Industrial Bonds 46.30Financial Bonds 32.74Utilities 4.20Government 3.68Covered/ABS 1.94Sovereign/Agencies 1.10Derivatives -0.18Cash/Cash Equivalents 10.22Total 100.00
Fund statistics3 years 5 years
Annualised volatility in % 3.20 3.45Information ratio 1.57 0.14Tracking Error (Ex post) 3.17 3.64Maximum drawdown in % 2) -2.10 -5.792) Maximum drawdown is the most negative cumulative returnover a given time period.
Credit Ratings in %
AAA 3.37AA 6.63AA- 14.13A+ 15.73A 19.70A- 14.11BBB+ 17.25BBB 9.08
Duration and YieldFund
Gross portfolio yield in % 2.00Average remaining term to maturity in years 2.53Modified duration in years 1.38
Top 10 Holdings in %Position Coupon
%Maturity as % of
assetsVeolia 1.750 17.06.15 2.58Novartis 4.250 15.06.16 2.53Deutsche BahnFin.
4.250 08.07.15 2.47
John Deere Capital 7.500 24.01.14 2.463M 5.000 14.07.14 2.45ENBW Intl.Finance
4.250 19.10.16 2.45
Procter & Gamble 4.500 12.05.14 2.44ABB Intl Fin 4.625 06.06.13 2.36Bayer 4.500 23.05.13 2.36Deutsche Telekom 4.500 25.10.13 2.34Total 24.44
Investment policyThe aim of the fund is to achieve a steadyincome in EUR whilst taking due account of thesecurity of the capital. The fund invests in debtsecurities rated at between high quality and lowerinvestment grade, including bonds, notes andsimilar fixed or variable interest securitiesworldwide. The Fund may invest in othercurrencies than the EUR. The part of suchinvestments which is not hedged against theEUR may not exceed 10% of the Fund’s assets.
Fund facts
Category B(capital growth)
Unit class currency EUR EURLU0217710747
Bloomberg ticker CSTOPEALX
CSTOPEB LX
2127973Net asset value(NAV)
98.95 117.88
--
Daily
Number of holdings
Source: Lipper, a Reuters Company
Average = A-
298
1) Historical performance indications and financial market scenarios are no guarantee for current or future performance. Performance indications do not consider commissions levied at subscription and/orredemption.
The disclaimer mentioned at the end of this document also applies to this page.
March 30, 2012Switzerland
SICAV II (Lux) Credit Suisse TOPS (Euro)Class A & B
Review previous quarter 3)
Substantial liquidity injections by the ECB (LTROI and LTRO II) and the restructuring of the Greekgovernment debt helped to stabilize markets inQ1 2012. Risky assets strongly outperformedgovernments bonds in general and peripheralgovernment bonds of the euro area also surgedin price. Q1 2012 was therefore one of thestrongest in recent history. Credit spreadstightened as measured by the iTraxx EuropeMain Index (5yrs) from 173bps to 125bps andin the US from 120bps to 92bps (CDX IG 5yrs).Interest rates in the US climbed higher on theback of improving economic data. The US yield
curve steepened as the differential between 2yrsand 10yrs maturities increased by 15pbs to179bps.
Unlike in the US, yield changes in the eurozoneresembled the picture of a butterfly as the shortend and the long end gapped higher while themiddle of the curve (6yrs -12 yrs) was lower.Spain got back into the spotlight after thegovernment warned that the budget deficit will behigher than originally forecasted in 2011. Also,demand was lower than expected at one of itsgovernment debt auctions. One of the key issues
in Europe is still that in order to reduce theirbudget deficits, governments need to introduceausterity measures which may cause civil unrestand a negative GDP growth rate. LTRO’s havereduced the liquidity issue for banks. However,many banks in Europe remain weakly capitalized.One of the bright spots are the high growth ratesof emerging market countries. Even as Chinahas declared that it will target a lower growth rateunder its new five-year plan, investors continueto be attracted by the higher interest rates andearnings growth of Asian and Latin Americaneconomies.
Outlook for the market 3)
The Fed announced that it does not expect torevise its monetary policy anytime soon. Therecovery of the US economy remains protractedbut recently exceeded the expectations of themarket. In particular, the labor market has beenmore dynamic as more jobs were created in Q1and the jobless rate dropped to 8.2%.Manufacturing also suggested that the USeconomy continues to be on a slow butcontinuous growth path. There are virtually noinflationary forces that could lead the Fed toincrease interest rates within a year. Interestrates will likely stay at the current level for some
time in the US which in turn may hurt emergingmarkets because their currencies are likely toappreciate versus the USD. In order to remaincompetitive, countries such as Brazil and otherfast growing economies need to replace moreexpensive labor with capital and encouragedomestic consumption. What does this mean forcredit spreads and interest rates?
For the first time since last year the score ofour interest rate factor model turned negative asthe more friendly fundamental picture suggestshigher yields going forward. The technical input
also changed to negative due to an overboughtsituation in the short term. The behavioral inputalso neutralized because of the recent strongflattening of yield curves in Europe. We willtherefore reduce our duration in the portfoliostowards a shorter position than the benchmark.In corporate bonds we recommend issuers witha good credit profile and would increase thediversification in the portfolio as even somefrequent issuers have become expensive. Aconsolidation period seems likely after the strongrally in the first quarter.
Portfolio ManagementMaurizio Pedrini is a Managing Director of Credit Suisse's Asset Management business, based in Zurich. He is Global Co-Head FixedIncome, focusing on retail funds and institutional products. He joined Credit Suisse in 1998. Prior to this he was Head of Bond Researchand Bond Fund Management at UBS Private Banking. Maurizio has more than 17 years of professional experience in the fixed income andforeign exchange business. Maurizio holds a Master's degree from the University of Zurich (specializing in Finance and Monetary Theory)and is a Certified EFFAS Financial Ana-lyst. He is a visiting lecturer at the University of Zurich for the EFFAS Financial Analyst studycourse and at the University of Applied Sciences Northwestern Switzerland on various fixed income topics. Maurizio is a member of theSwiss Bond Commission.
Cre
dit S
uiss
e S
ICA
V II
3) If not expressly indicated otherwise, all quantitative data contained in this comment is based on Lipper, Bloomberg or Datastream.
299
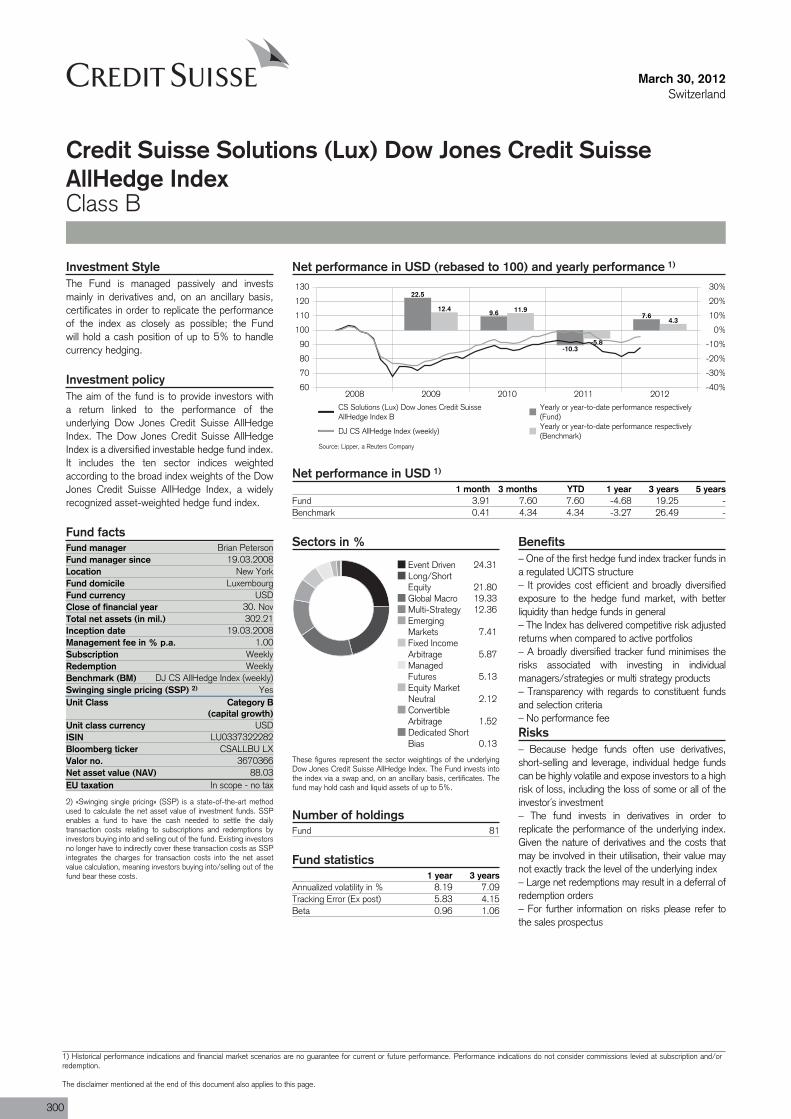
Fund 81
Fund manager Brian PetersonFund manager since 19.03.2008Location New YorkFund domicile LuxembourgFund currency USDClose of financial year 30. NovTotal net assets (in mil.) 302.21Inception date 19.03.2008Management fee in % p.a. 1.00Subscription WeeklyRedemption WeeklyBenchmark (BM) DJ CS AllHedge Index (weekly)Swinging single pricing (SSP) 2) YesUnit Class Category B
(capital growth)
ISIN LU0337322282
Valor no. 3670366
EU taxation In scope - no tax
March 30, 2012Switzerland
Credit Suisse Solutions (Lux) Dow Jones Credit SuisseAllHedge IndexClass B
Net performance in USD (rebased to 100) and yearly performance 1)
2008 2009 2010 2011 201260
70
80
90
100
110
120
130
-40%
-30%
-20%
-10%
0%
10%
20%
30%22.5
9.6
-10.3
7.612.4 11.9
-5.8
4.3
CS Solutions (Lux) Dow Jones Credit SuisseAllHedge Index B
Yearly or year-to-date performance respectively(Fund)
DJ CS AllHedge Index (weekly)Yearly or year-to-date performance respectively(Benchmark)
Net performance in USD 1)
1 month 3 months YTD 1 year 3 years 5 yearsFund 3.91 7.60 7.60 -4.68 19.25 -Benchmark 0.41 4.34 4.34 -3.27 26.49 -
Sectors in %
Event Driven 24.31Long/ShortEquity 21.80Global Macro 19.33Multi-Strategy 12.36EmergingMarkets 7.41Fixed IncomeArbitrage 5.87ManagedFutures 5.13Equity MarketNeutral 2.12ConvertibleArbitrage 1.52Dedicated ShortBias 0.13
These figures represent the sector weightings of the underlyingDow Jones Credit Suisse AllHedge Index. The Fund invests intothe index via a swap and, on an ancillary basis, certificates. Thefund may hold cash and liquid assets of up to 5%.
Benefits– One of the first hedge fund index tracker funds ina regulated UCITS structure– It provides cost efficient and broadly diversifiedexposure to the hedge fund market, with betterliquidity than hedge funds in general– The Index has delivered competitive risk adjustedreturns when compared to active portfolios– A broadly diversified tracker fund minimises therisks associated with investing in individualmanagers/strategies or multi strategy products– Transparency with regards to constituent fundsand selection criteria– No performance feeRisks– Because hedge funds often use derivatives,short-selling and leverage, individual hedge fundscan be highly volatile and expose investors to a highrisk of loss, including the loss of some or all of theinvestor´s investment– The fund invests in derivatives in order toreplicate the performance of the underlying index.Given the nature of derivatives and the costs thatmay be involved in their utilisation, their value maynot exactly track the level of the underlying index– Large net redemptions may result in a deferral ofredemption orders– For further information on risks please refer tothe sales prospectus
Number of holdings
Fund statistics1 year 3 years
Annualized volatility in % 8.19 7.09Tracking Error (Ex post) 5.83 4.15Beta 0.96 1.06
Investment StyleThe Fund is managed passively and investsmainly in derivatives and, on an ancillary basis,certificates in order to replicate the performanceof the index as closely as possible; the Fundwill hold a cash position of up to 5% to handlecurrency hedging.
Investment policyThe aim of the fund is to provide investors witha return linked to the performance of theunderlying Dow Jones Credit Suisse AllHedgeIndex. The Dow Jones Credit Suisse AllHedgeIndex is a diversified investable hedge fund index.It includes the ten sector indices weightedaccording to the broad index weights of the DowJones Credit Suisse AllHedge Index, a widelyrecognized asset-weighted hedge fund index.
Fund facts
Unit class currency USD
Bloomberg ticker CSALLBU LX
Net asset value (NAV) 88.03
2) «Swinging single pricing» (SSP) is a state-of-the-art methodused to calculate the net asset value of investment funds. SSPenables a fund to have the cash needed to settle the dailytransaction costs relating to subscriptions and redemptions byinvestors buying into and selling out of the fund. Existing investorsno longer have to indirectly cover these transaction costs as SSPintegrates the charges for transaction costs into the net assetvalue calculation, meaning investors buying into/selling out of thefund bear these costs.
Source: Lipper, a Reuters Company
300
1) Historical performance indications and financial market scenarios are no guarantee for current or future performance. Performance indications do not consider commissions levied at subscription and/orredemption.
The disclaimer mentioned at the end of this document also applies to this page.
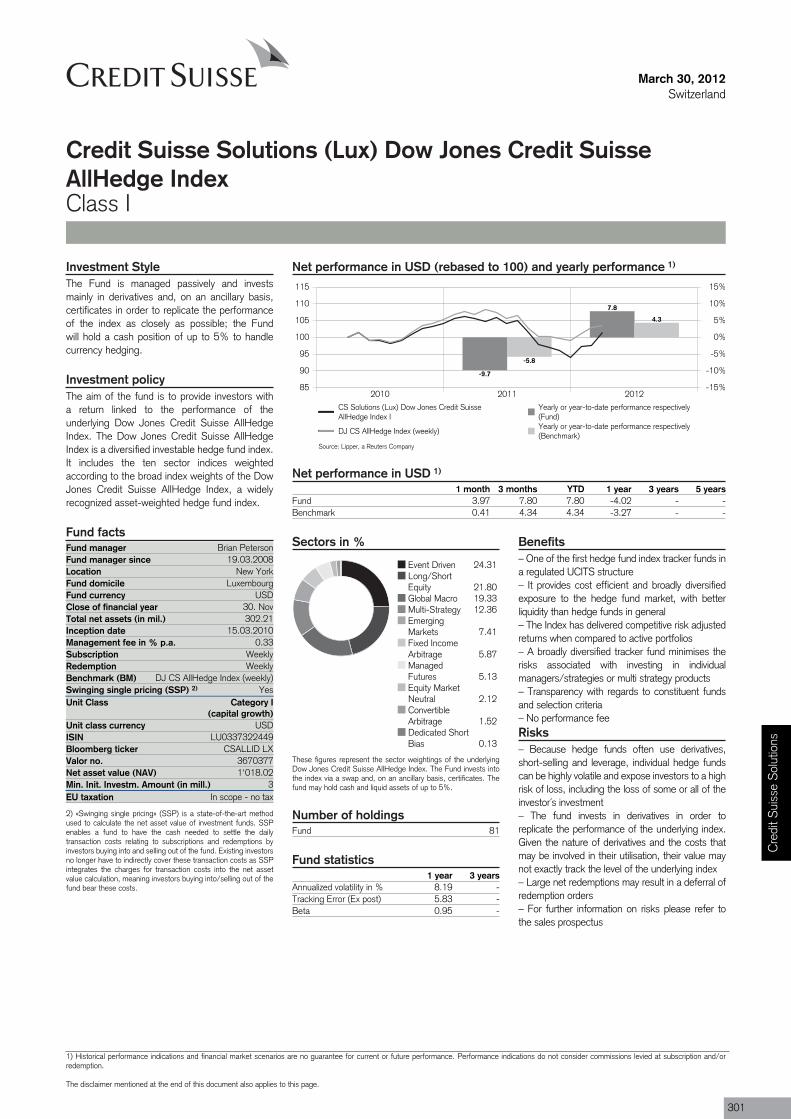
Fund 81
Fund manager Brian PetersonFund manager since 19.03.2008Location New YorkFund domicile LuxembourgFund currency USDClose of financial year 30. NovTotal net assets (in mil.) 302.21Inception date 15.03.2010Management fee in % p.a. 0.33Subscription WeeklyRedemption WeeklyBenchmark (BM) DJ CS AllHedge Index (weekly)Swinging single pricing (SSP) 2) YesUnit Class Category I
(capital growth)
ISIN LU0337322449
Valor no. 3670377
Min. Init. Investm. Amount (in mill.) 3EU taxation In scope - no tax
March 30, 2012Switzerland
Credit Suisse Solutions (Lux) Dow Jones Credit SuisseAllHedge IndexClass I
Net performance in USD (rebased to 100) and yearly performance 1)
2010 2011 201285
90
95
100
105
110
115
-15%
-10%
-5%
0%
5%
10%
15%
-9.7
7.8
-5.8
4.3
CS Solutions (Lux) Dow Jones Credit SuisseAllHedge Index I
Yearly or year-to-date performance respectively(Fund)
DJ CS AllHedge Index (weekly)Yearly or year-to-date performance respectively(Benchmark)
Net performance in USD 1)
1 month 3 months YTD 1 year 3 years 5 yearsFund 3.97 7.80 7.80 -4.02 - -Benchmark 0.41 4.34 4.34 -3.27 - -
Sectors in %
Event Driven 24.31Long/ShortEquity 21.80Global Macro 19.33Multi-Strategy 12.36EmergingMarkets 7.41Fixed IncomeArbitrage 5.87ManagedFutures 5.13Equity MarketNeutral 2.12ConvertibleArbitrage 1.52Dedicated ShortBias 0.13
These figures represent the sector weightings of the underlyingDow Jones Credit Suisse AllHedge Index. The Fund invests intothe index via a swap and, on an ancillary basis, certificates. Thefund may hold cash and liquid assets of up to 5%.
Benefits– One of the first hedge fund index tracker funds ina regulated UCITS structure– It provides cost efficient and broadly diversifiedexposure to the hedge fund market, with betterliquidity than hedge funds in general– The Index has delivered competitive risk adjustedreturns when compared to active portfolios– A broadly diversified tracker fund minimises therisks associated with investing in individualmanagers/strategies or multi strategy products– Transparency with regards to constituent fundsand selection criteria– No performance feeRisks– Because hedge funds often use derivatives,short-selling and leverage, individual hedge fundscan be highly volatile and expose investors to a highrisk of loss, including the loss of some or all of theinvestor´s investment– The fund invests in derivatives in order toreplicate the performance of the underlying index.Given the nature of derivatives and the costs thatmay be involved in their utilisation, their value maynot exactly track the level of the underlying index– Large net redemptions may result in a deferral ofredemption orders– For further information on risks please refer tothe sales prospectus
Number of holdings
Fund statistics1 year 3 years
Annualized volatility in % 8.19 -Tracking Error (Ex post) 5.83 -Beta 0.95 -
Investment StyleThe Fund is managed passively and investsmainly in derivatives and, on an ancillary basis,certificates in order to replicate the performanceof the index as closely as possible; the Fundwill hold a cash position of up to 5% to handlecurrency hedging.
Investment policyThe aim of the fund is to provide investors witha return linked to the performance of theunderlying Dow Jones Credit Suisse AllHedgeIndex. The Dow Jones Credit Suisse AllHedgeIndex is a diversified investable hedge fund index.It includes the ten sector indices weightedaccording to the broad index weights of the DowJones Credit Suisse AllHedge Index, a widelyrecognized asset-weighted hedge fund index.
Fund facts
Unit class currency USD
Bloomberg ticker CSALLID LX
Net asset value (NAV) 1'018.02
2) «Swinging single pricing» (SSP) is a state-of-the-art methodused to calculate the net asset value of investment funds. SSPenables a fund to have the cash needed to settle the dailytransaction costs relating to subscriptions and redemptions byinvestors buying into and selling out of the fund. Existing investorsno longer have to indirectly cover these transaction costs as SSPintegrates the charges for transaction costs into the net assetvalue calculation, meaning investors buying into/selling out of thefund bear these costs.
Source: Lipper, a Reuters Company
Cre
dit S
uiss
e S
olut
ions
1) Historical performance indications and financial market scenarios are no guarantee for current or future performance. Performance indications do not consider commissions levied at subscription and/orredemption.
The disclaimer mentioned at the end of this document also applies to this page.
301
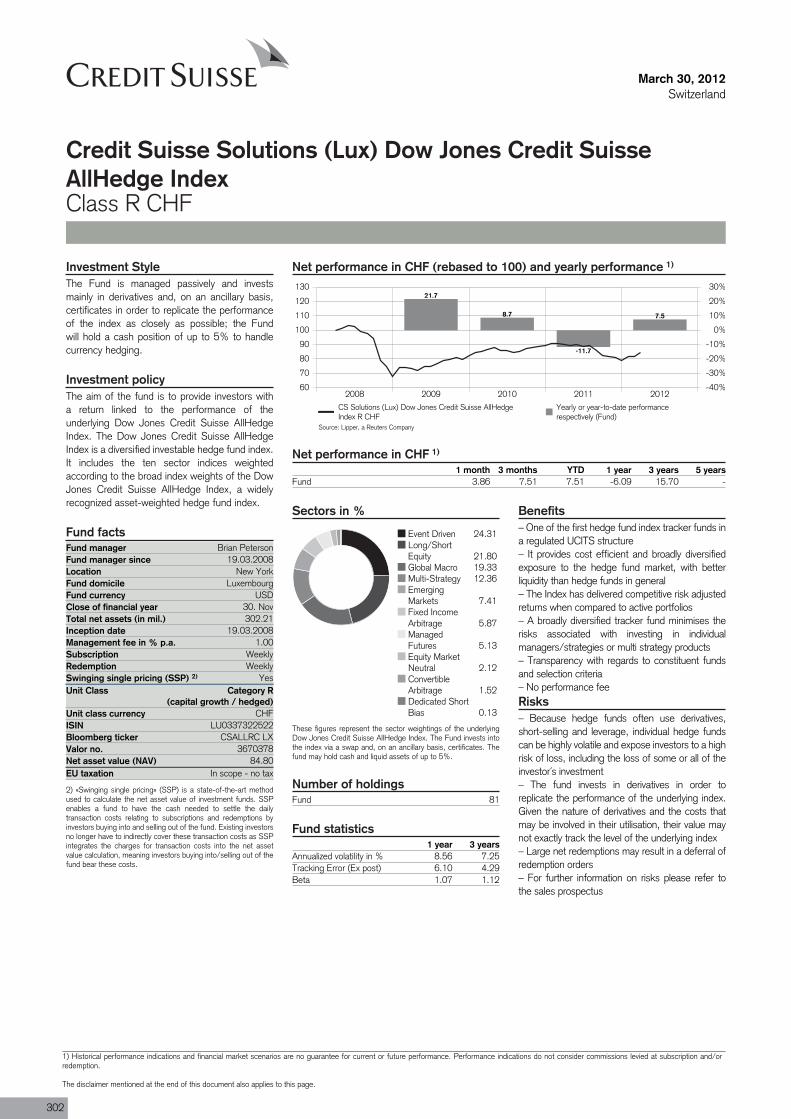
Fund 81
Fund manager Brian PetersonFund manager since 19.03.2008Location New YorkFund domicile LuxembourgFund currency USDClose of financial year 30. NovTotal net assets (in mil.) 302.21Inception date 19.03.2008Management fee in % p.a. 1.00Subscription WeeklyRedemption WeeklySwinging single pricing (SSP) 2) YesUnit Class Category R
(capital growth / hedged)
ISIN LU0337322522
Valor no. 3670378
EU taxation In scope - no tax
March 30, 2012Switzerland
Credit Suisse Solutions (Lux) Dow Jones Credit SuisseAllHedge IndexClass R CHF
Net performance in CHF (rebased to 100) and yearly performance 1)
2008 2009 2010 2011 201260
70
80
90
100
110
120
130
-40%
-30%
-20%
-10%
0%
10%
20%
30%21.7
8.7
-11.7
7.5
CS Solutions (Lux) Dow Jones Credit Suisse AllHedgeIndex R CHF
Yearly or year-to-date performancerespectively (Fund)
Net performance in CHF 1)
1 month 3 months YTD 1 year 3 years 5 yearsFund 3.86 7.51 7.51 -6.09 15.70 -
Sectors in %
Event Driven 24.31Long/ShortEquity 21.80Global Macro 19.33Multi-Strategy 12.36EmergingMarkets 7.41Fixed IncomeArbitrage 5.87ManagedFutures 5.13Equity MarketNeutral 2.12ConvertibleArbitrage 1.52Dedicated ShortBias 0.13
These figures represent the sector weightings of the underlyingDow Jones Credit Suisse AllHedge Index. The Fund invests intothe index via a swap and, on an ancillary basis, certificates. Thefund may hold cash and liquid assets of up to 5%.
Benefits– One of the first hedge fund index tracker funds ina regulated UCITS structure– It provides cost efficient and broadly diversifiedexposure to the hedge fund market, with betterliquidity than hedge funds in general– The Index has delivered competitive risk adjustedreturns when compared to active portfolios– A broadly diversified tracker fund minimises therisks associated with investing in individualmanagers/strategies or multi strategy products– Transparency with regards to constituent fundsand selection criteria– No performance feeRisks– Because hedge funds often use derivatives,short-selling and leverage, individual hedge fundscan be highly volatile and expose investors to a highrisk of loss, including the loss of some or all of theinvestor´s investment– The fund invests in derivatives in order toreplicate the performance of the underlying index.Given the nature of derivatives and the costs thatmay be involved in their utilisation, their value maynot exactly track the level of the underlying index– Large net redemptions may result in a deferral ofredemption orders– For further information on risks please refer tothe sales prospectus
Number of holdings
Fund statistics1 year 3 years
Annualized volatility in % 8.56 7.25Tracking Error (Ex post) 6.10 4.29Beta 1.07 1.12
Investment StyleThe Fund is managed passively and investsmainly in derivatives and, on an ancillary basis,certificates in order to replicate the performanceof the index as closely as possible; the Fundwill hold a cash position of up to 5% to handlecurrency hedging.
Investment policyThe aim of the fund is to provide investors witha return linked to the performance of theunderlying Dow Jones Credit Suisse AllHedgeIndex. The Dow Jones Credit Suisse AllHedgeIndex is a diversified investable hedge fund index.It includes the ten sector indices weightedaccording to the broad index weights of the DowJones Credit Suisse AllHedge Index, a widelyrecognized asset-weighted hedge fund index.
Fund facts
Unit class currency CHF
Bloomberg ticker CSALLRC LX
Net asset value (NAV) 84.80
2) «Swinging single pricing» (SSP) is a state-of-the-art methodused to calculate the net asset value of investment funds. SSPenables a fund to have the cash needed to settle the dailytransaction costs relating to subscriptions and redemptions byinvestors buying into and selling out of the fund. Existing investorsno longer have to indirectly cover these transaction costs as SSPintegrates the charges for transaction costs into the net assetvalue calculation, meaning investors buying into/selling out of thefund bear these costs.
Source: Lipper, a Reuters Company
302
1) Historical performance indications and financial market scenarios are no guarantee for current or future performance. Performance indications do not consider commissions levied at subscription and/orredemption.
The disclaimer mentioned at the end of this document also applies to this page.
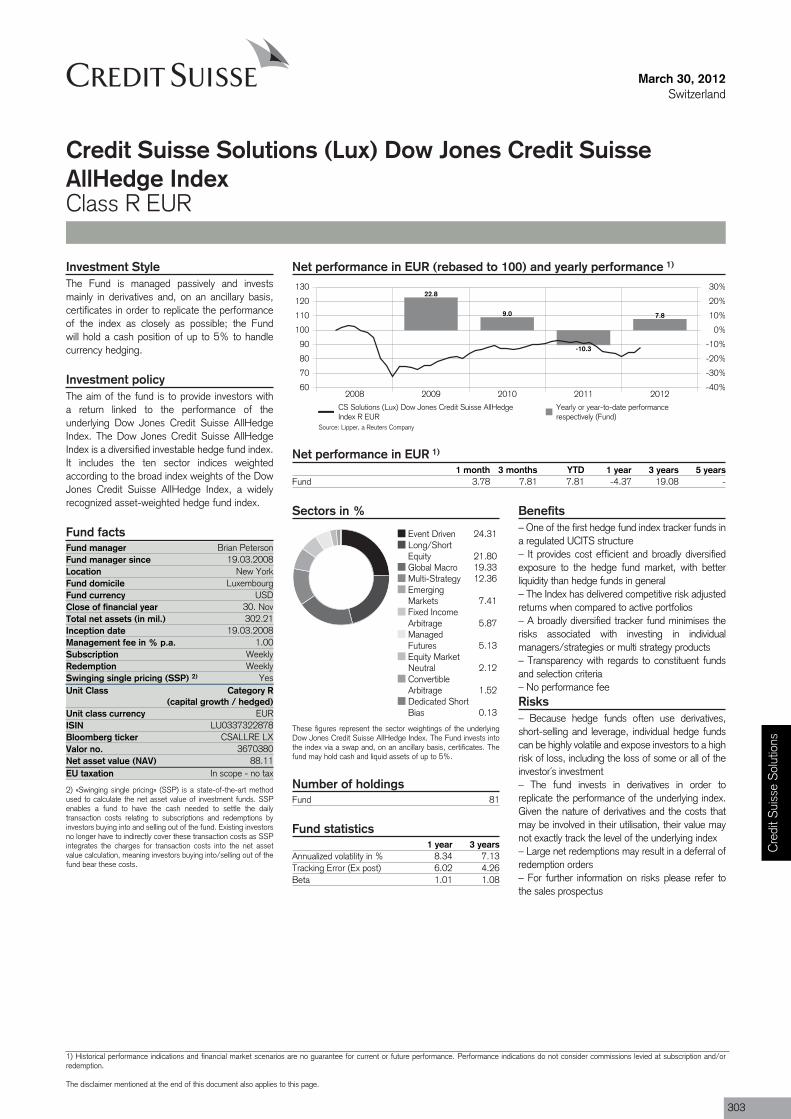
Fund 81
Fund manager Brian PetersonFund manager since 19.03.2008Location New YorkFund domicile LuxembourgFund currency USDClose of financial year 30. NovTotal net assets (in mil.) 302.21Inception date 19.03.2008Management fee in % p.a. 1.00Subscription WeeklyRedemption WeeklySwinging single pricing (SSP) 2) YesUnit Class Category R
(capital growth / hedged)
ISIN LU0337322878
Valor no. 3670380
EU taxation In scope - no tax
March 30, 2012Switzerland
Credit Suisse Solutions (Lux) Dow Jones Credit SuisseAllHedge IndexClass R EUR
Net performance in EUR (rebased to 100) and yearly performance 1)
2008 2009 2010 2011 201260
70
80
90
100
110
120
130
-40%
-30%
-20%
-10%
0%
10%
20%
30%22.8
9.0
-10.3
7.8
CS Solutions (Lux) Dow Jones Credit Suisse AllHedgeIndex R EUR
Yearly or year-to-date performancerespectively (Fund)
Net performance in EUR 1)
1 month 3 months YTD 1 year 3 years 5 yearsFund 3.78 7.81 7.81 -4.37 19.08 -
Sectors in %
Event Driven 24.31Long/ShortEquity 21.80Global Macro 19.33Multi-Strategy 12.36EmergingMarkets 7.41Fixed IncomeArbitrage 5.87ManagedFutures 5.13Equity MarketNeutral 2.12ConvertibleArbitrage 1.52Dedicated ShortBias 0.13
These figures represent the sector weightings of the underlyingDow Jones Credit Suisse AllHedge Index. The Fund invests intothe index via a swap and, on an ancillary basis, certificates. Thefund may hold cash and liquid assets of up to 5%.
Benefits– One of the first hedge fund index tracker funds ina regulated UCITS structure– It provides cost efficient and broadly diversifiedexposure to the hedge fund market, with betterliquidity than hedge funds in general– The Index has delivered competitive risk adjustedreturns when compared to active portfolios– A broadly diversified tracker fund minimises therisks associated with investing in individualmanagers/strategies or multi strategy products– Transparency with regards to constituent fundsand selection criteria– No performance feeRisks– Because hedge funds often use derivatives,short-selling and leverage, individual hedge fundscan be highly volatile and expose investors to a highrisk of loss, including the loss of some or all of theinvestor´s investment– The fund invests in derivatives in order toreplicate the performance of the underlying index.Given the nature of derivatives and the costs thatmay be involved in their utilisation, their value maynot exactly track the level of the underlying index– Large net redemptions may result in a deferral ofredemption orders– For further information on risks please refer tothe sales prospectus
Number of holdings
Fund statistics1 year 3 years
Annualized volatility in % 8.34 7.13Tracking Error (Ex post) 6.02 4.26Beta 1.01 1.08
Investment StyleThe Fund is managed passively and investsmainly in derivatives and, on an ancillary basis,certificates in order to replicate the performanceof the index as closely as possible; the Fundwill hold a cash position of up to 5% to handlecurrency hedging.
Investment policyThe aim of the fund is to provide investors witha return linked to the performance of theunderlying Dow Jones Credit Suisse AllHedgeIndex. The Dow Jones Credit Suisse AllHedgeIndex is a diversified investable hedge fund index.It includes the ten sector indices weightedaccording to the broad index weights of the DowJones Credit Suisse AllHedge Index, a widelyrecognized asset-weighted hedge fund index.
Fund facts
Unit class currency EUR
Bloomberg ticker CSALLRE LX
Net asset value (NAV) 88.11
2) «Swinging single pricing» (SSP) is a state-of-the-art methodused to calculate the net asset value of investment funds. SSPenables a fund to have the cash needed to settle the dailytransaction costs relating to subscriptions and redemptions byinvestors buying into and selling out of the fund. Existing investorsno longer have to indirectly cover these transaction costs as SSPintegrates the charges for transaction costs into the net assetvalue calculation, meaning investors buying into/selling out of thefund bear these costs.
Source: Lipper, a Reuters Company
Cre
dit S
uiss
e S
olut
ions
1) Historical performance indications and financial market scenarios are no guarantee for current or future performance. Performance indications do not consider commissions levied at subscription and/orredemption.
The disclaimer mentioned at the end of this document also applies to this page.
303
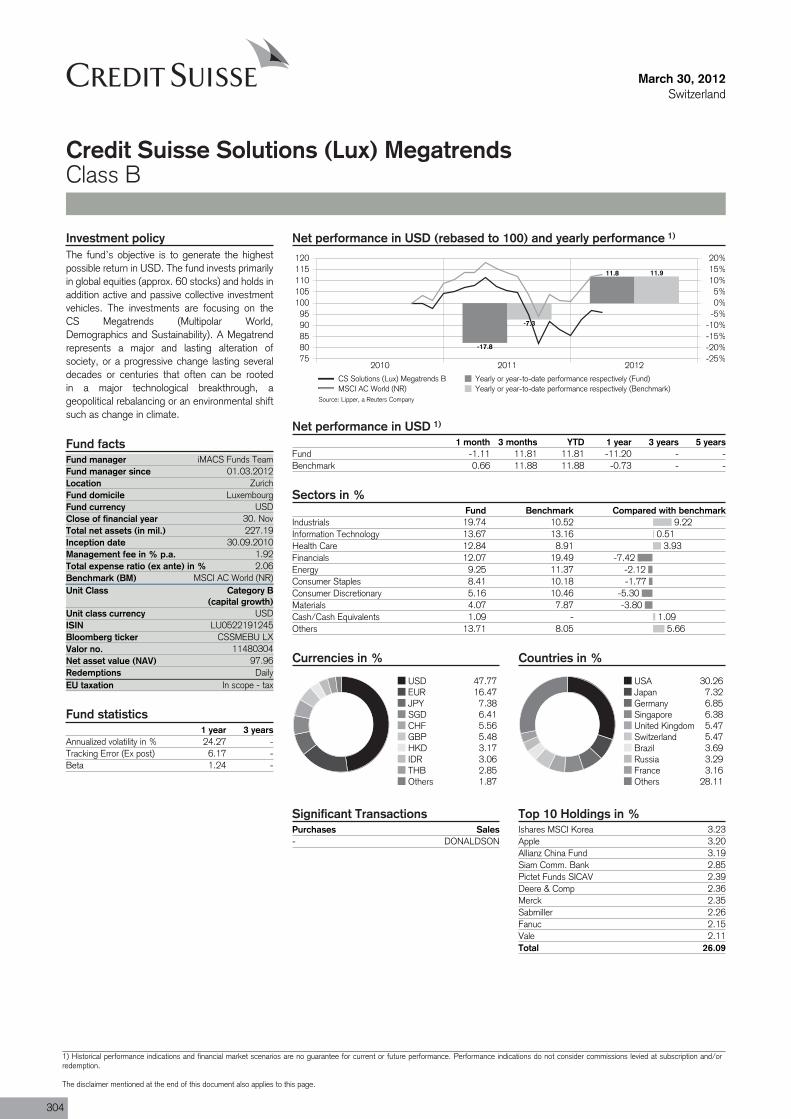
9.220.51
3.93-7.42
-2.12-1.77
-5.30-3.80
1.095.66
Purchases Sales- DONALDSON
Fund manager iMACS Funds TeamFund manager since 01.03.2012Location ZurichFund domicile LuxembourgFund currency USDClose of financial year 30. NovTotal net assets (in mil.) 227.19Inception date 30.09.2010Management fee in % p.a. 1.92Total expense ratio (ex ante) in % 2.06Benchmark (BM) MSCI AC World (NR)Unit Class Category B
(capital growth)
ISIN LU0522191245
Valor no. 11480304
Redemptions DailyEU taxation In scope - tax
March 30, 2012Switzerland
Credit Suisse Solutions (Lux) MegatrendsClass B
Net performance in USD (rebased to 100) and yearly performance 1)
2010 2011 20127580859095
100105110115120
-25%-20%-15%-10%-5%0%5%
10%15%20%
-17.8
11.8
-7.3
11.9
CS Solutions (Lux) Megatrends B Yearly or year-to-date performance respectively (Fund)MSCI AC World (NR) Yearly or year-to-date performance respectively (Benchmark)
Net performance in USD 1)
1 month 3 months YTD 1 year 3 years 5 yearsFund -1.11 11.81 11.81 -11.20 - -Benchmark 0.66 11.88 11.88 -0.73 - -
Sectors in %Fund Benchmark Compared with benchmark
Industrials 19.74 10.52Information Technology 13.67 13.16Health Care 12.84 8.91Financials 12.07 19.49Energy 9.25 11.37Consumer Staples 8.41 10.18Consumer Discretionary 5.16 10.46Materials 4.07 7.87Cash/Cash Equivalents 1.09 -Others 13.71 8.05
Currencies in %
USD 47.77EUR 16.47JPY 7.38SGD 6.41CHF 5.56GBP 5.48HKD 3.17IDR 3.06THB 2.85Others 1.87
Countries in %
USA 30.26Japan 7.32Germany 6.85Singapore 6.38United Kingdom 5.47Switzerland 5.47Brazil 3.69Russia 3.29France 3.16Others 28.11
Top 10 Holdings in %Ishares MSCI Korea 3.23Apple 3.20Allianz China Fund 3.19Siam Comm. Bank 2.85Pictet Funds SICAV 2.39Deere & Comp 2.36Merck 2.35Sabmiller 2.26Fanuc 2.15Vale 2.11Total 26.09
Significant Transactions
Investment policyThe fund’s objective is to generate the highestpossible return in USD. The fund invests primarilyin global equities (approx. 60 stocks) and holds inaddition active and passive collective investmentvehicles. The investments are focusing on theCS Megatrends (Multipolar World,Demographics and Sustainability). A Megatrendrepresents a major and lasting alteration ofsociety, or a progressive change lasting severaldecades or centuries that often can be rootedin a major technological breakthrough, ageopolitical rebalancing or an environmental shiftsuch as change in climate.
Fund facts
Unit class currency USD
Bloomberg ticker CSSMEBU LX
Net asset value (NAV) 97.96
Fund statistics1 year 3 years
Annualized volatility in % 24.27 -Tracking Error (Ex post) 6.17 -Beta 1.24 -
Source: Lipper, a Reuters Company
304
1) Historical performance indications and financial market scenarios are no guarantee for current or future performance. Performance indications do not consider commissions levied at subscription and/orredemption.
The disclaimer mentioned at the end of this document also applies to this page.
March 30, 2012Switzerland
Credit Suisse Solutions (Lux) MegatrendsClass B
Review previous quarter 2)
The first quarter of 2012 was again marked bythe debt situation in the eurozone, albeit this timeon a rather positive note. Government bonds ofItaly and Spain recovered some of their losses,whereas the German, French and some otherbond markets stayed at their low levels. Thegeneral mood could be summarized as “risk on”.
Economic indicators were pointing to a slightacceleration in economic growth, but were stillrather soft. This moved commodity prices up,especially oil. Equity markets also saw an
uptrend in prices. In the currency markets thepeg in EUR/CHF set by the SNB in earlySeptember at 1.20 held. It seems that Japanhas taken a similar course as the SNB and as aconsequence the JPY weakened considerably.
The eurozone showed growth in Q4 2011 of-0.3%, which was in line with expectations andthe unemployment rate increased above 10%.Greece, Italy and Spain entered into recessionduring Q4, so growth rates for the eurozone willbe low in Q1 2012. In the US growth accelerated
to 3% in Q4. House prices stabilized at lowerlevels but new building is still lagging.
Switzerland showed lower GDP growth in Q4 of0.1%, due to the strong Swiss franc dampeningforeign demand. Private consumption is stillrobust, but seems to be losing momentum. Theunemployment rate is stabilizing at low levels.The CPI and PPI are lower than before, with theCPI turning negative y-o-y.
Outlook for the market 2)
On a global level the growth picture still lookssolid. This includes the intact growth trends inAsia. Accordingly, we believe the risk of globalrecession to be moderate, but existing, though
growth in the mature markets is likely to remainvery low.
We have key overweights in the Emerging
Markets, whereas we may remain underweight inthe US, and neutral in the eurozone and Japan .
Portfolio ManagementThe portfolio is managed by a team of experienced investment professionals who are based in Zurich. The fund is managed according to CS private bankingresearch stock selection and in line with CS Asset Management Investment views. The team includes several portfolio managers who contribute to theco-management of the fund according to their area of expertise.
Cre
dit S
uiss
e S
olut
ions
2) If not expressly indicated otherwise, all quantitative data contained in this comment is based on Lipper, Bloomberg or Datastream.
305
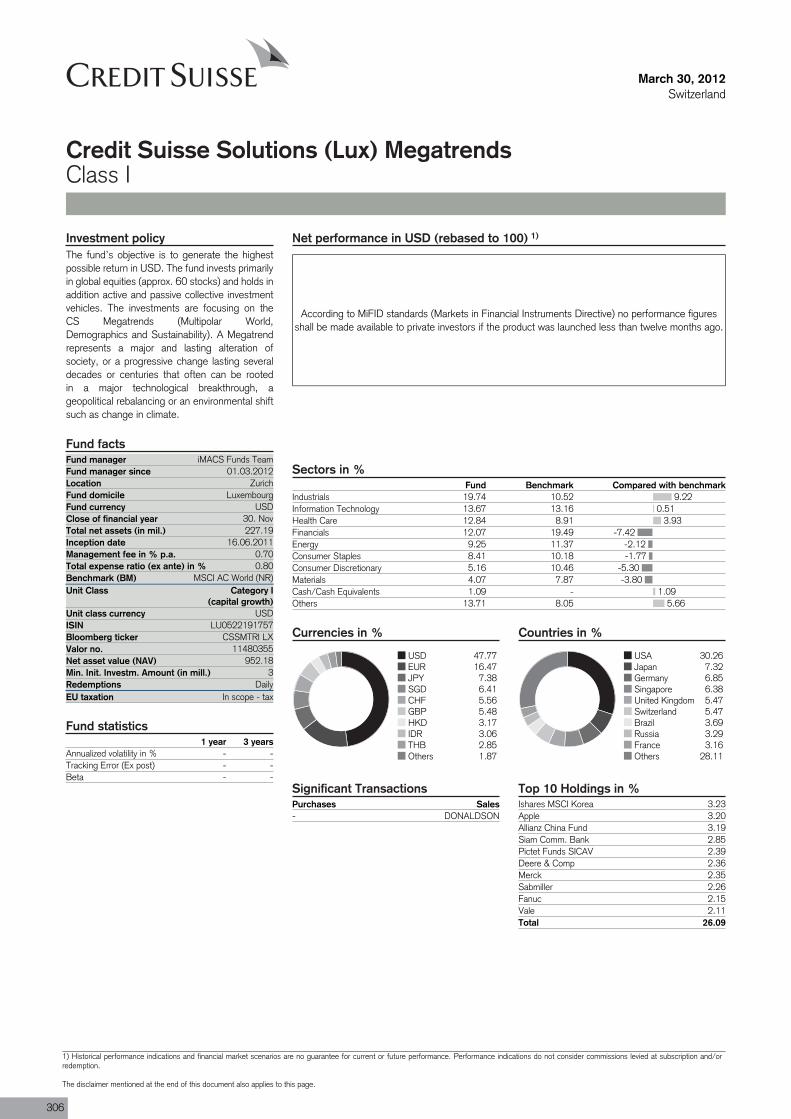
9.220.51
3.93-7.42
-2.12-1.77
-5.30-3.80
1.095.66
Purchases Sales- DONALDSON
Fund manager iMACS Funds TeamFund manager since 01.03.2012Location ZurichFund domicile LuxembourgFund currency USDClose of financial year 30. NovTotal net assets (in mil.) 227.19Inception date 16.06.2011Management fee in % p.a. 0.70Total expense ratio (ex ante) in % 0.80Benchmark (BM) MSCI AC World (NR)Unit Class Category I
(capital growth)
ISIN LU0522191757
Valor no. 11480355
Min. Init. Investm. Amount (in mill.) 3Redemptions DailyEU taxation In scope - tax
March 30, 2012Switzerland
Credit Suisse Solutions (Lux) MegatrendsClass I
Net performance in USD (rebased to 100) 1)
According to MiFID standards (Markets in Financial Instruments Directive) no performance figuresshall be made available to private investors if the product was launched less than twelve months ago.
Sectors in %Fund Benchmark Compared with benchmark
Industrials 19.74 10.52Information Technology 13.67 13.16Health Care 12.84 8.91Financials 12.07 19.49Energy 9.25 11.37Consumer Staples 8.41 10.18Consumer Discretionary 5.16 10.46Materials 4.07 7.87Cash/Cash Equivalents 1.09 -Others 13.71 8.05
Currencies in %
USD 47.77EUR 16.47JPY 7.38SGD 6.41CHF 5.56GBP 5.48HKD 3.17IDR 3.06THB 2.85Others 1.87
Countries in %
USA 30.26Japan 7.32Germany 6.85Singapore 6.38United Kingdom 5.47Switzerland 5.47Brazil 3.69Russia 3.29France 3.16Others 28.11
Top 10 Holdings in %Ishares MSCI Korea 3.23Apple 3.20Allianz China Fund 3.19Siam Comm. Bank 2.85Pictet Funds SICAV 2.39Deere & Comp 2.36Merck 2.35Sabmiller 2.26Fanuc 2.15Vale 2.11Total 26.09
Significant Transactions
Investment policyThe fund’s objective is to generate the highestpossible return in USD. The fund invests primarilyin global equities (approx. 60 stocks) and holds inaddition active and passive collective investmentvehicles. The investments are focusing on theCS Megatrends (Multipolar World,Demographics and Sustainability). A Megatrendrepresents a major and lasting alteration ofsociety, or a progressive change lasting severaldecades or centuries that often can be rootedin a major technological breakthrough, ageopolitical rebalancing or an environmental shiftsuch as change in climate.
Fund facts
Unit class currency USD
Bloomberg ticker CSSMTRI LX
Net asset value (NAV) 952.18
Fund statistics1 year 3 years
Annualized volatility in % - -Tracking Error (Ex post) - -Beta - -
306
1) Historical performance indications and financial market scenarios are no guarantee for current or future performance. Performance indications do not consider commissions levied at subscription and/orredemption.
The disclaimer mentioned at the end of this document also applies to this page.

March 30, 2012Switzerland
Credit Suisse Solutions (Lux) MegatrendsClass I
Review previous quarter 2)
The first quarter of 2012 was again marked bythe debt situation in the eurozone, albeit this timeon a rather positive note. Government bonds ofItaly and Spain recovered some of their losses,whereas the German, French and some otherbond markets stayed at their low levels. Thegeneral mood could be summarized as “risk on”.
Economic indicators were pointing to a slightacceleration in economic growth, but were stillrather soft. This moved commodity prices up,especially oil. Equity markets also saw an
uptrend in prices. In the currency markets thepeg in EUR/CHF set by the SNB in earlySeptember at 1.20 held. It seems that Japanhas taken a similar course as the SNB and as aconsequence the JPY weakened considerably.
The eurozone showed growth in Q4 2011 of-0.3%, which was in line with expectations andthe unemployment rate increased above 10%.Greece, Italy and Spain entered into recessionduring Q4, so growth rates for the eurozone willbe low in Q1 2012. In the US growth accelerated
to 3% in Q4. House prices stabilized at lowerlevels but new building is still lagging.
Switzerland showed lower GDP growth in Q4 of0.1%, due to the strong Swiss franc dampeningforeign demand. Private consumption is stillrobust, but seems to be losing momentum. Theunemployment rate is stabilizing at low levels.The CPI and PPI are lower than before, with theCPI turning negative y-o-y.
Outlook for the market 2)
On a global level the growth picture still lookssolid. This includes the intact growth trends inAsia. Accordingly, we believe the risk of globalrecession to be moderate, but existing, though
growth in the mature markets is likely to remainvery low.
We have key overweights in the Emerging
Markets, whereas we may remain underweight inthe US, and neutral in the eurozone and Japan .
Portfolio ManagementThe portfolio is managed by a team of experienced investment professionals who are based in Zurich. The fund is managed according to CS private bankingresearch stock selection and in line with CS Asset Management Investment views. The team includes several portfolio managers who contribute to theco-management of the fund according to their area of expertise.
Cre
dit S
uiss
e S
olut
ions
2) If not expressly indicated otherwise, all quantitative data contained in this comment is based on Lipper, Bloomberg or Datastream.
307
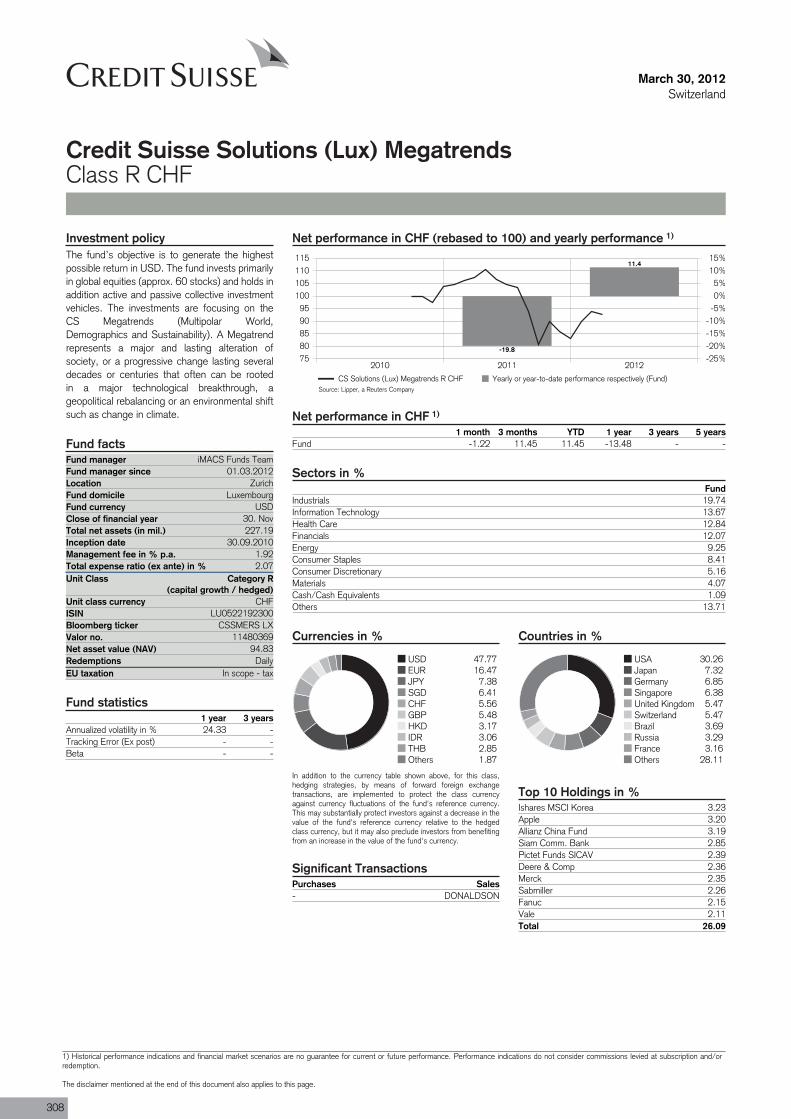
Purchases Sales- DONALDSON
Fund manager iMACS Funds TeamFund manager since 01.03.2012Location ZurichFund domicile LuxembourgFund currency USDClose of financial year 30. NovTotal net assets (in mil.) 227.19Inception date 30.09.2010Management fee in % p.a. 1.92Total expense ratio (ex ante) in % 2.07Unit Class Category R
(capital growth / hedged)
ISIN LU0522192300
Valor no. 11480369
Redemptions DailyEU taxation In scope - tax
March 30, 2012Switzerland
Credit Suisse Solutions (Lux) MegatrendsClass R CHF
Net performance in CHF (rebased to 100) and yearly performance 1)
2010 2011 20127580859095
100105110115
-25%-20%-15%-10%-5%0%5%
10%15%
-19.8
11.4
CS Solutions (Lux) Megatrends R CHF Yearly or year-to-date performance respectively (Fund)
Net performance in CHF 1)
1 month 3 months YTD 1 year 3 years 5 yearsFund -1.22 11.45 11.45 -13.48 - -
Sectors in %Fund
Industrials 19.74Information Technology 13.67Health Care 12.84Financials 12.07Energy 9.25Consumer Staples 8.41Consumer Discretionary 5.16Materials 4.07Cash/Cash Equivalents 1.09Others 13.71
Currencies in %
USD 47.77EUR 16.47JPY 7.38SGD 6.41CHF 5.56GBP 5.48HKD 3.17IDR 3.06THB 2.85Others 1.87
In addition to the currency table shown above, for this class,hedging strategies, by means of forward foreign exchangetransactions, are implemented to protect the class currencyagainst currency fluctuations of the fund's reference currency.This may substantially protect investors against a decrease in thevalue of the fund's reference currency relative to the hedgedclass currency, but it may also preclude investors from benefitingfrom an increase in the value of the fund's currency.
Countries in %
USA 30.26Japan 7.32Germany 6.85Singapore 6.38United Kingdom 5.47Switzerland 5.47Brazil 3.69Russia 3.29France 3.16Others 28.11
Top 10 Holdings in %Ishares MSCI Korea 3.23Apple 3.20Allianz China Fund 3.19Siam Comm. Bank 2.85Pictet Funds SICAV 2.39Deere & Comp 2.36Merck 2.35Sabmiller 2.26Fanuc 2.15Vale 2.11Total 26.09
Significant Transactions
Investment policyThe fund’s objective is to generate the highestpossible return in USD. The fund invests primarilyin global equities (approx. 60 stocks) and holds inaddition active and passive collective investmentvehicles. The investments are focusing on theCS Megatrends (Multipolar World,Demographics and Sustainability). A Megatrendrepresents a major and lasting alteration ofsociety, or a progressive change lasting severaldecades or centuries that often can be rootedin a major technological breakthrough, ageopolitical rebalancing or an environmental shiftsuch as change in climate.
Fund facts
Unit class currency CHF
Bloomberg ticker CSSMERS LX
Net asset value (NAV) 94.83
Fund statistics1 year 3 years
Annualized volatility in % 24.33 -Tracking Error (Ex post) - -Beta - -
Source: Lipper, a Reuters Company
308
1) Historical performance indications and financial market scenarios are no guarantee for current or future performance. Performance indications do not consider commissions levied at subscription and/orredemption.
The disclaimer mentioned at the end of this document also applies to this page.

March 30, 2012Switzerland
Credit Suisse Solutions (Lux) MegatrendsClass R CHF
Review previous quarter 2)
The first quarter of 2012 was again marked bythe debt situation in the eurozone, albeit this timeon a rather positive note. Government bonds ofItaly and Spain recovered some of their losses,whereas the German, French and some otherbond markets stayed at their low levels. Thegeneral mood could be summarized as “risk on”.
Economic indicators were pointing to a slightacceleration in economic growth, but were stillrather soft. This moved commodity prices up,especially oil. Equity markets also saw an
uptrend in prices. In the currency markets thepeg in EUR/CHF set by the SNB in earlySeptember at 1.20 held. It seems that Japanhas taken a similar course as the SNB and as aconsequence the JPY weakened considerably.
The eurozone showed growth in Q4 2011 of-0.3%, which was in line with expectations andthe unemployment rate increased above 10%.Greece, Italy and Spain entered into recessionduring Q4, so growth rates for the eurozone willbe low in Q1 2012. In the US growth accelerated
to 3% in Q4. House prices stabilized at lowerlevels but new building is still lagging.
Switzerland showed lower GDP growth in Q4 of0.1%, due to the strong Swiss franc dampeningforeign demand. Private consumption is stillrobust, but seems to be losing momentum. Theunemployment rate is stabilizing at low levels.The CPI and PPI are lower than before, with theCPI turning negative y-o-y.
Outlook for the market 2)
On a global level the growth picture still lookssolid. This includes the intact growth trends inAsia. Accordingly, we believe the risk of globalrecession to be moderate, but existing, though
growth in the mature markets is likely to remainvery low.
We have key overweights in the Emerging
Markets, whereas we may remain underweight inthe US, and neutral in the eurozone and Japan .
Portfolio ManagementThe portfolio is managed by a team of experienced investment professionals who are based in Zurich. The fund is managed according to CS private bankingresearch stock selection and in line with CS Asset Management Investment views. The team includes several portfolio managers who contribute to theco-management of the fund according to their area of expertise.
Cre
dit S
uiss
e S
olut
ions
2) If not expressly indicated otherwise, all quantitative data contained in this comment is based on Lipper, Bloomberg or Datastream.
309

Purchases Sales- DONALDSON
Fund manager iMACS Funds TeamFund manager since 01.03.2012Location ZurichFund domicile LuxembourgFund currency USDClose of financial year 30. NovTotal net assets (in mil.) 227.19Inception date 30.09.2010Management fee in % p.a. 1.92Total expense ratio (ex ante) in % 2.06Unit Class Category R
(capital growth / hedged)
ISIN LU0522192136
Valor no. 11480366
Redemptions DailyEU taxation In scope - tax
March 30, 2012Switzerland
Credit Suisse Solutions (Lux) MegatrendsClass R EUR
Net performance in EUR (rebased to 100) and yearly performance 1)
2010 2011 20127580859095
100105110115
-25%-20%-15%-10%-5%0%5%
10%15%
-19.3
11.7
CS Solutions (Lux) Megatrends R EUR Yearly or year-to-date performance respectively (Fund)
Net performance in EUR 1)
1 month 3 months YTD 1 year 3 years 5 yearsFund -1.24 11.72 11.72 -12.80 - -
Sectors in %Fund
Industrials 19.74Information Technology 13.67Health Care 12.84Financials 12.07Energy 9.25Consumer Staples 8.41Consumer Discretionary 5.16Materials 4.07Cash/Cash Equivalents 1.09Others 13.71
Currencies in %
USD 47.77EUR 16.47JPY 7.38SGD 6.41CHF 5.56GBP 5.48HKD 3.17IDR 3.06THB 2.85Others 1.87
In addition to the currency table shown above, for this class,hedging strategies, by means of forward foreign exchangetransactions, are implemented to protect the class currencyagainst currency fluctuations of the fund's reference currency.This may substantially protect investors against a decrease in thevalue of the fund's reference currency relative to the hedgedclass currency, but it may also preclude investors from benefitingfrom an increase in the value of the fund's currency.
Countries in %
USA 30.26Japan 7.32Germany 6.85Singapore 6.38United Kingdom 5.47Switzerland 5.47Brazil 3.69Russia 3.29France 3.16Others 28.11
Top 10 Holdings in %Ishares MSCI Korea 3.23Apple 3.20Allianz China Fund 3.19Siam Comm. Bank 2.85Pictet Funds SICAV 2.39Deere & Comp 2.36Merck 2.35Sabmiller 2.26Fanuc 2.15Vale 2.11Total 26.09
Significant Transactions
Investment policyThe fund’s objective is to generate the highestpossible return in USD. The fund invests primarilyin global equities (approx. 60 stocks) and holds inaddition active and passive collective investmentvehicles. The investments are focusing on theCS Megatrends (Multipolar World,Demographics and Sustainability). A Megatrendrepresents a major and lasting alteration ofsociety, or a progressive change lasting severaldecades or centuries that often can be rootedin a major technological breakthrough, ageopolitical rebalancing or an environmental shiftsuch as change in climate.
Fund facts
Unit class currency EUR
Bloomberg ticker CSSMERE LX
Net asset value (NAV) 95.64
Fund statistics1 year 3 years
Annualized volatility in % 24.39 -Tracking Error (Ex post) - -Beta - -
Source: Lipper, a Reuters Company
310
1) Historical performance indications and financial market scenarios are no guarantee for current or future performance. Performance indications do not consider commissions levied at subscription and/orredemption.
The disclaimer mentioned at the end of this document also applies to this page.
March 30, 2012Switzerland
Credit Suisse Solutions (Lux) MegatrendsClass R EUR
Review previous quarter 2)
The first quarter of 2012 was again marked bythe debt situation in the eurozone, albeit this timeon a rather positive note. Government bonds ofItaly and Spain recovered some of their losses,whereas the German, French and some otherbond markets stayed at their low levels. Thegeneral mood could be summarized as “risk on”.
Economic indicators were pointing to a slightacceleration in economic growth, but were stillrather soft. This moved commodity prices up,especially oil. Equity markets also saw an
uptrend in prices. In the currency markets thepeg in EUR/CHF set by the SNB in earlySeptember at 1.20 held. It seems that Japanhas taken a similar course as the SNB and as aconsequence the JPY weakened considerably.
The eurozone showed growth in Q4 2011 of-0.3%, which was in line with expectations andthe unemployment rate increased above 10%.Greece, Italy and Spain entered into recessionduring Q4, so growth rates for the eurozone willbe low in Q1 2012. In the US growth accelerated
to 3% in Q4. House prices stabilized at lowerlevels but new building is still lagging.
Switzerland showed lower GDP growth in Q4 of0.1%, due to the strong Swiss franc dampeningforeign demand. Private consumption is stillrobust, but seems to be losing momentum. Theunemployment rate is stabilizing at low levels.The CPI and PPI are lower than before, with theCPI turning negative y-o-y.
Outlook for the market 2)
On a global level the growth picture still lookssolid. This includes the intact growth trends inAsia. Accordingly, we believe the risk of globalrecession to be moderate, but existing, though
growth in the mature markets is likely to remainvery low.
We have key overweights in the Emerging
Markets, whereas we may remain underweight inthe US, and neutral in the eurozone and Japan .
Portfolio ManagementThe portfolio is managed by a team of experienced investment professionals who are based in Zurich. The fund is managed according to CS private bankingresearch stock selection and in line with CS Asset Management Investment views. The team includes several portfolio managers who contribute to theco-management of the fund according to their area of expertise.
Cre
dit S
uiss
e S
olut
ions
2) If not expressly indicated otherwise, all quantitative data contained in this comment is based on Lipper, Bloomberg or Datastream.
311
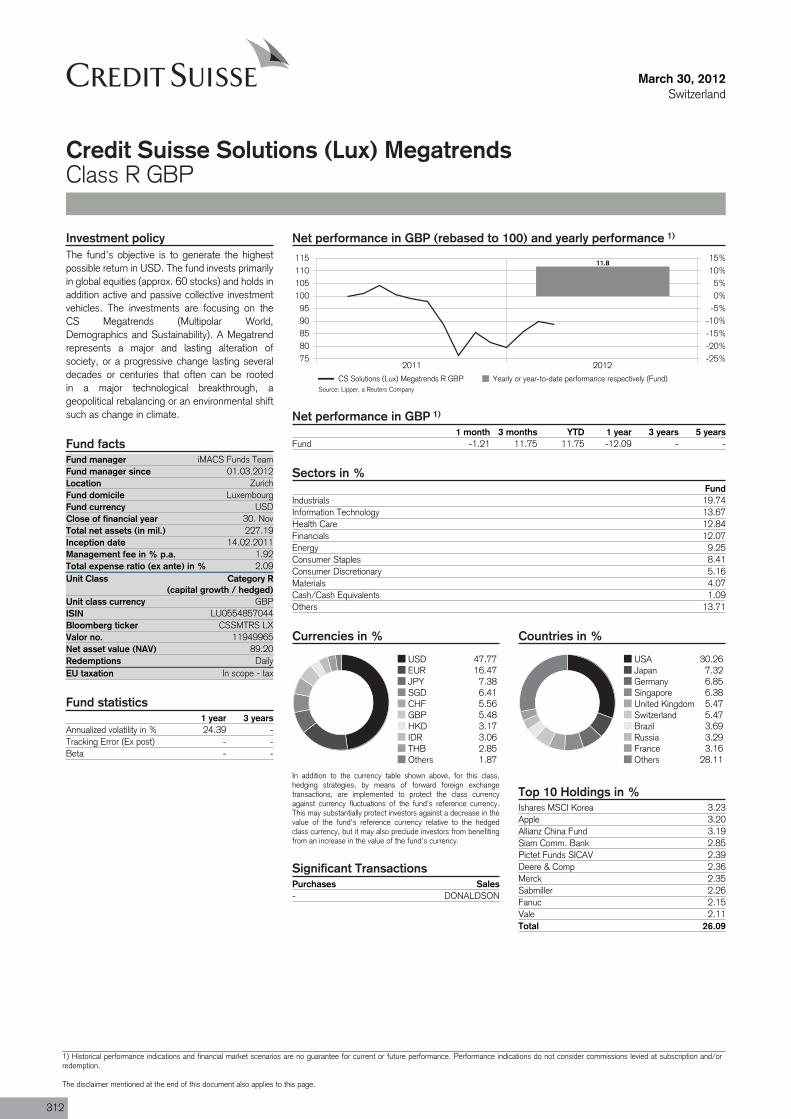
Purchases Sales- DONALDSON
Fund manager iMACS Funds TeamFund manager since 01.03.2012Location ZurichFund domicile LuxembourgFund currency USDClose of financial year 30. NovTotal net assets (in mil.) 227.19Inception date 14.02.2011Management fee in % p.a. 1.92Total expense ratio (ex ante) in % 2.09Unit Class Category R
(capital growth / hedged)
ISIN LU0554857044
Valor no. 11949965
Redemptions DailyEU taxation In scope - tax
March 30, 2012Switzerland
Credit Suisse Solutions (Lux) MegatrendsClass R GBP
Net performance in GBP (rebased to 100) and yearly performance 1)
2011 20127580859095
100105110115
-25%-20%-15%-10%-5%0%5%
10%15%
11.8
CS Solutions (Lux) Megatrends R GBP Yearly or year-to-date performance respectively (Fund)
Net performance in GBP 1)
1 month 3 months YTD 1 year 3 years 5 yearsFund -1.21 11.75 11.75 -12.09 - -
Sectors in %Fund
Industrials 19.74Information Technology 13.67Health Care 12.84Financials 12.07Energy 9.25Consumer Staples 8.41Consumer Discretionary 5.16Materials 4.07Cash/Cash Equivalents 1.09Others 13.71
Currencies in %
USD 47.77EUR 16.47JPY 7.38SGD 6.41CHF 5.56GBP 5.48HKD 3.17IDR 3.06THB 2.85Others 1.87
In addition to the currency table shown above, for this class,hedging strategies, by means of forward foreign exchangetransactions, are implemented to protect the class currencyagainst currency fluctuations of the fund's reference currency.This may substantially protect investors against a decrease in thevalue of the fund's reference currency relative to the hedgedclass currency, but it may also preclude investors from benefitingfrom an increase in the value of the fund's currency.
Countries in %
USA 30.26Japan 7.32Germany 6.85Singapore 6.38United Kingdom 5.47Switzerland 5.47Brazil 3.69Russia 3.29France 3.16Others 28.11
Top 10 Holdings in %Ishares MSCI Korea 3.23Apple 3.20Allianz China Fund 3.19Siam Comm. Bank 2.85Pictet Funds SICAV 2.39Deere & Comp 2.36Merck 2.35Sabmiller 2.26Fanuc 2.15Vale 2.11Total 26.09
Significant Transactions
Investment policyThe fund’s objective is to generate the highestpossible return in USD. The fund invests primarilyin global equities (approx. 60 stocks) and holds inaddition active and passive collective investmentvehicles. The investments are focusing on theCS Megatrends (Multipolar World,Demographics and Sustainability). A Megatrendrepresents a major and lasting alteration ofsociety, or a progressive change lasting severaldecades or centuries that often can be rootedin a major technological breakthrough, ageopolitical rebalancing or an environmental shiftsuch as change in climate.
Fund facts
Unit class currency GBP
Bloomberg ticker CSSMTRS LX
Net asset value (NAV) 89.20
Fund statistics1 year 3 years
Annualized volatility in % 24.39 -Tracking Error (Ex post) - -Beta - -
Source: Lipper, a Reuters Company
312
1) Historical performance indications and financial market scenarios are no guarantee for current or future performance. Performance indications do not consider commissions levied at subscription and/orredemption.
The disclaimer mentioned at the end of this document also applies to this page.

March 30, 2012Switzerland
Credit Suisse Solutions (Lux) MegatrendsClass R GBP
Review previous quarter 2)
The first quarter of 2012 was again marked bythe debt situation in the eurozone, albeit this timeon a rather positive note. Government bonds ofItaly and Spain recovered some of their losses,whereas the German, French and some otherbond markets stayed at their low levels. Thegeneral mood could be summarized as “risk on”.
Economic indicators were pointing to a slightacceleration in economic growth, but were stillrather soft. This moved commodity prices up,especially oil. Equity markets also saw an
uptrend in prices. In the currency markets thepeg in EUR/CHF set by the SNB in earlySeptember at 1.20 held. It seems that Japanhas taken a similar course as the SNB and as aconsequence the JPY weakened considerably.
The eurozone showed growth in Q4 2011 of-0.3%, which was in line with expectations andthe unemployment rate increased above 10%.Greece, Italy and Spain entered into recessionduring Q4, so growth rates for the eurozone willbe low in Q1 2012. In the US growth accelerated
to 3% in Q4. House prices stabilized at lowerlevels but new building is still lagging.
Switzerland showed lower GDP growth in Q4 of0.1%, due to the strong Swiss franc dampeningforeign demand. Private consumption is stillrobust, but seems to be losing momentum. Theunemployment rate is stabilizing at low levels.The CPI and PPI are lower than before, with theCPI turning negative y-o-y.
Outlook for the market 2)
On a global level the growth picture still lookssolid. This includes the intact growth trends inAsia. Accordingly, we believe the risk of globalrecession to be moderate, but existing, though
growth in the mature markets is likely to remainvery low.
We have key overweights in the Emerging
Markets, whereas we may remain underweight inthe US, and neutral in the eurozone and Japan .
Portfolio ManagementThe portfolio is managed by a team of experienced investment professionals who are based in Zurich. The fund is managed according to CS private bankingresearch stock selection and in line with CS Asset Management Investment views. The team includes several portfolio managers who contribute to theco-management of the fund according to their area of expertise.
Cre
dit S
uiss
e S
olut
ions
2) If not expressly indicated otherwise, all quantitative data contained in this comment is based on Lipper, Bloomberg or Datastream.
313
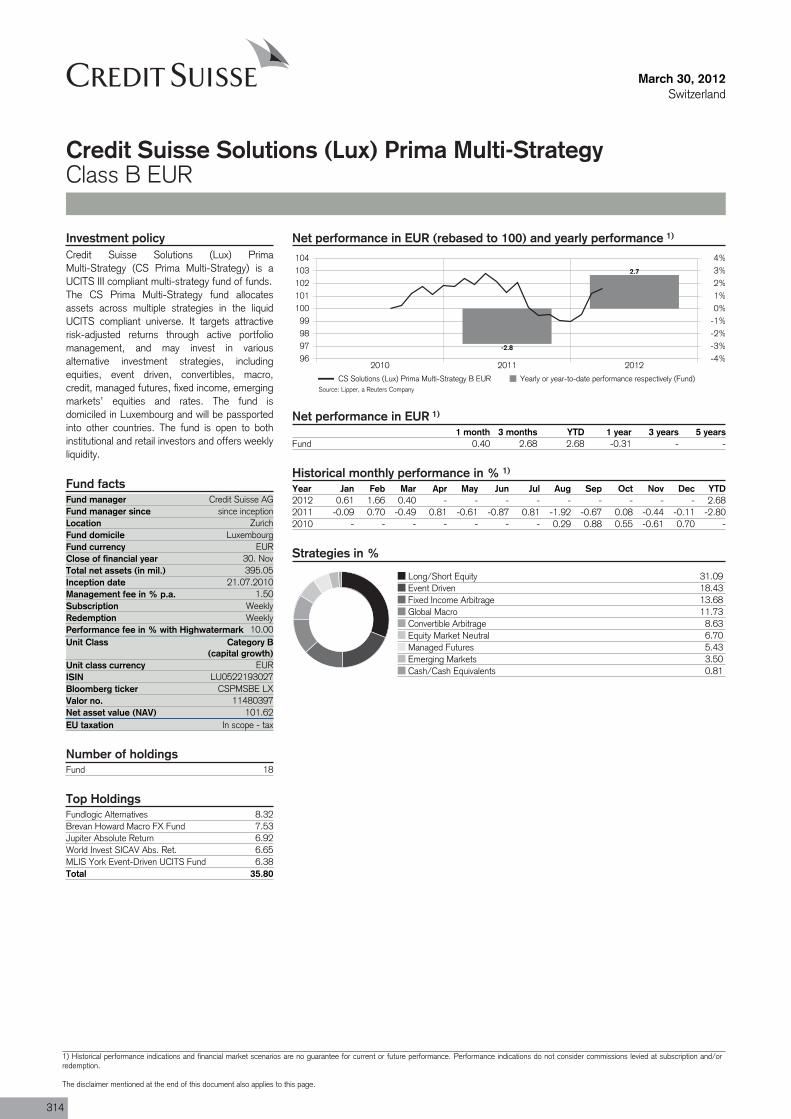
Fund manager Credit Suisse AGFund manager since since inceptionLocation ZurichFund domicile LuxembourgFund currency EURClose of financial year 30. NovTotal net assets (in mil.) 395.05Inception date 21.07.2010Management fee in % p.a. 1.50Subscription WeeklyRedemption WeeklyPerformance fee in % with Highwatermark 10.00Unit Class Category B
(capital growth)
ISIN LU0522193027
Valor no. 11480397
EU taxation In scope - tax
Fund 18
March 30, 2012Switzerland
Credit Suisse Solutions (Lux) Prima Multi-StrategyClass B EUR
Net performance in EUR (rebased to 100) and yearly performance 1)
2010 2011 201296979899
100101102103104
-4%-3%-2%-1%0%1%2%3%4%
-2.8
2.7
CS Solutions (Lux) Prima Multi-Strategy B EUR Yearly or year-to-date performance respectively (Fund)
Net performance in EUR 1)
1 month 3 months YTD 1 year 3 years 5 yearsFund 0.40 2.68 2.68 -0.31 - -
Historical monthly performance in % 1)
Year Jan Feb Mar Apr May Jun Jul Aug Sep Oct Nov Dec YTD2012 0.61 1.66 0.40 - - - - - - - - - 2.682011 -0.09 0.70 -0.49 0.81 -0.61 -0.87 0.81 -1.92 -0.67 0.08 -0.44 -0.11 -2.802010 - - - - - - - 0.29 0.88 0.55 -0.61 0.70 -
Investment policyCredit Suisse Solutions (Lux) PrimaMulti-Strategy (CS Prima Multi-Strategy) is aUCITS III compliant multi-strategy fund of funds.The CS Prima Multi-Strategy fund allocatesassets across multiple strategies in the liquidUCITS compliant universe. It targets attractiverisk-adjusted returns through active portfoliomanagement, and may invest in variousalternative investment strategies, includingequities, event driven, convertibles, macro,credit, managed futures, fixed income, emergingmarkets’ equities and rates. The fund isdomiciled in Luxembourg and will be passportedinto other countries. The fund is open to bothinstitutional and retail investors and offers weeklyliquidity.
Fund facts
Unit class currency EUR
Bloomberg ticker CSPMSBE LX
Net asset value (NAV) 101.62
Strategies in %
Long/Short Equity 31.09Event Driven 18.43Fixed Income Arbitrage 13.68Global Macro 11.73Convertible Arbitrage 8.63Equity Market Neutral 6.70Managed Futures 5.43Emerging Markets 3.50Cash/Cash Equivalents 0.81
Number of holdings
Top HoldingsFundlogic Alternatives 8.32Brevan Howard Macro FX Fund 7.53Jupiter Absolute Return 6.92World Invest SICAV Abs. Ret. 6.65MLIS York Event-Driven UCITS Fund 6.38Total 35.80
Source: Lipper, a Reuters Company
314
1) Historical performance indications and financial market scenarios are no guarantee for current or future performance. Performance indications do not consider commissions levied at subscription and/orredemption.
The disclaimer mentioned at the end of this document also applies to this page.
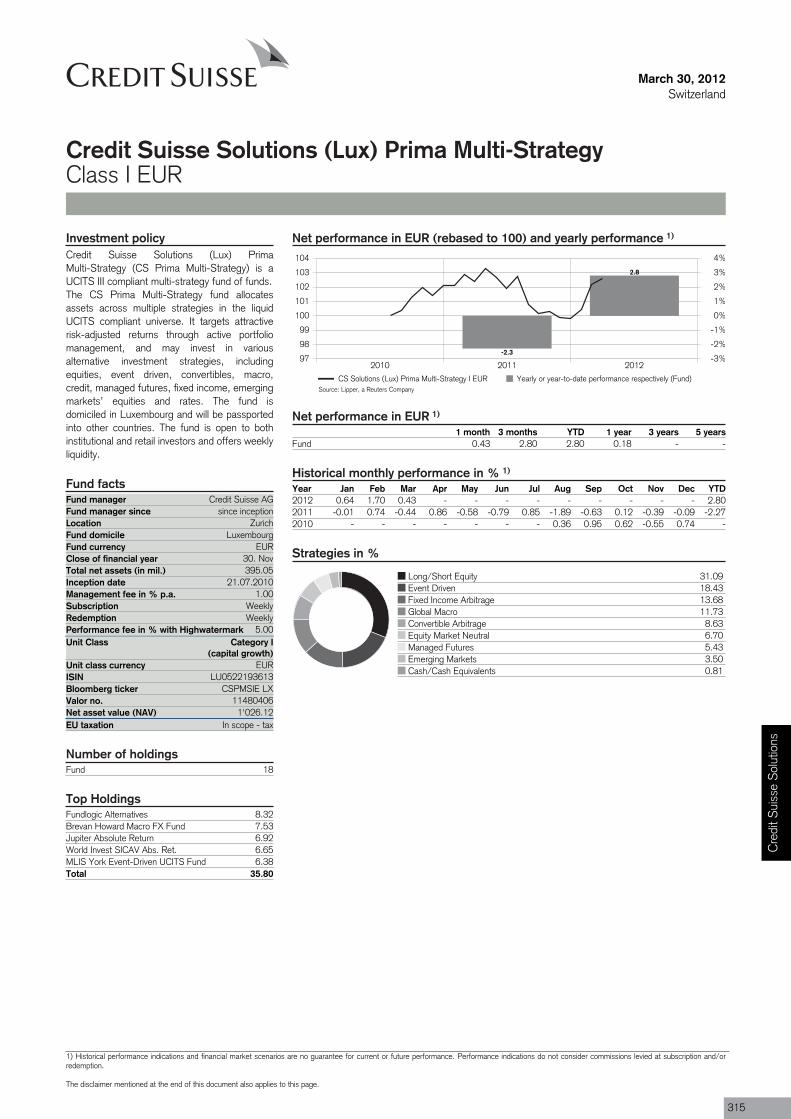
Fund manager Credit Suisse AGFund manager since since inceptionLocation ZurichFund domicile LuxembourgFund currency EURClose of financial year 30. NovTotal net assets (in mil.) 395.05Inception date 21.07.2010Management fee in % p.a. 1.00Subscription WeeklyRedemption WeeklyPerformance fee in % with Highwatermark 5.00Unit Class Category I
(capital growth)
ISIN LU0522193613
Valor no. 11480406
EU taxation In scope - tax
Fund 18
March 30, 2012Switzerland
Credit Suisse Solutions (Lux) Prima Multi-StrategyClass I EUR
Net performance in EUR (rebased to 100) and yearly performance 1)
2010 2011 201297
98
99
100
101
102
103
104
-3%
-2%
-1%
0%
1%
2%
3%
4%
-2.3
2.8
CS Solutions (Lux) Prima Multi-Strategy I EUR Yearly or year-to-date performance respectively (Fund)
Net performance in EUR 1)
1 month 3 months YTD 1 year 3 years 5 yearsFund 0.43 2.80 2.80 0.18 - -
Historical monthly performance in % 1)
Year Jan Feb Mar Apr May Jun Jul Aug Sep Oct Nov Dec YTD2012 0.64 1.70 0.43 - - - - - - - - - 2.802011 -0.01 0.74 -0.44 0.86 -0.58 -0.79 0.85 -1.89 -0.63 0.12 -0.39 -0.09 -2.272010 - - - - - - - 0.36 0.95 0.62 -0.55 0.74 -
Investment policyCredit Suisse Solutions (Lux) PrimaMulti-Strategy (CS Prima Multi-Strategy) is aUCITS III compliant multi-strategy fund of funds.The CS Prima Multi-Strategy fund allocatesassets across multiple strategies in the liquidUCITS compliant universe. It targets attractiverisk-adjusted returns through active portfoliomanagement, and may invest in variousalternative investment strategies, includingequities, event driven, convertibles, macro,credit, managed futures, fixed income, emergingmarkets’ equities and rates. The fund isdomiciled in Luxembourg and will be passportedinto other countries. The fund is open to bothinstitutional and retail investors and offers weeklyliquidity.
Fund facts
Unit class currency EUR
Bloomberg ticker CSPMSIE LX
Net asset value (NAV) 1'026.12
Strategies in %
Long/Short Equity 31.09Event Driven 18.43Fixed Income Arbitrage 13.68Global Macro 11.73Convertible Arbitrage 8.63Equity Market Neutral 6.70Managed Futures 5.43Emerging Markets 3.50Cash/Cash Equivalents 0.81
Number of holdings
Top HoldingsFundlogic Alternatives 8.32Brevan Howard Macro FX Fund 7.53Jupiter Absolute Return 6.92World Invest SICAV Abs. Ret. 6.65MLIS York Event-Driven UCITS Fund 6.38Total 35.80
Source: Lipper, a Reuters Company
Cre
dit S
uiss
e S
olut
ions
1) Historical performance indications and financial market scenarios are no guarantee for current or future performance. Performance indications do not consider commissions levied at subscription and/orredemption.
The disclaimer mentioned at the end of this document also applies to this page.
315

Fund manager Credit Suisse AGFund manager since since inceptionLocation ZurichFund domicile LuxembourgFund currency EURClose of financial year 30. NovTotal net assets (in mil.) 395.05Inception date 21.07.2010Management fee in % p.a. 1.50Subscription WeeklyRedemption WeeklyPerformance fee in % with Highwatermark 10.00Unit Class Category R
(capital growth / hedged)
ISIN LU0522194009
Valor no. 11480412
EU taxation In scope - tax
Fund 18
March 30, 2012Switzerland
Credit Suisse Solutions (Lux) Prima Multi-StrategyClass R CHF
Net performance in CHF (rebased to 100) and yearly performance 1)
2010 2011 20129596979899
100101102103104
-5%-4%-3%-2%-1%0%1%2%3%4%
-4.3
2.5
CS Solutions (Lux) Prima Multi-Strategy R CHF Yearly or year-to-date performance respectively (Fund)
Net performance in CHF 1)
1 month 3 months YTD 1 year 3 years 5 yearsFund 0.36 2.55 2.55 -1.76 - -
Historical monthly performance in % 1)
Year Jan Feb Mar Apr May Jun Jul Aug Sep Oct Nov Dec YTD2012 0.56 1.60 0.36 - - - - - - - - - 2.552011 -0.13 0.60 -0.57 0.73 -0.77 -0.99 0.57 -2.21 -0.78 -0.05 -0.51 -0.23 -4.292010 - - - - - - - 0.21 0.89 0.72 -0.66 0.64 -
Investment policyCredit Suisse Solutions (Lux) PrimaMulti-Strategy (CS Prima Multi-Strategy) is aUCITS III compliant multi-strategy fund of funds.The CS Prima Multi-Strategy fund allocatesassets across multiple strategies in the liquidUCITS compliant universe. It targets attractiverisk-adjusted returns through active portfoliomanagement, and may invest in variousalternative investment strategies, includingequities, event driven, convertibles, macro,credit, managed futures, fixed income, emergingmarkets’ equities and rates. The fund isdomiciled in Luxembourg and will be passportedinto other countries. The fund is open to bothinstitutional and retail investors and offers weeklyliquidity.
Fund facts
Unit class currency CHF
Bloomberg ticker CSPMSRC LX
Net asset value (NAV) 99.92
Strategies in %
Long/Short Equity 31.09Event Driven 18.43Fixed Income Arbitrage 13.68Global Macro 11.73Convertible Arbitrage 8.63Equity Market Neutral 6.70Managed Futures 5.43Emerging Markets 3.50Cash/Cash Equivalents 0.81
Number of holdings
Top HoldingsFundlogic Alternatives 8.32Brevan Howard Macro FX Fund 7.53Jupiter Absolute Return 6.92World Invest SICAV Abs. Ret. 6.65MLIS York Event-Driven UCITS Fund 6.38Total 35.80
Source: Lipper, a Reuters Company
316
1) Historical performance indications and financial market scenarios are no guarantee for current or future performance. Performance indications do not consider commissions levied at subscription and/orredemption.
The disclaimer mentioned at the end of this document also applies to this page.
Fund manager Credit Suisse AGFund manager since since inceptionLocation ZurichFund domicile LuxembourgFund currency EURClose of financial year 30. NovTotal net assets (in mil.) 395.05Inception date 18.05.2011Management fee in % p.a. 1.50Subscription WeeklyRedemption WeeklyPerformance fee in % with Highwatermark 10.00Unit Class Category R
(capital growth / hedged)
ISIN LU0627515090
Valor no. 12983829
EU taxation In scope - tax
Fund 18
March 30, 2012Switzerland
Credit Suisse Solutions (Lux) Prima Multi-StrategyClass R GBP
Net performance in GBP (rebased to 100) 1)
According to MiFID standards (Markets in Financial Instruments Directive) no performance figuresshall be made available to private investors if the product was launched less than twelve months ago.
Investment policyCredit Suisse Solutions (Lux) PrimaMulti-Strategy (CS Prima Multi-Strategy) is aUCITS III compliant multi-strategy fund of funds.The CS Prima Multi-Strategy fund allocatesassets across multiple strategies in the liquidUCITS compliant universe. It targets attractiverisk-adjusted returns through active portfoliomanagement, and may invest in variousalternative investment strategies, includingequities, event driven, convertibles, macro,credit, managed futures, fixed income, emergingmarkets’ equities and rates. The fund isdomiciled in Luxembourg and will be passportedinto other countries. The fund is open to bothinstitutional and retail investors and offers weeklyliquidity.
Fund facts
Unit class currency GBP
Bloomberg ticker CSPMSRS LX
Net asset value (NAV) 99.23
Strategies in %
Long/Short Equity 31.09Event Driven 18.43Fixed Income Arbitrage 13.68Global Macro 11.73Convertible Arbitrage 8.63Equity Market Neutral 6.70Managed Futures 5.43Emerging Markets 3.50Cash/Cash Equivalents 0.81
Number of holdings
Top HoldingsFundlogic Alternatives 8.32Brevan Howard Macro FX Fund 7.53Jupiter Absolute Return 6.92World Invest SICAV Abs. Ret. 6.65MLIS York Event-Driven UCITS Fund 6.38Total 35.80
Cre
dit S
uiss
e S
olut
ions
1) Historical performance indications and financial market scenarios are no guarantee for current or future performance. Performance indications do not consider commissions levied at subscription and/orredemption.
The disclaimer mentioned at the end of this document also applies to this page.
317
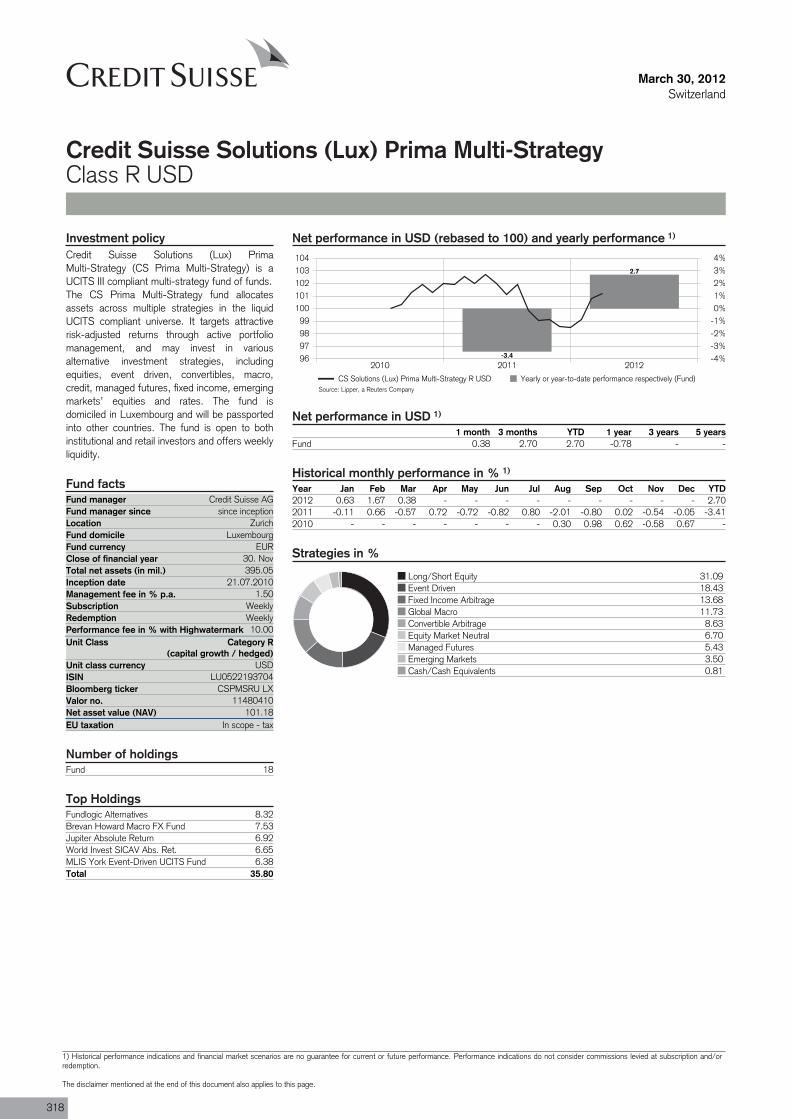
Fund manager Credit Suisse AGFund manager since since inceptionLocation ZurichFund domicile LuxembourgFund currency EURClose of financial year 30. NovTotal net assets (in mil.) 395.05Inception date 21.07.2010Management fee in % p.a. 1.50Subscription WeeklyRedemption WeeklyPerformance fee in % with Highwatermark 10.00Unit Class Category R
(capital growth / hedged)
ISIN LU0522193704
Valor no. 11480410
EU taxation In scope - tax
Fund 18
March 30, 2012Switzerland
Credit Suisse Solutions (Lux) Prima Multi-StrategyClass R USD
Net performance in USD (rebased to 100) and yearly performance 1)
2010 2011 201296979899
100101102103104
-4%-3%-2%-1%0%1%2%3%4%
-3.4
2.7
CS Solutions (Lux) Prima Multi-Strategy R USD Yearly or year-to-date performance respectively (Fund)
Net performance in USD 1)
1 month 3 months YTD 1 year 3 years 5 yearsFund 0.38 2.70 2.70 -0.78 - -
Historical monthly performance in % 1)
Year Jan Feb Mar Apr May Jun Jul Aug Sep Oct Nov Dec YTD2012 0.63 1.67 0.38 - - - - - - - - - 2.702011 -0.11 0.66 -0.57 0.72 -0.72 -0.82 0.80 -2.01 -0.80 0.02 -0.54 -0.05 -3.412010 - - - - - - - 0.30 0.98 0.62 -0.58 0.67 -
Investment policyCredit Suisse Solutions (Lux) PrimaMulti-Strategy (CS Prima Multi-Strategy) is aUCITS III compliant multi-strategy fund of funds.The CS Prima Multi-Strategy fund allocatesassets across multiple strategies in the liquidUCITS compliant universe. It targets attractiverisk-adjusted returns through active portfoliomanagement, and may invest in variousalternative investment strategies, includingequities, event driven, convertibles, macro,credit, managed futures, fixed income, emergingmarkets’ equities and rates. The fund isdomiciled in Luxembourg and will be passportedinto other countries. The fund is open to bothinstitutional and retail investors and offers weeklyliquidity.
Fund facts
Unit class currency USD
Bloomberg ticker CSPMSRU LX
Net asset value (NAV) 101.18
Strategies in %
Long/Short Equity 31.09Event Driven 18.43Fixed Income Arbitrage 13.68Global Macro 11.73Convertible Arbitrage 8.63Equity Market Neutral 6.70Managed Futures 5.43Emerging Markets 3.50Cash/Cash Equivalents 0.81
Number of holdings
Top HoldingsFundlogic Alternatives 8.32Brevan Howard Macro FX Fund 7.53Jupiter Absolute Return 6.92World Invest SICAV Abs. Ret. 6.65MLIS York Event-Driven UCITS Fund 6.38Total 35.80
Source: Lipper, a Reuters Company
318
1) Historical performance indications and financial market scenarios are no guarantee for current or future performance. Performance indications do not consider commissions levied at subscription and/orredemption.
The disclaimer mentioned at the end of this document also applies to this page.
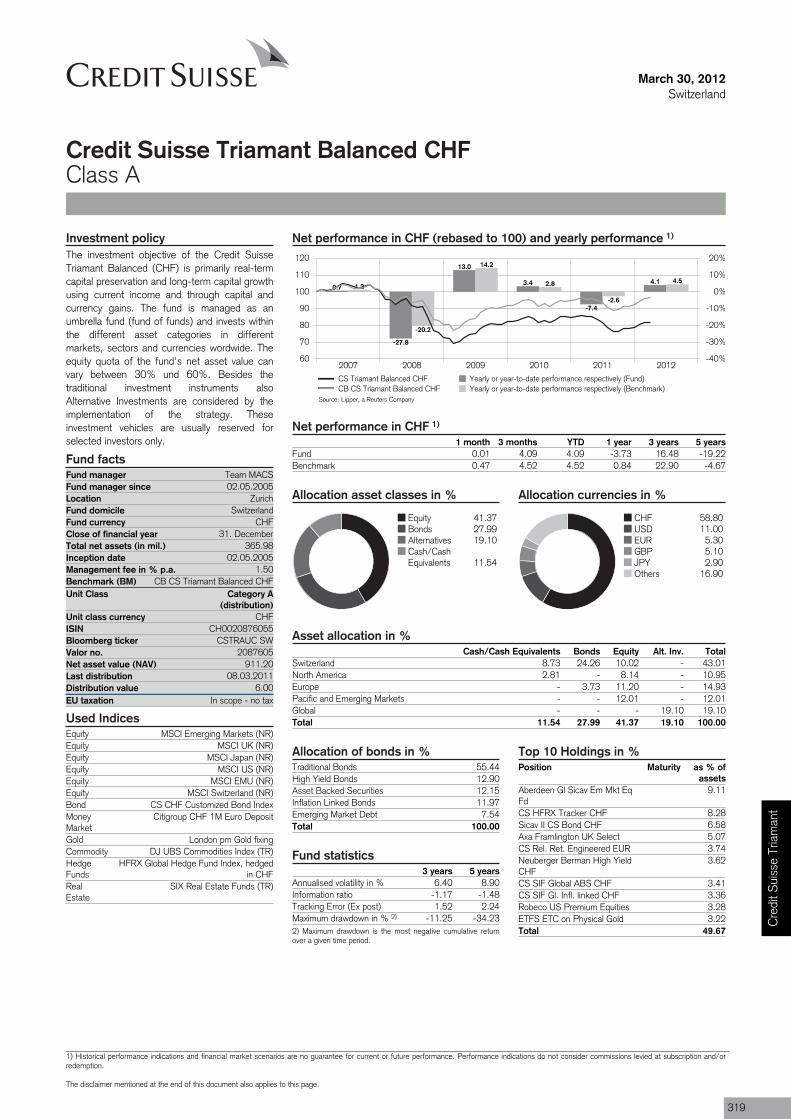
Fund manager Team MACSFund manager since 02.05.2005Location ZurichFund domicile SwitzerlandFund currency CHFClose of financial year 31. DecemberTotal net assets (in mil.) 365.98Inception date 02.05.2005Management fee in % p.a. 1.50Benchmark (BM) CB CS Triamant Balanced CHFUnit Class Category A
(distribution)
ISIN CH0020876055
Valor no. 2087605
Last distribution 08.03.2011Distribution value 6.00EU taxation In scope - no tax
March 30, 2012Switzerland
Credit Suisse Triamant Balanced CHFClass A
Net performance in CHF (rebased to 100) and yearly performance 1)
2007 2008 2009 2010 2011 201260
70
80
90
100
110
120
-40%
-30%
-20%
-10%
0%
10%
20%
0.7
-27.8
13.0
3.4
-7.4
4.11.2
-20.2
14.2
2.8
-2.6
4.5
CS Triamant Balanced CHF Yearly or year-to-date performance respectively (Fund)CB CS Triamant Balanced CHF Yearly or year-to-date performance respectively (Benchmark)
Net performance in CHF 1)
1 month 3 months YTD 1 year 3 years 5 yearsFund 0.01 4.09 4.09 -3.73 16.48 -19.22Benchmark 0.47 4.52 4.52 0.84 22.90 -4.67
Allocation asset classes in %
Equity 41.37Bonds 27.99Alternatives 19.10Cash/CashEquivalents 11.54
Allocation currencies in %
CHF 58.80USD 11.00EUR 5.30GBP 5.10JPY 2.90Others 16.90
Asset allocation in %Cash/Cash Equivalents Bonds Equity Alt. Inv. Total
Switzerland 8.73 24.26 10.02 - 43.01North America 2.81 - 8.14 - 10.95Europe - 3.73 11.20 - 14.93Pacific and Emerging Markets - - 12.01 - 12.01Global - - - 19.10 19.10Total 11.54 27.99 41.37 19.10 100.00
Investment policyThe investment objective of the Credit SuisseTriamant Balanced (CHF) is primarily real-termcapital preservation and long-term capital growthusing current income and through capital andcurrency gains. The fund is managed as anumbrella fund (fund of funds) and invests withinthe different asset categories in differentmarkets, sectors and currencies wordwide. Theequity quota of the fund's net asset value canvary between 30% und 60%. Besides thetraditional investment instruments alsoAlternative Investments are considered by theimplementation of the strategy. Theseinvestment vehicles are usually reserved forselected investors only.
Fund facts
Unit class currency CHF
Bloomberg ticker CSTRAUC SW
Net asset value (NAV) 911.20
Used IndicesEquity MSCI Emerging Markets (NR)Equity MSCI UK (NR)Equity MSCI Japan (NR)Equity MSCI US (NR)Equity MSCI EMU (NR)Equity MSCI Switzerland (NR)Bond CS CHF Customized Bond IndexMoneyMarket
Citigroup CHF 1M Euro Deposit
Gold London pm Gold fixingCommodity DJ UBS Commodities Index (TR)HedgeFunds
HFRX Global Hedge Fund Index, hedgedin CHF
RealEstate
SIX Real Estate Funds (TR)
Allocation of bonds in %Traditional Bonds 55.44High Yield Bonds 12.90Asset Backed Securities 12.15Inflation Linked Bonds 11.97Emerging Market Debt 7.54Total 100.00
Fund statistics3 years 5 years
Annualised volatility in % 6.40 8.90Information ratio -1.17 -1.48Tracking Error (Ex post) 1.52 2.24Maximum drawdown in % 2) -11.25 -34.232) Maximum drawdown is the most negative cumulative returnover a given time period.
Top 10 Holdings in %Position Maturity as % of
assetsAberdeen Gl Sicav Em Mkt EqFd
9.11
CS HFRX Tracker CHF 8.28Sicav II CS Bond CHF 6.58Axa Framlington UK Select 5.07CS Rel. Ret. Engineered EUR 3.74Neuberger Berman High YieldCHF
3.62
CS SIF Global ABS CHF 3.41CS SIF Gl. Infl. linked CHF 3.36Robeco US Premium Equities 3.28ETFS ETC on Physical Gold 3.22Total 49.67
Source: Lipper, a Reuters Company
Cre
dit S
uiss
e Tr
iam
ant
1) Historical performance indications and financial market scenarios are no guarantee for current or future performance. Performance indications do not consider commissions levied at subscription and/orredemption.
The disclaimer mentioned at the end of this document also applies to this page.
319
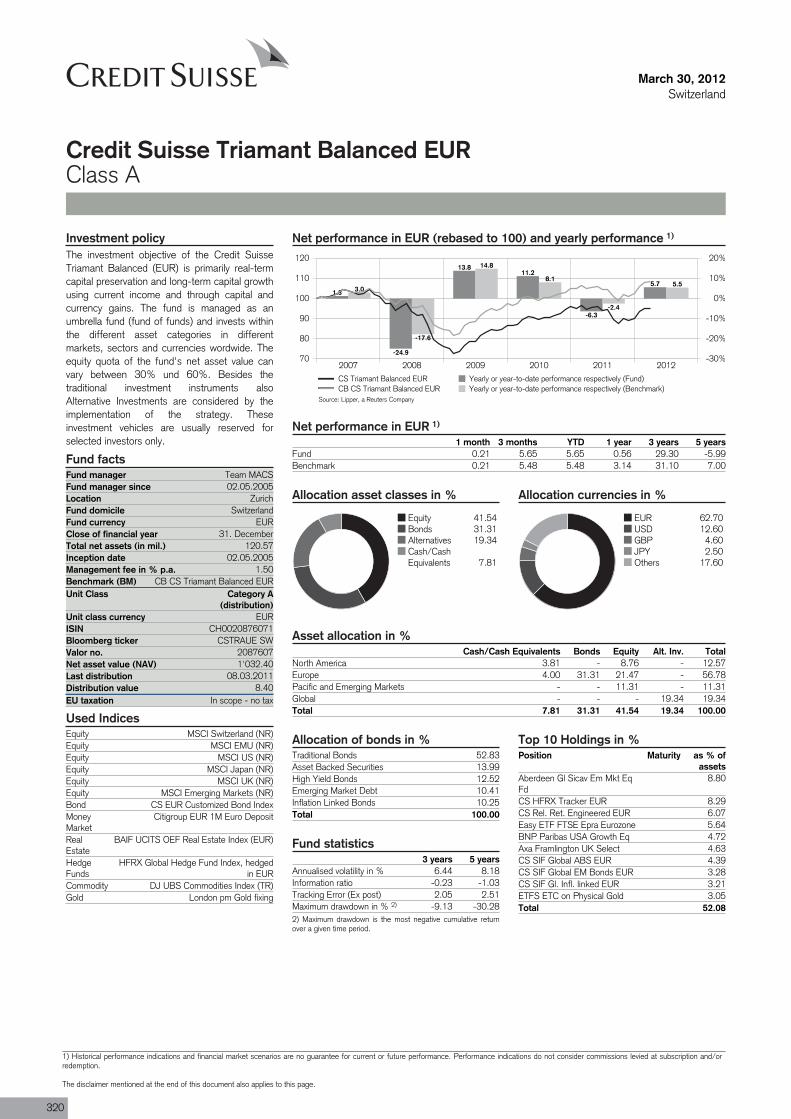
Fund manager Team MACSFund manager since 02.05.2005Location ZurichFund domicile SwitzerlandFund currency EURClose of financial year 31. DecemberTotal net assets (in mil.) 120.57Inception date 02.05.2005Management fee in % p.a. 1.50Benchmark (BM) CB CS Triamant Balanced EURUnit Class Category A
(distribution)
ISIN CH0020876071
Valor no. 2087607
Last distribution 08.03.2011Distribution value 8.40EU taxation In scope - no tax
March 30, 2012Switzerland
Credit Suisse Triamant Balanced EURClass A
Net performance in EUR (rebased to 100) and yearly performance 1)
2007 2008 2009 2010 2011 201270
80
90
100
110
120
-30%
-20%
-10%
0%
10%
20%
1.3
-24.9
13.811.2
-6.3
5.73.0
-17.6
14.8
8.1
-2.4
5.5
CS Triamant Balanced EUR Yearly or year-to-date performance respectively (Fund)CB CS Triamant Balanced EUR Yearly or year-to-date performance respectively (Benchmark)
Net performance in EUR 1)
1 month 3 months YTD 1 year 3 years 5 yearsFund 0.21 5.65 5.65 0.56 29.30 -5.99Benchmark 0.21 5.48 5.48 3.14 31.10 7.00
Allocation asset classes in %
Equity 41.54Bonds 31.31Alternatives 19.34Cash/CashEquivalents 7.81
Allocation currencies in %
EUR 62.70USD 12.60GBP 4.60JPY 2.50Others 17.60
Asset allocation in %Cash/Cash Equivalents Bonds Equity Alt. Inv. Total
North America 3.81 - 8.76 - 12.57Europe 4.00 31.31 21.47 - 56.78Pacific and Emerging Markets - - 11.31 - 11.31Global - - - 19.34 19.34Total 7.81 31.31 41.54 19.34 100.00
Investment policyThe investment objective of the Credit SuisseTriamant Balanced (EUR) is primarily real-termcapital preservation and long-term capital growthusing current income and through capital andcurrency gains. The fund is managed as anumbrella fund (fund of funds) and invests withinthe different asset categories in differentmarkets, sectors and currencies wordwide. Theequity quota of the fund's net asset value canvary between 30% und 60%. Besides thetraditional investment instruments alsoAlternative Investments are considered by theimplementation of the strategy. Theseinvestment vehicles are usually reserved forselected investors only.
Fund facts
Unit class currency EUR
Bloomberg ticker CSTRAUE SW
Net asset value (NAV) 1'032.40
Used IndicesEquity MSCI Switzerland (NR)Equity MSCI EMU (NR)Equity MSCI US (NR)Equity MSCI Japan (NR)Equity MSCI UK (NR)Equity MSCI Emerging Markets (NR)Bond CS EUR Customized Bond IndexMoneyMarket
Citigroup EUR 1M Euro Deposit
RealEstate
BAIF UCITS OEF Real Estate Index (EUR)
HedgeFunds
HFRX Global Hedge Fund Index, hedgedin EUR
Commodity DJ UBS Commodities Index (TR)Gold London pm Gold fixing
Allocation of bonds in %Traditional Bonds 52.83Asset Backed Securities 13.99High Yield Bonds 12.52Emerging Market Debt 10.41Inflation Linked Bonds 10.25Total 100.00
Fund statistics3 years 5 years
Annualised volatility in % 6.44 8.18Information ratio -0.23 -1.03Tracking Error (Ex post) 2.05 2.51Maximum drawdown in % 2) -9.13 -30.282) Maximum drawdown is the most negative cumulative returnover a given time period.
Top 10 Holdings in %Position Maturity as % of
assetsAberdeen Gl Sicav Em Mkt EqFd
8.80
CS HFRX Tracker EUR 8.29CS Rel. Ret. Engineered EUR 6.07Easy ETF FTSE Epra Eurozone 5.64BNP Paribas USA Growth Eq 4.72Axa Framlington UK Select 4.63CS SIF Global ABS EUR 4.39CS SIF Global EM Bonds EUR 3.28CS SIF Gl. Infl. linked EUR 3.21ETFS ETC on Physical Gold 3.05Total 52.08
Source: Lipper, a Reuters Company
320
1) Historical performance indications and financial market scenarios are no guarantee for current or future performance. Performance indications do not consider commissions levied at subscription and/orredemption.
The disclaimer mentioned at the end of this document also applies to this page.
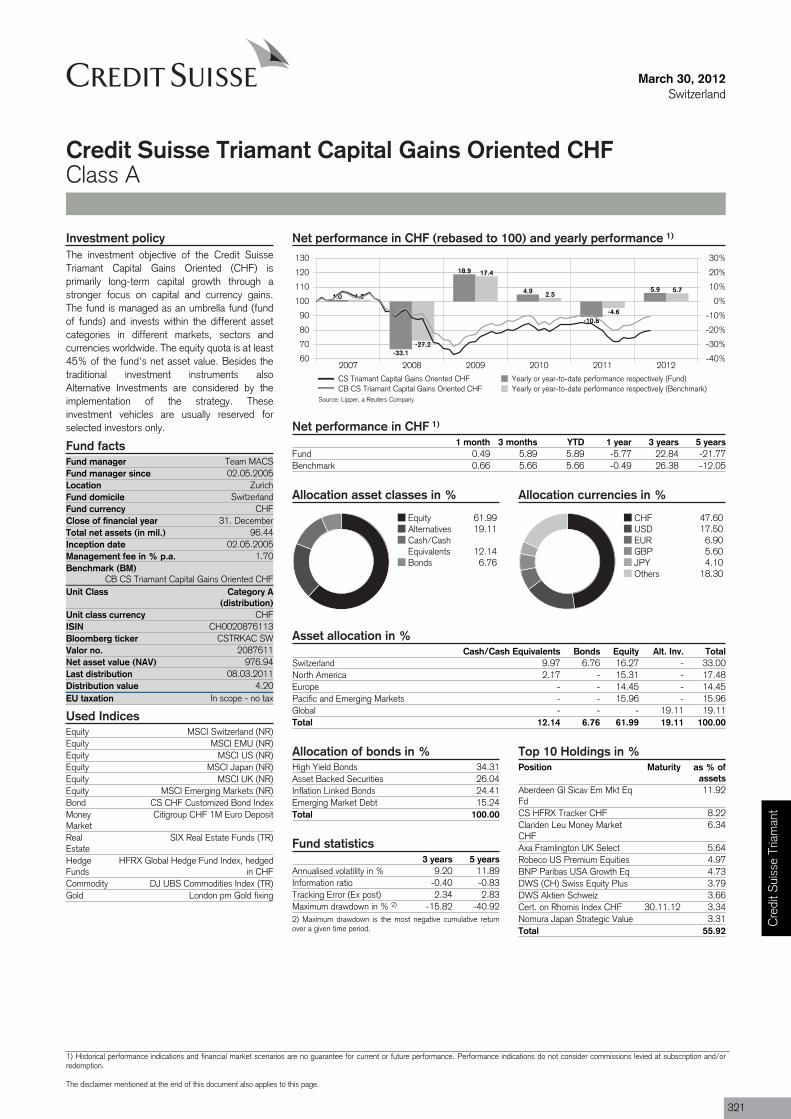
Fund manager Team MACSFund manager since 02.05.2005Location ZurichFund domicile SwitzerlandFund currency CHFClose of financial year 31. DecemberTotal net assets (in mil.) 96.44Inception date 02.05.2005Management fee in % p.a. 1.70Benchmark (BM)
CB CS Triamant Capital Gains Oriented CHFUnit Class Category A
(distribution)
ISIN CH0020876113
Valor no. 2087611
Last distribution 08.03.2011Distribution value 4.20EU taxation In scope - no tax
March 30, 2012Switzerland
Credit Suisse Triamant Capital Gains Oriented CHFClass A
Net performance in CHF (rebased to 100) and yearly performance 1)
2007 2008 2009 2010 2011 201260
70
80
90
100
110
120
130
-40%
-30%
-20%
-10%
0%
10%
20%
30%
1.0
-33.1
18.9
4.9
-10.8
5.91.2
-27.2
17.4
2.5
-4.6
5.7
CS Triamant Capital Gains Oriented CHF Yearly or year-to-date performance respectively (Fund)CB CS Triamant Capital Gains Oriented CHF Yearly or year-to-date performance respectively (Benchmark)
Net performance in CHF 1)
1 month 3 months YTD 1 year 3 years 5 yearsFund 0.49 5.89 5.89 -5.77 22.84 -21.77Benchmark 0.66 5.66 5.66 -0.49 26.38 -12.05
Allocation asset classes in %
Equity 61.99Alternatives 19.11Cash/CashEquivalents 12.14Bonds 6.76
Allocation currencies in %
CHF 47.60USD 17.50EUR 6.90GBP 5.60JPY 4.10Others 18.30
Asset allocation in %Cash/Cash Equivalents Bonds Equity Alt. Inv. Total
Switzerland 9.97 6.76 16.27 - 33.00North America 2.17 - 15.31 - 17.48Europe - - 14.45 - 14.45Pacific and Emerging Markets - - 15.96 - 15.96Global - - - 19.11 19.11Total 12.14 6.76 61.99 19.11 100.00
Investment policyThe investment objective of the Credit SuisseTriamant Capital Gains Oriented (CHF) isprimarily long-term capital growth through astronger focus on capital and currency gains.The fund is managed as an umbrella fund (fundof funds) and invests within the different assetcategories in different markets, sectors andcurrencies worldwide. The equity quota is at least45% of the fund's net asset value. Besides thetraditional investment instruments alsoAlternative Investments are considered by theimplementation of the strategy. Theseinvestment vehicles are usually reserved forselected investors only.
Fund facts
Unit class currency CHF
Bloomberg ticker CSTRKAC SW
Net asset value (NAV) 976.94
Used IndicesEquity MSCI Switzerland (NR)Equity MSCI EMU (NR)Equity MSCI US (NR)Equity MSCI Japan (NR)Equity MSCI UK (NR)Equity MSCI Emerging Markets (NR)Bond CS CHF Customized Bond IndexMoneyMarket
Citigroup CHF 1M Euro Deposit
RealEstate
SIX Real Estate Funds (TR)
HedgeFunds
HFRX Global Hedge Fund Index, hedgedin CHF
Commodity DJ UBS Commodities Index (TR)Gold London pm Gold fixing
Allocation of bonds in %High Yield Bonds 34.31Asset Backed Securities 26.04Inflation Linked Bonds 24.41Emerging Market Debt 15.24Total 100.00
Fund statistics3 years 5 years
Annualised volatility in % 9.20 11.89Information ratio -0.40 -0.83Tracking Error (Ex post) 2.34 2.83Maximum drawdown in % 2) -15.82 -40.922) Maximum drawdown is the most negative cumulative returnover a given time period.
Top 10 Holdings in %Position Maturity as % of
assetsAberdeen Gl Sicav Em Mkt EqFd
11.92
CS HFRX Tracker CHF 8.22Clariden Leu Money MarketCHF
6.34
Axa Framlington UK Select 5.64Robeco US Premium Equities 4.97BNP Paribas USA Growth Eq 4.73DWS (CH) Swiss Equity Plus 3.79DWS Aktien Schweiz 3.66Cert. on Rhomis Index CHF 30.11.12 3.34Nomura Japan Strategic Value 3.31Total 55.92
Source: Lipper, a Reuters Company
Cre
dit S
uiss
e Tr
iam
ant
1) Historical performance indications and financial market scenarios are no guarantee for current or future performance. Performance indications do not consider commissions levied at subscription and/orredemption.
The disclaimer mentioned at the end of this document also applies to this page.
321
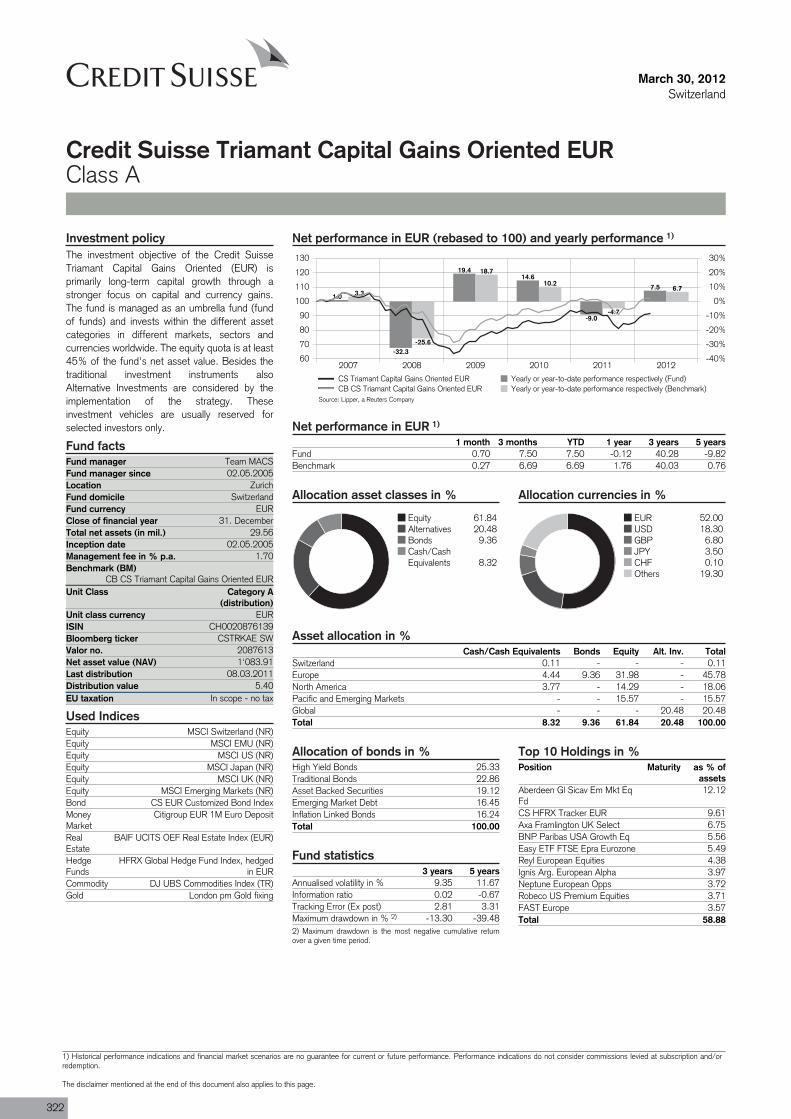
Fund manager Team MACSFund manager since 02.05.2005Location ZurichFund domicile SwitzerlandFund currency EURClose of financial year 31. DecemberTotal net assets (in mil.) 29.56Inception date 02.05.2005Management fee in % p.a. 1.70Benchmark (BM)
CB CS Triamant Capital Gains Oriented EURUnit Class Category A
(distribution)
ISIN CH0020876139
Valor no. 2087613
Last distribution 08.03.2011Distribution value 5.40EU taxation In scope - no tax
March 30, 2012Switzerland
Credit Suisse Triamant Capital Gains Oriented EURClass A
Net performance in EUR (rebased to 100) and yearly performance 1)
2007 2008 2009 2010 2011 201260
70
80
90
100
110
120
130
-40%
-30%
-20%
-10%
0%
10%
20%
30%
1.0
-32.3
19.414.6
-9.0
7.53.3
-25.6
18.7
10.2
-4.7
6.7
CS Triamant Capital Gains Oriented EUR Yearly or year-to-date performance respectively (Fund)CB CS Triamant Capital Gains Oriented EUR Yearly or year-to-date performance respectively (Benchmark)
Net performance in EUR 1)
1 month 3 months YTD 1 year 3 years 5 yearsFund 0.70 7.50 7.50 -0.12 40.28 -9.82Benchmark 0.27 6.69 6.69 1.76 40.03 0.76
Allocation asset classes in %
Equity 61.84Alternatives 20.48Bonds 9.36Cash/CashEquivalents 8.32
Allocation currencies in %
EUR 52.00USD 18.30GBP 6.80JPY 3.50CHF 0.10Others 19.30
Asset allocation in %Cash/Cash Equivalents Bonds Equity Alt. Inv. Total
Switzerland 0.11 - - - 0.11Europe 4.44 9.36 31.98 - 45.78North America 3.77 - 14.29 - 18.06Pacific and Emerging Markets - - 15.57 - 15.57Global - - - 20.48 20.48Total 8.32 9.36 61.84 20.48 100.00
Investment policyThe investment objective of the Credit SuisseTriamant Capital Gains Oriented (EUR) isprimarily long-term capital growth through astronger focus on capital and currency gains.The fund is managed as an umbrella fund (fundof funds) and invests within the different assetcategories in different markets, sectors andcurrencies worldwide. The equity quota is at least45% of the fund's net asset value. Besides thetraditional investment instruments alsoAlternative Investments are considered by theimplementation of the strategy. Theseinvestment vehicles are usually reserved forselected investors only.
Fund facts
Unit class currency EUR
Bloomberg ticker CSTRKAE SW
Net asset value (NAV) 1'083.91
Used IndicesEquity MSCI Switzerland (NR)Equity MSCI EMU (NR)Equity MSCI US (NR)Equity MSCI Japan (NR)Equity MSCI UK (NR)Equity MSCI Emerging Markets (NR)Bond CS EUR Customized Bond IndexMoneyMarket
Citigroup EUR 1M Euro Deposit
RealEstate
BAIF UCITS OEF Real Estate Index (EUR)
HedgeFunds
HFRX Global Hedge Fund Index, hedgedin EUR
Commodity DJ UBS Commodities Index (TR)Gold London pm Gold fixing
Allocation of bonds in %High Yield Bonds 25.33Traditional Bonds 22.86Asset Backed Securities 19.12Emerging Market Debt 16.45Inflation Linked Bonds 16.24Total 100.00
Fund statistics3 years 5 years
Annualised volatility in % 9.35 11.67Information ratio 0.02 -0.67Tracking Error (Ex post) 2.81 3.31Maximum drawdown in % 2) -13.30 -39.482) Maximum drawdown is the most negative cumulative returnover a given time period.
Top 10 Holdings in %Position Maturity as % of
assetsAberdeen Gl Sicav Em Mkt EqFd
12.12
CS HFRX Tracker EUR 9.61Axa Framlington UK Select 6.75BNP Paribas USA Growth Eq 5.56Easy ETF FTSE Epra Eurozone 5.49Reyl European Equities 4.38Ignis Arg. European Alpha 3.97Neptune European Opps 3.72Robeco US Premium Equities 3.71FAST Europe 3.57Total 58.88
Source: Lipper, a Reuters Company
322
1) Historical performance indications and financial market scenarios are no guarantee for current or future performance. Performance indications do not consider commissions levied at subscription and/orredemption.
The disclaimer mentioned at the end of this document also applies to this page.
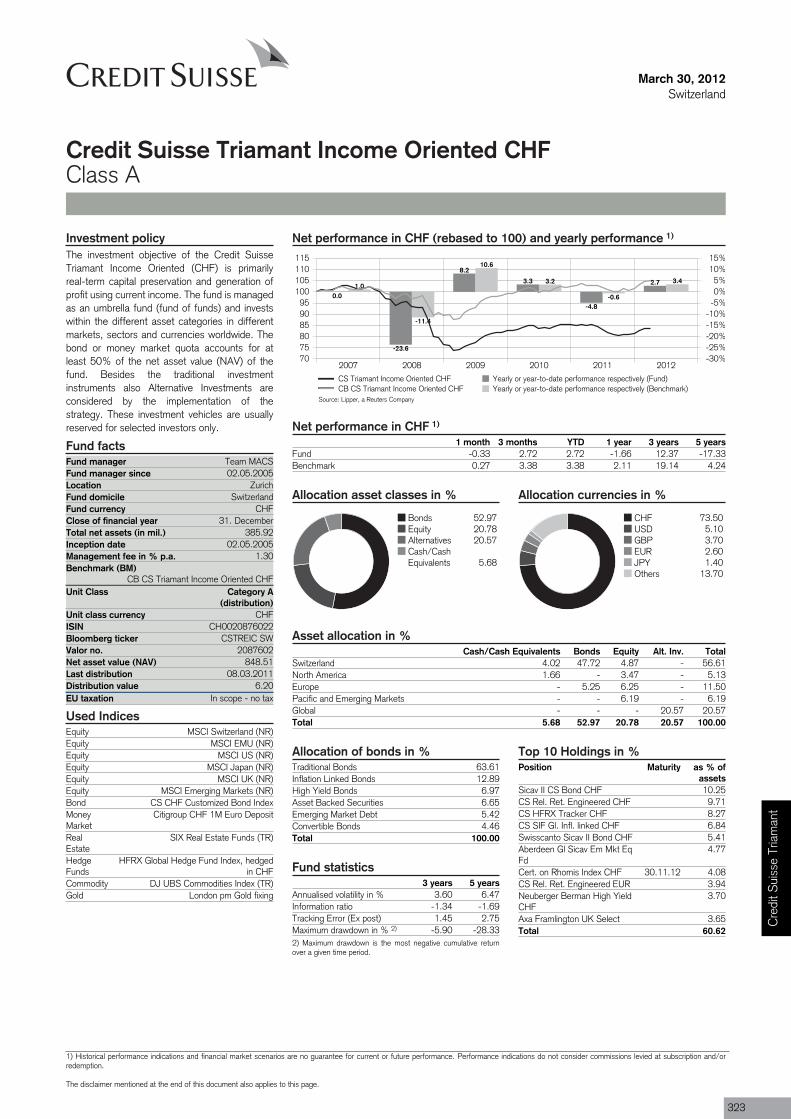
Fund manager Team MACSFund manager since 02.05.2005Location ZurichFund domicile SwitzerlandFund currency CHFClose of financial year 31. DecemberTotal net assets (in mil.) 385.92Inception date 02.05.2005Management fee in % p.a. 1.30Benchmark (BM)
CB CS Triamant Income Oriented CHFUnit Class Category A
(distribution)
ISIN CH0020876022
Valor no. 2087602
Last distribution 08.03.2011Distribution value 6.20EU taxation In scope - no tax
March 30, 2012Switzerland
Credit Suisse Triamant Income Oriented CHFClass A
Net performance in CHF (rebased to 100) and yearly performance 1)
2007 2008 2009 2010 2011 2012707580859095
100105110115
-30%-25%-20%-15%-10%-5%0%5%
10%15%
0.0
-23.6
8.2
3.3
-4.8
2.71.0
-11.4
10.6
3.2
-0.6
3.4
CS Triamant Income Oriented CHF Yearly or year-to-date performance respectively (Fund)CB CS Triamant Income Oriented CHF Yearly or year-to-date performance respectively (Benchmark)
Net performance in CHF 1)
1 month 3 months YTD 1 year 3 years 5 yearsFund -0.33 2.72 2.72 -1.66 12.37 -17.33Benchmark 0.27 3.38 3.38 2.11 19.14 4.24
Allocation asset classes in %
Bonds 52.97Equity 20.78Alternatives 20.57Cash/CashEquivalents 5.68
Allocation currencies in %
CHF 73.50USD 5.10GBP 3.70EUR 2.60JPY 1.40Others 13.70
Asset allocation in %Cash/Cash Equivalents Bonds Equity Alt. Inv. Total
Switzerland 4.02 47.72 4.87 - 56.61North America 1.66 - 3.47 - 5.13Europe - 5.25 6.25 - 11.50Pacific and Emerging Markets - - 6.19 - 6.19Global - - - 20.57 20.57Total 5.68 52.97 20.78 20.57 100.00
Investment policyThe investment objective of the Credit SuisseTriamant Income Oriented (CHF) is primarilyreal-term capital preservation and generation ofprofit using current income. The fund is managedas an umbrella fund (fund of funds) and investswithin the different asset categories in differentmarkets, sectors and currencies worldwide. Thebond or money market quota accounts for atleast 50% of the net asset value (NAV) of thefund. Besides the traditional investmentinstruments also Alternative Investments areconsidered by the implementation of thestrategy. These investment vehicles are usuallyreserved for selected investors only.
Fund facts
Unit class currency CHF
Bloomberg ticker CSTREIC SW
Net asset value (NAV) 848.51
Used IndicesEquity MSCI Switzerland (NR)Equity MSCI EMU (NR)Equity MSCI US (NR)Equity MSCI Japan (NR)Equity MSCI UK (NR)Equity MSCI Emerging Markets (NR)Bond CS CHF Customized Bond IndexMoneyMarket
Citigroup CHF 1M Euro Deposit
RealEstate
SIX Real Estate Funds (TR)
HedgeFunds
HFRX Global Hedge Fund Index, hedgedin CHF
Commodity DJ UBS Commodities Index (TR)Gold London pm Gold fixing
Allocation of bonds in %Traditional Bonds 63.61Inflation Linked Bonds 12.89High Yield Bonds 6.97Asset Backed Securities 6.65Emerging Market Debt 5.42Convertible Bonds 4.46Total 100.00
Fund statistics3 years 5 years
Annualised volatility in % 3.60 6.47Information ratio -1.34 -1.69Tracking Error (Ex post) 1.45 2.75Maximum drawdown in % 2) -5.90 -28.332) Maximum drawdown is the most negative cumulative returnover a given time period.
Top 10 Holdings in %Position Maturity as % of
assetsSicav II CS Bond CHF 10.25CS Rel. Ret. Engineered CHF 9.71CS HFRX Tracker CHF 8.27CS SIF Gl. Infl. linked CHF 6.84Swisscanto Sicav II Bond CHF 5.41Aberdeen Gl Sicav Em Mkt EqFd
4.77
Cert. on Rhomis Index CHF 30.11.12 4.08CS Rel. Ret. Engineered EUR 3.94Neuberger Berman High YieldCHF
3.70
Axa Framlington UK Select 3.65Total 60.62
Source: Lipper, a Reuters Company
Cre
dit S
uiss
e Tr
iam
ant
1) Historical performance indications and financial market scenarios are no guarantee for current or future performance. Performance indications do not consider commissions levied at subscription and/orredemption.
The disclaimer mentioned at the end of this document also applies to this page.
323
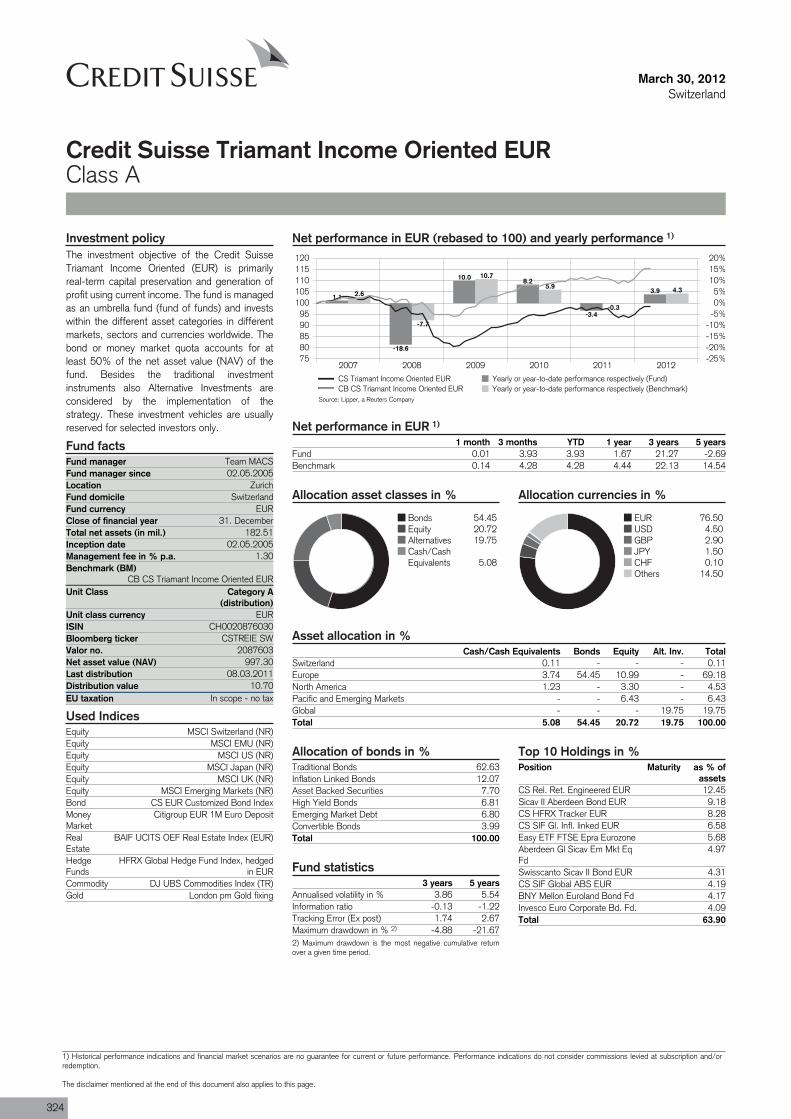
Fund manager Team MACSFund manager since 02.05.2005Location ZurichFund domicile SwitzerlandFund currency EURClose of financial year 31. DecemberTotal net assets (in mil.) 182.51Inception date 02.05.2005Management fee in % p.a. 1.30Benchmark (BM)
CB CS Triamant Income Oriented EURUnit Class Category A
(distribution)
ISIN CH0020876030
Valor no. 2087603
Last distribution 08.03.2011Distribution value 10.70EU taxation In scope - no tax
March 30, 2012Switzerland
Credit Suisse Triamant Income Oriented EURClass A
Net performance in EUR (rebased to 100) and yearly performance 1)
2007 2008 2009 2010 2011 20127580859095
100105110115120
-25%-20%-15%-10%-5%0%5%
10%15%20%
1.1
-18.6
10.0 8.2
-3.4
3.92.6
-7.7
10.7
5.9
-0.3
4.3
CS Triamant Income Oriented EUR Yearly or year-to-date performance respectively (Fund)CB CS Triamant Income Oriented EUR Yearly or year-to-date performance respectively (Benchmark)
Net performance in EUR 1)
1 month 3 months YTD 1 year 3 years 5 yearsFund 0.01 3.93 3.93 1.67 21.27 -2.69Benchmark 0.14 4.28 4.28 4.44 22.13 14.54
Allocation asset classes in %
Bonds 54.45Equity 20.72Alternatives 19.75Cash/CashEquivalents 5.08
Allocation currencies in %
EUR 76.50USD 4.50GBP 2.90JPY 1.50CHF 0.10Others 14.50
Asset allocation in %Cash/Cash Equivalents Bonds Equity Alt. Inv. Total
Switzerland 0.11 - - - 0.11Europe 3.74 54.45 10.99 - 69.18North America 1.23 - 3.30 - 4.53Pacific and Emerging Markets - - 6.43 - 6.43Global - - - 19.75 19.75Total 5.08 54.45 20.72 19.75 100.00
Investment policyThe investment objective of the Credit SuisseTriamant Income Oriented (EUR) is primarilyreal-term capital preservation and generation ofprofit using current income. The fund is managedas an umbrella fund (fund of funds) and investswithin the different asset categories in differentmarkets, sectors and currencies worldwide. Thebond or money market quota accounts for atleast 50% of the net asset value (NAV) of thefund. Besides the traditional investmentinstruments also Alternative Investments areconsidered by the implementation of thestrategy. These investment vehicles are usuallyreserved for selected investors only.
Fund facts
Unit class currency EUR
Bloomberg ticker CSTREIE SW
Net asset value (NAV) 997.30
Used IndicesEquity MSCI Switzerland (NR)Equity MSCI EMU (NR)Equity MSCI US (NR)Equity MSCI Japan (NR)Equity MSCI UK (NR)Equity MSCI Emerging Markets (NR)Bond CS EUR Customized Bond IndexMoneyMarket
Citigroup EUR 1M Euro Deposit
RealEstate
BAIF UCITS OEF Real Estate Index (EUR)
HedgeFunds
HFRX Global Hedge Fund Index, hedgedin EUR
Commodity DJ UBS Commodities Index (TR)Gold London pm Gold fixing
Allocation of bonds in %Traditional Bonds 62.63Inflation Linked Bonds 12.07Asset Backed Securities 7.70High Yield Bonds 6.81Emerging Market Debt 6.80Convertible Bonds 3.99Total 100.00
Fund statistics3 years 5 years
Annualised volatility in % 3.86 5.54Information ratio -0.13 -1.22Tracking Error (Ex post) 1.74 2.67Maximum drawdown in % 2) -4.88 -21.672) Maximum drawdown is the most negative cumulative returnover a given time period.
Top 10 Holdings in %Position Maturity as % of
assetsCS Rel. Ret. Engineered EUR 12.45Sicav II Aberdeen Bond EUR 9.18CS HFRX Tracker EUR 8.28CS SIF Gl. Infl. linked EUR 6.58Easy ETF FTSE Epra Eurozone 5.68Aberdeen Gl Sicav Em Mkt EqFd
4.97
Swisscanto Sicav II Bond EUR 4.31CS SIF Global ABS EUR 4.19BNY Mellon Euroland Bond Fd 4.17Invesco Euro Corporate Bd. Fd. 4.09Total 63.90
Source: Lipper, a Reuters Company
324
1) Historical performance indications and financial market scenarios are no guarantee for current or future performance. Performance indications do not consider commissions levied at subscription and/orredemption.
The disclaimer mentioned at the end of this document also applies to this page.
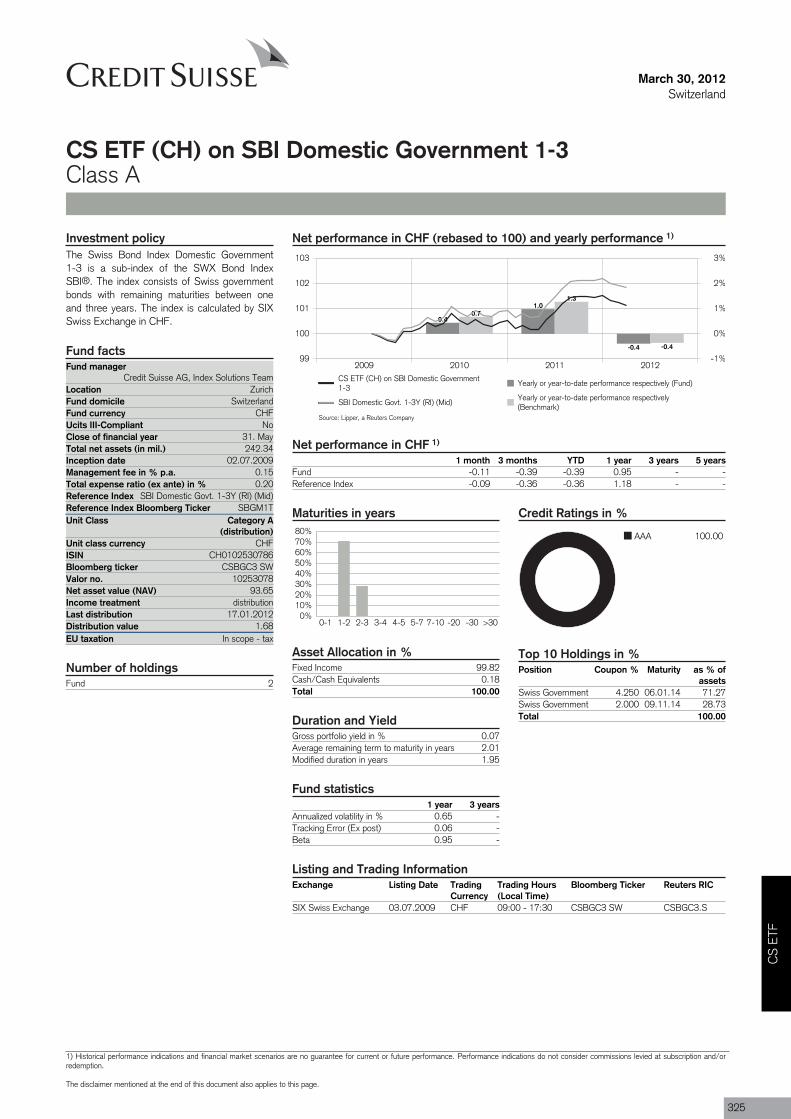
Fund managerCredit Suisse AG, Index Solutions Team
Location ZurichFund domicile SwitzerlandFund currency CHFUcits III-Compliant NoClose of financial year 31. MayTotal net assets (in mil.) 242.34Inception date 02.07.2009Management fee in % p.a. 0.15Total expense ratio (ex ante) in % 0.20Reference Index SBI Domestic Govt. 1-3Y (RI) (Mid)Reference Index Bloomberg Ticker SBGM1TUnit Class Category A
(distribution)
ISIN CH0102530786
Valor no. 10253078
Income treatment distributionLast distribution 17.01.2012Distribution value 1.68EU taxation In scope - tax
Fund 2
March 30, 2012Switzerland
CS ETF (CH) on SBI Domestic Government 1-3Class A
Net performance in CHF (rebased to 100) and yearly performance 1)
2009 2010 2011 201299
100
101
102
103
-1%
0%
1%
2%
3%
0.4
1.0
-0.4
0.7
1.3
-0.4
CS ETF (CH) on SBI Domestic Government1-3
Yearly or year-to-date performance respectively (Fund)
SBI Domestic Govt. 1-3Y (RI) (Mid)Yearly or year-to-date performance respectively(Benchmark)
Net performance in CHF 1)
1 month 3 months YTD 1 year 3 years 5 yearsFund -0.11 -0.39 -0.39 0.95 - -Reference Index -0.09 -0.36 -0.36 1.18 - -
Maturities in years
0%10%20%30%40%50%60%70%80%
0-1 1-2 2-3 3-4 4-5 5-7 7-10 -20 -30 >30
Asset Allocation in %Fixed Income 99.82Cash/Cash Equivalents 0.18Total 100.00
Duration and YieldGross portfolio yield in % 0.07Average remaining term to maturity in years 2.01Modified duration in years 1.95
Fund statistics1 year 3 years
Annualized volatility in % 0.65 -Tracking Error (Ex post) 0.06 -Beta 0.95 -
Credit Ratings in %
AAA 100.00
Top 10 Holdings in %Position Coupon % Maturity as % of
assetsSwiss Government 4.250 06.01.14 71.27Swiss Government 2.000 09.11.14 28.73Total 100.00
Investment policyThe Swiss Bond Index Domestic Government1-3 is a sub-index of the SWX Bond IndexSBI®. The index consists of Swiss governmentbonds with remaining maturities between oneand three years. The index is calculated by SIXSwiss Exchange in CHF.
Fund facts
Unit class currency CHF
Bloomberg ticker CSBGC3 SW
Net asset value (NAV) 93.65
Number of holdings
Listing and Trading InformationExchange Listing Date Trading
CurrencyTrading Hours(Local Time)
Bloomberg Ticker Reuters RIC
SIX Swiss Exchange 03.07.2009 CHF 09:00 - 17:30 CSBGC3 SW CSBGC3.S
Source: Lipper, a Reuters Company
CS
ETF
1) Historical performance indications and financial market scenarios are no guarantee for current or future performance. Performance indications do not consider commissions levied at subscription and/orredemption.
The disclaimer mentioned at the end of this document also applies to this page.
325
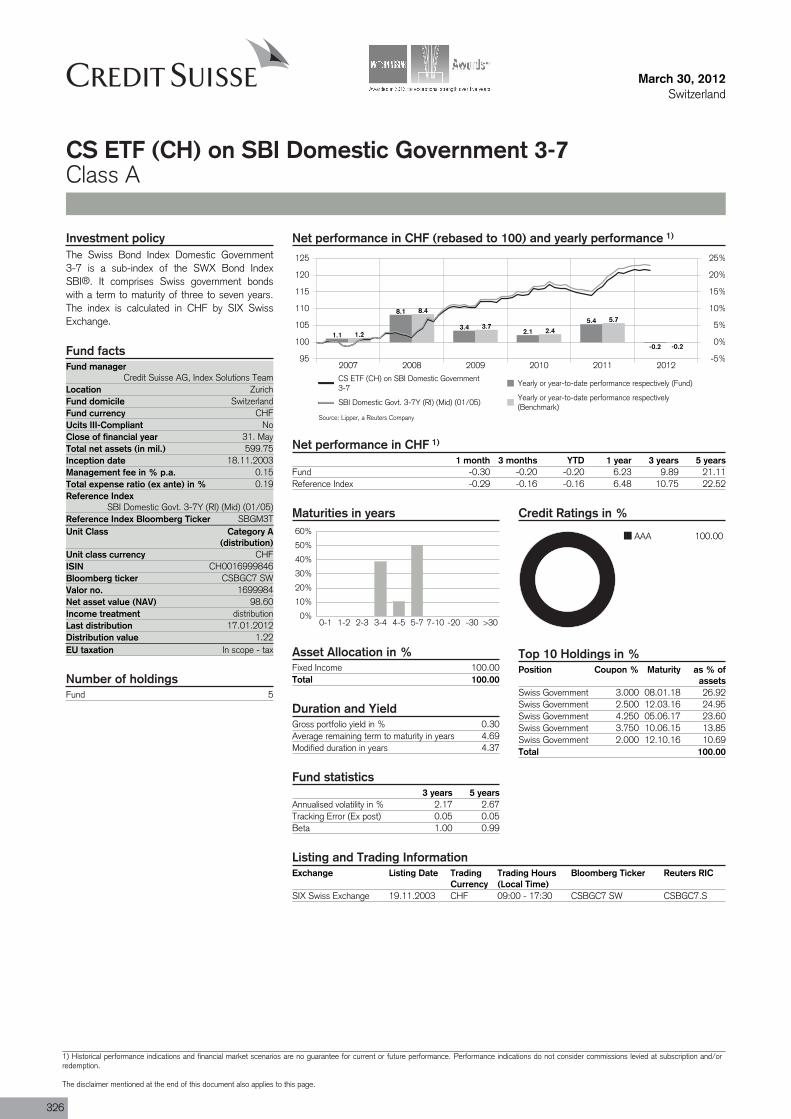
Fund managerCredit Suisse AG, Index Solutions Team
Location ZurichFund domicile SwitzerlandFund currency CHFUcits III-Compliant NoClose of financial year 31. MayTotal net assets (in mil.) 599.75Inception date 18.11.2003Management fee in % p.a. 0.15Total expense ratio (ex ante) in % 0.19Reference Index
SBI Domestic Govt. 3-7Y (RI) (Mid) (01/05)Reference Index Bloomberg Ticker SBGM3TUnit Class Category A
(distribution)
ISIN CH0016999846
Valor no. 1699984
Income treatment distributionLast distribution 17.01.2012Distribution value 1.22EU taxation In scope - tax
Fund 5
March 30, 2012Switzerland
CS ETF (CH) on SBI Domestic Government 3-7Class A
Net performance in CHF (rebased to 100) and yearly performance 1)
2007 2008 2009 2010 2011 201295
100
105
110
115
120
125
-5%
0%
5%
10%
15%
20%
25%
1.1
8.1
3.42.1
5.4
-0.2
1.2
8.4
3.72.4
5.7
-0.2
CS ETF (CH) on SBI Domestic Government3-7
Yearly or year-to-date performance respectively (Fund)
SBI Domestic Govt. 3-7Y (RI) (Mid) (01/05)Yearly or year-to-date performance respectively(Benchmark)
Net performance in CHF 1)
1 month 3 months YTD 1 year 3 years 5 yearsFund -0.30 -0.20 -0.20 6.23 9.89 21.11Reference Index -0.29 -0.16 -0.16 6.48 10.75 22.52
Maturities in years
0%
10%
20%
30%
40%
50%
60%
0-1 1-2 2-3 3-4 4-5 5-7 7-10 -20 -30 >30
Asset Allocation in %Fixed Income 100.00Total 100.00
Duration and YieldGross portfolio yield in % 0.30Average remaining term to maturity in years 4.69Modified duration in years 4.37
Fund statistics3 years 5 years
Annualised volatility in % 2.17 2.67Tracking Error (Ex post) 0.05 0.05Beta 1.00 0.99
Credit Ratings in %
AAA 100.00
Top 10 Holdings in %Position Coupon % Maturity as % of
assetsSwiss Government 3.000 08.01.18 26.92Swiss Government 2.500 12.03.16 24.95Swiss Government 4.250 05.06.17 23.60Swiss Government 3.750 10.06.15 13.85Swiss Government 2.000 12.10.16 10.69Total 100.00
Investment policyThe Swiss Bond Index Domestic Government3-7 is a sub-index of the SWX Bond IndexSBI®. It comprises Swiss government bondswith a term to maturity of three to seven years.The index is calculated in CHF by SIX SwissExchange.
Fund facts
Unit class currency CHF
Bloomberg ticker CSBGC7 SW
Net asset value (NAV) 98.60
Number of holdings
Listing and Trading InformationExchange Listing Date Trading
CurrencyTrading Hours(Local Time)
Bloomberg Ticker Reuters RIC
SIX Swiss Exchange 19.11.2003 CHF 09:00 - 17:30 CSBGC7 SW CSBGC7.S
Source: Lipper, a Reuters Company
326
1) Historical performance indications and financial market scenarios are no guarantee for current or future performance. Performance indications do not consider commissions levied at subscription and/orredemption.
The disclaimer mentioned at the end of this document also applies to this page.
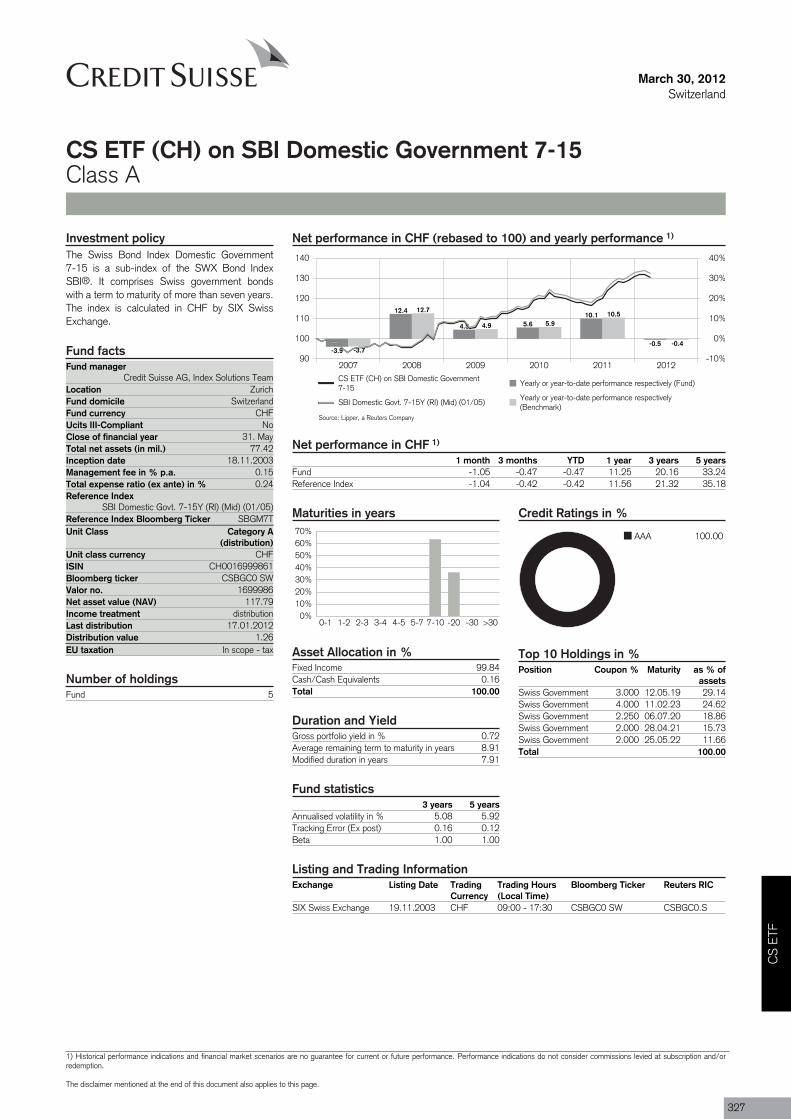
Fund managerCredit Suisse AG, Index Solutions Team
Location ZurichFund domicile SwitzerlandFund currency CHFUcits III-Compliant NoClose of financial year 31. MayTotal net assets (in mil.) 77.42Inception date 18.11.2003Management fee in % p.a. 0.15Total expense ratio (ex ante) in % 0.24Reference Index
SBI Domestic Govt. 7-15Y (RI) (Mid) (01/05)Reference Index Bloomberg Ticker SBGM7TUnit Class Category A
(distribution)
ISIN CH0016999861
Valor no. 1699986
Income treatment distributionLast distribution 17.01.2012Distribution value 1.26EU taxation In scope - tax
Fund 5
March 30, 2012Switzerland
CS ETF (CH) on SBI Domestic Government 7-15Class A
Net performance in CHF (rebased to 100) and yearly performance 1)
2007 2008 2009 2010 2011 201290
100
110
120
130
140
-10%
0%
10%
20%
30%
40%
-3.9
12.4
4.5 5.610.1
-0.5-3.7
12.7
4.9 5.910.5
-0.4
CS ETF (CH) on SBI Domestic Government7-15
Yearly or year-to-date performance respectively (Fund)
SBI Domestic Govt. 7-15Y (RI) (Mid) (01/05)Yearly or year-to-date performance respectively(Benchmark)
Net performance in CHF 1)
1 month 3 months YTD 1 year 3 years 5 yearsFund -1.05 -0.47 -0.47 11.25 20.16 33.24Reference Index -1.04 -0.42 -0.42 11.56 21.32 35.18
Maturities in years
0%10%20%30%40%50%60%70%
0-1 1-2 2-3 3-4 4-5 5-7 7-10 -20 -30 >30
Asset Allocation in %Fixed Income 99.84Cash/Cash Equivalents 0.16Total 100.00
Duration and YieldGross portfolio yield in % 0.72Average remaining term to maturity in years 8.91Modified duration in years 7.91
Fund statistics3 years 5 years
Annualised volatility in % 5.08 5.92Tracking Error (Ex post) 0.16 0.12Beta 1.00 1.00
Credit Ratings in %
AAA 100.00
Top 10 Holdings in %Position Coupon % Maturity as % of
assetsSwiss Government 3.000 12.05.19 29.14Swiss Government 4.000 11.02.23 24.62Swiss Government 2.250 06.07.20 18.86Swiss Government 2.000 28.04.21 15.73Swiss Government 2.000 25.05.22 11.66Total 100.00
Investment policyThe Swiss Bond Index Domestic Government7-15 is a sub-index of the SWX Bond IndexSBI®. It comprises Swiss government bondswith a term to maturity of more than seven years.The index is calculated in CHF by SIX SwissExchange.
Fund facts
Unit class currency CHF
Bloomberg ticker CSBGC0 SW
Net asset value (NAV) 117.79
Number of holdings
Listing and Trading InformationExchange Listing Date Trading
CurrencyTrading Hours(Local Time)
Bloomberg Ticker Reuters RIC
SIX Swiss Exchange 19.11.2003 CHF 09:00 - 17:30 CSBGC0 SW CSBGC0.S
Source: Lipper, a Reuters Company
CS
ETF
1) Historical performance indications and financial market scenarios are no guarantee for current or future performance. Performance indications do not consider commissions levied at subscription and/orredemption.
The disclaimer mentioned at the end of this document also applies to this page.
327
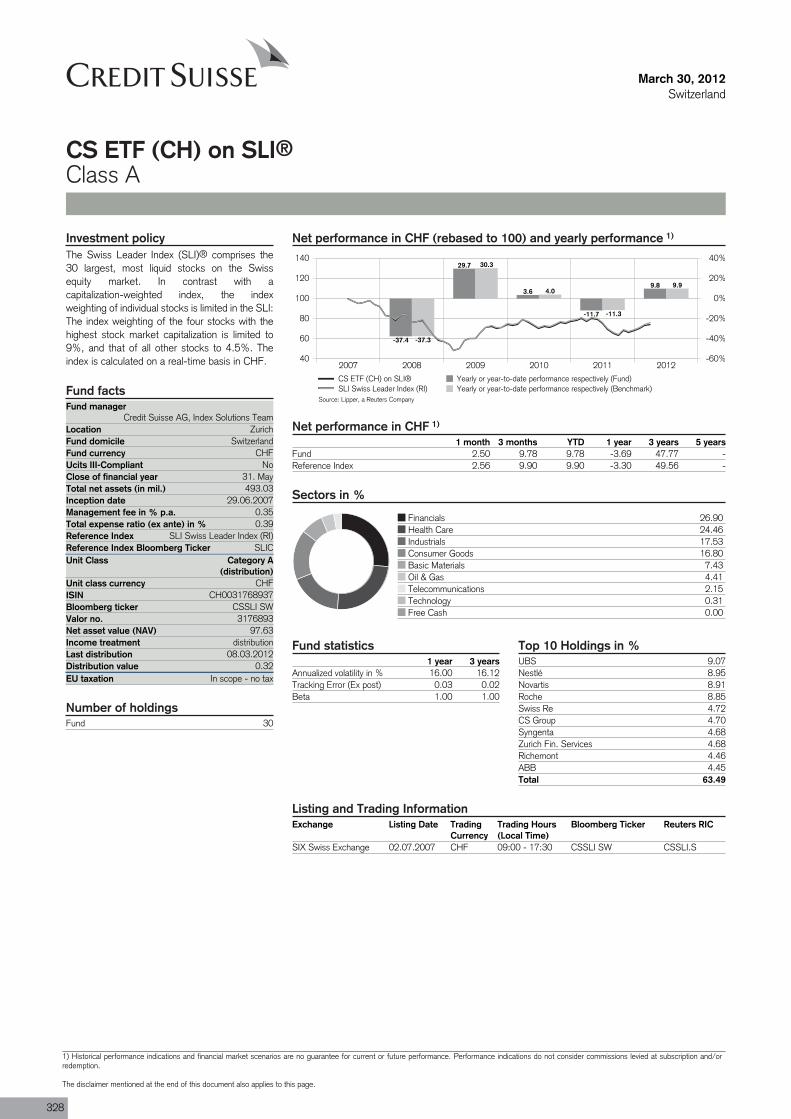
Fund managerCredit Suisse AG, Index Solutions Team
Location ZurichFund domicile SwitzerlandFund currency CHFUcits III-Compliant NoClose of financial year 31. MayTotal net assets (in mil.) 493.03Inception date 29.06.2007Management fee in % p.a. 0.35Total expense ratio (ex ante) in % 0.39Reference Index SLI Swiss Leader Index (RI)Reference Index Bloomberg Ticker SLICUnit Class Category A
(distribution)
ISIN CH0031768937
Valor no. 3176893
Income treatment distributionLast distribution 08.03.2012Distribution value 0.32EU taxation In scope - no tax
Fund 30
March 30, 2012Switzerland
CS ETF (CH) on SLI®Class A
Net performance in CHF (rebased to 100) and yearly performance 1)
2007 2008 2009 2010 2011 201240
60
80
100
120
140
-60%
-40%
-20%
0%
20%
40%
-37.4
29.7
3.6
-11.7
9.8
-37.3
30.3
4.0
-11.3
9.9
CS ETF (CH) on SLI® Yearly or year-to-date performance respectively (Fund)SLI Swiss Leader Index (RI) Yearly or year-to-date performance respectively (Benchmark)
Net performance in CHF 1)
1 month 3 months YTD 1 year 3 years 5 yearsFund 2.50 9.78 9.78 -3.69 47.77 -Reference Index 2.56 9.90 9.90 -3.30 49.56 -
Sectors in %
Financials 26.90Health Care 24.46Industrials 17.53Consumer Goods 16.80Basic Materials 7.43Oil & Gas 4.41Telecommunications 2.15Technology 0.31Free Cash 0.00
Investment policyThe Swiss Leader Index (SLI)® comprises the30 largest, most liquid stocks on the Swissequity market. In contrast with acapitalization-weighted index, the indexweighting of individual stocks is limited in the SLI:The index weighting of the four stocks with thehighest stock market capitalization is limited to9%, and that of all other stocks to 4.5%. Theindex is calculated on a real-time basis in CHF.
Fund facts
Unit class currency CHF
Bloomberg ticker CSSLI SW
Net asset value (NAV) 97.63
Number of holdings
Fund statistics1 year 3 years
Annualized volatility in % 16.00 16.12Tracking Error (Ex post) 0.03 0.02Beta 1.00 1.00
Top 10 Holdings in %UBS 9.07Nestlé 8.95Novartis 8.91Roche 8.85Swiss Re 4.72CS Group 4.70Syngenta 4.68Zurich Fin. Services 4.68Richemont 4.46ABB 4.45Total 63.49
Listing and Trading InformationExchange Listing Date Trading
CurrencyTrading Hours(Local Time)
Bloomberg Ticker Reuters RIC
SIX Swiss Exchange 02.07.2007 CHF 09:00 - 17:30 CSSLI SW CSSLI.S
Source: Lipper, a Reuters Company
328
1) Historical performance indications and financial market scenarios are no guarantee for current or future performance. Performance indications do not consider commissions levied at subscription and/orredemption.
The disclaimer mentioned at the end of this document also applies to this page.
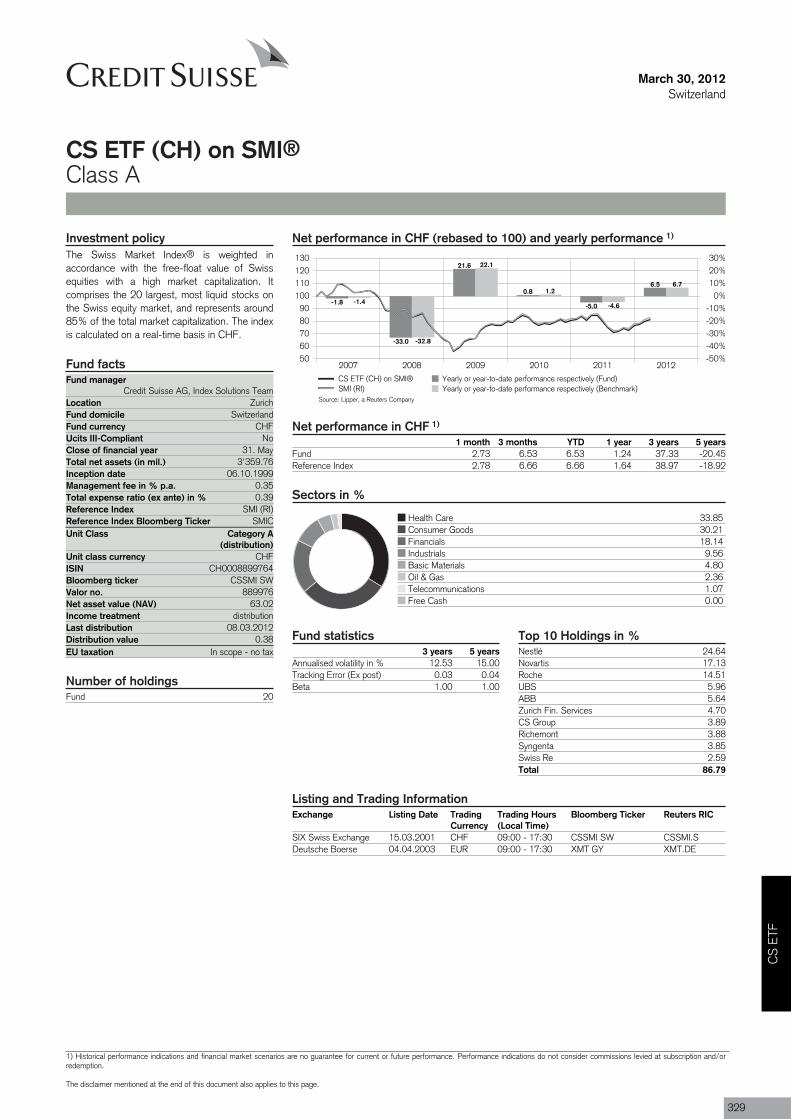
Fund managerCredit Suisse AG, Index Solutions Team
Location ZurichFund domicile SwitzerlandFund currency CHFUcits III-Compliant NoClose of financial year 31. MayTotal net assets (in mil.) 3'359.76Inception date 06.10.1999Management fee in % p.a. 0.35Total expense ratio (ex ante) in % 0.39Reference Index SMI (RI)Reference Index Bloomberg Ticker SMICUnit Class Category A
(distribution)
ISIN CH0008899764
Valor no. 889976
Income treatment distributionLast distribution 08.03.2012Distribution value 0.38EU taxation In scope - no tax
Fund 20
March 30, 2012Switzerland
CS ETF (CH) on SMI®Class A
Net performance in CHF (rebased to 100) and yearly performance 1)
2007 2008 2009 2010 2011 20125060708090
100110120130
-50%-40%-30%-20%-10%
0%10%20%30%
-1.8
-33.0
21.6
0.8
-5.0
6.5
-1.4
-32.8
22.1
1.2
-4.6
6.7
CS ETF (CH) on SMI® Yearly or year-to-date performance respectively (Fund)SMI (RI) Yearly or year-to-date performance respectively (Benchmark)
Net performance in CHF 1)
1 month 3 months YTD 1 year 3 years 5 yearsFund 2.73 6.53 6.53 1.24 37.33 -20.45Reference Index 2.78 6.66 6.66 1.64 38.97 -18.92
Sectors in %
Health Care 33.85Consumer Goods 30.21Financials 18.14Industrials 9.56Basic Materials 4.80Oil & Gas 2.36Telecommunications 1.07Free Cash 0.00
Investment policyThe Swiss Market Index® is weighted inaccordance with the free-float value of Swissequities with a high market capitalization. Itcomprises the 20 largest, most liquid stocks onthe Swiss equity market, and represents around85% of the total market capitalization. The indexis calculated on a real-time basis in CHF.
Fund facts
Unit class currency CHF
Bloomberg ticker CSSMI SW
Net asset value (NAV) 63.02
Number of holdings
Fund statistics3 years 5 years
Annualised volatility in % 12.53 15.00Tracking Error (Ex post) 0.03 0.04Beta 1.00 1.00
Top 10 Holdings in %Nestlé 24.64Novartis 17.13Roche 14.51UBS 5.96ABB 5.64Zurich Fin. Services 4.70CS Group 3.89Richemont 3.88Syngenta 3.85Swiss Re 2.59Total 86.79
Listing and Trading InformationExchange Listing Date Trading
CurrencyTrading Hours(Local Time)
Bloomberg Ticker Reuters RIC
SIX Swiss Exchange 15.03.2001 CHF 09:00 - 17:30 CSSMI SW CSSMI.SDeutsche Boerse 04.04.2003 EUR 09:00 - 17:30 XMT GY XMT.DE
Source: Lipper, a Reuters Company
CS
ETF
1) Historical performance indications and financial market scenarios are no guarantee for current or future performance. Performance indications do not consider commissions levied at subscription and/orredemption.
The disclaimer mentioned at the end of this document also applies to this page.
329
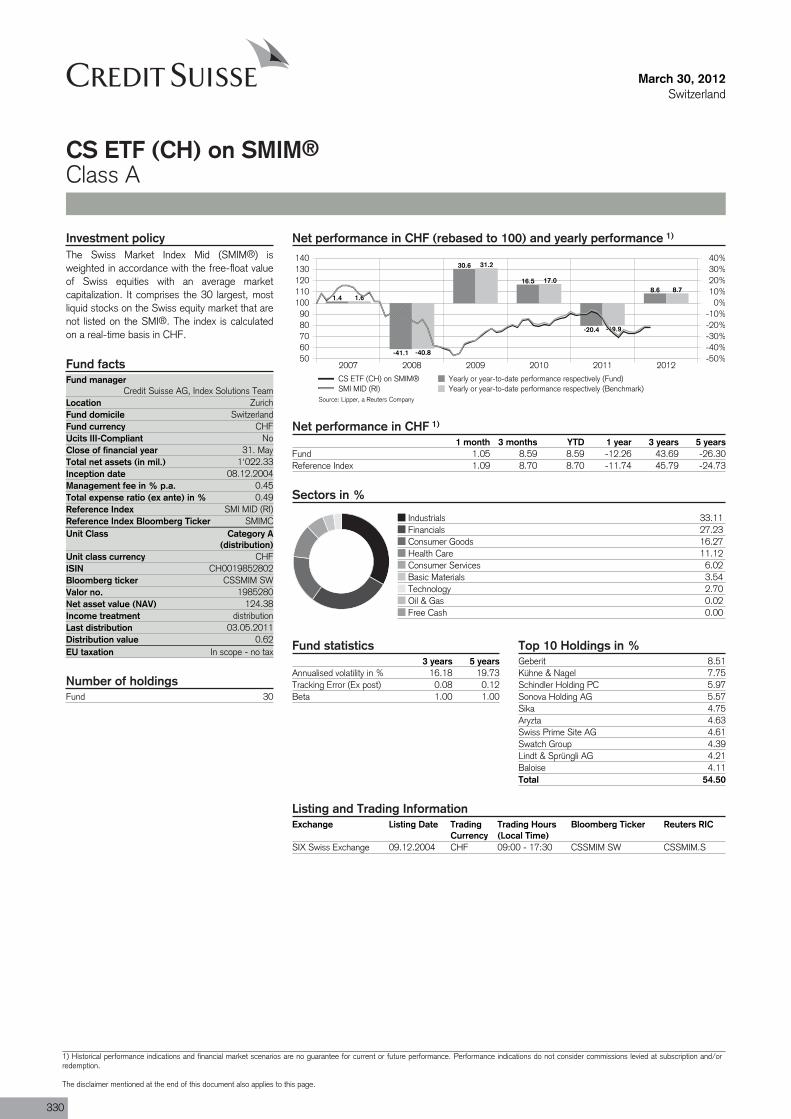
Fund managerCredit Suisse AG, Index Solutions Team
Location ZurichFund domicile SwitzerlandFund currency CHFUcits III-Compliant NoClose of financial year 31. MayTotal net assets (in mil.) 1'022.33Inception date 08.12.2004Management fee in % p.a. 0.45Total expense ratio (ex ante) in % 0.49Reference Index SMI MID (RI)Reference Index Bloomberg Ticker SMIMCUnit Class Category A
(distribution)
ISIN CH0019852802
Valor no. 1985280
Income treatment distributionLast distribution 03.05.2011Distribution value 0.62EU taxation In scope - no tax
Fund 30
March 30, 2012Switzerland
CS ETF (CH) on SMIM®Class A
Net performance in CHF (rebased to 100) and yearly performance 1)
2007 2008 2009 2010 2011 20125060708090
100110120130140
-50%-40%-30%-20%-10%
0%10%20%30%40%
1.4
-41.1
30.6
16.5
-20.4
8.61.6
-40.8
31.2
17.0
-19.9
8.7
CS ETF (CH) on SMIM® Yearly or year-to-date performance respectively (Fund)SMI MID (RI) Yearly or year-to-date performance respectively (Benchmark)
Net performance in CHF 1)
1 month 3 months YTD 1 year 3 years 5 yearsFund 1.05 8.59 8.59 -12.26 43.69 -26.30Reference Index 1.09 8.70 8.70 -11.74 45.79 -24.73
Sectors in %
Industrials 33.11Financials 27.23Consumer Goods 16.27Health Care 11.12Consumer Services 6.02Basic Materials 3.54Technology 2.70Oil & Gas 0.02Free Cash 0.00
Investment policyThe Swiss Market Index Mid (SMIM®) isweighted in accordance with the free-float valueof Swiss equities with an average marketcapitalization. It comprises the 30 largest, mostliquid stocks on the Swiss equity market that arenot listed on the SMI®. The index is calculatedon a real-time basis in CHF.
Fund facts
Unit class currency CHF
Bloomberg ticker CSSMIM SW
Net asset value (NAV) 124.38
Number of holdings
Fund statistics3 years 5 years
Annualised volatility in % 16.18 19.73Tracking Error (Ex post) 0.08 0.12Beta 1.00 1.00
Top 10 Holdings in %Geberit 8.51Kühne & Nagel 7.75Schindler Holding PC 5.97Sonova Holding AG 5.57Sika 4.75Aryzta 4.63Swiss Prime Site AG 4.61Swatch Group 4.39Lindt & Sprüngli AG 4.21Baloise 4.11Total 54.50
Listing and Trading InformationExchange Listing Date Trading
CurrencyTrading Hours(Local Time)
Bloomberg Ticker Reuters RIC
SIX Swiss Exchange 09.12.2004 CHF 09:00 - 17:30 CSSMIM SW CSSMIM.S
Source: Lipper, a Reuters Company
330
1) Historical performance indications and financial market scenarios are no guarantee for current or future performance. Performance indications do not consider commissions levied at subscription and/orredemption.
The disclaimer mentioned at the end of this document also applies to this page.
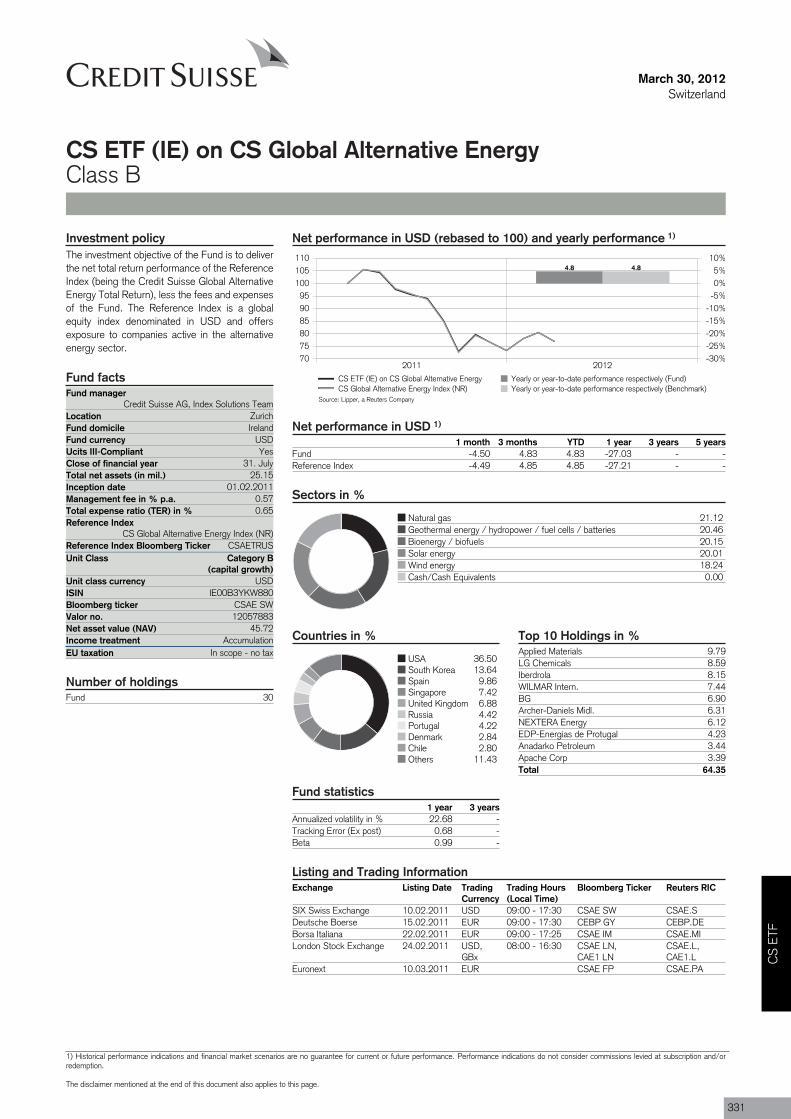
Fund managerCredit Suisse AG, Index Solutions Team
Location ZurichFund domicile IrelandFund currency USDUcits III-CompliantClose of financial year 31. JulyTotal net assets (in mil.) 25.15Inception date 01.02.2011Management fee in % p.a. 0.57Total expense ratio (TER) in % 0.65Reference Index
CS Global Alternative Energy Index (NR)Reference Index Bloomberg Ticker CSAETRUSUnit Class Category B
(capital growth)
ISIN IE00B3YKW880
Valor no. 12057883
Income treatment AccumulationEU taxation In scope - no tax
Fund 30
March 30, 2012Switzerland
CS ETF (IE) on CS Global Alternative EnergyClass B
Net performance in USD (rebased to 100) and yearly performance 1)
2011 2012707580859095
100105110
-30%-25%-20%-15%-10%-5%0%5%
10%4.8 4.8
CS ETF (IE) on CS Global Alternative Energy Yearly or year-to-date performance respectively (Fund)CS Global Alternative Energy Index (NR) Yearly or year-to-date performance respectively (Benchmark)
Net performance in USD 1)
1 month 3 months YTD 1 year 3 years 5 yearsFund -4.50 4.83 4.83 -27.03 - -Reference Index -4.49 4.85 4.85 -27.21 - -
Sectors in %
Natural gas 21.12Geothermal energy / hydropower / fuel cells / batteries 20.46Bioenergy / biofuels 20.15Solar energy 20.01Wind energy 18.24Cash/Cash Equivalents 0.00
Countries in %
USA 36.50South Korea 13.64Spain 9.86Singapore 7.42United Kingdom 6.88Russia 4.42Portugal 4.22Denmark 2.84Chile 2.80Others 11.43
Investment policyThe investment objective of the Fund is to deliverthe net total return performance of the ReferenceIndex (being the Credit Suisse Global AlternativeEnergy Total Return), less the fees and expensesof the Fund. The Reference Index is a globalequity index denominated in USD and offersexposure to companies active in the alternativeenergy sector.
Fund facts
Yes
Unit class currency USD
Bloomberg ticker CSAE SW
Net asset value (NAV) 45.72
Number of holdings
Fund statistics1 year 3 years
Annualized volatility in % 22.68 -Tracking Error (Ex post) 0.68 -Beta 0.99 -
Top 10 Holdings in %Applied Materials 9.79LG Chemicals 8.59Iberdrola 8.15WILMAR Intern. 7.44BG 6.90Archer-Daniels Midl. 6.31NEXTERA Energy 6.12EDP-Energias de Protugal 4.23Anadarko Petroleum 3.44Apache Corp 3.39Total 64.35
Listing and Trading InformationExchange Listing Date Trading
CurrencyTrading Hours(Local Time)
Bloomberg Ticker Reuters RIC
SIX Swiss Exchange 10.02.2011 USD 09:00 - 17:30 CSAE SW CSAE.SDeutsche Boerse 15.02.2011 EUR 09:00 - 17:30 CEBP GY CEBP.DEBorsa Italiana 22.02.2011 EUR 09:00 - 17:25 CSAE IM CSAE.MILondon Stock Exchange 24.02.2011 USD,
GBx08:00 - 16:30 CSAE LN,
CAE1 LNCSAE.L,CAE1.L
Euronext 10.03.2011 EUR CSAE FP CSAE.PA
Source: Lipper, a Reuters Company
CS
ETF
1) Historical performance indications and financial market scenarios are no guarantee for current or future performance. Performance indications do not consider commissions levied at subscription and/orredemption.
The disclaimer mentioned at the end of this document also applies to this page.
331
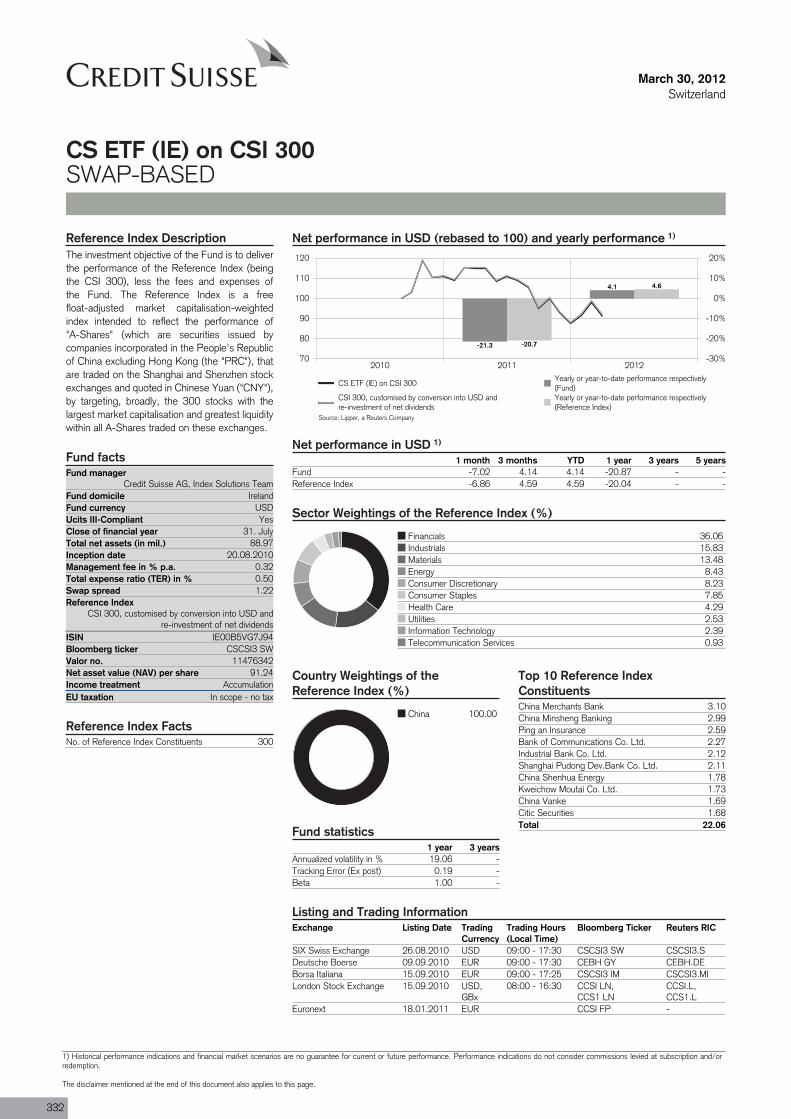
Fund managerCredit Suisse AG, Index Solutions Team
Fund domicile IrelandFund currency USDUcits III-CompliantClose of financial year 31. JulyTotal net assets (in mil.) 88.97Inception date 20.08.2010Management fee in % p.a. 0.32Total expense ratio (TER) in % 0.50Swap spread 1.22Reference Index
CSI 300, customised by conversion into USD andre-investment of net dividends
ISIN IE00B5VG7J94
Valor no. 11476342
Income treatment AccumulationEU taxation In scope - no tax
No. of Reference Index Constituents 300
March 30, 2012Switzerland
CS ETF (IE) on CSI 300SWAP-BASED
Net performance in USD (rebased to 100) and yearly performance 1)
2010 2011 201270
80
90
100
110
120
-30%
-20%
-10%
0%
10%
20%
-21.3
4.1
-20.7
4.6
CS ETF (IE) on CSI 300Yearly or year-to-date performance respectively(Fund)
CSI 300, customised by conversion into USD andre-investment of net dividends
Yearly or year-to-date performance respectively(Reference Index)
Net performance in USD 1)
1 month 3 months YTD 1 year 3 years 5 yearsFund -7.02 4.14 4.14 -20.87 - -Reference Index -6.86 4.59 4.59 -20.04 - -
Sector Weightings of the Reference Index (%)
Financials 36.06Industrials 15.83Materials 13.48Energy 8.43Consumer Discretionary 8.23Consumer Staples 7.85Health Care 4.29Utilities 2.53Information Technology 2.39Telecommunication Services 0.93
Country Weightings of theReference Index (%)
China 100.00
Reference Index DescriptionThe investment objective of the Fund is to deliverthe performance of the Reference Index (beingthe CSI 300), less the fees and expenses ofthe Fund. The Reference Index is a freefloat-adjusted market capitalisation-weightedindex intended to reflect the performance of"A-Shares" (which are securities issued bycompanies incorporated in the People's Republicof China excluding Hong Kong (the "PRC"), thatare traded on the Shanghai and Shenzhen stockexchanges and quoted in Chinese Yuan ("CNY"),by targeting, broadly, the 300 stocks with thelargest market capitalisation and greatest liquiditywithin all A-Shares traded on these exchanges.
Fund facts
Yes
Bloomberg ticker CSCSI3 SW
Net asset value (NAV) per share 91.24
Reference Index Facts
Fund statistics1 year 3 years
Annualized volatility in % 19.06 -Tracking Error (Ex post) 0.19 -Beta 1.00 -
Top 10 Reference IndexConstituentsChina Merchants Bank 3.10China Minsheng Banking 2.99Ping an Insurance 2.59Bank of Communications Co. Ltd. 2.27Industrial Bank Co. Ltd. 2.12Shanghai Pudong Dev.Bank Co. Ltd. 2.11China Shenhua Energy 1.78Kweichow Moutai Co. Ltd. 1.73China Vanke 1.69Citic Securities 1.68Total 22.06
Listing and Trading InformationExchange Listing Date Trading
CurrencyTrading Hours(Local Time)
Bloomberg Ticker Reuters RIC
SIX Swiss Exchange 26.08.2010 USD 09:00 - 17:30 CSCSI3 SW CSCSI3.SDeutsche Boerse 09.09.2010 EUR 09:00 - 17:30 CEBH GY CEBH.DEBorsa Italiana 15.09.2010 EUR 09:00 - 17:25 CSCSI3 IM CSCSI3.MILondon Stock Exchange 15.09.2010 USD,
GBx08:00 - 16:30 CCSI LN,
CCS1 LNCCSI.L,CCS1.L
Euronext 18.01.2011 EUR CCSI FP -
Source: Lipper, a Reuters Company
332
1) Historical performance indications and financial market scenarios are no guarantee for current or future performance. Performance indications do not consider commissions levied at subscription and/orredemption.
The disclaimer mentioned at the end of this document also applies to this page.
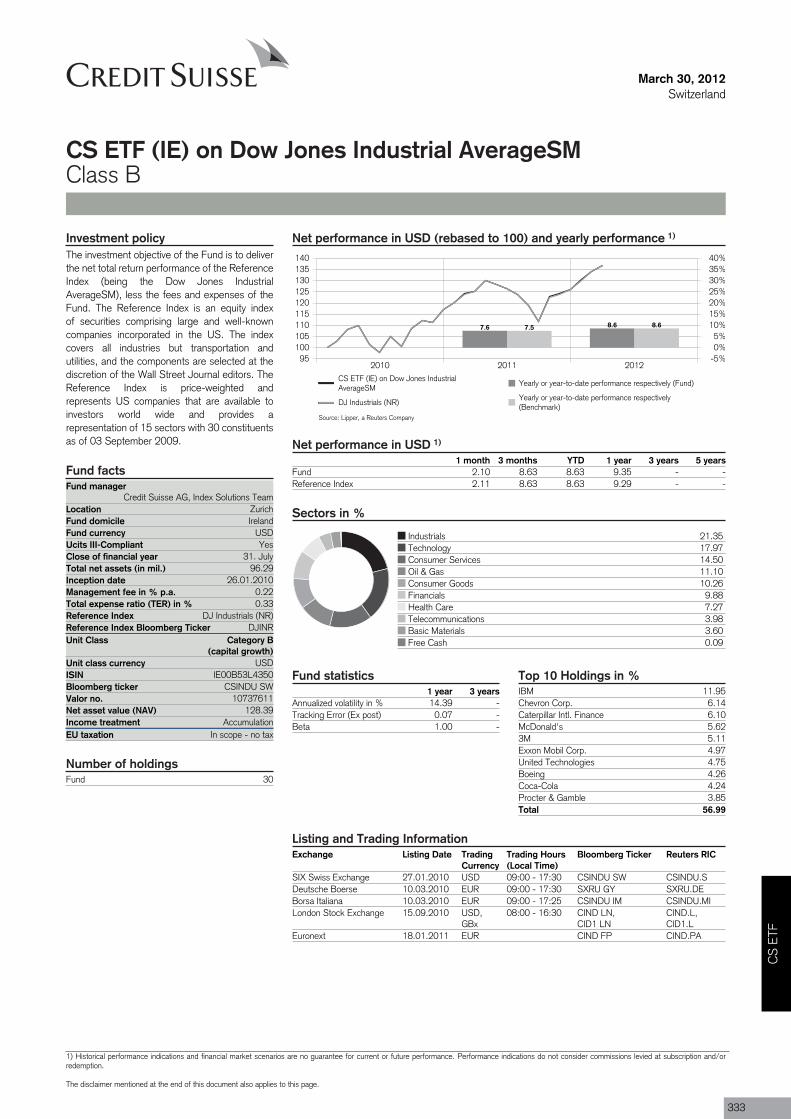
Fund managerCredit Suisse AG, Index Solutions Team
Location ZurichFund domicile IrelandFund currency USDUcits III-CompliantClose of financial year 31. JulyTotal net assets (in mil.) 96.29Inception date 26.01.2010Management fee in % p.a. 0.22Total expense ratio (TER) in % 0.33Reference Index DJ Industrials (NR)Reference Index Bloomberg Ticker DJINRUnit Class Category B
(capital growth)
ISIN IE00B53L4350
Valor no. 10737611
Income treatment AccumulationEU taxation In scope - no tax
Fund 30
March 30, 2012Switzerland
CS ETF (IE) on Dow Jones Industrial AverageSMClass B
Net performance in USD (rebased to 100) and yearly performance 1)
2010 2011 201295
100105110115120125130135140
-5%0%5%
10%15%20%25%30%35%40%
7.6 8.67.5 8.6
CS ETF (IE) on Dow Jones IndustrialAverageSM
Yearly or year-to-date performance respectively (Fund)
DJ Industrials (NR)Yearly or year-to-date performance respectively(Benchmark)
Net performance in USD 1)
1 month 3 months YTD 1 year 3 years 5 yearsFund 2.10 8.63 8.63 9.35 - -Reference Index 2.11 8.63 8.63 9.29 - -
Sectors in %
Industrials 21.35Technology 17.97Consumer Services 14.50Oil & Gas 11.10Consumer Goods 10.26Financials 9.88Health Care 7.27Telecommunications 3.98Basic Materials 3.60Free Cash 0.09
Investment policyThe investment objective of the Fund is to deliverthe net total return performance of the ReferenceIndex (being the Dow Jones IndustrialAverageSM), less the fees and expenses of theFund. The Reference Index is an equity indexof securities comprising large and well-knowncompanies incorporated in the US. The indexcovers all industries but transportation andutilities, and the components are selected at thediscretion of the Wall Street Journal editors. TheReference Index is price-weighted andrepresents US companies that are available toinvestors world wide and provides arepresentation of 15 sectors with 30 constituentsas of 03 September 2009.
Fund facts
Yes
Unit class currency USD
Bloomberg ticker CSINDU SW
Net asset value (NAV) 128.39
Number of holdings
Fund statistics1 year 3 years
Annualized volatility in % 14.39 -Tracking Error (Ex post) 0.07 -Beta 1.00 -
Top 10 Holdings in %IBM 11.95Chevron Corp. 6.14Caterpillar Intl. Finance 6.10McDonald's 5.623M 5.11Exxon Mobil Corp. 4.97United Technologies 4.75Boeing 4.26Coca-Cola 4.24Procter & Gamble 3.85Total 56.99
Listing and Trading InformationExchange Listing Date Trading
CurrencyTrading Hours(Local Time)
Bloomberg Ticker Reuters RIC
SIX Swiss Exchange 27.01.2010 USD 09:00 - 17:30 CSINDU SW CSINDU.SDeutsche Boerse 10.03.2010 EUR 09:00 - 17:30 SXRU GY SXRU.DEBorsa Italiana 10.03.2010 EUR 09:00 - 17:25 CSINDU IM CSINDU.MILondon Stock Exchange 15.09.2010 USD,
GBx08:00 - 16:30 CIND LN,
CID1 LNCIND.L,CID1.L
Euronext 18.01.2011 EUR CIND FP CIND.PA
Source: Lipper, a Reuters Company
CS
ETF
1) Historical performance indications and financial market scenarios are no guarantee for current or future performance. Performance indications do not consider commissions levied at subscription and/orredemption.
The disclaimer mentioned at the end of this document also applies to this page.
333
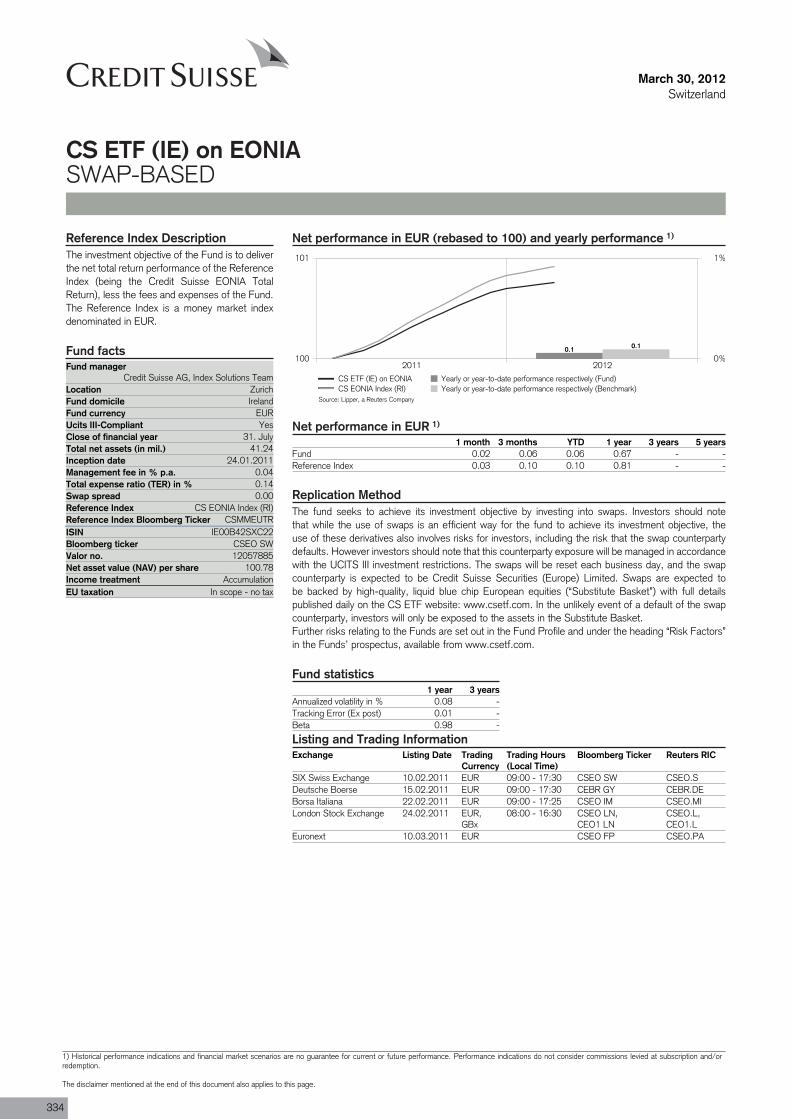
Fund managerCredit Suisse AG, Index Solutions Team
Location ZurichFund domicile IrelandFund currency EURUcits III-CompliantClose of financial year 31. JulyTotal net assets (in mil.) 41.24Inception date 24.01.2011Management fee in % p.a. 0.04Total expense ratio (TER) in % 0.14Swap spread 0.00Reference Index CS EONIA Index (RI)Reference Index Bloomberg Ticker CSMMEUTRISIN IE00B42SXC22
Valor no. 12057885
Income treatment AccumulationEU taxation In scope - no tax
March 30, 2012Switzerland
CS ETF (IE) on EONIASWAP-BASED
Net performance in EUR (rebased to 100) and yearly performance 1)
2011 2012100
101
0%
1%
0.1 0.1
CS ETF (IE) on EONIA Yearly or year-to-date performance respectively (Fund)CS EONIA Index (RI) Yearly or year-to-date performance respectively (Benchmark)
Net performance in EUR 1)
1 month 3 months YTD 1 year 3 years 5 yearsFund 0.02 0.06 0.06 0.67 - -Reference Index 0.03 0.10 0.10 0.81 - -
Replication MethodThe fund seeks to achieve its investment objective by investing into swaps. Investors should notethat while the use of swaps is an efficient way for the fund to achieve its investment objective, theuse of these derivatives also involves risks for investors, including the risk that the swap counterpartydefaults. However investors should note that this counterparty exposure will be managed in accordancewith the UCITS III investment restrictions. The swaps will be reset each business day, and the swapcounterparty is expected to be Credit Suisse Securities (Europe) Limited. Swaps are expected tobe backed by high-quality, liquid blue chip European equities (“Substitute Basket”) with full detailspublished daily on the CS ETF website: www.csetf.com. In the unlikely event of a default of the swapcounterparty, investors will only be exposed to the assets in the Substitute Basket.Further risks relating to the Funds are set out in the Fund Profile and under the heading “Risk Factors”in the Funds’ prospectus, available from www.csetf.com.
Fund statistics1 year 3 years
Annualized volatility in % 0.08 -Tracking Error (Ex post) 0.01 -Beta 0.98 -
Reference Index DescriptionThe investment objective of the Fund is to deliverthe net total return performance of the ReferenceIndex (being the Credit Suisse EONIA TotalReturn), less the fees and expenses of the Fund.The Reference Index is a money market indexdenominated in EUR.
Fund facts
Yes
Bloomberg ticker CSEO SW
Net asset value (NAV) per share 100.78
Listing and Trading InformationExchange Listing Date Trading
CurrencyTrading Hours(Local Time)
Bloomberg Ticker Reuters RIC
SIX Swiss Exchange 10.02.2011 EUR 09:00 - 17:30 CSEO SW CSEO.SDeutsche Boerse 15.02.2011 EUR 09:00 - 17:30 CEBR GY CEBR.DEBorsa Italiana 22.02.2011 EUR 09:00 - 17:25 CSEO IM CSEO.MILondon Stock Exchange 24.02.2011 EUR,
GBx08:00 - 16:30 CSEO LN,
CEO1 LNCSEO.L,CEO1.L
Euronext 10.03.2011 EUR CSEO FP CSEO.PA
Source: Lipper, a Reuters Company
334
1) Historical performance indications and financial market scenarios are no guarantee for current or future performance. Performance indications do not consider commissions levied at subscription and/orredemption.
The disclaimer mentioned at the end of this document also applies to this page.
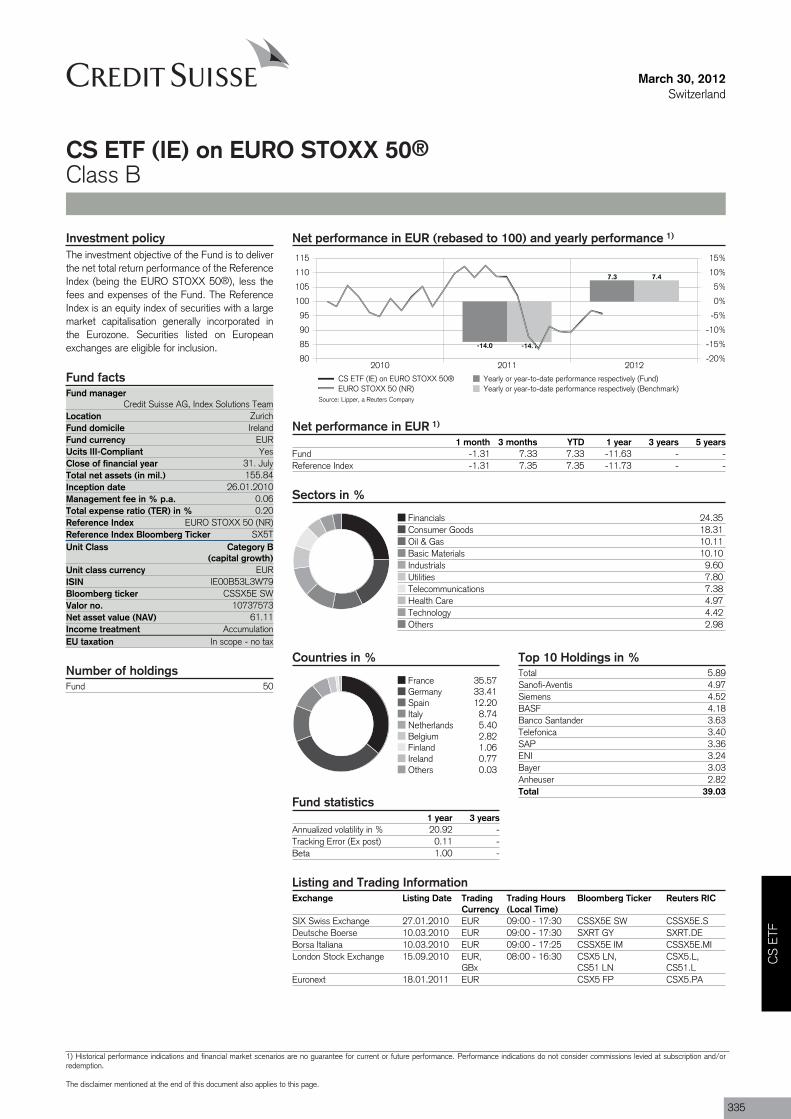
Fund managerCredit Suisse AG, Index Solutions Team
Location ZurichFund domicile IrelandFund currency EURUcits III-CompliantClose of financial year 31. JulyTotal net assets (in mil.) 155.84Inception date 26.01.2010Management fee in % p.a. 0.06Total expense ratio (TER) in % 0.20Reference Index EURO STOXX 50 (NR)Reference Index Bloomberg Ticker SX5TUnit Class Category B
(capital growth)
ISIN IE00B53L3W79
Valor no. 10737573
Income treatment AccumulationEU taxation In scope - no tax
Fund 50
March 30, 2012Switzerland
CS ETF (IE) on EURO STOXX 50®Class B
Net performance in EUR (rebased to 100) and yearly performance 1)
2010 2011 201280
85
90
95
100
105
110
115
-20%
-15%
-10%
-5%
0%
5%
10%
15%
-14.0
7.3
-14.1
7.4
CS ETF (IE) on EURO STOXX 50® Yearly or year-to-date performance respectively (Fund)EURO STOXX 50 (NR) Yearly or year-to-date performance respectively (Benchmark)
Net performance in EUR 1)
1 month 3 months YTD 1 year 3 years 5 yearsFund -1.31 7.33 7.33 -11.63 - -Reference Index -1.31 7.35 7.35 -11.73 - -
Sectors in %
Financials 24.35Consumer Goods 18.31Oil & Gas 10.11Basic Materials 10.10Industrials 9.60Utilities 7.80Telecommunications 7.38Health Care 4.97Technology 4.42Others 2.98
Countries in %
France 35.57Germany 33.41Spain 12.20Italy 8.74Netherlands 5.40Belgium 2.82Finland 1.06Ireland 0.77Others 0.03
Investment policyThe investment objective of the Fund is to deliverthe net total return performance of the ReferenceIndex (being the EURO STOXX 50®), less thefees and expenses of the Fund. The ReferenceIndex is an equity index of securities with a largemarket capitalisation generally incorporated inthe Eurozone. Securities listed on Europeanexchanges are eligible for inclusion.
Fund facts
Yes
Unit class currency EUR
Bloomberg ticker CSSX5E SW
Net asset value (NAV) 61.11
Number of holdings
Fund statistics1 year 3 years
Annualized volatility in % 20.92 -Tracking Error (Ex post) 0.11 -Beta 1.00 -
Top 10 Holdings in %Total 5.89Sanofi-Aventis 4.97Siemens 4.52BASF 4.18Banco Santander 3.63Telefonica 3.40SAP 3.36ENI 3.24Bayer 3.03Anheuser 2.82Total 39.03
Listing and Trading InformationExchange Listing Date Trading
CurrencyTrading Hours(Local Time)
Bloomberg Ticker Reuters RIC
SIX Swiss Exchange 27.01.2010 EUR 09:00 - 17:30 CSSX5E SW CSSX5E.SDeutsche Boerse 10.03.2010 EUR 09:00 - 17:30 SXRT GY SXRT.DEBorsa Italiana 10.03.2010 EUR 09:00 - 17:25 CSSX5E IM CSSX5E.MILondon Stock Exchange 15.09.2010 EUR,
GBx08:00 - 16:30 CSX5 LN,
CS51 LNCSX5.L,CS51.L
Euronext 18.01.2011 EUR CSX5 FP CSX5.PA
Source: Lipper, a Reuters Company
CS
ETF
1) Historical performance indications and financial market scenarios are no guarantee for current or future performance. Performance indications do not consider commissions levied at subscription and/orredemption.
The disclaimer mentioned at the end of this document also applies to this page.
335
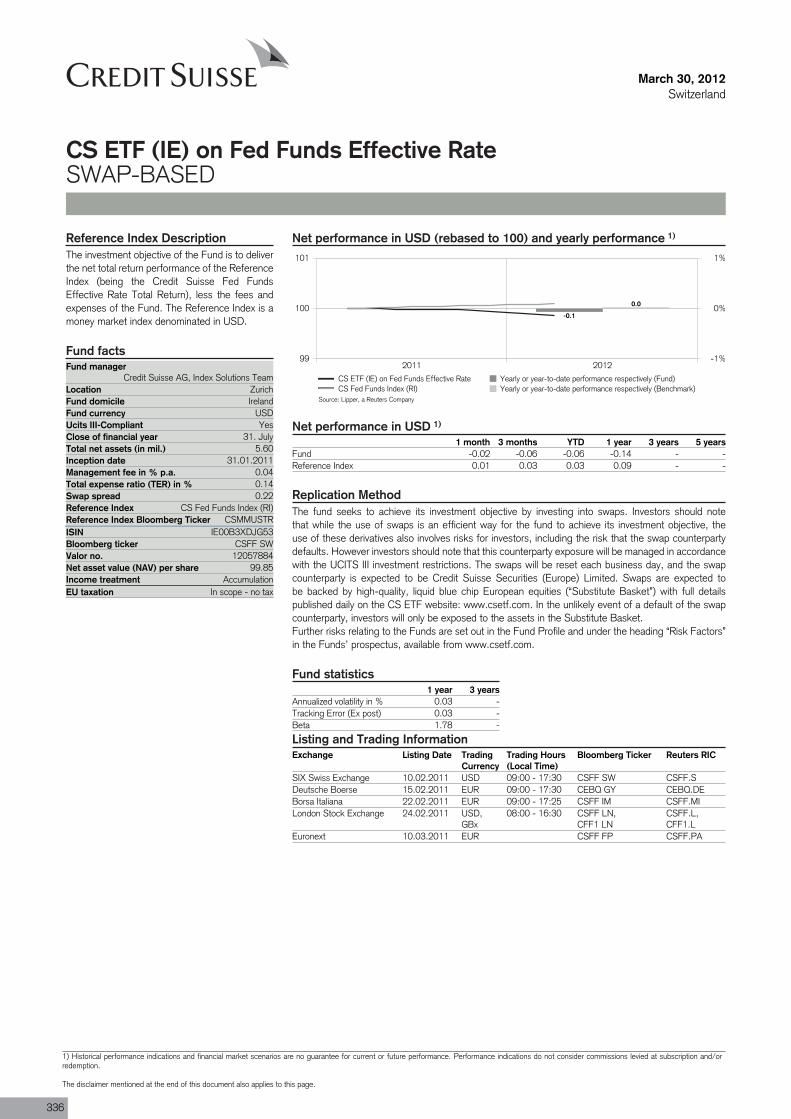
Fund managerCredit Suisse AG, Index Solutions Team
Location ZurichFund domicile IrelandFund currency USDUcits III-CompliantClose of financial year 31. JulyTotal net assets (in mil.) 5.60Inception date 31.01.2011Management fee in % p.a. 0.04Total expense ratio (TER) in % 0.14Swap spread 0.22Reference Index CS Fed Funds Index (RI)Reference Index Bloomberg Ticker CSMMUSTRISIN IE00B3XDJG53
Valor no. 12057884
Income treatment AccumulationEU taxation In scope - no tax
March 30, 2012Switzerland
CS ETF (IE) on Fed Funds Effective RateSWAP-BASED
Net performance in USD (rebased to 100) and yearly performance 1)
2011 201299
100
101
-1%
0%
1%
-0.1
0.0
CS ETF (IE) on Fed Funds Effective Rate Yearly or year-to-date performance respectively (Fund)CS Fed Funds Index (RI) Yearly or year-to-date performance respectively (Benchmark)
Net performance in USD 1)
1 month 3 months YTD 1 year 3 years 5 yearsFund -0.02 -0.06 -0.06 -0.14 - -Reference Index 0.01 0.03 0.03 0.09 - -
Replication MethodThe fund seeks to achieve its investment objective by investing into swaps. Investors should notethat while the use of swaps is an efficient way for the fund to achieve its investment objective, theuse of these derivatives also involves risks for investors, including the risk that the swap counterpartydefaults. However investors should note that this counterparty exposure will be managed in accordancewith the UCITS III investment restrictions. The swaps will be reset each business day, and the swapcounterparty is expected to be Credit Suisse Securities (Europe) Limited. Swaps are expected tobe backed by high-quality, liquid blue chip European equities (“Substitute Basket”) with full detailspublished daily on the CS ETF website: www.csetf.com. In the unlikely event of a default of the swapcounterparty, investors will only be exposed to the assets in the Substitute Basket.Further risks relating to the Funds are set out in the Fund Profile and under the heading “Risk Factors”in the Funds’ prospectus, available from www.csetf.com.
Fund statistics1 year 3 years
Annualized volatility in % 0.03 -Tracking Error (Ex post) 0.03 -Beta 1.78 -
Reference Index DescriptionThe investment objective of the Fund is to deliverthe net total return performance of the ReferenceIndex (being the Credit Suisse Fed FundsEffective Rate Total Return), less the fees andexpenses of the Fund. The Reference Index is amoney market index denominated in USD.
Fund facts
Yes
Bloomberg ticker CSFF SW
Net asset value (NAV) per share 99.85
Listing and Trading InformationExchange Listing Date Trading
CurrencyTrading Hours(Local Time)
Bloomberg Ticker Reuters RIC
SIX Swiss Exchange 10.02.2011 USD 09:00 - 17:30 CSFF SW CSFF.SDeutsche Boerse 15.02.2011 EUR 09:00 - 17:30 CEBQ GY CEBQ.DEBorsa Italiana 22.02.2011 EUR 09:00 - 17:25 CSFF IM CSFF.MILondon Stock Exchange 24.02.2011 USD,
GBx08:00 - 16:30 CSFF LN,
CFF1 LNCSFF.L,CFF1.L
Euronext 10.03.2011 EUR CSFF FP CSFF.PA
Source: Lipper, a Reuters Company
336
1) Historical performance indications and financial market scenarios are no guarantee for current or future performance. Performance indications do not consider commissions levied at subscription and/orredemption.
The disclaimer mentioned at the end of this document also applies to this page.
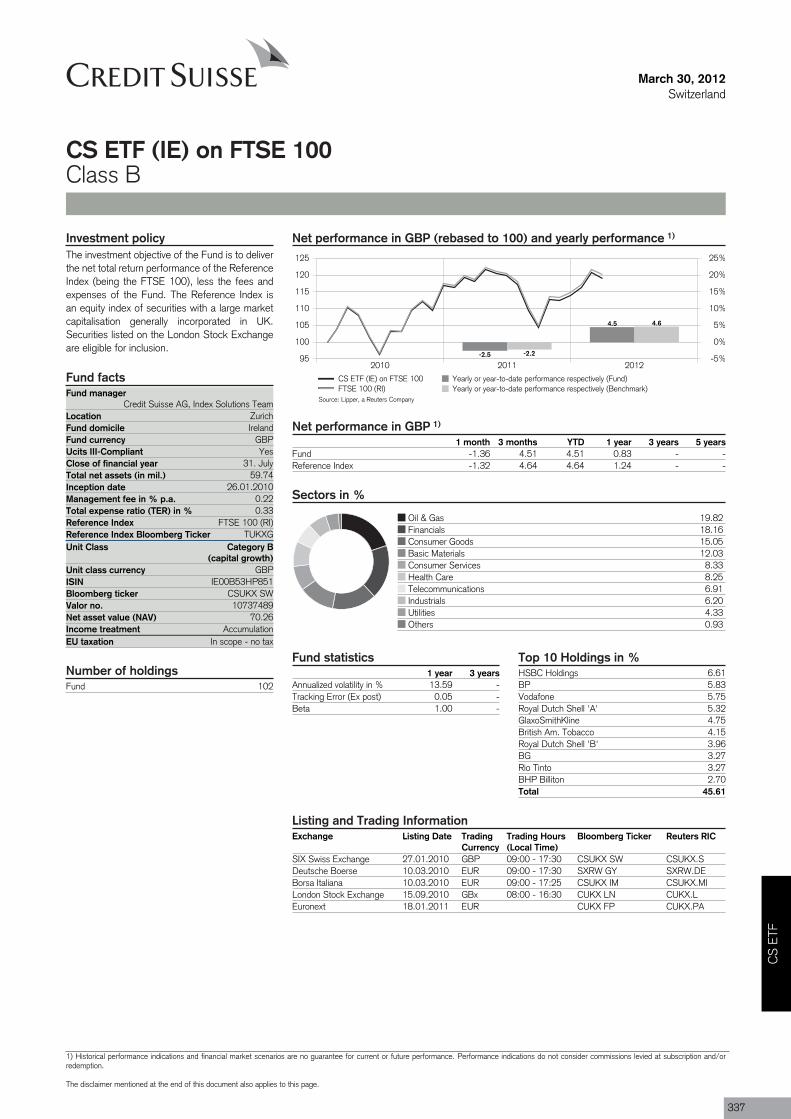
Fund managerCredit Suisse AG, Index Solutions Team
Location ZurichFund domicile IrelandFund currency GBPUcits III-CompliantClose of financial year 31. JulyTotal net assets (in mil.) 59.74Inception date 26.01.2010Management fee in % p.a. 0.22Total expense ratio (TER) in % 0.33Reference Index FTSE 100 (RI)Reference Index Bloomberg Ticker TUKXGUnit Class Category B
(capital growth)
ISIN IE00B53HP851
Valor no. 10737489
Income treatment AccumulationEU taxation In scope - no tax
Fund 102
March 30, 2012Switzerland
CS ETF (IE) on FTSE 100Class B
Net performance in GBP (rebased to 100) and yearly performance 1)
2010 2011 201295
100
105
110
115
120
125
-5%
0%
5%
10%
15%
20%
25%
-2.5
4.5
-2.2
4.6
CS ETF (IE) on FTSE 100 Yearly or year-to-date performance respectively (Fund)FTSE 100 (RI) Yearly or year-to-date performance respectively (Benchmark)
Net performance in GBP 1)
1 month 3 months YTD 1 year 3 years 5 yearsFund -1.36 4.51 4.51 0.83 - -Reference Index -1.32 4.64 4.64 1.24 - -
Sectors in %
Oil & Gas 19.82Financials 18.16Consumer Goods 15.05Basic Materials 12.03Consumer Services 8.33Health Care 8.25Telecommunications 6.91Industrials 6.20Utilities 4.33Others 0.93
Investment policyThe investment objective of the Fund is to deliverthe net total return performance of the ReferenceIndex (being the FTSE 100), less the fees andexpenses of the Fund. The Reference Index isan equity index of securities with a large marketcapitalisation generally incorporated in UK.Securities listed on the London Stock Exchangeare eligible for inclusion.
Fund facts
Yes
Unit class currency GBP
Bloomberg ticker CSUKX SW
Net asset value (NAV) 70.26
Number of holdingsFund statistics
1 year 3 yearsAnnualized volatility in % 13.59 -Tracking Error (Ex post) 0.05 -Beta 1.00 -
Top 10 Holdings in %HSBC Holdings 6.61BP 5.83Vodafone 5.75Royal Dutch Shell 'A' 5.32GlaxoSmithKline 4.75British Am. Tobacco 4.15Royal Dutch Shell 'B' 3.96BG 3.27Rio Tinto 3.27BHP Billiton 2.70Total 45.61
Listing and Trading InformationExchange Listing Date Trading
CurrencyTrading Hours(Local Time)
Bloomberg Ticker Reuters RIC
SIX Swiss Exchange 27.01.2010 GBP 09:00 - 17:30 CSUKX SW CSUKX.SDeutsche Boerse 10.03.2010 EUR 09:00 - 17:30 SXRW GY SXRW.DEBorsa Italiana 10.03.2010 EUR 09:00 - 17:25 CSUKX IM CSUKX.MILondon Stock Exchange 15.09.2010 GBx 08:00 - 16:30 CUKX LN CUKX.LEuronext 18.01.2011 EUR CUKX FP CUKX.PA
Source: Lipper, a Reuters Company
CS
ETF
1) Historical performance indications and financial market scenarios are no guarantee for current or future performance. Performance indications do not consider commissions levied at subscription and/orredemption.
The disclaimer mentioned at the end of this document also applies to this page.
337
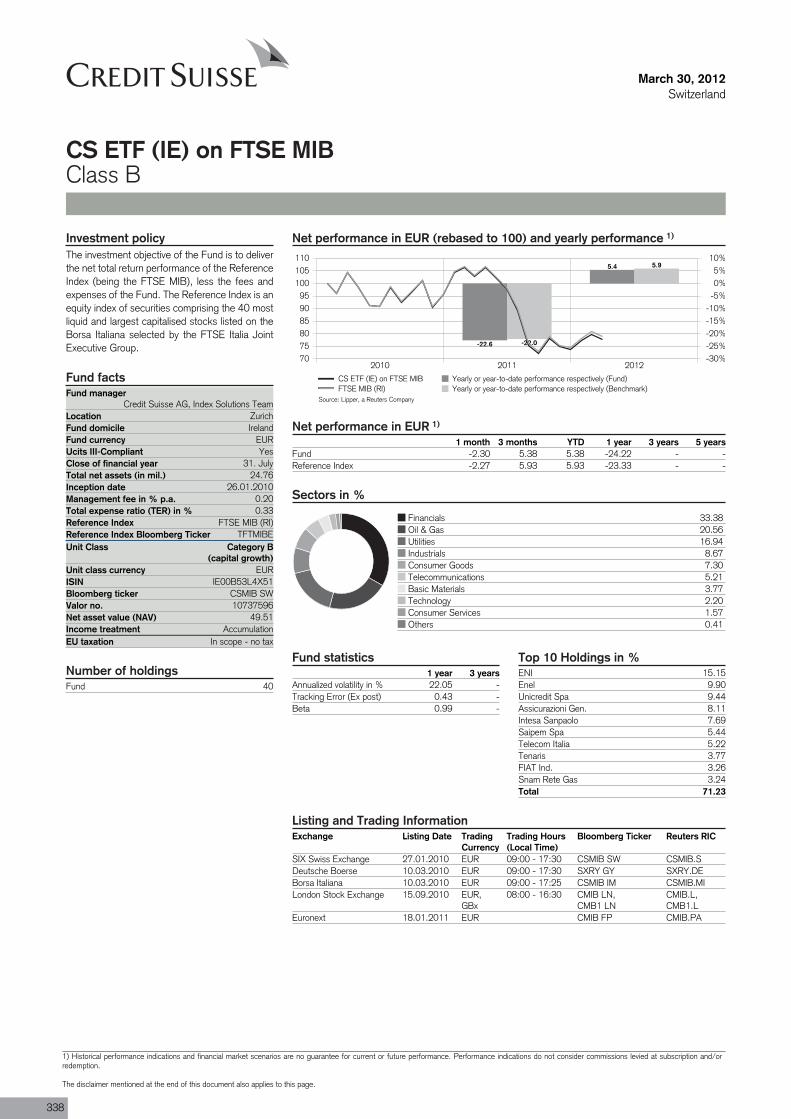
Fund managerCredit Suisse AG, Index Solutions Team
Location ZurichFund domicile IrelandFund currency EURUcits III-CompliantClose of financial year 31. JulyTotal net assets (in mil.) 24.76Inception date 26.01.2010Management fee in % p.a. 0.20Total expense ratio (TER) in % 0.33Reference Index FTSE MIB (RI)Reference Index Bloomberg Ticker TFTMIBEUnit Class Category B
(capital growth)
ISIN IE00B53L4X51
Valor no. 10737596
Income treatment AccumulationEU taxation In scope - no tax
Fund 40
March 30, 2012Switzerland
CS ETF (IE) on FTSE MIBClass B
Net performance in EUR (rebased to 100) and yearly performance 1)
2010 2011 2012707580859095
100105110
-30%-25%-20%-15%-10%-5%0%5%
10%
-22.6
5.4
-22.0
5.9
CS ETF (IE) on FTSE MIB Yearly or year-to-date performance respectively (Fund)FTSE MIB (RI) Yearly or year-to-date performance respectively (Benchmark)
Net performance in EUR 1)
1 month 3 months YTD 1 year 3 years 5 yearsFund -2.30 5.38 5.38 -24.22 - -Reference Index -2.27 5.93 5.93 -23.33 - -
Sectors in %
Financials 33.38Oil & Gas 20.56Utilities 16.94Industrials 8.67Consumer Goods 7.30Telecommunications 5.21Basic Materials 3.77Technology 2.20Consumer Services 1.57Others 0.41
Investment policyThe investment objective of the Fund is to deliverthe net total return performance of the ReferenceIndex (being the FTSE MIB), less the fees andexpenses of the Fund. The Reference Index is anequity index of securities comprising the 40 mostliquid and largest capitalised stocks listed on theBorsa Italiana selected by the FTSE Italia JointExecutive Group.
Fund facts
Yes
Unit class currency EUR
Bloomberg ticker CSMIB SW
Net asset value (NAV) 49.51
Number of holdingsFund statistics
1 year 3 yearsAnnualized volatility in % 22.05 -Tracking Error (Ex post) 0.43 -Beta 0.99 -
Top 10 Holdings in %ENI 15.15Enel 9.90Unicredit Spa 9.44Assicurazioni Gen. 8.11Intesa Sanpaolo 7.69Saipem Spa 5.44Telecom Italia 5.22Tenaris 3.77FIAT Ind. 3.26Snam Rete Gas 3.24Total 71.23
Listing and Trading InformationExchange Listing Date Trading
CurrencyTrading Hours(Local Time)
Bloomberg Ticker Reuters RIC
SIX Swiss Exchange 27.01.2010 EUR 09:00 - 17:30 CSMIB SW CSMIB.SDeutsche Boerse 10.03.2010 EUR 09:00 - 17:30 SXRY GY SXRY.DEBorsa Italiana 10.03.2010 EUR 09:00 - 17:25 CSMIB IM CSMIB.MILondon Stock Exchange 15.09.2010 EUR,
GBx08:00 - 16:30 CMIB LN,
CMB1 LNCMIB.L,CMB1.L
Euronext 18.01.2011 EUR CMIB FP CMIB.PA
Source: Lipper, a Reuters Company
338
1) Historical performance indications and financial market scenarios are no guarantee for current or future performance. Performance indications do not consider commissions levied at subscription and/orredemption.
The disclaimer mentioned at the end of this document also applies to this page.
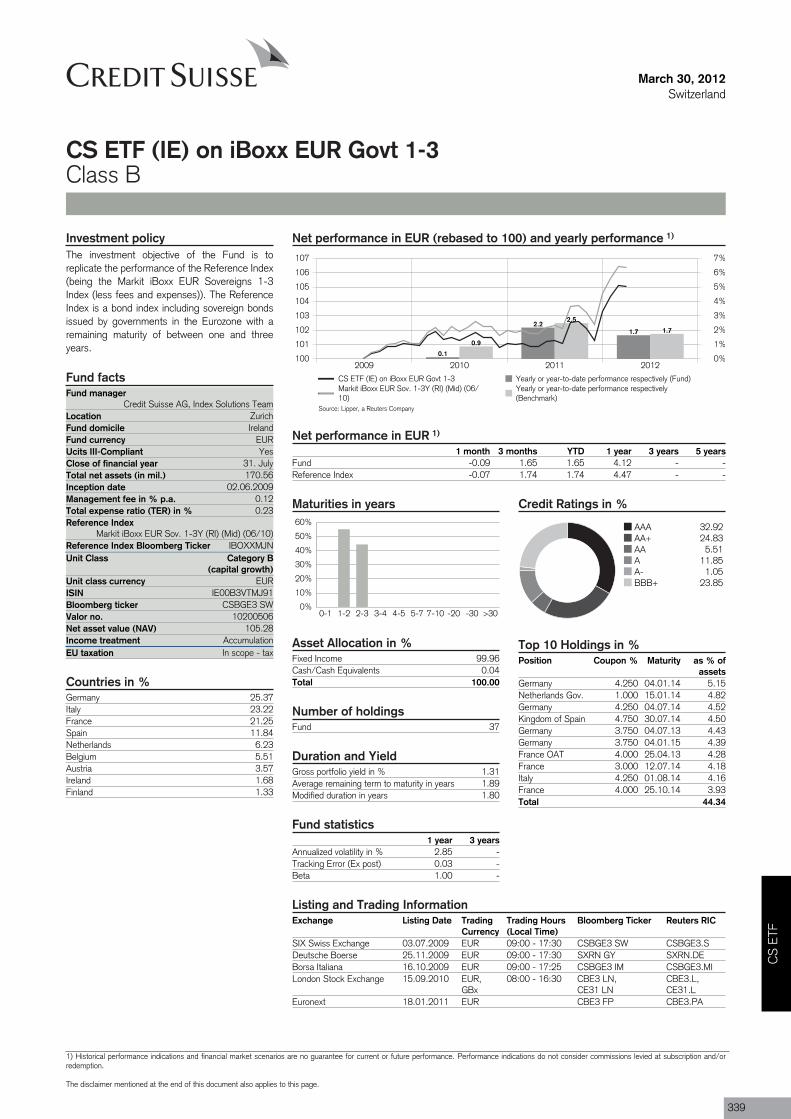
Fund 37
Fund managerCredit Suisse AG, Index Solutions Team
Location ZurichFund domicile IrelandFund currency EURUcits III-CompliantClose of financial year 31. JulyTotal net assets (in mil.) 170.56Inception date 02.06.2009Management fee in % p.a. 0.12Total expense ratio (TER) in % 0.23Reference Index
Markit iBoxx EUR Sov. 1-3Y (RI) (Mid) (06/10)Reference Index Bloomberg Ticker IBOXXMJNUnit Class Category B
(capital growth)
ISIN IE00B3VTMJ91
Valor no. 10200506
Income treatment AccumulationEU taxation In scope - tax
March 30, 2012Switzerland
CS ETF (IE) on iBoxx EUR Govt 1-3Class B
Net performance in EUR (rebased to 100) and yearly performance 1)
2009 2010 2011 2012100
101
102
103
104
105
106
107
0%
1%
2%
3%
4%
5%
6%
7%
0.1
2.21.7
0.9
2.5
1.7
CS ETF (IE) on iBoxx EUR Govt 1-3 Yearly or year-to-date performance respectively (Fund)Markit iBoxx EUR Sov. 1-3Y (RI) (Mid) (06/10)
Yearly or year-to-date performance respectively(Benchmark)
Net performance in EUR 1)
1 month 3 months YTD 1 year 3 years 5 yearsFund -0.09 1.65 1.65 4.12 - -Reference Index -0.07 1.74 1.74 4.47 - -
Maturities in years
0%
10%
20%
30%
40%
50%
60%
0-1 1-2 2-3 3-4 4-5 5-7 7-10 -20 -30 >30
Asset Allocation in %Fixed Income 99.96Cash/Cash Equivalents 0.04Total 100.00
Number of holdings
Duration and YieldGross portfolio yield in % 1.31Average remaining term to maturity in years 1.89Modified duration in years 1.80
Fund statistics1 year 3 years
Annualized volatility in % 2.85 -Tracking Error (Ex post) 0.03 -Beta 1.00 -
Credit Ratings in %
AAA 32.92AA+ 24.83AA 5.51A 11.85A- 1.05BBB+ 23.85
Top 10 Holdings in %Position Coupon % Maturity as % of
assetsGermany 4.250 04.01.14 5.15Netherlands Gov. 1.000 15.01.14 4.82Germany 4.250 04.07.14 4.52Kingdom of Spain 4.750 30.07.14 4.50Germany 3.750 04.07.13 4.43Germany 3.750 04.01.15 4.39France OAT 4.000 25.04.13 4.28France 3.000 12.07.14 4.18Italy 4.250 01.08.14 4.16France 4.000 25.10.14 3.93Total 44.34
Investment policyThe investment objective of the Fund is toreplicate the performance of the Reference Index(being the Markit iBoxx EUR Sovereigns 1-3Index (less fees and expenses)). The ReferenceIndex is a bond index including sovereign bondsissued by governments in the Eurozone with aremaining maturity of between one and threeyears.
Fund facts
Yes
Unit class currency EUR
Bloomberg ticker CSBGE3 SW
Net asset value (NAV) 105.28
Countries in %Germany 25.37Italy 23.22France 21.25Spain 11.84Netherlands 6.23Belgium 5.51Austria 3.57Ireland 1.68Finland 1.33
Listing and Trading InformationExchange Listing Date Trading
CurrencyTrading Hours(Local Time)
Bloomberg Ticker Reuters RIC
SIX Swiss Exchange 03.07.2009 EUR 09:00 - 17:30 CSBGE3 SW CSBGE3.SDeutsche Boerse 25.11.2009 EUR 09:00 - 17:30 SXRN GY SXRN.DEBorsa Italiana 16.10.2009 EUR 09:00 - 17:25 CSBGE3 IM CSBGE3.MILondon Stock Exchange 15.09.2010 EUR,
GBx08:00 - 16:30 CBE3 LN,
CE31 LNCBE3.L,CE31.L
Euronext 18.01.2011 EUR CBE3 FP CBE3.PA
Source: Lipper, a Reuters Company
CS
ETF
1) Historical performance indications and financial market scenarios are no guarantee for current or future performance. Performance indications do not consider commissions levied at subscription and/orredemption.
The disclaimer mentioned at the end of this document also applies to this page.
339
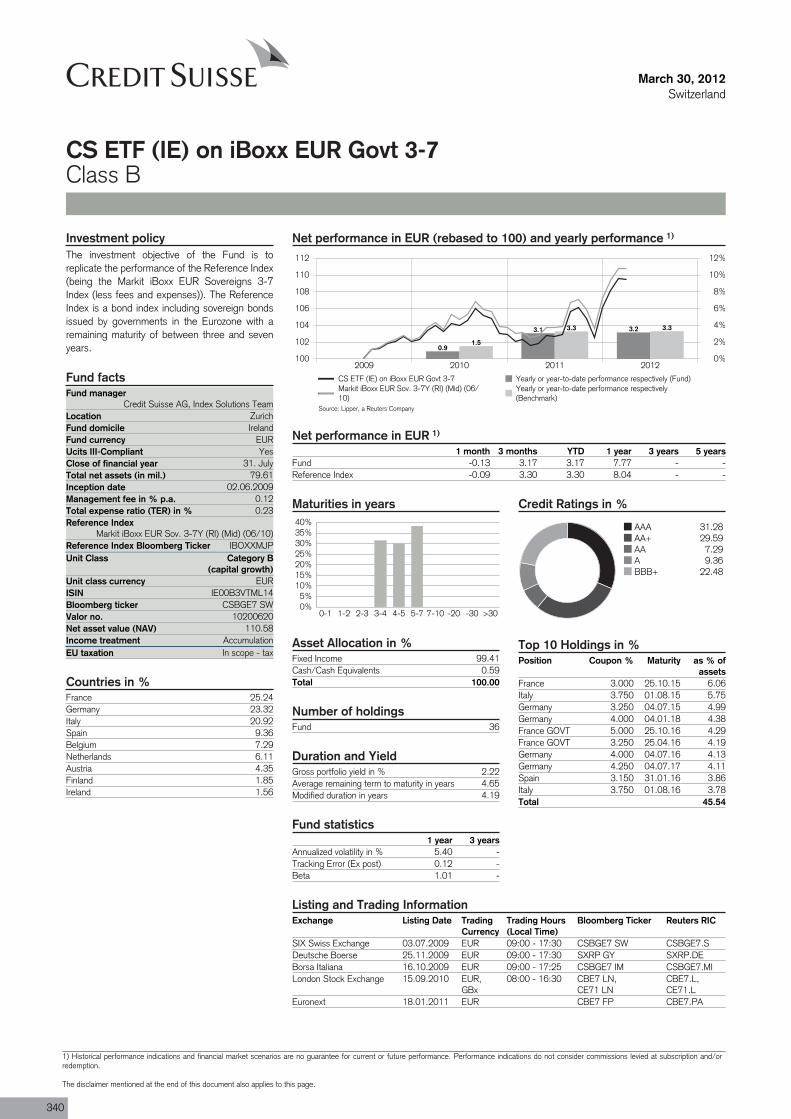
Fund 36
Fund managerCredit Suisse AG, Index Solutions Team
Location ZurichFund domicile IrelandFund currency EURUcits III-CompliantClose of financial year 31. JulyTotal net assets (in mil.) 79.61Inception date 02.06.2009Management fee in % p.a. 0.12Total expense ratio (TER) in % 0.23Reference Index
Markit iBoxx EUR Sov. 3-7Y (RI) (Mid) (06/10)Reference Index Bloomberg Ticker IBOXXMJPUnit Class Category B
(capital growth)
ISIN IE00B3VTML14
Valor no. 10200620
Income treatment AccumulationEU taxation In scope - tax
March 30, 2012Switzerland
CS ETF (IE) on iBoxx EUR Govt 3-7Class B
Net performance in EUR (rebased to 100) and yearly performance 1)
2009 2010 2011 2012100
102
104
106
108
110
112
0%
2%
4%
6%
8%
10%
12%
0.9
3.1 3.2
1.5
3.3 3.3
CS ETF (IE) on iBoxx EUR Govt 3-7 Yearly or year-to-date performance respectively (Fund)Markit iBoxx EUR Sov. 3-7Y (RI) (Mid) (06/10)
Yearly or year-to-date performance respectively(Benchmark)
Net performance in EUR 1)
1 month 3 months YTD 1 year 3 years 5 yearsFund -0.13 3.17 3.17 7.77 - -Reference Index -0.09 3.30 3.30 8.04 - -
Maturities in years
0%5%
10%15%20%25%30%35%40%
0-1 1-2 2-3 3-4 4-5 5-7 7-10 -20 -30 >30
Asset Allocation in %Fixed Income 99.41Cash/Cash Equivalents 0.59Total 100.00
Number of holdings
Duration and YieldGross portfolio yield in % 2.22Average remaining term to maturity in years 4.65Modified duration in years 4.19
Fund statistics1 year 3 years
Annualized volatility in % 5.40 -Tracking Error (Ex post) 0.12 -Beta 1.01 -
Credit Ratings in %
AAA 31.28AA+ 29.59AA 7.29A 9.36BBB+ 22.48
Top 10 Holdings in %Position Coupon % Maturity as % of
assetsFrance 3.000 25.10.15 6.06Italy 3.750 01.08.15 5.75Germany 3.250 04.07.15 4.99Germany 4.000 04.01.18 4.38France GOVT 5.000 25.10.16 4.29France GOVT 3.250 25.04.16 4.19Germany 4.000 04.07.16 4.13Germany 4.250 04.07.17 4.11Spain 3.150 31.01.16 3.86Italy 3.750 01.08.16 3.78Total 45.54
Investment policyThe investment objective of the Fund is toreplicate the performance of the Reference Index(being the Markit iBoxx EUR Sovereigns 3-7Index (less fees and expenses)). The ReferenceIndex is a bond index including sovereign bondsissued by governments in the Eurozone with aremaining maturity of between three and sevenyears.
Fund facts
Yes
Unit class currency EUR
Bloomberg ticker CSBGE7 SW
Net asset value (NAV) 110.58
Countries in %France 25.24Germany 23.32Italy 20.92Spain 9.36Belgium 7.29Netherlands 6.11Austria 4.35Finland 1.85Ireland 1.56
Listing and Trading InformationExchange Listing Date Trading
CurrencyTrading Hours(Local Time)
Bloomberg Ticker Reuters RIC
SIX Swiss Exchange 03.07.2009 EUR 09:00 - 17:30 CSBGE7 SW CSBGE7.SDeutsche Boerse 25.11.2009 EUR 09:00 - 17:30 SXRP GY SXRP.DEBorsa Italiana 16.10.2009 EUR 09:00 - 17:25 CSBGE7 IM CSBGE7.MILondon Stock Exchange 15.09.2010 EUR,
GBx08:00 - 16:30 CBE7 LN,
CE71 LNCBE7.L,CE71.L
Euronext 18.01.2011 EUR CBE7 FP CBE7.PA
Source: Lipper, a Reuters Company
340
1) Historical performance indications and financial market scenarios are no guarantee for current or future performance. Performance indications do not consider commissions levied at subscription and/orredemption.
The disclaimer mentioned at the end of this document also applies to this page.
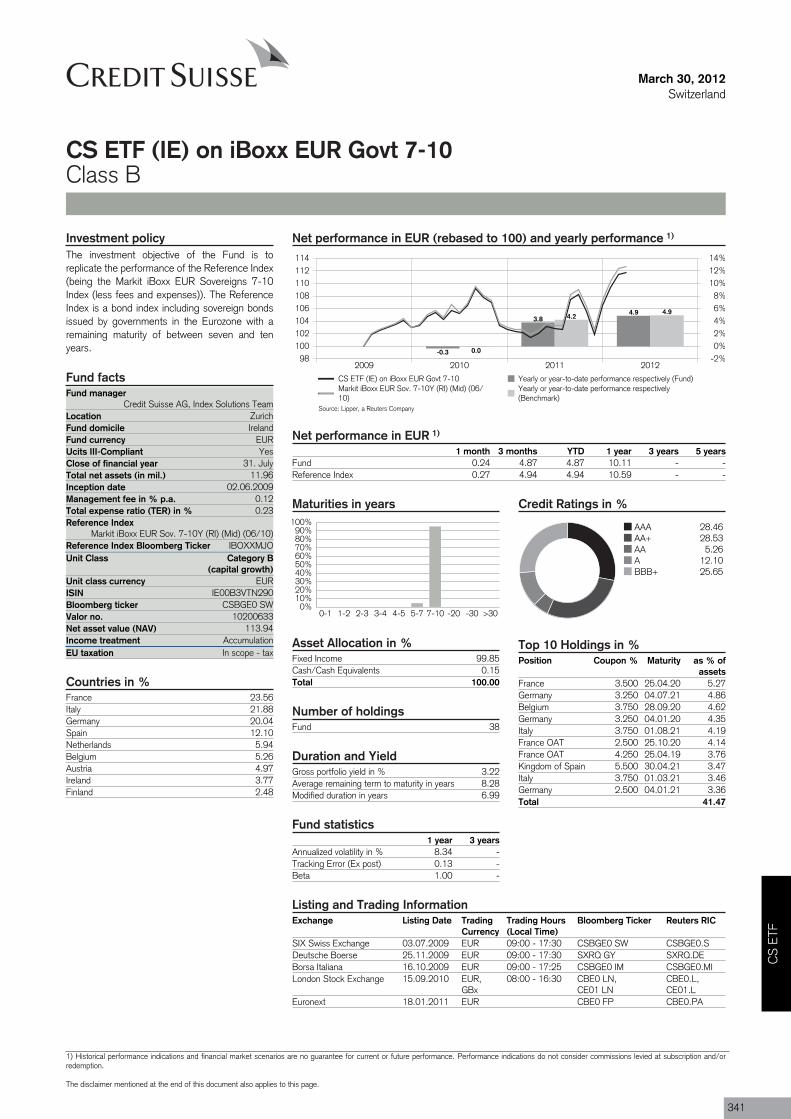
Fund 38
Fund managerCredit Suisse AG, Index Solutions Team
Location ZurichFund domicile IrelandFund currency EURUcits III-CompliantClose of financial year 31. JulyTotal net assets (in mil.) 11.96Inception date 02.06.2009Management fee in % p.a. 0.12Total expense ratio (TER) in % 0.23Reference Index
Markit iBoxx EUR Sov. 7-10Y (RI) (Mid) (06/10)Reference Index Bloomberg Ticker IBOXXMJOUnit Class Category B
(capital growth)
ISIN IE00B3VTN290
Valor no. 10200633
Income treatment AccumulationEU taxation In scope - tax
March 30, 2012Switzerland
CS ETF (IE) on iBoxx EUR Govt 7-10Class B
Net performance in EUR (rebased to 100) and yearly performance 1)
2009 2010 2011 201298
100102104106108110112114
-2%0%2%4%6%8%
10%12%14%
-0.3
3.84.9
0.0
4.24.9
CS ETF (IE) on iBoxx EUR Govt 7-10 Yearly or year-to-date performance respectively (Fund)Markit iBoxx EUR Sov. 7-10Y (RI) (Mid) (06/10)
Yearly or year-to-date performance respectively(Benchmark)
Net performance in EUR 1)
1 month 3 months YTD 1 year 3 years 5 yearsFund 0.24 4.87 4.87 10.11 - -Reference Index 0.27 4.94 4.94 10.59 - -
Maturities in years
0%10%20%30%40%50%60%70%80%90%
100%
0-1 1-2 2-3 3-4 4-5 5-7 7-10 -20 -30 >30
Asset Allocation in %Fixed Income 99.85Cash/Cash Equivalents 0.15Total 100.00
Number of holdings
Duration and YieldGross portfolio yield in % 3.22Average remaining term to maturity in years 8.28Modified duration in years 6.99
Fund statistics1 year 3 years
Annualized volatility in % 8.34 -Tracking Error (Ex post) 0.13 -Beta 1.00 -
Credit Ratings in %
AAA 28.46AA+ 28.53AA 5.26A 12.10BBB+ 25.65
Top 10 Holdings in %Position Coupon % Maturity as % of
assetsFrance 3.500 25.04.20 5.27Germany 3.250 04.07.21 4.86Belgium 3.750 28.09.20 4.62Germany 3.250 04.01.20 4.35Italy 3.750 01.08.21 4.19France OAT 2.500 25.10.20 4.14France OAT 4.250 25.04.19 3.76Kingdom of Spain 5.500 30.04.21 3.47Italy 3.750 01.03.21 3.46Germany 2.500 04.01.21 3.36Total 41.47
Investment policyThe investment objective of the Fund is toreplicate the performance of the Reference Index(being the Markit iBoxx EUR Sovereigns 7-10Index (less fees and expenses)). The ReferenceIndex is a bond index including sovereign bondsissued by governments in the Eurozone with aremaining maturity of between seven and tenyears.
Fund facts
Yes
Unit class currency EUR
Bloomberg ticker CSBGE0 SW
Net asset value (NAV) 113.94
Countries in %France 23.56Italy 21.88Germany 20.04Spain 12.10Netherlands 5.94Belgium 5.26Austria 4.97Ireland 3.77Finland 2.48
Listing and Trading InformationExchange Listing Date Trading
CurrencyTrading Hours(Local Time)
Bloomberg Ticker Reuters RIC
SIX Swiss Exchange 03.07.2009 EUR 09:00 - 17:30 CSBGE0 SW CSBGE0.SDeutsche Boerse 25.11.2009 EUR 09:00 - 17:30 SXRQ GY SXRQ.DEBorsa Italiana 16.10.2009 EUR 09:00 - 17:25 CSBGE0 IM CSBGE0.MILondon Stock Exchange 15.09.2010 EUR,
GBx08:00 - 16:30 CBE0 LN,
CE01 LNCBE0.L,CE01.L
Euronext 18.01.2011 EUR CBE0 FP CBE0.PA
Source: Lipper, a Reuters Company
CS
ETF
1) Historical performance indications and financial market scenarios are no guarantee for current or future performance. Performance indications do not consider commissions levied at subscription and/orredemption.
The disclaimer mentioned at the end of this document also applies to this page.
341
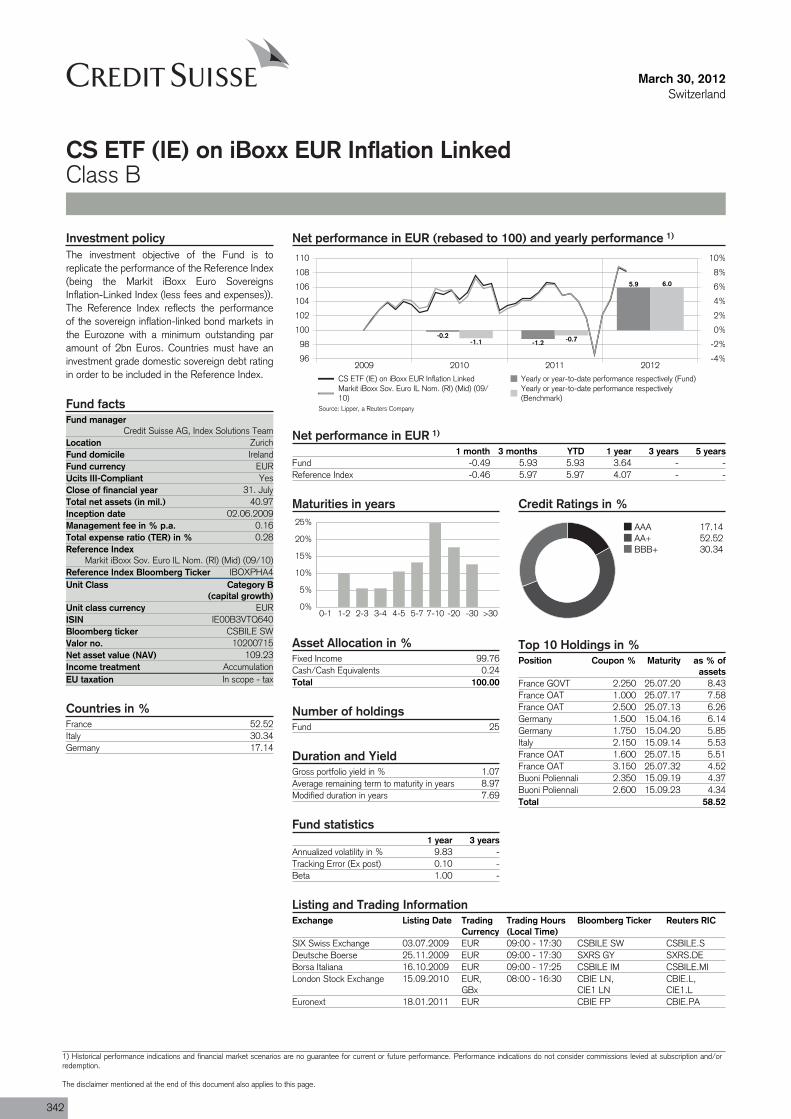
Fund 25
Fund managerCredit Suisse AG, Index Solutions Team
Location ZurichFund domicile IrelandFund currency EURUcits III-CompliantClose of financial year 31. JulyTotal net assets (in mil.) 40.97Inception date 02.06.2009Management fee in % p.a. 0.16Total expense ratio (TER) in % 0.28Reference Index
Markit iBoxx Sov. Euro IL Nom. (RI) (Mid) (09/10)Reference Index Bloomberg Ticker IBOXPHA4Unit Class Category B
(capital growth)
ISIN IE00B3VTQ640
Valor no. 10200715
Income treatment AccumulationEU taxation In scope - tax
March 30, 2012Switzerland
CS ETF (IE) on iBoxx EUR Inflation LinkedClass B
Net performance in EUR (rebased to 100) and yearly performance 1)
2009 2010 2011 201296
98
100
102
104
106
108
110
-4%
-2%
0%
2%
4%
6%
8%
10%
-0.2-1.2
5.9
-1.1 -0.7
6.0
CS ETF (IE) on iBoxx EUR Inflation Linked Yearly or year-to-date performance respectively (Fund)Markit iBoxx Sov. Euro IL Nom. (RI) (Mid) (09/10)
Yearly or year-to-date performance respectively(Benchmark)
Net performance in EUR 1)
1 month 3 months YTD 1 year 3 years 5 yearsFund -0.49 5.93 5.93 3.64 - -Reference Index -0.46 5.97 5.97 4.07 - -
Maturities in years
0%
5%
10%
15%
20%
25%
0-1 1-2 2-3 3-4 4-5 5-7 7-10 -20 -30 >30
Asset Allocation in %Fixed Income 99.76Cash/Cash Equivalents 0.24Total 100.00
Number of holdings
Duration and YieldGross portfolio yield in % 1.07Average remaining term to maturity in years 8.97Modified duration in years 7.69
Fund statistics1 year 3 years
Annualized volatility in % 9.83 -Tracking Error (Ex post) 0.10 -Beta 1.00 -
Credit Ratings in %
AAA 17.14AA+ 52.52BBB+ 30.34
Top 10 Holdings in %Position Coupon % Maturity as % of
assetsFrance GOVT 2.250 25.07.20 8.43France OAT 1.000 25.07.17 7.58France OAT 2.500 25.07.13 6.26Germany 1.500 15.04.16 6.14Germany 1.750 15.04.20 5.85Italy 2.150 15.09.14 5.53France OAT 1.600 25.07.15 5.51France OAT 3.150 25.07.32 4.52Buoni Poliennali 2.350 15.09.19 4.37Buoni Poliennali 2.600 15.09.23 4.34Total 58.52
Investment policyThe investment objective of the Fund is toreplicate the performance of the Reference Index(being the Markit iBoxx Euro SovereignsInflation-Linked Index (less fees and expenses)).The Reference Index reflects the performanceof the sovereign inflation-linked bond markets inthe Eurozone with a minimum outstanding paramount of 2bn Euros. Countries must have aninvestment grade domestic sovereign debt ratingin order to be included in the Reference Index.
Fund facts
Yes
Unit class currency EUR
Bloomberg ticker CSBILE SW
Net asset value (NAV) 109.23
Countries in %France 52.52Italy 30.34Germany 17.14
Listing and Trading InformationExchange Listing Date Trading
CurrencyTrading Hours(Local Time)
Bloomberg Ticker Reuters RIC
SIX Swiss Exchange 03.07.2009 EUR 09:00 - 17:30 CSBILE SW CSBILE.SDeutsche Boerse 25.11.2009 EUR 09:00 - 17:30 SXRS GY SXRS.DEBorsa Italiana 16.10.2009 EUR 09:00 - 17:25 CSBILE IM CSBILE.MILondon Stock Exchange 15.09.2010 EUR,
GBx08:00 - 16:30 CBIE LN,
CIE1 LNCBIE.L,CIE1.L
Euronext 18.01.2011 EUR CBIE FP CBIE.PA
Source: Lipper, a Reuters Company
342
1) Historical performance indications and financial market scenarios are no guarantee for current or future performance. Performance indications do not consider commissions levied at subscription and/orredemption.
The disclaimer mentioned at the end of this document also applies to this page.
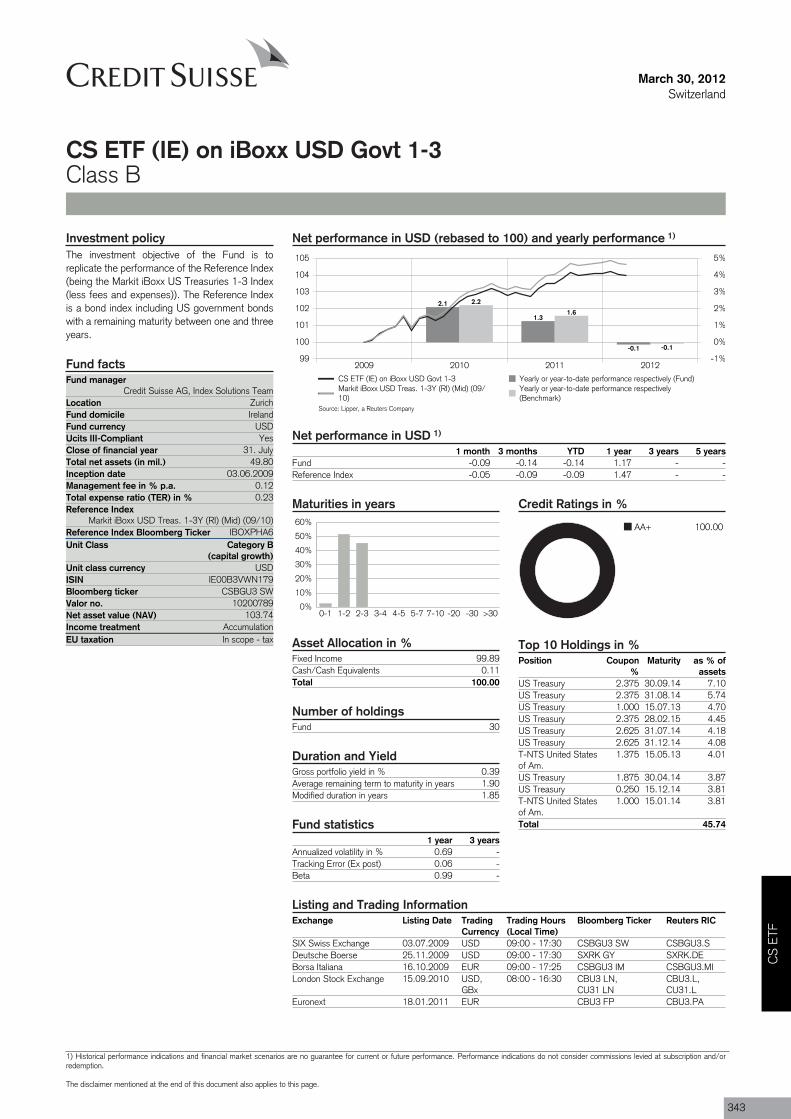
Fund 30
Fund managerCredit Suisse AG, Index Solutions Team
Location ZurichFund domicile IrelandFund currency USDUcits III-CompliantClose of financial year 31. JulyTotal net assets (in mil.) 49.80Inception date 03.06.2009Management fee in % p.a. 0.12Total expense ratio (TER) in % 0.23Reference Index
Markit iBoxx USD Treas. 1-3Y (RI) (Mid) (09/10)Reference Index Bloomberg Ticker IBOXPHA6Unit Class Category B
(capital growth)
ISIN IE00B3VWN179
Valor no. 10200789
Income treatment AccumulationEU taxation In scope - tax
March 30, 2012Switzerland
CS ETF (IE) on iBoxx USD Govt 1-3Class B
Net performance in USD (rebased to 100) and yearly performance 1)
2009 2010 2011 201299
100
101
102
103
104
105
-1%
0%
1%
2%
3%
4%
5%
2.1
1.3
-0.1
2.2
1.6
-0.1
CS ETF (IE) on iBoxx USD Govt 1-3 Yearly or year-to-date performance respectively (Fund)Markit iBoxx USD Treas. 1-3Y (RI) (Mid) (09/10)
Yearly or year-to-date performance respectively(Benchmark)
Net performance in USD 1)
1 month 3 months YTD 1 year 3 years 5 yearsFund -0.09 -0.14 -0.14 1.17 - -Reference Index -0.05 -0.09 -0.09 1.47 - -
Maturities in years
0%
10%
20%
30%
40%
50%
60%
0-1 1-2 2-3 3-4 4-5 5-7 7-10 -20 -30 >30
Asset Allocation in %Fixed Income 99.89Cash/Cash Equivalents 0.11Total 100.00
Number of holdings
Duration and YieldGross portfolio yield in % 0.39Average remaining term to maturity in years 1.90Modified duration in years 1.85
Fund statistics1 year 3 years
Annualized volatility in % 0.69 -Tracking Error (Ex post) 0.06 -Beta 0.99 -
Credit Ratings in %
AA+ 100.00
Top 10 Holdings in %Position Coupon
%Maturity as % of
assetsUS Treasury 2.375 30.09.14 7.10US Treasury 2.375 31.08.14 5.74US Treasury 1.000 15.07.13 4.70US Treasury 2.375 28.02.15 4.45US Treasury 2.625 31.07.14 4.18US Treasury 2.625 31.12.14 4.08T-NTS United Statesof Am.
1.375 15.05.13 4.01
US Treasury 1.875 30.04.14 3.87US Treasury 0.250 15.12.14 3.81T-NTS United Statesof Am.
1.000 15.01.14 3.81
Total 45.74
Investment policyThe investment objective of the Fund is toreplicate the performance of the Reference Index(being the Markit iBoxx US Treasuries 1-3 Index(less fees and expenses)). The Reference Indexis a bond index including US government bondswith a remaining maturity between one and threeyears.
Fund facts
Yes
Unit class currency USD
Bloomberg ticker CSBGU3 SW
Net asset value (NAV) 103.74
Listing and Trading InformationExchange Listing Date Trading
CurrencyTrading Hours(Local Time)
Bloomberg Ticker Reuters RIC
SIX Swiss Exchange 03.07.2009 USD 09:00 - 17:30 CSBGU3 SW CSBGU3.SDeutsche Boerse 25.11.2009 USD 09:00 - 17:30 SXRK GY SXRK.DEBorsa Italiana 16.10.2009 EUR 09:00 - 17:25 CSBGU3 IM CSBGU3.MILondon Stock Exchange 15.09.2010 USD,
GBx08:00 - 16:30 CBU3 LN,
CU31 LNCBU3.L,CU31.L
Euronext 18.01.2011 EUR CBU3 FP CBU3.PA
Source: Lipper, a Reuters Company
CS
ETF
1) Historical performance indications and financial market scenarios are no guarantee for current or future performance. Performance indications do not consider commissions levied at subscription and/orredemption.
The disclaimer mentioned at the end of this document also applies to this page.
343

Fund 30
Fund managerCredit Suisse AG, Index Solutions Team
Location ZurichFund domicile IrelandFund currency USDUcits III-CompliantClose of financial year 31. JulyTotal net assets (in mil.) 135.87Inception date 03.06.2009Management fee in % p.a. 0.12Total expense ratio (TER) in % 0.23Reference Index
Markit iBoxx USD Treas. 3-7Y (RI) (Mid) (09/10)Reference Index Bloomberg Ticker IBOXPHA7Unit Class Category B
(capital growth)
ISIN IE00B3VWN393
Valor no. 10200795
Income treatment AccumulationEU taxation In scope - tax
March 30, 2012Switzerland
CS ETF (IE) on iBoxx USD Govt 3-7Class B
Net performance in USD (rebased to 100) and yearly performance 1)
2009 2010 2011 201295
100
105
110
115
120
-5%
0%
5%
10%
15%
20%
6.18.0
-0.6
6.58.4
-0.5
CS ETF (IE) on iBoxx USD Govt 3-7 Yearly or year-to-date performance respectively (Fund)Markit iBoxx USD Treas. 3-7Y (RI) (Mid) (09/10)
Yearly or year-to-date performance respectively(Benchmark)
Net performance in USD 1)
1 month 3 months YTD 1 year 3 years 5 yearsFund -0.67 -0.55 -0.55 7.44 - -Reference Index -0.62 -0.49 -0.49 7.82 - -
Maturities in years
0%5%
10%15%20%25%30%35%40%45%50%
0-1 1-2 2-3 3-4 4-5 5-7 7-10 -20 -30 >30
Asset Allocation in %Fixed Income 99.98Cash/Cash Equivalents 0.02Total 100.00
Number of holdings
Duration and YieldGross portfolio yield in % 1.09Average remaining term to maturity in years 4.91Modified duration in years 4.52
Fund statistics1 year 3 years
Annualized volatility in % 3.24 -Tracking Error (Ex post) 0.21 -Beta 1.00 -
Credit Ratings in %
AA+ 100.00
Top 10 Holdings in %Position Coupon % Maturity as % of
assetsUS Treasury 1.750 31.07.15 5.58US Treasury 3.250 30.06.16 5.11US Treasury 3.875 15.05.18 5.10US Treasury 3.125 31.10.16 4.87US Treasury 4.125 15.05.15 4.85US Treasury 4.250 15.11.17 4.82US Treasury 3.000 30.09.16 4.80US Treasury 2.250 30.11.17 4.73US Treasury 2.500 30.06.17 4.10US Treasury 4.000 15.08.18 4.10Total 48.06
Investment policyThe investment objective of the Fund is toreplicate the performance of the Reference Index(being the Markit iBoxx US Treasuries 3-7 Index(less fees and expenses)). The Reference Indexis a bond index including US government bondswith a remaining maturity between three andseven years.
Fund facts
Yes
Unit class currency USD
Bloomberg ticker CSBGU7 SW
Net asset value (NAV) 115.13
Listing and Trading InformationExchange Listing Date Trading
CurrencyTrading Hours(Local Time)
Bloomberg Ticker Reuters RIC
SIX Swiss Exchange 03.07.2009 USD 09:00 - 17:30 CSBGU7 SW CSBGU7.SDeutsche Boerse 25.11.2009 USD 09:00 - 17:30 SXRL GY SXRL.DEBorsa Italiana 16.10.2009 EUR 09:00 - 17:25 CSBGU7 IM CSBGU7.MILondon Stock Exchange 15.09.2010 USD,
GBx08:00 - 16:30 CBU7 LN,
CU71 LNCBU7.L,CU71.L
Euronext 18.01.2011 EUR CBU7 FP CBU7.PA
Source: Lipper, a Reuters Company
344
1) Historical performance indications and financial market scenarios are no guarantee for current or future performance. Performance indications do not consider commissions levied at subscription and/orredemption.
The disclaimer mentioned at the end of this document also applies to this page.
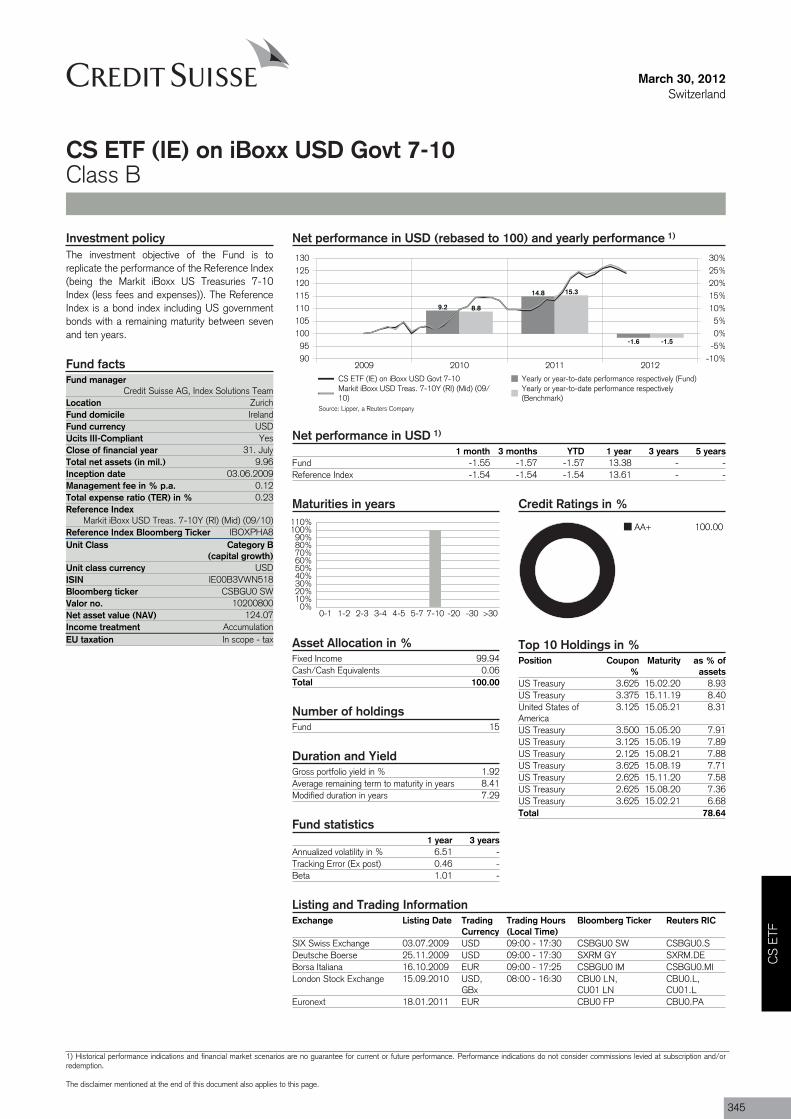
Fund 15
Fund managerCredit Suisse AG, Index Solutions Team
Location ZurichFund domicile IrelandFund currency USDUcits III-CompliantClose of financial year 31. JulyTotal net assets (in mil.) 9.96Inception date 03.06.2009Management fee in % p.a. 0.12Total expense ratio (TER) in % 0.23Reference Index
Markit iBoxx USD Treas. 7-10Y (RI) (Mid) (09/10)Reference Index Bloomberg Ticker IBOXPHA8Unit Class Category B
(capital growth)
ISIN IE00B3VWN518
Valor no. 10200800
Income treatment AccumulationEU taxation In scope - tax
March 30, 2012Switzerland
CS ETF (IE) on iBoxx USD Govt 7-10Class B
Net performance in USD (rebased to 100) and yearly performance 1)
2009 2010 2011 20129095
100105110115120125130
-10%-5%0%5%
10%15%20%25%30%
9.2
14.8
-1.6
8.8
15.3
-1.5
CS ETF (IE) on iBoxx USD Govt 7-10 Yearly or year-to-date performance respectively (Fund)Markit iBoxx USD Treas. 7-10Y (RI) (Mid) (09/10)
Yearly or year-to-date performance respectively(Benchmark)
Net performance in USD 1)
1 month 3 months YTD 1 year 3 years 5 yearsFund -1.55 -1.57 -1.57 13.38 - -Reference Index -1.54 -1.54 -1.54 13.61 - -
Maturities in years
0%10%20%30%40%50%60%70%80%90%
100%110%
0-1 1-2 2-3 3-4 4-5 5-7 7-10 -20 -30 >30
Asset Allocation in %Fixed Income 99.94Cash/Cash Equivalents 0.06Total 100.00
Number of holdings
Duration and YieldGross portfolio yield in % 1.92Average remaining term to maturity in years 8.41Modified duration in years 7.29
Fund statistics1 year 3 years
Annualized volatility in % 6.51 -Tracking Error (Ex post) 0.46 -Beta 1.01 -
Credit Ratings in %
AA+ 100.00
Top 10 Holdings in %Position Coupon
%Maturity as % of
assetsUS Treasury 3.625 15.02.20 8.93US Treasury 3.375 15.11.19 8.40United States ofAmerica
3.125 15.05.21 8.31
US Treasury 3.500 15.05.20 7.91US Treasury 3.125 15.05.19 7.89US Treasury 2.125 15.08.21 7.88US Treasury 3.625 15.08.19 7.71US Treasury 2.625 15.11.20 7.58US Treasury 2.625 15.08.20 7.36US Treasury 3.625 15.02.21 6.68Total 78.64
Investment policyThe investment objective of the Fund is toreplicate the performance of the Reference Index(being the Markit iBoxx US Treasuries 7-10Index (less fees and expenses)). The ReferenceIndex is a bond index including US governmentbonds with a remaining maturity between sevenand ten years.
Fund facts
Yes
Unit class currency USD
Bloomberg ticker CSBGU0 SW
Net asset value (NAV) 124.07
Listing and Trading InformationExchange Listing Date Trading
CurrencyTrading Hours(Local Time)
Bloomberg Ticker Reuters RIC
SIX Swiss Exchange 03.07.2009 USD 09:00 - 17:30 CSBGU0 SW CSBGU0.SDeutsche Boerse 25.11.2009 USD 09:00 - 17:30 SXRM GY SXRM.DEBorsa Italiana 16.10.2009 EUR 09:00 - 17:25 CSBGU0 IM CSBGU0.MILondon Stock Exchange 15.09.2010 USD,
GBx08:00 - 16:30 CBU0 LN,
CU01 LNCBU0.L,CU01.L
Euronext 18.01.2011 EUR CBU0 FP CBU0.PA
Source: Lipper, a Reuters Company
CS
ETF
1) Historical performance indications and financial market scenarios are no guarantee for current or future performance. Performance indications do not consider commissions levied at subscription and/orredemption.
The disclaimer mentioned at the end of this document also applies to this page.
345
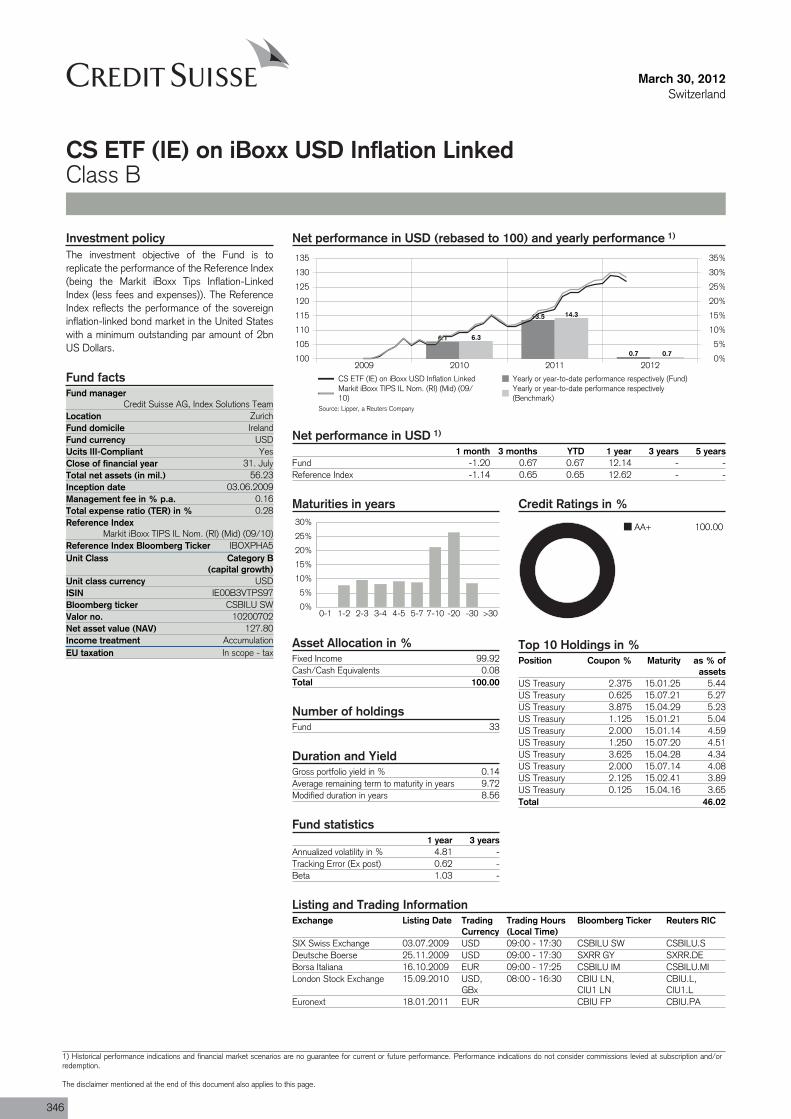
Fund 33
Fund managerCredit Suisse AG, Index Solutions Team
Location ZurichFund domicile IrelandFund currency USDUcits III-CompliantClose of financial year 31. JulyTotal net assets (in mil.) 56.23Inception date 03.06.2009Management fee in % p.a. 0.16Total expense ratio (TER) in % 0.28Reference Index
Markit iBoxx TIPS IL Nom. (RI) (Mid) (09/10)Reference Index Bloomberg Ticker IBOXPHA5Unit Class Category B
(capital growth)
ISIN IE00B3VTPS97
Valor no. 10200702
Income treatment AccumulationEU taxation In scope - tax
March 30, 2012Switzerland
CS ETF (IE) on iBoxx USD Inflation LinkedClass B
Net performance in USD (rebased to 100) and yearly performance 1)
2009 2010 2011 2012100
105
110
115
120
125
130
135
0%
5%
10%
15%
20%
25%
30%
35%
6.1
13.5
0.7
6.3
14.3
0.7
CS ETF (IE) on iBoxx USD Inflation Linked Yearly or year-to-date performance respectively (Fund)Markit iBoxx TIPS IL Nom. (RI) (Mid) (09/10)
Yearly or year-to-date performance respectively(Benchmark)
Net performance in USD 1)
1 month 3 months YTD 1 year 3 years 5 yearsFund -1.20 0.67 0.67 12.14 - -Reference Index -1.14 0.65 0.65 12.62 - -
Maturities in years
0%
5%
10%
15%
20%
25%
30%
0-1 1-2 2-3 3-4 4-5 5-7 7-10 -20 -30 >30
Asset Allocation in %Fixed Income 99.92Cash/Cash Equivalents 0.08Total 100.00
Number of holdings
Duration and YieldGross portfolio yield in % 0.14Average remaining term to maturity in years 9.72Modified duration in years 8.56
Fund statistics1 year 3 years
Annualized volatility in % 4.81 -Tracking Error (Ex post) 0.62 -Beta 1.03 -
Credit Ratings in %
AA+ 100.00
Top 10 Holdings in %Position Coupon % Maturity as % of
assetsUS Treasury 2.375 15.01.25 5.44US Treasury 0.625 15.07.21 5.27US Treasury 3.875 15.04.29 5.23US Treasury 1.125 15.01.21 5.04US Treasury 2.000 15.01.14 4.59US Treasury 1.250 15.07.20 4.51US Treasury 3.625 15.04.28 4.34US Treasury 2.000 15.07.14 4.08US Treasury 2.125 15.02.41 3.89US Treasury 0.125 15.04.16 3.65Total 46.02
Investment policyThe investment objective of the Fund is toreplicate the performance of the Reference Index(being the Markit iBoxx Tips Inflation-LinkedIndex (less fees and expenses)). The ReferenceIndex reflects the performance of the sovereigninflation-linked bond market in the United Stateswith a minimum outstanding par amount of 2bnUS Dollars.
Fund facts
Yes
Unit class currency USD
Bloomberg ticker CSBILU SW
Net asset value (NAV) 127.80
Listing and Trading InformationExchange Listing Date Trading
CurrencyTrading Hours(Local Time)
Bloomberg Ticker Reuters RIC
SIX Swiss Exchange 03.07.2009 USD 09:00 - 17:30 CSBILU SW CSBILU.SDeutsche Boerse 25.11.2009 USD 09:00 - 17:30 SXRR GY SXRR.DEBorsa Italiana 16.10.2009 EUR 09:00 - 17:25 CSBILU IM CSBILU.MILondon Stock Exchange 15.09.2010 USD,
GBx08:00 - 16:30 CBIU LN,
CIU1 LNCBIU.L,CIU1.L
Euronext 18.01.2011 EUR CBIU FP CBIU.PA
Source: Lipper, a Reuters Company
346
1) Historical performance indications and financial market scenarios are no guarantee for current or future performance. Performance indications do not consider commissions levied at subscription and/orredemption.
The disclaimer mentioned at the end of this document also applies to this page.
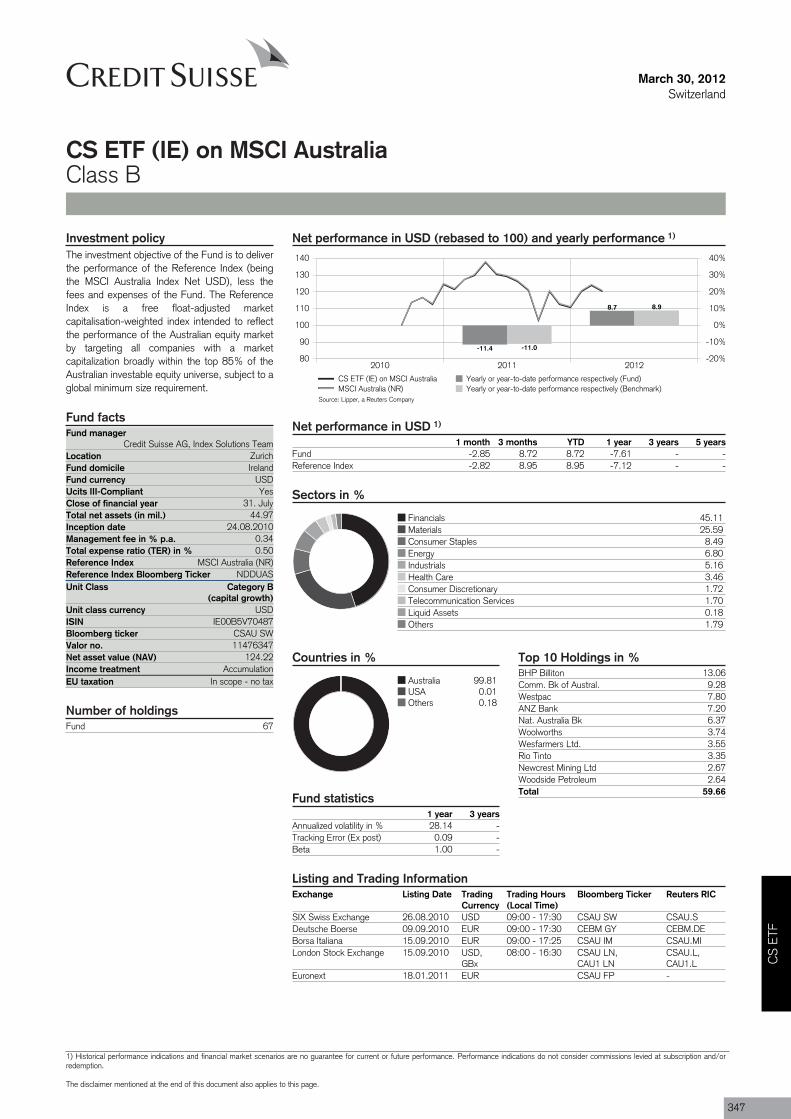
Fund managerCredit Suisse AG, Index Solutions Team
Location ZurichFund domicile IrelandFund currency USDUcits III-CompliantClose of financial year 31. JulyTotal net assets (in mil.) 44.97Inception date 24.08.2010Management fee in % p.a. 0.34Total expense ratio (TER) in % 0.50Reference Index MSCI Australia (NR)Reference Index Bloomberg Ticker NDDUASUnit Class Category B
(capital growth)
ISIN IE00B5V70487
Valor no. 11476347
Income treatment AccumulationEU taxation In scope - no tax
Fund 67
March 30, 2012Switzerland
CS ETF (IE) on MSCI AustraliaClass B
Net performance in USD (rebased to 100) and yearly performance 1)
2010 2011 201280
90
100
110
120
130
140
-20%
-10%
0%
10%
20%
30%
40%
-11.4
8.7
-11.0
8.9
CS ETF (IE) on MSCI Australia Yearly or year-to-date performance respectively (Fund)MSCI Australia (NR) Yearly or year-to-date performance respectively (Benchmark)
Net performance in USD 1)
1 month 3 months YTD 1 year 3 years 5 yearsFund -2.85 8.72 8.72 -7.61 - -Reference Index -2.82 8.95 8.95 -7.12 - -
Sectors in %
Financials 45.11Materials 25.59Consumer Staples 8.49Energy 6.80Industrials 5.16Health Care 3.46Consumer Discretionary 1.72Telecommunication Services 1.70Liquid Assets 0.18Others 1.79
Countries in %
Australia 99.81USA 0.01Others 0.18
Investment policyThe investment objective of the Fund is to deliverthe performance of the Reference Index (beingthe MSCI Australia Index Net USD), less thefees and expenses of the Fund. The ReferenceIndex is a free float-adjusted marketcapitalisation-weighted index intended to reflectthe performance of the Australian equity marketby targeting all companies with a marketcapitalization broadly within the top 85% of theAustralian investable equity universe, subject to aglobal minimum size requirement.
Fund facts
Yes
Unit class currency USD
Bloomberg ticker CSAU SW
Net asset value (NAV) 124.22
Number of holdings
Fund statistics1 year 3 years
Annualized volatility in % 28.14 -Tracking Error (Ex post) 0.09 -Beta 1.00 -
Top 10 Holdings in %BHP Billiton 13.06Comm. Bk of Austral. 9.28Westpac 7.80ANZ Bank 7.20Nat. Australia Bk 6.37Woolworths 3.74Wesfarmers Ltd. 3.55Rio Tinto 3.35Newcrest Mining Ltd 2.67Woodside Petroleum 2.64Total 59.66
Listing and Trading InformationExchange Listing Date Trading
CurrencyTrading Hours(Local Time)
Bloomberg Ticker Reuters RIC
SIX Swiss Exchange 26.08.2010 USD 09:00 - 17:30 CSAU SW CSAU.SDeutsche Boerse 09.09.2010 EUR 09:00 - 17:30 CEBM GY CEBM.DEBorsa Italiana 15.09.2010 EUR 09:00 - 17:25 CSAU IM CSAU.MILondon Stock Exchange 15.09.2010 USD,
GBx08:00 - 16:30 CSAU LN,
CAU1 LNCSAU.L,CAU1.L
Euronext 18.01.2011 EUR CSAU FP -
Source: Lipper, a Reuters Company
CS
ETF
1) Historical performance indications and financial market scenarios are no guarantee for current or future performance. Performance indications do not consider commissions levied at subscription and/orredemption.
The disclaimer mentioned at the end of this document also applies to this page.
347
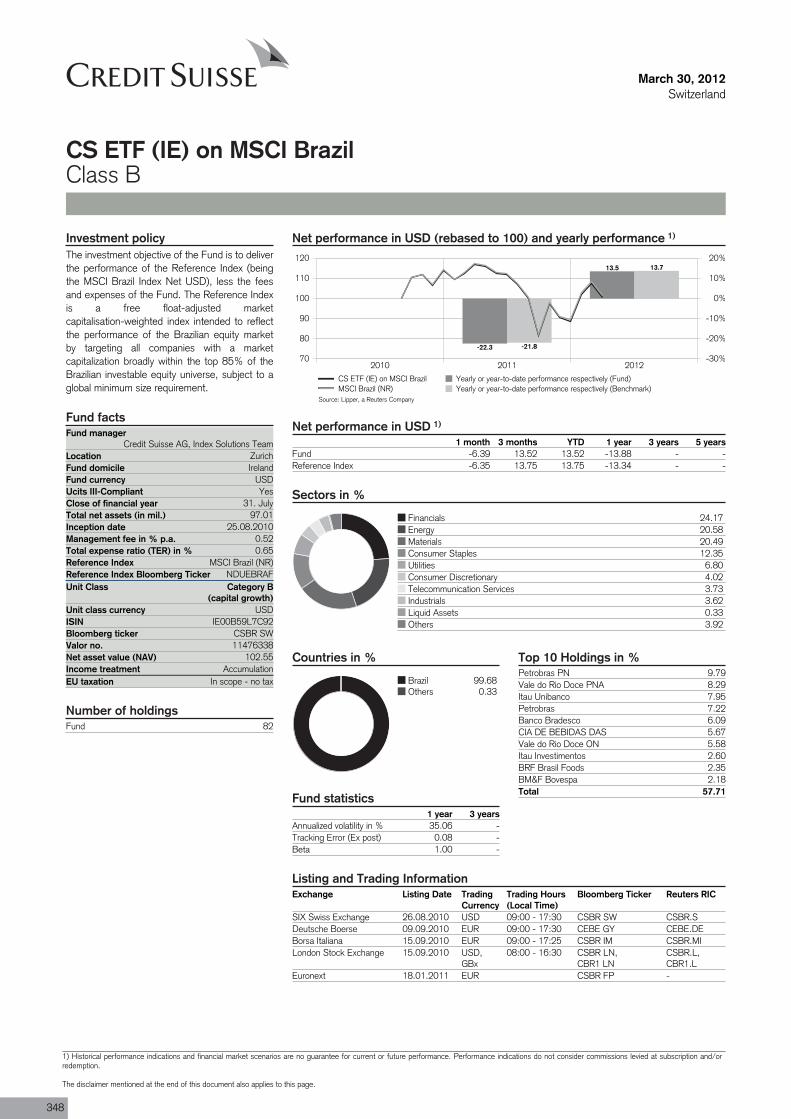
Fund managerCredit Suisse AG, Index Solutions Team
Location ZurichFund domicile IrelandFund currency USDUcits III-CompliantClose of financial year 31. JulyTotal net assets (in mil.) 97.01Inception date 25.08.2010Management fee in % p.a. 0.52Total expense ratio (TER) in % 0.65Reference Index MSCI Brazil (NR)Reference Index Bloomberg Ticker NDUEBRAFUnit Class Category B
(capital growth)
ISIN IE00B59L7C92
Valor no. 11476338
Income treatment AccumulationEU taxation In scope - no tax
Fund 82
March 30, 2012Switzerland
CS ETF (IE) on MSCI BrazilClass B
Net performance in USD (rebased to 100) and yearly performance 1)
2010 2011 201270
80
90
100
110
120
-30%
-20%
-10%
0%
10%
20%
-22.3
13.5
-21.8
13.7
CS ETF (IE) on MSCI Brazil Yearly or year-to-date performance respectively (Fund)MSCI Brazil (NR) Yearly or year-to-date performance respectively (Benchmark)
Net performance in USD 1)
1 month 3 months YTD 1 year 3 years 5 yearsFund -6.39 13.52 13.52 -13.88 - -Reference Index -6.35 13.75 13.75 -13.34 - -
Sectors in %
Financials 24.17Energy 20.58Materials 20.49Consumer Staples 12.35Utilities 6.80Consumer Discretionary 4.02Telecommunication Services 3.73Industrials 3.62Liquid Assets 0.33Others 3.92
Countries in %
Brazil 99.68Others 0.33
Investment policyThe investment objective of the Fund is to deliverthe performance of the Reference Index (beingthe MSCI Brazil Index Net USD), less the feesand expenses of the Fund. The Reference Indexis a free float-adjusted marketcapitalisation-weighted index intended to reflectthe performance of the Brazilian equity marketby targeting all companies with a marketcapitalization broadly within the top 85% of theBrazilian investable equity universe, subject to aglobal minimum size requirement.
Fund facts
Yes
Unit class currency USD
Bloomberg ticker CSBR SW
Net asset value (NAV) 102.55
Number of holdings
Fund statistics1 year 3 years
Annualized volatility in % 35.06 -Tracking Error (Ex post) 0.08 -Beta 1.00 -
Top 10 Holdings in %Petrobras PN 9.79Vale do Rio Doce PNA 8.29Itau Unibanco 7.95Petrobras 7.22Banco Bradesco 6.09CIA DE BEBIDAS DAS 5.67Vale do Rio Doce ON 5.58Itau Investimentos 2.60BRF Brasil Foods 2.35BM&F Bovespa 2.18Total 57.71
Listing and Trading InformationExchange Listing Date Trading
CurrencyTrading Hours(Local Time)
Bloomberg Ticker Reuters RIC
SIX Swiss Exchange 26.08.2010 USD 09:00 - 17:30 CSBR SW CSBR.SDeutsche Boerse 09.09.2010 EUR 09:00 - 17:30 CEBE GY CEBE.DEBorsa Italiana 15.09.2010 EUR 09:00 - 17:25 CSBR IM CSBR.MILondon Stock Exchange 15.09.2010 USD,
GBx08:00 - 16:30 CSBR LN,
CBR1 LNCSBR.L,CBR1.L
Euronext 18.01.2011 EUR CSBR FP -
Source: Lipper, a Reuters Company
348
1) Historical performance indications and financial market scenarios are no guarantee for current or future performance. Performance indications do not consider commissions levied at subscription and/orredemption.
The disclaimer mentioned at the end of this document also applies to this page.
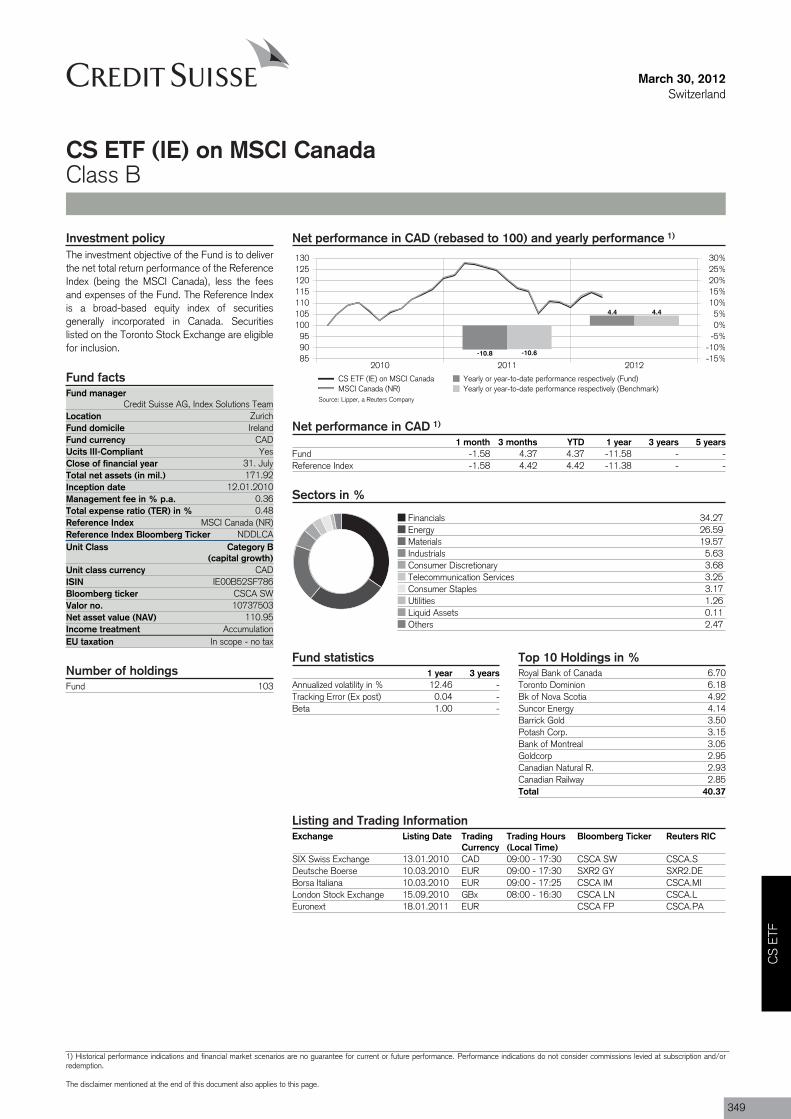
Fund managerCredit Suisse AG, Index Solutions Team
Location ZurichFund domicile IrelandFund currency CADUcits III-CompliantClose of financial year 31. JulyTotal net assets (in mil.) 171.92Inception date 12.01.2010Management fee in % p.a. 0.36Total expense ratio (TER) in % 0.48Reference Index MSCI Canada (NR)Reference Index Bloomberg Ticker NDDLCAUnit Class Category B
(capital growth)
ISIN IE00B52SF786
Valor no. 10737503
Income treatment AccumulationEU taxation In scope - no tax
Fund 103
March 30, 2012Switzerland
CS ETF (IE) on MSCI CanadaClass B
Net performance in CAD (rebased to 100) and yearly performance 1)
2010 2011 2012859095
100105110115120125130
-15%-10%-5%0%5%
10%15%20%25%30%
-10.8
4.4
-10.6
4.4
CS ETF (IE) on MSCI Canada Yearly or year-to-date performance respectively (Fund)MSCI Canada (NR) Yearly or year-to-date performance respectively (Benchmark)
Net performance in CAD 1)
1 month 3 months YTD 1 year 3 years 5 yearsFund -1.58 4.37 4.37 -11.58 - -Reference Index -1.58 4.42 4.42 -11.38 - -
Sectors in %
Financials 34.27Energy 26.59Materials 19.57Industrials 5.63Consumer Discretionary 3.68Telecommunication Services 3.25Consumer Staples 3.17Utilities 1.26Liquid Assets 0.11Others 2.47
Investment policyThe investment objective of the Fund is to deliverthe net total return performance of the ReferenceIndex (being the MSCI Canada), less the feesand expenses of the Fund. The Reference Indexis a broad-based equity index of securitiesgenerally incorporated in Canada. Securitieslisted on the Toronto Stock Exchange are eligiblefor inclusion.
Fund facts
Yes
Unit class currency CAD
Bloomberg ticker CSCA SW
Net asset value (NAV) 110.95
Number of holdingsFund statistics
1 year 3 yearsAnnualized volatility in % 12.46 -Tracking Error (Ex post) 0.04 -Beta 1.00 -
Top 10 Holdings in %Royal Bank of Canada 6.70Toronto Dominion 6.18Bk of Nova Scotia 4.92Suncor Energy 4.14Barrick Gold 3.50Potash Corp. 3.15Bank of Montreal 3.05Goldcorp 2.95Canadian Natural R. 2.93Canadian Railway 2.85Total 40.37
Listing and Trading InformationExchange Listing Date Trading
CurrencyTrading Hours(Local Time)
Bloomberg Ticker Reuters RIC
SIX Swiss Exchange 13.01.2010 CAD 09:00 - 17:30 CSCA SW CSCA.SDeutsche Boerse 10.03.2010 EUR 09:00 - 17:30 SXR2 GY SXR2.DEBorsa Italiana 10.03.2010 EUR 09:00 - 17:25 CSCA IM CSCA.MILondon Stock Exchange 15.09.2010 GBx 08:00 - 16:30 CSCA LN CSCA.LEuronext 18.01.2011 EUR CSCA FP CSCA.PA
Source: Lipper, a Reuters Company
CS
ETF
1) Historical performance indications and financial market scenarios are no guarantee for current or future performance. Performance indications do not consider commissions levied at subscription and/orredemption.
The disclaimer mentioned at the end of this document also applies to this page.
349
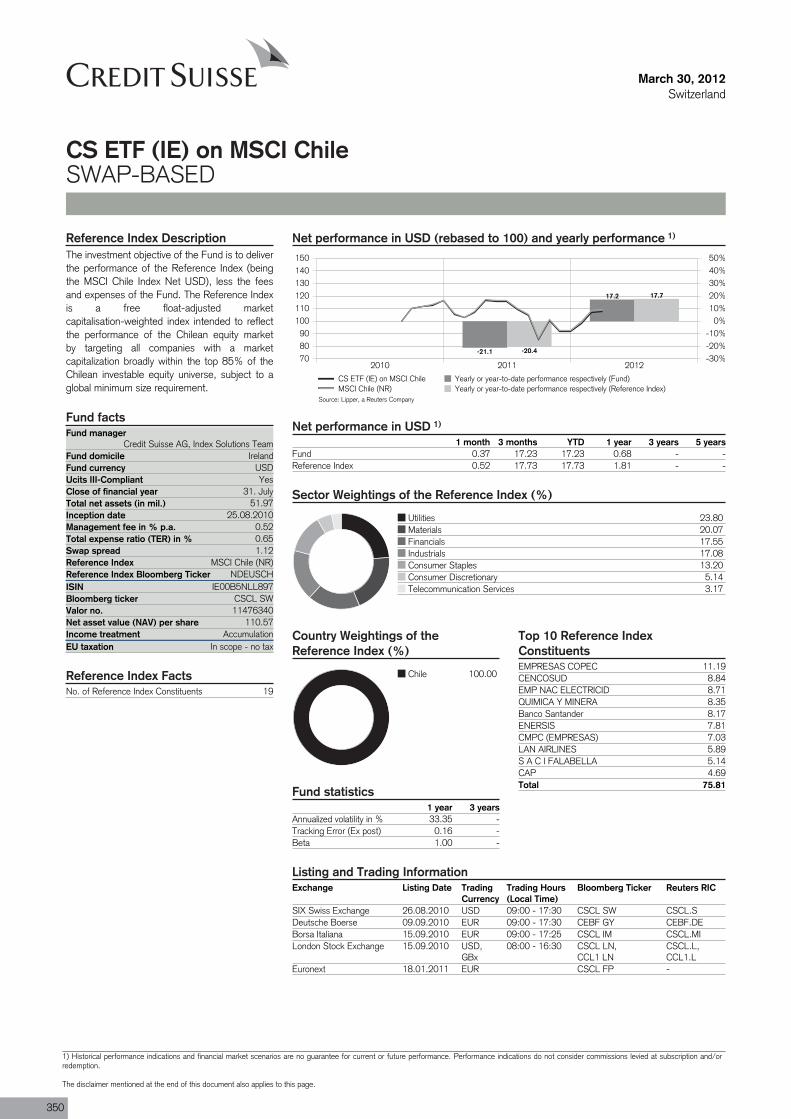
Fund managerCredit Suisse AG, Index Solutions Team
Fund domicile IrelandFund currency USDUcits III-CompliantClose of financial year 31. JulyTotal net assets (in mil.) 51.97Inception date 25.08.2010Management fee in % p.a. 0.52Total expense ratio (TER) in % 0.65Swap spread 1.12Reference Index MSCI Chile (NR)Reference Index Bloomberg Ticker NDEUSCHISIN IE00B5NLL897
Valor no. 11476340
Income treatment AccumulationEU taxation In scope - no tax
No. of Reference Index Constituents 19
March 30, 2012Switzerland
CS ETF (IE) on MSCI ChileSWAP-BASED
Net performance in USD (rebased to 100) and yearly performance 1)
2010 2011 2012708090
100110120130140150
-30%-20%-10%
0%10%20%30%40%50%
-21.1
17.2
-20.4
17.7
CS ETF (IE) on MSCI Chile Yearly or year-to-date performance respectively (Fund)MSCI Chile (NR) Yearly or year-to-date performance respectively (Reference Index)
Net performance in USD 1)
1 month 3 months YTD 1 year 3 years 5 yearsFund 0.37 17.23 17.23 0.68 - -Reference Index 0.52 17.73 17.73 1.81 - -
Sector Weightings of the Reference Index (%)
Utilities 23.80Materials 20.07Financials 17.55Industrials 17.08Consumer Staples 13.20Consumer Discretionary 5.14Telecommunication Services 3.17
Country Weightings of theReference Index (%)
Chile 100.00
Reference Index DescriptionThe investment objective of the Fund is to deliverthe performance of the Reference Index (beingthe MSCI Chile Index Net USD), less the feesand expenses of the Fund. The Reference Indexis a free float-adjusted marketcapitalisation-weighted index intended to reflectthe performance of the Chilean equity marketby targeting all companies with a marketcapitalization broadly within the top 85% of theChilean investable equity universe, subject to aglobal minimum size requirement.
Fund facts
Yes
Bloomberg ticker CSCL SW
Net asset value (NAV) per share 110.57
Reference Index Facts
Fund statistics1 year 3 years
Annualized volatility in % 33.35 -Tracking Error (Ex post) 0.16 -Beta 1.00 -
Top 10 Reference IndexConstituentsEMPRESAS COPEC 11.19CENCOSUD 8.84EMP NAC ELECTRICID 8.71QUIMICA Y MINERA 8.35Banco Santander 8.17ENERSIS 7.81CMPC (EMPRESAS) 7.03LAN AIRLINES 5.89S A C I FALABELLA 5.14CAP 4.69Total 75.81
Listing and Trading InformationExchange Listing Date Trading
CurrencyTrading Hours(Local Time)
Bloomberg Ticker Reuters RIC
SIX Swiss Exchange 26.08.2010 USD 09:00 - 17:30 CSCL SW CSCL.SDeutsche Boerse 09.09.2010 EUR 09:00 - 17:30 CEBF GY CEBF.DEBorsa Italiana 15.09.2010 EUR 09:00 - 17:25 CSCL IM CSCL.MILondon Stock Exchange 15.09.2010 USD,
GBx08:00 - 16:30 CSCL LN,
CCL1 LNCSCL.L,CCL1.L
Euronext 18.01.2011 EUR CSCL FP -
Source: Lipper, a Reuters Company
350
1) Historical performance indications and financial market scenarios are no guarantee for current or future performance. Performance indications do not consider commissions levied at subscription and/orredemption.
The disclaimer mentioned at the end of this document also applies to this page.
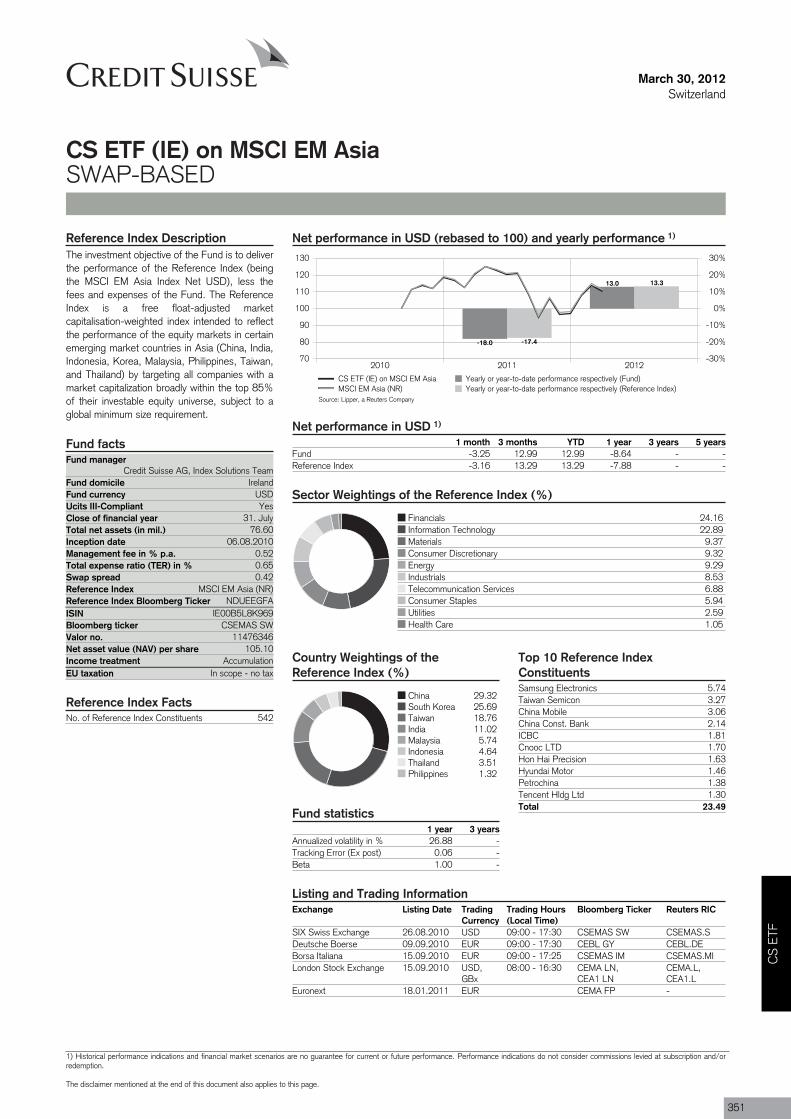
Fund managerCredit Suisse AG, Index Solutions Team
Fund domicile IrelandFund currency USDUcits III-CompliantClose of financial year 31. JulyTotal net assets (in mil.) 76.60Inception date 06.08.2010Management fee in % p.a. 0.52Total expense ratio (TER) in % 0.65Swap spread 0.42Reference Index MSCI EM Asia (NR)Reference Index Bloomberg Ticker NDUEEGFAISIN IE00B5L8K969
Valor no. 11476346
Income treatment AccumulationEU taxation In scope - no tax
No. of Reference Index Constituents 542
March 30, 2012Switzerland
CS ETF (IE) on MSCI EM AsiaSWAP-BASED
Net performance in USD (rebased to 100) and yearly performance 1)
2010 2011 201270
80
90
100
110
120
130
-30%
-20%
-10%
0%
10%
20%
30%
-18.0
13.0
-17.4
13.3
CS ETF (IE) on MSCI EM Asia Yearly or year-to-date performance respectively (Fund)MSCI EM Asia (NR) Yearly or year-to-date performance respectively (Reference Index)
Net performance in USD 1)
1 month 3 months YTD 1 year 3 years 5 yearsFund -3.25 12.99 12.99 -8.64 - -Reference Index -3.16 13.29 13.29 -7.88 - -
Sector Weightings of the Reference Index (%)
Financials 24.16Information Technology 22.89Materials 9.37Consumer Discretionary 9.32Energy 9.29Industrials 8.53Telecommunication Services 6.88Consumer Staples 5.94Utilities 2.59Health Care 1.05
Country Weightings of theReference Index (%)
China 29.32South Korea 25.69Taiwan 18.76India 11.02Malaysia 5.74Indonesia 4.64Thailand 3.51Philippines 1.32
Reference Index DescriptionThe investment objective of the Fund is to deliverthe performance of the Reference Index (beingthe MSCI EM Asia Index Net USD), less thefees and expenses of the Fund. The ReferenceIndex is a free float-adjusted marketcapitalisation-weighted index intended to reflectthe performance of the equity markets in certainemerging market countries in Asia (China, India,Indonesia, Korea, Malaysia, Philippines, Taiwan,and Thailand) by targeting all companies with amarket capitalization broadly within the top 85%of their investable equity universe, subject to aglobal minimum size requirement.
Fund facts
Yes
Bloomberg ticker CSEMAS SW
Net asset value (NAV) per share 105.10
Reference Index Facts
Fund statistics1 year 3 years
Annualized volatility in % 26.88 -Tracking Error (Ex post) 0.06 -Beta 1.00 -
Top 10 Reference IndexConstituentsSamsung Electronics 5.74Taiwan Semicon 3.27China Mobile 3.06China Const. Bank 2.14ICBC 1.81Cnooc LTD 1.70Hon Hai Precision 1.63Hyundai Motor 1.46Petrochina 1.38Tencent Hldg Ltd 1.30Total 23.49
Listing and Trading InformationExchange Listing Date Trading
CurrencyTrading Hours(Local Time)
Bloomberg Ticker Reuters RIC
SIX Swiss Exchange 26.08.2010 USD 09:00 - 17:30 CSEMAS SW CSEMAS.SDeutsche Boerse 09.09.2010 EUR 09:00 - 17:30 CEBL GY CEBL.DEBorsa Italiana 15.09.2010 EUR 09:00 - 17:25 CSEMAS IM CSEMAS.MILondon Stock Exchange 15.09.2010 USD,
GBx08:00 - 16:30 CEMA LN,
CEA1 LNCEMA.L,CEA1.L
Euronext 18.01.2011 EUR CEMA FP -
Source: Lipper, a Reuters Company
CS
ETF
1) Historical performance indications and financial market scenarios are no guarantee for current or future performance. Performance indications do not consider commissions levied at subscription and/orredemption.
The disclaimer mentioned at the end of this document also applies to this page.
351
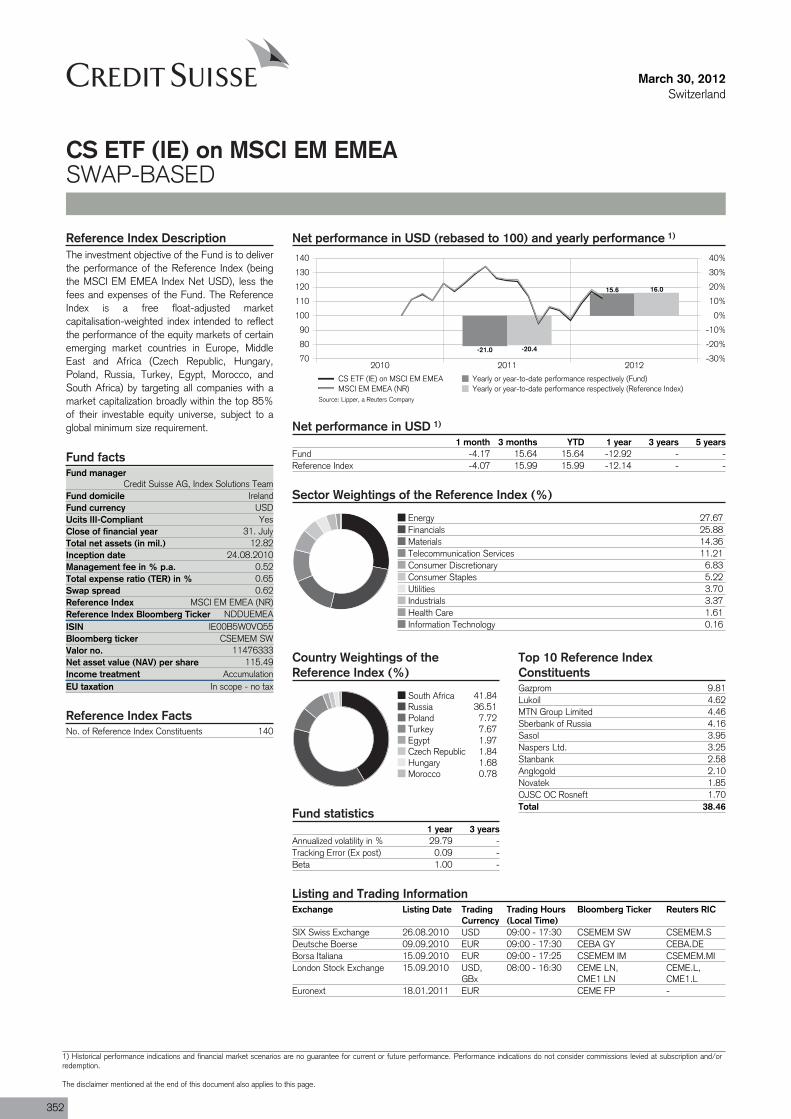
Fund managerCredit Suisse AG, Index Solutions Team
Fund domicile IrelandFund currency USDUcits III-CompliantClose of financial year 31. JulyTotal net assets (in mil.) 12.82Inception date 24.08.2010Management fee in % p.a. 0.52Total expense ratio (TER) in % 0.65Swap spread 0.62Reference Index MSCI EM EMEA (NR)Reference Index Bloomberg Ticker NDDUEMEAISIN IE00B5W0VQ55
Valor no. 11476333
Income treatment AccumulationEU taxation In scope - no tax
No. of Reference Index Constituents 140
March 30, 2012Switzerland
CS ETF (IE) on MSCI EM EMEASWAP-BASED
Net performance in USD (rebased to 100) and yearly performance 1)
2010 2011 201270
80
90
100
110
120
130
140
-30%
-20%
-10%
0%
10%
20%
30%
40%
-21.0
15.6
-20.4
16.0
CS ETF (IE) on MSCI EM EMEA Yearly or year-to-date performance respectively (Fund)MSCI EM EMEA (NR) Yearly or year-to-date performance respectively (Reference Index)
Net performance in USD 1)
1 month 3 months YTD 1 year 3 years 5 yearsFund -4.17 15.64 15.64 -12.92 - -Reference Index -4.07 15.99 15.99 -12.14 - -
Sector Weightings of the Reference Index (%)
Energy 27.67Financials 25.88Materials 14.36Telecommunication Services 11.21Consumer Discretionary 6.83Consumer Staples 5.22Utilities 3.70Industrials 3.37Health Care 1.61Information Technology 0.16
Country Weightings of theReference Index (%)
South Africa 41.84Russia 36.51Poland 7.72Turkey 7.67Egypt 1.97Czech Republic 1.84Hungary 1.68Morocco 0.78
Reference Index DescriptionThe investment objective of the Fund is to deliverthe performance of the Reference Index (beingthe MSCI EM EMEA Index Net USD), less thefees and expenses of the Fund. The ReferenceIndex is a free float-adjusted marketcapitalisation-weighted index intended to reflectthe performance of the equity markets of certainemerging market countries in Europe, MiddleEast and Africa (Czech Republic, Hungary,Poland, Russia, Turkey, Egypt, Morocco, andSouth Africa) by targeting all companies with amarket capitalization broadly within the top 85%of their investable equity universe, subject to aglobal minimum size requirement.
Fund facts
Yes
Bloomberg ticker CSEMEM SW
Net asset value (NAV) per share 115.49
Reference Index Facts
Fund statistics1 year 3 years
Annualized volatility in % 29.79 -Tracking Error (Ex post) 0.09 -Beta 1.00 -
Top 10 Reference IndexConstituentsGazprom 9.81Lukoil 4.62MTN Group Limited 4.46Sberbank of Russia 4.16Sasol 3.95Naspers Ltd. 3.25Stanbank 2.58Anglogold 2.10Novatek 1.85OJSC OC Rosneft 1.70Total 38.46
Listing and Trading InformationExchange Listing Date Trading
CurrencyTrading Hours(Local Time)
Bloomberg Ticker Reuters RIC
SIX Swiss Exchange 26.08.2010 USD 09:00 - 17:30 CSEMEM SW CSEMEM.SDeutsche Boerse 09.09.2010 EUR 09:00 - 17:30 CEBA GY CEBA.DEBorsa Italiana 15.09.2010 EUR 09:00 - 17:25 CSEMEM IM CSEMEM.MILondon Stock Exchange 15.09.2010 USD,
GBx08:00 - 16:30 CEME LN,
CME1 LNCEME.L,CME1.L
Euronext 18.01.2011 EUR CEME FP -
Source: Lipper, a Reuters Company
352
1) Historical performance indications and financial market scenarios are no guarantee for current or future performance. Performance indications do not consider commissions levied at subscription and/orredemption.
The disclaimer mentioned at the end of this document also applies to this page.

Fund managerCredit Suisse AG, Index Solutions Team
Fund domicile IrelandFund currency USDUcits III-CompliantClose of financial year 31. JulyTotal net assets (in mil.) 22.53Inception date 25.08.2010Management fee in % p.a. 0.52Total expense ratio (TER) in % 0.65Swap spread 0.58Reference Index MSCI EM Latin America (NR)Reference Index Bloomberg Ticker NDUEEGFLISIN IE00B5KMFT47
Valor no. 11476337
Income treatment AccumulationEU taxation In scope - no tax
No. of Reference Index Constituents 137
March 30, 2012Switzerland
CS ETF (IE) on MSCI EM Latin AmericaSWAP-BASED
Net performance in USD (rebased to 100) and yearly performance 1)
2010 2011 201270
80
90
100
110
120
-30%
-20%
-10%
0%
10%
20%
-20.0
14.3
-19.4
14.6
CS ETF (IE) on MSCI EM Latin America Yearly or year-to-date performance respectively (Fund)MSCI EM Latin America (NR) Yearly or year-to-date performance respectively (Reference Index)
Net performance in USD 1)
1 month 3 months YTD 1 year 3 years 5 yearsFund -3.29 14.31 14.31 -9.17 - -Reference Index -3.22 14.60 14.60 -8.39 - -
Sector Weightings of the Reference Index (%)
Financials 21.22Materials 20.89Consumer Staples 15.52Energy 14.97Telecommunication Services 8.42Utilities 6.54Consumer Discretionary 5.33Industrials 4.59Information Technology 1.98Health Care 0.54
Country Weightings of theReference Index (%)
Brazil 64.04Mexico 20.50Chile 7.94Colombia 4.69Peru 2.83
Reference Index DescriptionThe investment objective of the Fund is to deliverthe performance of the Reference Index (beingthe MSCI EM Latin America Index Net USD),less the fees and expenses of the Fund. TheReference Index is a free float-adjusted marketcapitalisation-weighted index intended to reflectthe performance of the equity markets of certainemerging market countries in Latin America(Brazil, Chile, Colombia, Mexico, and Peru) bytargeting all companies with a marketcapitalization broadly within the top 85% of theirinvestable equity universe, subject to a globalminimum size requirement.
Fund facts
Yes
Bloomberg ticker CSEMLA SW
Net asset value (NAV) per share 108.83
Reference Index Facts
Fund statistics1 year 3 years
Annualized volatility in % 31.14 -Tracking Error (Ex post) 0.08 -Beta 1.00 -
Top 10 Reference IndexConstituentsPetrobras PN 6.29America Movil 5.77Vale do Rio Doce PNA 5.33Itau Unibanco 5.11Petrobras 4.64Banco Bradesco 3.91CIA DE BEBIDAS DAS 3.64Vale do Rio Doce ON 3.58Wal-Mart de Mexico 2.44Fomento Eco Mexicano 1.87Total 42.59
Listing and Trading InformationExchange Listing Date Trading
CurrencyTrading Hours(Local Time)
Bloomberg Ticker Reuters RIC
SIX Swiss Exchange 26.08.2010 USD 09:00 - 17:30 CSEMLA SW CSEMLA.SDeutsche Boerse 09.09.2010 EUR 09:00 - 17:30 CEBD GY CEBD.DEBorsa Italiana 15.09.2010 EUR 09:00 - 17:25 CSEMLA IM CSEMLA.MILondon Stock Exchange 15.09.2010 USD,
GBx08:00 - 16:30 CEML LN,
CML1 LNCEML.L,CML1.L
Euronext 18.01.2011 EUR CEML FP -
Source: Lipper, a Reuters Company
CS
ETF
1) Historical performance indications and financial market scenarios are no guarantee for current or future performance. Performance indications do not consider commissions levied at subscription and/orredemption.
The disclaimer mentioned at the end of this document also applies to this page.
353
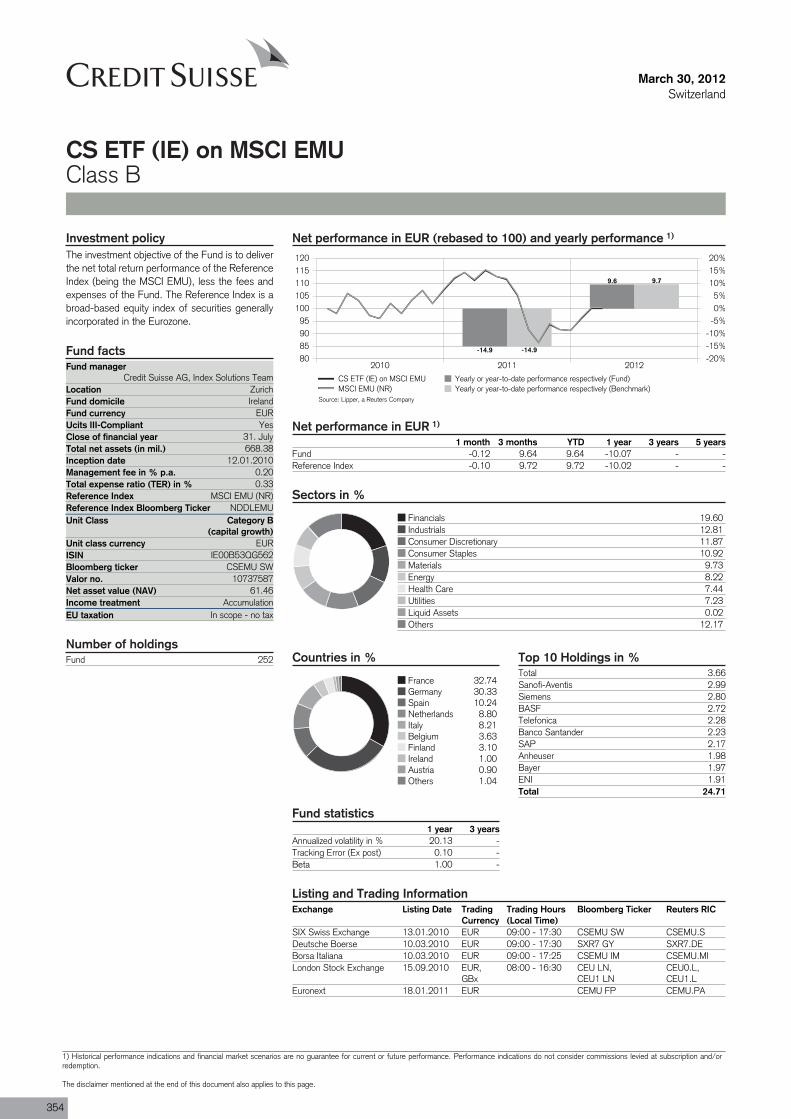
Fund managerCredit Suisse AG, Index Solutions Team
Location ZurichFund domicile IrelandFund currency EURUcits III-CompliantClose of financial year 31. JulyTotal net assets (in mil.) 668.38Inception date 12.01.2010Management fee in % p.a. 0.20Total expense ratio (TER) in % 0.33Reference Index MSCI EMU (NR)Reference Index Bloomberg Ticker NDDLEMUUnit Class Category B
(capital growth)
ISIN IE00B53QG562
Valor no. 10737587
Income treatment AccumulationEU taxation In scope - no tax
Fund 252
March 30, 2012Switzerland
CS ETF (IE) on MSCI EMUClass B
Net performance in EUR (rebased to 100) and yearly performance 1)
2010 2011 201280859095
100105110115120
-20%-15%-10%-5%0%5%
10%15%20%
-14.9
9.6
-14.9
9.7
CS ETF (IE) on MSCI EMU Yearly or year-to-date performance respectively (Fund)MSCI EMU (NR) Yearly or year-to-date performance respectively (Benchmark)
Net performance in EUR 1)
1 month 3 months YTD 1 year 3 years 5 yearsFund -0.12 9.64 9.64 -10.07 - -Reference Index -0.10 9.72 9.72 -10.02 - -
Sectors in %
Financials 19.60Industrials 12.81Consumer Discretionary 11.87Consumer Staples 10.92Materials 9.73Energy 8.22Health Care 7.44Utilities 7.23Liquid Assets 0.02Others 12.17
Countries in %
France 32.74Germany 30.33Spain 10.24Netherlands 8.80Italy 8.21Belgium 3.63Finland 3.10Ireland 1.00Austria 0.90Others 1.04
Investment policyThe investment objective of the Fund is to deliverthe net total return performance of the ReferenceIndex (being the MSCI EMU), less the fees andexpenses of the Fund. The Reference Index is abroad-based equity index of securities generallyincorporated in the Eurozone.
Fund facts
Yes
Unit class currency EUR
Bloomberg ticker CSEMU SW
Net asset value (NAV) 61.46
Number of holdings
Fund statistics1 year 3 years
Annualized volatility in % 20.13 -Tracking Error (Ex post) 0.10 -Beta 1.00 -
Top 10 Holdings in %Total 3.66Sanofi-Aventis 2.99Siemens 2.80BASF 2.72Telefonica 2.28Banco Santander 2.23SAP 2.17Anheuser 1.98Bayer 1.97ENI 1.91Total 24.71
Listing and Trading InformationExchange Listing Date Trading
CurrencyTrading Hours(Local Time)
Bloomberg Ticker Reuters RIC
SIX Swiss Exchange 13.01.2010 EUR 09:00 - 17:30 CSEMU SW CSEMU.SDeutsche Boerse 10.03.2010 EUR 09:00 - 17:30 SXR7 GY SXR7.DEBorsa Italiana 10.03.2010 EUR 09:00 - 17:25 CSEMU IM CSEMU.MILondon Stock Exchange 15.09.2010 EUR,
GBx08:00 - 16:30 CEU LN,
CEU1 LNCEU0.L,CEU1.L
Euronext 18.01.2011 EUR CEMU FP CEMU.PA
Source: Lipper, a Reuters Company
354
1) Historical performance indications and financial market scenarios are no guarantee for current or future performance. Performance indications do not consider commissions levied at subscription and/orredemption.
The disclaimer mentioned at the end of this document also applies to this page.
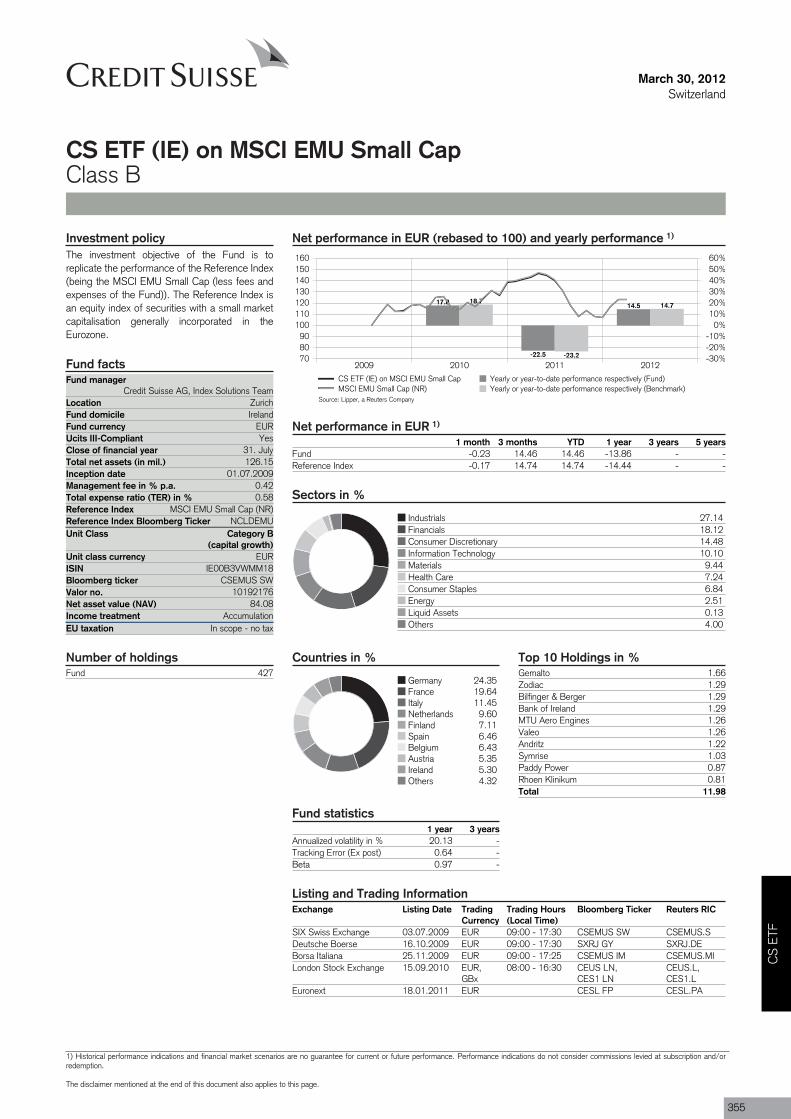
Fund managerCredit Suisse AG, Index Solutions Team
Location ZurichFund domicile IrelandFund currency EURUcits III-CompliantClose of financial year 31. JulyTotal net assets (in mil.) 126.15Inception date 01.07.2009Management fee in % p.a. 0.42Total expense ratio (TER) in % 0.58Reference Index MSCI EMU Small Cap (NR)Reference Index Bloomberg Ticker NCLDEMUUnit Class Category B
(capital growth)
ISIN IE00B3VWMM18
Valor no. 10192176
Income treatment AccumulationEU taxation In scope - no tax
Fund 427
March 30, 2012Switzerland
CS ETF (IE) on MSCI EMU Small CapClass B
Net performance in EUR (rebased to 100) and yearly performance 1)
2009 2010 2011 2012708090
100110120130140150160
-30%-20%-10%
0%10%20%30%40%50%60%
17.8
-22.5
14.518.7
-23.2
14.7
CS ETF (IE) on MSCI EMU Small Cap Yearly or year-to-date performance respectively (Fund)MSCI EMU Small Cap (NR) Yearly or year-to-date performance respectively (Benchmark)
Net performance in EUR 1)
1 month 3 months YTD 1 year 3 years 5 yearsFund -0.23 14.46 14.46 -13.86 - -Reference Index -0.17 14.74 14.74 -14.44 - -
Sectors in %
Industrials 27.14Financials 18.12Consumer Discretionary 14.48Information Technology 10.10Materials 9.44Health Care 7.24Consumer Staples 6.84Energy 2.51Liquid Assets 0.13Others 4.00
Countries in %
Germany 24.35France 19.64Italy 11.45Netherlands 9.60Finland 7.11Spain 6.46Belgium 6.43Austria 5.35Ireland 5.30Others 4.32
Investment policyThe investment objective of the Fund is toreplicate the performance of the Reference Index(being the MSCI EMU Small Cap (less fees andexpenses of the Fund)). The Reference Index isan equity index of securities with a small marketcapitalisation generally incorporated in theEurozone.
Fund facts
Yes
Unit class currency EUR
Bloomberg ticker CSEMUS SW
Net asset value (NAV) 84.08
Number of holdings
Fund statistics1 year 3 years
Annualized volatility in % 20.13 -Tracking Error (Ex post) 0.64 -Beta 0.97 -
Top 10 Holdings in %Gemalto 1.66Zodiac 1.29Bilfinger & Berger 1.29Bank of Ireland 1.29MTU Aero Engines 1.26Valeo 1.26Andritz 1.22Symrise 1.03Paddy Power 0.87Rhoen Klinikum 0.81Total 11.98
Listing and Trading InformationExchange Listing Date Trading
CurrencyTrading Hours(Local Time)
Bloomberg Ticker Reuters RIC
SIX Swiss Exchange 03.07.2009 EUR 09:00 - 17:30 CSEMUS SW CSEMUS.SDeutsche Boerse 16.10.2009 EUR 09:00 - 17:30 SXRJ GY SXRJ.DEBorsa Italiana 25.11.2009 EUR 09:00 - 17:25 CSEMUS IM CSEMUS.MILondon Stock Exchange 15.09.2010 EUR,
GBx08:00 - 16:30 CEUS LN,
CES1 LNCEUS.L,CES1.L
Euronext 18.01.2011 EUR CESL FP CESL.PA
Source: Lipper, a Reuters Company
CS
ETF
1) Historical performance indications and financial market scenarios are no guarantee for current or future performance. Performance indications do not consider commissions levied at subscription and/orredemption.
The disclaimer mentioned at the end of this document also applies to this page.
355
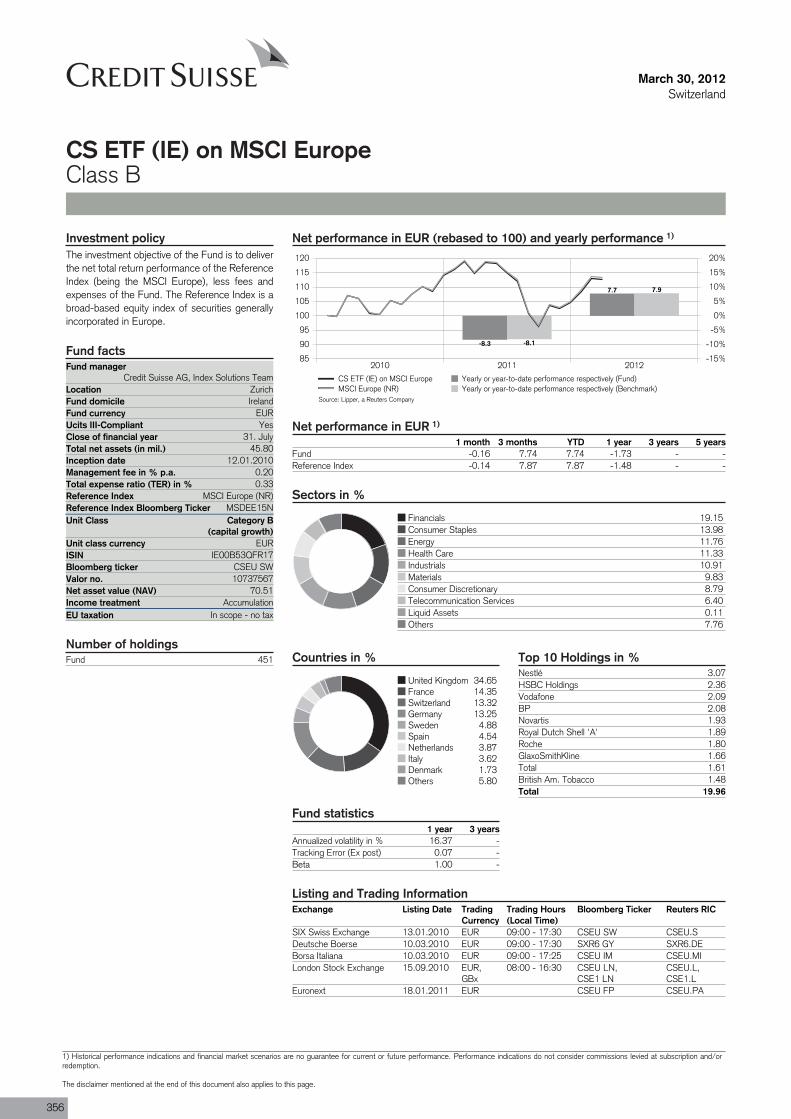
Fund managerCredit Suisse AG, Index Solutions Team
Location ZurichFund domicile IrelandFund currency EURUcits III-CompliantClose of financial year 31. JulyTotal net assets (in mil.) 45.80Inception date 12.01.2010Management fee in % p.a. 0.20Total expense ratio (TER) in % 0.33Reference Index MSCI Europe (NR)Reference Index Bloomberg Ticker MSDEE15NUnit Class Category B
(capital growth)
ISIN IE00B53QFR17
Valor no. 10737567
Income treatment AccumulationEU taxation In scope - no tax
Fund 451
March 30, 2012Switzerland
CS ETF (IE) on MSCI EuropeClass B
Net performance in EUR (rebased to 100) and yearly performance 1)
2010 2011 201285
90
95
100
105
110
115
120
-15%
-10%
-5%
0%
5%
10%
15%
20%
-8.3
7.7
-8.1
7.9
CS ETF (IE) on MSCI Europe Yearly or year-to-date performance respectively (Fund)MSCI Europe (NR) Yearly or year-to-date performance respectively (Benchmark)
Net performance in EUR 1)
1 month 3 months YTD 1 year 3 years 5 yearsFund -0.16 7.74 7.74 -1.73 - -Reference Index -0.14 7.87 7.87 -1.48 - -
Sectors in %
Financials 19.15Consumer Staples 13.98Energy 11.76Health Care 11.33Industrials 10.91Materials 9.83Consumer Discretionary 8.79Telecommunication Services 6.40Liquid Assets 0.11Others 7.76
Countries in %
United Kingdom 34.65France 14.35Switzerland 13.32Germany 13.25Sweden 4.88Spain 4.54Netherlands 3.87Italy 3.62Denmark 1.73Others 5.80
Investment policyThe investment objective of the Fund is to deliverthe net total return performance of the ReferenceIndex (being the MSCI Europe), less fees andexpenses of the Fund. The Reference Index is abroad-based equity index of securities generallyincorporated in Europe.
Fund facts
Yes
Unit class currency EUR
Bloomberg ticker CSEU SW
Net asset value (NAV) 70.51
Number of holdings
Fund statistics1 year 3 years
Annualized volatility in % 16.37 -Tracking Error (Ex post) 0.07 -Beta 1.00 -
Top 10 Holdings in %Nestlé 3.07HSBC Holdings 2.36Vodafone 2.09BP 2.08Novartis 1.93Royal Dutch Shell 'A' 1.89Roche 1.80GlaxoSmithKline 1.66Total 1.61British Am. Tobacco 1.48Total 19.96
Listing and Trading InformationExchange Listing Date Trading
CurrencyTrading Hours(Local Time)
Bloomberg Ticker Reuters RIC
SIX Swiss Exchange 13.01.2010 EUR 09:00 - 17:30 CSEU SW CSEU.SDeutsche Boerse 10.03.2010 EUR 09:00 - 17:30 SXR6 GY SXR6.DEBorsa Italiana 10.03.2010 EUR 09:00 - 17:25 CSEU IM CSEU.MILondon Stock Exchange 15.09.2010 EUR,
GBx08:00 - 16:30 CSEU LN,
CSE1 LNCSEU.L,CSE1.L
Euronext 18.01.2011 EUR CSEU FP CSEU.PA
Source: Lipper, a Reuters Company
356
1) Historical performance indications and financial market scenarios are no guarantee for current or future performance. Performance indications do not consider commissions levied at subscription and/orredemption.
The disclaimer mentioned at the end of this document also applies to this page.
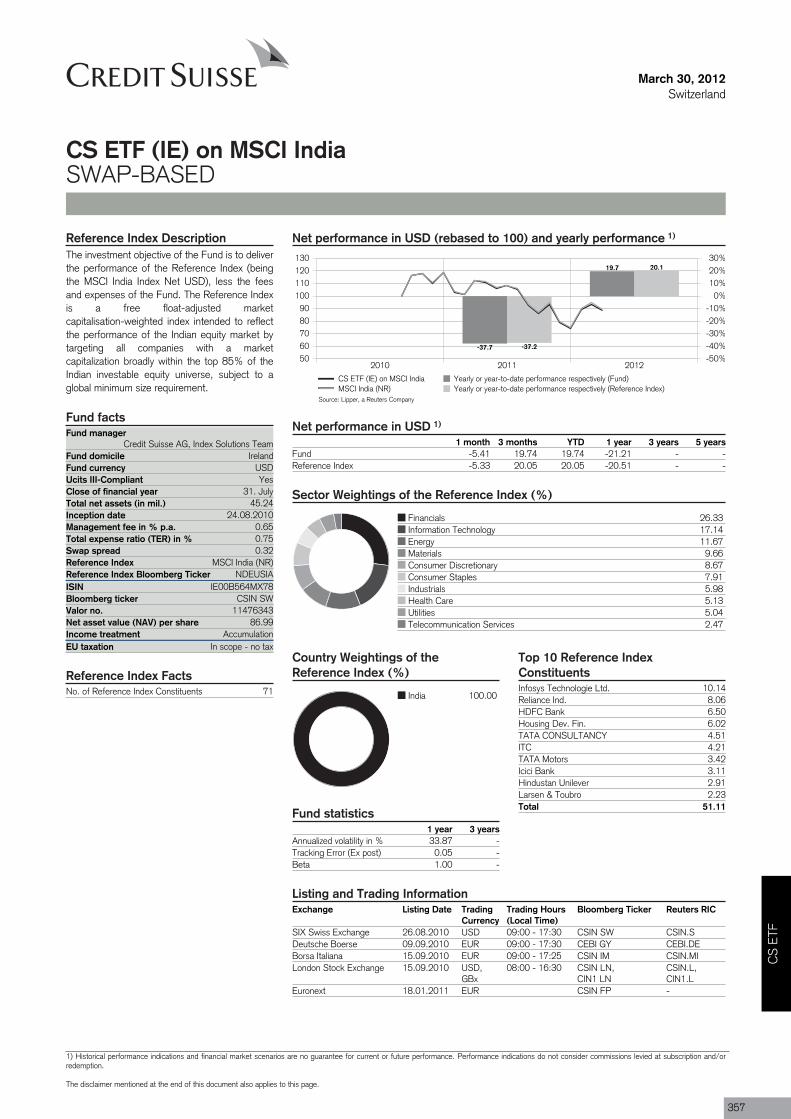
Fund managerCredit Suisse AG, Index Solutions Team
Fund domicile IrelandFund currency USDUcits III-CompliantClose of financial year 31. JulyTotal net assets (in mil.) 45.24Inception date 24.08.2010Management fee in % p.a. 0.65Total expense ratio (TER) in % 0.75Swap spread 0.32Reference Index MSCI India (NR)Reference Index Bloomberg Ticker NDEUSIAISIN IE00B564MX78
Valor no. 11476343
Income treatment AccumulationEU taxation In scope - no tax
No. of Reference Index Constituents 71
March 30, 2012Switzerland
CS ETF (IE) on MSCI IndiaSWAP-BASED
Net performance in USD (rebased to 100) and yearly performance 1)
2010 2011 20125060708090
100110120130
-50%-40%-30%-20%-10%
0%10%20%30%
-37.7
19.7
-37.2
20.1
CS ETF (IE) on MSCI India Yearly or year-to-date performance respectively (Fund)MSCI India (NR) Yearly or year-to-date performance respectively (Reference Index)
Net performance in USD 1)
1 month 3 months YTD 1 year 3 years 5 yearsFund -5.41 19.74 19.74 -21.21 - -Reference Index -5.33 20.05 20.05 -20.51 - -
Sector Weightings of the Reference Index (%)
Financials 26.33Information Technology 17.14Energy 11.67Materials 9.66Consumer Discretionary 8.67Consumer Staples 7.91Industrials 5.98Health Care 5.13Utilities 5.04Telecommunication Services 2.47
Country Weightings of theReference Index (%)
India 100.00
Reference Index DescriptionThe investment objective of the Fund is to deliverthe performance of the Reference Index (beingthe MSCI India Index Net USD), less the feesand expenses of the Fund. The Reference Indexis a free float-adjusted marketcapitalisation-weighted index intended to reflectthe performance of the Indian equity market bytargeting all companies with a marketcapitalization broadly within the top 85% of theIndian investable equity universe, subject to aglobal minimum size requirement.
Fund facts
Yes
Bloomberg ticker CSIN SW
Net asset value (NAV) per share 86.99
Reference Index Facts
Fund statistics1 year 3 years
Annualized volatility in % 33.87 -Tracking Error (Ex post) 0.05 -Beta 1.00 -
Top 10 Reference IndexConstituentsInfosys Technologie Ltd. 10.14Reliance Ind. 8.06HDFC Bank 6.50Housing Dev. Fin. 6.02TATA CONSULTANCY 4.51ITC 4.21TATA Motors 3.42Icici Bank 3.11Hindustan Unilever 2.91Larsen & Toubro 2.23Total 51.11
Listing and Trading InformationExchange Listing Date Trading
CurrencyTrading Hours(Local Time)
Bloomberg Ticker Reuters RIC
SIX Swiss Exchange 26.08.2010 USD 09:00 - 17:30 CSIN SW CSIN.SDeutsche Boerse 09.09.2010 EUR 09:00 - 17:30 CEBI GY CEBI.DEBorsa Italiana 15.09.2010 EUR 09:00 - 17:25 CSIN IM CSIN.MILondon Stock Exchange 15.09.2010 USD,
GBx08:00 - 16:30 CSIN LN,
CIN1 LNCSIN.L,CIN1.L
Euronext 18.01.2011 EUR CSIN FP -
Source: Lipper, a Reuters Company
CS
ETF
1) Historical performance indications and financial market scenarios are no guarantee for current or future performance. Performance indications do not consider commissions levied at subscription and/orredemption.
The disclaimer mentioned at the end of this document also applies to this page.
357
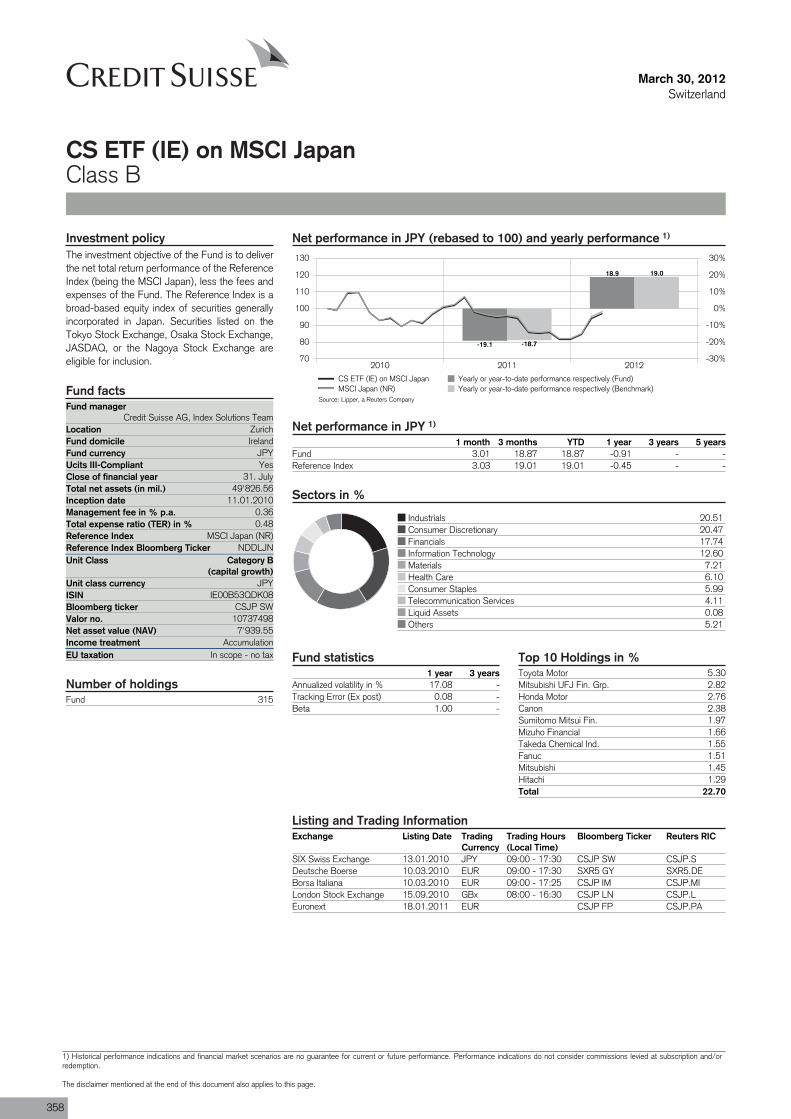
Fund managerCredit Suisse AG, Index Solutions Team
Location ZurichFund domicile IrelandFund currency JPYUcits III-CompliantClose of financial year 31. JulyTotal net assets (in mil.) 49'826.56Inception date 11.01.2010Management fee in % p.a. 0.36Total expense ratio (TER) in % 0.48Reference Index MSCI Japan (NR)Reference Index Bloomberg Ticker NDDLJNUnit Class Category B
(capital growth)
ISIN IE00B53QDK08
Valor no. 10737498
Income treatment AccumulationEU taxation In scope - no tax
Fund 315
March 30, 2012Switzerland
CS ETF (IE) on MSCI JapanClass B
Net performance in JPY (rebased to 100) and yearly performance 1)
2010 2011 201270
80
90
100
110
120
130
-30%
-20%
-10%
0%
10%
20%
30%
-19.1
18.9
-18.7
19.0
CS ETF (IE) on MSCI Japan Yearly or year-to-date performance respectively (Fund)MSCI Japan (NR) Yearly or year-to-date performance respectively (Benchmark)
Net performance in JPY 1)
1 month 3 months YTD 1 year 3 years 5 yearsFund 3.01 18.87 18.87 -0.91 - -Reference Index 3.03 19.01 19.01 -0.45 - -
Sectors in %
Industrials 20.51Consumer Discretionary 20.47Financials 17.74Information Technology 12.60Materials 7.21Health Care 6.10Consumer Staples 5.99Telecommunication Services 4.11Liquid Assets 0.08Others 5.21
Investment policyThe investment objective of the Fund is to deliverthe net total return performance of the ReferenceIndex (being the MSCI Japan), less the fees andexpenses of the Fund. The Reference Index is abroad-based equity index of securities generallyincorporated in Japan. Securities listed on theTokyo Stock Exchange, Osaka Stock Exchange,JASDAQ, or the Nagoya Stock Exchange areeligible for inclusion.
Fund facts
Yes
Unit class currency JPY
Bloomberg ticker CSJP SW
Net asset value (NAV) 7'939.55
Number of holdings
Fund statistics1 year 3 years
Annualized volatility in % 17.08 -Tracking Error (Ex post) 0.08 -Beta 1.00 -
Top 10 Holdings in %Toyota Motor 5.30Mitsubishi UFJ Fin. Grp. 2.82Honda Motor 2.76Canon 2.38Sumitomo Mitsui Fin. 1.97Mizuho Financial 1.66Takeda Chemical Ind. 1.55Fanuc 1.51Mitsubishi 1.45Hitachi 1.29Total 22.70
Listing and Trading InformationExchange Listing Date Trading
CurrencyTrading Hours(Local Time)
Bloomberg Ticker Reuters RIC
SIX Swiss Exchange 13.01.2010 JPY 09:00 - 17:30 CSJP SW CSJP.SDeutsche Boerse 10.03.2010 EUR 09:00 - 17:30 SXR5 GY SXR5.DEBorsa Italiana 10.03.2010 EUR 09:00 - 17:25 CSJP IM CSJP.MILondon Stock Exchange 15.09.2010 GBx 08:00 - 16:30 CSJP LN CSJP.LEuronext 18.01.2011 EUR CSJP FP CSJP.PA
Source: Lipper, a Reuters Company
358
1) Historical performance indications and financial market scenarios are no guarantee for current or future performance. Performance indications do not consider commissions levied at subscription and/orredemption.
The disclaimer mentioned at the end of this document also applies to this page.
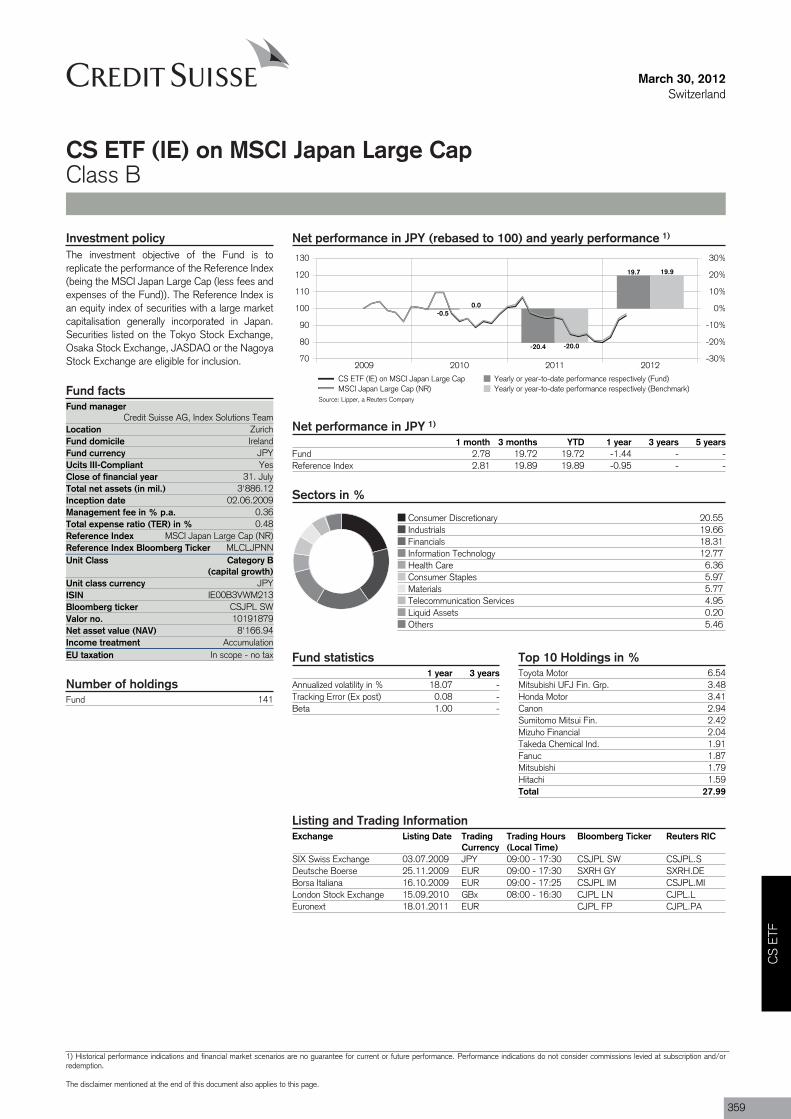
Fund managerCredit Suisse AG, Index Solutions Team
Location ZurichFund domicile IrelandFund currency JPYUcits III-CompliantClose of financial year 31. JulyTotal net assets (in mil.) 3'886.12Inception date 02.06.2009Management fee in % p.a. 0.36Total expense ratio (TER) in % 0.48Reference Index MSCI Japan Large Cap (NR)Reference Index Bloomberg Ticker MLCLJPNNUnit Class Category B
(capital growth)
ISIN IE00B3VWM213
Valor no. 10191879
Income treatment AccumulationEU taxation In scope - no tax
Fund 141
March 30, 2012Switzerland
CS ETF (IE) on MSCI Japan Large CapClass B
Net performance in JPY (rebased to 100) and yearly performance 1)
2009 2010 2011 201270
80
90
100
110
120
130
-30%
-20%
-10%
0%
10%
20%
30%
-0.5
-20.4
19.7
0.0
-20.0
19.9
CS ETF (IE) on MSCI Japan Large Cap Yearly or year-to-date performance respectively (Fund)MSCI Japan Large Cap (NR) Yearly or year-to-date performance respectively (Benchmark)
Net performance in JPY 1)
1 month 3 months YTD 1 year 3 years 5 yearsFund 2.78 19.72 19.72 -1.44 - -Reference Index 2.81 19.89 19.89 -0.95 - -
Sectors in %
Consumer Discretionary 20.55Industrials 19.66Financials 18.31Information Technology 12.77Health Care 6.36Consumer Staples 5.97Materials 5.77Telecommunication Services 4.95Liquid Assets 0.20Others 5.46
Investment policyThe investment objective of the Fund is toreplicate the performance of the Reference Index(being the MSCI Japan Large Cap (less fees andexpenses of the Fund)). The Reference Index isan equity index of securities with a large marketcapitalisation generally incorporated in Japan.Securities listed on the Tokyo Stock Exchange,Osaka Stock Exchange, JASDAQ or the NagoyaStock Exchange are eligible for inclusion.
Fund facts
Yes
Unit class currency JPY
Bloomberg ticker CSJPL SW
Net asset value (NAV) 8'166.94
Number of holdings
Fund statistics1 year 3 years
Annualized volatility in % 18.07 -Tracking Error (Ex post) 0.08 -Beta 1.00 -
Top 10 Holdings in %Toyota Motor 6.54Mitsubishi UFJ Fin. Grp. 3.48Honda Motor 3.41Canon 2.94Sumitomo Mitsui Fin. 2.42Mizuho Financial 2.04Takeda Chemical Ind. 1.91Fanuc 1.87Mitsubishi 1.79Hitachi 1.59Total 27.99
Listing and Trading InformationExchange Listing Date Trading
CurrencyTrading Hours(Local Time)
Bloomberg Ticker Reuters RIC
SIX Swiss Exchange 03.07.2009 JPY 09:00 - 17:30 CSJPL SW CSJPL.SDeutsche Boerse 25.11.2009 EUR 09:00 - 17:30 SXRH GY SXRH.DEBorsa Italiana 16.10.2009 EUR 09:00 - 17:25 CSJPL IM CSJPL.MILondon Stock Exchange 15.09.2010 GBx 08:00 - 16:30 CJPL LN CJPL.LEuronext 18.01.2011 EUR CJPL FP CJPL.PA
Source: Lipper, a Reuters Company
CS
ETF
1) Historical performance indications and financial market scenarios are no guarantee for current or future performance. Performance indications do not consider commissions levied at subscription and/orredemption.
The disclaimer mentioned at the end of this document also applies to this page.
359
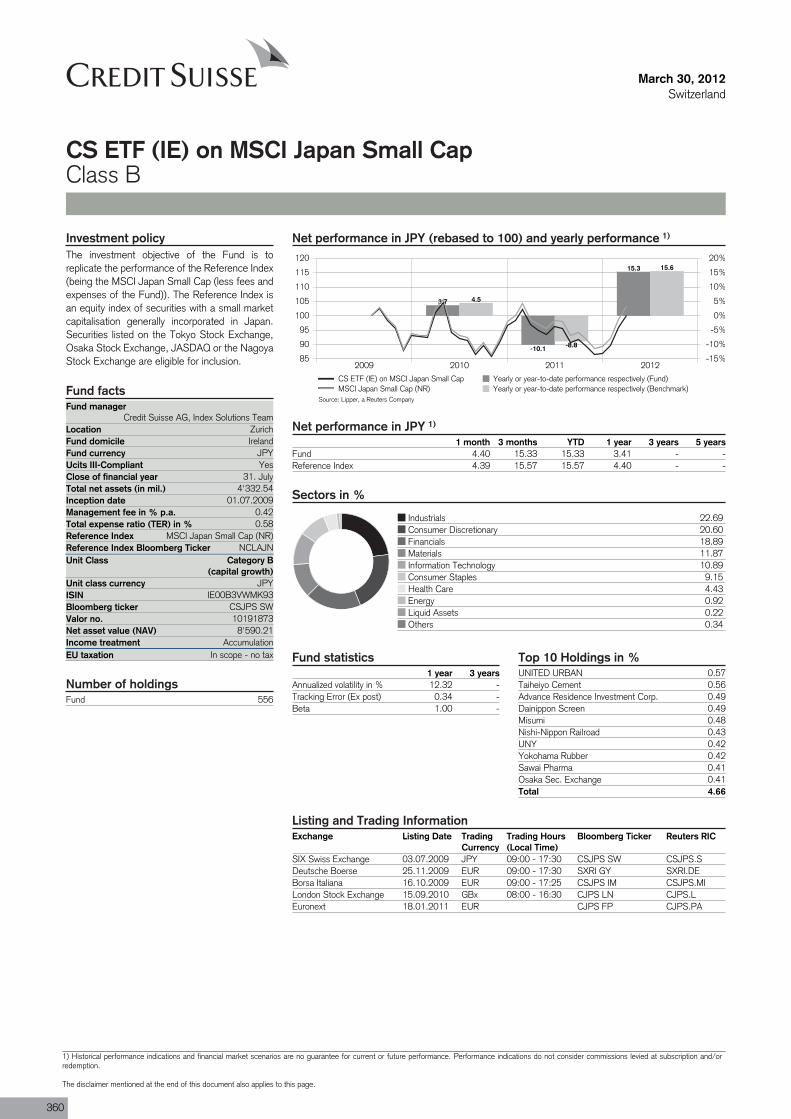
Fund managerCredit Suisse AG, Index Solutions Team
Location ZurichFund domicile IrelandFund currency JPYUcits III-CompliantClose of financial year 31. JulyTotal net assets (in mil.) 4'332.54Inception date 01.07.2009Management fee in % p.a. 0.42Total expense ratio (TER) in % 0.58Reference Index MSCI Japan Small Cap (NR)Reference Index Bloomberg Ticker NCLAJNUnit Class Category B
(capital growth)
ISIN IE00B3VWMK93
Valor no. 10191873
Income treatment AccumulationEU taxation In scope - no tax
Fund 556
March 30, 2012Switzerland
CS ETF (IE) on MSCI Japan Small CapClass B
Net performance in JPY (rebased to 100) and yearly performance 1)
2009 2010 2011 201285
90
95
100
105
110
115
120
-15%
-10%
-5%
0%
5%
10%
15%
20%
3.7
-10.1
15.3
4.5
-8.8
15.6
CS ETF (IE) on MSCI Japan Small Cap Yearly or year-to-date performance respectively (Fund)MSCI Japan Small Cap (NR) Yearly or year-to-date performance respectively (Benchmark)
Net performance in JPY 1)
1 month 3 months YTD 1 year 3 years 5 yearsFund 4.40 15.33 15.33 3.41 - -Reference Index 4.39 15.57 15.57 4.40 - -
Sectors in %
Industrials 22.69Consumer Discretionary 20.60Financials 18.89Materials 11.87Information Technology 10.89Consumer Staples 9.15Health Care 4.43Energy 0.92Liquid Assets 0.22Others 0.34
Investment policyThe investment objective of the Fund is toreplicate the performance of the Reference Index(being the MSCI Japan Small Cap (less fees andexpenses of the Fund)). The Reference Index isan equity index of securities with a small marketcapitalisation generally incorporated in Japan.Securities listed on the Tokyo Stock Exchange,Osaka Stock Exchange, JASDAQ or the NagoyaStock Exchange are eligible for inclusion.
Fund facts
Yes
Unit class currency JPY
Bloomberg ticker CSJPS SW
Net asset value (NAV) 8'590.21
Number of holdings
Fund statistics1 year 3 years
Annualized volatility in % 12.32 -Tracking Error (Ex post) 0.34 -Beta 1.00 -
Top 10 Holdings in %UNITED URBAN 0.57Taiheiyo Cement 0.56Advance Residence Investment Corp. 0.49Dainippon Screen 0.49Misumi 0.48Nishi-Nippon Railroad 0.43UNY 0.42Yokohama Rubber 0.42Sawai Pharma 0.41Osaka Sec. Exchange 0.41Total 4.66
Listing and Trading InformationExchange Listing Date Trading
CurrencyTrading Hours(Local Time)
Bloomberg Ticker Reuters RIC
SIX Swiss Exchange 03.07.2009 JPY 09:00 - 17:30 CSJPS SW CSJPS.SDeutsche Boerse 25.11.2009 EUR 09:00 - 17:30 SXRI GY SXRI.DEBorsa Italiana 16.10.2009 EUR 09:00 - 17:25 CSJPS IM CSJPS.MILondon Stock Exchange 15.09.2010 GBx 08:00 - 16:30 CJPS LN CJPS.LEuronext 18.01.2011 EUR CJPS FP CJPS.PA
Source: Lipper, a Reuters Company
360
1) Historical performance indications and financial market scenarios are no guarantee for current or future performance. Performance indications do not consider commissions levied at subscription and/orredemption.
The disclaimer mentioned at the end of this document also applies to this page.
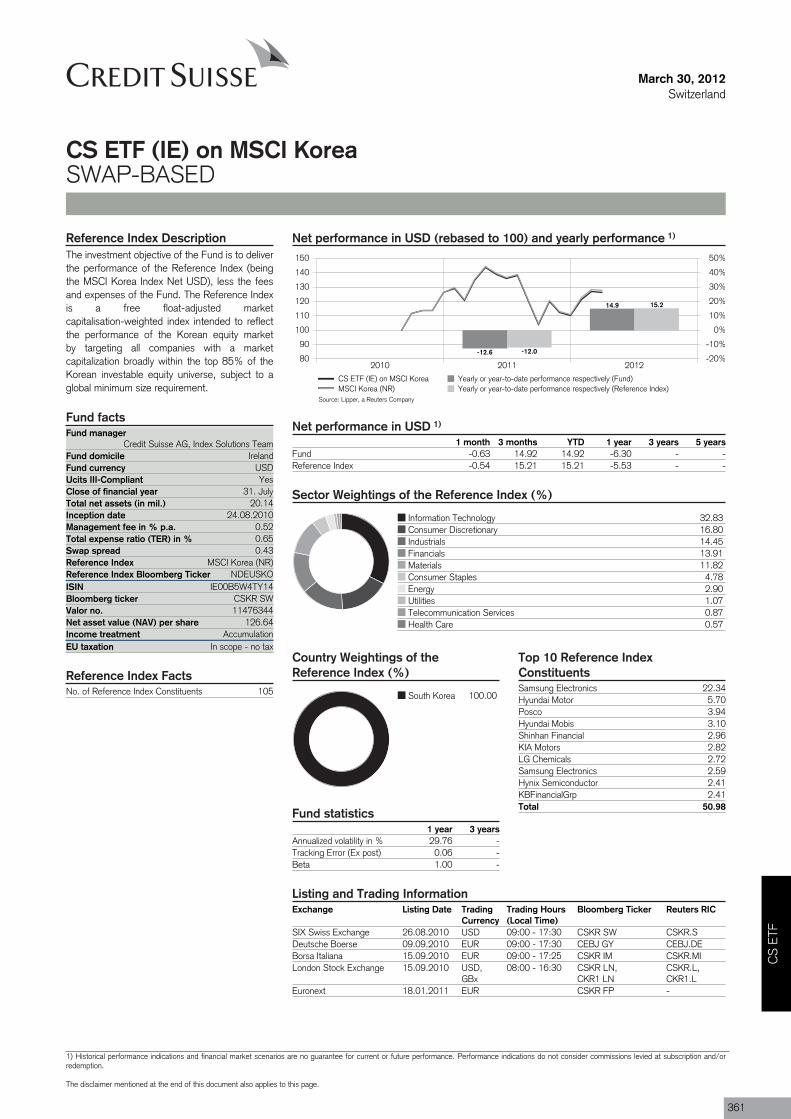
Fund managerCredit Suisse AG, Index Solutions Team
Fund domicile IrelandFund currency USDUcits III-CompliantClose of financial year 31. JulyTotal net assets (in mil.) 20.14Inception date 24.08.2010Management fee in % p.a. 0.52Total expense ratio (TER) in % 0.65Swap spread 0.43Reference Index MSCI Korea (NR)Reference Index Bloomberg Ticker NDEUSKOISIN IE00B5W4TY14
Valor no. 11476344
Income treatment AccumulationEU taxation In scope - no tax
No. of Reference Index Constituents 105
March 30, 2012Switzerland
CS ETF (IE) on MSCI KoreaSWAP-BASED
Net performance in USD (rebased to 100) and yearly performance 1)
2010 2011 201280
90
100
110
120
130
140
150
-20%
-10%
0%
10%
20%
30%
40%
50%
-12.6
14.9
-12.0
15.2
CS ETF (IE) on MSCI Korea Yearly or year-to-date performance respectively (Fund)MSCI Korea (NR) Yearly or year-to-date performance respectively (Reference Index)
Net performance in USD 1)
1 month 3 months YTD 1 year 3 years 5 yearsFund -0.63 14.92 14.92 -6.30 - -Reference Index -0.54 15.21 15.21 -5.53 - -
Sector Weightings of the Reference Index (%)
Information Technology 32.83Consumer Discretionary 16.80Industrials 14.45Financials 13.91Materials 11.82Consumer Staples 4.78Energy 2.90Utilities 1.07Telecommunication Services 0.87Health Care 0.57
Country Weightings of theReference Index (%)
South Korea 100.00
Reference Index DescriptionThe investment objective of the Fund is to deliverthe performance of the Reference Index (beingthe MSCI Korea Index Net USD), less the feesand expenses of the Fund. The Reference Indexis a free float-adjusted marketcapitalisation-weighted index intended to reflectthe performance of the Korean equity marketby targeting all companies with a marketcapitalization broadly within the top 85% of theKorean investable equity universe, subject to aglobal minimum size requirement.
Fund facts
Yes
Bloomberg ticker CSKR SW
Net asset value (NAV) per share 126.64
Reference Index Facts
Fund statistics1 year 3 years
Annualized volatility in % 29.76 -Tracking Error (Ex post) 0.06 -Beta 1.00 -
Top 10 Reference IndexConstituentsSamsung Electronics 22.34Hyundai Motor 5.70Posco 3.94Hyundai Mobis 3.10Shinhan Financial 2.96KIA Motors 2.82LG Chemicals 2.72Samsung Electronics 2.59Hynix Semiconductor 2.41KBFinancialGrp 2.41Total 50.98
Listing and Trading InformationExchange Listing Date Trading
CurrencyTrading Hours(Local Time)
Bloomberg Ticker Reuters RIC
SIX Swiss Exchange 26.08.2010 USD 09:00 - 17:30 CSKR SW CSKR.SDeutsche Boerse 09.09.2010 EUR 09:00 - 17:30 CEBJ GY CEBJ.DEBorsa Italiana 15.09.2010 EUR 09:00 - 17:25 CSKR IM CSKR.MILondon Stock Exchange 15.09.2010 USD,
GBx08:00 - 16:30 CSKR LN,
CKR1 LNCSKR.L,CKR1.L
Euronext 18.01.2011 EUR CSKR FP -
Source: Lipper, a Reuters Company
CS
ETF
1) Historical performance indications and financial market scenarios are no guarantee for current or future performance. Performance indications do not consider commissions levied at subscription and/orredemption.
The disclaimer mentioned at the end of this document also applies to this page.
361
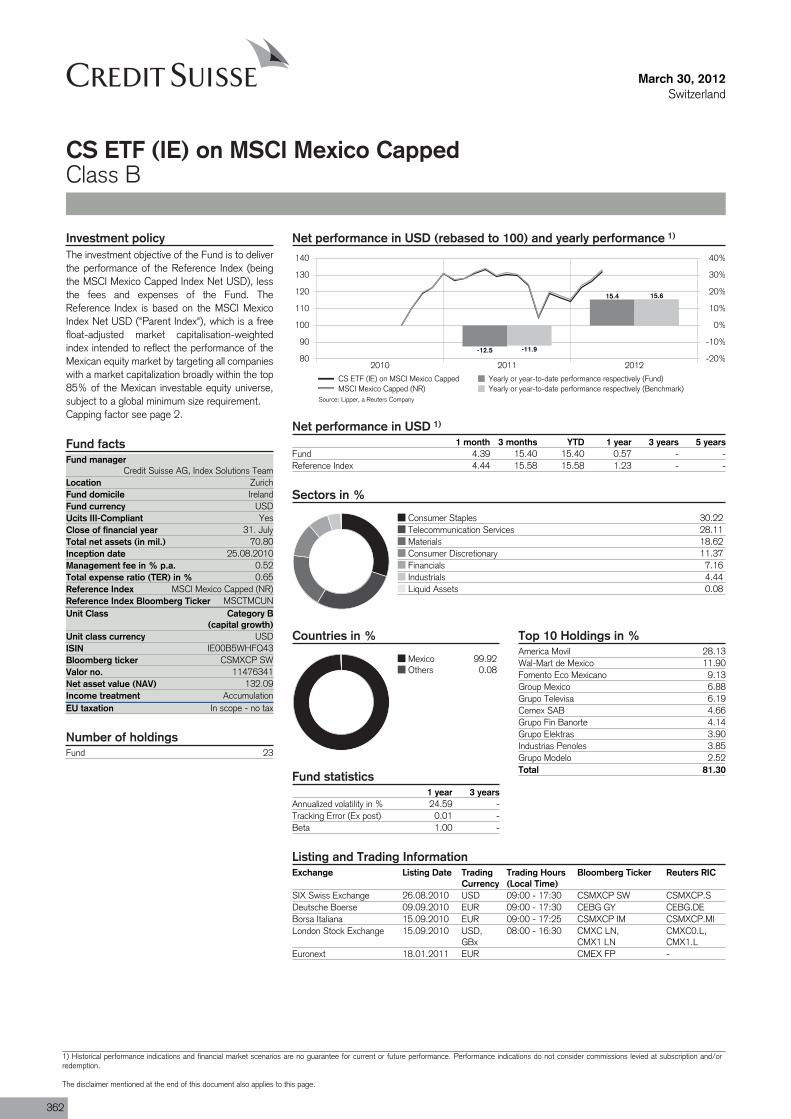
Fund managerCredit Suisse AG, Index Solutions Team
Location ZurichFund domicile IrelandFund currency USDUcits III-CompliantClose of financial year 31. JulyTotal net assets (in mil.) 70.80Inception date 25.08.2010Management fee in % p.a. 0.52Total expense ratio (TER) in % 0.65Reference Index MSCI Mexico Capped (NR)Reference Index Bloomberg Ticker MSCTMCUNUnit Class Category B
(capital growth)
ISIN IE00B5WHFQ43
Valor no. 11476341
Income treatment AccumulationEU taxation In scope - no tax
Fund 23
March 30, 2012Switzerland
CS ETF (IE) on MSCI Mexico CappedClass B
Net performance in USD (rebased to 100) and yearly performance 1)
2010 2011 201280
90
100
110
120
130
140
-20%
-10%
0%
10%
20%
30%
40%
-12.5
15.4
-11.9
15.6
CS ETF (IE) on MSCI Mexico Capped Yearly or year-to-date performance respectively (Fund)MSCI Mexico Capped (NR) Yearly or year-to-date performance respectively (Benchmark)
Net performance in USD 1)
1 month 3 months YTD 1 year 3 years 5 yearsFund 4.39 15.40 15.40 0.57 - -Reference Index 4.44 15.58 15.58 1.23 - -
Sectors in %
Consumer Staples 30.22Telecommunication Services 28.11Materials 18.62Consumer Discretionary 11.37Financials 7.16Industrials 4.44Liquid Assets 0.08
Countries in %
Mexico 99.92Others 0.08
Investment policyThe investment objective of the Fund is to deliverthe performance of the Reference Index (beingthe MSCI Mexico Capped Index Net USD), lessthe fees and expenses of the Fund. TheReference Index is based on the MSCI MexicoIndex Net USD ("Parent Index"), which is a freefloat-adjusted market capitalisation-weightedindex intended to reflect the performance of theMexican equity market by targeting all companieswith a market capitalization broadly within the top85% of the Mexican investable equity universe,subject to a global minimum size requirement.Capping factor see page 2.
Fund facts
Yes
Unit class currency USD
Bloomberg ticker CSMXCP SW
Net asset value (NAV) 132.09
Number of holdings
Fund statistics1 year 3 years
Annualized volatility in % 24.59 -Tracking Error (Ex post) 0.01 -Beta 1.00 -
Top 10 Holdings in %America Movil 28.13Wal-Mart de Mexico 11.90Fomento Eco Mexicano 9.13Group Mexico 6.88Grupo Televisa 6.19Cemex SAB 4.66Grupo Fin Banorte 4.14Grupo Elektras 3.90Industrias Penoles 3.85Grupo Modelo 2.52Total 81.30
Listing and Trading InformationExchange Listing Date Trading
CurrencyTrading Hours(Local Time)
Bloomberg Ticker Reuters RIC
SIX Swiss Exchange 26.08.2010 USD 09:00 - 17:30 CSMXCP SW CSMXCP.SDeutsche Boerse 09.09.2010 EUR 09:00 - 17:30 CEBG GY CEBG.DEBorsa Italiana 15.09.2010 EUR 09:00 - 17:25 CSMXCP IM CSMXCP.MILondon Stock Exchange 15.09.2010 USD,
GBx08:00 - 16:30 CMXC LN,
CMX1 LNCMXC0.L,CMX1.L
Euronext 18.01.2011 EUR CMEX FP -
Source: Lipper, a Reuters Company
362
1) Historical performance indications and financial market scenarios are no guarantee for current or future performance. Performance indications do not consider commissions levied at subscription and/orredemption.
The disclaimer mentioned at the end of this document also applies to this page.
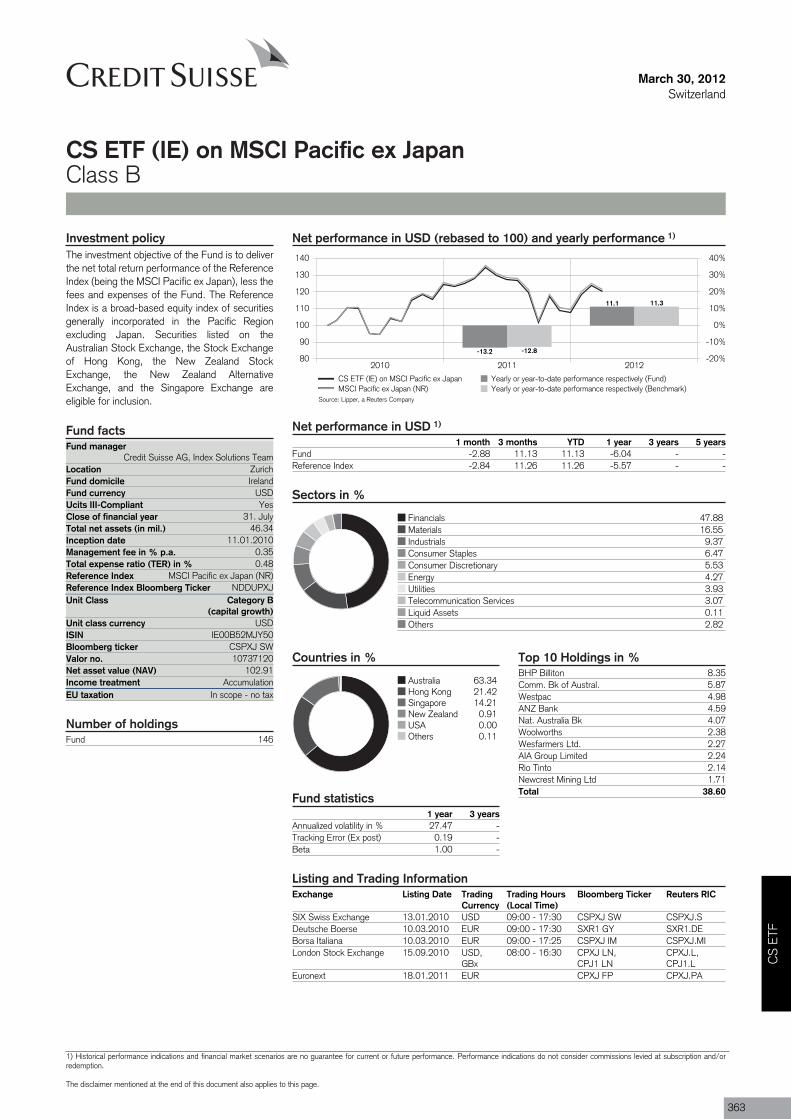
Fund managerCredit Suisse AG, Index Solutions Team
Location ZurichFund domicile IrelandFund currency USDUcits III-CompliantClose of financial year 31. JulyTotal net assets (in mil.) 46.34Inception date 11.01.2010Management fee in % p.a. 0.35Total expense ratio (TER) in % 0.48Reference Index MSCI Pacific ex Japan (NR)Reference Index Bloomberg Ticker NDDUPXJUnit Class Category B
(capital growth)
ISIN IE00B52MJY50
Valor no. 10737120
Income treatment AccumulationEU taxation In scope - no tax
Fund 146
March 30, 2012Switzerland
CS ETF (IE) on MSCI Pacific ex JapanClass B
Net performance in USD (rebased to 100) and yearly performance 1)
2010 2011 201280
90
100
110
120
130
140
-20%
-10%
0%
10%
20%
30%
40%
-13.2
11.1
-12.8
11.3
CS ETF (IE) on MSCI Pacific ex Japan Yearly or year-to-date performance respectively (Fund)MSCI Pacific ex Japan (NR) Yearly or year-to-date performance respectively (Benchmark)
Net performance in USD 1)
1 month 3 months YTD 1 year 3 years 5 yearsFund -2.88 11.13 11.13 -6.04 - -Reference Index -2.84 11.26 11.26 -5.57 - -
Sectors in %
Financials 47.88Materials 16.55Industrials 9.37Consumer Staples 6.47Consumer Discretionary 5.53Energy 4.27Utilities 3.93Telecommunication Services 3.07Liquid Assets 0.11Others 2.82
Countries in %
Australia 63.34Hong Kong 21.42Singapore 14.21New Zealand 0.91USA 0.00Others 0.11
Investment policyThe investment objective of the Fund is to deliverthe net total return performance of the ReferenceIndex (being the MSCI Pacific ex Japan), less thefees and expenses of the Fund. The ReferenceIndex is a broad-based equity index of securitiesgenerally incorporated in the Pacific Regionexcluding Japan. Securities listed on theAustralian Stock Exchange, the Stock Exchangeof Hong Kong, the New Zealand StockExchange, the New Zealand AlternativeExchange, and the Singapore Exchange areeligible for inclusion.
Fund facts
Yes
Unit class currency USD
Bloomberg ticker CSPXJ SW
Net asset value (NAV) 102.91
Number of holdings
Fund statistics1 year 3 years
Annualized volatility in % 27.47 -Tracking Error (Ex post) 0.19 -Beta 1.00 -
Top 10 Holdings in %BHP Billiton 8.35Comm. Bk of Austral. 5.87Westpac 4.98ANZ Bank 4.59Nat. Australia Bk 4.07Woolworths 2.38Wesfarmers Ltd. 2.27AIA Group Limited 2.24Rio Tinto 2.14Newcrest Mining Ltd 1.71Total 38.60
Listing and Trading InformationExchange Listing Date Trading
CurrencyTrading Hours(Local Time)
Bloomberg Ticker Reuters RIC
SIX Swiss Exchange 13.01.2010 USD 09:00 - 17:30 CSPXJ SW CSPXJ.SDeutsche Boerse 10.03.2010 EUR 09:00 - 17:30 SXR1 GY SXR1.DEBorsa Italiana 10.03.2010 EUR 09:00 - 17:25 CSPXJ IM CSPXJ.MILondon Stock Exchange 15.09.2010 USD,
GBx08:00 - 16:30 CPXJ LN,
CPJ1 LNCPXJ.L,CPJ1.L
Euronext 18.01.2011 EUR CPXJ FP CPXJ.PA
Source: Lipper, a Reuters Company
CS
ETF
1) Historical performance indications and financial market scenarios are no guarantee for current or future performance. Performance indications do not consider commissions levied at subscription and/orredemption.
The disclaimer mentioned at the end of this document also applies to this page.
363
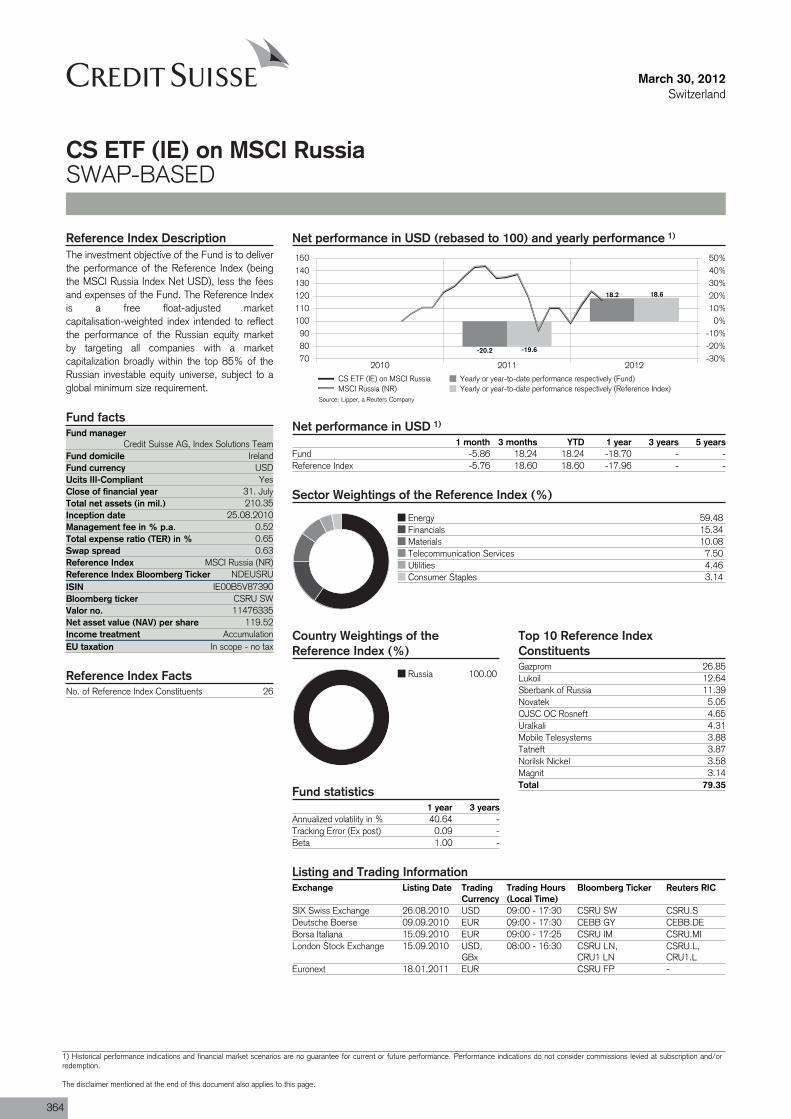
Fund managerCredit Suisse AG, Index Solutions Team
Fund domicile IrelandFund currency USDUcits III-CompliantClose of financial year 31. JulyTotal net assets (in mil.) 210.35Inception date 25.08.2010Management fee in % p.a. 0.52Total expense ratio (TER) in % 0.65Swap spread 0.63Reference Index MSCI Russia (NR)Reference Index Bloomberg Ticker NDEUSRUISIN IE00B5V87390
Valor no. 11476335
Income treatment AccumulationEU taxation In scope - no tax
No. of Reference Index Constituents 26
March 30, 2012Switzerland
CS ETF (IE) on MSCI RussiaSWAP-BASED
Net performance in USD (rebased to 100) and yearly performance 1)
2010 2011 2012708090
100110120130140150
-30%-20%-10%
0%10%20%30%40%50%
-20.2
18.2
-19.6
18.6
CS ETF (IE) on MSCI Russia Yearly or year-to-date performance respectively (Fund)MSCI Russia (NR) Yearly or year-to-date performance respectively (Reference Index)
Net performance in USD 1)
1 month 3 months YTD 1 year 3 years 5 yearsFund -5.86 18.24 18.24 -18.70 - -Reference Index -5.76 18.60 18.60 -17.96 - -
Sector Weightings of the Reference Index (%)
Energy 59.48Financials 15.34Materials 10.08Telecommunication Services 7.50Utilities 4.46Consumer Staples 3.14
Country Weightings of theReference Index (%)
Russia 100.00
Reference Index DescriptionThe investment objective of the Fund is to deliverthe performance of the Reference Index (beingthe MSCI Russia Index Net USD), less the feesand expenses of the Fund. The Reference Indexis a free float-adjusted marketcapitalisation-weighted index intended to reflectthe performance of the Russian equity marketby targeting all companies with a marketcapitalization broadly within the top 85% of theRussian investable equity universe, subject to aglobal minimum size requirement.
Fund facts
Yes
Bloomberg ticker CSRU SW
Net asset value (NAV) per share 119.52
Reference Index Facts
Fund statistics1 year 3 years
Annualized volatility in % 40.64 -Tracking Error (Ex post) 0.09 -Beta 1.00 -
Top 10 Reference IndexConstituentsGazprom 26.85Lukoil 12.64Sberbank of Russia 11.39Novatek 5.05OJSC OC Rosneft 4.65Uralkali 4.31Mobile Telesystems 3.88Tatneft 3.87Norilsk Nickel 3.58Magnit 3.14Total 79.35
Listing and Trading InformationExchange Listing Date Trading
CurrencyTrading Hours(Local Time)
Bloomberg Ticker Reuters RIC
SIX Swiss Exchange 26.08.2010 USD 09:00 - 17:30 CSRU SW CSRU.SDeutsche Boerse 09.09.2010 EUR 09:00 - 17:30 CEBB GY CEBB.DEBorsa Italiana 15.09.2010 EUR 09:00 - 17:25 CSRU IM CSRU.MILondon Stock Exchange 15.09.2010 USD,
GBx08:00 - 16:30 CSRU LN,
CRU1 LNCSRU.L,CRU1.L
Euronext 18.01.2011 EUR CSRU FP -
Source: Lipper, a Reuters Company
364
1) Historical performance indications and financial market scenarios are no guarantee for current or future performance. Performance indications do not consider commissions levied at subscription and/orredemption.
The disclaimer mentioned at the end of this document also applies to this page.
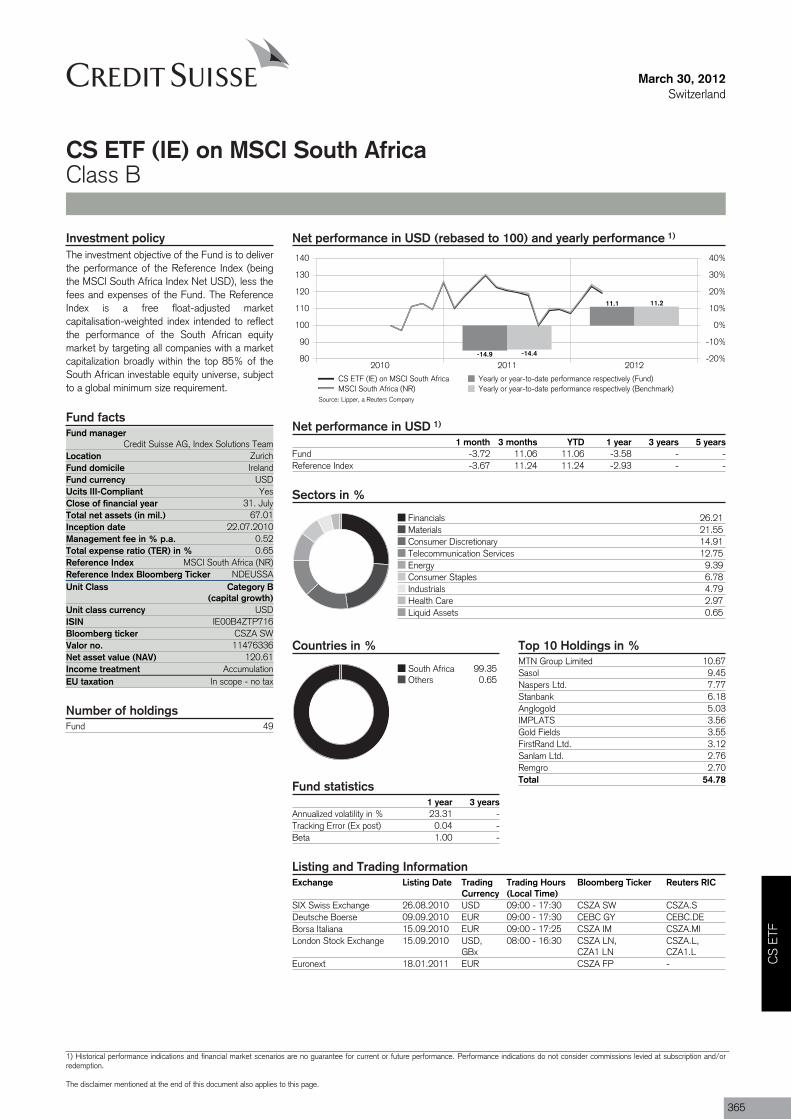
Fund managerCredit Suisse AG, Index Solutions Team
Location ZurichFund domicile IrelandFund currency USDUcits III-CompliantClose of financial year 31. JulyTotal net assets (in mil.) 67.01Inception date 22.07.2010Management fee in % p.a. 0.52Total expense ratio (TER) in % 0.65Reference Index MSCI South Africa (NR)Reference Index Bloomberg Ticker NDEUSSAUnit Class Category B
(capital growth)
ISIN IE00B4ZTP716
Valor no. 11476336
Income treatment AccumulationEU taxation In scope - no tax
Fund 49
March 30, 2012Switzerland
CS ETF (IE) on MSCI South AfricaClass B
Net performance in USD (rebased to 100) and yearly performance 1)
2010 2011 201280
90
100
110
120
130
140
-20%
-10%
0%
10%
20%
30%
40%
-14.9
11.1
-14.4
11.2
CS ETF (IE) on MSCI South Africa Yearly or year-to-date performance respectively (Fund)MSCI South Africa (NR) Yearly or year-to-date performance respectively (Benchmark)
Net performance in USD 1)
1 month 3 months YTD 1 year 3 years 5 yearsFund -3.72 11.06 11.06 -3.58 - -Reference Index -3.67 11.24 11.24 -2.93 - -
Sectors in %
Financials 26.21Materials 21.55Consumer Discretionary 14.91Telecommunication Services 12.75Energy 9.39Consumer Staples 6.78Industrials 4.79Health Care 2.97Liquid Assets 0.65
Countries in %
South Africa 99.35Others 0.65
Investment policyThe investment objective of the Fund is to deliverthe performance of the Reference Index (beingthe MSCI South Africa Index Net USD), less thefees and expenses of the Fund. The ReferenceIndex is a free float-adjusted marketcapitalisation-weighted index intended to reflectthe performance of the South African equitymarket by targeting all companies with a marketcapitalization broadly within the top 85% of theSouth African investable equity universe, subjectto a global minimum size requirement.
Fund facts
Yes
Unit class currency USD
Bloomberg ticker CSZA SW
Net asset value (NAV) 120.61
Number of holdings
Fund statistics1 year 3 years
Annualized volatility in % 23.31 -Tracking Error (Ex post) 0.04 -Beta 1.00 -
Top 10 Holdings in %MTN Group Limited 10.67Sasol 9.45Naspers Ltd. 7.77Stanbank 6.18Anglogold 5.03IMPLATS 3.56Gold Fields 3.55FirstRand Ltd. 3.12Sanlam Ltd. 2.76Remgro 2.70Total 54.78
Listing and Trading InformationExchange Listing Date Trading
CurrencyTrading Hours(Local Time)
Bloomberg Ticker Reuters RIC
SIX Swiss Exchange 26.08.2010 USD 09:00 - 17:30 CSZA SW CSZA.SDeutsche Boerse 09.09.2010 EUR 09:00 - 17:30 CEBC GY CEBC.DEBorsa Italiana 15.09.2010 EUR 09:00 - 17:25 CSZA IM CSZA.MILondon Stock Exchange 15.09.2010 USD,
GBx08:00 - 16:30 CSZA LN,
CZA1 LNCSZA.L,CZA1.L
Euronext 18.01.2011 EUR CSZA FP -
Source: Lipper, a Reuters Company
CS
ETF
1) Historical performance indications and financial market scenarios are no guarantee for current or future performance. Performance indications do not consider commissions levied at subscription and/orredemption.
The disclaimer mentioned at the end of this document also applies to this page.
365

Fund managerCredit Suisse AG, Index Solutions Team
Fund domicile IrelandFund currency USDUcits III-CompliantClose of financial year 31. JulyTotal net assets (in mil.) 24.82Inception date 24.08.2010Management fee in % p.a. 0.52Total expense ratio (TER) in % 0.65Swap spread -0.18Reference Index MSCI Taiwan (NR)Reference Index Bloomberg Ticker NDEUSTWISIN IE00B5VL1928
Valor no. 11476345
Income treatment AccumulationEU taxation In scope - no tax
No. of Reference Index Constituents 113
March 30, 2012Switzerland
CS ETF (IE) on MSCI TaiwanSWAP-BASED
Net performance in USD (rebased to 100) and yearly performance 1)
2010 2011 201270
80
90
100
110
120
130
140
-30%
-20%
-10%
0%
10%
20%
30%
40%
-21.4
14.4
-20.9
14.5
CS ETF (IE) on MSCI Taiwan Yearly or year-to-date performance respectively (Fund)MSCI Taiwan (NR) Yearly or year-to-date performance respectively (Reference Index)
Net performance in USD 1)
1 month 3 months YTD 1 year 3 years 5 yearsFund -2.27 14.35 14.35 -5.96 - -Reference Index -2.23 14.48 14.48 -5.42 - -
Sector Weightings of the Reference Index (%)
Information Technology 56.54Financials 14.25Materials 13.88Telecommunication Services 4.94Consumer Discretionary 3.91Industrials 3.34Consumer Staples 2.27Energy 0.88
Country Weightings of theReference Index (%)
Taiwan 100.00
Reference Index DescriptionThe investment objective of the Fund is to deliverthe performance of the Reference Index (beingthe MSCI Taiwan Index Net USD), less the feesand expenses of the Fund. The Reference Indexis a free float-adjusted marketcapitalisation-weighted index intended to reflectthe performance of the Taiwanese equity marketby targeting all companies with a marketcapitalization broadly within the top 85% of theTaiwanese investable equity universe, subject toa global minimum size requirement.
Fund facts
Yes
Bloomberg ticker CSTW SW
Net asset value (NAV) per share 115.44
Reference Index Facts
Fund statistics1 year 3 years
Annualized volatility in % 24.39 -Tracking Error (Ex post) 0.03 -Beta 1.00 -
Top 10 Reference IndexConstituentsTaiwan Semicon 17.43Hon Hai Precision 8.67HTC 3.65Formosa Plastics 2.88Chunghwa Telecm. 2.88China Steel 2.84Nan Ya Plastic 2.62Mediatek 2.43Formosa Chemical Fibers 2.05Cathay Financial 1.89Total 47.33
Listing and Trading InformationExchange Listing Date Trading
CurrencyTrading Hours(Local Time)
Bloomberg Ticker Reuters RIC
SIX Swiss Exchange 26.08.2010 USD 09:00 - 17:30 CSTW SW CSTW.SDeutsche Boerse 09.09.2010 EUR 09:00 - 17:30 CEBK GY CEBK.DEBorsa Italiana 15.09.2010 EUR 09:00 - 17:25 CSTW IM CSTW.MILondon Stock Exchange 15.09.2010 USD,
GBx08:00 - 16:30 CSTW LN,
CTW1 LNCSTW.L,CTW1.L
Euronext 18.01.2011 EUR CSTW FP -
Source: Lipper, a Reuters Company
366
1) Historical performance indications and financial market scenarios are no guarantee for current or future performance. Performance indications do not consider commissions levied at subscription and/orredemption.
The disclaimer mentioned at the end of this document also applies to this page.

Fund managerCredit Suisse AG, Index Solutions Team
Location ZurichFund domicile IrelandFund currency GBPUcits III-CompliantClose of financial year 31. JulyTotal net assets (in mil.) 243.10Inception date 12.01.2010Management fee in % p.a. 0.21Total expense ratio (TER) in % 0.33Reference Index MSCI UK (NR)Reference Index Bloomberg Ticker NDDLUKUnit Class Category B
(capital growth)
ISIN IE00B539F030
Valor no. 10737561
Income treatment AccumulationEU taxation In scope - no tax
Fund 104
March 30, 2012Switzerland
CS ETF (IE) on MSCI UKClass B
Net performance in GBP (rebased to 100) and yearly performance 1)
2010 2011 201295
100
105
110
115
120
125
-5%
0%
5%
10%
15%
20%
25%
-2.2
4.6
-1.8
4.7
CS ETF (IE) on MSCI UK Yearly or year-to-date performance respectively (Fund)MSCI UK (NR) Yearly or year-to-date performance respectively (Benchmark)
Net performance in GBP 1)
1 month 3 months YTD 1 year 3 years 5 yearsFund -1.24 4.56 4.56 1.00 - -Reference Index -1.21 4.69 4.69 1.39 - -
Sectors in %
Energy 20.21Financials 18.47Consumer Staples 16.52Materials 11.84Health Care 8.42Telecommunication Services 7.23Consumer Discretionary 6.15Industrials 5.82Liquid Assets 0.12Others 5.24
Investment policyThe investment objective of the Fund is to deliverthe net total return performance of the ReferenceIndex (being the MSCI UK), less the fees andexpenses of the Fund. The Reference Index is abroad-based equity index of securities generallyincorporated in the United Kingdom. Securitieslisted on the London Stock Exchange are eligiblefor inclusion.
Fund facts
Yes
Unit class currency GBP
Bloomberg ticker CSUK SW
Net asset value (NAV) 67.53
Number of holdingsFund statistics
1 year 3 yearsAnnualized volatility in % 13.45 -Tracking Error (Ex post) 0.05 -Beta 1.00 -
Top 10 Holdings in %HSBC Holdings 6.76BP 5.98Vodafone 5.90Royal Dutch Shell 'A' 5.37GlaxoSmithKline 4.81British Am. Tobacco 4.23Royal Dutch Shell 'B' 4.00BG 3.36Rio Tinto 3.22BHP Billiton 2.76Total 46.39
Listing and Trading InformationExchange Listing Date Trading
CurrencyTrading Hours(Local Time)
Bloomberg Ticker Reuters RIC
SIX Swiss Exchange 13.01.2010 GBP 09:00 - 17:30 CSUK SW CSUK.SDeutsche Boerse 10.03.2010 EUR 09:00 - 17:30 SXR3 GY SXR3.DEBorsa Italiana 10.03.2010 EUR 09:00 - 17:25 CSUK IM CSUK.MILondon Stock Exchange 15.09.2010 GBx 08:00 - 16:30 CSUK LN CSUK.LEuronext 18.01.2011 EUR CSUK FP CSUK.PA
Source: Lipper, a Reuters Company
CS
ETF
1) Historical performance indications and financial market scenarios are no guarantee for current or future performance. Performance indications do not consider commissions levied at subscription and/orredemption.
The disclaimer mentioned at the end of this document also applies to this page.
367
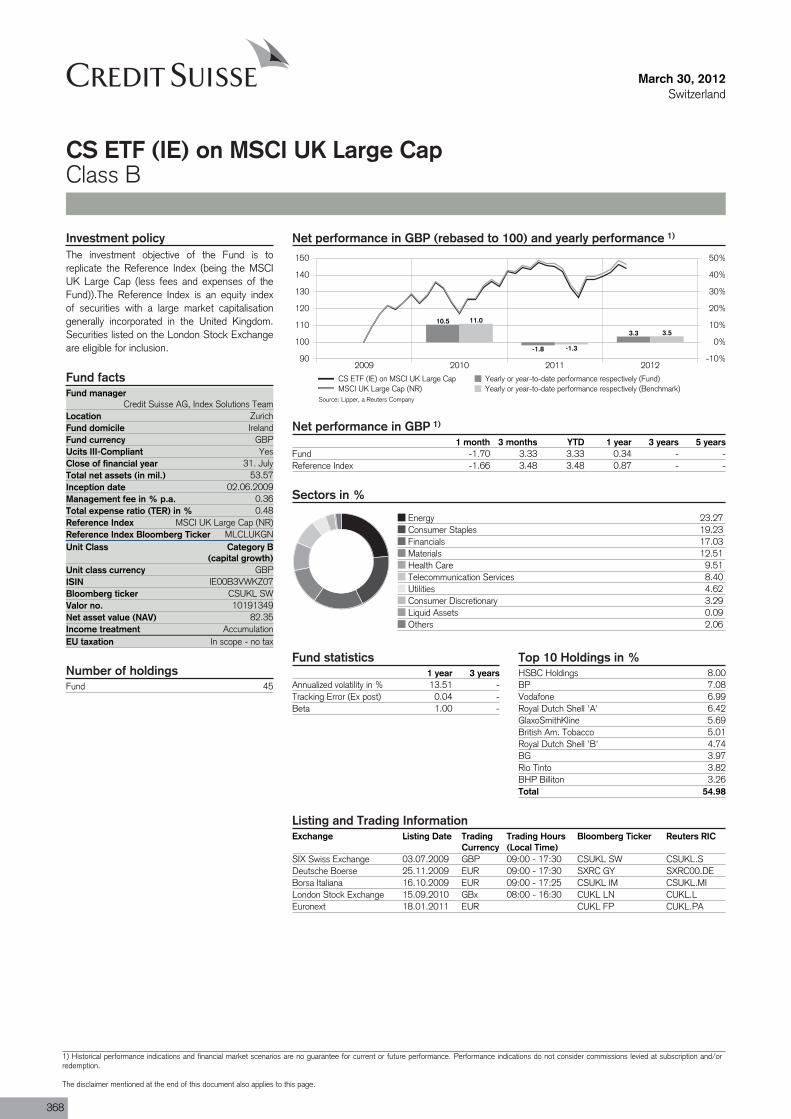
Fund managerCredit Suisse AG, Index Solutions Team
Location ZurichFund domicile IrelandFund currency GBPUcits III-CompliantClose of financial year 31. JulyTotal net assets (in mil.) 53.57Inception date 02.06.2009Management fee in % p.a. 0.36Total expense ratio (TER) in % 0.48Reference Index MSCI UK Large Cap (NR)Reference Index Bloomberg Ticker MLCLUKGNUnit Class Category B
(capital growth)
ISIN IE00B3VWKZ07
Valor no. 10191349
Income treatment AccumulationEU taxation In scope - no tax
Fund 45
March 30, 2012Switzerland
CS ETF (IE) on MSCI UK Large CapClass B
Net performance in GBP (rebased to 100) and yearly performance 1)
2009 2010 2011 201290
100
110
120
130
140
150
-10%
0%
10%
20%
30%
40%
50%
10.5
-1.8
3.3
11.0
-1.3
3.5
CS ETF (IE) on MSCI UK Large Cap Yearly or year-to-date performance respectively (Fund)MSCI UK Large Cap (NR) Yearly or year-to-date performance respectively (Benchmark)
Net performance in GBP 1)
1 month 3 months YTD 1 year 3 years 5 yearsFund -1.70 3.33 3.33 0.34 - -Reference Index -1.66 3.48 3.48 0.87 - -
Sectors in %
Energy 23.27Consumer Staples 19.23Financials 17.03Materials 12.51Health Care 9.51Telecommunication Services 8.40Utilities 4.62Consumer Discretionary 3.29Liquid Assets 0.09Others 2.06
Investment policyThe investment objective of the Fund is toreplicate the Reference Index (being the MSCIUK Large Cap (less fees and expenses of theFund)).The Reference Index is an equity indexof securities with a large market capitalisationgenerally incorporated in the United Kingdom.Securities listed on the London Stock Exchangeare eligible for inclusion.
Fund facts
Yes
Unit class currency GBP
Bloomberg ticker CSUKL SW
Net asset value (NAV) 82.35
Number of holdingsFund statistics
1 year 3 yearsAnnualized volatility in % 13.51 -Tracking Error (Ex post) 0.04 -Beta 1.00 -
Top 10 Holdings in %HSBC Holdings 8.00BP 7.08Vodafone 6.99Royal Dutch Shell 'A' 6.42GlaxoSmithKline 5.69British Am. Tobacco 5.01Royal Dutch Shell 'B' 4.74BG 3.97Rio Tinto 3.82BHP Billiton 3.26Total 54.98
Listing and Trading InformationExchange Listing Date Trading
CurrencyTrading Hours(Local Time)
Bloomberg Ticker Reuters RIC
SIX Swiss Exchange 03.07.2009 GBP 09:00 - 17:30 CSUKL SW CSUKL.SDeutsche Boerse 25.11.2009 EUR 09:00 - 17:30 SXRC GY SXRC00.DEBorsa Italiana 16.10.2009 EUR 09:00 - 17:25 CSUKL IM CSUKL.MILondon Stock Exchange 15.09.2010 GBx 08:00 - 16:30 CUKL LN CUKL.LEuronext 18.01.2011 EUR CUKL FP CUKL.PA
Source: Lipper, a Reuters Company
368
1) Historical performance indications and financial market scenarios are no guarantee for current or future performance. Performance indications do not consider commissions levied at subscription and/orredemption.
The disclaimer mentioned at the end of this document also applies to this page.
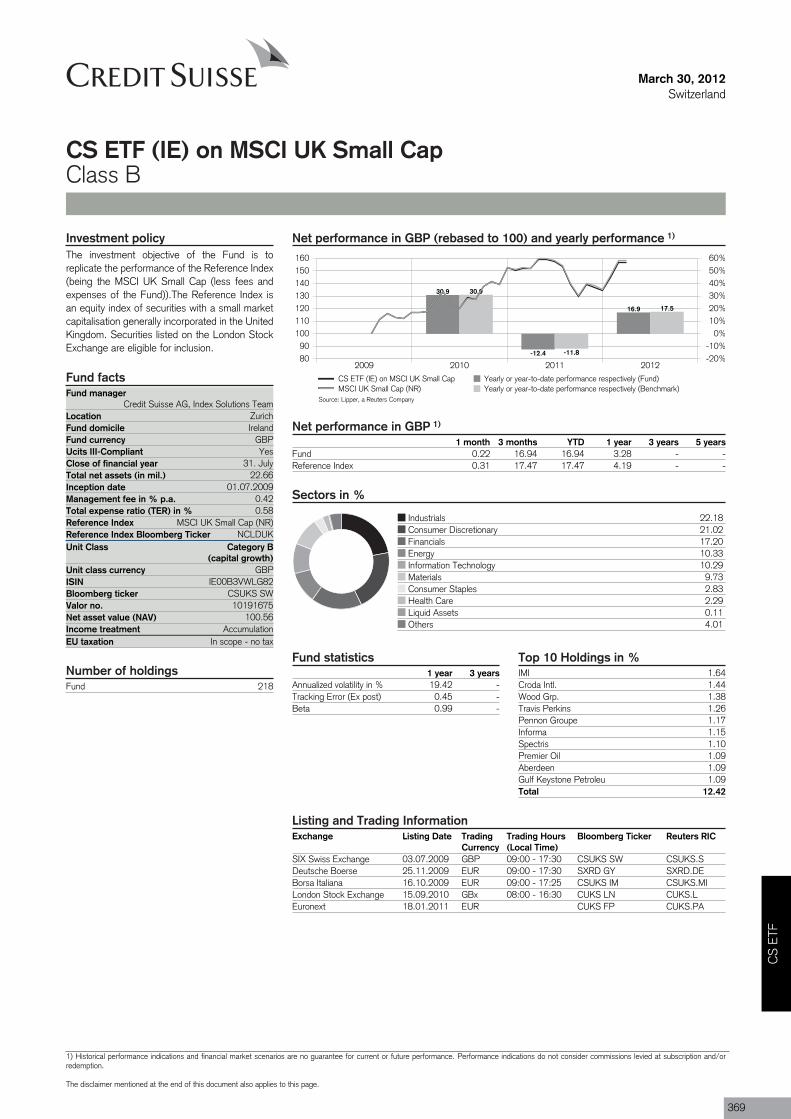
Fund managerCredit Suisse AG, Index Solutions Team
Location ZurichFund domicile IrelandFund currency GBPUcits III-CompliantClose of financial year 31. JulyTotal net assets (in mil.) 22.66Inception date 01.07.2009Management fee in % p.a. 0.42Total expense ratio (TER) in % 0.58Reference Index MSCI UK Small Cap (NR)Reference Index Bloomberg Ticker NCLDUKUnit Class Category B
(capital growth)
ISIN IE00B3VWLG82
Valor no. 10191675
Income treatment AccumulationEU taxation In scope - no tax
Fund 218
March 30, 2012Switzerland
CS ETF (IE) on MSCI UK Small CapClass B
Net performance in GBP (rebased to 100) and yearly performance 1)
2009 2010 2011 20128090
100110120130140150160
-20%-10%
0%10%20%30%40%50%60%
30.9
-12.4
16.9
30.9
-11.8
17.5
CS ETF (IE) on MSCI UK Small Cap Yearly or year-to-date performance respectively (Fund)MSCI UK Small Cap (NR) Yearly or year-to-date performance respectively (Benchmark)
Net performance in GBP 1)
1 month 3 months YTD 1 year 3 years 5 yearsFund 0.22 16.94 16.94 3.28 - -Reference Index 0.31 17.47 17.47 4.19 - -
Sectors in %
Industrials 22.18Consumer Discretionary 21.02Financials 17.20Energy 10.33Information Technology 10.29Materials 9.73Consumer Staples 2.83Health Care 2.29Liquid Assets 0.11Others 4.01
Investment policyThe investment objective of the Fund is toreplicate the performance of the Reference Index(being the MSCI UK Small Cap (less fees andexpenses of the Fund)).The Reference Index isan equity index of securities with a small marketcapitalisation generally incorporated in the UnitedKingdom. Securities listed on the London StockExchange are eligible for inclusion.
Fund facts
Yes
Unit class currency GBP
Bloomberg ticker CSUKS SW
Net asset value (NAV) 100.56
Number of holdingsFund statistics
1 year 3 yearsAnnualized volatility in % 19.42 -Tracking Error (Ex post) 0.45 -Beta 0.99 -
Top 10 Holdings in %IMI 1.64Croda Intl. 1.44Wood Grp. 1.38Travis Perkins 1.26Pennon Groupe 1.17Informa 1.15Spectris 1.10Premier Oil 1.09Aberdeen 1.09Gulf Keystone Petroleu 1.09Total 12.42
Listing and Trading InformationExchange Listing Date Trading
CurrencyTrading Hours(Local Time)
Bloomberg Ticker Reuters RIC
SIX Swiss Exchange 03.07.2009 GBP 09:00 - 17:30 CSUKS SW CSUKS.SDeutsche Boerse 25.11.2009 EUR 09:00 - 17:30 SXRD GY SXRD.DEBorsa Italiana 16.10.2009 EUR 09:00 - 17:25 CSUKS IM CSUKS.MILondon Stock Exchange 15.09.2010 GBx 08:00 - 16:30 CUKS LN CUKS.LEuronext 18.01.2011 EUR CUKS FP CUKS.PA
Source: Lipper, a Reuters Company
CS
ETF
1) Historical performance indications and financial market scenarios are no guarantee for current or future performance. Performance indications do not consider commissions levied at subscription and/orredemption.
The disclaimer mentioned at the end of this document also applies to this page.
369
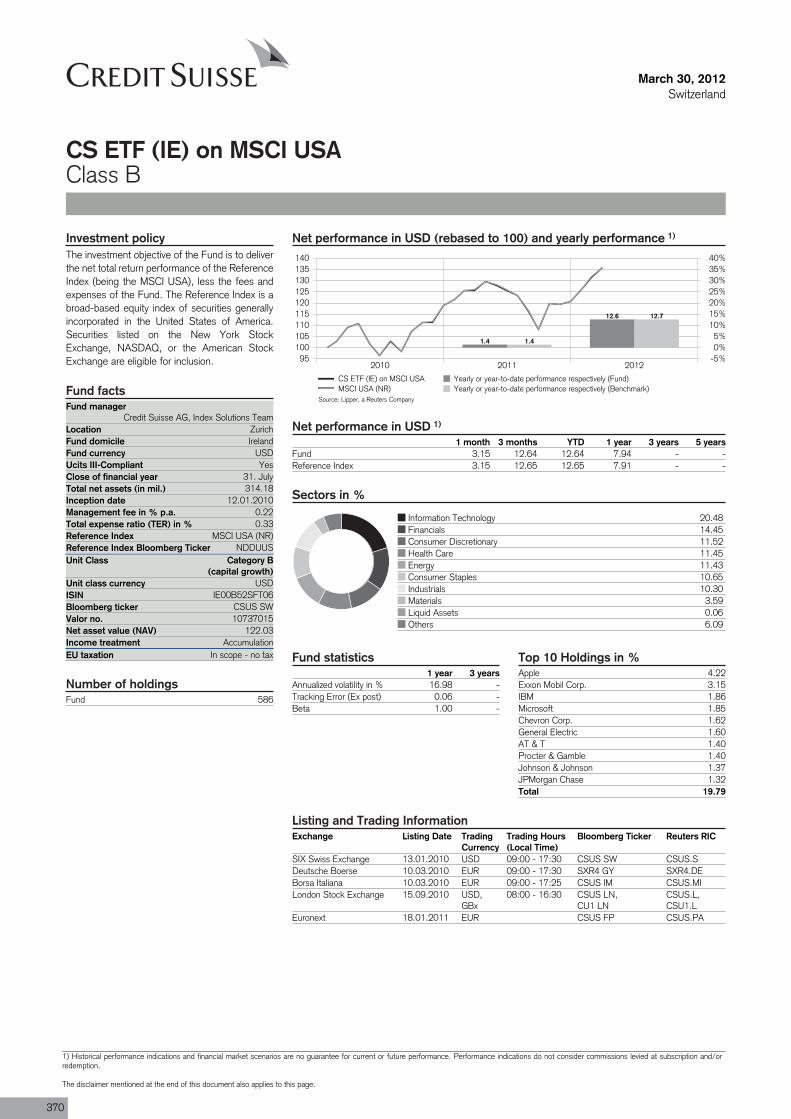
Fund managerCredit Suisse AG, Index Solutions Team
Location ZurichFund domicile IrelandFund currency USDUcits III-CompliantClose of financial year 31. JulyTotal net assets (in mil.) 314.18Inception date 12.01.2010Management fee in % p.a. 0.22Total expense ratio (TER) in % 0.33Reference Index MSCI USA (NR)Reference Index Bloomberg Ticker NDDUUSUnit Class Category B
(capital growth)
ISIN IE00B52SFT06
Valor no. 10737015
Income treatment AccumulationEU taxation In scope - no tax
Fund 586
March 30, 2012Switzerland
CS ETF (IE) on MSCI USAClass B
Net performance in USD (rebased to 100) and yearly performance 1)
2010 2011 201295
100105110115120125130135140
-5%0%5%
10%15%20%25%30%35%40%
1.4
12.6
1.4
12.7
CS ETF (IE) on MSCI USA Yearly or year-to-date performance respectively (Fund)MSCI USA (NR) Yearly or year-to-date performance respectively (Benchmark)
Net performance in USD 1)
1 month 3 months YTD 1 year 3 years 5 yearsFund 3.15 12.64 12.64 7.94 - -Reference Index 3.15 12.65 12.65 7.91 - -
Sectors in %
Information Technology 20.48Financials 14.45Consumer Discretionary 11.52Health Care 11.45Energy 11.43Consumer Staples 10.65Industrials 10.30Materials 3.59Liquid Assets 0.06Others 6.09
Investment policyThe investment objective of the Fund is to deliverthe net total return performance of the ReferenceIndex (being the MSCI USA), less the fees andexpenses of the Fund. The Reference Index is abroad-based equity index of securities generallyincorporated in the United States of America.Securities listed on the New York StockExchange, NASDAQ, or the American StockExchange are eligible for inclusion.
Fund facts
Yes
Unit class currency USD
Bloomberg ticker CSUS SW
Net asset value (NAV) 122.03
Number of holdings
Fund statistics1 year 3 years
Annualized volatility in % 16.98 -Tracking Error (Ex post) 0.06 -Beta 1.00 -
Top 10 Holdings in %Apple 4.22Exxon Mobil Corp. 3.15IBM 1.86Microsoft 1.85Chevron Corp. 1.62General Electric 1.60AT & T 1.40Procter & Gamble 1.40Johnson & Johnson 1.37JPMorgan Chase 1.32Total 19.79
Listing and Trading InformationExchange Listing Date Trading
CurrencyTrading Hours(Local Time)
Bloomberg Ticker Reuters RIC
SIX Swiss Exchange 13.01.2010 USD 09:00 - 17:30 CSUS SW CSUS.SDeutsche Boerse 10.03.2010 EUR 09:00 - 17:30 SXR4 GY SXR4.DEBorsa Italiana 10.03.2010 EUR 09:00 - 17:25 CSUS IM CSUS.MILondon Stock Exchange 15.09.2010 USD,
GBx08:00 - 16:30 CSUS LN,
CU1 LNCSUS.L,CSU1.L
Euronext 18.01.2011 EUR CSUS FP CSUS.PA
Source: Lipper, a Reuters Company
370
1) Historical performance indications and financial market scenarios are no guarantee for current or future performance. Performance indications do not consider commissions levied at subscription and/orredemption.
The disclaimer mentioned at the end of this document also applies to this page.
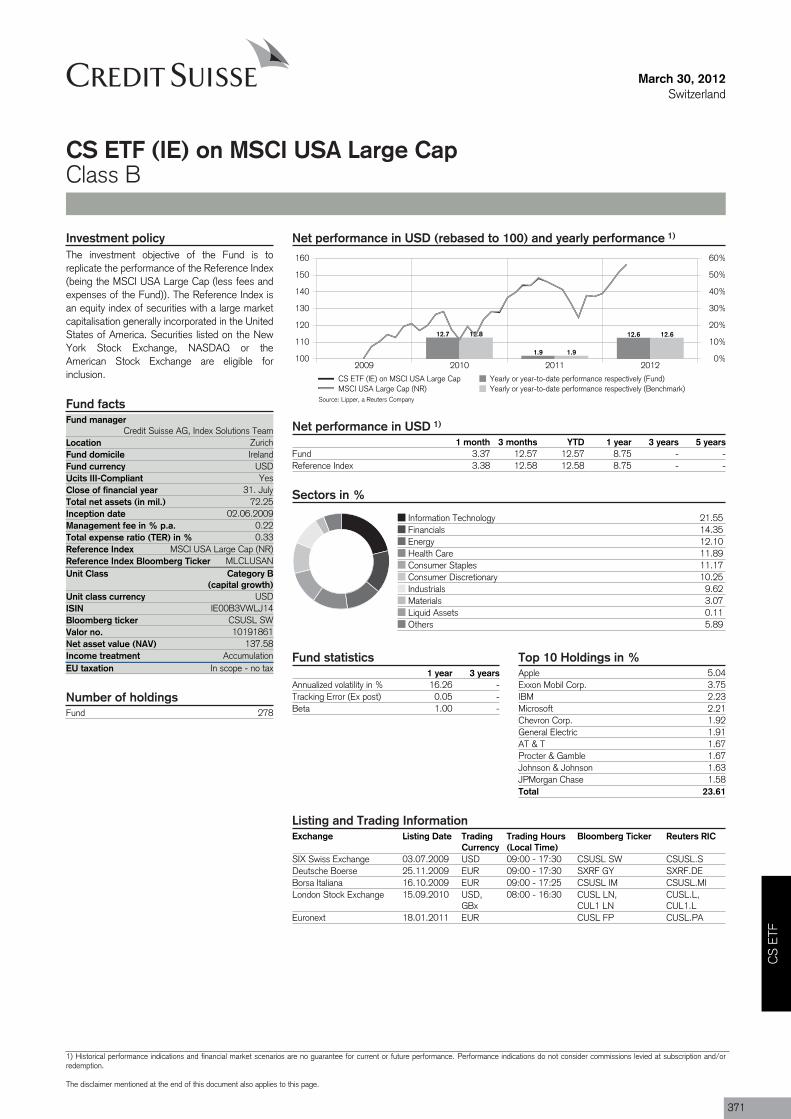
Fund managerCredit Suisse AG, Index Solutions Team
Location ZurichFund domicile IrelandFund currency USDUcits III-CompliantClose of financial year 31. JulyTotal net assets (in mil.) 72.25Inception date 02.06.2009Management fee in % p.a. 0.22Total expense ratio (TER) in % 0.33Reference Index MSCI USA Large Cap (NR)Reference Index Bloomberg Ticker MLCLUSANUnit Class Category B
(capital growth)
ISIN IE00B3VWLJ14
Valor no. 10191861
Income treatment AccumulationEU taxation In scope - no tax
Fund 278
March 30, 2012Switzerland
CS ETF (IE) on MSCI USA Large CapClass B
Net performance in USD (rebased to 100) and yearly performance 1)
2009 2010 2011 2012100
110
120
130
140
150
160
0%
10%
20%
30%
40%
50%
60%
12.7
1.9
12.612.8
1.9
12.6
CS ETF (IE) on MSCI USA Large Cap Yearly or year-to-date performance respectively (Fund)MSCI USA Large Cap (NR) Yearly or year-to-date performance respectively (Benchmark)
Net performance in USD 1)
1 month 3 months YTD 1 year 3 years 5 yearsFund 3.37 12.57 12.57 8.75 - -Reference Index 3.38 12.58 12.58 8.75 - -
Sectors in %
Information Technology 21.55Financials 14.35Energy 12.10Health Care 11.89Consumer Staples 11.17Consumer Discretionary 10.25Industrials 9.62Materials 3.07Liquid Assets 0.11Others 5.89
Investment policyThe investment objective of the Fund is toreplicate the performance of the Reference Index(being the MSCI USA Large Cap (less fees andexpenses of the Fund)). The Reference Index isan equity index of securities with a large marketcapitalisation generally incorporated in the UnitedStates of America. Securities listed on the NewYork Stock Exchange, NASDAQ or theAmerican Stock Exchange are eligible forinclusion.
Fund facts
Yes
Unit class currency USD
Bloomberg ticker CSUSL SW
Net asset value (NAV) 137.58
Number of holdings
Fund statistics1 year 3 years
Annualized volatility in % 16.26 -Tracking Error (Ex post) 0.05 -Beta 1.00 -
Top 10 Holdings in %Apple 5.04Exxon Mobil Corp. 3.75IBM 2.23Microsoft 2.21Chevron Corp. 1.92General Electric 1.91AT & T 1.67Procter & Gamble 1.67Johnson & Johnson 1.63JPMorgan Chase 1.58Total 23.61
Listing and Trading InformationExchange Listing Date Trading
CurrencyTrading Hours(Local Time)
Bloomberg Ticker Reuters RIC
SIX Swiss Exchange 03.07.2009 USD 09:00 - 17:30 CSUSL SW CSUSL.SDeutsche Boerse 25.11.2009 EUR 09:00 - 17:30 SXRF GY SXRF.DEBorsa Italiana 16.10.2009 EUR 09:00 - 17:25 CSUSL IM CSUSL.MILondon Stock Exchange 15.09.2010 USD,
GBx08:00 - 16:30 CUSL LN,
CUL1 LNCUSL.L,CUL1.L
Euronext 18.01.2011 EUR CUSL FP CUSL.PA
Source: Lipper, a Reuters Company
CS
ETF
1) Historical performance indications and financial market scenarios are no guarantee for current or future performance. Performance indications do not consider commissions levied at subscription and/orredemption.
The disclaimer mentioned at the end of this document also applies to this page.
371
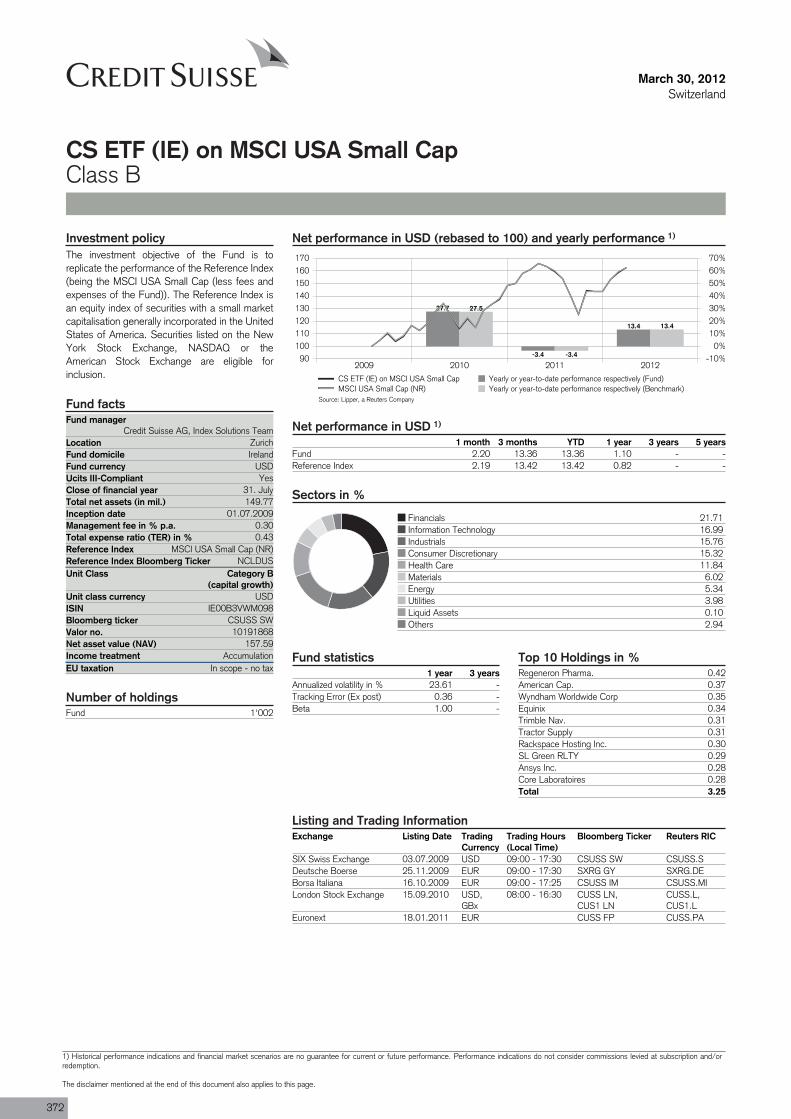
Fund managerCredit Suisse AG, Index Solutions Team
Location ZurichFund domicile IrelandFund currency USDUcits III-CompliantClose of financial year 31. JulyTotal net assets (in mil.) 149.77Inception date 01.07.2009Management fee in % p.a. 0.30Total expense ratio (TER) in % 0.43Reference Index MSCI USA Small Cap (NR)Reference Index Bloomberg Ticker NCLDUSUnit Class Category B
(capital growth)
ISIN IE00B3VWM098
Valor no. 10191868
Income treatment AccumulationEU taxation In scope - no tax
Fund 1'002
March 30, 2012Switzerland
CS ETF (IE) on MSCI USA Small CapClass B
Net performance in USD (rebased to 100) and yearly performance 1)
2009 2010 2011 201290
100110120130140150160170
-10%0%
10%20%30%40%50%60%70%
27.7
-3.4
13.4
27.5
-3.4
13.4
CS ETF (IE) on MSCI USA Small Cap Yearly or year-to-date performance respectively (Fund)MSCI USA Small Cap (NR) Yearly or year-to-date performance respectively (Benchmark)
Net performance in USD 1)
1 month 3 months YTD 1 year 3 years 5 yearsFund 2.20 13.36 13.36 1.10 - -Reference Index 2.19 13.42 13.42 0.82 - -
Sectors in %
Financials 21.71Information Technology 16.99Industrials 15.76Consumer Discretionary 15.32Health Care 11.84Materials 6.02Energy 5.34Utilities 3.98Liquid Assets 0.10Others 2.94
Investment policyThe investment objective of the Fund is toreplicate the performance of the Reference Index(being the MSCI USA Small Cap (less fees andexpenses of the Fund)). The Reference Index isan equity index of securities with a small marketcapitalisation generally incorporated in the UnitedStates of America. Securities listed on the NewYork Stock Exchange, NASDAQ or theAmerican Stock Exchange are eligible forinclusion.
Fund facts
Yes
Unit class currency USD
Bloomberg ticker CSUSS SW
Net asset value (NAV) 157.59
Number of holdings
Fund statistics1 year 3 years
Annualized volatility in % 23.61 -Tracking Error (Ex post) 0.36 -Beta 1.00 -
Top 10 Holdings in %Regeneron Pharma. 0.42American Cap. 0.37Wyndham Worldwide Corp 0.35Equinix 0.34Trimble Nav. 0.31Tractor Supply 0.31Rackspace Hosting Inc. 0.30SL Green RLTY 0.29Ansys Inc. 0.28Core Laboratoires 0.28Total 3.25
Listing and Trading InformationExchange Listing Date Trading
CurrencyTrading Hours(Local Time)
Bloomberg Ticker Reuters RIC
SIX Swiss Exchange 03.07.2009 USD 09:00 - 17:30 CSUSS SW CSUSS.SDeutsche Boerse 25.11.2009 EUR 09:00 - 17:30 SXRG GY SXRG.DEBorsa Italiana 16.10.2009 EUR 09:00 - 17:25 CSUSS IM CSUSS.MILondon Stock Exchange 15.09.2010 USD,
GBx08:00 - 16:30 CUSS LN,
CUS1 LNCUSS.L,CUS1.L
Euronext 18.01.2011 EUR CUSS FP CUSS.PA
Source: Lipper, a Reuters Company
372
1) Historical performance indications and financial market scenarios are no guarantee for current or future performance. Performance indications do not consider commissions levied at subscription and/orredemption.
The disclaimer mentioned at the end of this document also applies to this page.
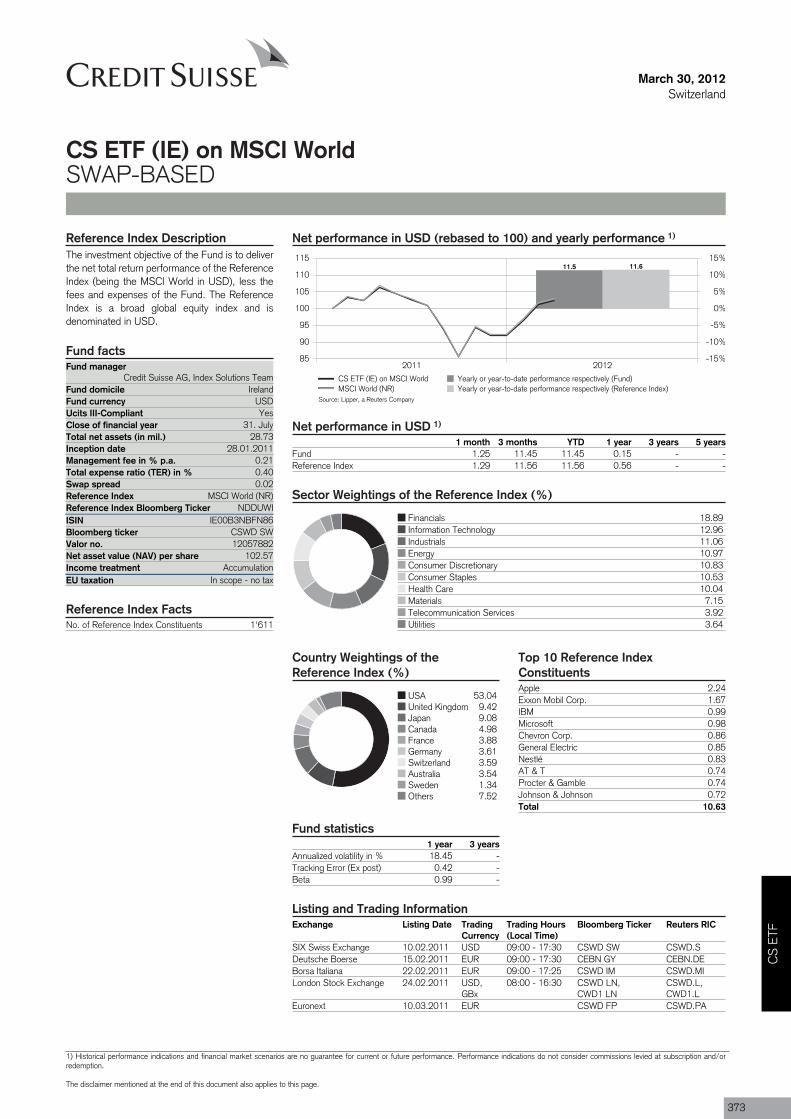
Fund managerCredit Suisse AG, Index Solutions Team
Fund domicile IrelandFund currency USDUcits III-CompliantClose of financial year 31. JulyTotal net assets (in mil.) 28.73Inception date 28.01.2011Management fee in % p.a. 0.21Total expense ratio (TER) in % 0.40Swap spread 0.02Reference Index MSCI World (NR)Reference Index Bloomberg Ticker NDDUWIISIN IE00B3NBFN86
Valor no. 12057882
Income treatment AccumulationEU taxation In scope - no tax
No. of Reference Index Constituents 1'611
March 30, 2012Switzerland
CS ETF (IE) on MSCI WorldSWAP-BASED
Net performance in USD (rebased to 100) and yearly performance 1)
2011 201285
90
95
100
105
110
115
-15%
-10%
-5%
0%
5%
10%
15%11.5 11.6
CS ETF (IE) on MSCI World Yearly or year-to-date performance respectively (Fund)MSCI World (NR) Yearly or year-to-date performance respectively (Reference Index)
Net performance in USD 1)
1 month 3 months YTD 1 year 3 years 5 yearsFund 1.25 11.45 11.45 0.15 - -Reference Index 1.29 11.56 11.56 0.56 - -
Sector Weightings of the Reference Index (%)
Financials 18.89Information Technology 12.96Industrials 11.06Energy 10.97Consumer Discretionary 10.83Consumer Staples 10.53Health Care 10.04Materials 7.15Telecommunication Services 3.92Utilities 3.64
Country Weightings of theReference Index (%)
USA 53.04United Kingdom 9.42Japan 9.08Canada 4.98France 3.88Germany 3.61Switzerland 3.59Australia 3.54Sweden 1.34Others 7.52
Reference Index DescriptionThe investment objective of the Fund is to deliverthe net total return performance of the ReferenceIndex (being the MSCI World in USD), less thefees and expenses of the Fund. The ReferenceIndex is a broad global equity index and isdenominated in USD.
Fund facts
Yes
Bloomberg ticker CSWD SW
Net asset value (NAV) per share 102.57
Reference Index Facts
Fund statistics1 year 3 years
Annualized volatility in % 18.45 -Tracking Error (Ex post) 0.42 -Beta 0.99 -
Top 10 Reference IndexConstituentsApple 2.24Exxon Mobil Corp. 1.67IBM 0.99Microsoft 0.98Chevron Corp. 0.86General Electric 0.85Nestlé 0.83AT & T 0.74Procter & Gamble 0.74Johnson & Johnson 0.72Total 10.63
Listing and Trading InformationExchange Listing Date Trading
CurrencyTrading Hours(Local Time)
Bloomberg Ticker Reuters RIC
SIX Swiss Exchange 10.02.2011 USD 09:00 - 17:30 CSWD SW CSWD.SDeutsche Boerse 15.02.2011 EUR 09:00 - 17:30 CEBN GY CEBN.DEBorsa Italiana 22.02.2011 EUR 09:00 - 17:25 CSWD IM CSWD.MILondon Stock Exchange 24.02.2011 USD,
GBx08:00 - 16:30 CSWD LN,
CWD1 LNCSWD.L,CWD1.L
Euronext 10.03.2011 EUR CSWD FP CSWD.PA
Source: Lipper, a Reuters Company
CS
ETF
1) Historical performance indications and financial market scenarios are no guarantee for current or future performance. Performance indications do not consider commissions levied at subscription and/orredemption.
The disclaimer mentioned at the end of this document also applies to this page.
373
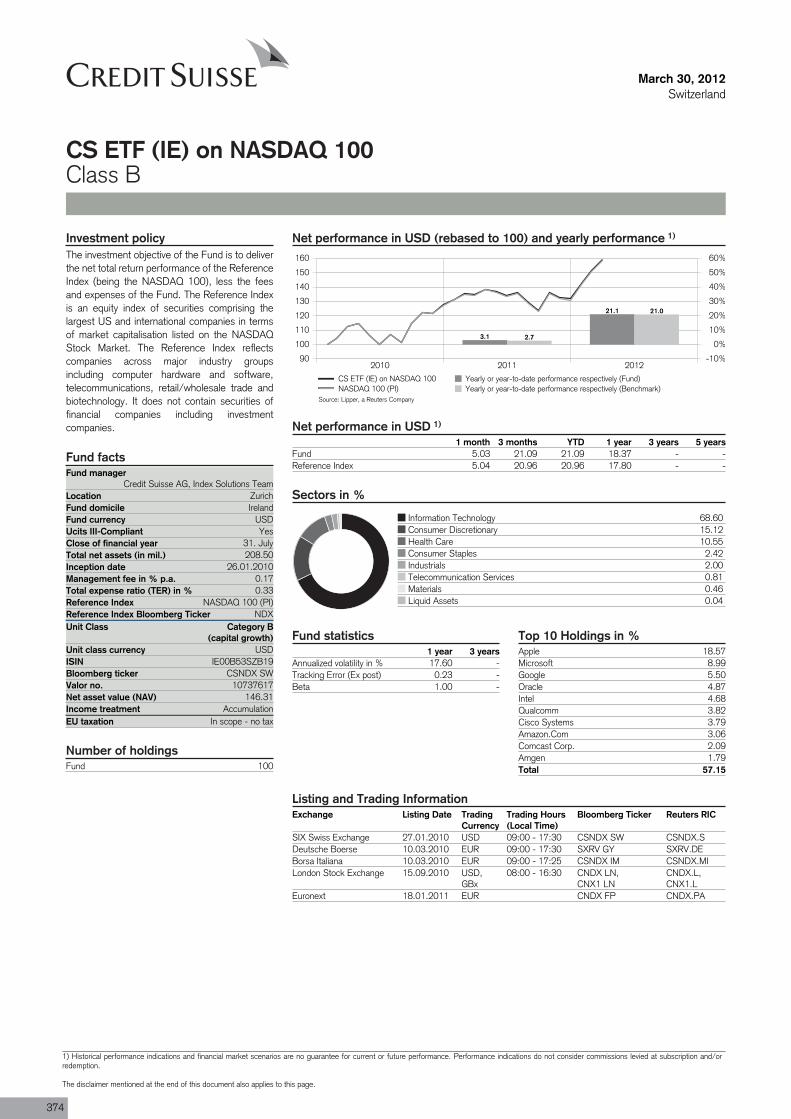
Fund managerCredit Suisse AG, Index Solutions Team
Location ZurichFund domicile IrelandFund currency USDUcits III-CompliantClose of financial year 31. JulyTotal net assets (in mil.) 208.50Inception date 26.01.2010Management fee in % p.a. 0.17Total expense ratio (TER) in % 0.33Reference Index NASDAQ 100 (PI)Reference Index Bloomberg Ticker NDXUnit Class Category B
(capital growth)
ISIN IE00B53SZB19
Valor no. 10737617
Income treatment AccumulationEU taxation In scope - no tax
Fund 100
March 30, 2012Switzerland
CS ETF (IE) on NASDAQ 100Class B
Net performance in USD (rebased to 100) and yearly performance 1)
2010 2011 201290
100
110
120
130
140
150
160
-10%
0%
10%
20%
30%
40%
50%
60%
3.1
21.1
2.7
21.0
CS ETF (IE) on NASDAQ 100 Yearly or year-to-date performance respectively (Fund)NASDAQ 100 (PI) Yearly or year-to-date performance respectively (Benchmark)
Net performance in USD 1)
1 month 3 months YTD 1 year 3 years 5 yearsFund 5.03 21.09 21.09 18.37 - -Reference Index 5.04 20.96 20.96 17.80 - -
Sectors in %
Information Technology 68.60Consumer Discretionary 15.12Health Care 10.55Consumer Staples 2.42Industrials 2.00Telecommunication Services 0.81Materials 0.46Liquid Assets 0.04
Investment policyThe investment objective of the Fund is to deliverthe net total return performance of the ReferenceIndex (being the NASDAQ 100), less the feesand expenses of the Fund. The Reference Indexis an equity index of securities comprising thelargest US and international companies in termsof market capitalisation listed on the NASDAQStock Market. The Reference Index reflectscompanies across major industry groupsincluding computer hardware and software,telecommunications, retail/wholesale trade andbiotechnology. It does not contain securities offinancial companies including investmentcompanies.
Fund facts
Yes
Unit class currency USD
Bloomberg ticker CSNDX SW
Net asset value (NAV) 146.31
Number of holdings
Fund statistics1 year 3 years
Annualized volatility in % 17.60 -Tracking Error (Ex post) 0.23 -Beta 1.00 -
Top 10 Holdings in %Apple 18.57Microsoft 8.99Google 5.50Oracle 4.87Intel 4.68Qualcomm 3.82Cisco Systems 3.79Amazon.Com 3.06Comcast Corp. 2.09Amgen 1.79Total 57.15
Listing and Trading InformationExchange Listing Date Trading
CurrencyTrading Hours(Local Time)
Bloomberg Ticker Reuters RIC
SIX Swiss Exchange 27.01.2010 USD 09:00 - 17:30 CSNDX SW CSNDX.SDeutsche Boerse 10.03.2010 EUR 09:00 - 17:30 SXRV GY SXRV.DEBorsa Italiana 10.03.2010 EUR 09:00 - 17:25 CSNDX IM CSNDX.MILondon Stock Exchange 15.09.2010 USD,
GBx08:00 - 16:30 CNDX LN,
CNX1 LNCNDX.L,CNX1.L
Euronext 18.01.2011 EUR CNDX FP CNDX.PA
Source: Lipper, a Reuters Company
374
1) Historical performance indications and financial market scenarios are no guarantee for current or future performance. Performance indications do not consider commissions levied at subscription and/orredemption.
The disclaimer mentioned at the end of this document also applies to this page.
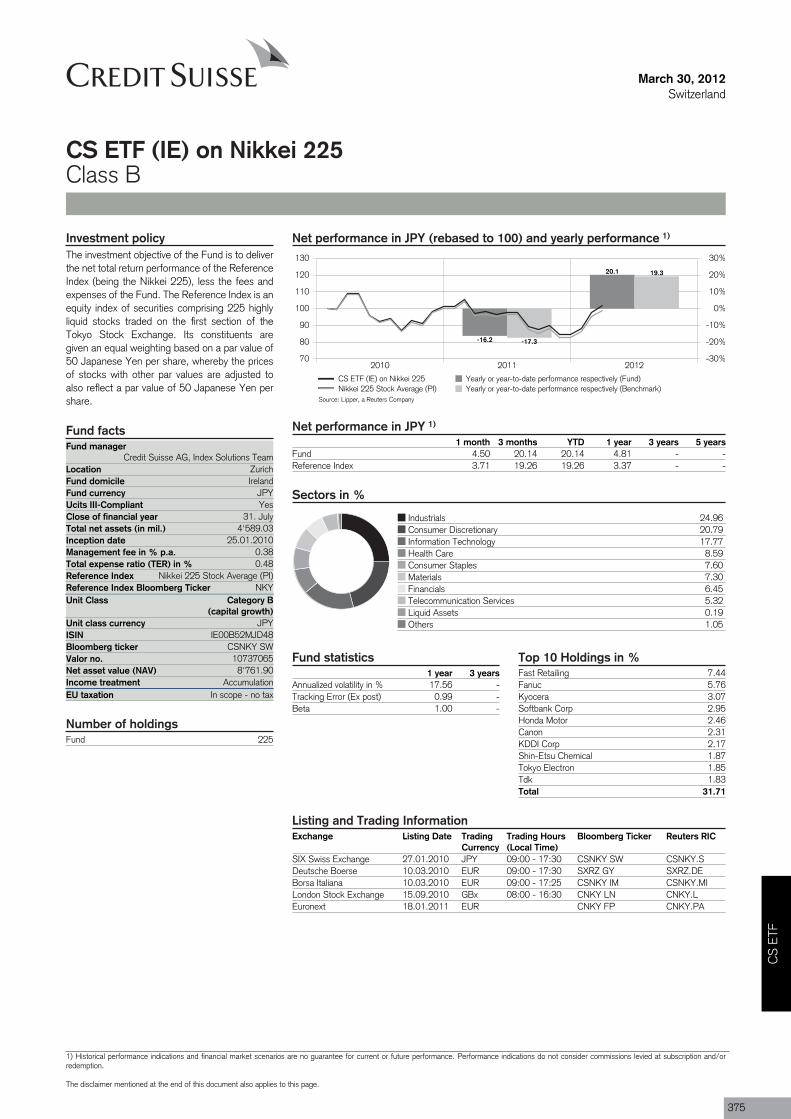
Fund managerCredit Suisse AG, Index Solutions Team
Location ZurichFund domicile IrelandFund currency JPYUcits III-CompliantClose of financial year 31. JulyTotal net assets (in mil.) 4'589.03Inception date 25.01.2010Management fee in % p.a. 0.38Total expense ratio (TER) in % 0.48Reference Index Nikkei 225 Stock Average (PI)Reference Index Bloomberg Ticker NKYUnit Class Category B
(capital growth)
ISIN IE00B52MJD48
Valor no. 10737065
Income treatment AccumulationEU taxation In scope - no tax
Fund 225
March 30, 2012Switzerland
CS ETF (IE) on Nikkei 225Class B
Net performance in JPY (rebased to 100) and yearly performance 1)
2010 2011 201270
80
90
100
110
120
130
-30%
-20%
-10%
0%
10%
20%
30%
-16.2
20.1
-17.3
19.3
CS ETF (IE) on Nikkei 225 Yearly or year-to-date performance respectively (Fund)Nikkei 225 Stock Average (PI) Yearly or year-to-date performance respectively (Benchmark)
Net performance in JPY 1)
1 month 3 months YTD 1 year 3 years 5 yearsFund 4.50 20.14 20.14 4.81 - -Reference Index 3.71 19.26 19.26 3.37 - -
Sectors in %
Industrials 24.96Consumer Discretionary 20.79Information Technology 17.77Health Care 8.59Consumer Staples 7.60Materials 7.30Financials 6.45Telecommunication Services 5.32Liquid Assets 0.19Others 1.05
Investment policyThe investment objective of the Fund is to deliverthe net total return performance of the ReferenceIndex (being the Nikkei 225), less the fees andexpenses of the Fund. The Reference Index is anequity index of securities comprising 225 highlyliquid stocks traded on the first section of theTokyo Stock Exchange. Its constituents aregiven an equal weighting based on a par value of50 Japanese Yen per share, whereby the pricesof stocks with other par values are adjusted toalso reflect a par value of 50 Japanese Yen pershare.
Fund facts
Yes
Unit class currency JPY
Bloomberg ticker CSNKY SW
Net asset value (NAV) 8'761.90
Number of holdings
Fund statistics1 year 3 years
Annualized volatility in % 17.56 -Tracking Error (Ex post) 0.99 -Beta 1.00 -
Top 10 Holdings in %Fast Retailing 7.44Fanuc 5.76Kyocera 3.07Softbank Corp 2.95Honda Motor 2.46Canon 2.31KDDI Corp 2.17Shin-Etsu Chemical 1.87Tokyo Electron 1.85Tdk 1.83Total 31.71
Listing and Trading InformationExchange Listing Date Trading
CurrencyTrading Hours(Local Time)
Bloomberg Ticker Reuters RIC
SIX Swiss Exchange 27.01.2010 JPY 09:00 - 17:30 CSNKY SW CSNKY.SDeutsche Boerse 10.03.2010 EUR 09:00 - 17:30 SXRZ GY SXRZ.DEBorsa Italiana 10.03.2010 EUR 09:00 - 17:25 CSNKY IM CSNKY.MILondon Stock Exchange 15.09.2010 GBx 08:00 - 16:30 CNKY LN CNKY.LEuronext 18.01.2011 EUR CNKY FP CNKY.PA
Source: Lipper, a Reuters Company
CS
ETF
1) Historical performance indications and financial market scenarios are no guarantee for current or future performance. Performance indications do not consider commissions levied at subscription and/orredemption.
The disclaimer mentioned at the end of this document also applies to this page.
375
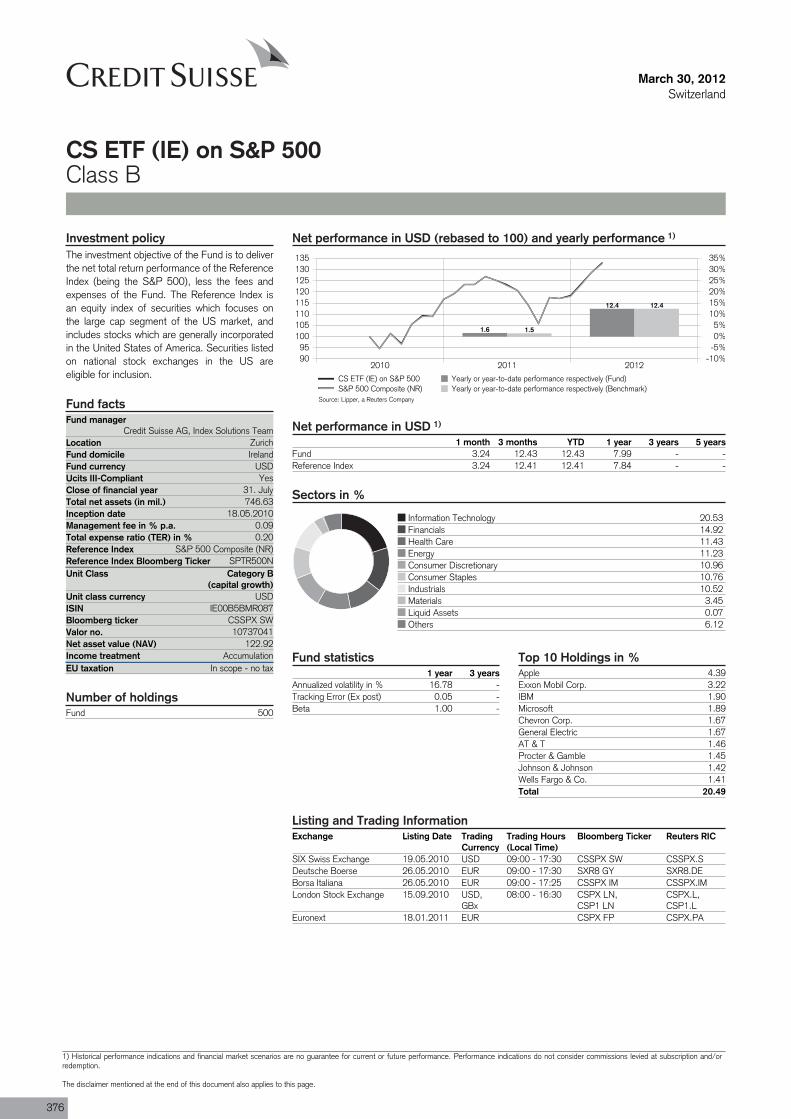
Fund managerCredit Suisse AG, Index Solutions Team
Location ZurichFund domicile IrelandFund currency USDUcits III-CompliantClose of financial year 31. JulyTotal net assets (in mil.) 746.63Inception date 18.05.2010Management fee in % p.a. 0.09Total expense ratio (TER) in % 0.20Reference Index S&P 500 Composite (NR)Reference Index Bloomberg Ticker SPTR500NUnit Class Category B
(capital growth)
ISIN IE00B5BMR087
Valor no. 10737041
Income treatment AccumulationEU taxation In scope - no tax
Fund 500
March 30, 2012Switzerland
CS ETF (IE) on S&P 500Class B
Net performance in USD (rebased to 100) and yearly performance 1)
2010 2011 20129095
100105110115120125130135
-10%-5%0%5%
10%15%20%25%30%35%
1.6
12.4
1.5
12.4
CS ETF (IE) on S&P 500 Yearly or year-to-date performance respectively (Fund)S&P 500 Composite (NR) Yearly or year-to-date performance respectively (Benchmark)
Net performance in USD 1)
1 month 3 months YTD 1 year 3 years 5 yearsFund 3.24 12.43 12.43 7.99 - -Reference Index 3.24 12.41 12.41 7.84 - -
Sectors in %
Information Technology 20.53Financials 14.92Health Care 11.43Energy 11.23Consumer Discretionary 10.96Consumer Staples 10.76Industrials 10.52Materials 3.45Liquid Assets 0.07Others 6.12
Investment policyThe investment objective of the Fund is to deliverthe net total return performance of the ReferenceIndex (being the S&P 500), less the fees andexpenses of the Fund. The Reference Index isan equity index of securities which focuses onthe large cap segment of the US market, andincludes stocks which are generally incorporatedin the United States of America. Securities listedon national stock exchanges in the US areeligible for inclusion.
Fund facts
Yes
Unit class currency USD
Bloomberg ticker CSSPX SW
Net asset value (NAV) 122.92
Number of holdings
Fund statistics1 year 3 years
Annualized volatility in % 16.78 -Tracking Error (Ex post) 0.05 -Beta 1.00 -
Top 10 Holdings in %Apple 4.39Exxon Mobil Corp. 3.22IBM 1.90Microsoft 1.89Chevron Corp. 1.67General Electric 1.67AT & T 1.46Procter & Gamble 1.45Johnson & Johnson 1.42Wells Fargo & Co. 1.41Total 20.49
Listing and Trading InformationExchange Listing Date Trading
CurrencyTrading Hours(Local Time)
Bloomberg Ticker Reuters RIC
SIX Swiss Exchange 19.05.2010 USD 09:00 - 17:30 CSSPX SW CSSPX.SDeutsche Boerse 26.05.2010 EUR 09:00 - 17:30 SXR8 GY SXR8.DEBorsa Italiana 26.05.2010 EUR 09:00 - 17:25 CSSPX IM CSSPX.IMLondon Stock Exchange 15.09.2010 USD,
GBx08:00 - 16:30 CSPX LN,
CSP1 LNCSPX.L,CSP1.L
Euronext 18.01.2011 EUR CSPX FP CSPX.PA
Source: Lipper, a Reuters Company
376
1) Historical performance indications and financial market scenarios are no guarantee for current or future performance. Performance indications do not consider commissions levied at subscription and/orredemption.
The disclaimer mentioned at the end of this document also applies to this page.
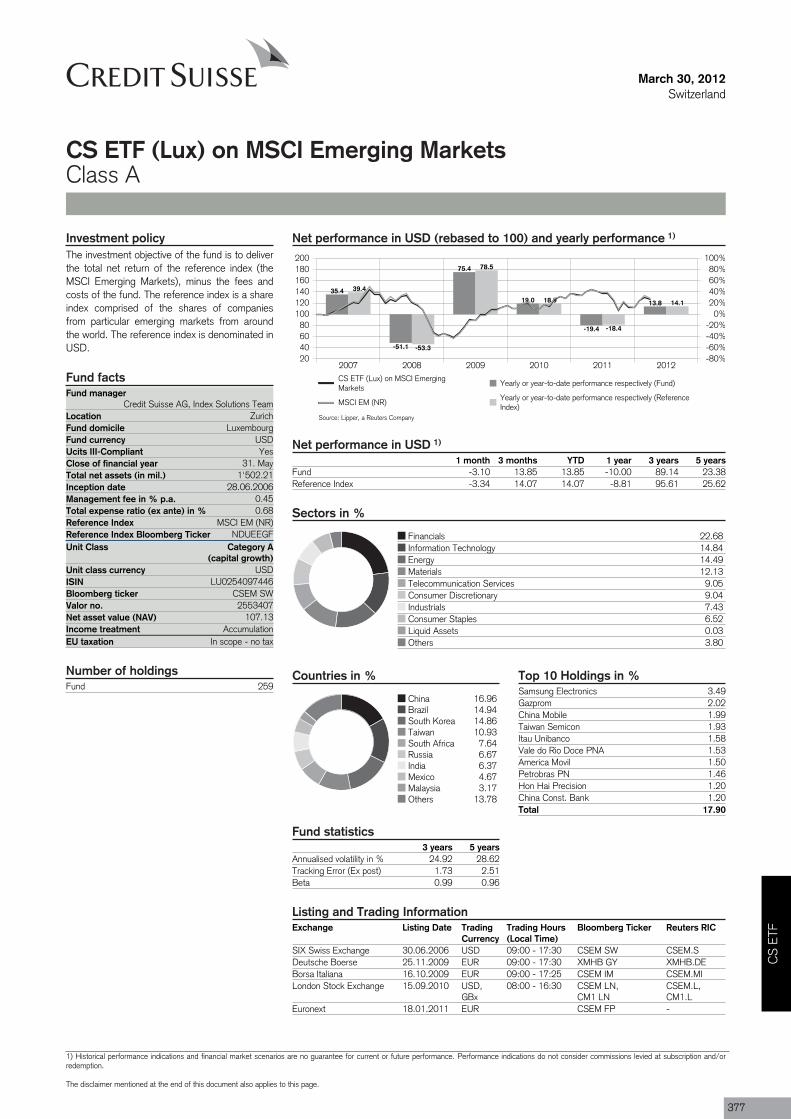
Fund managerCredit Suisse AG, Index Solutions Team
Location ZurichFund domicile LuxembourgFund currency USDUcits III-CompliantClose of financial year 31. MayTotal net assets (in mil.) 1'502.21Inception date 28.06.2006Management fee in % p.a. 0.45Total expense ratio (ex ante) in % 0.68Reference Index MSCI EM (NR)Reference Index Bloomberg Ticker NDUEEGFUnit Class Category A
(capital growth)
ISIN LU0254097446
Valor no. 2553407
Income treatment AccumulationEU taxation In scope - no tax
Fund 259
March 30, 2012Switzerland
CS ETF (Lux) on MSCI Emerging MarketsClass A
Net performance in USD (rebased to 100) and yearly performance 1)
2007 2008 2009 2010 2011 201220406080
100120140160180200
-80%-60%-40%-20%
0%20%40%60%80%
100%
35.4
-51.1
75.4
19.0
-19.4
13.8
39.4
-53.3
78.5
18.9
-18.4
14.1
CS ETF (Lux) on MSCI EmergingMarkets
Yearly or year-to-date performance respectively (Fund)
MSCI EM (NR)Yearly or year-to-date performance respectively (ReferenceIndex)
Net performance in USD 1)
1 month 3 months YTD 1 year 3 years 5 yearsFund -3.10 13.85 13.85 -10.00 89.14 23.38Reference Index -3.34 14.07 14.07 -8.81 95.61 25.62
Sectors in %
Financials 22.68Information Technology 14.84Energy 14.49Materials 12.13Telecommunication Services 9.05Consumer Discretionary 9.04Industrials 7.43Consumer Staples 6.52Liquid Assets 0.03Others 3.80
Countries in %
China 16.96Brazil 14.94South Korea 14.86Taiwan 10.93South Africa 7.64Russia 6.67India 6.37Mexico 4.67Malaysia 3.17Others 13.78
Investment policyThe investment objective of the fund is to deliverthe total net return of the reference index (theMSCI Emerging Markets), minus the fees andcosts of the fund. The reference index is a shareindex comprised of the shares of companiesfrom particular emerging markets from aroundthe world. The reference index is denominated inUSD.
Fund facts
Yes
Unit class currency USD
Bloomberg ticker CSEM SW
Net asset value (NAV) 107.13
Number of holdings
Fund statistics3 years 5 years
Annualised volatility in % 24.92 28.62Tracking Error (Ex post) 1.73 2.51Beta 0.99 0.96
Top 10 Holdings in %Samsung Electronics 3.49Gazprom 2.02China Mobile 1.99Taiwan Semicon 1.93Itau Unibanco 1.58Vale do Rio Doce PNA 1.53America Movil 1.50Petrobras PN 1.46Hon Hai Precision 1.20China Const. Bank 1.20Total 17.90
Listing and Trading InformationExchange Listing Date Trading
CurrencyTrading Hours(Local Time)
Bloomberg Ticker Reuters RIC
SIX Swiss Exchange 30.06.2006 USD 09:00 - 17:30 CSEM SW CSEM.SDeutsche Boerse 25.11.2009 EUR 09:00 - 17:30 XMHB GY XMHB.DEBorsa Italiana 16.10.2009 EUR 09:00 - 17:25 CSEM IM CSEM.MILondon Stock Exchange 15.09.2010 USD,
GBx08:00 - 16:30 CSEM LN,
CM1 LNCSEM.L,CM1.L
Euronext 18.01.2011 EUR CSEM FP -
Source: Lipper, a Reuters Company
CS
ETF
1) Historical performance indications and financial market scenarios are no guarantee for current or future performance. Performance indications do not consider commissions levied at subscription and/orredemption.
The disclaimer mentioned at the end of this document also applies to this page.
377
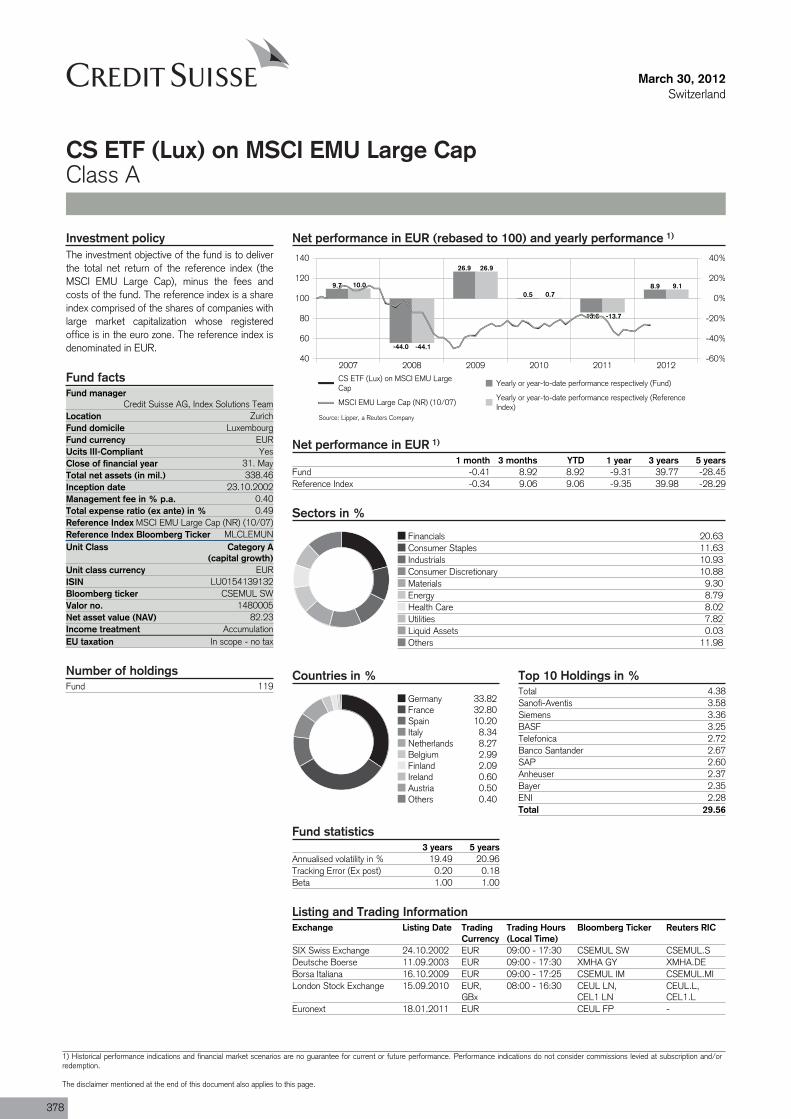
Fund managerCredit Suisse AG, Index Solutions Team
Location ZurichFund domicile LuxembourgFund currency EURUcits III-CompliantClose of financial year 31. MayTotal net assets (in mil.) 338.46Inception date 23.10.2002Management fee in % p.a. 0.40Total expense ratio (ex ante) in % 0.49Reference Index MSCI EMU Large Cap (NR) (10/07)Reference Index Bloomberg Ticker MLCLEMUNUnit Class Category A
(capital growth)
ISIN LU0154139132
Valor no. 1480005
Income treatment AccumulationEU taxation In scope - no tax
Fund 119
March 30, 2012Switzerland
CS ETF (Lux) on MSCI EMU Large CapClass A
Net performance in EUR (rebased to 100) and yearly performance 1)
2007 2008 2009 2010 2011 201240
60
80
100
120
140
-60%
-40%
-20%
0%
20%
40%
9.7
-44.0
26.9
0.5
-13.6
8.910.0
-44.1
26.9
0.7
-13.7
9.1
CS ETF (Lux) on MSCI EMU LargeCap
Yearly or year-to-date performance respectively (Fund)
MSCI EMU Large Cap (NR) (10/07)Yearly or year-to-date performance respectively (ReferenceIndex)
Net performance in EUR 1)
1 month 3 months YTD 1 year 3 years 5 yearsFund -0.41 8.92 8.92 -9.31 39.77 -28.45Reference Index -0.34 9.06 9.06 -9.35 39.98 -28.29
Sectors in %
Financials 20.63Consumer Staples 11.63Industrials 10.93Consumer Discretionary 10.88Materials 9.30Energy 8.79Health Care 8.02Utilities 7.82Liquid Assets 0.03Others 11.98
Countries in %
Germany 33.82France 32.80Spain 10.20Italy 8.34Netherlands 8.27Belgium 2.99Finland 2.09Ireland 0.60Austria 0.50Others 0.40
Investment policyThe investment objective of the fund is to deliverthe total net return of the reference index (theMSCI EMU Large Cap), minus the fees andcosts of the fund. The reference index is a shareindex comprised of the shares of companies withlarge market capitalization whose registeredoffice is in the euro zone. The reference index isdenominated in EUR.
Fund facts
Yes
Unit class currency EUR
Bloomberg ticker CSEMUL SW
Net asset value (NAV) 82.23
Number of holdings
Fund statistics3 years 5 years
Annualised volatility in % 19.49 20.96Tracking Error (Ex post) 0.20 0.18Beta 1.00 1.00
Top 10 Holdings in %Total 4.38Sanofi-Aventis 3.58Siemens 3.36BASF 3.25Telefonica 2.72Banco Santander 2.67SAP 2.60Anheuser 2.37Bayer 2.35ENI 2.28Total 29.56
Listing and Trading InformationExchange Listing Date Trading
CurrencyTrading Hours(Local Time)
Bloomberg Ticker Reuters RIC
SIX Swiss Exchange 24.10.2002 EUR 09:00 - 17:30 CSEMUL SW CSEMUL.SDeutsche Boerse 11.09.2003 EUR 09:00 - 17:30 XMHA GY XMHA.DEBorsa Italiana 16.10.2009 EUR 09:00 - 17:25 CSEMUL IM CSEMUL.MILondon Stock Exchange 15.09.2010 EUR,
GBx08:00 - 16:30 CEUL LN,
CEL1 LNCEUL.L,CEL1.L
Euronext 18.01.2011 EUR CEUL FP -
Source: Lipper, a Reuters Company
378
1) Historical performance indications and financial market scenarios are no guarantee for current or future performance. Performance indications do not consider commissions levied at subscription and/orredemption.
The disclaimer mentioned at the end of this document also applies to this page.
Fund managerCredit Suisse AG, Index Solutions Team
Location ZurichFund domicile LuxembourgFund currency EURUcits III-CompliantClose of financial year 31. MayTotal net assets (in mil.) 123.29Inception date 17.09.2007Management fee in % p.a. 0.40Total expense ratio (ex ante) in % 0.50Reference Index MSCI EMU Mid Cap (NR)Reference Index Bloomberg Ticker MMDLEMUNUnit Class Category A
(capital growth)
ISIN LU0312694234
Valor no. 3280326
Income treatment AccumulationEU taxation In scope - no tax
Fund 133
March 30, 2012Switzerland
CS ETF (Lux) on MSCI EMU Mid CapClass A
Net performance in EUR (rebased to 100) and yearly performance 1)
2007 2008 2009 2010 2011 201240
60
80
100
120
140
-60%
-40%
-20%
0%
20%
40%
-48.9
30.3
10.8
-20.5
13.1
-49.2
30.5
11.3
-20.3
13.2
CS ETF (Lux) on MSCI EMU Mid Cap Yearly or year-to-date performance respectively (Fund)MSCI EMU Mid Cap (NR) Yearly or year-to-date performance respectively (Reference Index)
Net performance in EUR 1)
1 month 3 months YTD 1 year 3 years 5 yearsFund 1.08 13.08 13.08 -13.29 45.09 -Reference Index 1.14 13.22 13.22 -13.03 46.46 -
Sectors in %
Industrials 22.31Consumer Discretionary 16.78Financials 14.39Materials 11.83Information Technology 9.78Consumer Staples 7.32Energy 5.38Health Care 4.50Liquid Assets 0.07Others 7.64
Countries in %
France 32.48Germany 12.51Netherlands 11.49Spain 10.45Finland 8.22Italy 7.54Belgium 6.90Ireland 3.06Austria 2.98Others 4.37
Investment policyThe investment objective of the fund is to deliverthe total net return of the reference index (theMSCI EMU Mid Cap), minus the fees and costsof the fund. The reference index is a share indexcomprised of the shares of companies withmedium market capitalization whose registeredoffice is in the euro zone. The reference index isdenominated in EUR.
Fund facts
Yes
Unit class currency EUR
Bloomberg ticker CSEMUM SW
Net asset value (NAV) 53.07
Number of holdings
Fund statistics1 year 3 years
Annualized volatility in % 20.04 20.47Tracking Error (Ex post) 0.07 0.15Beta 1.00 1.00
Top 10 Holdings in %Technip 2.41Infineon 2.30Koninklijke Dsm 1.84Reed Elsevier 1.81Legrand 1.70Publicis 1.65Sodexo 1.60SES 1.53Elan 1.51Vallourec 1.48Total 17.83
Listing and Trading InformationExchange Listing Date Trading
CurrencyTrading Hours(Local Time)
Bloomberg Ticker Reuters RIC
SIX Swiss Exchange 18.09.2007 EUR 09:00 - 17:30 CSEMUM SW CSEMUM.SDeutsche Boerse 18.08.2010 EUR 09:00 - 17:30 XMHC GY XMHC.DELondon Stock Exchange 15.09.2010 EUR,
GBx08:00 - 16:30 CEUM LN,
CEM1 LNCEUM.L,CEM1.L
Euronext 18.01.2011 EUR CEUM FP -
Source: Lipper, a Reuters Company
CS
ETF
1) Historical performance indications and financial market scenarios are no guarantee for current or future performance. Performance indications do not consider commissions levied at subscription and/orredemption.
The disclaimer mentioned at the end of this document also applies to this page.
379
Fund managerCredit Suisse AG, Index Solutions Team
Location ZurichFund domicile SwitzerlandFund currency USDUcits III-Compliant NoClose of financial year 31. MayTotal net assets (in mil.) 1'349.98Inception date 05.10.2009Management fee in % p.a. 0.30Total expense ratio (ex ante) in % 0.33Reference Index London Gold Fixing PMReference Index Bloomberg Ticker GOLDLNPMUnderlying approx. 1/10 ounceUnit Class Category A
(distribution)
ISIN CH0104136236
Valor no. 10413623
Income treatment distributionLast distribution 20.07.2010Distribution value 0.00
Gold bars with a standard weight of around 400 oz. and a purity of 995/1'000 or higher: 2'032
March 30, 2012Switzerland
CS ETF II (CH) on GoldClass A
Net performance in USD (rebased to 100) and yearly performance 1)
2009 2010 2011 2012100110120130140150160170180
0%10%20%30%40%50%60%70%80%
28.8
8.6 8.5
29.2
8.9 8.6
CS ETF II (CH) on Gold Yearly or year-to-date performance respectively (Fund)London Gold Fixing PM Yearly or year-to-date performance respectively (Benchmark)
Net performance in USD 1)
1 month 3 months YTD 1 year 3 years 5 yearsFund -6.10 8.51 8.51 15.15 - -Reference Index -6.07 8.59 8.59 15.53 - -
Investment policyThe Fund invests in physical gold without makinguse of commodity derivatives. The Fund´sinvestment objective is to replicate the return ofthe gold spot price less the fees and expenses ofthe Fund.
Fund facts
Unit class currency USD
Bloomberg ticker CSGOLD SW
Net asset value (NAV) 164.85
Stock of gold bars
Fund statistics1 year 3 years
Annualized volatility in % 28.73 -Tracking Error (Ex post) 0.01 -Beta 1.00 -
Listing and Trading InformationExchange Listing Date Trading
CurrencyTrading Hours(Local Time)
Bloomberg Ticker Reuters RIC
SIX Swiss Exchange 06.10.2009 USD 09:00 - 17:30 CSGOLD SW CSGOLD.S
Source: Lipper, a Reuters Company
380
1) Historical performance indications and financial market scenarios are no guarantee for current or future performance. Performance indications do not consider commissions levied at subscription and/orredemption.
The disclaimer mentioned at the end of this document also applies to this page.
Fund managerCredit Suisse AG, Index Solutions Team
Location ZurichFund domicile SwitzerlandFund currency CHFUcits III-Compliant NoClose of financial year 31. MayTotal net assets (in mil.) 584.58Inception date 05.10.2009Management fee in % p.a. 0.35Total expense ratio (ex ante) in % 0.39Reference Index
London Gold Fixing PM (Hedged into CHF)Reference Index Bloomberg Ticker GLDLNCHFUnderlying approx. 1/10 ounce
(without considering the currency hedge)Unit Class Category A
(distribution)
ISIN CH0104136285
Valor no. 10413628
Income treatment distributionLast distribution 20.07.2010Distribution value 0.00
Gold bars with a standard weight of around 400 oz. and a purity of 995/1'000 or higher: 965
March 30, 2012Switzerland
CS ETF II (CH) on Gold - hedged CHFClass A
Net performance in CHF (rebased to 100) and yearly performance 1)
2009 2010 2011 2012100110120130140150160170180
0%10%20%30%40%50%60%70%80%
27.0
6.1 8.1
28.1
8.0 8.2
CS ETF II (CH) on Gold - hedged CHF Yearly or year-to-date performance respectively (Fund)London Gold Fixing PM (Hedged into CHF) Yearly or year-to-date performance respectively (Benchmark)
Net performance in CHF 1)
1 month 3 months YTD 1 year 3 years 5 yearsFund -6.18 8.07 8.07 12.34 - -Reference Index -6.19 8.21 8.21 14.27 - -
Investment policyThe Fund invests in physical gold without makinguse of commodity derivatives. The Fund´sinvestment objective is to replicate the return ofthe gold spot price less the fees and expensesof the Fund. The US Dollar exposure of Gold ishedged into CHF.
Fund facts
Unit class currency CHF
Bloomberg ticker CSGLDC SW
Net asset value (NAV) 162.82
Stock of gold bars
Fund statistics1 year 3 years
Annualized volatility in % 28.79 -Tracking Error (Ex post) 0.72 -Beta 1.01 -
Listing and Trading InformationExchange Listing Date Trading
CurrencyTrading Hours(Local Time)
Bloomberg Ticker Reuters RIC
SIX Swiss Exchange 06.10.2009 CHF 09:00 - 17:30 CSGLDC SW CSGLDC.S
Source: Lipper, a Reuters Company
CS
ETF
1) Historical performance indications and financial market scenarios are no guarantee for current or future performance. Performance indications do not consider commissions levied at subscription and/orredemption.
The disclaimer mentioned at the end of this document also applies to this page.
381
Fund managerCredit Suisse AG, Index Solutions Team
Location ZurichFund domicile SwitzerlandFund currency EURUcits III-Compliant NoClose of financial year 31. MayTotal net assets (in mil.) 214.43Inception date 05.10.2009Management fee in % p.a. 0.35Total expense ratio (ex ante) in % 0.40Reference Index
London Gold Fixing PM (Hedged into EUR)Reference Index Bloomberg Ticker GLDLNEURUnderlying approx. 1/10 ounce
(without considering the currency hedge)Unit Class Category A
(distribution)
ISIN CH0104136319
Valor no. 10413631
Income treatment distributionLast distribution 20.07.2010Distribution value 0.00
Gold bars with a standard weight of around 400 oz. and a purity of 995/1'000 or higher: 429
March 30, 2012Switzerland
CS ETF II (CH) on Gold - hedged EURClass A
Net performance in EUR (rebased to 100) and yearly performance 1)
2009 2010 2011 2012100110120130140150160170180
0%10%20%30%40%50%60%70%80%
28.3
8.4 8.2
28.8
8.7 8.3
CS ETF II (CH) on Gold - hedged EUR Yearly or year-to-date performance respectively (Fund)London Gold Fixing PM (Hedged into EUR) Yearly or year-to-date performance respectively (Benchmark)
Net performance in EUR 1)
1 month 3 months YTD 1 year 3 years 5 yearsFund -6.14 8.22 8.22 14.62 - -Reference Index -6.15 8.30 8.30 15.02 - -
Investment policyThe Fund invests in physical gold without makinguse of commodity derivatives. The Fund´sinvestment objective is to replicate the return ofthe gold spot price less the fees and expensesof the Fund. The US Dollar exposure of Gold ishedged into EUR.
Fund facts
Unit class currency EUR
Bloomberg ticker CSGLDE SW
Net asset value (NAV) 111.35
Stock of gold bars
Fund statistics1 year 3 years
Annualized volatility in % 28.85 -Tracking Error (Ex post) 0.32 -Beta 1.00 -
Listing and Trading InformationExchange Listing Date Trading
CurrencyTrading Hours(Local Time)
Bloomberg Ticker Reuters RIC
SIX Swiss Exchange 06.10.2009 EUR 09:00 - 17:30 CSGLDE SW CSGLDE.S
Source: Lipper, a Reuters Company
382
1) Historical performance indications and financial market scenarios are no guarantee for current or future performance. Performance indications do not consider commissions levied at subscription and/orredemption.
The disclaimer mentioned at the end of this document also applies to this page.

383
Average remaining termThe average remaining term until maturity of the investmentscomprising a bond fund.
Annualized volatilityAnnualized volatility measures the risk of a fund. It describesthe range of returns most likely to be achieved. The biggerthe volatility, the greater the uncertainty regarding a fund'slikely return, and the riskier it is. Annualized volatility may becalculated by using the lognormal annualized standard deviationof a fund's return distribution.
BenchmarkIndex that serves as a basis of comparison when measuring afund’s performance. Benchmarks enable investors to comparethe performance of fund managers and to make a balanced,objective judgement.
BetaBeta is a factor describing the sensitivity of a fund's return to itsmarket index. Values below 1 indicate a defensive fund, whichmoves less in either direction than the expected return of theindex. Values greater than 1 indicate aggressive positioning anda beta value of 1 means that the fund is expected to move inline with market returns.
EU taxationOn July 1, 2005, the EU Savings Tax Directive came intoforce. It is applicable to cross-border interest payments toEU-domiciled natural persons (and associated products with aninterest component) – regardless of the country of domicileof the issuer of the interest-bearing securities (exception: theissuer's country of domicile is Switzerland).
The tax rates are staggered as follows:01.07.2005 – 30.06.2008: 15%07-01-2008 – 06-30-2011: 20%From 07-01-2011: 35%
A specialized identification system introduced by Credit Suissereveals the degree to which products are affected. A distinctionis drawn between the following designations:
Current tax classification with regard to EU taxation
In scope – tax: EU taxation applies to the product
In scope – no tax: No EU taxation, as the productmeets one of the exemption rules(e.g. grandfathered bonds, fundswith low taxable interest income)
In scope – tax exempt: No EU taxation, as the distributionsare also subject to Swisswithholding tax in the case offoreigners
Out of scope: No EU taxation
DistributionA “dividend” paid to unit holders, usually on a yearly basis, whichmay be made up of income derived from both the investmentfund and from realised capital gains. The amount of thedistribution is determined by the fund management.
Duration (modified duration)The duration shows the weighted-average term to maturity ofa bond’s cash flows (i.e. interest payments and repayments ofcapital). Duration is also a risk yardstick for bonds. When thelevel of interest payable changes by 1%, the expected pricechange of the bond corresponds approximately to the duration,expressed as a percentage.
Fund domicileThe place where the investment fund is domiciled. The funddomicile defines the law by which the fund is regulated and isespecially important for tax reasons.
Gross portfolio yieldThe Gross Portfolio Yield is the total yield of a portfolio beforethe deduction of fees. It is equal to the investment yield of thesecurities held in the portfolio.
Information ratioA fund’s outperformance can be attributed to the skill of theportfolio management or market moves. The higher theinformation ratio, the higher the contribution of manager skill.To determine the information ratio, the difference between theaverage annualized return of a fund and the average annualizedreturn of its benchmark is calculated and then divided by thetracking error of the two components.
Glossary
384
ISIN number (International Securities IdentificationNumber)Fund identification: International equivalent to the Swiss securitynumber.
Issuing commissionA commission charged to investors when they purchase units inthe fund.
Management feeRemuneration paid to the fund management company formanaging the fund. The management fee is expressed on anannual basis as a percentage of the fund’s assets and deductedfrom the fund’s assets on a proportionate daily basis.
Maximum drawdownThe maximum drawdown is the biggest downside pricemovement for the observed period of time.
Net asset valueThe NAV of a fund unit is the current market value of the fundon a particular reference date, less any liabilities, and divided bythe number of outstanding units. The NAV is usually calculatedand published on a daily basis (except for real estate funds).
Net portfolio returnWeighted average of returns upon maturity of all securitiescomprising a fund, after deduction of the fund managementfee.
Retail sales registrationThe fund is registered and can be sold in the retail markets ofthe listed countries.
Total returnTotal increase in value of an investment fund over a certainperiod of time, expressed as a percentage, and comprisingboth distributions and price gains. The cumulative return is thetotal return on the investment achieved over several years. Theaverage increase in value over 3 and 5 years is the averageannual performance over the last 36 and 60 months.
Tracking errorThe tracking error shows (in %) the deviation of the return of afund compared to the return of a benchmark over a fixed periodof time. A small tracking error indicates a passively managedportfolio.
Total expense ratio (TER)The TER shows the total costs of a fund in relation to the fundstotal assets and is expressed as a percentage. These costsinclude management fees, trading fees, legal fees, auditor feesand other operational expenses.
Info
rmat
ion
385
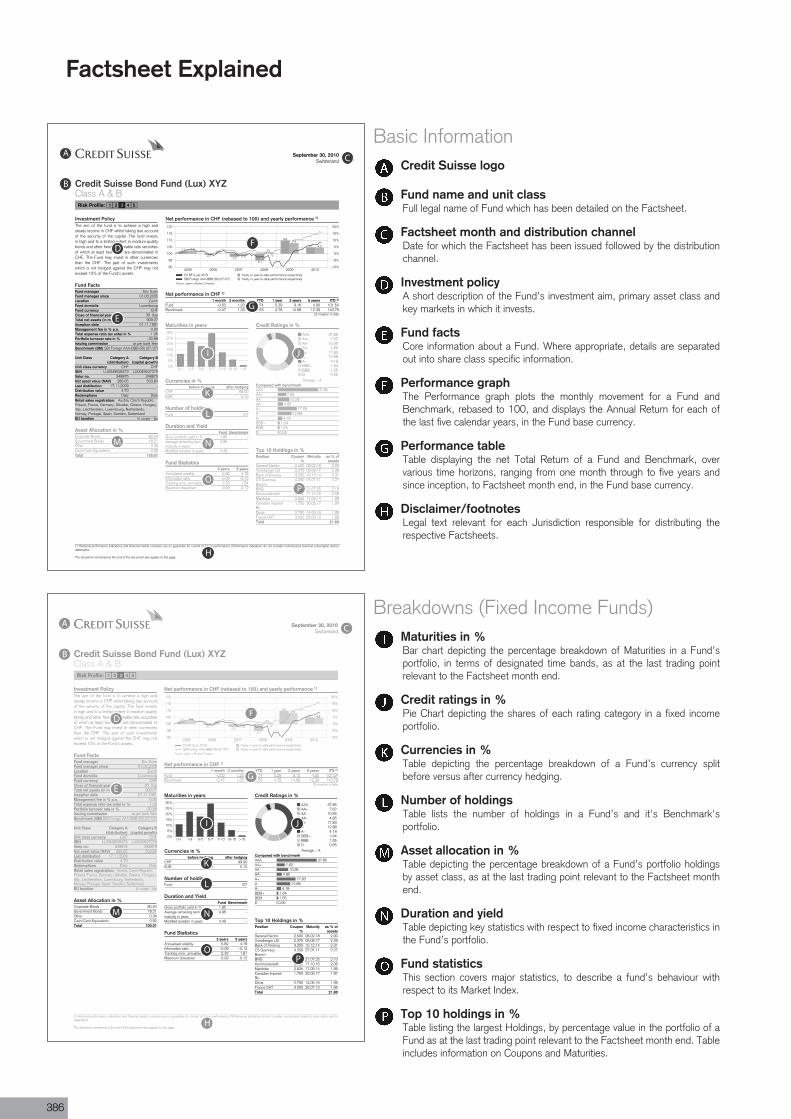
������������
��������
�������
���������
��� �
���������� ���������������������� �� ���������� �� �������������� � � ��������� ������������ !" ������������� ������ �����#
����� ������ �������������� �������� ��
���� ������ �� �� $%�#����$�&�'��%������������ �()� ���� ��***+(((�,-).�,�/�.
!� ������� �������"�� ��� #�� ��
�$�% �0��������&�������� ������
������ ��� #�� �� �����' ��� #�� ���(��� ���)���� ��� 1$�23)�� �������� ����� ��* *�%���$4�!5����-�#��2��4 ��2$��4� �$���4�6���$�34�6���$2�$�4�6�����4�"�� $�34)�$234���������%����4���������� 4�7�����2$��%47��8$34�9���� $24��#$��4��8����4��8��5��2$��+!���,�� �� )��%��#��+��$�
$���#��-./�0.1.�8��5��2$��
��� ��$� ����������������, �XYZ!2$%%�*�:�() ���2����* 1 0 - 3 4
%������������ ���5����#�������1.. �������������������� 1
�� �� �� �� �� ��
��
�
�
�
+;
+�;
;
�;
;
�;
�;
��
+��+���
+��
���
������
��
+�
�
���
���
!��( �,���.��'��( <�$�23����3�$�+��+�$���#��'���$������%#����=�23�()� ���� ��***+(((�,-).�,�/�. <�$�23����3�$�+��+�$���#��'���$������%#����=�23
%������������ ���5� 1
1������ -������� 67' 1���� -����� 4����� �7' 0
��� +�� ��� ���� ���� ��� ��� ���(�����$�& +��� ��� ���� ���� ���� ���� �����
�. ����#���������$��
����� � �� ������
;
�;
;
�;
�;
��;
�;
+ +� �+� �+� �+ +� >�
������ �� ���#������ � ������� �
!" ���� �����0- ��� �
��� ��)�� ��� ���
*** �����**? ����** ���**+ ����*? ����* ����*+ ���(((? ���((( ���1 ���
��������8 ���#�������*****?****+*?**+(((?(((1
7���1.�5��� ��� ���2�� � �� ������
������ �� �������
�����6����$2��2������ ��� ����� ���@��$�2��� ����( ����� ����� ����($�&��'�*�����$ ���� ���� ���!��6����%�3(�$���
���� ����� ����
(76 ��� ������ ��A������&����� ����� ���� ���B$�����$ ����� ����� ���!$�$��$��)�#���$2(&
��� ����� ���
1���$ ���� ����� ��� �$����C*D �� ������ ���7���� 01�9.
%��#��������� ��
'���� �������6 ������ ��������
6��%%�#���'�2���3��2�����; ��� +*=��$ �����$���� ���������$�����3����3�$�%
���� +
B���E������$��������3�$�% ���� +
�����$��� �� ��-����� 4�����
*���$2�%���=�2$��2��3 ���� ����)�'���$������$��� +�� +��D�$�&�� ������4�$���$2�%�� ���� ��B$��������$8��8� +�� +��
��(������2�� ��D�� $�� �' ��� '��� �% �� $����=� $ �� � $��%��$�3 ������ �� !" 8��2%� �$&�� ��� $�������' ��� %������3 �' ��� �$#��$2� D�� '��� ��=�%�%�� �� � $�� �� $ 2������ ������ �� ������ F�$2��3����% $�� ����� E��� $�� =$��$�2� �$�� %��������%�' 8���� $� 2�$%� �8�+�����% $�� �������$��� ��!" � D�� ��� �$3 ��=�%� �� ����� ���������%��$� ��� !" � D�� #$�� �' %��� ��=�%�����%8���� �% ��� ��� �� $ $��%� ��� !" �$3 ����������;��'����� ���G%�$%%��%�
����������
7��������������� ��� �� ����
7�����,������� ���,���� � ��� ��2������ �������(������ ��� +����
������������ ������8��
!� ��������������� !" !" �0�������
������%�������(�����%"& ������ �����
++
1$�23
"����"������ ��� ���!��#��$���(���% ����6�=��������(���% ���C���� ���!$%�/!$%���F��=$2���% ���7���� 1..�.1
������H���##��4�$�-�����%�!��#$�3
*=��$ ��I�*
. "�%�����$2 #��'���$��� �����$����% $�� E�$���$2 �$�&�� %���$���% $�� �� �$�$���� '�� ������� �' '����� #��'���$���� 9��'���$��� �����$����% �� ��� ���%���� �����%%���% 2�=��� $� %��%���#���� $��/�������#�����
D�����%�2$���������������$�����������'����%����������$2%��$##2��%�������%�#$ ��
A
B
C
D
E
F
G
H
I J
K
L
M N
OP
������������
��������
�������
���������
��� �
����� � �� ������
;
�;
;
�;
�;
��;
�;
+ +� �+� �+� �+ +� >�
������ �� ���#������ � ������� �
!" �����0- �
��� ��)�� ��� ���
*** �����**? ����** ���**+ ����? ����
* ����*+ ���(((? ���((( ���1 ���
��������8 ���#�������*****?****+*?**+(((?(((1
7���1.�5��� ��� ���2�� � �� ������
������ �� �������
�����6����$2��2������ ��� ����� ���@��$�2��� ����( ����� ����� ����($�&��'�*�����$ ���� ���� ���!��6����%�3(�$���
���� ����� ����
(76 ������ ��A������&����� ����� ���� ���B$�����$ ����� ����� ���!$�$��$��)�#���$2(&
��� ����� ���
1���$ ���� ����� ��� �$����C*D �� ������ ���7���� 01�9.
%��#��������� ��
'���� �������6 ������ ��������
6��%%�#���'�2���3��2�����; ��� +*=��$ �����$���� ��������$�����3����3�$�%
���� +
B���E������$��������3�$�% ���� +
�����$��� �� ��-����� 4�����
*���$2�%���=�2$��2��3 ���� ����)�'���$������$��� +�� +��D�$�&�� ������4�$���$2�%�� ���� ��B$��������$8��8� +�� +��
*=��$ ��I�*
I J
K
L
N
OP
"����"������ ��� ���!��#��$���(���% ����6�=��������(���% ���C���� ���!$%�/!$%���F��=$2���% ���7���� 1..�.1
M
������������
��������
�������
���������
��� �
���������� ���������������������� �� ���������� �� �������������� � � ��������� ������������ !" ������������� ������ �����#
����� ������ �������������� �������� ��
���� ������ �� �� $%�#����$�&�'��%������������ �()� ���� ��***+(((�,-).�,�/�.
!� ������� �������"�� ��� #�� ��
�$�% �0��������&�������� ������
������ ��� #�� �� �����' ��� #�� ���(��� ���)���� ��� 1$�23)�� �������� ����� ��* *�%���$4�!5����-�#��2��4 ��2$��4� �$���4�6���$�34�6���$2�$�4�6�����4�"�� $�34)�$234���������%����4���������� 4�7�����2$��%47��8$34�9���� $24��#$��4��8����4��8��5��2$��+!���,�� �� )��%��#��+��$�
$���#��-./�0.1.�8��5��2$��
��� ��$� ����������������, �$��!2$%%�*�:�() ���2����* 1 0 - 3 4
%������������ ���5����#�������1.. �������������������� 1
�� �� �� �� �� ��
��
�
�
�
+;
+�;
;
�;
;
�;
�;
��
+��+���
+��
���
������
��
+�
�
���
���
!��( �,���.��'��( <�$�23����3�$�+��+�$���#��'���$������%#����=�23�()� ���� ��***+(((�,-).�,�/�. <�$�23����3�$�+��+�$���#��'���$������%#����=�23
%������������ ���5� 1
1������ -������� 67' 1���� -����� 4����� �7' 0
��� +�� ��� ���� ���� ��� ��� ���(�����$�& +��� ��� ���� ���� ���� ���� �����
�. ����#���������$��
����� � �� ������
;
�;
;
�;
�;
��;
�;
+ +� �+� �+� �+ +� >�
������ �� ���#������ � ������� �
!" ���� �����0- ��� �
��� ��)�� ��� ���
*** �����**? ����** ���**+ ����*? ����* ����*+ ���(((? ���((( ���1 ���
��������8 ���#�������*****?****+*?**+(((?(((1
7���1.�5��� ��� ���2�� � �� ������
������ �� �������
�����6����$2��2������ ��� ����� ���@��$�2��� ����( ����� ����� ����($�&��'�*�����$ ���� ���� ���!��6����%�3(�$���
���� ����� ����
(76 ��� ������ ��A������&����� ����� ���� ���B$�����$ ����� ����� ���!$�$��$��)�#���$2(&
��� ����� ���
1���$ ���� ����� ��� �$����C*D �� ������ ���7���� 01�9.
%��#��������� ��
'���� �������6 ������ ��������
6��%%�#���'�2���3��2�����; ��� +*=��$ �����$���� ���������$�����3����3�$�%
���� +
B���E������$��������3�$�% ���� +
�����$��� �� ��-����� 4�����
*���$2�%���=�2$��2��3 ���� ����)�'���$������$��� +�� +��D�$�&�� ������4�$���$2�%�� ���� ��B$��������$8��8� +�� +��
��(������2�� ��D�� $�� �' ��� '��� �% �� $����=� $ �� � $��%��$�3 ������ �� !" 8��2%� �$&�� ��� $�������' ��� %������3 �' ��� �$#��$2� D�� '��� ��=�%�%�� �� � $�� �� $ 2������ ������ �� ������ F�$2��3����% $�� ����� E��� $�� =$��$�2� �$�� %��������%�' 8���� $� 2�$%� �8�+�����% $�� �������$��� ��!" � D�� ��� �$3 ��=�%� �� ����� ���������%��$� ��� !" � D�� #$�� �' %��� ��=�%�����%8���� �% ��� ��� �� $ $��%� ��� !" �$3 ����������;��'����� ���G%�$%%��%�
����������
7��������������� ��� �� ����
7�����,������� ���,���� � ��� ��2������ �������(������ ��� +����
������������ ������8��
!� ��������������� !" !" �0�������
������%�������(�����%"& ������ �����
++
1$�23
"����"������ ��� ���!��#��$���(���% ����6�=��������(���% ���C���� ���!$%�/!$%���F��=$2���% ���7���� 1..�.1
������H���##��4�$�-�����%�!��#$�3
*=��$ ��I�*
. "�%�����$2 #��'���$��� �����$����% $�� E�$���$2 �$�&�� %���$���% $�� �� �$�$���� '�� ������� �' '����� #��'���$���� 9��'���$��� �����$����% �� ��� ���%���� �����%%���% 2�=��� $� %��%���#���� $��/�������#�����
D�����%�2$���������������$�����������'����%����������$2%��$##2��%�������%�#$ ��
A
B
C
D
E
F
G
H
I J
K
L
M N
OP
%������������ ���5����#�������1.. �������������������� 1
�� �� �� �� �� ��
��
�
�
�
+;
+�;
;
�;
;
�;
�;
��
+��+���
+��
���
������
��
+�
�
���
������
!��( �,���.��'��( <�$�23����3�$�+��+�$���#��'���$������%#����=�23�()� ���� ��***+(((�,-).�,�/�. <�$�23����3�$�+��+�$���#��'���$������%#����=�23
%������������ ���5� 1
1������ -������� 67' 1���� -����� 4����� �7' 0
��� +�� ��� ���� ���� ��� ��� ���(�����$�& +��� ��� ���� ���� ���� ���� �����
�. ����#���������$��
������H���##��4�$�-�����%�!��#$�3
F
G
���������� ����������������������� �� ���������� �� �������������� � � ��������� ������������ !" ������������� ������ �����#
����� ������ �������������� �������� ��
���� ������ �� �� $%�#����$�&�'��%������������ �()� ���� ��***+(((�,-).�,�/�.
!� ������� �������"�� ��� #�� ��
�$�% �0��������&�������� ������
������ ��� #�� �� �����' ��� #�� ���(��� ���)���� ��� 1$�23)�� �������� ����� ��* *�%���$4�!5����-�#��2��4 ��2$��4� �$���4�6���$�34�6���$2�$�4�6�����4�"�� $�34)�$234���������%����4���������� 4�7�����2$��%47��8$34�9���� $24��#$��4��8����4��8��5��2$��+!���,�� �� )��%��#��+��$�
��(������2�� ��D�� $�� �' ��� '��� �% �� $����=� $ �� � $��%��$�3 ������ �� !" 8��2%� �$&�� ��� $�������' ��� %������3 �' ��� �$#��$2� D�� '��� ��=�%�%�� �� � $�� �� $ 2������ ������ �� ������ F�$2��3����% $�� ����� E��� $�� =$��$�2� �$�� %��������%�' 8���� $� 2�$%� �8�+�����% $�� �������$��� ��!" � D�� ��� �$3 ��=�%� �� ����� ���������%��$� ��� !" � D�� #$�� �' %��� ��=�%�����%8���� �% ��� ��� �� $ $��%� ��� !" �$3 ����������;��'����� ���G%�$%%��%�
����������
7��������������� ��� ����
7�����,������� ���,���� � ��� ��2������ �������(������ ��� +����
������������ ������8��
!� ��������������� !" !" �0�������
������%�������(�����%"& ������ �����
++
1$�23
D
E
$���#��-./�0.1.�8��5��2$��
��� ��$� ����������������, �XYZ!2$%%�*�:�() ���2����* 1 0 - 3 4
A
B
C
. "�%�����$2 #��'���$��� �����$����% $�� E�$���$2 �$�&�� %���$���% $�� �� �$�$���� '�� ������� �' '����� #��'���$���� 9��'���$��� �����$����% �� ��� ���%���� �����%%���% 2�=��� $� %��%���#���� $��/�������#�����
D�����%�2$���������������$�����������'����%����������$2%��$##2��%�������%�#$ ��H
##FLUX_EMBED_PDF##c:\temp\Flux.Cache\160ad5bfb8f442858647ec09ca2c235e.pdf[1;False]##FLUX_EMBED_PDF##
Factsheet Explained
Basic InformationCredit Suisse logo
Fund name and unit classFull legal name of Fund which has been detailed on the Factsheet.
Factsheet month and distribution channelDate for which the Factsheet has been issued followed by the distributionchannel.
Investment policyA short description of the Fund’s investment aim, primary asset class andkey markets in which it invests.
Fund factsCore information about a Fund. Where appropriate, details are separatedout into share class specific information.
Performance graphThe Performance graph plots the monthly movement for a Fund andBenchmark, rebased to 100, and displays the Annual Return for each ofthe last five calendar years, in the Fund base currency.
Performance tableTable displaying the net Total Return of a Fund and Benchmark, overvarious time horizons, ranging from one month through to five years andsince inception, to Factsheet month end, in the Fund base currency.
Disclaimer/footnotesLegal text relevant for each Jurisdiction responsible for distributing therespective Factsheets.
Breakdowns (Fixed Income Funds)Maturities in %Bar chart depicting the percentage breakdown of Maturities in a Fund’sportfolio, in terms of designated time bands, as at the last trading pointrelevant to the Factsheet month end.
Credit ratings in %Pie Chart depicting the shares of each rating category in a fixed incomeportfolio.
Currencies in %Table depicting the percentage breakdown of a Fund’s currency splitbefore versus after currency hedging.
Number of holdingsTable lists the number of holdings in a Fund’s and it's Benchmark'sportfolio.
Asset allocation in %Table depicting the percentage breakdown of a Fund’s portfolio holdingsby asset class, as at the last trading point relevant to the Factsheet monthend.
Duration and yieldTable depicting key statistics with respect to fixed income characteristics inthe Fund’s portfolio.
Fund statisticsThis section covers major statistics, to describe a fund’s behaviour withrespect to its Market Index.
Top 10 holdings in %Table listing the largest Holdings, by percentage value in the portfolio of aFund as at the last trading point relevant to the Factsheet month end. Tableincludes information on Coupons and Maturities.
386
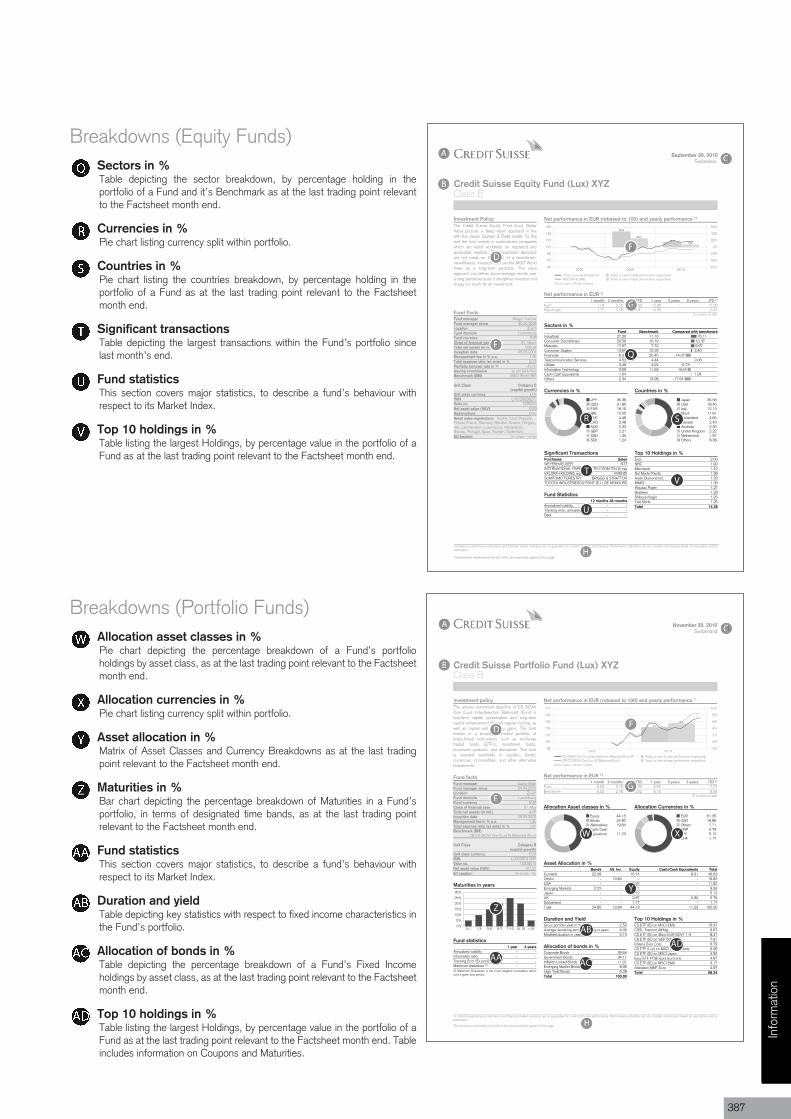
�����������������
��������
�������
�������
�������� ��� �J��������� ���������������������� ������������������� ���������!��"��#$ � ��!����������%������J &��""��:�����������J������!�������!�������,����.�!���������
�� ���� ��� "�#$'����()*�#+�� ���� ������ � �����,���������� -.��)*�� ��������� �./#01'.�$�� ������ �� �����������: � �������� �����(�)*������ ���������� ����� ,������ ����� ���� ������,����� ��� ����� ������� ���,������;� ���������;�� � �� �� ,���
����� ����������� (���#��1(2K�3##�� ���������� ����� '�+4�,��.
� �������� ���������������������<��
��� ����,����,�,=����� �� �,��,�
������ � !(�+5 �������������������� ! �.�6��(7��8#)*��#�.1+�)7%�2+(247�%�(2)#7�"#�0(257�"�1�(+6(�7�"�##)#7��.2$(�57�6(+57���#)*6#2�6#�27��./#01'.�$7��#6*#�+(24�7�'�9(57��'�6.$(+7���(�27��9#4#27��9�68#�+(24>����;���� �2��)'�#��2'�6(/
���"��-./�0.1.�9�68#�+(24
�����������>#������� �����; �XYZ�+(���&
���������� ��� �>� ���"�������1.. �� ��������������� � 1
,��� ,��� ,����
��
��
���
�,�
��
���
��;
�;
,�;
�;
,�;
�;
��;3?�-
14�.04�$
%�&
����%�,�./.�"+'1(+� (+.#�& J#(�+5�'��5#(�6'4(6#��#�3'�0(2)#��#��#)6�:#+5����� '�+4�,��. J#(�+5�'��5#(�6'4(6#��#�3'�0(2)#��#��#)6�:#+5
���������� ��� �>� 1
1��� �� -��� ��� '�( 1���� -����� 4����� ��( 0
%.24 ��� ,�,� ���� ����� �����)*0(�K ���� ,��� ���� ���� ����
,. �2)#�6�'2�6'�4(6#
������� ���� � � ������ ��������<����" ������
�24.�6��(+� ,��,� ������'2�.0#��!��)�#6�'2(�5 ,���� ������(6#��(+� ����� �����'2�.0#���6(�+#� ����� ���,�%�2(2)�(+� ���� ,����#+#)'00.2�)(6�'2��#�:�)#� ��, ��6�+�6�#� ��� �,,�23'�0(6�'2��#)*2'+'$5 ���� ������(�*;�(�*��<.�:(+#26� ��� �6*#�� ,�� �����
���� ����� ��
=�J �������! ,������� �����&�� �������% ����! ,����! ,��,"&� ,�,��"! ������> ��,
��� ������ ��
=(�(2 �������� �����6(+5 �,���&�(8�+ ������9�68#�+(24 ����(2(4( ,���.�6�(+�( ,����2�6#4�>�2$4'0 ,�,,�#6*#�+(24� �����6*#�� ����
�� �:�� ����� ������ �
�� �����������10��� ��� -?��� ���
�22.(+��#4�:'+(6�+�65 ��()K�2$�#��'�7�(22.(+��#4 (
����1.�@���� ���� ���/'� ,����&� �����(�)'�'+' ��,!#+��'26#��()�L) ������(*��!�(0'24��24� ��������� ���� (.�(.��(�#� ��,�&�(�K#0 ��,��*�1.5(�>'$5' ��,��#+#��'�6# ��,������ 13�-&
� )��� ���������*# ��#4�6 �.���# �<.�65 %.24 ,�./. "+'1(+ (+.# �.��.#� ( M4##� :(+.#M (���'()* �2 +�2#9�6* 6*# )+(���) "�(*(0 : !'44 0'4#+� �' 6*��#24 6*# 3.24 �2:#�6� �2 .24#�:(+.#4 )'0�(2�#�9*�)* (�# +��6#4 9'�+49�4# '2 �#$.+(6#4 (24())#���1+# 0(�K#6�� �*# �2:#�60#26 4#)���'2�(�# 2'6 0(4# '2 6*# 1(��� '3 ( 1#2)*0(�K?2#:#�6*#+#��7 �2:#�6'�� )(2 .�# 6*# ���� '�+4�24#/ (� ( +'2$6#�0 5(�4�6�)K� �*# :(+.#(���'()* )(2 4#+�:#� (1':#(:#�($# �#�.+6� ':#�( +'2$ �#��'4 1#)(.�# �6 4��)��+�2#� �2:#�6'�� 2'66'��(5�6''�0.)*�3'��(2��2:#�60#26�
�� �������
������������� �)������� �� ,���
� ������������� �� ���
��������)������*= ����
�'.�)#@�����#�7�(��#.6#����'0�(25
�. ���6'��)(+ �#�3'�0(2)# �24�)(6�'2� (24 L2(2)�(+ 0(�K#6 �)#2(��'� (�# 2' $.(�(26## 3'� ).��#26 '3 3.6.�# �#�3'�0(2)#� �#�3'�0(2)# �24�)(6�'2� 4' 2'6 )'2��4#� )'00����'2� +#:�#4 (6 �.1�)���6�'2 (24;'��#4#0�6�'2�
�*#�4��)+(�0#��0#26�'2#4�(6�6*#�#24�'3�6*���4').0#26�(+�'�(��+�#��6'�6*����($#�
A
B
C
D
E
F
G
H
V
U
Q
R S
T
���"��-./�0.1.�9�68#�+(24
�����������>#������� �����; �XYZ�+(���&
A
B
C
�� ���� ��� "�#$'����()*�#+�� ���� ������ � �����,���������� -.��)*�� ��������� �./#01'.�$�� ������ �� �����������: � �������� �����(�)*������ ���������� ���� ,������ ����� ���� ������,����� ��� ����� ������� ���,������;� ���������;�� � �� �� ,���
����� ����������� (���#��1(2K�3##�� ���������� ����� '�+4�,��.
� �������� ���������������������<��
��� ����,����,�,==����� �� �,��,�
������ � !(�+5 �������������������� ! �.�6��(7��8#)*��#�.1+�)7%�2+(247�%�(2)#7�"#�0(257�"�1�(+6(�7�"�##)#7��.2$(�57�6(+57���#)*6#2�6#�27��./#01'.�$7��#6*#�+(24�7�'�9(57��'�6.$(+7���(�27��9#4#27��9�68#�+(24>����;���� �2��)'�#��2'�6(/
� )��� ���������*# ��#4�6 �.���# �<.�65 %.24 ,�./. "+'1(+ (+.# �.��.#� ( M4##� :(+.#M (���'()* �2 +�2#9�6* 6*# )+(���) "�(*(0 : !'44 0'4#+� �' 6*��#24 6*# 3.24 �2:#�6� �2 .24#�:(+.#4 )'0�(2�#�9*�)* (�# +��6#4 9'�+49�4# '2 �#$.+(6#4 (24())#���1+# 0(�K#6�� �*# �2:#�60#26 4#)���'2�(�# 2'6 0(4# '2 6*# 1(��� '3 ( 1#2)*0(�K?2#:#�6*#+#��7 �2:#�6'�� )(2 .�# 6*# ���� '�+4�24#/ (� ( +'2$6#�0 5(�4�6�)K� �*# :(+.#(���'()* )(2 4#+�:#� (1':#(:#�($# �#�.+6� ':#�( +'2$ �#��'4 1#)(.�# �6 4��)��+�2#� �2:#�6'�� 2'66'��(5�6''�0.)*�3'��(2��2:#�60#26�
�� �������
������������� �)������� �� ,���
� ������������� �� ���
��������)������*= ����
D
E
���������� ��� �>� ���"�������1.. �� ��������������� � 1
,��� ,��� ,����
��
��
���
�,�
��
���
��;
�;
,�;
�;
,�;
�;
��;3?�-
14�.14 .04�$
%�&
����%�,�./.�"+'1(+� (+.#�& J#(�+5�'��5#(�6'4(6#��#�3'�0(2)#��#��#)6�:#+5����� '�+4�,��. J#(�+5�'��5#(�6'4(6#��#�3'�0(2)#��#��#)6�:#+5
���������� ��� �>� 1
1��� �� -��� ��� '�( 1���� -����� 4����� ��( 0
%.24 ��� ,�,� ���� ����� �����)*0(�K ���� ,��� ���� ���� ����
,. �2)#�6�'2�6'�4(6#
�'.�)#@�����#�7�(��#.6#����'0�(25
F
G
�. ���6'��)(+ �#�3'�0(2)# �24�)(6�'2� (24 L2(2)�(+ 0(�K#6 �)#2(��'� (�# 2' $.(�(26## 3'� ).��#26 '3 3.6.�# �#�3'�0(2)#� �#�3'�0(2)# �24�)(6�'2� 4' 2'6 )'2��4#� )'00����'2� +#:�#4 (6 �.1�)���6�'2 (24;'��#4#0�6�'2�
�*#�4��)+(�0#��0#26�'2#4�(6�6*#�#24�'3�6*���4').0#26�(+�'�(��+�#��6'�6*����($#�H
+���������� �()*(� �4�2�������������� � ,�����,����� ����� -.��)*�������� ��� �./#01'.�$���� ��� � ������������A��� ������� �����(5������������������������� ����� ����������� ,�����,��������������������������� ������������������������������� ����� ������� ��������
�&�������� ��2#�,�./.����&(+(2)#4�,�.�'.
���������� ���������� ������������
��� ��������,��!������� ������
"���������� �2��)'�#��6(/
�#��$��%&/�'&(&�9�68#�+(24
Credit Suisse Portfolio Fund (Lux) XYZ �+(���&
���������� �����"�)���$��������(&& ������������������ � (
,��� ,�����
���
��,
��
���
���
���
,;
�;
,;
;
�;
�;
��;
*�*+�+
������� ��2#�,�./.��24#/�#+#)6�'2�&(+(2)#4�,�.�'.�& J#(�+5�'��5#(�6'4(6#��#�3'�0(2)#��#��#)6�:#+5�&�������� ��2#�,�./.����&(+(2)#4�,�.�'. J#(�+5�'��5#(�6'4(6#��#�3'�0(2)#��#��#)6�:#+5
���������� �����"�) (
(������ %������� ,�- (���� %����� +����� ��- %
%.24 ���, ���� ��� ���� ��,�)*0(�K ���� ,��� ���, ���� ����
�. �2)#�6�'2�6'�4(6#
.��� ������.����� �����������
�<.�65 ���&'24� ,����+6#�2(6�:#� �����(�*;�(�*�<.�:(+#26� ���,�
.��� ���������� ��������
��� �������! ������6*#�� ����"&� ����=�J ���,��% ����
.�����.��� ��������������� .������#� "/���� ����0�����"/��#������ �����
�.�'+(24 ,,��� ���� ���� �����6*#�� ���� ������� ����, ����,�0#�$�2$��(�K#6� ,�,, ���� ����=(�(2 ���, ���,�> ,��� ,��, �����9�68#�+(24 ���� �����'6(+ ,��� ���� ��� ���,� ������
��#������������ ��*# ���0(�5 �2:#�60#26 '1A#)6�:# '3 �� ���� �2# ,�./. �24#/�#+#)6�'2 &(+(2)#4 ,�.�'. ���#(+6#�0 )(��6(+ ��#�#�:(6�'2 (24 +'2$6#�0)(��6(+ #2*(2)#0#26 6*�'.$* �#$.+(� �2)'0#7 (�9#++ (� )(��6(+ (24 ).��#2)5 $(�2�� �*# 3.24�2:#�6� �2 ( 1�'(4+5 4�:#���L#4 �'�63'+�' '3�24#/+�2K#4 �2�6�.0#26� �.)* (� #/)*(2$#6�(4#4 3.24� ,��%�.7 �2:#�60#26 3.24�7�6�.)6.�#4 ��'4.)6�7 (24 4#��:(6�:#�� �*# 3.24�� �2:#�6#4 9'�+49�4# �2 #<.�6�#�7 1'24�7).��#2)�#�7 )'00'4�6�#�7 (24 '6*#� (+6#�2(6�:#�2:#�60#26��
������ ��
����� ����� ��� � ���
���������#������ .! ����,�
�����������������
�;
�;
��;
��;
,�;
,�;
��;
�� �� �� �� ��� ���� ���
������������ �(���� %�����
������� ������� � ���������������� � �����K���������,�������. � �������� ��� ��� . � � . ������ !��� ��� � �"� ���� ������� �������� �������������������������� #
-�����������,����$��������������� ���; #�%��������������������������������������� &#%%�� L� � �������������� �#�%
.��� ���������$���������'���������(�� � )*#+&$����������(�� � )&#����,�����-�K� �(�� � ��#%������������K���(�� � .#*+/�"�J� �(�� � +# .����� (&&�&&
����(&�1������������'0���1�,��.�����0'����2 �)#&�'00-����������/ � *#+3'0���1�,��.����(�����24�$56����) .#&3'0���1�,��.����0:7��%% 3#*���"����������'���# +#3*'0���1�,-��.�����0'����#����K��� +#%+'0���1�,��.�����0'��8���� &#* �������1�1�0��������������� &#.3'0���1�,��.�����0'����2 )#�3�9�� ������1����� #*3����� 23�'*
0�����:�-����;���4�������'������
�. /������ ����������� � ������ �� L����� ���K�� �������� ��� �� ��������� ��� ������� �� ������ �����������# 7���������� � ������ � ��� ���� �� ��������� ��� �� ��9������� �� <���� ������#
�"�� �������������� �����"���� �����"�� ����������������������"������#
A
B
C
D
E
F
G
H
W X
Y
Z
AA
AB
AC
AD
�#��$��%&/�'&(&0�������
Credit Suisse Portfolio Fund (Lux) XYZ'����(
A
B
C
���������� 0��"��= ��������������� � *#%*# %%*�� ����� >���"�������� ��� -����9�������� ��� � �24���������A��� ������� )�#����������������������������� &#%.�� ����������� *#%*# %%*������������������������ �#)%��������������������������� ����� �#.+��� ��������
'(�'0�0�'�6�5���,-��.��0�(����� �,����.
���������� ���������� ������������
��� -2%&)*3)� +�!!������� �%)&.&��
"���������� ��������������
��#������������ ��"� ������ ��������� �9?����� �� '0 0�'�65�� ,-��. �� ��0������ (����� ,����. ��������� ����� ����������� �� ������������� ��"�������� �"����" ������ �����; ���� �� ����� �� �������� ����# �"� ��� ������ � � 9��� � ����L� ������� ��� ����K� ���������� ���" �� ���"������� � ��� � ,��1�.; ��������� ��� �;��������� ��� ����; �� ��������# �"� ��� � ������ ��� � � � �@����; 9�� �;���������; ����� ���; �� ��"�� �������������������#
������ ��
����� ����� ��� � �24
���������#������ .! �%3# 3
D
E
���������� �����"�)���$��������(&& ������������������ � (
%%* %�%*.
�%%
�%
�%&
�%+
�%.
��%
� ;
%;
;
&;
+;
.;
�%;
*�*+�++ ++ +
'0�0�'�6�5���,-��.��� ��0�������(����� �,����.�( J���������������� ��������������������������'(�'0�0�'�6�5���,-��.��0�(����� �,����. J���������������� ��������������������������
���������� �����"�) (
(������ %������� ,�- (���� %����� +����� ��- %
1�� %#� )#�� &#)* +#*� � � 3# 3(���"���K �%#%) #3+ �#� .#�+ � � .#�.
). ����������� ���
0�����:�-����;���4�������'������
F
G
�. /������ ����������� � ������ �� L����� ���K�� �������� ��� �� ��������� ��� ������� �� ������ �����������# 7���������� � ������ � ��� ���� �� ��������� ��� �� ��9������� �� <���� ������#
�"�� �������������� �����"���� �����"�� ����������������������"������# H
##FLUX_EMBED_PDF##c:\temp\Flux.Cache\3ef7839ef5c84542ab7c4216ec2b54c4.pdf[1;False]##FLUX_EMBED_PDF##
Breakdowns (Equity Funds)Sectors in %Table depicting the sector breakdown, by percentage holding in theportfolio of a Fund and it’s Benchmark as at the last trading point relevantto the Factsheet month end.
Currencies in %Pie chart listing currency split within portfolio.
Countries in %Pie chart listing the countries breakdown, by percentage holding in theportfolio of a Fund as at the last trading point relevant to the Factsheetmonth end.
Significant transactionsTable depicting the largest transactions within the Fund’s portfolio sincelast month’s end.
Fund statisticsThis section covers major statistics, to describe a fund’s behaviour withrespect to its Market Index.
Top 10 holdings in %Table listing the largest Holdings, by percentage value in the portfolio of aFund as at the last trading point relevant to the Factsheet month end.
Breakdowns (Portfolio Funds)Allocation asset classes in %Pie chart depicting the percentage breakdown of a Fund’s portfolioholdings by asset class, as at the last trading point relevant to the Factsheetmonth end.
Allocation currencies in %Pie chart listing currency split within portfolio.
Asset allocation in %Matrix of Asset Classes and Currency Breakdowns as at the last tradingpoint relevant to the Factsheet month end.
Maturities in %Bar chart depicting the percentage breakdown of Maturities in a Fund’sportfolio, in terms of designated time bands, as at the last trading pointrelevant to the Factsheet month end.
Fund statisticsThis section covers major statistics, to describe a fund’s behaviour withrespect to its Market Index.
Duration and yieldTable depicting key statistics with respect to fixed income characteristics inthe Fund’s portfolio.
Allocation of bonds in %Table depicting the percentage breakdown of a Fund’s Fixed Incomeholdings by asset class, as at the last trading point relevant to the Factsheetmonth end.
Top 10 holdings in %Table listing the largest Holdings, by percentage value in the portfolio of aFund as at the last trading point relevant to the Factsheet month end. Tableincludes information on Coupons and Maturities.
Info
rmat
ion
387
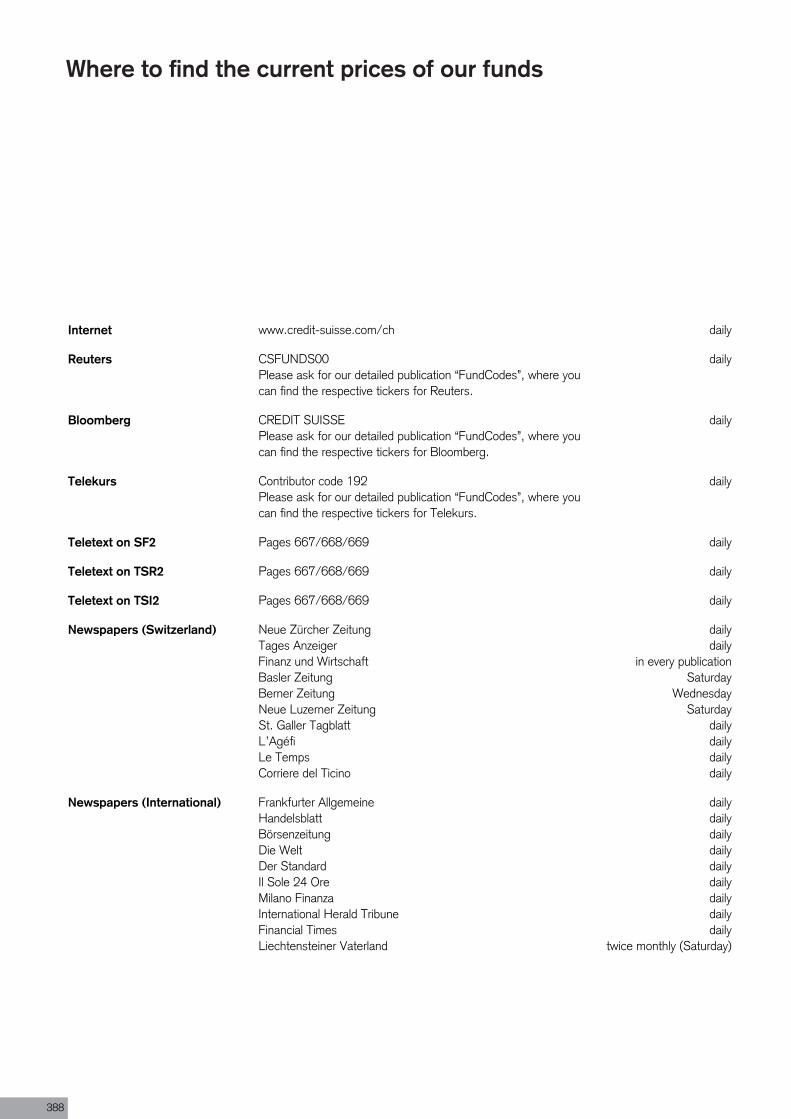
Internet www.credit-suisse.com/ch daily
Reuters CSFUNDS00Please ask for our detailed publication “FundCodes”, where youcan find the respective tickers for Reuters.
daily
Bloomberg CREDIT SUISSEPlease ask for our detailed publication “FundCodes”, where youcan find the respective tickers for Bloomberg.
daily
Telekurs Contributor code 192Please ask for our detailed publication “FundCodes”, where youcan find the respective tickers for Telekurs.
daily
Teletext on SF2 Pages 667/668/669 daily
Teletext on TSR2 Pages 667/668/669 daily
Teletext on TSI2 Pages 667/668/669 daily
Newspapers (Switzerland) Neue Zürcher ZeitungTages AnzeigerFinanz und WirtschaftBasler ZeitungBerner ZeitungNeue Luzerner ZeitungSt. Galler TagblattL’AgéfiLe TempsCorriere del Ticino
dailydaily
in every publicationSaturday
WednesdaySaturday
dailydailydailydaily
Newspapers (International) Frankfurter AllgemeineHandelsblattBörsenzeitungDie WeltDer StandardIl Sole 24 OreMilano FinanzaInternational Herald TribuneFinancial TimesLiechtensteiner Vaterland
dailydailydailydailydailydailydailydailydaily
twice monthly (Saturday)
Where to find the current prices of our funds
388
This document was produced by Credit Suisse AG and/or itsaffiliates (hereafter "CS") with the greatest of care and to thebest of its knowledge and belief. However, CS provides noguarantee with regard to its content and completeness anddoes not accept any liability for losses which might arise frommaking use of this information. The opinions expressed in thisdocument are those of CS at the time of writing and are subjectto change at any time without notice. If nothing is indicatedto the contrary, all figures are unaudited. This document isprovided for information purposes only and is for the exclusiveuse of the recipient. It does not constitute an offer or arecommendation to buy or sell financial instruments or bankingservices and does not release the recipient from exercising his/her own judgment. The recipient is in particular recommendedto check that the information provided is in line with his/herown circumstances with regard to any legal, regulatory, tax orother consequences, if necessary with the help of a professionaladvisor. This document may not be reproduced either in part orin full without the written permission of CS. It is expressly notintended for persons who, due to their nationality or place ofresidence, are not permitted access to such information underlocal law. Neither this document nor any copy thereof may besent, taken into or distributed in the United States or to anyU. S. person. Every investment involves risk, especially withregard to fluctuations in value and return. Investments in foreigncurrencies involve the additional risk that the foreign currencymight lose value against the investor's reference currency.Historical performance indications and financial marketscenarios are no guarantee for current or future performance.Performance indications do not consider commissions levied atsubscription and/or redemption. Furthermore, no guarantee canbe given that the performance of the benchmark will be reachedor outperformed.
Some of the investment products include investments inEmerging Markets. Emerging Markets are located in countriesthat possess one or more of the following characteristics: Acertain degree of political instability, relatively unpredictablefinancial markets and economic growth patterns, a financialmarket that is still at the development stage or a weakeconomy. Emerging markets investments usually result inhigher risks such as political risks, economical risks, creditrisks, exchange rate risks, market liquidity risks, legal risks,settlement risks, market risks, shareholder risk and creditorrisk. Some of the investment products include Commodityinvestments. Commodity investmets are subject to greaterfluctuations in value than normal investments and may lead to
additional investment risks. Some of the investment productsinclude alternative investments. Alternative investments (e.g.Hedge Funds or Private Equity) are complex instruments andmay carry a very high degree of risk. Such risks can arisefrom extensive use of short sales, derivatives and debt capital.Furthermore, the minimum investment periods can be long.Hedge Funds are intended only for investors who understandand accept the associated risks.
1a Immo PK was issued in Switzerland. The target group ofinvestors is restricted to tax-exempt domestic occupationalbenefit institutions and tax-exempt domestic social insuranceinstitutions and compensation funds.Credit Suisse Real Estate Fund International was launchedin Switzerland under the type "other funds for traditionalinvestments." The target group of investors is restricted toqualified investors as defined in art. 10, para. 3 of the SwissFederal Act on Collective Investment Schemes (CISA).CS PortfolioReal and the CS MACS Funds are a GemischtesSondervermögen (mixed fund) pursuant to the GermanInvestment Act (InvG).Credit Suisse Prime Select Trust (hereinafter "the Company")is an investment company with variable capital established inLuxembourg pursuant to Part II of the Luxembourg law onundertakings for collective investment of December 20, 2002,and approved for sale in Switzerland as a foreign collectiveinvestment scheme with special risks.The subfunds of theCompany invest as funds of funds in hedge funds that engagein alternative investments and employ investment techniquesinvolving risks that are not comparable to those of securitiesfunds. Investors are expressly made aware of the risks outlinedin the prospectus and must in particular be willing to acceptsubstantial price losses. The Company and the managementcompany endeavor, however, to minimize these risks througha strict selection of the funds purchased (target funds) andadequate risk diversification. However, a total loss for individualtarget funds cannot be ruled out.
The CS ETFs family includes Exchange Traded Funds (ETF)under Swiss law, Luxembourg law and Irish law. The Collectiveinvestment schemes with domicile in Luxembourg were issuedpursuant to Part I and Part II of the Luxembourg law ofDecember 20, 2002, on undertakings for collective investment.
Fund management company of the Funds under Swiss lawas well as representative of the foreign funds registered forpublic sale in Switzerland is Credit Suisse Funds AG, Zurich.
Important Information
Info
rmat
ion
389
Custodian Bank of the funds under Swiss law as well as PayingAgent of the foreign funds registered for public sale inSwitzerland is Credit Suisse AG, Zurich. Subscriptions are onlyvalid on the basis of the current sales prospectus and the mostrecent annual report (or half-yearly report, if this is more recent).The prospectus, the simplified prospectus, the managementregulations respectively the articles of incorporation and theannual and half-yearly reports may be obtained free of chargefrom Credit Suisse Funds AG, Zurich and from any bank in theCredit Suisse AG in Switzerland.
Index-DisclaimerThe product is not sponsored, endorsed, sold or promoted bySIX Swiss Exchange Ltd and SIX Swiss Exchange Ltd makesno representation regarding the advisability of investing in theproduct. SMI®, SMIM®, SLI®, SBI® and the relevant indicesare registered trademarks of SIX Swiss Exchange Ltd and maybe used only under license from the owner.The MSCI indices are exclusively owned by MSCI. MSCI as wellas names of MSCI indices are registered traded marks of MSCIand/or its affiliates and have been licensed to use in predefinedmanner by Credit Suisse Fund Management S.A. and CreditSuisse Fund Management Company (Ireland) Limited. Allsubfunds of CS ETF (LUX) as well as of CS ETF (IE) which arebased on MSCI indices are not issued, signed, confirmed, soldor marketed by MSCI. MSCI neither provides any guaranteenor assumes any liability for CS ETF funds. Furthermore, MSCIdoes not take responsibility for selling CS ETF fund shares andis not involved in the management of CS ETF funds."Dow Jones" and "Dow Jones Industrial AverageSM” aretrademarks of Dow Jones & Company, Inc. and have beenlicensed for use for certain purposes by Credit Suisse FundManagement Company (Ireland) Limited. Credit Suisse FundManagement Company (Ireland) Limited's CS ETF (IE) on theDow Jones Industrial AverageSM is not sponsored, endorsed,sold or promoted by Dow Jones, and Dow Jones makes norepresentation regarding the advisability of trading in suchproduct(s).The Nikkei 225 is a copyrighted material calculated in amethodology independently developed and created by NikkeiInc., and Nikkei Inc., is the sole exclusive owner of the copyrightand other intellectual property rights in the Nikkei 225 itselfand the methodology to calculate the Nikkei 225. Nikkei DigitalMedia Inc. as authorized by Nikkei Inc. granted a license tothe Licensee to use the Nikkei 225 as basis for the Fund.The intellectual property and any other rights in the marks toindicate Nikkei and the Nikkei 225 shall be vested in Nikkei
Inc. Nikkei Inc. and/or Nikkei Digital Media, Inc. does notsponsor, support, sell or market the Fund. Nikkei Inc. and/orNikkei Digital Media, Inc. has - besides granting the licenseto the Licensee to use certain trademarks and to use theNikkei 225 for the Fund – no connection with the Fund. Thelicense agreement between Nikkei Digital Media, Inc. and theLicensee does not provide any rights to any third parties. TheFund is managed exclusively at the risk of the Licensee andNikkei Inc. and/or Nikkei Digital Media, Inc. shall assume noobligation or responsibility for its management and transactionsof the Fund. Nikkei Inc. and/or Nikkei Digital Media, Inc. isnot responsible for the accuracy and the calculation of theFund or the data contained therein. Nikkei Inc. and/or NikkeiDigital Media, Inc. shall not have the obligation to continuouslyannounce the Nikkei 225 and shall not be liable for any error,delay, interruption, suspension or cessation of announcementthereof; and Nikkei Inc. and Nikkei Digital Media, Inc. shall havethe right to change the description of the stocks included in theNikkei 225, the calculation methodology of the Nikkei 225 orany other details of the Nikkei 225 and shall have the right tosuspend or cease the announcement of the Nikkei 225 withoutowning any liability to the Licensor or any other third party.The EURO STOXX 50® is the intellectual property (includingregistered trademarks) of STOXX Limited, Zurich, Switzerlandand/or its licensors (“Licensors”), which is used under license.The Fund based on the Index is in no way sponsored, endorsed,sold or promoted by STOXX and its Licensors and neither ofthe Licensors shall have any liability with respect thereto.“FTSE®”, "FT-SE®", "Footsie®", “FTSE4Good®” and“techMARK” are trade marks jointly owned by the London StockExchange Plc and The Financial Times Limited and are usedby FTSE International Limited (“FTSE”) under licence.“All-World®”, “All-Share®” and “All-Small®” are trade marks ofFTSE. The FTSE 100 is calculated by FTSE. FTSE does notsponsor, endorse or promote this product and is not in any wayconnected to it and does not accept any liability in relation to itsissue, operation and trading. All copyright and database rightsin the index values and constituent list vest in FTSE.“FTSE®” is a trade mark of the London Stock Exchange plcand the Financial Times Limited, “MIB®” is a trade mark ofBorsa Italiana SpA (“Borsa Italiana”) and both are used byFTSE International Limited (“FTSE”) under licence. The FTSEMIB Index is calculated by FTSE with the assistance of BorsaItaliana. Neither FTSE nor its licensors nor Borsa Italianasponsor, endorse or promote this product and are not in anyway connected to it and do not accept any liability in relationto its issue, operation and trading. All copyright in the index
390
values and constituent list vest in FTSE. Credit Suisse FundManagement Company (Ireland) Limited has obtained fulllicence from FTSE to use such copyright in the creation of thisproduct.Standard & Poor’s® and S&P® are registered trademarks ofStandard & Poor’s Financial Services LLC (“S&P”) and havebeen licensed for use by the Manager. The Fund is notsponsored, endorsed, sold or promoted by S&P or its Affiliates,and S&P and its Affiliates make no representation, warranty orcondition regarding the advisability of buying, selling or holdingshares in the Fund.CSI Indices are compiled and calculated by China SecuritiesIndex Co. Ltd. CSI will apply all necessary means to ensurethe accuracy of the CSI Indices. However, neither CSI nor theShanghai Stock Exchange nor the Shenzhen Stock Exchangeshall be liable (whether in negligence or otherwise) to any
person for any error in the CSI Indices and neither CSI nor theShanghai Stock Exchange nor the Shenzhen Stock Exchangeshall be under any obligation to advise any person of any errortherein. All copyright in the index values and constituent listvests in CSI.Standard & Poor’s® and S&P® are registered trademarks ofStandard & Poor’s Financial Services LLC (“S&P”) and havebeen licensed for use by the Manager. The Fund is notsponsored, endorsed, sold or promoted by S&P or its Affiliates,and S&P and its Affiliates make no representation, warranty orcondition regarding the advisability of buying, selling or holdingshares in the Fund.
Copyright © 2012 Credit Suisse Group AG and/or its affiliates.All rights reserved.
Info
rmat
ion
391
Individuals
Address: CREDIT SUISSE AGParadeplatz 8P.O.Box 500CH-8070 Zurich
Internet: www.credit-suisse.com
Upload Fund Factbook: www.credit-suisse.com/ch/factbook
Financial Advisors
Address: CREDIT SUISSE AGAsset ManagementRetail Distribution CH/LIAWREP. O. Box 800CH-8070 Zurich
Internet: www.credit-suisse.com/ch
Quarterly produced by: Marketing EMEA, Asset Management
Contacts
International Standard Serial Number: ISSN 1663-1463
392


booklet issuerId channelId languageId perDateFund Factbook9926 9913 18 20120330


