25
CLEAN BALTIC SEA SHIPPING Final Conference Trelleborg, 2-3 September 2013 FUTURE OF MARITIME TRAFFIC IN THE BALTIC SEA Urszula Kowalczyk Maritime Institute in Gdansk (MIG)
CLEAN BALTIC SEA SHIPPING
Final Conference Trelleborg, 2-3 September 2013
FUTURE OF MARITIME TRAFFIC IN THE BALTIC SEA
Urszula Kowalczyk Maritime Institute in Gdansk (MIG)
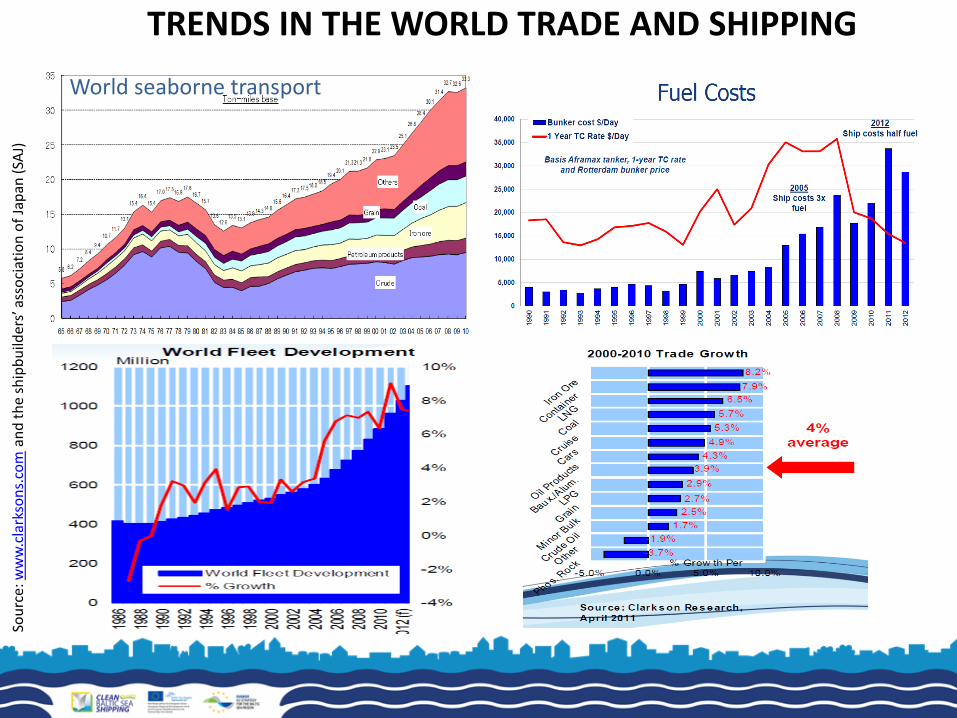
TRENDS IN THE WORLD TRADE AND SHIPPING So
urc
e: w
ww
.cla
rkso
ns.
com
an
d t
he
ship
bu
ilder
s’ a
sso
ciat
ion
of
Jap
an (
SAJ)
World seaborne transport
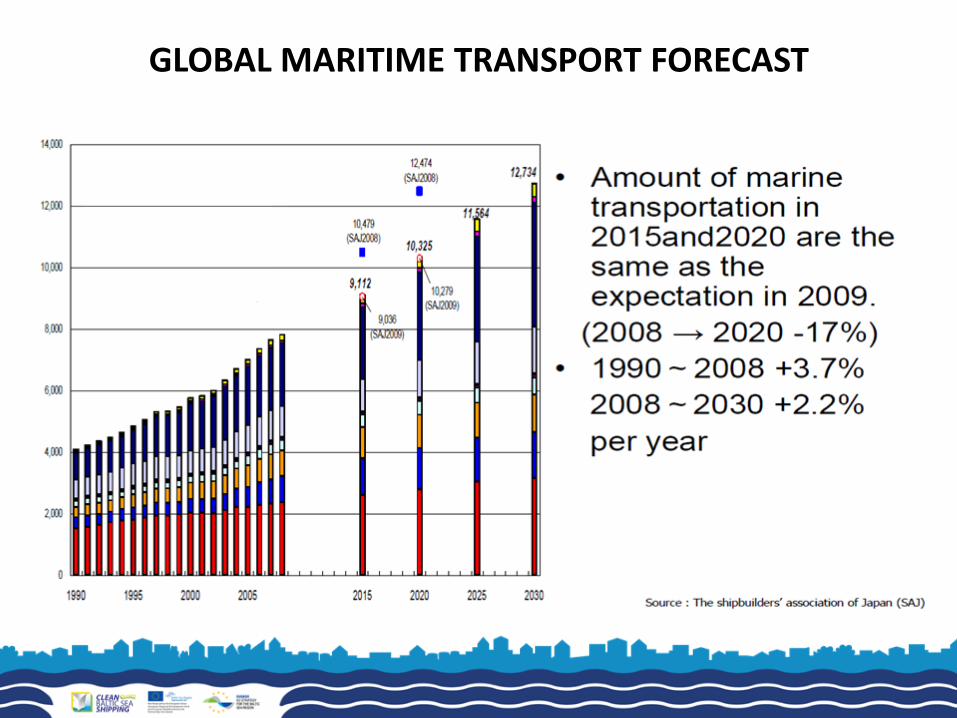
GLOBAL MARITIME TRANSPORT FORECAST
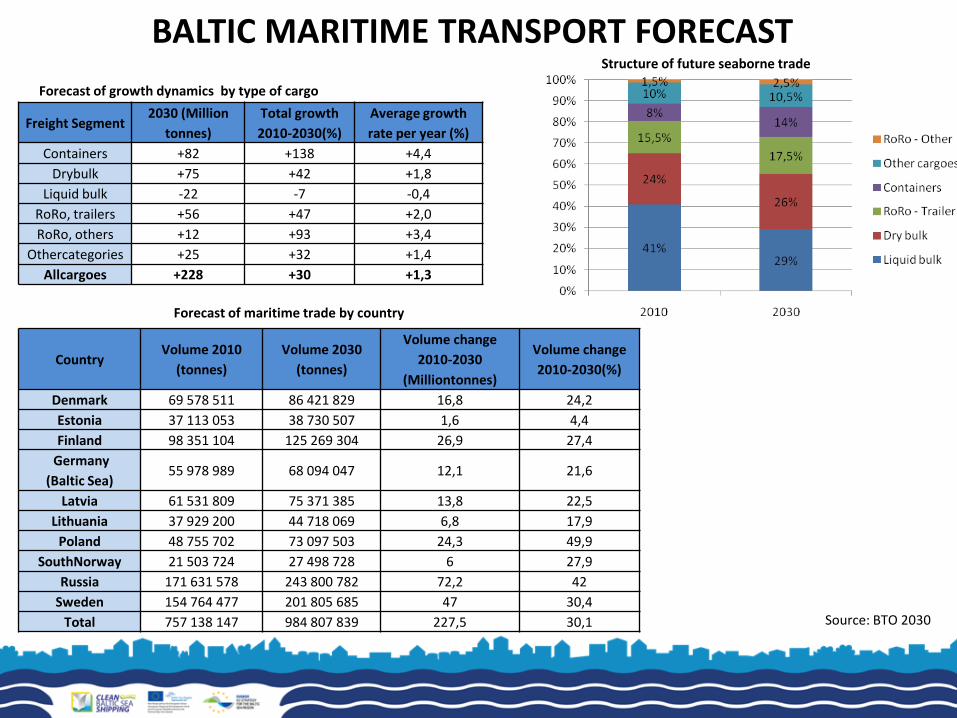
BALTIC MARITIME TRANSPORT FORECAST
Freight Segment 2030 (Million
tonnes)
Total growth
2010-2030(%)
Average growth
rate per year (%)
Containers +82 +138 +4,4
Drybulk +75 +42 +1,8
Liquid bulk -22 -7 -0,4
RoRo, trailers +56 +47 +2,0
RoRo, others +12 +93 +3,4
Othercategories +25 +32 +1,4
Allcargoes +228 +30 +1,3
Forecast of growth dynamics by type of cargo
Source: BTO 2030
Country Volume 2010
(tonnes)
Volume 2030
(tonnes)
Volume change
2010-2030
(Milliontonnes)
Volume change
2010-2030(%)
Denmark 69 578 511 86 421 829 16,8 24,2
Estonia 37 113 053 38 730 507 1,6 4,4
Finland 98 351 104 125 269 304 26,9 27,4
Germany
(Baltic Sea) 55 978 989 68 094 047 12,1 21,6
Latvia 61 531 809 75 371 385 13,8 22,5
Lithuania 37 929 200 44 718 069 6,8 17,9
Poland 48 755 702 73 097 503 24,3 49,9
SouthNorway 21 503 724 27 498 728 6 27,9
Russia 171 631 578 243 800 782 72,2 42
Sweden 154 764 477 201 805 685 47 30,4
Total 757 138 147 984 807 839 227,5 30,1
Structure of future seaborne trade
Forecast of maritime trade by country
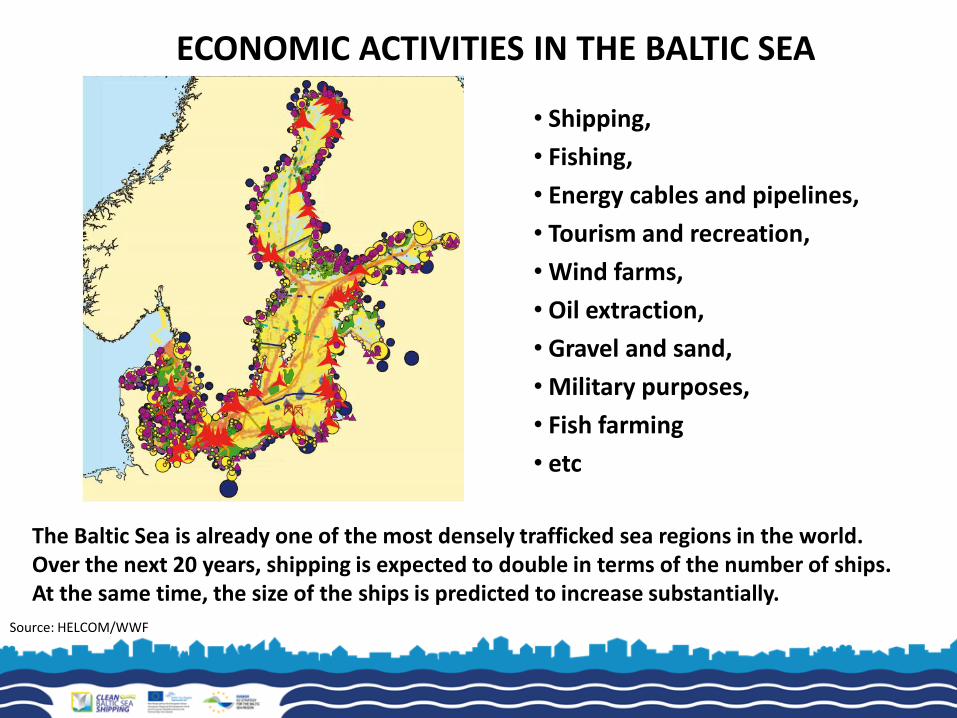
ECONOMIC ACTIVITIES IN THE BALTIC SEA
• Shipping,
• Fishing,
• Energy cables and pipelines,
• Tourism and recreation,
• Wind farms,
• Oil extraction,
• Gravel and sand,
• Military purposes,
• Fish farming
• etc
Source: HELCOM/WWF
The Baltic Sea is already one of the most densely trafficked sea regions in the world. Over the next 20 years, shipping is expected to double in terms of the number of ships. At the same time, the size of the ships is predicted to increase substantially.
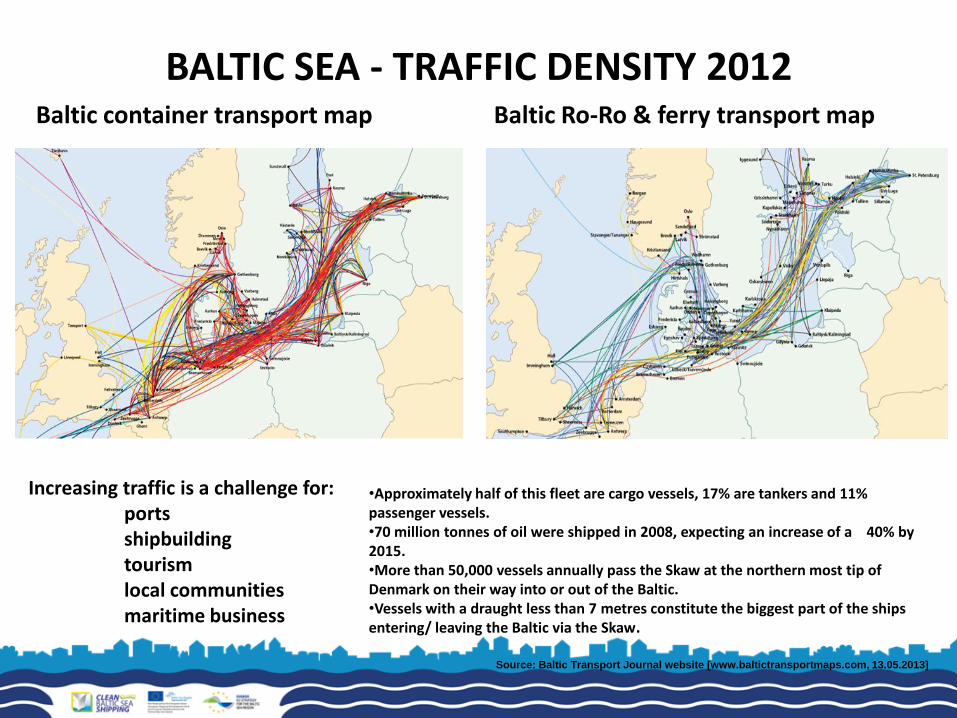
BALTIC SEA - TRAFFIC DENSITY 2012 Baltic container transport map Baltic Ro-Ro & ferry transport map
Source: Baltic Transport Journal website [www.baltictransportmaps.com, 13.05.2013]
Increasing traffic is a challenge for: ports shipbuilding tourism local communities maritime business
•Approximately half of this fleet are cargo vessels, 17% are tankers and 11% passenger vessels. •70 million tonnes of oil were shipped in 2008, expecting an increase of a 40% by 2015. •More than 50,000 vessels annually pass the Skaw at the northern most tip of Denmark on their way into or out of the Baltic. •Vessels with a draught less than 7 metres constitute the biggest part of the ships entering/ leaving the Baltic via the Skaw.
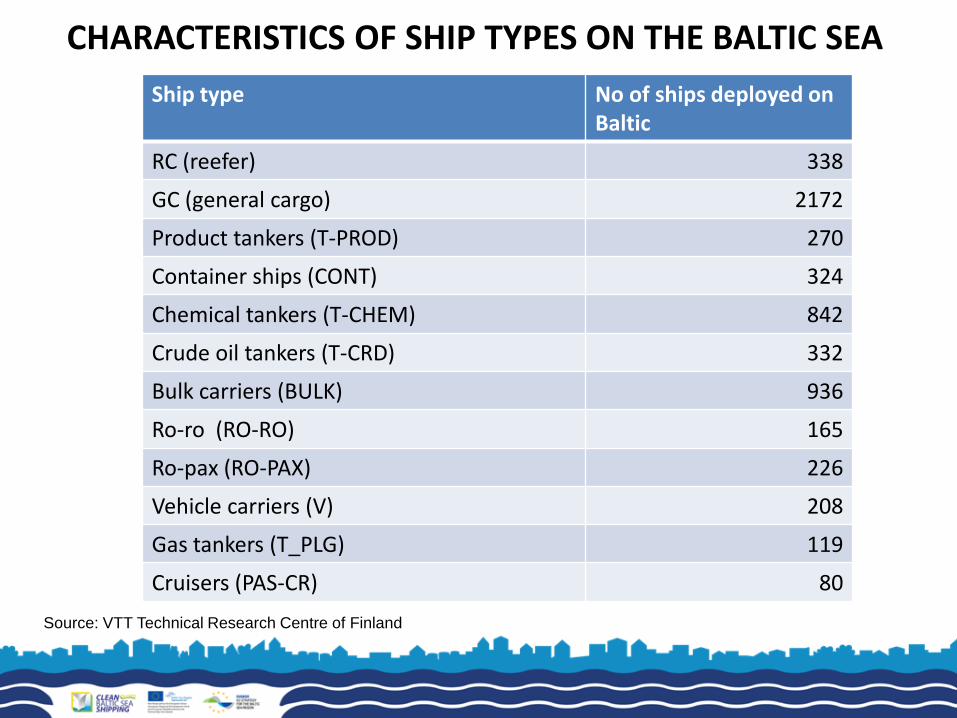
CHARACTERISTICS OF SHIP TYPES ON THE BALTIC SEA
Ship type No of ships deployed on Baltic
RC (reefer) 338
GC (general cargo) 2172
Product tankers (T-PROD) 270
Container ships (CONT) 324
Chemical tankers (T-CHEM) 842
Crude oil tankers (T-CRD) 332
Bulk carriers (BULK) 936
Ro-ro (RO-RO) 165
Ro-pax (RO-PAX) 226
Vehicle carriers (V) 208
Gas tankers (T_PLG) 119
Cruisers (PAS-CR) 80
Source: VTT Technical Research Centre of Finland
POLLUTION FROM SHIPPING
• In line with growing density of shipping, the threat for the maritime environment from shipping is increasing as the consequence of expanding traffic and increasing volume of various goods and number of passengers. Development of shipping and other type of maritime resources exploration cause enlargement in of the volume of pollution
• The polution can appear in global, regional or local scale. • The amount of hazardous substances (in terms of ton-miles) emited in
exhaust gases is not very high. However, in case of heavy trafficked sea areas like the Baltic Sea, the dence cumulation of emmission is harmfull for the environment.
• The exhaust gases emited from ships are polluting mainly the atmosphere and indirectly also the water environment.
• Around 3% of global pollution from transport can be attributed to maritime shipping. Emission from international shipping amount to around 8 mil-CO2t, which is equivalent to that of Germany, or 6th states in the world.
• The emmission is expected to increase steadily in the long term.
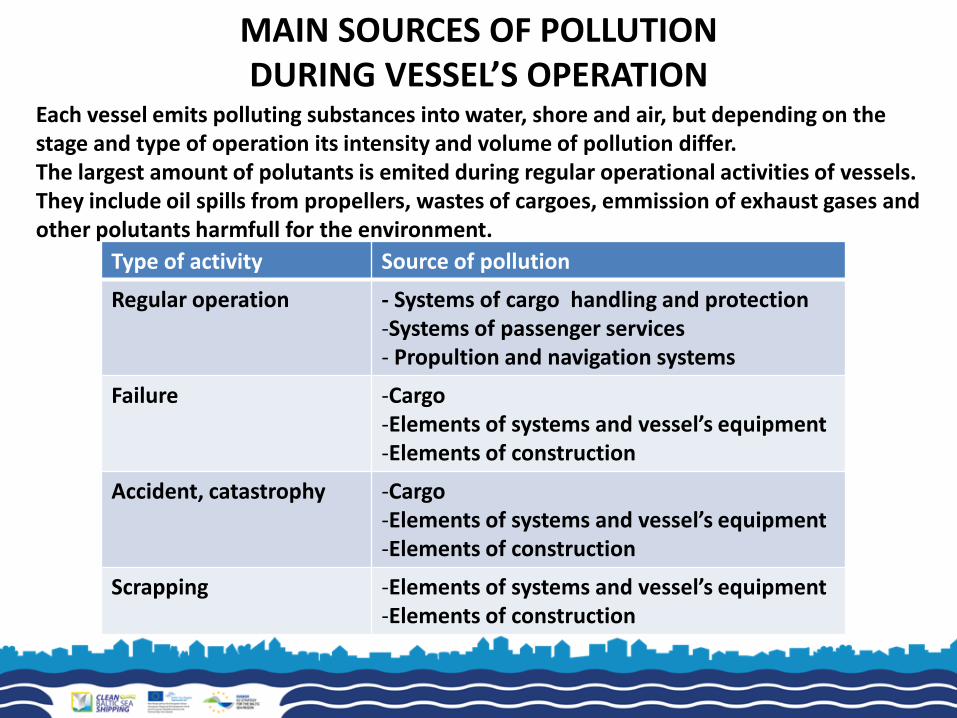
MAIN SOURCES OF POLLUTION DURING VESSEL’S OPERATION
Each vessel emits polluting substances into water, shore and air, but depending on the stage and type of operation its intensity and volume of pollution differ. The largest amount of polutants is emited during regular operational activities of vessels. They include oil spills from propellers, wastes of cargoes, emmission of exhaust gases and other polutants harmfull for the environment.
Type of activity Source of pollution
Regular operation - Systems of cargo handling and protection -Systems of passenger services - Propultion and navigation systems
Failure -Cargo -Elements of systems and vessel’s equipment -Elements of construction
Accident, catastrophy -Cargo -Elements of systems and vessel’s equipment -Elements of construction
Scrapping -Elements of systems and vessel’s equipment -Elements of construction
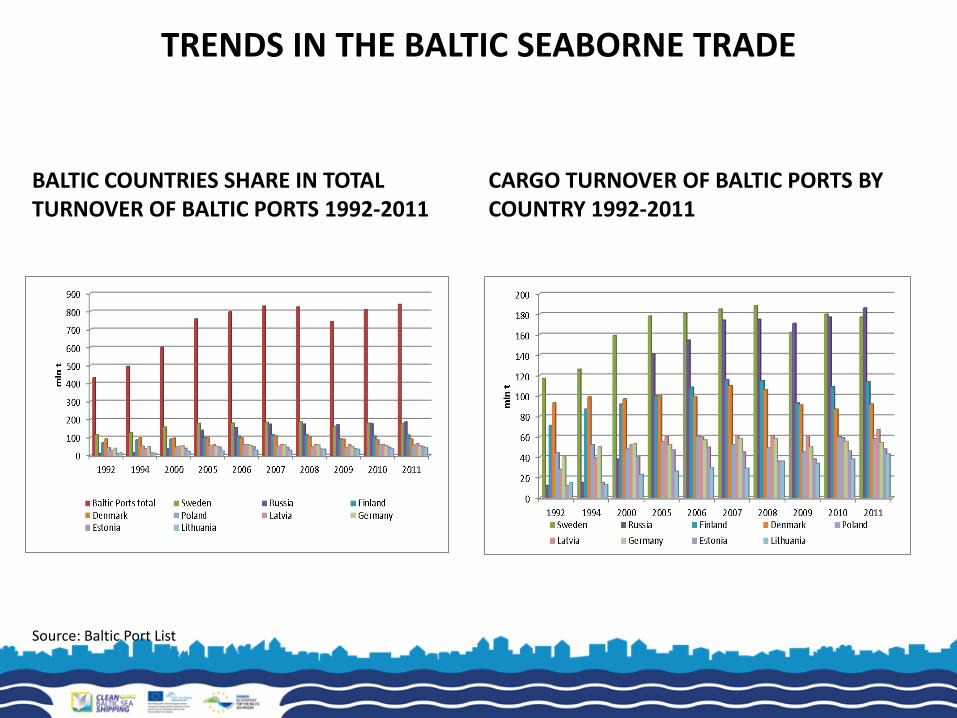
TRENDS IN THE BALTIC SEABORNE TRADE
BALTIC COUNTRIES SHARE IN TOTAL TURNOVER OF BALTIC PORTS 1992-2011
CARGO TURNOVER OF BALTIC PORTS BY COUNTRY 1992-2011
Source: Baltic Port List
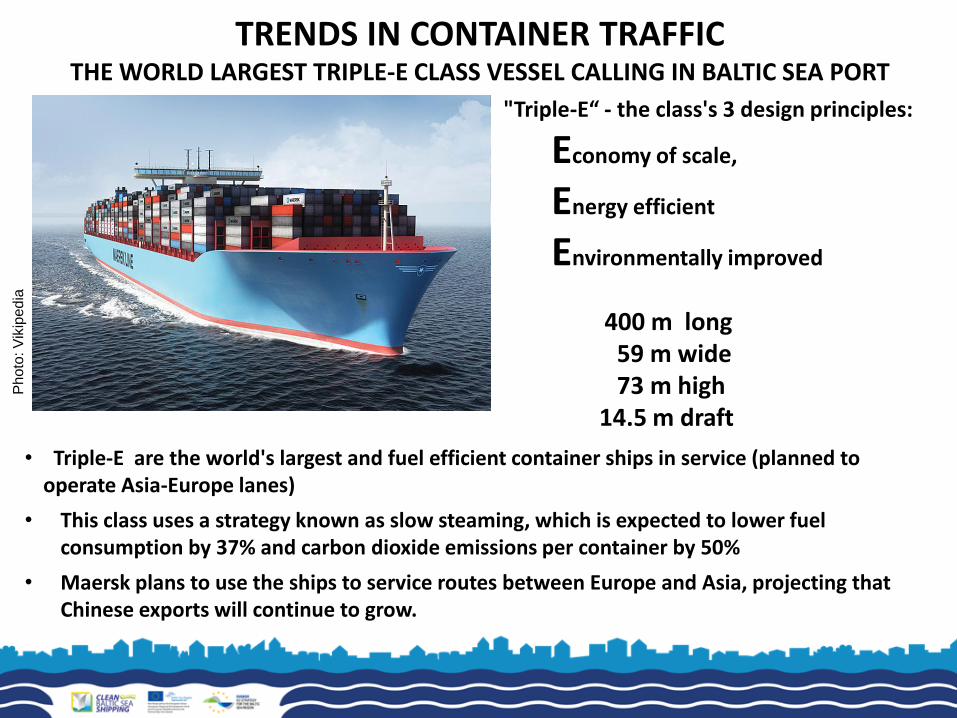
TRENDS IN CONTAINER TRAFFIC THE WORLD LARGEST TRIPLE-E CLASS VESSEL CALLING IN BALTIC SEA PORT
• Triple-E are the world's largest and fuel efficient container ships in service (planned to operate Asia-Europe lanes)
• This class uses a strategy known as slow steaming, which is expected to lower fuel consumption by 37% and carbon dioxide emissions per container by 50%
• Maersk plans to use the ships to service routes between Europe and Asia, projecting that Chinese exports will continue to grow.
"Triple-E“ - the class's 3 design principles:
Economy of scale,
Energy efficient
Environmentally improved
400 m long 59 m wide 73 m high 14.5 m draft
Ph
oto
: V
ikip
ed
ia
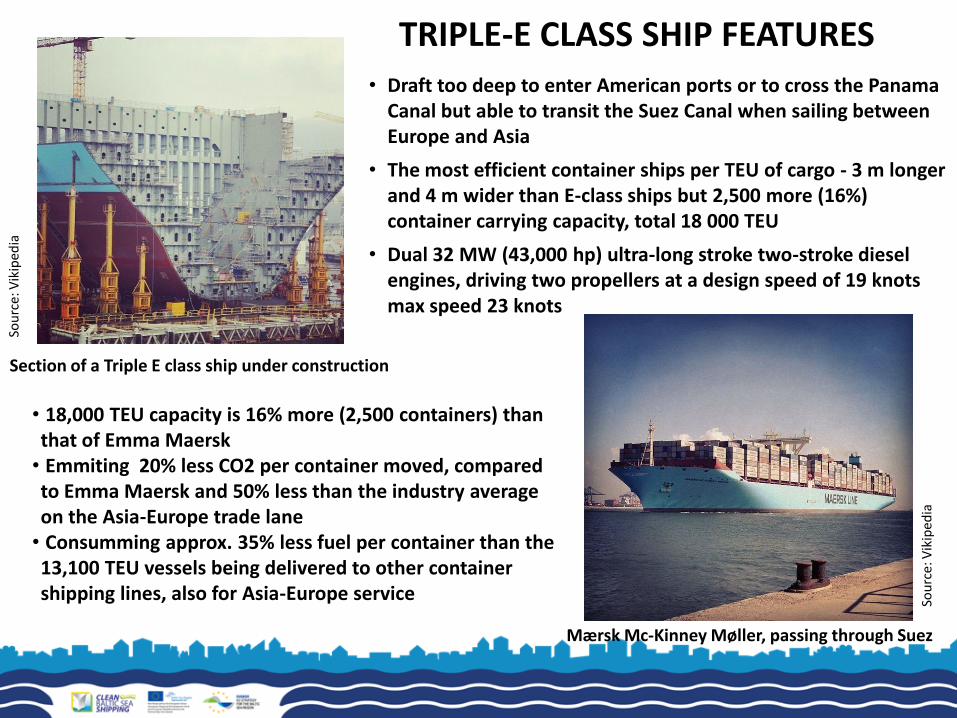
TRIPLE-E CLASS SHIP FEATURES
Section of a Triple E class ship under construction
Mærsk Mc-Kinney Møller, passing through Suez
• Draft too deep to enter American ports or to cross the Panama Canal but able to transit the Suez Canal when sailing between Europe and Asia
• The most efficient container ships per TEU of cargo - 3 m longer and 4 m wider than E-class ships but 2,500 more (16%) container carrying capacity, total 18 000 TEU
• Dual 32 MW (43,000 hp) ultra-long stroke two-stroke diesel engines, driving two propellers at a design speed of 19 knots max speed 23 knots
Sou
rce:
Vik
iped
ia
Sou
rce:
Vik
iped
ia
• 18,000 TEU capacity is 16% more (2,500 containers) than that of Emma Maersk
• Emmiting 20% less CO2 per container moved, compared to Emma Maersk and 50% less than the industry average on the Asia-Europe trade lane
• Consumming approx. 35% less fuel per container than the 13,100 TEU vessels being delivered to other container shipping lines, also for Asia-Europe service
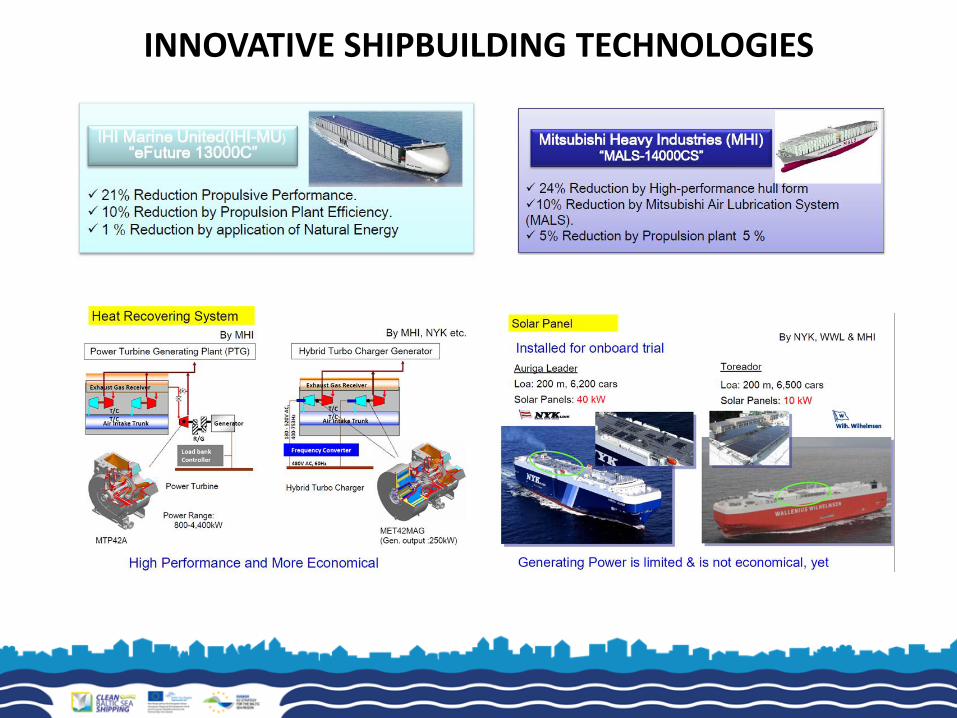
INNOVATIVE SHIPBUILDING TECHNOLOGIES
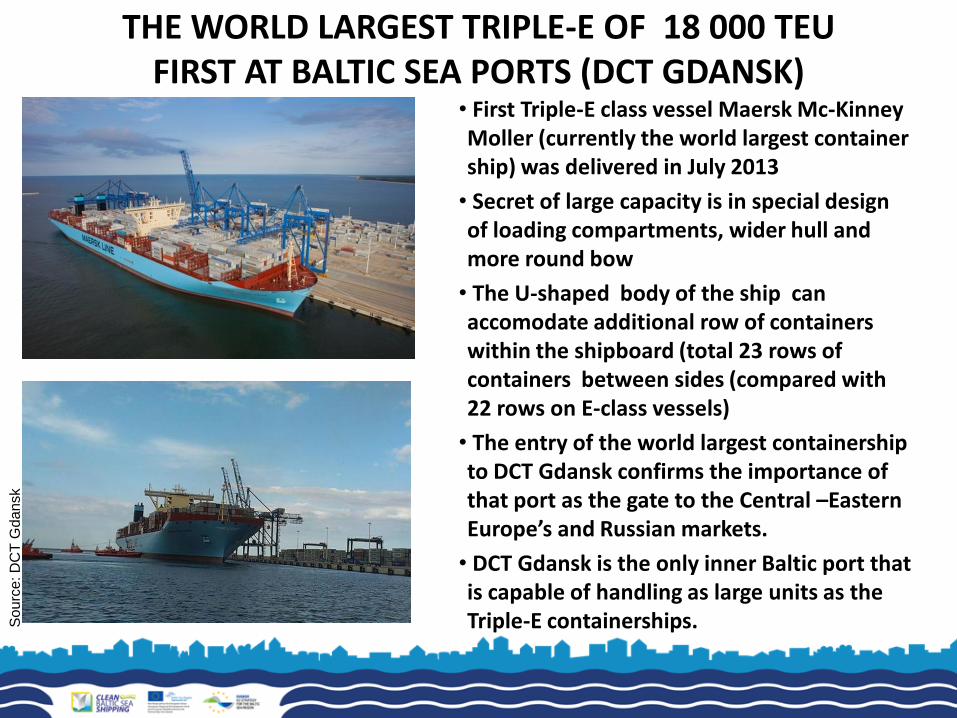
THE WORLD LARGEST TRIPLE-E OF 18 000 TEU FIRST AT BALTIC SEA PORTS (DCT GDANSK)
• First Triple-E class vessel Maersk Mc-Kinney Moller (currently the world largest container ship) was delivered in July 2013
• Secret of large capacity is in special design of loading compartments, wider hull and more round bow
• The U-shaped body of the ship can accomodate additional row of containers within the shipboard (total 23 rows of containers between sides (compared with 22 rows on E-class vessels)
• The entry of the world largest containership to DCT Gdansk confirms the importance of that port as the gate to the Central –Eastern Europe’s and Russian markets.
• DCT Gdansk is the only inner Baltic port that is capable of handling as large units as the Triple-E containerships. S
ourc
e: D
CT
Gd
an
sk
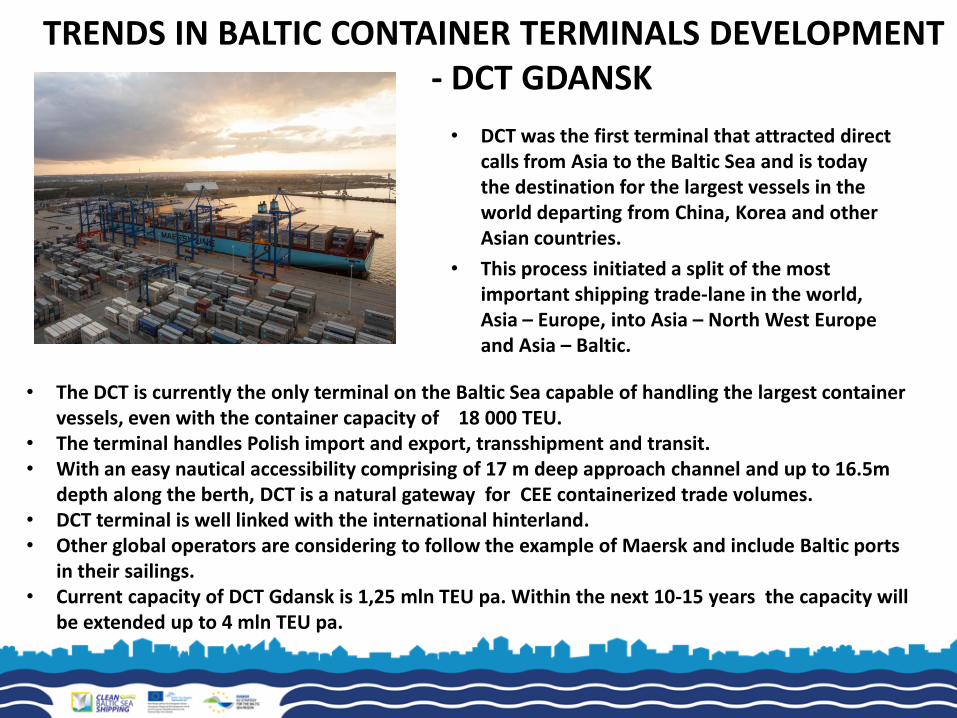
• DCT was the first terminal that attracted direct calls from Asia to the Baltic Sea and is today the destination for the largest vessels in the world departing from China, Korea and other Asian countries.
• This process initiated a split of the most important shipping trade-lane in the world, Asia – Europe, into Asia – North West Europe and Asia – Baltic.
TRENDS IN BALTIC CONTAINER TERMINALS DEVELOPMENT
- DCT GDANSK
• The DCT is currently the only terminal on the Baltic Sea capable of handling the largest container vessels, even with the container capacity of 18 000 TEU.
• The terminal handles Polish import and export, transshipment and transit. • With an easy nautical accessibility comprising of 17 m deep approach channel and up to 16.5m
depth along the berth, DCT is a natural gateway for CEE containerized trade volumes. • DCT terminal is well linked with the international hinterland. • Other global operators are considering to follow the example of Maersk and include Baltic ports
in their sailings. • Current capacity of DCT Gdansk is 1,25 mln TEU pa. Within the next 10-15 years the capacity will
be extended up to 4 mln TEU pa.
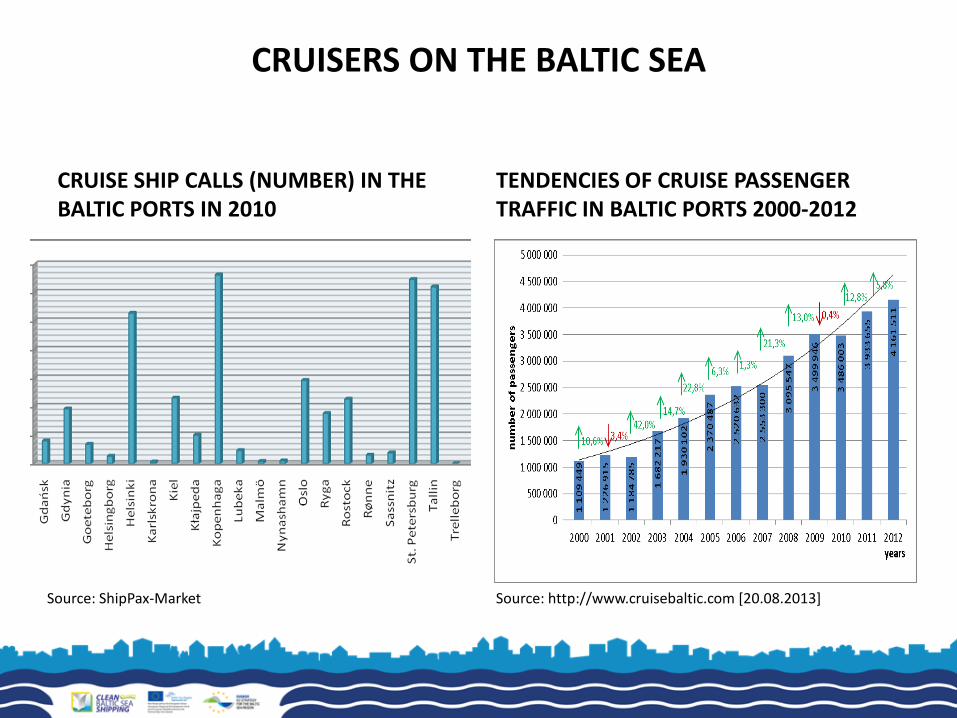
CRUISERS ON THE BALTIC SEA
CRUISE SHIP CALLS (NUMBER) IN THE BALTIC PORTS IN 2010
TENDENCIES OF CRUISE PASSENGER TRAFFIC IN BALTIC PORTS 2000-2012
Source: http://www.cruisebaltic.com [20.08.2013] Source: ShipPax-Market
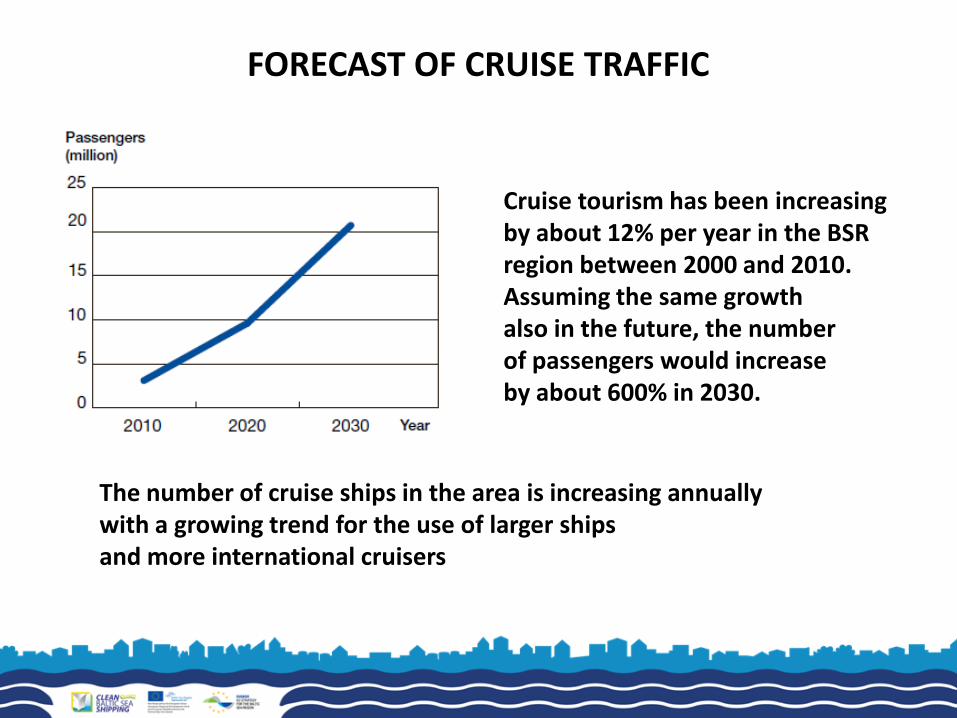
FORECAST OF CRUISE TRAFFIC
Cruise tourism has been increasing by about 12% per year in the BSR region between 2000 and 2010. Assuming the same growth also in the future, the number of passengers would increase by about 600% in 2030.
The number of cruise ships in the area is increasing annually with a growing trend for the use of larger ships and more international cruisers
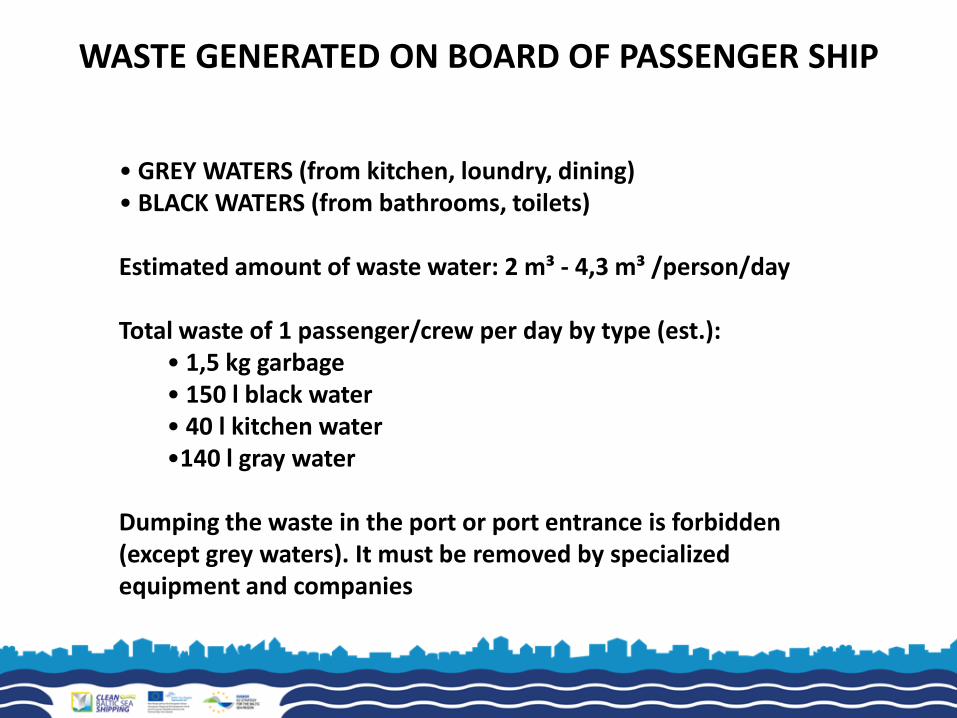
WASTE GENERATED ON BOARD OF PASSENGER SHIP
• GREY WATERS (from kitchen, loundry, dining) • BLACK WATERS (from bathrooms, toilets) Estimated amount of waste water: 2 m³ - 4,3 m³ /person/day Total waste of 1 passenger/crew per day by type (est.):
• 1,5 kg garbage • 150 l black water • 40 l kitchen water •140 l gray water
Dumping the waste in the port or port entrance is forbidden (except grey waters). It must be removed by specialized equipment and companies
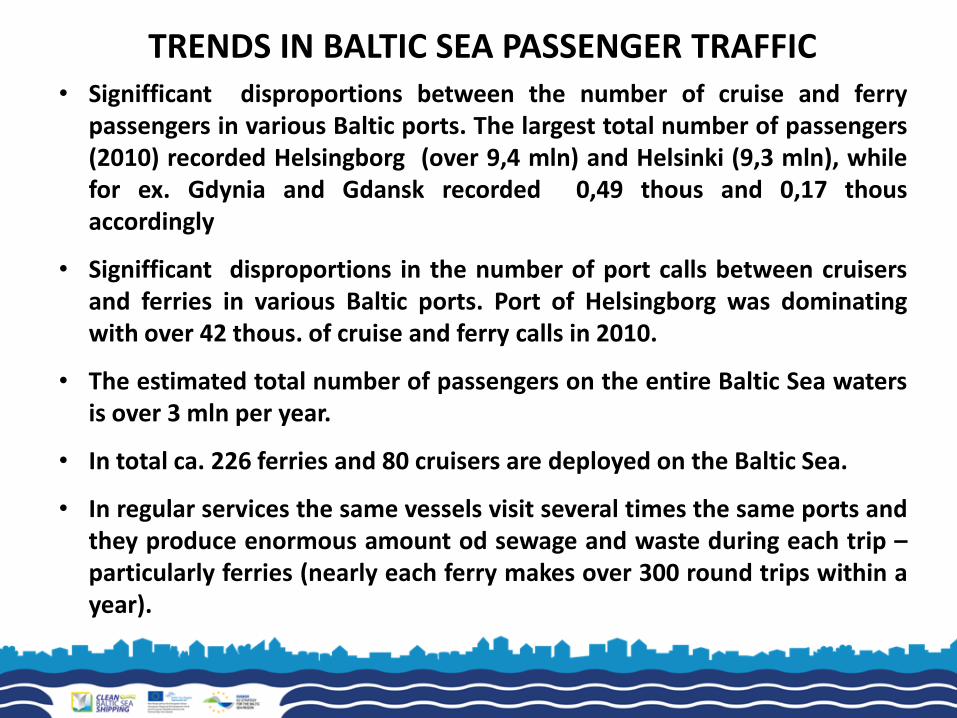
TRENDS IN BALTIC SEA PASSENGER TRAFFIC • Signifficant disproportions between the number of cruise and ferry
passengers in various Baltic ports. The largest total number of passengers (2010) recorded Helsingborg (over 9,4 mln) and Helsinki (9,3 mln), while for ex. Gdynia and Gdansk recorded 0,49 thous and 0,17 thous accordingly
• Signifficant disproportions in the number of port calls between cruisers and ferries in various Baltic ports. Port of Helsingborg was dominating with over 42 thous. of cruise and ferry calls in 2010.
• The estimated total number of passengers on the entire Baltic Sea waters is over 3 mln per year.
• In total ca. 226 ferries and 80 cruisers are deployed on the Baltic Sea.
• In regular services the same vessels visit several times the same ports and they produce enormous amount od sewage and waste during each trip – particularly ferries (nearly each ferry makes over 300 round trips within a year).
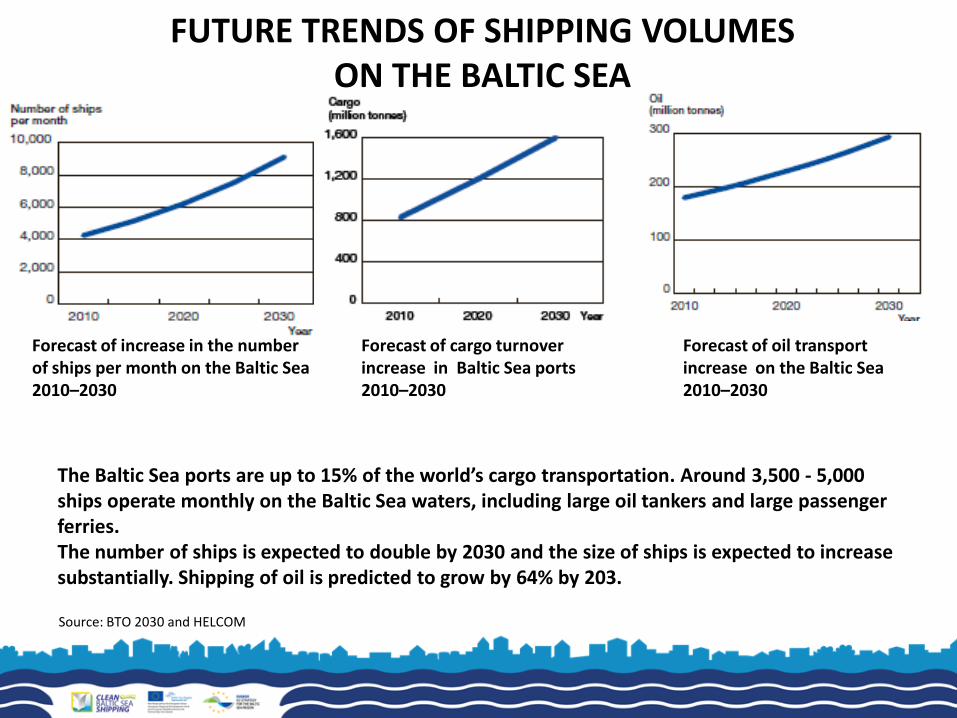
FUTURE TRENDS OF SHIPPING VOLUMES
ON THE BALTIC SEA
Forecast of increase in the number of ships per month on the Baltic Sea 2010–2030
Forecast of oil transport increase on the Baltic Sea 2010–2030
The Baltic Sea ports are up to 15% of the world’s cargo transportation. Around 3,500 - 5,000 ships operate monthly on the Baltic Sea waters, including large oil tankers and large passenger ferries. The number of ships is expected to double by 2030 and the size of ships is expected to increase substantially. Shipping of oil is predicted to grow by 64% by 203.
Forecast of cargo turnover increase in Baltic Sea ports 2010–2030
Source: BTO 2030 and HELCOM
IMPROVING RECEPTION FACILITIES
• In 2000 the European Commission’s directive 2000/59/EC on port reception facilities was adopted. This was designed to protect the marine environment by reducing the discharge of waste into the sea. It applies to all commercial ports, regardless of their size.
• The directive required each port to provide adequate waste reception facilities to meet the needs of ships, and to develop and put in place a waste reception and handling plan. The reality, though, is that – 12 years on – the facilities and plans have largely failed to materialise.
• Having invested heavily in advanced new treatment plans, cruise ships can now recycle up to 95% of their own waste; but reception facilities for recyclables in Europe are virtually non-existent.
• A call for more flexibility in the port charges levied on cruise ships has come up. Port costs have been rising steadily in recent years while average cruise ticket prices have fallen almost 30% since 2009.
BALTIC SMALL AND MEDIUM SIZE PORTS
• Small Baltic ports operate on a very fragmented market, handling in general dry bulk cargo but also specialise in some types of cargo (e.g. timber, offshore wind farm equipment) and sustain local tourism and fishery.
• About 66 % of all Baltic sea ports are small ports which handle less than 2 million tonnes of cargo per year.
• Small ports share in total cargo turnover of Baltic ports is around 10%. • For majority of small Baltic ports dry bulk cargo is the main type of handled
cargo. Many ports are specialized in handling some types of cargo, like some Finish ports dedicated to handling timber.
• In some of this ports, tourist traffic plays an important role. • Small ports development is strictly connected with the development of the
port city and the region and is vital for developing local and regional businesses and sutainable development of the area.
BALTIC FISHING DEVELOPMENT
• Commercial fisheries are intensive in the whole Baltic Sea, but fishing pressure is particularly high in the southern parts.
• The number of commercial fishermen and fishing fleets in the region has decreased due to overcapacity in the sector and shrinking fish populations after several years of overfishing.
• Commercial fishing in the Baltic Sea is politically regulated through quotas on an annual basis. If the fishing quotas are set at a level which is sustainable for the survival of the fish populations, fishing will initially decrease in the region but may later increase as fish populations are allowed to recover.
• It is expected that the number of fishing vessels will continue to decrease, but still smaller area of the Baltic Sea will be exploited by fishing.
• A decrease in fleet number may only imply increased quotas and larger areas to fish for a lower number of vessels.
• Also, recreational fishing is an important activity in the Baltic Sea region that is steadily growing.
CONCLUSIONS • Developments by 2030 may result in considerable changes to transport patterns.
This, will have a significant impact on the future position of the Baltic Sea region, where a sustainable economic growth is currently observed and expected in the near future.
• Shipowners are introducing larger vessels in container transport, aiming for reduction of costs per unit.
• Need for deepwater ports that can handle larger ships is being observed, it mean fewer port calls and the elimination of secondary calls from rotations on the main arterial routes. Ports have to respond to the extended requirements to handle large ships. Due to certain restrictions, the largest container vessels until recently avoided the Baltic ports. The turning point breaking that routine was the decision of Maersk Line.
• The DCT is currently the only terminal on the Baltic Sea capable of handling the largest container vessels, even with the container capacity of 18 000 TEU.
• The total demand at Baltic container ports is expected to grow from 38% to 60% up to 5.68 mln TEU by 2015, and by a further 55%-65% to just over 10 mln TEU by 2020. The container handling capacity of Baltic ports will increase from 13,8 mln TEU in 2015 to 29 mln TEU in 2025 (Baltic Russian ports will increase by 42%-72% to 3.8 mln TEU by 2015 and to 6.8 mln TEU by 2020. Polish ports will increase to 1.43 mln TEU, and by a further 49% to 2.1 mln TEU, respectively.
Urszula Kowalczyk Jakub Piotrowicz
MARITIME INSTITUTE IN
GDANSK www.im.gda.pl


