http://www.jamstec.go.jp/frcgc/research/p3/emission.htm. FUTURE PREDICTION OF SURFACE OZONE OVER EAST ASIA UP TO 2020. Using CMAQ and REAS*. *Regional Emission inventory in ASia for past and future, developed at FRCGC. Kazuyo Yamaji and Hajime Akimoto. ([email protected]). - PowerPoint PPT Presentation
17
The 6th Annual CMAS Conference, Chapel Hill, NC, October 1-3, 2007 1 FUTURE PREDICTION OF SURFACE OZONE OVER EAST ASIA UP TO 2020 Kyushu University, Japan Kazuyo Yamaji Kazuyo Yamaji and Hajime Akimoto and Hajime Akimoto Toshimasa Ohara and Jun-ichi Kurokawa Toshimasa Ohara and Jun-ichi Kurokawa Itsushi Uno Itsushi Uno Frontier Research Center for Global Change (FRCGC), JAMSTEC, Japan National Institute for Environmental Studies, Japan ([email protected]. jp) Using CMAQ and REAS* Using CMAQ and REAS* *Regional Emission inventory in ASia for past and future, developed at FR *Regional Emission inventory in ASia for past and future, developed at FR CGC CGC http://www.jamstec.go.jp/frcgc/research/p 3/emission.htm
Transcript
The 6th Annual CMAS Conference, Chapel Hill, NC, October 1-3, 2007 1
FUTURE PREDICTION OF SURFACE OZONE OVER EAST
ASIA UP TO 2020
FUTURE PREDICTION OF SURFACE OZONE OVER EAST
ASIA UP TO 2020
Kyushu University, Japan
Kazuyo YamajiKazuyo Yamaji and Hajime Akimotoand Hajime Akimoto
Toshimasa Ohara and Jun-ichi KurokawaToshimasa Ohara and Jun-ichi Kurokawa
Itsushi UnoItsushi Uno
Frontier Research Center for Global Change (FRCGC), JAMSTEC, Japan
National Institute for Environmental Studies, Japan
Using CMAQ and REAS*Using CMAQ and REAS*Using CMAQ and REAS*Using CMAQ and REAS**Regional Emission inventory in ASia for past and future, developed at FRCGC*Regional Emission inventory in ASia for past and future, developed at FRCGC*Regional Emission inventory in ASia for past and future, developed at FRCGC*Regional Emission inventory in ASia for past and future, developed at FRCGC
not consider rapid not consider rapid increase, 2000-2003increase, 2000-2003
WORSE WORSE CASE? CASE? WORSE WORSE CASE? CASE?
The 6th Annual CMAS Conference, Chapel Hill, NC, October 1-3, 2007 3
Objective of this simulationObjective of this simulationObjective of this simulationObjective of this simulationTo investigate future OTo investigate future O33 changes caused by changes caused by
Objective of this simulationObjective of this simulationObjective of this simulationObjective of this simulationTo investigate future OTo investigate future O33 changes caused by changes caused by
The 6th Annual CMAS Conference, Chapel Hill, NC, October 1-3, 2007 7
RAMS RAMS domaindomain
CMAQ CMAQ domaindomain
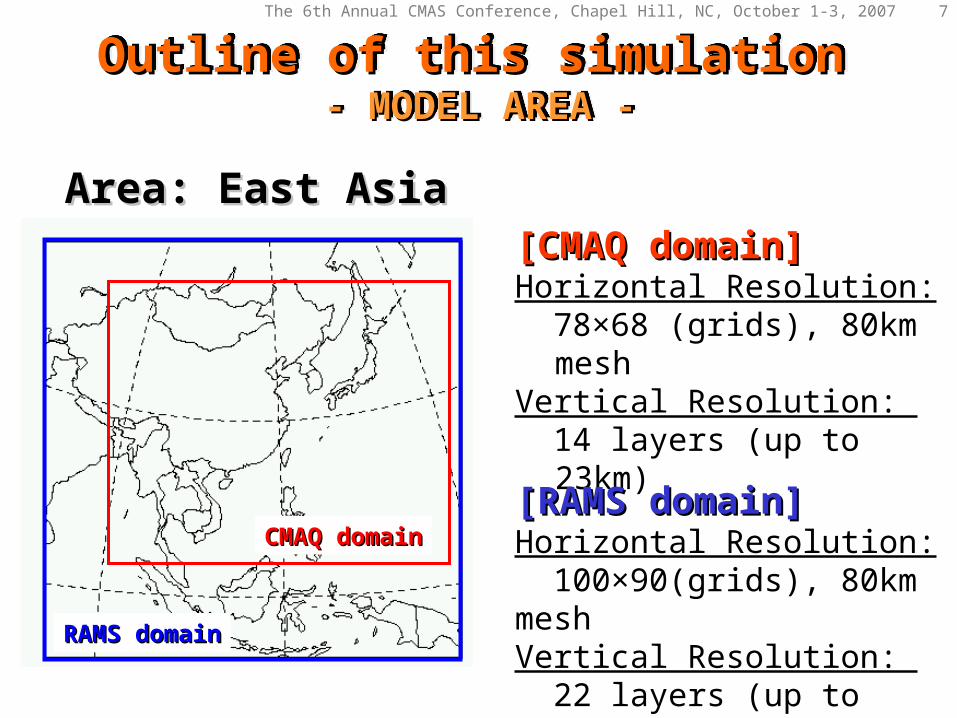
- MODEL AREA -- MODEL AREA -- MODEL AREA -- MODEL AREA -Outline of this simulationOutline of this simulationOutline of this simulationOutline of this simulation
Area: East AsiaArea: East Asia[CMAQ domain][CMAQ domain]Horizontal Resolution: 78×68 (grids), 80km meshVertical Resolution: 14 layers (up to 23km)
The 6th Annual CMAS Conference, Chapel Hill, NC, October 1-3, 2007 8
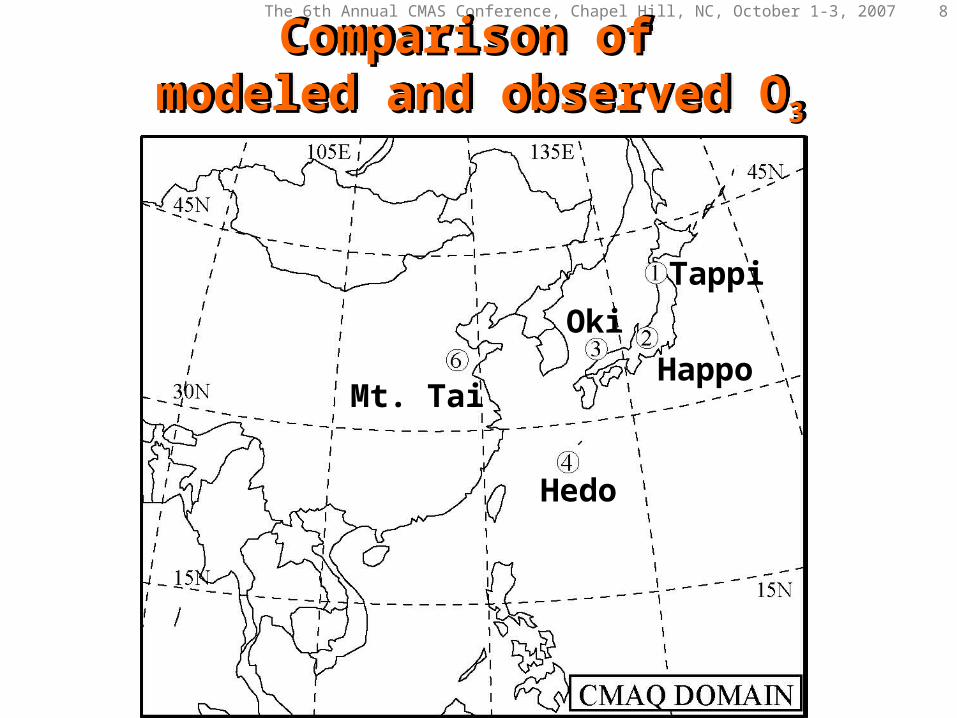
Comparison of Comparison of modeled and observed Omodeled and observed O33
Comparison of Comparison of modeled and observed Omodeled and observed O33
Tappi
Happo
Oki
Hedo
Mt. Tai
The 6th Annual CMAS Conference, Chapel Hill, NC, October 1-3, 2007 9
JAN FEB MAR APR MAY JUN JUL AUG SEP OCT NOV DEC0.21 0.40 0.72 0.65 0.44 0.45 0.64 0.47 0.53 0.55 0.68 0.41
correlation coefficientscorrelation coefficients: R=0.61 (for YR.): R=0.61 (for YR.)JAN FEB MAR APR MAY JUN JUL AUG SEP OCT NOV DEC0.17 0.72 0.37 0.52 0.57 0.81 0.77 0.52 0.90 0.38 0.46 0.49
JAN FEB MAR APR MAY JUN JUL AUG SEP OCT NOV DEC0.28 0.58 0.63 0.58 - 0.82 0.74 0.53 0.66 0.44 0.69 0.29
correlation coefficientscorrelation coefficients: R=0.74 (for YR.): R=0.74 (for YR.)JAN FEB MAR APR MAY JUN JUL AUG SEP OCT NOV DEC0.45 0.43 0.41 0.85 0.81 0.90 0.85 0.56 0.88 0.83 0.78 0.74
The 6th Annual CMAS Conference, Chapel Hill, NC, October 1-3, 2007 13
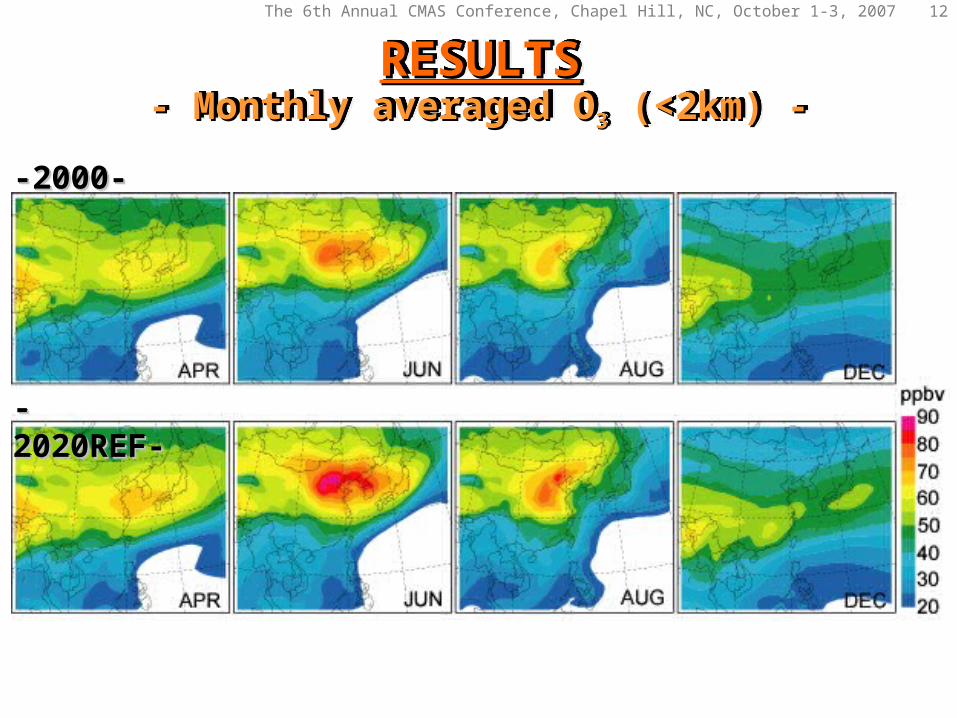
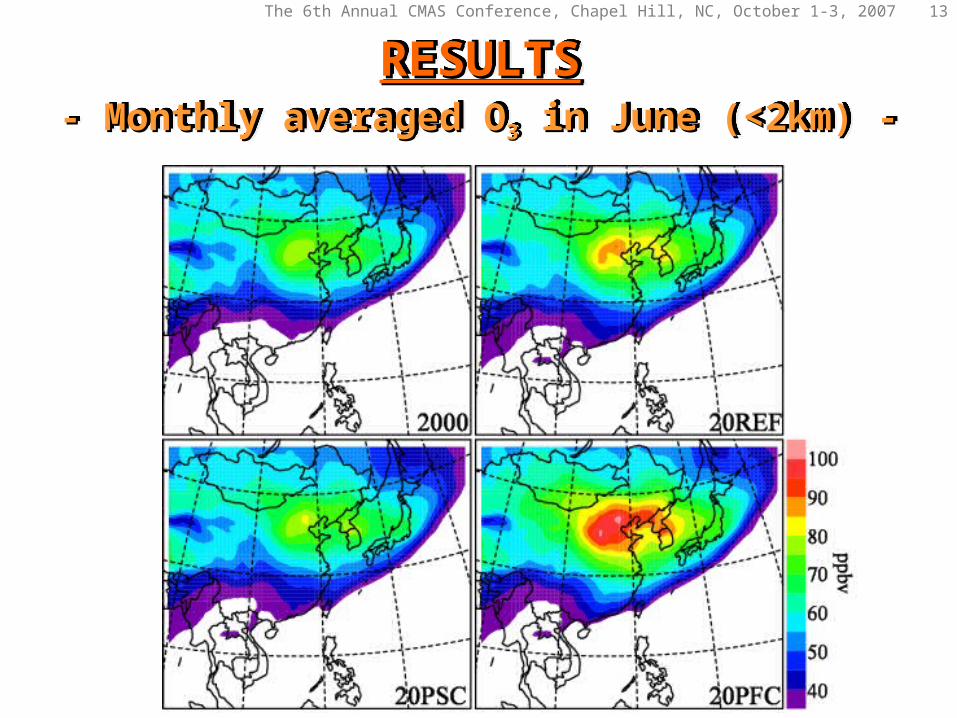
RESULTSRESULTSRESULTSRESULTS- Monthly averaged O- Monthly averaged O33 in June (<2km) - in June (<2km) -- Monthly averaged O- Monthly averaged O33 in June (<2km) - in June (<2km) -
The 6th Annual CMAS Conference, Chapel Hill, NC, October 1-3, 2007 14
20-80 ppm h
70-80ppmh
75-85ppmh
AOT40 AOT40 (Accumulated Exposure Over Threshold of 40ppb)AOT40 AOT40 (Accumulated Exposure Over Threshold of 40ppb)
- For tree: Critical Level 8-21ppm h -- For tree: Critical Level 8-21ppm h -- For tree: Critical Level 8-21ppm h -- For tree: Critical Level 8-21ppm h -
80-120*ppmh * More than 5 times of Critical Level
1-4 times of Critical Level
Critical Level
RESULTSRESULTSRESULTSRESULTS
The 6th Annual CMAS Conference, Chapel Hill, NC, October 1-3, 2007 15
RESULTSRESULTSRESULTSRESULTSWhich precursor’s change, NOx or NMVWhich precursor’s change, NOx or NMV
OC, is sensitive to OOC, is sensitive to O33 growth? growth? Which precursor’s change, NOx or NMVWhich precursor’s change, NOx or NMV
OC, is sensitive to OOC, is sensitive to O33 growth? growth?
*with large anthropogenic emission increases !!*with large anthropogenic emission increases !!larger NOx sensitivity and smaller NMVOC sensitivity larger NOx sensitivity and smaller NMVOC sensitivity
over CEC in June.over CEC in June.
The 6th Annual CMAS Conference, Chapel Hill, NC, October 1-3, 2007 16
SUMMARYSUMMARY SUMMARYSUMMARY Past and future O3 over East Asia has been simulated by using CMAQ and REAS.
This model system can capture O3 concentrations at monitoring sites in East Asia.
REAS PFC with large NOx and NMVOC increases in China will bring about higher O3 in 2020. But, NOx decrease (REAS PSC in 2020) will be helpful to decrease of O3 in China. Additionally, NOx decreases will be also helpful to control O3 increase over East Asia.
Especially in June (with high O3), REAS REF and PFC will bring about considerable high O3 at the North China Plain in 2020.
Based on these model experiments, over CEC in June, O3 concentration is largely affected by NOx emission increases but is not sensitive to NMVOC emission increases.
The 6th Annual CMAS Conference, Chapel Hill, NC, October 1-3, 2007 17


![Regional Report on Ozone Observation Ozone Observation [ RA-II: Asia ] Regional Report on Ozone Observation Ozone Observation [ RA-II: Asia ] Hidehiko.](https://static.documents.pub/doc/80x56/56649f115503460f94c23df0/regional-report-on-ozone-observation-ozone-observation-ra-ii-asia-regional.jpg)


