HAL Id: tel-01064993 https://tel.archives-ouvertes.fr/tel-01064993 Submitted on 17 Sep 2014 HAL is a multi-disciplinary open access archive for the deposit and dissemination of sci- entific research documents, whether they are pub- lished or not. The documents may come from teaching and research institutions in France or abroad, or from public or private research centers. L’archive ouverte pluridisciplinaire HAL, est destinée au dépôt et à la diffusion de documents scientifiques de niveau recherche, publiés ou non, émanant des établissements d’enseignement et de recherche français ou étrangers, des laboratoires publics ou privés. Gamma-rays and neutrons effects on optical fibers and Bragg gratings for temperature sensors Adriana Morana To cite this version: Adriana Morana. Gamma-rays and neutrons effects on optical fibers and Bragg gratings for temper- ature sensors. Optics / Photonic. Université Jean Monnet - Saint-Etienne; Università degli studi (Palerme, Italie), 2013. English. NNT : 2013STET4023. tel-01064993
Transcript
HAL Id: tel-01064993https://tel.archives-ouvertes.fr/tel-01064993
Submitted on 17 Sep 2014
HAL is a multi-disciplinary open accessarchive for the deposit and dissemination of sci-entific research documents, whether they are pub-lished or not. The documents may come fromteaching and research institutions in France orabroad, or from public or private research centers.
L’archive ouverte pluridisciplinaire HAL, estdestinée au dépôt et à la diffusion de documentsscientifiques de niveau recherche, publiés ou non,émanant des établissements d’enseignement et derecherche français ou étrangers, des laboratoirespublics ou privés.
Gamma-rays and neutrons effects on optical fibers andBragg gratings for temperature sensors
Adriana Morana
To cite this version:Adriana Morana. Gamma-rays and neutrons effects on optical fibers and Bragg gratings for temper-ature sensors. Optics / Photonic. Université Jean Monnet - Saint-Etienne; Università degli studi(Palerme, Italie), 2013. English. NNT : 2013STET4023. tel-01064993
electronique et spectroscopie Raman) pour l’etude des mecanismes de formation et trans-
formation des defauts ponctuels et l’evolution structurale en fonction de la sollicitation
radiative.
La these est organisee en 6 chapitres. Dans le chapitre 1 est presentee une breve
introduction sur les fibres optiques a base de silice et les effets du rayonnement. Le
chapitre 2 reprend l’etat de l’art sur les capteurs de temperature a fibres optiques ainsi
que les motivations du choix de reseaux de Bragg (Fiber Bragg Grating ou FBG) inscrit
dans une fibre resistante aux radiations pour l’application visee. Le chapitre 3 presente
un resume detaille sur ce capteur : les differentes techniques utilisees pour inscrire les
reseaux dans differentes classes de fibres, en particulier dans une fibre durcie, et les
differents types de reseaux ainsi que leur reponse sous rayonnement. Deux types de
fibres ont ete retenues dans le cadre de cette etude : dopee au germanium et/ou au fluor.
Grace a leur photosensibilite, les fibres dopees au germanium permettent facilement la
photoinscription de reseaux de Bragg sous UV. Pendant des annees, ces reseaux ont ete le
centre d’attention pour leur utilisation dans des environnements severes. Mais les fibres
dopees au germanium ne presentent qu’une faible immunite au rayonnement ionisant.
En revanche les fibres dopees au fluor presentent une bonne resistance dans certains
environnements radiatifs mais ne permettent pas la photoinscription de FBG au moyen
des installations standards sous UV. Une technologie plus recente utilisant un laser a
impulsions femtosecondes permet de contourner cette difficulte. En consequence, nous
avons etudie principalement les FBG inscrits avec radiation laser femtoseconde a 800 nm
dans les deux types de fibres. Le chapitre 5 presente les principaux resultats de l’etude des
FBG en fonction des traitements thermiques a haute temperature, jusqu’a 750C, et sous
rayonnement X a la temperature ambiante et a 230C. Le chapitre 6 est consacre aux effets
du rayonnement gamma, des neutrons et des traitements thermiques sur la transmission
des fibres. Afin d’identifier l’origine de l’attenuation induite par le rayonnement, plusieurs
techniques spectroscopiques (presentees dans le chapitre 4) ont ete utilisees. Le manuscrit
se termine par quelques conclusions et perspectives de ce travail de these.
5
Introduzione
Oggigiorno l’industria nucleare mostra un interesse crescente nella tecnologia delle fi-
bre ottiche sia per la trasmissione di dati sia come sensori negli impianti nucleari. Les
fibre ottiche offrono diversi vantaggi: hanno dimensioni ridotte, sono leggere e non sono
influenzate dai campi elettromagnetici. Inoltre, i sensori basati su questa tecnologia non
necessitano d’energia elettrica nel punto di rilevamento, hanno una risposta rapida e
possono essere facilmente “multiplexed”, ossia combinati: nel caso di un sensore di tem-
peratura, per esempio, diverse termocoppie possono essere sostituite da una unica fibra,
con una conseguente riduzione delle scorie.
Nonostante questi vantaggi, l’uso dei sensori basati sulle fibre puo essere influenzato
dal livello di radiazione ionizzante. I reattori a fissione sono ambienti estremi: essi sono
caratterizzati dalla dose piu alta di raggi gamma, dell’ordine di grandezza dei GGy per
un ciclo di combustibile, oltre ad un alto flusso di neutroni ed una temperatura di fun-
zionamento superiore ai 300C per i reattori attuali di III generazione. L’esposizione alla
radiazione degrada la trasmissione delle fibre a causa di fenomeni, come l’attenuazione
ottica e la compattazione, con entita e cinetiche che dipendono dalla composizione delle
fibre.
Questo lavoro e stato realizzato in collaborazione con l’AREVA, industria francese
attiva nel settore dell’energia, con l’obiettivo di realizzare un sensore di temperatura re-
sistente all’ambiente di un reattore nucleare di IV generazione, veloce raffreddato al sodio:
il sensore deve sopportare, in due anni, una dose gamma di circa 0.2 GGy, un flusso di
neutroni di 1019 n cm−2 e una temperatura di funzionamento di circa 550C. La tecnolo-
gia attualmente utilizzata, ossia le termocoppie, presenta una sistematica deriva della
misura dovuta alla radiazione, che necessita di una calibrazione, e un tempo di risposta
di un secondo. Per eliminare questi errori sistematici, ridurre il tempo di risposta (fino a
0.5 s) e aumentare la precisione, possono essere considerate due alternative: migliorare la
stessa tecnologia o svilupparne una nuova. Dati i vantaggi sopra descritti, e stato scelto
un sensore di temperatura a fibre ottiche. Inoltre, utilizzare la tecnologia a fibre ottiche
migliora la sicurezza grazie alla diversificazione dei sensori di temperatura. Fino ad oggi,
nonostante molti ricercatori abbiano focalizzato la loro attenzione sulle prestazioni dei
sensori a fibre ottiche, non esiste ancora un modello predittivo. Quindi, per comprendere
il comportamento di tali sistemi in un ambiente estremo come il nucleo di un reattore
nucleare, abbiamo utilizzato un approccio sperimentale basato su tecniche complementari
come l’attenuazione indotta dalla radiazione, la fotoluminescenza, la risonanza paramag-
netica elettronica e la spettroscopia Raman, per studiare i meccanismi di formazione e
6 Introduction
trasformazione dei difetti di punto e l’evoluzione stutturale.
La tesi e organizzata in 6 capitoli. Nel capitolo 1 viene presentata una breve in-
troduzione sulle fibre ottiche in silice e gli effetti indotti dalla radiazione. Al fine di
individuare la tecnologia piu promettente adatta per la richiesta dell’Areva, nel capitolo 2
viene riportato lo stato dell’arte sui sensori di temperatura a fibre ottiche. Il sensore scelto
per l’applicazione e un reticolo di Bragg (Fiber Bragg Grating o semplicemente FBG) is-
critto in una fibra resistente alle radiazioni. Il capitolo 3 riporta uno studio dettagliato su
questo sensore: le differenti tecniche utilizzate per iscrivere i reticoli nelle diverse classi di
fibre, e in particolare in una resistente alla radiazione, i differenti tipi di reticoli e la loro
risposta sotto irraggiamento. Quindi, la nostra ricerca e stata indirizzata a determinare il
componente piu tollerante alla radiazione realizzato da una fibra ed un FBG inscritto in
essa. Due tipi di fibre sono state prese in considerazione, drogate con germanio e/o con
fluoro. A causa della loro fotosensibilita, i FBG possono essere iscritti in fibre dopate con
germanio usando luce laser UV e, per anni, sono stati al centro dell’attenzione di molti
ricercatori per il loro uso in ambienti nucleari. Le fibre drogate con fluoro, invece, sono
resistenti alla radiazione laser UV, sia continua sia pulsata al nanosecondo; l’iscrizione di
reticoli in tali fibre puo essere realizzata solo utilizzando laser al femtosecondo. Di con-
seguenza, abbiamo studiato principalmente FBG iscritti con radiazione laser a 800 nm con
impulsi al femtosecondo in entrambi i tipi di fibre. Il capitolo 5 riporta i risultati piu im-
portanti che riguardano il loro comportamento durante trattamenti ad alta temperatura,
fino a 750C, e durante irraggiamenti X realizzati sia a temperatura ambiente sia a circa
230C. Il capitolo 6 e dedicato agli effetti sulla trasmissione della fibra della radiazione
gamma, dei neutroni e dei trattamenti termici. Per identificare l’origine dell’attenuazione
indotta dalla radiazione, sono state utilizzate varie tecniche spettroscopiche (riportate nel
capitolo 4). Infine, sono riportate le conclusioni e le prospettive di questo lavoro di tesi.
7
Chapter 1
Background on optical fibers and
radiation effects
Before dealing with the fiber optic sensors in radiative environment, it is useful to
introduce the optical fibers and the effects induced by the radiation on them and to
provide the background to understand the results reported in this thesis. The chapter
starts with a general description of optical fibers and some of their properties; it continues
with the silica optical fibers: the structure and the most common defects of the silica
glass, pure and doped with germanium, will be presented. Finally, the radiation effects
on optical fibers will be introduced.
1.1 Optical fibers
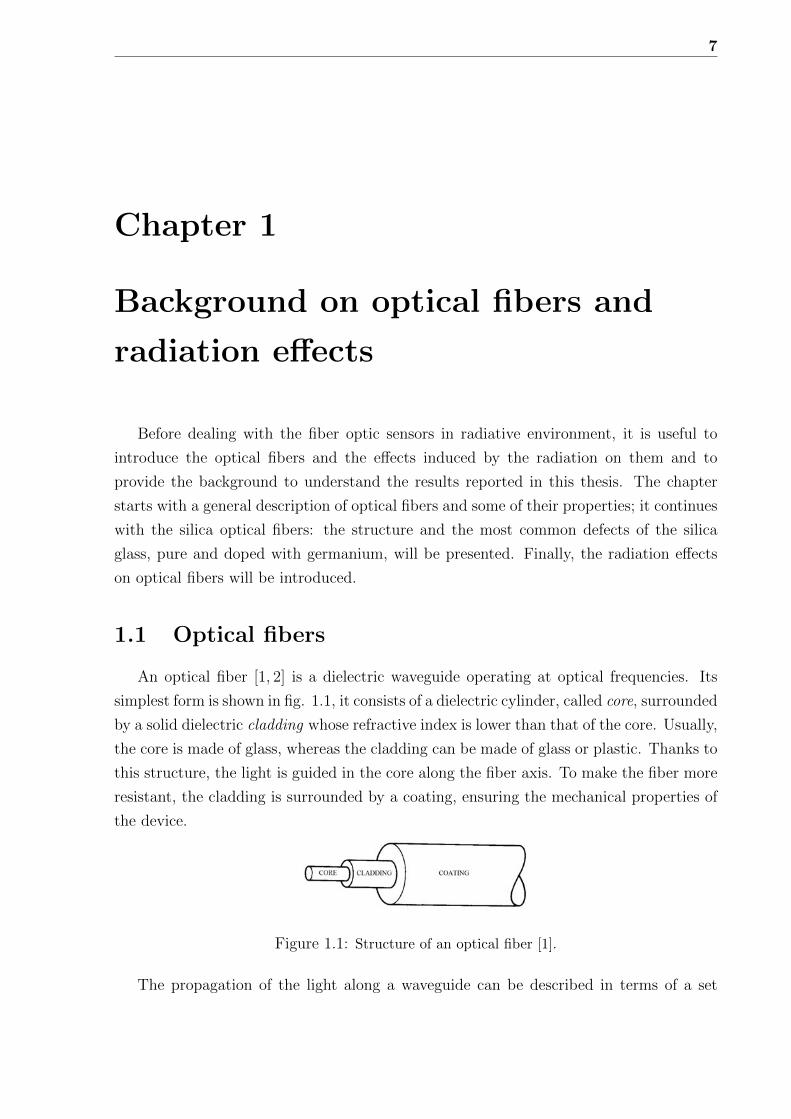
An optical fiber [1, 2] is a dielectric waveguide operating at optical frequencies. Its
simplest form is shown in fig. 1.1, it consists of a dielectric cylinder, called core, surrounded
by a solid dielectric cladding whose refractive index is lower than that of the core. Usually,
the core is made of glass, whereas the cladding can be made of glass or plastic. Thanks to
this structure, the light is guided in the core along the fiber axis. To make the fiber more
resistant, the cladding is surrounded by a coating, ensuring the mechanical properties of
the device.
Figure 1.1: Structure of an optical fiber [1].
The propagation of the light along a waveguide can be described in terms of a set
8 Chapter 1: Background on optical fibers and radiation effects
of finite members of guided electromagnetic waves. Depending on the number of modes
propagating through the core, the fiber is known as:
• single-mode (SM), if only one mode, the fundamental one, is guided in the core; this
corresponds to a core diameter of about 8-12 µm, for fibers operating at IR telecom
wavelengths;
• multi-mode (MM), if it can support several modes and it is characterized by a core
diameter between 50 and 200 µm, for fibers working in the IR.
In fact, a single-mode fiber behaves as such only for wavelengths longer than a value
known as cutoff wavelength [1]:
λcutoff =2πrcoreV
√n2core − n2
clad (1.1)
where V , the normalized frequency, is 2.405, for the telecommunication fibers. Generally,
λcutoff is around 1250 nm in telecom fibers.
Depending on the refractive index profile (fig. 1.2), the fiber is called:
• step-index (SI), if the refractive index of the core is uniform and undergoes an abrupt
change at the core-cladding interface;
• graded-index (GI), if the refractive index changes gradually with the radial distance
inside the core. A particular graded-index fiber is the multi-step index fiber, whose
refractive index parabolic profile is approximated by several steps.
(a) (b)
Figure 1.2: Refractive index profile for (a) a step-index and (b) a graded-index fiber.
Another important parameter for an optical fiber is the numerical aperture (NA), a
dimensionless quantity less than unity, which represents its capability of collecting light.
For a step-index fiber, NA depends on the refractive index of the core and the cladding [1]:
1.1 Optical fibers 9
NA =√n2core − n2
clad (1.2)
Fiber loss
Optical attenuation is one of the most important properties of an optical fiber: it is
the reduction of optical power as light travels through the waveguide; indeed, it is defined
as the ratio of the optical output power from a fiber of length L to the optical input power
and it is reported in dB/km. Fig. 1.3 reports a typical attenuation spectrum for a silica
optical fiber.
Figure 1.3: Attenuation spectrum of a silica based optical fiber [2].
The mechanisms causing the attenuation are [1]:
• scattering, that arises from microscopic variations in the material density or from
structural inhomogeneities and depends on 1/λ4;
• absorption, that can be due to the fiber material constituents, as:
– the IR-tail associated with the vibration modes of the molecules,
– the UV-tail that is associated with the electronic transitions from the valence
to conduction bands and decays exponentially with increasing wavelength,
10 Chapter 1: Background on optical fibers and radiation effects
or to impurities, as the OH groups which absorb around 2.73, 1.38 and 0.95 µm, or
the defects in the glass, whose most common are reported in the next section;
• bending losses, particularly macrobending, when the fiber undergoes a bend having
a radius larger than the fiber diameter, i.e. when a fiber turns a corner, and
microbending, that is microscopic bends of the fiber axis, due, for example, to
the drawing fabrication step or the incorporation into cables.
Generally, single-mode fibers have lower attenuation than the multi-mode ones, especially
for silica-based optical fibers.
1.2 The silica glass
The material, that the fibers studied in this thesis are made of, is the silica glass.
To produce two materials having slightly different refractive indices, dopants have to be
added during the fabrication process, as GeO2 in the core or F in the cladding, to increase
the refractive index of the core or to decrease that of the cladding, respectively [1].
Two types of fibers have been mainly studied in this thesis: the Germanium-doped
fibers, known for their photo-sensitivity, and the Fluorine-doped fibers, known for the
radiation resistance to high γ-doses, reported in literature. To have a clear picture on the
used materials, in this section the structure and the most common defects of the pure and
the Ge-doped silica will be briefly introduced.
1.2.1 Silica: structure and defects
The amorphous silicon dioxide, known as silica (a-SiO2), can be considered as a Con-
tinuous Random Network (CNR) of SiO4 tetrahedra joined by bridging oxygen atoms [3].
The structural unit is the SiO4 tetrahedron consisting of a silicon atom bounded with four
oxygens atoms with the Si-O bond length of 1.62 A and the O-Si-O angle of 109.5, as for
the quartz that is its crystalline form. The disorder of the glassy state is related to the
continuous distribution in intertetrahedral Si-O-Si angle and torsion angles, in particular
the Si-O-Si angle varies between 120 and 180, with a maximum around 144 − 150,
which are the values for the two types of quartz (α and β, respectively) [4]. The silica
structure is constituted by n-membered (Si-O)n rings, where n is distributed between 3
and 10, with most of the rings having 6-7 size [4]. It was demonstrated that the 3-rings
are planar and characterized by Si-O-Si angle of 130.5 and strained Si-O bonds, whereas
the 4-rings can not be planar but slightly puckered with Si-O-Si angle of 160.5 [5, 6].
1.2 The silica glass 11
The presence of dopants or impurities, the fiber drawing and the radiation generate
defects in the glass matrix. The most common intrinsic defects are listed below [7] and
for each of them the structure is shown in fig. 1.4 and it is denoted with the most used
symbolism, where (≡) and (=) indicate the bonds of a Si with three or two O atoms,
whereas (·) and (··) represent an unpaired electron and two paired electrons in the same
orbital:
• E ´ center (≡Si·): it consists of a dangling silicon bond, with an unpaired spin in
half-filled sp3 orbital; this gives rise to a characteristic narrow EPR signal with axial
symmetry;
• neutral oxygen vacancy or ODC(I) (≡Si-Si≡): it consists of a bonding between two
Si atoms and it is diamagnetic;
• twofold coordinated silicon or ODC(II) (=Si··): it consists of a Si coordinated with
two O atoms and having a lone pair (that is two paired electrons in the same orbital),
it is a diamagnetic center;
• non-bridging oxygen hole center or NBOHC (≡Si-O·): it consists of a dangling
oxygen bond; as it has an unpaired spin in an oxygen p orbital, it is paramagnetic;
• peroxy linkage (≡Si-O-O-Si≡): it is a vacancy of silicon and it is diamagnetic;
• peroxy radical or POR (≡Si-O-O·): it consists of a Si atom linked to an oxygen
molecule with an unpaired electron that is delocalized on the two O atoms and
makes the center paramagnetic;
• self trapped hole or STH [8], that are stable at temperatures lower than 200 K and
can be divided in two types:
– STH1 consists of a hole trapped on a normal bridging oxygen in the glass
matrix,
– STH2 is tentatively ascribed to a hole trapped on two normal oxygens;
• self trapped exciton or STE.
The defects give rise to electronic states within the bandgap and so to absorption
bands, mainly in the UV and visible part of the spectrum. Fig. 1.5 reports the absorption
(OA) bands associated with these defects [9]. However, the attribution is often not certain:
whereas for the paramagnetic centers it is based on the correlation between the EPR
signals and the OA bands, for the diamagnetic ones it is possible thanks to computational
works or by observing defects conversion due to thermal treatments.
12 Chapter 1: Background on optical fibers and radiation effects
Figure 1.4: Intrinsic point defects in silica: at the top oxygen deficient centers and at the
bottom oxygen excess-related centers [7]. The dark and light gray spheres represent O and Si
atoms, respectively.
Figure 1.5: Summary of the main optical absorption bands of the Si-related defects in semi-
logarithmic plot [9].
1.2.2 Ge-doped silica: structure and defects
The germanium is isoelectronic with the silicon and its amorphous oxide, known as
germania (a-GeO2), has the same structure of the silica. It is composed by tetrahedra
linked through their corners, but the distribution of the Ge-O-Ge angle is peaked around
132 and is narrower and the Ge-O bond is longer, 1.74 A, than in the case of a-SiO2 [10].
1.3 Radiation induced effects on optical fibers 13
When GeO2 is incorporated into the silica glass, most of the small SiO4 rings convert
to larger mixed Ge/Si rings; so, the network is constituted by large (≥6-membered)
SiO4 rings, large (≥6-membered) mixed rings and small and large (≥3-membered) GeO4
rings [10].
Due to the similarity between Si and Ge atoms, several Ge-related point defects are
structurally identical to Si-related centers apart from the substitution of Si with Ge [11],
as the GeE´center (≡Ge·) and the Ge-NBOHC (≡Ge-O·), structurally identical to the E
and the NBOHC, respectively, or the Ge-lone pair center, briefly GLPC (=Ge··), that is,
as the twofold coordinated silicon, a dicoordinated Ge atom with a lone pair [12]. Other
defects are the germanium electron centers:
• Ge(1) center (GeO4·): it consists of an electron trapped by a substitutional tetra-
coordinated Ge atom, it is a paramagnetic defect, typical only of the Ge-doped
silica and not present in pure GeO2, because the electron has to be localized on a
Ge atom, condition verified when it has Si atoms as its neighbors [12];
• Ge(2) center, whose structure is still not unambiguously identified: a first model
associates it with an electron trapped at a GeO4, such as the Ge(1) center, but
having a Ge atom as nearest neighbor [12,13], whereas, according to a second model,
it consists of an ionized GLPC (=Ge·) [14];
and the GeX center, that is a diamagnetic defect whose structure is unknown but to whom
an absorption band has been associated [15,16].
The absorption bands associated with these Ge-related defects are reported in fig. 1.6.
As for the Si-related defects, the attribution is still open to debate at least for the
diamagnetic centers.
1.3 Radiation induced effects on optical fibers
A lot of researches demonstrated that the optical fiber properties change under
irradiation, especially the transmission that is deteriorated because of three important
phenomena:
• Radiation Induced Attenuation (RIA): the fiber attenuation increases because of the
absorption bands of the point defects generated by the radiation through ionization
and knock-on processes;
• Radiation Induced Emission (RIE): the photoluminescence emitted by some of
centers (preexisting or induced by radiation), excited by the radiation itself, or
the Cerenkov emission superpose on the transmitted signal;
14 Chapter 1: Background on optical fibers and radiation effects
Figure 1.6: Summary of the main optical absorption bands of the Ge-related defects in semi-
logarithmic plot [9].
• compaction, that is a fractional increase of the silica density ρ.
The radiation response of the fibers depends on several parameters [17]:
• the chemical composition and the fabrication process;
• the experimental measurement conditions, as wavelength and power of light propa-
gating in the fiber;
• the irradiation conditions, as nature of the incident particles, accumulated dose,
dose rate and temperature.
For the compaction, its dependence on the radiation dose D has been found for the
silica glass [18]:∆ρ
ρ∝ Dc (1.3)
where
c =
2/3 for γ − rays
1 for neutrons(1.4)
However, the γ-radiation induced effects depend on the glass strain and even a dilatation
(negative compaction) can be observed, above all in the sample pre-compacted by other
processes [19].
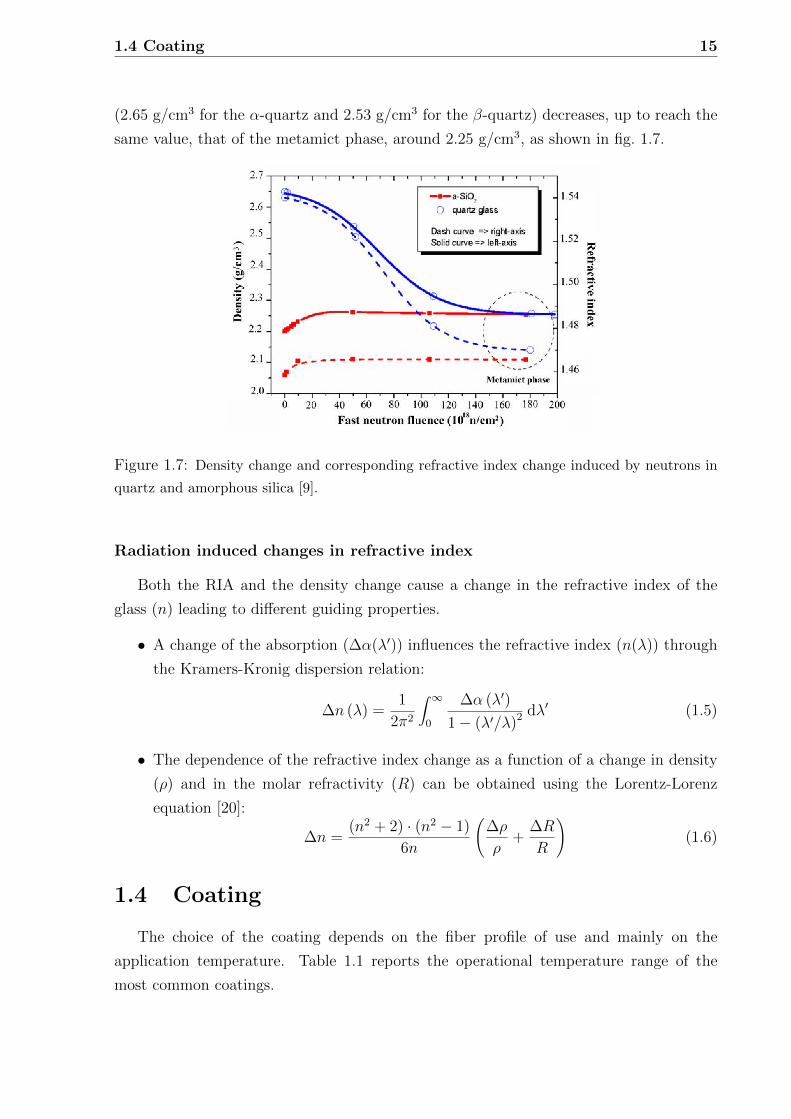
It is worth noting that neutron irradiation transforms the structure of silicon dioxide,
both amorphous and crystalline, into a new phase, known as metamict phase, character-
ized by a narrower Si-O-Si angle, around 135. As a consequence, with increasing neutron
fluence, the density of amorphous silica (2.20 g/cm3) increases, whereas that of the quartz
1.4 Coating 15
(2.65 g/cm3 for the α-quartz and 2.53 g/cm3 for the β-quartz) decreases, up to reach the
same value, that of the metamict phase, around 2.25 g/cm3, as shown in fig. 1.7.
Figure 1.7: Density change and corresponding refractive index change induced by neutrons in
quartz and amorphous silica [9].
Radiation induced changes in refractive index
Both the RIA and the density change cause a change in the refractive index of the
glass (n) leading to different guiding properties.
• A change of the absorption (∆α(λ′)) influences the refractive index (n(λ)) through
the Kramers-Kronig dispersion relation:
∆n (λ) =1
2π2
∫ ∞0
∆α (λ′)
1− (λ′/λ)2 dλ′ (1.5)
• The dependence of the refractive index change as a function of a change in density
(ρ) and in the molar refractivity (R) can be obtained using the Lorentz-Lorenz
equation [20]:
∆n =(n2 + 2) · (n2 − 1)
6n
(∆ρ
ρ+
∆R
R
)(1.6)
1.4 Coating
The choice of the coating depends on the fiber profile of use and mainly on the
application temperature. Table 1.1 reports the operational temperature range of the
most common coatings.
16 Chapter 1: Background on optical fibers and radiation effects
Optical fiber coating Operational temperature range (C)
acrylate -50 → 85
polymide -190 → 350
aluminium -269 → 400
copper -269 → 500
gold -269 → 700
Table 1.1: Operational temperature range of the most common coatings.
It is important to note that the coating can influence the fiber degradation, above all
under neutron or proton irradiation. Fig. 1.8 displays the RIA of a pure silica fiber (KS4V)
with two different coatings, subjected to both γ-rays and neutrons: a higher absorption
band associate with the SiOH groups is observed in the polymer coated fiber. Its origin
is linked to the neutron-induced knock-on processes: hydrogen nucleii are released from
the coating and embedded into the fiber, resulting in H-related species [21].
Figure 1.8: Comparison of the RIA in the infra-red region of two KS4V fibers: one metal
coated (dashed line) and the other polymer coated (continuous line). The γ-doses and the
neutron fluences (above 1 MeV) are: (a) 34 MGy and 1.46 · 1017 n/cm2 and (b) 150 MGy and
6.19 · 1017 n/cm2 [21].
This chapter provides an introduction to the optical fibers, the effects of radiation and
the main defects of pure and germanium-doped silica.
1.4 Coating 17
Ce chapitre presente une introduction sur les fibres optiques et les effets des radiations
ainsi que les principaux defauts de la silice pure et dopee au germanium.
In questo capitolo, e presentata un’introduzione sulle fibre ottiche e gli effetti della
radiazione, insieme ai principali difetti della silice pura e drogata con germanio.
18 Chapter 1: Fiber Optic Temperature Sensors
19
Chapter 2
Fiber Optic Temperature Sensors:
advantages and limitations in
radiative environments
Since the first experiments on optical fibers several research groups have focused their
attention on developing this technology not only for telecommunication but also for sens-
ing applications. In fact, the optical fiber properties depend on several parameters, as
temperature, strain, pressure, refractive index of the surrounding environment, therefore
they can be used as sensors. The optical fiber sensors (OFS) have all the advantages which
characterize optical fibers, as small size, light weight and resistance to electromagnetic
interference, as well as no need of electrical power at the sensing point and the ability to
be easily multiplexed [22,23].
All these excellent features make OFSs an interesting alternative for applications in
harsh environments; however, as introduced in chapter 1, optical fibers suffer from a
degradation of their properties under radiation and this influences the OFS response and
compromises their use in a radiative environment.
Independently of the physical parameter to measure, sensors can be distinguished by
their measurement principles: they can use a variation of the signal intensity, frequency
or polarization. Generally, the frequency-based techniques are more accurate.
This chapter will deal with the fiber optic temperature sensors, their working principles
and features, advantages and limitations in harsh environments, highlighted by previous
studies reported in literature. In particular, we will focus our attention on:
• Blackbody Sensor;
• Distributed Sensors, that allow the temperature monitoring along all the fiber
20 Chapter 2: Fiber Optic Temperature Sensors
length:
– Rayleigh Scattering,
– Raman Scattering,
– Brillouin Scattering;
• Fiber Grating Sensors:
– Fiber Bragg Grating,
– Long Period Grating.
2.1 Blackbody sensor
The blackbody sensor is one of the oldest and it consists of a high temperature resistant
optical fiber, as a sapphire fiber (working at temperature up to 2000C), with an end
covered with a thin (∼µm) metallic film (generally made of platinum or iridium) and
then with a protective film of aluminum oxide, as shown in fig. 2.1 [24].
Figure 2.1: Schema of a blackbody sensor using a sapphire fiber [24].
This end realizes a quasi blackbody cavity; however, some of these sensors use the light
generated directly in the fiber core, without any metallic film [25].
The emission from such a cavity at a wavelength λ is proportional to the blackbody
emission and it depends on the environment temperature T , according to the Planck’s
law [26]:
W (λ, T ) =2hc2
λ5
1
exp(
hcλKBT
)− 1
(2.1)
By recording the signal emitted by the cavity in a spectral region, that is:
W (T ) =∫ λ2
λ1W (λ, T ) dλ (2.2)
2.1 Blackbody sensor 21
the temperature can be determined by the ratio of the power W(T) measured at the
temperature T to W(T0), recorded at a reference temperature T0. In this way, the signal
dependence on system parameters such as emissivity, that can change because of con-
taminations during its employment, is eliminated; however, the sensor losses sensitivity,
because of dividing two nearly similar signals [24].
Moreover, the emission W (λ, T ) (Eq. 2.1) presents a maximum at a wavelength (λmax)
that shifts towards the blue with increasing temperature, following the Wien’s displace-
ment law:
λmax · T = 2.898 · 10−3 K m (2.3)
so, the temperature can be calculated by using this property, but it is mandatory to find
an easy way to determine λmax.
This sensor is mainly based on intensity measurements: since a fraction of the emitted
light is absorbed as it travels from the sensing tip to the detector, the fiber attenuation
should be accounted for, because it decreases the signal intensity and it can also change
the shape of the curve W (λ, T ).
Blackbody sensors can operate over a wide range of temperatures. However, in the
low temperature region the signal intensity is very weak and this causes a degradation
of the resolution [24]. The optimum measuring temperature range depends on the fiber
material:
• for a sapphire fiber, the range is (500-1900)C, because the melting point of the
sapphire is 2070C, and the temperature resolution is about 0.5C [24];
• for a silica fiber, the range is (300-1000)C, indeed in this range the thermal radiation
is largest in the intermediate infrared region where the silica fibers do not present
absorption bands, and the temperature measure is determined with a precision of
about 0.05% [25].
Moreover, the measurement time depends on the small size (on the order of µm) and the
heat conduction of the blackbody cavity [24] and it can be even lower than 20 ms [27].
Under radiation
This sensor was tested in a nuclear reactor, with a γ-dose rate of 18 MGy/h and a
neutron flux of 5.1·1014 n cm−2 s−1, for 300 h irradiation time (that means an accumulated
γ-dose of about 5 GGy) [25]. Under these conditions, the sensor works well only for
temperatures higher than 300C; instead, below 250C the blackbody emission is weak and
22 Chapter 2: Fiber Optic Temperature Sensors
the main component of the measured light consists of the Cerenkov emission induced by
the radiation. However, both RIE and RIA have to be taken in account, as they influence
the blackbody emission and the temperature measurement. The obtained precision is
about 2% around 650C.
2.2 Distributed Sensors
When a pulse light is launched into a fiber, it can be transmitted, absorbed and
scattered. The scattering can be:
• elastic, if the scattered light is at the same wavelength as the incident one, for
example Rayleigh scattering and Fresnel reflections;
• inelastic, if a wavelength change happens, as Raman and Brillouin scatterings.
Fig. 2.2 shows all the scattered signals.
Figure 2.2: Spectrum of all the scattered signals [28].
Sensors based on the measurement of these signals are named distributed because they
allow to determine the temperature all along the fiber length.
2.2.1 Rayleigh sensor
Rayleigh scattering is known as the strongest scattering that occurs in a fiber. It is
an elastic scattering caused by random fluctuations in the refractive index profile, due to
2.2 Distributed Sensors 23
variations in density or dopants concentration. For a given fiber, the scattered amplitude
as a function of distance is a random but static property of the fiber: an external stimulus,
as temperature or strain, causes changes in the locally reflected spectrum. Then, by
comparing the Rayleigh signal profile with that recorded at a reference temperature, as
room temperature (RT), the temperature changes can be estimated.
There are different techniques to measure the Rayleigh backscattered signal.
The simplest technique to measure the scattered intensity is the Optical Time Domain
Reflectometer (OTDR) [28]: a pulsed signal is transmitted in a fiber end and the back-
scattered signal is recovered from the same end, as a function of position along the fiber,
as shown in fig. 2.3.
Figure 2.3: Basic optical arrangement of an OTDR [28].
The position z is obtained by the two-way propagation delay, 2t, through the expression:
z = vg · t (2.4)
where vg is the group velocity of light in the fiber. Therefore, the spatial resolution de-
pends on the pulse width: a 10 ns pulse implies a spatial resolution of 1 m.
The temperature sensor using the OTDR is based on intensity measurements [29]: the
temperature is obtained from the ratio of the scattered intensity recorded at a reference
temperature and that after heat was applied at some point along the fiber length. This
ratio depends linearly on temperature in the range between RT and ∼800C with a sensi-
bility of about 0.015 %/C. The temperature resolution is around 15C. The measurement
time is less than 1 minute.
Another technique often used is the Swept Wavelength Interferometry (SWI) [30],
shown in fig. 2.4. The light of a tunable laser source (TLS) is split between the reference
and measurement arms of an interferometer: while the reference light is split between the
two orthogonal polarization states, the light in the measurement arm is reflected from
the fiber under test (FUT); the interference between the measurement light and the two
24 Chapter 2: Fiber Optic Temperature Sensors
polarization states is recorded by detectors. The analysis of these interference patterns
lets obtain the complex reflection coefficient of the FUT as a function of wavelength and,
finally, the Rayleigh scatter as a function of length is calculated via the Fourier transform.
Figure 2.4: Optical arrangement of a SWI [30].
Figure 2.5: SWI as temperature sensor: (a) scatter amplitudes along a 5 mm fiber segment
before and after heating; (b) corresponding wavelength spectra; (c) cross-correlation of these
spectra [30].
The temperature sensor using a SWI is realized by comparing, on short fiber length
∆x of order of magnitude of mm, the Rayleigh scatter signature of the FUT with that of
reference, recorded at RT, as illustrated in fig. 2.5 [30]: a temperature change in one of
these fiber segments induces a shift in the Rayleigh signal spectrum corresponding to that
∆x (fig. 2.5(a)); the spectra are Fourier transformed in the frequency domain (fig. 2.5(b))
2.2 Distributed Sensors 25
and finally the calculated complex cross-correlation between reference and measured data
shows a peak that shifts proportionally with the temperature variation (fig. 2.5(c)).
For a sensor realized with a SWI and a standard fiber, the temperature range is
from RT to ∼850C and the sensibility, that is related to the correlation-peak shift for
a temperature change, is around 10 pm/C and it depends on the fiber composition,
for example it increases with a high concentration of germanium in the fiber core. The
segment ∆x size corresponds to the spatial resolution and, together with the signal-noise
ratio, it determines also the temperature resolution: if ∆x = 5 mm, the temperature
resolution is around 0.3C, but it improves up to 0.1C, by increasing ∆x to 10 mm [30].
The measurement time is tens of seconds, for example it is 5 s for a fiber length of less
than 40 m and the scan range of the laser wavelength is about 40 nm [31].
Under radiation
A Rayleigh sensor using the SWI technique was tested under a neutron flux of 1.2 ·1013
n cm−2 s−1 and γ-dose-rate of 1 MGy/h: it worked well, at least for 13 hours [31].
2.2.2 Raman sensor
Raman scattering is an inelastic scattering of a photon on molecules with the creation
or the annihilation of an IR phonon [32], it is illustrated in fig. 2.6 for a system having
two vibrational levels of energy E1 and E2 (where E2 > E1). The system is excited by
an incident photon of frequency ω0 from the initial state, not necessarily the ground, to
a virtual state, before coming back to another state, different from the initial one:
• if the system absorbs energy from the incident photon, the first will be in a higher
vibrational level, whereas the scattered photon will have frequency ωS lower than
ω0 (Stokes Raman scattering);
• if the emitted photon absorbs energy from the system, its final vibrational state will
be lower than the initial one, whereas the scattered photon will have frequency ωAS
higher than ω0 (anti-Stokes Raman scattering).
The phonon that is emitted or absorbed, respectively in the Stokes and anti-Stokes
scattering, has frequency ∆ν ∼ 1.3 · 1013 Hz for the fused silica.
The differential cross section (dσ/dΩ) for Stokes and Anti-Stokes scatterings depends
differently on the temperature T [33]:
dσSdΩ' νS
4
1− exp (−h∆ν/KB T )(2.5)
26 Chapter 2: Fiber Optic Temperature Sensors
Figure 2.6: Schema of Raman scattering for a system with two vibrational levels: the ar-
rows show the transitions induced by the absorption and the emission of photons, which are
represented by waves.
dσASdΩ
' νAS4
exp (h∆ν/KB T )− 1(2.6)
As the pulses, both the laser light and the scattered signals, propagate through the
fiber, they are attenuated. If P0 is the pump power at the wavelength λ0, the intensity
of the anti-Stokes and Stokes signals scattered in a point z of the fiber can be expressed
by [33]:
IS(z, T ) = P0AS(T ) exp(−∫ z
0(α(λ0, u) + α(λS, u)) du
)(2.7)
IAS(z, T ) = P0AAS(T ) exp(−∫ z
0(α(λ0, u) + α(λAS, u)) du
)(2.8)
where AS and AAS are the Raman scattering cross sections, dependent on T and propor-
tional to the differential cross sections averaged over the capture fraction. α(λ, u) is the
attenuation of a point u of the fiber, at the wavelength λ.
The Raman sensor working is based on the intensity ratio of the anti-Stokes signal to
the Stokes one (sometimes, the Rayleigh signal is used instead of the Stokes one) [34]:
R(T, z) =IAS(z, T )
IS(z, T )=(νASνS
)4
· exp
(− h∆ν
KB T
)exp
(−∫ z
0(α(λAS, u)− α(λS, u)) du
)(2.9)
This ratio is unaffected by the power fluctuations but it depends on the differential loss∫ z0 (α(λAS, u)− α(λS, u)) du that can be not constant with time or uniform along the fiber
in harsh environments.
In absence of ionizing radiation, by neglecting the differential loss, the temperature
can be easily calculated by comparing the ratio R(T, z) with that recorded at a reference
temperature (T0):
2.2 Distributed Sensors 27
T =
(1
T0
− KB
h∆ν· ln
(R(T )
R(T0)
))−1
(2.10)
However, several solutions have been already proposed to correct for the attenuation
losses [33, 35].
The most used technique to measure the scattered intensity is the Optical Time
Domain Reflectometer (OTDR), discussed in the previous section.
For a Raman distributed temperature sensor using an OTDR and commercial fibers
[36–39], the temperature resolution can reach 0.1C and the temperature accuracy is
around ±(1-2)C, whereas the spatial resolution is mainly governed by the laser pulse
and the detector response time and it varies from 10 cm [40] to few meters; the maximum
distance range is 2 km [37, 41]. The temperature range, instead, depends mainly on the
fiber coating [38]: there is no example reported in literature at temperature higher than
550C. The measurement time is closely linked to the OTDR performances: it is few
seconds [41] but it can reach ∼6 min for the ultra high resolution sensor [40].
The most suitable fibers for sensors based on the Raman scattering are fibers with
a large core and/or a large numerical aperture because of its larger Raman scattering
efficiency [37].
Under radiation
Under radiation, as previously announced, the main cause of errors is the radiation-
induced attenuation, since the Raman systems rely on optical intensity measurements.
For example, an attenuation difference between the Stokes and anti-Stokes signals of
0.1 dB/km causes, at the end of 1 km long fiber, a temperature error of about 2C if the
fiber is γ-irradiated at 300C [41] and of about 7C when it is is γ-irradiated at 80C [42].
Different solutions have been found to correct these errors caused by the losses:
1. Method with thermocouple data, when the radiation-induced loss distribution is
uniform [43]: by measuring with two thermocouples the true values of the temper-
ature at the two ends of the fiber and by measuring with the Raman technique the
values obtained at the two ends and in a point along the fiber, the true value at this
point can be extrapolated.
2. Method with loop arrangement, valid even when the losses are not uniform [43]:
the fiber is arranged like a loop in order to have two parts set as close as possible
so that the temperature and the radiation conditions can be assumed to be the
28 Chapter 2: Fiber Optic Temperature Sensors
same; by comparing the measured intensity in two points in the first part and their
corresponding in the second part, the induced loss between the two parts can be
calculated and so the true value of the temperature in the second point can be
obtained, if the true temperature in the first point is known.
3. Method with double ended measurement [34]: in contrast with the previous meth-
ods, the sensing fiber is probed first from one end and then the laser source is
switched into the other end for a second measurement; the geometric mean of the
two signals eliminates the errors linked to bending and RIA.
Single-ended arrangements can hardly perform accurate distributed temperature mea-
surements in nuclear environments, without a compensation technique. The double-
ended systems, instead, show good radiation-tolerance up to an accumulated γ-dose of
0.3 MGy [34].
2.2.3 Brillouin sensor
The Brillouin scattering is the inelastic scattering of a photon from fluctuations in
the density of the medium, with emission (Stokes component) or absorption (anti-Stokes
component) of a phonon, in particular an acoustic one. The frequency of the scattered
light is shifted with respect to the excitation line by a quantity named Brillouin frequency
and defined as [44]:
νB =2neff vaλ0
(2.11)
where neff is the the effective refractive index of the propagating mode, va is the speed of
sound in glass (∼5800 m/s) and λ0 is the wavelength of the incident light. Generally, by
exciting at 1300 nm, for a silica fiber, the Brillouin frequency ranges from 9 to 13 GHz,
depending on the fiber composition and refractive index profile [45].
The Brillouin scattering can be [46]:
• spontaneous, if the amount of light scattered by thermal fluctuations is too small
to excite further fluctuations in the density;
• stimulated, if the incident light (pump light) interacts with a counter-propagating
light (Stokes wave), in order to create a beat pattern that causes the periodic
fluctuations in the density and so an acoustic wave. The Stokes wave can be:
– the back-scattered light from the thermal fluctuations,
– a light injected into the opposite fiber end to that of the pump signal and
having a frequency such that νpump − νStokes = νB.
2.2 Distributed Sensors 29
The Brillouin frequency depends on temperature through the acoustic speed, deter-
mined by the temperature-depending material density ρ [44]:
va =
√K
ρ(2.12)
where K is the bulk modulus. By comparing the Brillouin scatter profile with the one
recorded at RT, the Brillouin frequency shift allows to determine the temperature change
along all the fiber. There are different techniques to measure the Brillouin signal, spon-
taneous or stimulated. In all the cases, the spatial resolution is limited to 1 m, which is
equivalent to the relaxation time of an acoustic wave (∼10 ns); however, it depends on
the laser pulse width.
The techniques based on the Spontaneous Scattering are the direct detection, using
the BOTDR, and coherent detection.
• The Brillouin Optical Time-Domain Reflectometry or BOTDR, is based on the
direct measurement of the Brillouin backscattered intensity and not of the Brillouin
frequency, as a function of time [29]: the ratio of the scattered intensity to that
recorded at a reference temperature depends linearly on temperature in the range
between -30C and ∼850C with a sensibility of about 0.26 %/C. The temperature
resolution is around 10C but it can be enhanced using amplification techniques [47].
The measurement time is few minutes.
• The coherent detection is based on a combination of optical and electronic filters [48]:
the backscattered signal is mixed optically with an optical local oscillator and then
amplified. The temperature sensitivity is ∼1 MHz/C in the range from RT to
∼150C and the temperature resolution depends on the fiber distance, from 0.5C
at 60 km to 8C at 100 km. For the measurement time of a 100 km sensor, the
theoretical time limit is around 8 min but it can reach 100 min, because of the
repetition rate of the laser pulse and the acquisition system.
The most used technique is based on the Stimulated Scattering and it is the Brillouin
Optical Time-Domain Analysis (BOTDA) [49]. It uses the interaction between a pulsed
light and a continuous light counter-propagating in the fiber. By scanning one of the two
frequencies, one of the beams will be amplified when the characteristic Brillouin frequency
of a point and the frequencies of the two beams satisfy the condition:
∆ν = νB (2.13)
30 Chapter 2: Fiber Optic Temperature Sensors
So by monitoring the cw beam intensity, as a function of time, the Brillouin frequency of
every point of the fiber can be determined and so its temperature.
For a temperature sensor based on this technique, the temperature sensitivity coeffi-
cient is ∼1 MHz/C in the range from RT up to ∼100C, to our knowledge, [50]. The
temperature resolution is about 1C [51], but it can enhanced up to 0.25C with a setup
that uses a single source [45]. The measurement time, generally, is few minutes, for a tens
km long fiber, but it can reach few seconds, by employing pulse coding techniques [47].
Under radiation
The Brillouin sensor using the BOTDA was tested under γ-radiation: νB increases
nonlinearly with the dose, indicating a change in the silica density, in particular a
dilatation [52]. The frequency shift depends on the fiber composition: at a dose of
10 MGy, the temperature error associated with the frequency shift is only 2C for a
F-doped cladding and pure silica core fiber, whereas it increases for a Ge-doped core
fiber, up to ∼18C for a highly Ge-doped fiber ([GeO2] = 28%mol) [53]. The sensitivity
does not change because of the radiation for the Ge-doped fibers, whereas a decrease of
about 6% is observed for the F-doped one [53].
2.3 Fiber Grating Sensors
Fiber gratings consist of a periodic perturbation of the optical fiber properties, gener-
ally of the core refractive index, and fall into two general classifications based upon the
period of the grating (Λ) [54]:
• Fiber Bragg Grating (FBG), if Λ is of the order of µm,
• Long Period Grating (LPG), if Λ is several hundreds of µm.
Their working is based on the coupling of a propagating core mode and other modes of
the core or the cladding. The phase-matching condition to be satisfied is given by [55]:
∆β =2π
Λm (2.14)
where ∆β = β1 − β2 is the difference between propagation constants of the involved
modes, referred to as 1 and 2, and m is an integer number, called order. Because of this
coupling, their transmission spectra show one or more attenuation peaks, whose position
depends on the grating characteristics but also on temperature. So, at the basis of the
Fiber Grating Sensors there is a wavelength (or frequency) measurement.
2.3 Fiber Grating Sensors 31
2.3.1 Fiber Bragg Grating
A Fiber Bragg Grating (FBG) couples light from a forward-propagating mode to the
backward, counter-propagating mode, in the core. In this case, β2 = −β1 and ∆β = 2β1
results in a period Λ of the order of magnitude of µm [55]. The coupling occurs at a
specific wavelengths, named Bragg wavelengths and defined as [56]:
λBragg = 2 · neff · Λ/m (2.15)
where neff is the effective refractive index of the propagating core mode and m is the
order. So, the transmission or reflection spectra of a FBG show a narrow dip or peak
centered at λBragg, respectively [56].
The Bragg wavelength is a function of temperature [57]:
∆λBraggλBragg
=1
neff
(∂neff∂T
)∆T +
1
Λ
(∂Λ
∂T
)∆T (2.16)
where the first term is the thermo-optic coefficient and the second is the thermal expan-
sion coefficient. The temperature sensitivity depends on the fiber composition and also
on the fiber coating, indeed it can be enhanced by embedding the FBG in a metal plate
or by using a metal coating: the thermal expansion of the metal transfers a strain to the
fiber core, which affects the period and also the refractive index because of a photo-elastic
effect [58]. Generally, the sensitivity is about 10 pm/C and the dependence of λBragg on
temperature is linear only in small range (∼100C ) around RT.
The temperature resolution depends on the temperature sensitivity and on the wave-
length resolution of the Optical Spectrum Analyzer used to record the spectra: for ex-
ample, it is about 0.2C if the OSA wavelength resolution is 1 pm [58]. However, it can
decrease by an order of magnitude if the information is decoded in intensity, through the
use of a LPG (see next section) [59], and it can even reach ∼0.005C with a particular
sensor using more FBGs (in this case the temperature range is only 20C) [60].
The optimum measuring temperature range depends on the fiber composition and the
conditions of the grating inscription: it is between RT and ∼500C for a standard FBG
written in a standard telecommunication fiber [61], but the Regenerated Bragg gratings,
that are gratings grown through thermal processing at high temperatures, can withstand
higher temperature, up to ∼1000C if the FBG is written in a silica fiber, and ∼1500C
in a sapphire fiber [62].
The measurement time is around tens of ms.
32 Chapter 2: Fiber Optic Temperature Sensors
Under radiation
Among all the temperature sensors, presented here, the FBGs are the ones that have
attracted more attention for the use under irradiation (see paper review [20]). The
radiation can induce changes in both the refractive index (∆neff ) and the period (∆Λ)
and so a Bragg wavelength shift:
∆λBraggλBragg
=∆neffneff
+∆Λ
Λ(2.17)
Generally, under γ-radiation, the Bragg wavelength shifts towards the red and it satu-
rates at different values and at different accumulated doses, according to the fiber chemical
composition and the conditions of the grating inscription. An exception is the N-doped
silica fiber: its Bragg wavelength does not show a saturation effect, at least up to a
1.5 MGy dose [63]. The H2-loading used to make easier the grating inscription causes a
higher sensitivity to radiation.
Among the standard gratings written with UV light, the FBG that possesses the low-
est radiation sensitivity is the one written in a photo-sensitive 10 mol% Ge-doped silica
fiber [64]: ∆λBragg saturates, with an accumulated dose of 0.1 MGy, at a level of 20 pm,
corresponding to a temperature change of ∼2C. Similar gratings were also tested under
a mixed flux of γ-rays and neutrons for a long period: in about four years, with an accu-
mulated γ-dose of ∼4 MGy and a total flux of neutrons of ∼1018 n/cm2, the error on the
temperature measurement is about 3C [65].
Recent studies showed that the most resistant gratings under γ-radiation are the FBGs
written in fluorine-doped fibers with the more recent technique that uses femto-second
radiation at 800 nm [66]: ∆λBragg saturates around 5 pm at low γ-doses, ∼5 kGy. How-
ever, they have been never tested yet under mixed γ-neutron radiation.
2.3.2 Long Period Grating
A Long Period Grating (LPG) contributes to couple light of a propagating core mode
(the fundamental one) with discrete co-propagating cladding modes (indicated by their
order n); in this case, β2 = β(n)cl > 0 and ∆β is small, resulting in a period Λ of some
hundreds of micrometers [55, 67]. As the cladding modes are quickly attenuated, the
transmission spectrum of the grating contains a series of attenuation bands: each band
corresponds to the coupling to a different cladding mode and it is centered at a wavelength
defined as [67]:
λ(n) = δneff · Λ (2.18)
2.3 Fiber Grating Sensors 33
where δneff =(neff − n(n)
clad
)and neff and n
(n)clad are the refractive indices of the propa-
gating core mode and of the nth cladding mode.
The wavelength of the attenuation bands depends on several external parameters, such
as temperature, strain and refractive index of the medium around the cladding [54,55,68].
The following expression explains the dependence on temperature, that is of our interest:
∆λ(n)
λ(n)=
1
neff − n(n)clad
∂neff∂T
− ∂n(n)clad
∂T
∆T +1
Λ
(∂Λ
∂T
)∆T (2.19)
where the first term is the material contribution, related to the thermo-optic effect on the
refractive indices of the core and the cladding, whereas the second term is the waveguide
contribution depending on the period change with temperature. Generally, the relation
between λ(n) and T is linear, at least in a range from RT to more than 100C. The
temperature coefficient depends on the grating period, the fiber composition and the
cladding mode order. It can assume positive, negative (see reference [69] as an example
of a LPG with negative sensitivity) and null values: if the sensitivity is null, the LPG
is temperature insensitive. For LPGs fabricated in standard telecommunication fibers,
the sensitivity varies between 0.03 nm/C and 0.1 nm/C, that is one order of magnitude
larger than the FBG sensitivity, and it can be further enhanced by loading the germano-
silicate fiber with hydrogen (0.15 nm/C) [68] or by inscribing the LPG in special fibers:
it reaches 2.75 nm/C with a photosensitive B/Ge co-doped fiber [54].
The temperature resolution depends on the temperature coefficient and the wavelength
resolution of the detector: generally, it is about 1C, if the wavelength resolution is 0.1 nm
and the sensitivity is 0.1 nm/C, but it can improved up to 0.1 - 0.2 C by using different
techniques, based on intensity measurements [70] or modulated laser source [71].
Typically, LPGs are used in temperature range from RT to more than 200C, but, as
for all the OFSs, their good working is limited by the fiber coating material.
Under radiation
In contrast with FBGs, only few studies have been published about the radiation
effects on LPGs. As for FBGs, the radiation induces a peak shift due to the refractive
indices change (∆neff and ∆n(n)clad ) and to the period change (∆Λ):
∆λ(n)
λ(n)=
∆neff −∆n(n)clad
neff − n(n)clad
+∆Λ
Λ(2.20)
Under γ-radiation up to the accumulated dose of 9.3 kGy (dose-rate of 6.6 Gy/s) [72],
standard LPGs written in N-doped or Ge-doped fibers did not reveal any radiation induced
34 Chapter 2: Fiber Optic Temperature Sensors
change, within experimental error, that is ±3 nm. Other types of LPGs show a different
response under radiation.
• The turn-around-point long period grating (TAP-LPG) [73, 74] is a grating char-
acterized by dual resonant peaks, due to coupling to higher order cladding modes.
Under radiation, both peaks shift in different directions with high sensitivity and
indeed they are good candidates as dosimeters. The TAP-LPGs written in a B/Ge
co-doped fiber show a radiation-induced shift of more than 35 nm for each of the
dips, after a γ-dose of 6 kGy, and of 80 nm after a futher exposure to a dose of
65 kGy.
• The chiral long period grating (CLPG) [75] is characterized by a periodic modulation
of the optical properties of the fiber achieved by twisting the fiber as it passes
through a miniature oven. The period greatly exceeds the optical wavelength so
that core and cladding modes can be coupled to produce several narrow dips in
the transmission spectrum. Even if their radiation sensitivity depends on the fiber
composition, peak shifts of 10 nm were observed after a γ-dose of 100 kGy.
2.4 Summary of the temperature sensors and multi-
plexing
Table 2.1 reports briefly the main characteristics of temperature sensors based on silica
fibers.
A very important property that the OFSs studied here have (except for the blackbody
sensor) is their possibility to be multiplexed: a large number of sensors can be supported
by a single optical fiber [76].
All the distributed sensors, based on the Rayleigh, Raman and Brillouin scatterings,
are multiplexed by their nature: the fiber length can be considered as the sum of sensing
elements, whose size depends on the spatial resolution. Generally, these sensors employ
the time division multiplexing: the discrimination between two elements is based on the
time delay between the pulse light transmission into the fiber and the backscattered signal
arrival at the detector (according to the expression in Eq. 2.4).
The technique of multiplexing employed for the fiber grating sensors is the wavelength
division multiplexing: several of these sensors can be written in series in the same fiber
and investigated with a broadband light source. Their main limitation is their bandwidth:
their peak positions have to be different and their spectral ranges of variation should
2.4 Summary of the temperature sensors and multiplexing 35
Senso
rT
ech
niq
ue
T.
ran
ge(
C)
T.
sen
siti
vit
yT
.re
solu
tion
Sp
ati
al
reso
luti
on
mea
sure
men
tti
me
Bla
ckb
od
y30
0→
1000
0.05
%/
<20
ms
Ray
leig
hO
TD
RR
T→
800
0.01
5%
/C
15 C
1m
<1
min
SW
IR
T→
850
10p
m/
C0.
3C
(0.1 C
)5
mm
(10
mm
)∼
10
s
Ram
anO
TD
RR
T→
550
0.1
C∼
1m
few
seco
nd
s
Bri
llou
in
BO
TD
R-3
0→
850
0.26
%/
C10 C
few
min
ute
s
coh
eren
td
etec
tion
RT→∼
150
1M
Hz/ C
≥0.
5 C
∼1
m>
8m
in
BO
TD
AR
T→∼
100
1M
Hz/ C
1 C
few
min
ute
s
FB
GR
T→
<10
00 C
10p
m/ C
0.2 C
/∼
10
ms
LP
GR
T→
>20
0C
(0.0
3-
3)n
m/ C
∼1
C/
∼10
ms
Tab
le2.
1:S
um
mar
yof
the
mai
nch
arac
teri
stic
sof
the
fib
eropti
cte
mp
eratu
rese
nso
rs.
36 Chapter 2: Fiber Optic Temperature Sensors
not overlap. It is possible to multiplex about 15 gratings in a fiber, without increasing
excessively the measurement time.
2.5 Development of a temperature sensor in a recent
nuclear reactor: the SFR
In comparison with all the other radiative environments, the nuclear reactor is charac-
terized by the highest γ-rays dose, as well as by a neutron flux. Nowadays, the operational
reactors are II or III generation systems, whereas most of the I-generation has been al-
ready retired. The IV generation rectors are the last field the research is working on, to
make them more economical and safer and to minimize the waste. These reactors can be
distinguished in fast and thermal, depending on the used neutrons.
The French group AREVA, with CEA and EDF, is working on the Sodium-cooled
Fast Reactor (or SFR) technology [77], whose schema is shown in fig. 2.7.
Figure 2.7: Schema of a Sodium-cooled Fast Reactor (or SFR) [77].
The SFR reactor is fueled by a metallic alloy of uranium and plutonium and cooled by
liquid sodium. It allows to increase the efficiency of uranium usage by breeding pluto-
nium, so the reactor can work for a long period (about 2 years) without any external
operation. The liquid sodium has a high heat capacity, it does not slow down the fast
neutrons into thermal neutrons, as water does, and it allows the system to work at atmo-
spheric pressure, since its boiling point, at 883C at atmospheric pressure, is much higher
2.5 Development of a temperature sensor in a recent nuclear reactor: theSFR 37
than the reactor operating temperature. Indeed, in comparison with other reactors, the
temperature is not particularly high: it is generally around 550C (hot sodium plenum)
during the reactor operation and it is only 180C during the maintenance and the outage.
The pressure in the primary circuit is much lower than in pressurized reactors (around
4 bars).
Regarding the radiation dose, that is higher near the core than in the rest of the reac-
tor, for the SFR the γ-dose rate is 10 kGy/h and the neutron flux is 2 · 1011 n cm−2 s−1;
if the maintenance is realized each two years, the accumulated γ-dose is around 175 MGy
and the neutron fluence is about 1.3 · 1019 n cm−2.
A temperature sensor to be used in the very harsh environment near the SFR core
should have all the characteristics reported in table 2.2, not only to work inside the
reactor but also to be able to follow rapid temperature changes. Even if the operation
temperature limit is only 600C, the sensor should withstand temperatures up to 750C,
that can be reached in accidental conditions.
Operational range (120 - 600)C
Tolerance max ±1.5C
Temperature resolution < 0.5C
Measurement time response 0.5 s
Table 2.2: Measuring characteristics of the temperature sensors.
The comparison between the characteristics of all the temperature sensors, reported
in table 2.1, and of the ideal one leads to the conclusion that the sensor that best suits
the Areva application seems to be the Fiber Bragg Grating.
To summarize, among all the OFSs, the FBG seems to be the most suitable temperature
sensor to work for two years at about 550C, under a mixed radiation up to a γ-dose of
∼175 MGy and a neutron fluence of ∼1.3 · 1019 n cm−2, with a temperature resolution
lower than 0.5C and a measuring time response of 0.5 s. In this thesis, the potential
of this technology in terms of radiation hardness will be investigated with the following
irradiation characteristics as a first preliminary work:
γ-dose ≈ 4 MGy, irradiation temperature ≈ 300C.
38 Chapter 2: Fiber Optic Temperature Sensors
En resume, l’etude bibliographique sur les diffrents capteurs a fibre optique a montre
que le capteur de temperature a reseau de Bragg est celui qui presente le potentiel
le plus eleve pour travailler pendant deux ans a environ 550C, sous un rayonnement
mixte jusqu’a une dose de radiation gamma de ∼175 MGy et une fluence de neutrons de
∼1.3 · 1019 n cm−2, avec une resolution de temperature inferieure a 0.5C et un temps
de reponse permettant une mesure chaque 0.5 s. Dans cette these, le potentiel de cette
technologie en termes de durcissement sera etudie avec les caracteristiques ci-apres comme
un premier objectif :
dose γ ≈ 4 MGy, temperature de fonctionnement ≈ 300C.
Fra i sensori a fibre ottiche (OFS) studiati in letteratura, il FBG sembra essere il piu
adatto a lavorare per due anni a circa 550C sotto irraggiamento, fino a una dose gamma
di ∼175 MGy e un flusso totale di neutroni di ∼1.3 · 1019 n cm−2, con una risoluzione di
temperatura inferiore a 0.5C e un tempo di risposta di 0.5 s. In questa tesi, il potenziale di
questa tecnologia in termini di resistenza alle radiazioni saranno studiati preliminarmente
con le seguenti caratteristiche d’irraggiamento:
dose γ ≈ 4 MGy, temperatura di irraggiamento ≈ 300C.
39
Chapter 3
Fiber Bragg Gratings
In the previous chapter the radiation effects on the fiber optic temperature sensors
were reported. As the FBG was chosen as a good candidate for the applicative aim studied
in this thesis, further attention has to be given to this sensor. This chapter is focused
on the temperature and radiation limitations of the different types of FBGs. Because of
the wide literature on the temperature effects on Bragg gratings, only few works will be
cited here. A particular type of gratings will be neglected: the Chemical Composition
Fiber Grating. It is generally very stable at high temperatures but not at all under mixed
γ-neutron radiation [78].
3.1 A little of theory
A Fiber Bragg Grating [56, 79, 80] consists of a periodic modulation of the refractive
index in the fiber core formed by its exposure to an intense light interference pattern. At
each index variation a small amount of light guided along the fiber core is reflected and
all the reflections add coherently at a well determined wavelengths, called Bragg wave-
lengths and defined in Eq. 2.15. So, a FBG is a wavelength selective filter, which acts
as a pass-band in reflection and as a rejection band in transmission. In the following,
only gratings written in single-mode fibers will be presented. However, it is worth noting
that Bragg gratings can also be written in multi-mode fibers, depending on the aimed
applications [81].
Several theoretical works have been trying to determine the optical properties of
gratings, depending on:
• magnitude of effective refractive index (neff ),
• period of the refractive index perturbation (Λ),
40 Chapter 3: Fiber Bragg Gratings
• grating length (L),
• number of grating periods (N), defined as L/Λ,
• refractive index modulation amplitude (∆nmod), defined as the difference between
the refractive index of the zones illuminated and not,
• modal overlap factor (η), which defines the amount of the power guided by the core
and can be calculated as [82]:
η =π2φ2
coreNA2
λ2 + π2φ2coreNA
2 (3.1)
where φcore is the core diameter.
From the well-known coupled-mode theory, the reflectivity (R) of uniform gratings, as a
function of wavelength, can be expressed as [83,84]:
R =
sinh2
(κL
√1−
(δκ
)2)
(1−
(δκ
)2)
cosh2
(κL
√1−
(δκ
)2)
+(δκ
)2sinh2
(κL
√1−
(δκ
)2) (3.2)
where κ = π/λBragg · η ·∆nmod is known as the coupling coefficient, δ =2πneff
λ− π
Λand
δ/κ is the detuning ratio, depending on λ/λBragg. Fig. 3.1 shows, as example, the profile
obtained for an uniform grating with κL = 2.
The maximum value of R occurs at λBragg (i.e. δ = 0) and is [85]:
Rmax = tgh2 (κL) (3.3)
Another important parameter is the grating width, in particular the full width, defined
as the distance between the first two minima, is given by [85]:
width = λBragg
√√√√(∆nmod
neff
)2
+
(λBraggneffL
)2
(3.4)
In the weak grating case(∆nmod <<
λBragg
L
), the filter bandwidth is limited by the FBG
length, whereas in the strong grating case(∆nmod >>
λBragg
L
), the light does not penetrate
the full length of the grating and the bandwidth is dependent only on the refractive index
modulation amplitude.
3.1 A little of theory 41
Figure 3.1: Reflection spectrum versus normalized wavelength for an uniform Bragg grating
with κL = 2 [85].
FBG as a sensor
The FBG response is sensitive to environmental factors; indeed, any change which
varies the refractive index or grating period, such as strain and temperature, will change
the Bragg wavelength, making the grating a very good intrinsic sensor, with the informa-
tion wavelength-encoded and independent of the signal intensity [56].
When a force ∆F is applied to the grating [57],
∆λBraggλBragg
=
(1 +
1
neff
∂neff∂S
)(1
Λ
∂Λ
∂F
)∆F (3.5)
where S is the strain. The strain response is linear with no evidence of hysteresis; a
typical value for the sensitivity to an applied axial strain is 1 nm/millistrain, for a grating
at 1300 nm [56].
A temperature change ∆T causes a shift [57]:
∆λBraggλBragg
=1
neff
(∂neff∂T
)∆T +
1
Λ
(∂Λ
∂T
)∆T (3.6)
where:
• ∂neff
∂Tis the thermo-optic coefficient, about 10−5/C [86],
• 1Λ
(∂Λ∂T
)is the thermal expansion coefficient, about 0.5 · 10−6/C at RT [23].
42 Chapter 3: Fiber Bragg Gratings
A typical value of the temperature coefficient of a bare grating at 1550 nm is about 0.01
nm/C and it is primarily due to the thermo-optic effect [57]. However, it depends strongly
on the fiber coating, particularly on its material and thickness, indeed it increases by
increasing the coating thickness with a saturating trend [87]. The temperature sensitivity
also decreases if the grating peak is at shorter wavelengths [88]. The FBG temperature
response is not linear over a wide range and there is hysteresis [57]: this issue will be
discussed later.
3.2 Grating fabrication techniques
Since 1978, when for the first time a FBG was observed by Hill and al. [57], several
techniques have been developed for the grating fabrication. This section deals with the
principles of the different techniques, holographic (internal, transverse writing and phase
mask) and non (point by point). For short pulse lasers, such as femtosecond systems,
interferometric setups are nontrivial to align, since path lengths need to be matched to
within the spatial location of the pulse, for example within 36 µm for a 120 fs beam [89].
Internal writing (Hill 1978)
The fiber core is exposed to coherent contra-directional beams, which originate an
interference pattern and so the refractive index periodic structure. A laser beam at
488 nm is injected in a photosensitive fiber end and partially back-reflected at the other
end, initially only because of the Fresnel reflection (4%); the interference between these
beams start to originate the grating, increasing the back-reflected signal and making easier
the grating writing [57]. The Bragg wavelength coincides with that of the laser used for
the inscription, i.e. λBragg = λlaser. Therefore, to change λBragg, it is necessary to have a
laser source at the chosen wavelength. Moreover, the grating length is the all fiber length,
because it is all exposed to the laser light.
Transverse holographic technique (Meltz 1989)
This method was the first consisting of exposing the fiber core to a two beams
interference pattern from a side of the fiber. The UV light is split into two equal-intensity
beams and then recombined to produce an interference pattern, normal to the fiber axis,
focused within the core of the bare photosensitive fiber [90]. The grating period, and then
λBragg, depends on the laser wavelength and the angle between the beams.
3.3 Types of Gratings 43
Point by point (Malo 1993)
In this technique, briefly referred to as PbP, each grating fringe is produced one after
the other [91]: the laser light is focused in a point of the core, increasing locally the
refractive index, then either the fiber or the laser beam is translated through a distance
corresponding to the grating period Λ, in parallel direction to the fiber axis; this process
is repeated N times, until all the grating length, L = NΛ, is written. The laser spot
determines the dimension of the illuminated zones.
Phase mask technique (Hill 1993)
The basis of this technique is the phase-mask grating (PM), an one-dimensional surface
relief structure fabricated in a material transparent to the laser radiation. When it is
placed between the light source and the optical fiber, the beam passes through it at
normal incidence and originates an interference pattern [92]. The grating period is half
that of the phase mask and is independent on the laser wavelength. As this technique was
used to fabricate our gratings, more details will be presented in the following chapter.
3.3 Types of Gratings
The gratings can be distinguished according to the laser source used for their writing:
the UV laser can be pulsed or continuous wave, whereas the IR source has to be ultrashort
pulsed, because the phenomena originating the gratings can only be multi-photons, due
to the small energy of the IR photons.
3.3.1 UV-FBGs
The phenomenon behind the UV-FBG formation is the photo-sensitivity of silica doped
with specific elements, primarily the germanium.
In the past decades, gratings were written with all types of lasers, continuous wave
or pulsed, emitting light at different wavelengths. The use of high pulse energy laser was
proposed for the first time by Askins et al. [93], to reduce the writing time down to few
tens of nanoseconds, the duration of a single pulse.
Nowadays, the most commonly used light sources are KrF and ArF excimer lasers
emitting, respectively, 248 and 193 nm pulses with a duration of ∼10 ns at repetition
rates of 50-75 Hz. The exposure of a Ge-doped fiber to UV light for few minutes at
intensities of 100-1000 mJ/cm2 causes an increase of the refractive index ranging between
10−5 and 10−3 but it can reach 10−2 by loading the fiber with H2 [56].
44 Chapter 3: Fiber Bragg Gratings
During inscription neff and ∆nmod increase, indeed the peak position shifts towards
longer wavelengths, while the peak width and reflectivity increase [94]. It was observed
that [94]:
1. the laser repetition rate does not influence much the reflectivity, that becomes
slightly higher as the laser repetition increases by a factor 10, without degrading
the spectra quality;
2. R increases with increasing fluence, at constant total exposure dose;
3. at each fluence, R shows a saturating tendency as a function of writing time, but
the maximum R value and the total dose at which the saturation is reached increase
with the exposure fluence.
The relation between ∆nmod and the incident fluence (I) depends on the excitation
photon energy. For the gratings writing with an ArF excimer laser, Malo et al. found a
dependence of the growth rate on I2, indicating a two-photon process, in which the carriers
are generated by direct excitation in the silica bandgap and then they are trapped at Ge-
related defects [95].
The thermal stability of gratings depends on the fiber composition and the inscription
conditions but, generally, they do not withstand 600C. This is related to the defects
originating ∆nmod: studies about the fluence dependence of the Ge-related defects and
∆nmod and their thermal stability showed that the grating formation is mainly associated
with the generation of GeE and GeH centers and indeed it is the much higher formation
efficiency of these centers that gives rise to the much higher photosensitivity of H2-loaded
fibers [61].
Type II FBGs
By increasing the pulse energy beyond a threshold value the induced refractive index
modulation does not grow anymore linearly with the pulse energy but increases very
quickly up to saturate around 5 · 10−3. The gratings written in this regime are labeled as
type II FBGs, to distinguish from the previous, called type I gratings [96]. They exhibit
high reflectivity and large bandwidth and they withstand temperatures up to 800C: they
decay quite slowly at 900C, whereas at 1000C a treatment of few hours is sufficient to
make them disappear. However, their use is limited by their poor quality spectra.
Studies with optical microscope show that laser damage, responsible for the index
change, is limited to the core-cladding interface [96].
3.3 Types of Gratings 45
Type IA FBGs
Type IA FBGs are regenerated gratings written in hydrogenated Ge-doped or B/Ge
co-doped optical fibers after a prolonged UV exposure. During inscription they exhibit
a large red-shift of the central wavelength, that means a large increase in the mean
refractive index of the core [97]. This red-shift occurs in three phases [98]: an initially
rapid increase of the Bragg wavelength, followed by a slower growth up to reach a plateau
at a saturation value that depends on fiber type, hydrogenation and irradiation conditions.
Typically, ∆λBragg is around 20 pm and entails ∆neff ∼ 2 · 10−2 [97,98]. With increasing
laser intensity, the grating formation is more rapid but the stabilization λBragg value is
lower [98].
Type IA gratings show lower temperature stability than type I [99]. Moreover, they
exhibit also the lowest thermal sensitivity of all the FBG types [97,99], whereas the strain
response does not change particularly [99].
Type IIA FBGs
Type IIA FBGs are also called negative index gratings, because the UV light induced
refractive index change is negative [100]. Their inscription is characterized by a non-
monotonic evolution in both modulation and effective index, with three phases. Initially,
neff and ∆nmod increase and a type I grating is written. Then, by increasing the
accumulated laser energy [101] or by subjecting the grating to a thermal treatment at high
temperature, as 700C, [102] the type I grating is erased and neff and ∆nmod decrease,
until the starting point of the regeneration process is reached: ∆nmod starts to increase
again, while neff decreases, implying the blue-shift of the initial central wavelength.
Physically, the type I regime is based on the exhaust of pre-existing precursors, while the
type IIA regime on the formation of UV-induced structural changes, such as compaction
or core-cladding stress relaxation [100, 101]. These gratings are written in highly Ge-
doped, B/Ge or Sn/Ge co-doped fibers, with or without H2-loading [101].
Type IIA gratings exhibit a better stability at high temperatures than type I [100].
If as example is considered a type IIA FBG written in an unloaded highly Ge-doped
fiber and pre-annealed at 700C for two days, a thermal treatment at 1000C causes the
reduction of 2.5 ·10−3% reflectivity and 1 pm wavelength shift per hour; however, it is the
pre-treatment at 700C that strongly affects the Bragg peak [102].
Type IIA gratings can be written also by UV femtosecond laser, as observed by Violakis
et al. [103]: they show similar features to the other type IIA gratings but enhanced thermal
stability.
46 Chapter 3: Fiber Bragg Gratings
3.3.2 IR fs-FBGs
This section will deal with FBGs made with 800 nm femtosecond radiation.
The grating formation is characterized by a threshold for the pulse peak intensity,
which depends on:
• the temporal and spatial qualities of the laser light and the accuracy of the alignment
of the incident beam onto the fiber core [104];
• the fiber dopants: with the PM technique, the threshold is about 3 · 1013 W/cm2
for all-silica core fibers [105], as for observing fs-induced modifications in silica
bulk [106], but it decreases down to 2 · 1013 W/cm2 for Ge-doped core fibers [105];
• the used technique: the threshold for a Ge-doped fiber is one order of magnitude
higher with the PbP technique than with the phase mask [105,107];
• the H2-loading, which reduces the threshold but only in the Ge-doped fibers and
not in the all-silica core fibers [105,108].
Above this peak intensity threshold, a grating will be written, but increasing the peak
intensity two regimes of induced index change are observed: in analogy with the UV-
FBGs, the two types gratings are referred to as type I-IR and type II-IR [109].
Type I-IR FBGs
Type I-IR FBGs can be made with multiple-pulse exposures: the reflectivity shows
a linear growth with the number of incident pulses, indicating that ∆nmod does not
saturate, while the Bragg peak shifts towards longer wavelengths with a saturating
tendency [89, 104]. Fig. 3.2 shows, as example, the variations of R and λBragg with the
number of incident IR pulses (having energy of 300 µJ) in a standard Ge-doped Corning
SMF-28 fiber: after 15000 pulses, λBragg shifts by about 0.2 nm, corresponding to ∆neff
of 1.8 · 10−4 [89].
One of the most important features of IR gratings is that the refractive index modu-
lation amplitude is one order of magnitude larger than the average index change [89].
Type I-IR FBGs show similar annealing properties to type I-UV gratings of comparable
strength, as shown in fig. 3.3. Consequently, the mechanism for fabrication of type I-IR
gratings may result from color center formation, induced from multi-photon absorption
processes, as demonstrated by Smelser et al. [105] with a study about the growth of the
index modulation as a function of interference field intensity.
3.3 Types of Gratings 47
Figure 3.2: Variations of reflectivity and peak wavelength with the number of incident IR pulses
(with energy of 300 µJ/pulse) in a standard Ge-doped Corning SMF-28 fiber [89].
Figure 3.3: Annealing for fs IR (filled circles and squares) and cw UV (open circles and squares)
gratings: the lower annealing curves are referred to gratings with an initial ∆nmod of 10−5,
whereas the upper curves are referred to gratings with an initial ∆nmod of 10−3 [105].
Type II-IR FBGs
In a Ge-doped fiber, a type I-IR grating is written with a pulse peak intensity of
2 · 1013 W/cm2, whereas for intensity above ∼5·1013 W/cm2 a type II-IR grating is
obtained [109]. These FBGs are characterized by several differences with respect to the
type I:
• the growth rate is more rapid [109];
• the bandwidth increases, likely resulting by a reduction in the effective grating
length, because, where the laser beam profile tapers to zero, the peak intensity is
not above the threshold and grating lines can miss [109];
• the reflection spectra have lower quality, resulting from the strong coupling into the
48 Chapter 3: Fiber Bragg Gratings
cladding modes due to the non-uniform refractive index change across the core [109]:
the H2-loading improves the spectra quality, probably because of the enhanced
photosensitivity of the fiber core and the lower laser intensity employed [108].
The most important difference lies in the annealing behavior of these gratings: they
show the same thermal stability of type II UV-induced damage gratings. For example, a
16 h annealing at 950C stabilizes the fs-FBG written in a Ge-doped fiber at ∼75% of the
initial strength [104]. However, the grating behavior under thermal treatment depends on
the grating itself, that is its writing parameters and history. Some authors, as Marshall et
al. with the PbP technique [107] or Smelser et al. with the phase-mask technique [109],
noticed a slight increase of the strength as the annealing temperature increases up to
1000C. This increase may be a result of two kinds of index change. In the peaks of
the interference pattern, enough intensity exists to ionize the fiber glass producing an
index change durable with temperature. In the valleys of the interference pattern the
peak intensity is below the type II-IR threshold and only type I-IR index changes may
occur. During the thermal treatment the annealable type I-IR component is erased, while
the permanent type II-IR component remains fixed. This causes an increase of ∆nmod.
When the annealing temperature exceeds 1000C, the gratings are gradually erased, more
rapidly in fibers loaded with H2 than in the unloaded ones [108].
Moreover, Grobnic et al. [110] studied the Bragg wavelength behavior under tempera-
ture cycling. For a grating written in a Ge-doped fiber no hysteresis for cycles at 1000C
was observed, whereas around 1040C the Bragg peak becomes unstable and starts drift-
ing towards longer wavelengths at a rate depending on the annealing temperature and
the grating history. Instead, for a grating written in an all-silica core fiber the peak
shift was observed towards longer wavelength during a treatment at 1060C, but towards
shorter wavelengths at 1000C. In conclusion, the shift rate and its direction depend on
the grating history and on the annealing temperature. Neglecting the contribution of
the variation of Λ with the temperature to the Bragg drift, a reduction in neff due to
a reduction in ∆nmod can explain only a blue-shift. The red-shift can be attributed to
an irreversible change in the unperturbed refractive index of the core and the cladding.
An increase of the core index of an all-silica core fiber was observed through thermal
relaxation of residual stress under treatments at 900C [111].
3.4 Grating stability
The possibility of using FBGs in real applications depends strongly on their effective
lifetime, above all for applications at high temperatures. The grating thermal degradation
3.4 Grating stability 49
manifests itself with a reduction in the peak reflectivity and bandwidth: during a
treatment the decay is rapid at first and followed by a decreasing rate decay.
Erdogan et al. [112] proposed a model to explain this degradation: if R is the grating
reflectance, the integrated coupling coefficient (ICC), defined as
ICC = tgh−1(R1/2
)(3.7)
is proportional to ∆nmod and, if normalized to the value assumed before the treatment
start (ICC0), it follows a power law as a function of duration t of the thermal treatment
at temperature T :ICC
ICC0
=1
1 + A · (t/t′)B(3.8)
where t is expressed in minutes and t′ is 1 min, in order to have all the parameters
dimensionless. A plotted on logarithmic scale varies linearly with temperature in K:
A = A0 · exp(aT ) (3.9)
and B varies linearly with temperature in K, passing through zero at 0 K:
B = T/T0 (3.10)
This approach assumes that the grating inscription causes a broad distribution of the
activation energy of thermodynamically unstable traps and the thermal treatment releases
electrons involved in the traps with energy lower than the demarcation energy, defined as
Ed = KBT · ln (νt) (3.11)
where KB is Boltzmann’s constant and ν is a frequency that has to be calculated from
data and is about 1013 Hz for H2-free Ge-doped FBGs [113]. The Ed distribution is bell-
shaped with the peak at ∆E ≈ −KBT0 · ln (A0) and FWHM of about 3KBT0.
Erdogan’s model does not apply for gratings made of hydrogenated fibers, because
these gratings have a broader distribution of activation states, that extends to low energy,
so treatments at low temperature, around 100C, are enough to start the detrapping
process and the decay is rapid. Baker et al. proposed a new model for these gratings,
known as ‘log time model’ [114], according to which the normalized ICC as a function of
t can be expressed as:
ICC
ICC0
=
1− C · log(tτ
)for t > τ
1 for t < τ(3.12)
50 Chapter 3: Fiber Bragg Gratings
where C is a constant and τ depends on the temperature according to the Arrhenius
relation:
τ = A · exp(EaR · T
)(3.13)
where R is the universal constant.
To stabilize a FBG in order to obtain stable performances over an operating time tO at
the temperature TO, after inscription it has to undergo to an annealing at a temperature
TA, higher than TO, with duration tA defined as [114]:
tA =
exp
[aT0
(TATO− 1
)]tTA/TOA for the Erdogan model
tO(τAτO
)for the log time model
(3.14)
where all the parameters are related to the data fit.
3.5 Effects of γ-radiation
This section will deal with the radiation effects on the grating types reported in
section 3.3.
3.5.1 UV-FBGs
As already said, gratings can be written with UV lasers only in photosensitive fibers.
As radiation induces losses in fiber transmission, it is preferable to splice small lengths of
photosensitive fibers, including Bragg gratings, with radiation-resistant fibers, in order to
reduce the total induced losses and to keep an acceptable signal-noise ratio [115].
The radiation influences the position, amplitude and FWHM of the Bragg peak, de-
pending on the grating parameters and the writing conditions as well as the used fiber.
In most of cases, the radiation causes a Bragg wavelength shift (hereafter referred to
as BWS) towards longer wavelengths with a saturating tendency. This red-shift means
an increase of the average effective index neff and, as a consequence of the Kramers-
Kronig relations (Eq. 1.5), an increase of absorption at wavelengths shorter than the Bragg
one [116]. For example, for the germanosilicate fibers, as demonstrated by Neustruev et
al. [117], the γ-irradiation creates the same paramagnetic defects, Ge(1), Ge(2) and GeE,
as the UV-light does. Moreover, the γ-radiation should affect only the mean value of neff
and not the modulation amplitude ∆nmod [64]. The saturating behavior can result from
two reasons [118]: one is the limited concentration of precursor defects responsible for
the refractive index change and the other is the competition between defect generation
3.5 Effects of γ-radiation 51
and annealing [119]. In the first case, the saturation level is independent of the dose-rate,
whereas in the latter case it depends on the radiation dose-rate and the annealing rate.
The BWS depends mainly on the chemical composition of the fiber and the photosen-
sitization technique used for writing FBGs.
As demonstrated by Henschel et al. [120], it is not possible to determine the influence
of the fiber composition on the BWS. As example, fig. 3.4 shows the BWS of gratings
made of several fibers doped with different elements, as germanium, boron, phosphorous,
cerium and nitrogen, to make the fiber core photosensitive. Despite the fiber composition,
the BWS behavior is the same within 70 pm.
Figure 3.4: Bragg wavelength shift of gratings made of different fibers, during γ-irradiation at
RT up to 0.1 MGy, with dose-rate of 0.9 Gy/s [120].
Therefore, fibers that show higher radiation induced attenuation do not give rise to grat-
ings with higher radiation sensitivity. The cause is that the grating inscription with high
UV light intensity changes the fiber properties so much that the resulting material can
no longer be compared with that of the initial fiber and even the defect generation by
ionizing radiation in this new material will be different [120]. However, Lin et al. observed
in B/Ge co-doped fibers that the higher the GeO2 concentration, the higher the FBG ra-
diation sensitivity, easy to explain as the formation of more Ge-related color centers [121].
In addition of the core doping, another method used to enhance the fiber photosensi-
tivity is the H2-loading before the grating writing; to accelerate the hydrogen out-diffusion
and stabilize the grating, an annealing has to be performed after the writing. As the hy-
drogen increases the fiber sensitivity to UV light, it increases also the radiation sensitivity
of gratings. Indeed, BWS saturates at higher shift levels and at higher doses for gratings
written in loaded fibers than in the unloaded [63,121,122]. A probable reason of the high
radiation-sensitivity of gratings written in hydrogen-loaded fibers is the radiolytic rupture
52 Chapter 3: Fiber Bragg Gratings
of the OH-bonds, whose concentration increases with the H2-loading [122]. Moreover, it
seems that the higher the hydrogen loading pressure, the higher the radiation induced
BWS [120].
A thermal pre-treatment increases the radiation sensitivity: the higher the annealing
temperature the higher the BWS [116, 120]. The centers generated during the grating
inscription recombine during the annealing, restoring the precursors.
Except special fiber coatings, it is not possible to write gratings with UV light without
removing it, because it is not transparent at such wavelengths. So, gratings have to be in-
scribed in a bare fiber and then a coating has to be applied. Most of results here reported
have been realized on bare gratings and they have to be attributed to the radiation effects
on the glass. However, the coating influences the grating radiation-sensitivity [123]: the
radiation modifies the coating, which can shrink or swell, causing a stress on the fiber and
so a Bragg wavelength shift, for example a red-shift if the stress along the grating is sym-
metric and uniform. The grating radiation sensitivity increases by increasing the coating
thickness or if the coating is in polymer and not in acrylate. However, it can be thought
that the coating could shield rays, in fact this effect has to be considered only with UV
light or X-rays of very low energy, but not for γ-rays with an energy of about 1 MeV [124].
Besides the fiber, the conditions of writing and using could also influence the grating
response under radiation. The grating radiation sensitivity does not depend on the writing
UV laser light, for example its wavelength, whether it is cw or pulsed [125]. It depends
on the Bragg wavelength initial value and it increases with increasing λBragg [88], whereas
it depends slightly on the fiber tension during the grating inscription, indeed the BWS
decreases by increasing the tension [124].
Even if the light power increasing reduces the fiber RIA, by the phenomenon known as
photo-bleaching, the grating response is independent of the light power used for measuring
the spectra [125].
Finally, a dependence of the grating radiation sensitivity was found on the irradiation
conditions, in particular on:
• dose-rate: by increasing the dose-rate, the BWS still continues saturating but at
higher shift levels and at higher doses [126];
• irradiation temperature: the BWS decreases with increasing temperature, because
it facilitates the defect annealing [124].
It was also observed that a pre-irradiation could reduce the radiation sensitivity, because
during the pre-irradiation most of the precursors is converted [121]; however, this effect
3.5 Effects of γ-radiation 53
depends on the post-irradiation recovery [116].
Before concluding this discussion on BWS, it has to be highlighted that a shift of the
Bragg peak towards shorter wavelengths was also observed in few cases. This was noticed
for the first time by Niay et al. [115], but the grating transmission spectra were recorded
only several days after irradiation. Gusarov et al. [127] focused their attention on this
atypical behavior in type I-FBGs written in a photosensitive fiber doped with ∼8 mol%
of GeO2. As shown in fig. 3.5, at the beginning of the exposure, the BWS increases, as
expected, but at the moment when it seems to start to saturate, the direction of the shift
is inverted and the peak shifts towards shorter wavelengths. The authors proposed the
existence of two different types of defects: one responsible for the refractive index increase
and the other for the index decrease.
Figure 3.5: Bragg wavelength shift of two gratings written in the photosensitive fiber PS-1550-
Y3 from Stocker-Yale by a 248 nm pulsed laser, during the annealing-interrupted γ-irradiation
at ∼33C, with dose-rate of 1 kGy/h. The down/up arrows indicate the start/end of the
irradiations, with the total accumulated dose values. Lines without marking–grating with peak
at 1537 nm; lines with crosses–grating with peak at 1550 nm [127].
Beyond the Bragg wavelength, the peak is characterized by its width and amplitude,
which generally have similar dependence on dose. In most of works about gratings un-
der radiation, these parameters do not change, above all for gratings made of unloaded
fibers, whereas for gratings written in H2-loaded fibers they initially increase and then de-
crease [63,122]. This non-monotonous behavior can be explained with a non-monotonous
change of ∆nmod. At the beginning of the irradiation, the refractive index at the max-
ima of the UV-fringe pattern grows faster than at the minima, increasing ∆nmod. At an
irradiation time, the refractive index at the maxima starts to decrease slowly, while the
54 Chapter 3: Fiber Bragg Gratings
refractive index at the minima continues to grow, giving rise to a decrease of ∆nmod [122].
By increasing the annealing temperature, in contrast with the BWS increase, the am-
plitude decreases [116].
Finally, several works show that the temperature sensitivity is not influenced by
radiation [63,64,120,128].
UV fs-FBGs
A study about the radiation effects on FBGs written by fs UV laser in Ge-doped fibers
was recently published by Gusarov et al. [118]. The Bragg wavelength of these gratings
red-shifts with a saturating tendency at a level independent of the fiber composition,
the hydrogen loading or the initial strength, whereas the post-irradiation recovery is
significant and slightly dependent on the fiber type. As a consequence of the dependence
of the annealing rate on the fiber type and the independence of the saturation level, it can
be highlighted that the saturation has to be due to a limited concentration of precursors
sensitive to the ionizing radiation. The amplitude slightly decreases, with a saturating
tendency dependent on the fiber type.
As shown in fig. 3.6, for gratings written in different fibers with or without H2-loading,
the BWS saturates after a total dose of 30-40 kGy (dose rate of 0.3 Gy/s), around 15 pm.
This low saturation level can be obtained also for grating written by cw UV laser but
under particular writing conditions (for example, using low intensity UV light) and only
at higher total doses. However, the behavior of the hydrogen loaded fibers is in contrast
with the previous results.
Type IA FBGs
Compared to standard gratings, type IA FBGs are more radiation sensitive [129].
During irradiation the Bragg wavelength red-shifts with a slow saturation tendency: the
higher obtained value of ∆λBragg is 190 pm at the accumulated dose of 116 kGy (dose rate
of 0.2 Gy/s), for a grating written in a hydrogenated B/Ge co-doped fiber. Moreover, the
post-irradiation annealing is so strong that a negative BWS is observed at ∼1000 h after
the irradiation end. This effect can be easily explained by a model based on the radiation
generation of two types of defects, similar to the model proposed by Gusarov et al. to
explain the λBragg blue-shift [127].
3.5 Effects of γ-radiation 55
Figure 3.6: Bragg wavelength shift of gratings written in Ge-doped fibers by a fs UV laser (λ
= 264 nm, τpulse = 220 fs), during the γ-irradiation at ∼35C up to a total dose of 84 kGy, with
dose-rate of 0.84 kGy/h. The down/up arrows indicate the start/end of the irradiation. With
the exception of the violet asteriks, associated with a grating written in the hydrogen loaded
SMF-28, all the other curves are associated with FBGs written in the unloaded photo-sensitive
Fibercore Ltd. PS1250/1500 with different laser fluence (and initial grating strength): red
triangles–0.73 kJ/cm2 (14.1 dB), black line–0.75 kJ/cm2 (15.2 dB), black diamonds–1.38 kJ/cm2
(19.2 dB), blue crosses–2.91 kJ/cm2 (17.5 dB). [118].
Type IIA FBGs
If type IIA gratings are made of only Ge-doped fibers [116], the Bragg peak shifts
towards longer wavelengths, with a saturating behavior and no significant post-irradiation
recovery, whereas the peak amplitude change is rather small. In contrast to the results on
type I gratings, it was observed no dependence of the BWS on the GeO2 concentration or
monotonic behavior as a function of the annealing temperature, even if the shift is larger
for the grating annealed at the highest temperature than for the others. The best result
was obtained for a grating made of an unloaded SM310 fiber (75 mol% GeO2): the BWS
saturates around only 12 pm, after a dose of 30 kGy (dose rate of 0.1 Gy/s).
If gratings are made in B/Ge co-doped fibers [130], the initial increase of the Bragg
wavelength is followed by a marked decrease, with no significant recovery after irradiation.
The authors conclude that the original UV induced reduction of the average refractive
index leading to the peak blue shift during inscription is continued by the high energetic
γ-radiation. The peak amplitude is reduced; moreover, the strongest the grating, the
lower the amplitude reduction.
56 Chapter 3: Fiber Bragg Gratings
3.5.2 IR fs-FBGs
The radiation effects on the IR fs-FBGs were studied for the first time by Grobnic et
al. [66]. Fig. 3.7 shows the γ-radiation-induced BWS in FBGs written in the standard Ge-
doped fiber Corning SMF-28, with a dose-rate of 0.94 Gy/s up to 0.1 MGy at RT. From
this graph it is clear that the H2-loading increases the radiation sensitivity, especially for
type I-IR gratings, that have higher BWS than the type II-IR gratings.
Figure 3.7: Bragg wavelength shift of type I-IR and type II-IR gratings made of a hydrogen
loaded and unloaded standard Ge-doped Corning SMF-28 fiber, during γ-irradiation at RT up
to 0.1 MGy, with dose-rate of 0.94 Gy/s [66].
Only for the gratings made in unloaded fibers the BWS shows a saturating behavior,
at levels that are similar for both grating types and depend on the fiber composition: the
radiation-induced BWS is larger in the fiber with higher RIA at λBragg, however a RIA
difference of more than two orders of magnitude leads to a BWS difference of less than a
factor 10 [66]. Fig. 3.8 shows the influence of fiber composition on the BWS: the gratings
made of radiation-resistant fibers (indicated in the figure with 1,3), doped only with F
or GeO2, result in FBGs more radiation-resistant than those made of radiation-sensitive
fibers, doped with CeO2 and/or P2O5 (indicated in the figure with 4,5).
The saturating level depends also on the grating pre-treatments: as for UV-FBGs,
exposure to higher temperatures increases the radiation sensitivity. However, the anneal-
ings are often necessary to stabilize the gratings, that blue-shift of 1-5 pm/day [131].
As it is clear from curves 1 and 3 in fig. 3.8(b), the BWS decreases for dose higher
than 20 kGy. This behavior was confirmed by Henschel et al. in another work realized
on similar samples at higher doses, up to 1 MGy [131]: λBragg increases at the irradiation
start and then it begins to decrease at a dose depending on the fiber composition, around
100 kGy for a F-doped core, 250 kGy for a Ge-doped core and 500 kGy for a pure-silica
core. The decrease of the Bragg wavelength can be caused by a decrease of neff or Λ.
3.6 Effects of mixed γ-neutron radiation 57
(a) Type I-IR FBGs (b) Type II-IR FBGs
Figure 3.8: Bragg wavelength shift of (a) type I-IR and (b) type II-IR gratings made of
unloaded fibers, during γ-irradiation at RT up to 0.1 MGy, with dose-rate of 0.94 Gy/s.
Finally, in contrast with the UV-induced gratings, the temperature sensitivity coeffi-
cient decreases by 9% after 1 MGy dose [131].
3.6 Effects of mixed γ-neutron radiation
As just seen, a lot of papers have been published until now about the γ-radiation
tolerance of the gratings. In contrast, very few tests were performed on the gratings in
nuclear reactor cores and all on the standard gratings: type I-UV FBGs. The sensitiv-
ity of the Bragg wavelength to mixed γ-neutron radiation is higher than that to pure
γ-radiation [132]. λBragg red-shifts showing a saturating behavior under a neutron flux
lower than 1.5 · 1011 n cm−2 s−1, with a γ-dose-rate up to 180 Gy/h, whereas under an
higher neutron flux (lower than 1.5 · 1014 n cm−2 s−1), with a γ-dose-rate up to 9 MGy/h
λBragg increases almost linearly with increasing dose without any saturation and the peak
width also increases, indicating the grating erasure.
Annealing at high temperatures and pre-irradiation do not improve the grating ra-
diation stability [133]. As for the γ-radiation, the hydrogenation increases the grating
sensitivity: the wavelength shift, the amplitude reduction and the peak broadening are
bigger for the grating written in loaded fibers than in the unloaded one [132–134].
The temperature sensitivity does not change because of the radiation [134].
58 Chapter 3: Fiber Bragg Gratings
Since their discovery in 1978 several research groups have been interested in the
radiation sensitivity of the Fiber Bragg Gratings: this depends on a lot of parameters,
such as fiber composition, pre-treatments, writing and irradiation conditions. Due
to the radiation, the Bragg wavelength peak shifts towards the blue or the red and
sometimes it shows a non-monotonic behavior. This is attributed to the presence of
different types of defects.
It is worth noting that the grating response depends strongly on the pre-thermal
treatment: the higher is the used temperature, the higher is the resulting radiation
sensitivity. However, the annealings are often necessary to stabilize the gratings.
Under γ-radiation, the most radiation-resistant grating at the beginning of this thesis
was the FBG written with a femtosecond radiation at 800 nm in a radiation resistant
fiber: the radiation induced Bragg wavelength shift saturates around 5 pm after a dose
lower than 10 kGy and, at higher doses, the BWS can remain constant or decrease,
depending on the fiber and FBG characteristics.
Under mixed γ-neutron radiation, no test has been reported yet on this type of gratings;
however, for the UV-FBGs, a saturation behavior of BWS was observed for low neutron
flux, around 2·1011 n cm−2 s−1, similar to that observed under pure γ-radiation, whereas
at higher flux the Bragg wavelength showed a linear dependence on the dose.
3.6 Effects of mixed γ-neutron radiation 59
Depuis leur decouverte en 1978 plusieurs etudes ont ete consacrees a l’evolution des
reseaux de Bragg sous rayonnement. Cette evolution depend de differents parametres ;
la composition des fibres, les pretraitements, les conditions d’inscription et d’irradiation.
Sous rayonnement, la longueur d’onde de Bragg se decale vers le bleu ou le rouge et peut
aussi presenter une evolution non monotone. Ces resultats vont dans le sens de l’existence
de differents types de defauts a l’origine de la formation et de la reponse des reseaux de
Bragg inscrits sur fibre.
Il est interessant de noter que la reponse du reseau depend fortement du pretraitement
thermique. Les resultats publies montrent que plus la temperature du pre-traitement est
elevee, plus la variation de la reponse du reseau sous rayonnement est importante. Les
recuits sont souvent necessaires pour stabiliser les reseaux.
Sous rayonnement γ, l’etat de lart au debut de la presente these montrait que le reseau
de Bragg le plus resistant aux radiations etait le FBG inscrit par laser a impulsion
femtoseconde a 800 nm dans une fibre resistante au rayonnement : le decalage induit
par le rayonnement de la longueur d’onde de Bragg (BWS) commence par saturer autour
de 5 pm apres une dose inferieure a 10 kGy et, a fortes doses, le BWS peut rester constant
ou evoluer a nouveau en fonction des caracteristiques de la fibre et du FBG.
Sous rayonnement mixte, gamma et neutrons, aucun test n’avait encore ete realise
sur ce type de reseau. En revanche pour les FBG inscrits par insolation UV, un
comportement de saturation du BWS a ete observe pour de faible flux de neutrons, autour
de 2 · 1011 n cm−2 s−1, similaire a celui observe sous rayonnement gamma seul, tandis que
a plus haut flux la longueur d’onde de Bragg a montre une dependance lineaire de la dose.
Fin dalla loro scoperta nel 1978 diversi gruppi di ricerca si sono interessati alla foto-
sensibilita dei reticoli di Bragg: questa dipende da molti parametri, come la composizione
della fibra, i pre-trattamenti, le condizioni d’iscrizione e irraggiamento. A causa della
radiazione, il picco di Bragg si sposta verso il blu o rosso e, in alcuni casi, mostra un
andamento non monotono. Questo comportamento e stato attribuito alla presenza di
diversi tipi di difetti a l’origine della formazione e risposta dei reticoli di Bragg iscritti in
fibra.
E importante notare che la risposta dei reticoli dipende fortemente dal pre-trattamento
termico: piu alta e la temperatura utilizzata, maggiore e la sensibilit risultante alla radi-
azione. Tuttavia, i trattamenti sono spesso necessari per stabilizzare i reticoli.
Sotto irraggiamento γ, il reticolo piu resistente alla radiazione all’inizio della presente
tesi era quello iscritto con radiazione al femtosecondo a 800 nm in una fibra resistente
alle radiazioni: lo spostamento della lunghezza d’onda di Bragg indotto dalla radiazione
60 Chapter 3: Fiber Bragg Gratings
(BWS) satura intorno ai 5 pm dopo una dose inferiore a 10 kGy e, a dosi piu elevate, esso
rimane costante o evolve, a seconda delle caratteristiche della fibra e del reticolo.
Sotto irraggiamento con raggi γ e neutroni, nessun test era stato ancora effettuato su
questo tipo di reticoli; tuttavia, per i FBG iscritti con radiazione UV, la saturazione del
BWS e stata osservata per bassi flussi di neutroni, circa 2 · 1011 n cm−2 s−1, comporta-
mento analogo a quello osservato sotto radiazione gamma, mentre a flussi piu elevati la
lunghezza d’onda di Bragg ha mostrato una dipendenza lineare dalla dose.
61
Chapter 4
Materials, treatments and
experimental-setups
This chapter is focused on the description of the samples, treatments and techniques
used to select the most radiation resistant optical fiber and the Fiber Bragg Grating most
suitable for the application aimed in this thesis. It starts with the description of the
tested samples; then, it continues with the FBGs: the used fabrication technique and
the measurement setups employed to monitor the Bragg wavelength during inscription,
thermal treatments and irradiations. The following section is devoted to the spectroscopic
techniques employed to identify the point defects in pristine and irradiated samples.
Finally, it ends with the thermal treatments and irradiation sources.
4.1 Samples
The fibers studied in this thesis are made of silica glass, doped with Ge and/or F [1].
For some of the studied fibers the dopants concentration along the fiber diameter has
been obtained by the Electron MicroProbe Analysis (EMPA), performed by the Bureau
Veritas [135]. This technique allows to determine the concentrations of the different
dopants present in the fiber, by studying the signals emitted from the sample when
exposed to an electron beam. The spatial resolution, around 2 µm in our case, depends
on the used beam diameter.
The most important characteristics of all the used fibers are reported in table 4.1.
Ge-doped fibers
• Std-SMF is a step-index single-mode fiber, doped only with germanium in the core
and widely used in the telecom and sensor markets.
62 Chapter 4: Materials, treatments and experimental-setups
Sample Fiber type φcore(µm) φclad(µm) φcoat(µm) NAGerm
anium Std-SMF SM 8.2 125 245 0.14
Ge-SMF SM 9 125 242
Ge-MMF MM GI 50 125 242 0.2
Fluorine
PSC-SMF SM 8.2 125 240 0.12
F-SMF1SM 9 125 242
F-SMF2
F-MMF1
MM GI 50 125 242 0.2F-MMF2
F-MMF3
Table 4.1: The most important parameters characterizing the used fibers.
• Ge-SMF is a single-mode fiber, doped with germanium and fluorine.
• Ge-MMF is a graded-index multi-mode fiber and, as Ge-SMF, it is mainly doped
with germanium and fluorine, as shown in fig. 4.1: the Ge profile is parabolic with
a maximum concentration of 25 wt% in the fiber center, where the F profile has a
minimum.
F-doped fibers
• PSC-SMF is a step-index single-mode fiber having a pure silica core and a cladding
in F-doped silica, surrounded by another layer in pure silica.
• F-SMF1 and F-SMF2 are two single-mode fibers both doped with fluorine in the
core and in the cladding but with different dopant concentrations.
• F-MMF1, F-MMF2 and F-MMF3 are graded-index multi-mode fibers, character-
ized by different parabolic profiles for the fluorine concentration; the dopant profile
of F-MMF1 is shown in fig. 4.2.
4.2 Fiber Bragg Gratings 63
Figure 4.1: Profiles of the dopants concentra-
tion obtained with the EMPA technique for the
Ge-MMF. The chlorine is an impurity due to
the fabrication process.
Figure 4.2: Profiles of the dopants concentra-
tion obtained with the EMPA technique for the
F-MMF1. The chlorine is an impurity due to
the fabrication process.
4.2 Fiber Bragg Gratings
4.2.1 Fabrication
As already mentioned, Bragg gratings can be fabricated using different techniques: the
FBGs studied in this thesis were realized with the phase-mask technique, which is a simple
and not very expensive method for fabricating reproducible gratings of high quality.
The phase mask (PM) [56, 92] is made by a flat slat of silica glass. On one of the
surfaces, a 1-dimensional periodic surface-relief structure is etched using photolitographic
techniques; the shape of the periodic pattern approximates a square wave in profile. The
PM period (ΛPM) determines as well the period of the imprinted grating:
Λ = ΛPM/2 (4.1)
and it is independent of the laser wavelength. In contrast, the corrugation depth (APM)
is a function of the laser wavelength (λlaser) and of the refractive index of the phase mask
glass at that wavelength (nsilica(λlaser)); in order to result in a diffraction pattern with less
than 5% of its total intensity in the zero-order and approximately 35% in the diverging
+1 and -1 orders:
APM =λlaser
4(nsilica(λlaser)− 1)(4.2)
For the inscription, the stripped optical fiber, to which is applied a slight tension using
64 Chapter 4: Materials, treatments and experimental-setups
small weights, is placed almost in contact with the PM, with the grating corrugations
normal to the fiber axis, as shown in fig. 4.3. The laser light passes through the PM at
normal incidence, it is phase modulated spatially and diffracted, therefore it forms an
interference pattern along the fiber axis, which causes the refractive index modulation.
Figure 4.3: Scheme of the apparatus using the phase mask technique [92].
To write a FBG, besides the phase mask, a fused-silica cylindrical lens is required:
when its axis is parallel to the fiber axis, it focuses the laser light on a line, in particular
on the fiber core, and increases the energy density.
The Bragg gratings have been written by using two different lasers.
• UV continuum laser
FBGs were written in the H2-loaded standard telecom fibers (Ge-doped ones) by
using a frequency doubled CW argon-ion laser (Coherent). This laser, emitting at
244 nm (5.1 eV), has a spot diameter of ∼1 mm and it is powerful (maximum power
of 250 mW). So, a grating can be realized directly, without moving the fiber, by
using a beam expander. It is a system composed by two cylindrical lenses separated
by the sum of their focal lengths and it transforms the laser beam with a circular
cross section into an elongated beam.
4.2 Fiber Bragg Gratings 65
• IR femtosecond laser
Other gratings were written in Ge-doped or Ge-free fibers by a Ti-sapphire laser,
emitting 150 fs pulses at 800 nm (1.55 eV) with a repetition rate of 1 kHz. To
irradiate all the core, the focusing lens can be translate perpendicularly to the
direction of light propagation at a frequency ranging between 10 mHz and 10 Hz.
The area of the laser spot is smaller than 3 µm × 1 cm.
4.2.2 Set-ups for the Bragg wavelength monitoring
The Bragg wavelength monitoring during inscription, thermal treatments or irradia-
tions was realized in the transmission and reflection configurations, by three experimental
systems.
Figure 4.4: Block scheme of the standard setup in transmission (a) and reflection (b)
configuration. The gray lines represent optical fiber cables.
Figure 4.5: Block scheme of the high-performance setup. The gray lines represent optical
fiber cables.
• The standard set-up (fig. 4.4) is realized by a broadband source, as the Erbium
doped fiber source Photonetics FIBERWHITE, and the AQ6370C Optical Spec-
trum Analyzer (from Yokogawa), working in the wavelength range between 600 and
66 Chapter 4: Materials, treatments and experimental-setups
1700 nm with the maximum resolution of 0.02 nm. It can operate in both config-
urations; moreover, more fibers can be investigated automatically in the reflection
configuration, one after the other, by using a switch.
• The reflection set-up is made up by the NI PXIe-4844 optical sensor interrogator:
a system suitable for FBG optical sensors, with four optical channels that work in
the wavelength range between 1510 and 1590 nm, with a resolution of 30 pm; all
the channels are simultaneously sampled at 10 Hz.
• The high-performance set-up (fig. 4.5) is realized by a coupler, the tunable laser
Tunics Plus (from NetTest) and the CT400 high performance optical tester (from
Yenista Optics), operating in the wavelength range between 1260 and 1650 nm with a
maximum resolution of 1 pm; this setup can realize simultaneously the transmission
spectra of up to 4 gratings in few seconds, depending on the sweep range.
Peak analysis
Fig. 4.6 shows a typical transmission spectrum of a FBG and the principal parameters
used to define the Bragg peak.
Figure 4.6: Example of the transmission spectrum of a FBG.
• The Bragg wavelength is found using a third order polynomial approximation of the
peak, to account for a possible peak asymmetry, on a number N of points in the
transmission (or reflection) spectrum near the main dip (or peak). The value of N
4.3 Spectroscopic techniques 67
is chosen in order to obtain the best fit possible and a variation of the calculated
value for λBragg lower than 5 pm for N varying by 30% of its value.
• The grating amplitude is calculated as the difference between the value of the
measured and the reference spectra, both calculated at λBragg. The reference
spectrum is the transmission or reflection spectrum of the fiber without FBGs and it
is simulated by a high-order polynomial realized over all the spectrum range without
the portion of about 10 nm around the peak wavelength. This procedure eliminates
the influence of the light source intensity fluctuations and also the effect of the fiber
transmission degradation.
• The full width at half maximum, FWHM, is calculated as the distance between two
points on the two sides of the central wavelength at which the amplitude is half of
the maximum peak value expressed in dB.
4.3 Spectroscopic techniques
In order to study the fiber response, firstly the induced attenuation was evaluated in
the visible and infrared regions of the spectrum at room temperature (RT) before and
after irradiation, to estimate the permanent losses. Subsequently, thermal treatments
were performed on the irradiated samples to evaluate the high temperature treatment
effects on the attenuation. To well identify the origin of the observed absorption bands,
photo-luminescence measurements were performed, whereas electron spin resonance spec-
troscopy was used to investigate paramagnetic defects. Structural changes induced by
radiation and thermal treatments were investigated by Raman spectroscopy.
4.3.1 Radiation Induced Attenuation
In order to evaluate the changes permanently induced by radiation on the transmission
spectrum, RIA measurements at RT were performed by using the cut-back technique [17].
It consists of recording the transmission spectrum of a long and a short length of the
sample, IL(λ) and Il(λ) respectively. The shorter length is obtained by cutting a fiber
length ∆L, without changing injection conditions (fig. 4.7).
The spectral attenuation is defined as:
RIA(λ) = − 10
∆L· log10
(IL(λ)
Il(λ)
)(dB/m) 1 (4.3)
1The absorption coefficient in cm−1 is equal to 2.303 · 10−3 times the loss in dB/m.
68 Chapter 4: Materials, treatments and experimental-setups
Figure 4.7: Diagram of the cut-back technique
All the transmission spectra were recorded using a halogen (or deuterium) lamp
emitting light from ∼400 nm up to over 2000 nm (∼150 nm to 900 nm), coupled to
a spectrometer QE65000 from Ocean Optics for the UV-Visible range, between 200 and
750 nm, and to an Optical Spectrum Analyzer AQ6370C from Yokogawa for the IR range,
between 750 and 1700 nm.
Annealing effects on the RIA
Depending on the loss level, different lengths of the irradiated samples were heated in
air. The fibers were coiled to diameters of around 10 cm and put inside quartz cylinders
to avoid contact with the inner surface of the furnace. The acrylate coating of the fibers
can not indeed stand temperatures higher than 100C and it is totally removed by heat
treatment, with no additional effect on the transmitted signal. The tested fiber was
spliced, at both ends, to fiber pigtails. The optical transmission signal was recorded at
room temperature before and after the thermal treatment at the temperature Tann, INT (λ)
and I(λ, Tann) respectively. The as-measured difference spectrum I(λ, Tann)− INT (λ) was
calculated to monitor the RIA change and so the annealing effect.
Spectral decomposition approaches
To identify the centers responsible for the attenuation, the RIA curves can be decom-
posed as a sum of Gaussian bands. The difficulty is choosing the number n of bands
that have to be used and their characteristics (peak position, En, and full width at half
maximum, FWHMn) [136]. We have decided to fix the number of absorption bands to
be considered for the decomposition on the basis of all the previous studies and not to fix
their peak position and FWHM values but to let them change in small ranges centered
4.3 Spectroscopic techniques 69
on the values reported in literature. However, sometimes a new unknown band has to be
added to achieve good results.
The obtained result is a RIA curve expressed as:
RIA(E) =∑n
An exp(−(E − En)2/(2σn
2))
(4.4)
where An is the amplitude of the Gaussian band and FWHMn = 2√
2 ln(2)σn = 2.355σn.
The multi-gaussian decomposition is a procedure based on the fact that most of the
absorption bands are Gaussian and the asymmetric ones can be always represented by
several Gaussian functions. However, an easy mistake that can be committed is to
associate a component of an asymmetric band to a different center. This subject will
be discussed later for the NBOHC band.
Smakula’s equation: from the absorption to the defect concentration
With the optical absorption technique the absolute concentration N of the absorbing
species can be obtained, if the oscillator strength of the respective electronic transition is
known. The oscillator strength f of an electric dipole transition of energy E between the
initial (1) and the final (2) states is defined as [137]:
f =8π2meE
3h2e2
1
g1
· |〈2|~p|1〉|2 (4.5)
where g1 is the degeneracy of the initial state, ~p is the electric dipole operator and 〈2|~p|1〉is its matrix element between the two states. Moreover, this dimensionless parameter
measures the optical transition probability for the studied centers.
The oscillator strength f and the defect concentration N can be related to the
absorption coefficient α by the Smakula’s equation [137]:
f ·N =mec
πe2h· 9n
(n2 + 2)2
∫α(E) dE ' 8.2 · 1016 n
(n2 + 2)2
∫α(E) dE [eV−1 cm−2] (4.6)
where α(E) is the absorption in cm−1 and n is the refractive index of the medium.
For a gaussian band-shape,∫α(E) dE = 1.065 · αmax · FWHM .
4.3.2 Raman spectroscopy
Raman scattering is an inelastic scattering of light on molecules [32] (see section 2.2.2).
The energy difference between the incident and emitted photons corresponds to the energy
70 Chapter 4: Materials, treatments and experimental-setups
difference between the initial and final vibrational levels and it is independent of the
absolute energy of the photon, which generally falls in the visible and near-infrared regions
of the spectrum. The Raman spectroscopy is very useful to study the vibrational modes
of the molecules and so to obtain information on its structure: a Raman spectrum shows
the intensity of the scattered light as a function of its frequency difference with respect
to the incident photon.
Confocal micro-spectroscopy setup
All the Raman spectra were performed with the LabRAM Aramis (Horiba Jobin
Yvon), an integrated confocal microRaman system [138], whose schema is shown in fig. 4.8.
Figure 4.8: Optical path in the LAbRAM Aramis system [138].
To examine small volumes of the sample (∼ µm3), a confocal microscope uses a point
illumination, which is a laser light focused on the sample by an objective. The light signal
from the sample goes through a pinhole placed in an optically conjugate plane in front of
the detector and playing the role of the spectrograph entrance slit, to eliminate out-of-
focus signal. As a consequence, only the light that can be detected is the one produced
in a region very close to the focal plane, within a depth:
∆z =0.9λ0 nmedium
NA2 (4.7)
where nmedium is the refractive index of the medium between the sample and the objective,
generally air, NA is the numerical aperture of the objective and λ0 is the laser wavelength
[139]. For example, for a laser light at 325 nm and a 40× objective with NA = 0.5,
4.3 Spectroscopic techniques 71
∆z ∼ 1 µm.
The used confocal system is coupled to a 460 mm focal length spectrograph equipped
with a four interchangeable gratings turret. The excitation is realized by three different
sources: a HeNe laser working at 633 nm (1.96 eV), an Ar+ laser at 488 nm (2.54 eV) and
a HeCd laser emitting at 442 nm (2.81 eV) and at 325 nm (3.82 eV). The laser power can
be reduced by choosing one of the available density filters via software. On the incoming
path, the laser beam is reflected towards the microscope by the means of a special filter
used in injection/rejection mode. On the return path to the spectrograph, the Raman
backscattered light is transmitted towards the confocal slit-hole located at the entrance
of the spectrograph. Another filter is necessary to filter out the Rayleigh signal. Then
the spectrograph disperses the multichromatic Raman signal onto the CCD multichannel
detector.
Thanks to different motors, the sample stage can be moved along the three spatial
directions via software: this allows to easily realize mappings of the signal on the sample
surface or along its thickness. Spatial resolution depends on the used microscope objective
and pinhole diameter: for example, the 40× objective used for the UV excitation light
and a 75 µm pinhole imply a spatial resolution of 4.7 µm.
4.3.3 Photo-luminescence spectroscopy
Photo-luminescence, or briefly PL, is a process where an optically active defect, excited
by a light at the energy Eexc from its ground state to a higher one, decays back to a lower
state radiatively, by emitting photons of energy Eem, with Eem ≤ Eexc.
Figure 4.9: Jablonski diagram of a simple two-levels system. The continuous and dotted
arrows represent the spontaneous emission and the non-radiative relaxation from the excited
state, respectively.
Let us consider the simple two-levels system shown in fig. 4.9: the two levels have
72 Chapter 4: Materials, treatments and experimental-setups
energies E1 and E2, where E1 < E2, and populations N1 and N2. When the system is not
excited, N2 is almost zero, for the Boltzmann distribution. Under excitation at energy
Eexc ≥ E2 − E1, the higher level population N2 will increase because of the absorption
but it will decrease because of two processes [137]: the spontaneous emission, when the
center decays radiatively with a temperature independent rate kR and it emits a photon
with energy E2 − E1, and the non-radiative relaxation, when the center relaxes with a
temperature dependent rate kNR, by producing phonons. So, the variation rate of the
excited level population can be described by the equation [140]:
Table 5.1: Parameters of the gratings before irradiation. For fs-FBG-II the FWHM value can
not be determined, because the spectrum is too distorted.
(a)
(b) (c)
Figure 5.6: Gratings written by the fs laser in the Ge-doped fiber Std-SMF: evolution of the
Bragg peak parameters as a function of the time from the irradiation start, during the irradiation
up to the dose of 1 MGy and the recovery, both performed at RT. The vertical line indicates
the end of the irradiation run. The black points are referred to fs-FBG-I, whereas the red ones
to fs-FBG-II. In figure (a) the y-axis on the left indicates the radiation-induced error done by
the grating if it works as a temperature sensors.
5.2 Effects of irradiation 91
characterized by a red-shift up to 15 pm, and a slower one for higher doses, where
the Bragg wavelength decreases without showing a saturating tendency at the maximal
accumulated dose. This behavior does not depend on the inscription power, within an
error of 6 pm (around 0.5C). After irradiation, no significant recovery was observed and
for the fs-FBG-II λBragg initially continues to blue-shift further, by 5 pm. The error on
the temperature measurement due to the radiation is within a range of 5C.
The amplitude and the FWHM of the fs-FBG-I are rather not affected by the radiation:
their decrease is around 1%. In contrast, the fs-FBG-II strength variation is around 6%:
it increases up to the dose of 760 kGy and then it decreases, without recovering its initial
value.
Fluorine-doped fibers
Two types of F-doped fibers were chosen for the irradiation tests: the F-SMF1 and
the PCS-SMF, characterized by a F-doped silica core and a pure silica core, respectively.
For each fiber type, five gratings were written by the fs-laser with a power of 500 mW and
an initial amplitude higher than 10 dB: one grating was not thermally treated, two were
annealed at 350C and the other two at 750C. The values of the grating parameters before
irradiation are reported in table 5.2, together with the used irradiation temperature. It
would be useless to irradiate a not thermally treated grating at a temperature higher
than RT, because both radiation and temperature will cause the grating degradation.
The temperature sensitivity, obtained before irradiations, varies between 9 and 15 pm/C
and it decreases with increasing annealing temperature.
The X-ray irradiations were performed at RT, around 25C, and at ∼230C with a
dose rate of 50 Gy/s. At each irradiation temperature, two runs with dose of 1.5 MGy
were realized with a duration of 3 ·104 s, total dose being 3 MGy. For the gratings written
in the pure silica core fiber, a further run at RT was realized with a duration of 2 · 104 s,
for an additional dose of 1 MGy, in this case the total dose was 4 MGy.
Among all the parameters, the radiation-induced BWS is particular relevant, because
it represents the error on the temperature measurement caused by the radiation. Fig. 5.7
shows its profile for all the gratings, thermally treated or not, during irradiation at RT.
For the not thermally treated gratings written in the two fibers (fig. 5.7(a) and 5.7(d)),
λBragg shifts towards shorter wavelengths: the first irradiation causes a larger shift for
the F-doped core fiber than for the pure silica core fiber (0.06 nm against 0.02 nm at
the 1.5 MGy dose). For the F-doped core fiber, the recoveries and the second irradiation
produce a shift of about 0.02 nm towards the blue and the red, respectively. For the pure
silica core fiber, the observed trend is more complicated but it is easy to note that the
92 Chapter 5: Bragg Grating temperature sensor under radiation
Fib
erT
herm
al
Irradiation
Bragg
peak
Trea
tmen
tT
emp
erature
λB
(nm
)A
(dB
)F
WH
M(n
m)
F-d
oped
core
/R
T1539.736
±0.002
18.53±
0.020.577
±0.002
350C
RT
1539.610±
0.0038.69
±0.02
0.47±
0.03
750C
RT
1539.298±
0.0082.49
±0.12
0.39±
0.05
350C
230C
1541.61±
0.067.51
±0.03
∗0.420
±0.009
750C
230C
1542.080±
0.01525.9
±0.3
∗∼
2
Pure
silicacore
/R
T1545.345
±0.014
12.00±
0.070.93
±0.02
350C
RT
1544.601±
0.00412.00
±0.02
0.96±
0.02
750C
RT
1543.727±
0.0021.600
±0.006
0.374±
0.007
350C
230C
1549.98±
0.0412.88
±0.06
0.86±
0.02
750C
230C
1546.20±
0.021.400
±0.007
0.424±
0.014
Tab
le5.2:
Para
meters
valu
esof
the
gratings
before
irradiation
.∗
Th
esegratin
gsw
erean
alyzed
inrefl
ection.
5.2 Effects of irradiation 93
F-doped core fiber
(a)
(b)
(c)
Pure silica core fiber
(d)
(e)
(f)
Figure 5.7: Irradiation at RT: Bragg wavelength shift, corrected with respect to the temper-
ature variations, as a function of the time from the first irradiation start, for gratings written in
(a, b, c) the F-doped core and (d, e, f) the pure silica core fibers. The black points are recorded
during irradiations whereas the red ones during recoveries at RT. The vertical lines indicate the
start and the end of the two (for the first fiber, on the left) or three (for the second fiber, on
the right) irradiation runs. In the upper part of each graph the total dose reached after a run is
shown, dose-rate being 50 Gy/s. The y-axis changes from a grating to another. The y-axis on
the left indicates the radiation-induced error done by the grating if it works as a temperature
sensors.
94 Chapter 5: Bragg Grating temperature sensor under radiation
F-doped core fiber
(a)
(b)
Pure silica core fiber
(c)
(d)
Figure 5.8: Irradiation at T≈ 230C: Bragg wavelength shift, corrected with respect to the
temperature variations, as a function of the time from the first irradiation start, for gratings
written in (a, b) the F-doped core and (c, d) the pure silica core fibers. The black points are
recorded during irradiations whereas the red ones during recoveries at ∼ 230C. The vertical
lines indicate the start and the end of the two irradiation runs. In the upper part of each graph
the total dose reached after a run is shown, dose-rate being 50 Gy/s. The insert of the graph
(d) shows a zoom of the BSW near the end of the first run. The y-axis on the left indicates the
radiation-induced error done by the grating if it works as a temperature sensors.
5.2 Effects of irradiation 95
second and third irradiations cause a further blue-shift lower than 0.02 nm. In both the
fiber types, this shift of 0.02 nm corresponds to an error on the temperature measurement
of about 1.5C.
For the gratings annealed at 350C (fig. 5.7(b) and 5.7(e)), during the first irradia-
tion the BWS initially increases with the dose, then it reaches a maximum value, that is
smaller for F-SMF1 than for PSC-SMF (8 pm against 27 pm), and it starts to decrease;
during recovery it continues to decrease till 0 pm for the first fiber and 9 pm for the
second. For F-SMF1, the second irradiation run does not change λBragg, probably be-
cause the radiation and the recovery effects compensate. For PSC-SMF, a pre-irradiation
improves the grating response, indeed the first 1.5 MGy increase the Bragg wavelength
by 27 pm, the second additional 1.5 MGy increase the BWS from 9 pm to 27 pm, whereas
the BWS due to the last run of 1 MGy dose is smaller than 18 pm, that corresponds to
1.5C. Moreover, it can be highlighted that during the last run the Bragg peak reaches
the maximum red-shift quickly, at the dose of only 0.3 MGy.
For the gratings annealed at 750C (fig. 5.7(c) and 5.7(f)), the Bragg peak red-shifts
during irradiation and it blue-shifts during recovery. For the F-doped core fiber, the peak
wavelength increases by 12 pm at the total dose of 3 MGy, this corresponds to an error
on the temperature measurement of 1C. Instead, the grating written in the pure silica
core fiber shows a saturating BWS behavior at doses of about 0.3 MGy and the maximum
temperature error that can be done during all the irradiations is also in this case about
1C.
For the irradiations at higher temperature, held at 230C during all the experiment,
the compensated Bragg wavelength shift is shown in fig. 5.8.
For the gratings annealed at 350C (fig. 5.8(a) and 5.8(c)), the Bragg wavelength
decreases during irradiation: after a 3 MGy dose, the maximum shift is around 0.2 nm
that means a temperature error due to the radiation of about 10C. This value is one
order of magnitude bigger than in the case of the irradiations at RT. Fig. 5.8(c) highlights
that for the grating written in the pure silica core fiber the Bragg peak continues to
shift towards the blue during the recovery at 230C after the first run: this suggests that
the thermal treatment is still erasing the grating, so the pre-annealing at 350C was not
enough to stabilize the FBG for an use of two days at 230C.
For the gratings annealed at 750C (fig. 5.8(b) and 5.8(d)), the Bragg wavelength
shows a saturating tendency: it does not change anymore after the first run at a dose of
1.5 MGy. During the recovery the peak blue-shifts quickly of about 20 pm (as shown in
the inset of fig. 5.8(b)), whereas at the start of the second irradiation run it red-shifts by
the same quantity. This shift can not be associated with a temperature change due to
96 Chapter 5: Bragg Grating temperature sensor under radiation
the irradiation light-on or -off, because the BWS was already corrected with respect to
these variations. The total shift is always within 30 pm, towards the red or the blue for
F-SMF1 and PSC-SMF, respectively. The error on the temperature due to the radiation
is lower than 1.5C. In contrast to the graphs of fig. 5.7, the data in fig. 5.8 possess
a significant noise and this causes an uncertainty on the temperature measurement of
about (0.5-1)C. It can be guessed that the origin of this noise is the compensation: the
temperature measurements are subjected to random errors and the correction for the
temperature variation increases the noise of the BWS.
5.3 Discussion and comparison with the literature
Gratings in Ge-doped fibers
As reported in Chapter 3, very few publications deal with the radiation sensitivity of
gratings written with femtosecond IR lasers. For both the type I and the type II gratings
written in the standard Ge-doped fiber, it was observed a BWS increase up to ∼15 pm
at 100 kGy followed by a slower decrease of ∼8 pm up to 1 MGy dose [66,131]. A similar
evolution under radiation was observed for our samples: no significant difference between
the type I and the type II gratings and an initial BWS increase, up to 15 pm at 40 kGy
dose, followed by a decrease, which is more important in our case, about 0.05 pm/kGy.
This difference can be due to the different conditions: the dose-rate used in our experiment
was higher, 50 Gy/s against 1-2 Gy/s, and our gratings were not thermally treated. As
stated in literature, the lower dose-rate should decrease the BWS values [126]; however,
the exposure to higher temperatures should increase the grating radiation sensitivity [120].
The cause of this blue-shift is not clarified yet. In order to make some hypothesis about
its origin, a comparison with a grating written by the cw UV laser in the hydrogenated
Std-SMF1 is reported in the following. Fig. 5.9 shows the peak shift during the X-ray
irradiation at RT for the gratings written in the standard Ge-doped fiber by the cw UV
and the fs IR laser, UV-FBG and fs-FBG-I, respectively. The UV-FBG shows a red-shift,
whereas the fs-FBG-I is mainly characterized by a blue-shift.
From the definition of λBragg, reported in Eq. 2.15, it is can be found that:
∆λBraggλBragg
=∆neffneff
+∆Λ
Λ(5.3)
If only the dependence on neff is taken into account, the red-shift (the blue shift) means
an increase (a decrease) of the average effective index, which can be explained with
1H2-loading at 130 mbar and RT, for a week, followed by a thermal treatment at 80C for 7 h.
5.3 Discussion and comparison with the literature 97
Figure 5.9: Evolution of the Bragg wavelength shift as a function of the time from the irradiation
start, or the dose, the dose rate being 50 Gy/s, during irradiation at RT, up to 1 MGy dose.
The gratings have been written in the Std-SMF Ge-doped fiber, the UV-FBG (black points) by
the cw UV laser, whereas the fs-FBG-I (red points) by the fs IR laser.
Figure 5.10: Attenuation spectra of the three FBGs written in the Std-SMF Ge-doped fiber,
before (dotted line) and after (continuous line) irradiation.
98 Chapter 5: Bragg Grating temperature sensor under radiation
the Kramer-Kronig relation as a consequence of an increase (a decrease) of absorption
at shorter wavelengths, the UV-Vis region of the spectrum. To verify this hypothesis,
attenuation spectra on the gratings were measured at RT before and after irradiation,
using the cut-back technique (see section 4.3.1), and they are reported in fig. 5.10: for all
the gratings the radiation causes an increase of the attenuation. Generally, in a fiber the
scattering losses can be neglected with respect to the absorption, above all in the UV-Vis
range, and the attenuation spectrum can be considered coincident with the absorption
one. When a grating is written inside the fiber, the light is reflected and scattered at each
refractive index variation: for example, for the fs-FBG-II, the attenuation spectra show all
the other orders of λBragg and the background around 103 dB/m is due to the scattered
light. All these spectra let us deduce that the absorption in the UV-Vis range should
increase or at most remain unchanged. As a consequence, a blue-shift of the Bragg peak
can be explained not with a decrease of neff but by a Λ reduction, due to a compaction.
If ∆neff is neglected, an underestimation of the compaction can be obtained:
∆Λ
Λ∼ ∆λBragg
λBragg∼ −0.03 nm
1606 nm∼ −2 · 10−5 = −20µε (5.4)
that entails a compaction ∆ρρ
of about 10−14, that is too low to be experimentally verified
with other techniques yet.
Gratings in F-doped fibers
For the not pre-treated gratings, the evolution of the BWS under radiation observed
in the F-doped fibers is very similar to that observed in the Ge-doped one, except for
the lack of the first fast red-shift regime: the Bragg peak blue-shifts directly from the
irradiation start. However, the slope of the blue-shift is larger for the Ge-doped FBG
than for the Ge-free FBGs, by a factor ∼2 (-0.05 pm/kGy against -0.03 pm/kGy for the
F-doped core fiber and -0.02 pm/kGy for the pure silica core fiber).
A surprising result is obtained for the pre-treated gratings. In literature it stated that
an exposure to higher temperature increases the grating radiation sensitivity, because de-
fects created during the grating inscription are annealed at high temperature and can be
generated again by the ionizing radiation. This was observed for gratings written both by
UV lasers [116,120] and fs lasers [131]. Our results suggest that a pre-annealing enhances
the radiation-resistance of gratings: for example, for the F-doped core fiber the BWS due
to the only first 1.5 MGy irradiation run decreases from ∼50 pm, without treatments, to
∼8 pm for the treated gratings. Moreover, the annealing changes the BWS direction from
the blue to the red.
5.3 Discussion and comparison with the literature 99
In conclusion, we focused our attention on the gratings written with the femtosecond
radiation at 800 nm, in particular in F-doped fibers.
The thermal response of the gratings depends strongly on the inscription conditions.
If the laser power is lower than 450 mW (power density in front of the PM lower than
1.5 kW cm−2) or the inscription time is shorter than 30 s, the gratings will be erased
by a treatment at 750C, necessary for their stabilization. Our studies showed that a
laser power of 500 mW (power density in front of the PM around 1.7 kW cm−2) and an
initial amplitude larger than 10 dB are good conditions to write a grating having good
characteristics. Otherwise, a pre-treatment at a temperature higher than that of the
application stabilizes the FBG. However, if the application temperature reaches that
of the pre-treatment, 750C in our case, the induced blue-shift causes an error on the
temperature measurement of about 2C for a grating written in a F-doped fiber and of
about 20C for a grating written in a Ge-doped fiber.
Regarding the grating response under radiation, it does not depend strongly on the
inscription conditions for the fs-FBGs. In contrast, the thermal pre-treatment is crucial.
For the FBG written in F-doped fibers, the Bragg peak blue-shifts directly from the
irradiation start for non pre-treated gratings, whereas it starts shifting towards the red
for the gratings that undergo a thermal treatment before irradiation. The pretreatment
is essential for the grating stabilization and radiation-resistance: the radiation-induced
error on the temperature measurement decreases from 5C, for the non treated sample,
to about 3C for the gratings treated at 350C and down to 1.5C for the samples
annealed at 750C.
100 Chapter 5: Bragg Grating temperature sensor under radiation
Dans ce chapitre, nous avons principalement presente les resultats relatifs aux reseaux
inscrits par laser a impulsion femtoseconde a 800 nm, en particulier dans les fibres dopees
au fluor.
La reponse thermique des reseaux depend fortement des conditions d’inscription. Si la
puissance du laser est faible (densite de puissance avant le masque de phase inferieure a
1.5 kW cm−2) ou le temps dinscription est court (inferieur a 30 s), les FBG sont effaces par
le traitement a 750C, necessaire pour leur stabilisation. Nos etudes ont montre qu’une
puissance de 500 mW (densite de puissance avant le masque de phase de l’ordre de 1.7 kW
cm−2) et une amplitude initiale superieure a 10 dB constituent de bonnes conditions pour
obtenir un FBG presentant de bonnes caracteristiques. Par ailleurs, un pretraitement
a une temperature plus elevee que celle de l’application stabilise le FBG. Cependant, si
la temperature de l’application atteint celle du pretraitement, 750C dans notre cas, on
assiste a un decalage vers le bleu causant une erreur sur la mesure de temperature de
∼2C pour un reseau inscrit dans une fibre dopee au fluor et d’environ 20C pour un
reseau inscrit dans une fibre dopee au germanium.
En ce qui concerne la reponse des reseaux sous radiation, les reseaux inscrits par laser a im-
pulsion femtoseconde ne presentent pas une forte dependance aux conditions d’inscription.
En revanche, le pretraitement thermique est determinant. Pour les reseaux de Bragg in-
scrits dans la fibre dopee au fluor, le pic de Bragg se decale vers le bleu des le debut de
l’irradiation pour les reseaux non traitees thermiquement, alors qu’il commence par se
decaler vers le rouge pour les reseaux pretraites. Le pretraitement est aussi primordial
pour la stabilisation et l’immunite des FBG vis-a-vis des radiations ; l’erreur associee
a l’irradiation pour la mesure de la temperature passe de 5C, pour l’echantillon non
pretraite, a environ 3C pour les reseaux pretraites a 350C et a 1.5C pour les echantillons
pretraites a 750C.
In questo capitolo abbiamo focalizzato la nostra attenzione sui reticoli iscritti con la
radiazione al femtosecondo a 800 nm in fibre drogate con fluoro.
La risposta termica dei reticoli dipende fortemente dalle condizioni d’iscrizione. Se la
potenza del laser e bassa (densita di potenza prima della maschera di fase inferiore a 1.5
kW cm−2) o il tempo d’iscrizione e breve (inferiore a 30 s), i reticoli vengono rimossi dal
trattamento a 750C, necessario per la loro stabilizzazione. I nostri studi hanno mostrato
che una potenza del laser di 500 mW (densita di potenza prima della maschera di fase
dell’ordine di 1.7 kW cm−2) e una ampiezza iniziale maggiore di 10 dB costituiscono delle
buone condizioni per ottenere un FBG con delle buone caratteristiche. Inoltre, un pre-
trattamento ad una temperatura superiore a quella dell’applicazione stabilizza il FBG.
Tuttavia, se la temperatura dell’applicazione raggiunge quella del pre-trattamento, 750C
5.3 Discussion and comparison with the literature 101
nel nostro caso, il blu-shift indotto causa un errore sistematico sulla misura della temper-
atura inferiore ai 2C, se il reticolo e stato iscritto in una fibra drogata con fluoro, e di
circa 20C in una fibra drogata con germanio.
Per quanto riguarda la risposta del reticolo sotto irraggiamento, essa non dipende forte-
mente dalle condizioni d’iscrizione, per i reticoli iscritti con la radiazione al femtosecondo.
Tuttavia, il pre-trattamento termico e determinante. Per i FBG iscritti in fibre drogate
con il fluoro, il picco di Bragg si sposta verso il blu dall’inizio dell’irraggiamento, se non
sono pre-trattati, mentre esso inizia a spostarsi verso il rosso, se i reticoli subiscono un
trattamento termico prima dell’irraggiamento. Il pre-trattamento e fondamentale per la
stabilizzazione dei reticoli e la resistenza alla radiazione: l’errore associato alla misura di
temperatura diminuisce da 5C, per il campione non trattato, a circa 3C per i reticoli
trattati a 350C, fino a meno di 1.5C per i campioni pre-trattati a 750C.
102 Chapter 5: Bragg Grating temperature sensor under radiation
103
Chapter 6
Spectroscopic characterization
This chapter reports the main results obtained for the radiation effects on the trans-
mission properties of optical fibers doped with fluorine and/or germanium. The origin of
the attenuation was studied decomposing the RIA spectra as a sum of Gaussian curves
and investigating the photoluminescence emission, whereas the EPR technique allows us
to observe the paramagnetic defects.
6.1 Fluorine doped fibers
In this section dealing with the F-doped fibers, the results obtained on F-SMF1 and
F-MMF1, unless noted otherwise, will be shown: same conclusions can be realized for
all the other F-doped fibers. All the fibers were irradiated with γ-rays or neutrons at
different doses.
6.1.1 RIA and its origin
Under γ-radiations, the RIA spectra of the multi- or single-mode fibers made of F-
doped silica are displayed in fig. 6.1. These curves show the same trend and consist of at
least three contributions:
• an UV-absorption tail which increases with decreasing wavelength,
• an absorption band in the visible range, around 620 nm,
• an IR-absorption which increases for wavelengths longer than 900 nm.
Despite the spectra missing part, due to the range of the two detectors, it is evident that
the RIA curves have a minimum around 900 nm. Moreover, for the single-mode fiber, an
absorption band around 1400 nm seems present, in fact the IR part of this spectrum has
104 Chapter 6: Spectroscopic characterization
to be considered as an upper limit, because it is influenced by the fiber bending losses.
This problem does not come up for multi-mode fibers.
Figure 6.1: RIA spectra of the γ-irradiated F-doped multi- (black curve) and single-mode (red
curve) fibers at 10 MGy.
The RIA increases with increasing irradiation dose, as shown in fig. 6.2, whereas fig. 6.3
displays the post-irradiation thermal treatment effects: the absorption bands induced by
the radiation decrease their amplitude with increasing annealing temperature.
Figure 6.2: RIA spectra of the γ-irradiated F-doped multi-mode fibers at different doses: 3, 5.5
and 10 MGy.
In the visible range (fig. 6.3(a)), the absorption band at 620 nm is completely annealed
after the thermal treatment at 550C, whereas the UV tail amplitude is only slightly
reduced by the treatment, indeed the residual attenuation at the wavelength of 400 nm
6.1 Fluorine doped fibers 105
(a) Visible range
(b) IR range
Figure 6.3: All the spectra are referred to the 10 MGy irradiated F-doped multi-mode fiber:
(a1-b1) RIA spectrum obtained with the cut-back technique, (a2-b2) RIA changes induced by
the thermal treatments at 300C (red line) and 550C (blue line), (a3-b3) Residual RIA after
the thermal treatments, obtained as the sum of the curve reported in (a1-b1) and in (a2-b2).
The thermal treatment at 750C causes no further change, so the curves are not shown.
106 Chapter 6: Spectroscopic characterization
is still around 1 dB/m. In the IR range (fig. 6.3(b)), it is the treatment at 300C that
reduces the attenuation at 0 dB/m, within the experimental uncertainty.
The limited range of the detector lets record only a tail of the IR band, so it is mean-
ingless to fit this curve with a Gaussian function. In literature, a NIR-band peaked at
a wavelength longer than 1500 nm and observable only at low temperatures, up to 160
K, is attributed to STH defects by Chernov et al. [150]. Even if it is known that STHs
are unstable at RT, Regnier et al. [151] supposed to associate with these defects their
NIR-band peaked around 1800 nm (∼0.7 eV, FWHM = 0.3 eV) and observed at RT in
a pure silica core fiber γ-irradiated at an accumulated dose of 100 Gy. According to the
authors, these defects were observable at RT thanks to their high measurement sensitivity
obtained by using several km long fibers.
Also the origin of the absorption around 620 nm (2 eV) is still debated: one of the main
questions concerns its assignment to a single or more defects. Under the hypothesis that
more components overlap around 620 nm [152], the RIA spectra of fig. 6.2 were analyzed
as a sum of three Gaussian curves. The absorption below 450 nm (above 2.8 eV), due to
all the defects absorbing in the UV region, is accounted for by another Gaussian centered
around 225 nm (∼5.5 eV).
Fig. 6.4 displays the decomposition of the RIA spectrum of the 10 MGy irradiated
fiber; the spectral parameters are listed in table 6.1.
Figure 6.4: Decomposition into Gaussian bands of the RIA spectrum of the 10 MGy irradiated
F-doped multi-mode fiber: measured spectrum (dots) and fitted curve (lines).
6.1 Fluorine doped fibers 107
Band Position (eV) FWHM (eV)
1 1.945 ± 0.004 0.161 ± 0.011
2 2.04 ± 0.05 0.27 ± 0.08
3 2.21 ± 0.05 0.46 ± 0.06
Table 6.1: Spectral parameters of the bands used for the decomposition of all the OA spectra
recorded in F-doped fibers irradiated at 3, 5.5 and 10 MGy. The error accounts for half of the
maximum deviation.
These results, derived from the fitting, agree with previous studies on thermally treated
F-doped samples, both fibers and bulks. Griscom and Mizuguchi have attributed a band
centered at 1.97 eV with FWHM of 0.18 eV to PORs, a band at 2.08 eV with FWHM of
0.3 eV to NBOHCs induced by the H removal from SiOH groups and a band at 2.19 eV
with FWHM of 0.5 eV to NBOHCs produced by the radiolysis of Si-O bonds [152].
However, some findings weaken this model, in favor of a ‘single-defect’ model, consid-
ering only the NBOHC. Firstly, the absorption band shape is independent of the radiation
dose, consequently the generation rate under radiation of the three defects should be ex-
actly the same. Secondly, the OH concentration is not high enough (∼0.2 ppm) to justify
the 2.04 eV band intensity, associated with the NBOHCs deriving from the SiOH groups,
compared to the 2.21 eV component, due to the NBOHCs produced by the Si-O bond
rupture, as shown in fig. 6.4. Thirdly, the 2 eV absorption is completely annealed at
550C, as pointed out in fig. 6.3(a), consequently it seems unlikely a model containing
an absorption band due to the PORs, whose annealing is completed around 700C [153].
But the most important evidence is given by PL measurements obtained with the Con-
focal Microscopy Luminescence setup. It is known that NBOHC is characterized by an
asymmetric luminescence band at ∼1.9 eV that can be excited through all its absorption
bands, peaked around 2, 4.8 and 6.8 eV [137]. So, it is possible to study the correlation
of the absorption band at 2 eV with NBOHC through this PL: fig. 6.5 highlights the
linear correlation between this absorption and the PL intensity emitted from all the fiber-
transverse-surface at 1.9 eV under the laser excitation at 3.82 eV, which falls in the tail of
the PLE spectrum of the NBOHC. The pristine fiber shows a weak 1.9 eV emission, whose
intensity agrees with an absorption lower than the experimental uncertainty (0.10 dB/m).
In conclusion, the identification of the 1.9 eV emission with the NBOHC entails
that only this defect is the origin of the 2 eV absorption. This hypothesis has been
already advanced in previous studies: for instance, Cannas et al. observed an asymmetric
absorption band peaked at 2.01 eV with a FWHM of 0.44 eV in γ- and β-irradiated
synthetic wet silica samples and they associated it with NBOHCs thanks to its linear
correlation with the 1.9 eV PL [154].
108 Chapter 6: Spectroscopic characterization
Figure 6.5: PL intensity emitted from all the fiber-transverse-surface at 1.9 eV under excitation
at 3.82 eV, as a function of the optical absorption at 2 eV for pristine, 3, 5.5 and 10 MGy
irradiated fibers. The dashed line is the fitted straight line (correlation coefficient R = 0.997).
6.1.2 Spectroscopic characteristics of Si-NBOHCs in fibers
Most of the PL studies about NBOHCs were realized in silica bulk samples; in con-
trast, its spectroscopic characteristics were poorly investigated in fibers [155]. So, in this
section a methodical study on the spectral and decay features of the NBOHC in fibers
will be presented.
The radiation and annealing effects on the PL band shape are reported in fig. 6.6:
because of the radiation the peak red-shifts from 1.92 to 1.90 eV while the FWHM
increases from 0.15 to 0.17 eV; on the other hand, the thermal treatment causes the
opposite effects.
Fig. 6.7 displays an example of the 1.9 eV PL decay, obtained carrying out time
resolved PL spectra on increasing TD up to 90 µs with ∆t ranging between 1 and 4 µs
(see section 4.3.3). It agrees with a stretched exponential, exp(−(t/τ)β), characterized
by a lifetime τ = (11 ± 1) µs and a stretching parameter β = 0.81 ± 0.07. Moreover, it
was observed that these decay features remain unchanged regardless the excitation energy
both in the visible (∼2.0 eV) and in the UV (∼4.8 eV), the irradiation or the thermal
treatments.
Finally, fig. 6.8 displays the excitation profile obtained by monitoring the peak emis-
sion intensity under laser excitation photon energy ranging from 1.7 to 2.3 eV. Both in
the pristine and in the irradiated samples, the visible excitation shows an asymmetric
band centered at (1.95 ± 0.02) eV with FWHM of (0.16 ± 0.02) eV.
6.1 Fluorine doped fibers 109
Figure 6.6: PL spectra recorded, with the time-resolved setup using the transverse excitation,
on the pristine fiber (continuous line), that irradiated up to 10 MGy before (dashed line) and
after the treatment at 300C (dotted line). The laser excitation energy was 2.07 eV (600 nm)
and the temporal parameters were fixed: TD = 1 µs and ∆t = 10 µs.
Figure 6.7: Semilog plot of the PL decay measured at 1.9 eV in the 10 MGy irradiated sample
excited at 2.07 eV.
110 Chapter 6: Spectroscopic characterization
Figure 6.8: Visible-excitation spectra of the PL at 1.9 eV measured with TD = 1 µs and
∆t = 10 µs in the pristine (full circles) and the 10 MGy irradiated sample (empty circles).
All the spectral and decay features evidenced by time-resolved PL experiments support
that the defect emitting at 1.9 eV in the F-doped fibers is the NBOHC. However, from
a spectroscopic viewpoint, the acceptance of this single-defect model seems to be in
contradiction with the different shapes of the absorption and PLE bands. It is known
that the asymmetric PL and PLE spectra are accounted for by the weak electron-phonon
coupling, characteristic of the NBOHC. As a consequence, these bands can be described
by a Pekarian curve, which is the convolution of a Gaussian and a Poissonian and, under
the straightforward model of coupling with a single mode having a mean Huang-Rhys
factor S and an effective frequency ω, the lineshape I(E) can be approximated by the
function [156]:
I(E) ∝∑
ne−S
Sn
n!exp
[−(E − E00 ± nhω)2
2σinh2
](6.1)
valid at temperature sufficiently low in order not to populate the higher vibrational levels,
that is KBT hω. The signs + and − refer to the PL and PLE lineshape, respectively.
Because of the glass disorder, the pure electronic transition between the lowest vibrational
levels of the first excited and ground states is inhomogeneously distributed in agreement
with a Gaussian curve, peaked at E00 with FWHMinh = 2√
2ln(2) · σinh.We used the equation 6.1 to best fit the PL and PLE curves measured in the irradiated
sample, as shown in fig. 6.9, and we got S = 1.3 ± 0.3, hω = (0.053 ± 0.009) eV,
6.1 Fluorine doped fibers 111
Figure 6.9: Normalized PL, PLE and OA spectra of the sample irradiated at 10 MGy.
Solid curves represent the best-fitting functions (Eq. 6.1). The inset shows the quantum
yield calculated as the ratio between PLE and absorption.
E00 = (1.93 ± 0.01) eV and FWHM inh = (0.082 ± 0.002) eV. We note that our spectra
are detected at room temperature and hω ∼ KBT , this introduces a further Gaussian
broadening adding to the inhomogeneous one [157], that could be therefore overestimated
by our fit procedure. In fact, FWHM inh has been measured in previous works based on
site selective luminescence [158] and it varies between 0.071 and 0.086 eV, depending on
the irradiation history.
As concerns the absorption spectrum, its band shape is much wider than the PLE
one. Under the assumption that it is completely due to NBOHC, the ratio between PLE
and absorption curves is proportional to the quantum yield and it results in a photon
energy dependent curve, as shown in the inset of fig. 6.9, thus suggesting that there are
absorbing NBOHCs with non-radiative emission.
6.1.3 Spatial distribution of NBOHCs in fibers
Thanks to the Confocal Microscopy Luminescence setup, the NBOHC concentration
profile along the fiber diameter was studied. PL spectra were recorded using the laser
excitation at 3.82 eV. Fig. 6.10 reports the PL intensity at 1.9 eV normalized to that
emitted from the core center, in the pristine and the 10 MGy irradiated multi-mode
fiber. Both the fiber fabrication process, as the drawing [159], and the radiation create
NBOHCs: the lower is the F content, the higher is the defect concentration; moreover,
112 Chapter 6: Spectroscopic characterization
the NBOHC profile is wider in the irradiated fiber than in the pristine one and it does
not change with increasing dose.
Figure 6.10: NBOHC profile detected through the 1.9 PL band on the pristine and
irradiated MM fiber and F concentration profile obtained with the EMPA technique.
The PL spectra were performed with the CML setup, under excitation at 3.82 eV, using
a 40× objective and a diaphragm diameter of 75 µm, for a spatial resolution of ∼5 µm.
The semi-logarithmic scale of fig. 6.11 points out the anticorrelation existing between
the NBOHC concentration and the F content; the concentration of both the drawing
and irradiation induced defects decays exponentially with the F content, according the
following equation [160]:
[NBOHC] ∝ exp (− [F ] / [F0]) (6.2)
where [F0] is the F content at which the NBOHC concentration decreases by a factor of e.
From the derivative of Eq. 6.2,
d [NBOHC]
[NBOHC]= −d [F ]
[F0](6.3)
it is evident that the generation rate decreases on increasing the defect concentration or
the F content and it depends also on the generation process through the coefficient 1/ [F0]:
it can be thought as the reduction of the effective volume for the defect formation and it
is ∼1.3 (wt%)−1 for the drawing and ∼0.4 (wt%)−1 for the irradiation.
6.1 Fluorine doped fibers 113
Figure 6.11: Normalized 1.9 eV PL intensity a function of the F content in the pristine
and irradiated MM fiber, in semi-logarithmic scale. Solid lines represent the best fitting
curves with Eq. 6.2.
6.1.4 Radiation and annealing effects on the Raman spectra
To investigate more the radiation and annealing effects on the samples, Raman spectra
were recorded by using the Confocal Microscopy Raman setup. In this case, the results
are shown for the fiber F-MMF2, because of the higher signal-to-noise ratio of these spec-
tra.
The fluorine is incorporated into the silica matrix by forming mainly Si-F bonds, indeed
the presence of free fluorine atoms was predicted by simulations only in high temperature
quenched glasses [161]. Generally, the fluorine tends to depolymerize the silica network,
by breaking Si-O-Si linkages, preferentially the strained ones, replacing a bridging oxygen
atom and, consequently, resulting in SiO3F tetrahedra, where the Si-F distance is about
1.7 A [161]. However, in an experimental and simulation work [161] Youngman et al.
observed that a small fraction of fluorine can bond to Si atoms without any rupture of the
Si-O network, resulting in fivefold coordinated silicons of the type of SiO4F, where the
Si-F distance is longer, around 1.9-2 A. Finally, on the basis of bond valence calculations,
the fluorine atom can exist in a bridging configuration, as Si-F-Si linkages, but there is
still no experimental evidence.
The presence of the fluorine gives rise to two new bands in the Raman spectra: they
are peaked around 480 and 945 cm−1 and ascribed to the Si-F bending and stretching
114 Chapter 6: Spectroscopic characterization
vibrational mode of a SiO3F tetrahedron, respectively [162,163].
To understand the Raman spectra of the silica glass, reported in the following, table 6.2
reports the assignement of all the most common Raman bands.
Position(cm−1
)Assignment
445 (main band) symmetric stretching of bridging oxygens in n-membered rings, with n
higher than 5
495 (D1) breathing motion of bridging oxygens in 4-membered rings
606 (D2) breathing motion of bridging oxygens in 3-membered rings
800 bending of the Si-O-Si bridge
1060 TO (transversal optical mode) asymmetric stretching of bridging oxy-
gens
1200 LO (longitudinal optical mode) asymmetric stretching of bridging oxy-
gens
Table 6.2: Raman band assignment for silica glass [10].
Fig. 6.12(a) shows the Raman spectra recorded in different zones of the F-doped
multi-mode fiber; in particular, going outwards from the center, the F content increases,
causing:
1. an increase in the intensity of the two Raman bands associated with the Si-F bonds,
as observed by Shimodaira et al. [163]: the increasing of the 480 cm−1 band makes
impossible to determine the D1 band presence and the main band position, that
seems to shift towards higher wavenumbers;
2. a clear decrease in the intensity of the D2 band, as observed by Mulder et al. [164];
in our case, an increase of the F concentration from 0.2 to 5 wt% leads to a reduction
of the D2 band area by ∼10%;
3. the loss of the components at lower wavenumbers of the 1060 cm−1 band, causing a
shift of its peak, while the other component at 1200 cm−1 does not show any change.
It was observed that the γ-radiation up to a 10 MGy dose does not change the silica
structure (curves not shown here), whereas the thermal treatment does. Fig. 6.12(b)
reports the Raman spectra recorded in different zones of the F-doped multi-mode fiber
after an annealing at 750C and it highlights that the annealing affects more the structure
of the zones with higher F content, by inducing bigger changes in the Raman bands, as:
1. the reduction of the D2 area which ranges from 10%, in the core center with only
0.2 wt% F content, to 80%, in the zone with 5 wt% F content;
6.1 Fluorine doped fibers 115
200 400 600 800 1000 1200 1400
0
2
4
800 1000 12000
1
Distance from the center 0 µm 5 µm 10 µm 15 µm 20 µm
Nor
mal
ized
Ram
an I
nten
sity
Raman Shift (cm -1 )
(a) Pristine fiber
200 400 600 800 1000 1200 1400
0
2
4
800 1000 12000
1
Distance from the center 0 µm 5 µm 10 µm 15 µm 20 µm
Nor
mal
ized
Ram
an I
nten
sity
Raman Shift (cm -1 )
(b) Fiber annealed at 750C
Figure 6.12: Raman spectra detected at different distances from the center in the pristine F-
doped multi-mode fiber, (a) before and (b) after a thermal treatment at 750C. All the spectra
were measured under excitation at 3.82 eV, with a spatial resolution of ∼5 µm (due to the 40×objective and the diaphragm diameter of 75 µm), and normalized to the intensity of the peak
around 800 cm−1. The arrows show the trend of Raman bands on increasing the distance.
116 Chapter 6: Spectroscopic characterization
2. a shift of the 1060 cm−1 band peak towards higher wavenumbers.
No observation can be made for the D1 band, because of its overlapping with other bands.
In conclusion, it seems that the thermal treatment facilitates the fluorine in fulfilling its
task.
To better understand the annealing effects on fluorine, fig. 6.13 displays the area of
the 945 cm−1 and D2 bands as a function of the distance from the center for the F-
doped multi-mode fiber after three thermal treatments. The profile of the Si-F stretching
peak coincides with that of the F concentration and does not change with increasing
treatment temperature, indeed, as already said, all the F atoms realize Si-F bonds in the
silica matrix, independently of the treatment. In contrast, the profile of the D2 band is
anticorrelated with the F content and by increasing the annealing temperature its area
decreases with a bigger reduction in the zone with a higher F concentration. This seems
to point out that, because of a treatment at temperature higher than 300C, the Si-F
bond is broken and the F links to the Si atom of another small membered ring.
Figure 6.13: Area of (a) the 945 cm−1 band due to the Si-F stretching mode and (b) the
D2 band ascribed to the breathing mode of the 3-membered rings, as a function of the
distance from the fiber center, in thermally treated F-doped multi-mode fibers. The black
points are associated with the fiber before any treatment, the others are referred to fibers
annealed at different temperatures: red–300C, green–550C, blue–750C.
To corroborate that the D2 band behavior depends on the F content and not on the
internal stress inside the fiber core, the D2 area profile was analyzed also in a pure-silica
core multi-mode fiber before and after the annealing at 750C: the D2 area does not de-
6.1 Fluorine doped fibers 117
pend on the radial position, within an error of 10%, nor before neither after the treatment,
which causes only a global reduction of 15%.
A very important parameter which controls the degree of the structural disorder in
silica glass is the fictive temperature, defined as the temperature at which the liquid
structure is frozen when cooling down through the glass transition [165], and often
coinciding with the long-lasting thermal treatment temperature. Shimodaira et al. [166]
demonstrated that, in silica bulk, the D1 and D2 bands intensities increase, independently
of the F concentration, with the increasing fictive temperature. Because of the 480 cm−1
band, which influences the main band around 400 cm−1, it is not possible to determine
the fictive temperature from its position in our F-doped samples. However, Martinet
et al. [167] studied the changes in the Raman distribution of the fictive temperature in
a pure silica cladding single-mode optical fiber and showed that in a pristine fiber the
fictive temperature, calculated from the main band position, increases going outwards
(from ∼1400C, near the core, to ∼1700C) and the D2 area increases with increasing
fictive temperature; moreover, a 66 h-long thermal treatment at 1100C decreases the
fictive temperature of all the cladding and also the D2 band area without no difference
along the fiber diameter. This lets us conclude that in absence of the fluorine the D2 band
area should increase with increasing distance from the center or it should be independent
of the distance. In our case the D2 band area decreases going outwards corroborating
that this effect is only due to the F content and not on the different stress along the fiber
diameter.
Comparison between F, D2 band and contents
It was shown that both D2 band area and NBOHC concentration are anticorrelated
with F content: the lower the F content, the higher is the D2 amplitude and the larger is
the radiation or drawing induced defect concentration. Since the OH content present in the
samples is low (∼0.2 ppm), the main NBOHC generation process is not the radiolysis of
≡Si-OH bonds but rather the cleavage of strained ≡Si-O-Si≡ bonds, which are related to
small membered rings. However, it can be deduced that these defects are not generated
by a one-to-one conversion of strained bonds [160]. Firstly, inside the fiber core, the
D2 band area varies by only 15%, while the NBOHC concentration decreases from the
maximum obtained in the fiber center by 80% in the irradiated sample and down to zero
(100%) in the pristine one. Secondly, if the NBOHC precursors were the strained bonds
of the 3-membered rings, both the concentration and the distribution of the radiation-
induced NBOHCs should change because of a pre-treatment at 750C. Fig. 6.14 displays
118 Chapter 6: Spectroscopic characterization
a reduction of the 1.9 eV PL intensity in the fiber core only by 20% thanks to the thermal
treatment performed before a X-ray irradiation up to 3 MGy dose, whereas the profile of
this band does not change with the exception of the pure-silica cladding, whose NBOHC
concentration increases because of the thermal treatment.
Figure 6.14: Profile of the 1.9 eV PL intensity emitted from the radiation induced
NBOHCs, after X-ray irradiation up to 3 MGy dose at RT, in two F-doped MM fibers:
one pristine and the other pre-annealed at 750C, before irradiation. The PL spectra were
performed on F-MMF2 with the CML setup, under excitation at 3.82 eV, using a 40×objective and a diaphragm diameter of 75 µm, for a spatial resolution of ∼5 µm.
6.1.5 Paramagnetic defects
Because of the limited UV range of the detector used to acquire the attenuation
spectra, these measurements allow us to determine the concentration of defects absorbing
only in the visible range, that are the NBOHCs. Another important technique that
can be used to obtain more information about the defects concentration is the electron
paramagnetic resonance that allows us to identify, nonetheless, only the paramagnetic
centers.
One of the most common paramagnetic intrinsic defects is the E: its typical first
harmonic EPR spectrum, characterized by axial symmetry, is recorded at RT using the
optimal parameters Pin = 8·10−4 mW and Hm = 0.1 G and it is shown in fig. 6.15(b). Also
a variant of the E center can be observed in EPR spectra but using other parameters,
Pin = 0.2 mW and Hm = 1 G (or 4 G in case of low defect concentration): it is the
H(I) defect, consisting of a dangling Si bond with one neighboring O substituted by a H
atom. The hyperfine interaction between the unpaired electron and the H nucleus, with
6.1 Fluorine doped fibers 119
spin of 1/2, originates the doublet of 74 G, shown in fig. 6.15(a). In contrast to these
centers, the oxygen-related defect signals are very large and they overlap, so they can not
be distinguished at RT: measurements at low temperature, 77 K (liquid nitrogen), are
needed to separate the two contributions. Fig. 6.16 displays an EPR spectrum recorded
at 77 K with Pin = 1 mW and Hm = 0.6 G and the reference signals of the NBOHC and
POR reported in literature [168] and which are used for the deconvolution. The spectrum
of fig. 6.16 shows also the E signal distorted because of the high used values of Pin and
Hm.
Figure 6.15: EPR first harmonic spectra in the F-doped multi-mode fiber γ-irradiated at
10 MGy. The part (a) was recorded with Pin = 0.2 mW (attenuation of 30 dB) and Hm =
1 G and shows the doublet of the H(I) center, whereas the part (b) was recorded with Pin =
8 · 10−4 mW (attenuation of 54 dB) and Hm = 0.1 G and shows the signal of the E center.
Before irradiation, the EPR spectra show only a very low signal associated with the
E center, as a consequence, the pristine samples are characterized by an E concentration
of about 1014 cm−3 whereas all the other defects, if present, have a concentration under
the detection limit.
Figures 6.17 and 6.18 report the calculated concentration values for the different
paramagnetic defects and they show that for all the defects:
• the concentration grows with both γ-dose and neutron fluence,
• more defects are created in the multi-mode fiber than in the single-mode one, under
the same conditions.
For the E center, the concentration reached at 10 MGy dose is about 1017 cm−3, three
order of magnitude higher than in the pristine samples.
120 Chapter 6: Spectroscopic characterization
Figure 6.16: (a) EPR first harmonic spectra in the F-doped multi-mode fiber γ-irradiated at
10 MGy, recorded at 77 K with Pin = 1 mW (attenuation of 23 dB) and Hm = 0.6 G. (b)-(c)
EPR spectrum associated with the NBOHC and the POR [168].
In fig. 6.19, we plot the concentration of the E defects as generated through primary
(γ-rays associated with the neutron tests) or secondary (indirect effect: 1 Gy for 3 ·1013 n/cm2) ionization processes by considering the total ionizing dose as sole generation
mechanism. In case displacement damages play mayor role in the defect generation,
the concentration for γ-rays and neutron irradiations should present very different total
ionizing dose dependence. This is clearly not the case, as only small differences in the dose
dependance can be observed, at the highest neutron fluence, maybe due to displacement
damages or to the different conditions between the two facilities used for the tests.
Once the concentration of defects, such as NBOHC and E, is known, the Smakula’s
equation (Eq. 4.6) can be used to calculate their absorption bands, whose positions and
width are reported in literature [169]. Fig. 6.20 compares the RIA curves of the F-doped
multi-mode fiber irradiated at 10 MGy: the measured spectrum with that obtained as a
sum of the bands associated with NBOHC and E defects.
This graph highlights that these centers cause an attenuation of about 5 · 103 dB/m at
5.8 eV (∼210 nm) and they can not be the origin of the UV tail observed in the measured
spectrum: this is likely caused by Cl-related centers, since two absorption bands at 3.8 eV
(FWHM of 0.67 eV) and at 3.05 eV (weaker than the first one) are associated with the
Cl2 molecules [137], a band at 2.98 eV is attributed to Cl−2 ions and another at 3.95 eV
to Cl atoms [170].
6.1 Fluorine doped fibers 121
E
(a)
(b)
H(I)
(c)
(d)
Figure 6.17: E and H(I) concentration as a function of (a,c) the γ-radiation dose and (b,d) the
neutron fluence, in the F-doped multi- (full circles) and single-mode (empty circles) fibers. In
the pristine fibers the H(I) doublet was not observed.
122 Chapter 6: Spectroscopic characterization
NBOHC
(a)
(b)
POR
(c)
(d)
Figure 6.18: NBOHC and POR concentration as a function of (a,c) the γ-radiation dose and
(b,d) the neutron fluence, in the F-doped multi- (full circles) and single-mode (empty circles)
fibers. With the neutron fluence of 1015 n/cm2, the oxygen-related defect concentrations are
under the detection limit, lower than 1015 cm−3.
6.1 Fluorine doped fibers 123
Figure 6.19: E concentration generated by γ-rays and neutrons only through ionization.
Figure 6.20: RIA spectrum of the F-doped multi-mode fiber irradiated at 10 MGy: measured
(continuous line) and calculated (dots) spectra. In the inset a zoom of the curves in the visible
region.
6.1.6 Conclusions
Before irradiation, the defect concentration is about 1014 cm−3 for the E centers and
even lower for the other defects, indeed it can not be determined because under detection
limit. Both irradiations, γ-rays and neutrons, produce in the fibers intrinsic defects, as
E, NBOHCs and PORs, whose concentration grows without saturating at the maximum
124 Chapter 6: Spectroscopic characterization
reached doses, γ-ray dose of 10 MGy or neutron fluence of 1017 n/cm2.
It can be observed that in silica bulk, reported in literature, the concentration of
the E centers induced by γ-radiation is much higher than that of the oxygen related
defects, because the main precursors are the impurities [171], whereas for the fibers the
concentrations of the E, NBOHC and POR defects are of the same order of magnitude.
Generally, it was observed that more defects are created in the multi-mode fibers
than in the single-mode one, under the same conditions. Only for the H(I) defect, its
concentration does not depend on the fiber type. The presence of this center could seem
singular, as the samples are not hydrogenated and the concentration of hydrogen inside
the fiber is low (for example, the initial OH concentration is about 4 · 1015 cm−3). It can
be generated from ≡Si-H bonds (whose presence can not be verified) or from the reaction
of an H atom with a two-fold-coordinated silicon center [169]:
= Si•• +H →= Si• − H (6.4)
The H atoms can come from the breakage of an O-H bond or from the acrylate coating,
in the case of the neutron irradiated samples [21,172]: hydrogen atoms are released from
the coating and diffuse in the fiber glass.
NBOHC and Fluorine
Several results, as the unchanging shape of the 2 eV absorption band with the radiation
dose or its correlation with the 1.9 eV photoluminescent band, point out that the NBOHC
is the only defect originating the asymmetric absorption around 2 eV. Moreover, their PL
band at 1.9 eV was studied in detail in fibers and the obtained results are reported in the
following.
• This PL red-shifts and broadens because of the radiation, whereas the thermal
treatment causes the opposite effects. The shift of the PL peak may reflect a change
in the defect environment induced by the radiation, whereas high temperatures
recover the pre-irradiation glass structure, as already explained for other defects,
like E, that presents the same behavior under radiation and annealing [173–175].
The band broadening with irradiation can be explained by an increasing disorder in
the surroundings of the NBOHCs [158].
• The decay of this PL can be described by a stretched exponential, exp(−(t/τ)β),
with τ = (11 ± 1) µs and β = 0.81 ± 0.07. The decay features remain unchanged
regardless the excitation energy, the irradiation or the thermal treatments; conse-
quently, the interaction between the defect and the environment does not affect the
lifetime.
6.1 Fluorine doped fibers 125
• This PL can be excited in the visible through an asymmetric band peaked at (1.95
± 0.02) eV with FWHM of (0.16 ± 0.02) eV, that does not change with radiation.
• The PL and PLE band shapes can be described by a Pekarian curve with similar
parameters; however, the OA band is wider than the PLE one, resulting in a
quantum yield dependent on the photon energy and suggesting that there are
absorbing NBOHCs with non-radiative emission.
The NBOHCs can be created by [7]:
• the radiolysis of ≡Si-OH bonds:
≡ Si-O-H→≡ Si-O• + H• (6.5)
• the cleavage of strained ≡Si-O-Si≡ bonds:
≡ Si-O-Si ≡→≡ Si-O• +• Si ≡ (6.6)
Since the OH content is low in our fibers, the most likely precursors of NBOHCs are
the strained bonds of small membered rings but the conversion process is not linear.
Moreover, the fluorine hinders the generation of NBOHCs: the higher the F content, the
lower the radiation or drawing induced NBOHC concentration; indeed, the increment of
F reduces the effective volume where NBOHCs are formed.
Finally, an annealing at temperature higher than 300C facilitates the fluorine to
modify the silica structure, for example by destroying strained bonds, but it does not
improve the fiber radiation-resistance.
126 Chapter 6: Spectroscopic characterization
6.2 Germanium doped fibers
This section deals with the γ-radiation effects on the Ge-doped fibers: the results
here reported were obtained on Ge-MMF and Ge-SMF, fibers doped with germanium and
fluorine.
6.2.1 RIA and its origin
Fig. 6.21 shows the RIA spectra of the multi- and single-mode Ge-doped fibers, after
a γ-radiation dose of 10 MGy: the curves, that coincide except for the UV region, show
the same trend of the F-doped fibers. However, the attenuation values are one order of
magnitude higher and the RIA curve minimum is at longer wavelength, around 1200 nm,
as observed by Regnier et al. in similar samples [151].
Figure 6.21: RIA spectra of the γ-irradiated Ge-doped multi- (black curve) and single-mode
(red curve) fibers at 10 MGy.
As for the F-doped fibers, the RIA increases with increasing irradiation dose, with the
exception of the UV component of the SM fiber that clearly decreases in fig. 6.22, whereas
it decreases with post-irradiation thermal treatments.
In the UV-visible range (fig. 6.23(a)), the absorption band around 620 nm is not
completely bleached because of the thermal treatment at 550C, after which a residual
attenuation of about 2 dB/m is still present at the wavelength of 620 nm. The UV tail
6.2 Germanium doped fibers 127
Figure 6.22: RIA spectra of the γ-irradiated Ge-doped (a) multi- and (b) single-mode fibers at
different doses.
residual value is higher, around 5 dB/m at the wavelength of 400 nm, but a further treat-
ment at 750C (curves not shown) does not improve the transmission. In the IR range
(fig. 6.23(b)), it is the annealing at 300C that causes the main change but only after the
treatment at 550C the RIA is reduced at 0 dB/m, within the error of the measurement.
The origin of the IR-band is still unknown: as for F-doped fibers, in literature it is
tentatively associated with STHs [151].
For the UV-Visible part of the RIA spectrum, a decomposition as a sum of Gaussians
has been realized. Starting from the three Gaussian bands used by Griscom for the
decomposition of the RIA curves of γ-irradiated Ge-doped silica fiber image guides and
associated with Ge(1), GeX and Ge-NBOHC defects [16], three Gaussian bands were
initially used to decompose the RIA spectra. However, the thermal treatment results
obliged us to add another band to obtain good fit. Fig. 6.24 shows the decomposition of
the RIA spectrum of the 10 MGy irradiated MM fiber; the spectral parameters obtained
from the fits are listed in table 6.31. In literature, the absorption band of the Ge-
NBOHC defects is simulated by a Gaussian band peaked at 1.97 eV (FWHM of ∼0.3 eV)
1The parameters of the Ge(1) band do not have an associated error, indeed they were fixed during
the fitting procedure, because only a tail of this band is shown in the RIA spectra and it is not possible
to determine its real peak position.
128 Chapter 6: Spectroscopic characterization
(a) Visible range
(b) IR range
Figure 6.23: All the spectra are referred to the 10 MGy irradiated Ge-doped multi-mode fiber:
(a1-b1) RIA spectrum obtained with the cut-back technique, (a2-b2) RIA changes induced by
the thermal treatments at 300C (red line) and 550C (blue line), (a3-b3) Residual RIA after
the thermal treatments, obtained as the sum of the curve reported in (a1-b1) and those in (a2-
b2). The effects of the thermal treatment at 750C are not shown, because it causes no further
change.
6.2 Germanium doped fibers 129
[15,16,176], however, with a view to the possibility to associate an asymmetric absorption
band with the NBOHCs in F-doped fibers (as demonstrated in section 6.1.1), the 2.11 eV
component, not present in literature, could be conceived as another contribution to the
absorption due to the Ge-NBOHCs or to both Si- and Ge-NBOHCs.
Figure 6.24: Decomposition into Gaussian bands of the RIA spectrum for the 10 MGy irradiated
Ge-doped fiber: measured spectrum (dots) and fitted curves (lines).
Band Assignment Position (eV) FWHM (eV)
1 Ge(1) 4.40 1.30
2 GeX 2.61 ± 0.08 0.96 ± 0.08
3NBOHC
2.11 ± 0.10 0.36 ± 0.07
4 1.94 ± 0.05 0.23 ± 0.08
Table 6.3: Spectral parameters of the bands used for the decomposition of all the OA spectra
recorded in Ge-doped irradiated fibers. The error accounts for half of the maximum deviation.
6.2.2 Spectroscopic characteristics of NBOHCs present in Ge-
doped fibers
The PL at 1.9 eV due to the Si-NBOHCs was widely studied in pristine and γ-
irradiated F-doped fibers (see section 6.1.2). In literature, a PL band having similar
characteristics to the Si-NBOHC, with peak position at 1.86 eV, FWHM of 0.16 eV and
decay constant of ∼5µs, was observed by Skuja et al. in γ-irradiated GeO2 samples and
associated with the Ge-NBOHCs [177]. As a consequence, in Ge-doped silica fibers it
130 Chapter 6: Spectroscopic characterization
is expected that both types of NBOHCs are induced by the fabrication process and the
radiation and contribute to the PL at ∼1.9 eV: the time-resolved PL is a very useful
technique to separate the two contributions.
Fig. 6.25 shows the decay kinetics of the PL intensity monitored at 1.9 eV and excited
at three different energies: 2.07 eV and 4.77 eV, that are the maxima of the visible and
UV excitation bands of the Si-NBOHC [154], and 3.44 eV, to make a comparison with
the results reported on the GeO2 bulk by Skuja et al. [177].
Figure 6.25: Semilog plot of the PL decay measured at 1.9 eV in the 10 MGy irradiated
Ge-doped multi-mode fiber, under three different excitations: squares–4.77 eV, circles–2.07 eV,
triangles–3.44 eV.
The decay is faster than in the F-doped fibers and the curves are best fitted by the
sum of two stretched exponentials, one to attribute to the Si-NBOHC and the other likely