100
Organized by With support of Other sponsors GCOS Science Conference ABSTRACTS
Organized by With support of
Other sponsors
GCOS Science Conference
ABSTRACTS
- 2 -
Table of Contents I. Overview: Day Schedules ................................................................................................... 8
II. Conference Objectives and Expected Outcomes ................................................................... 14
III. Abstracts and Posters ...................................................................................................... 15
A. Performance of the current climate observations .................................................................. 15
Session I : Scope and aims of the Conference – (Chairs: Han Dolman and Carolin Richter) .............. 15
Abstracts ............................................................................................................................ 15
1. Welcome speech from Han Dolman (VU University Amsterdam) ............................................. 15
2. Opening speech from Petteri Taalas, WMO Secretary-General ................................................ 15
3. Opening and aims of the conference; Stephen Briggs, Chairman, GCOS Steering Committee ...... 15
4. Focusing the Macroscope: Tracking the Earth System's Vital Signs – Keynote talk by Chris Rapley (University College London) .................................................................................................... 15
5. From the WCRP Climate Symposium 2014 to the GCOS Conference via the COP 21 – Keynote talk by Alain Ratier (EUMETSAT) .............................................................................................. 15
6. IPCC WG-I Findings and some new findings from cryospheric observation in Tibetan Plateau 21 – Keynote talk by Dahe Qin (CAS) .............................................................................................. 15
7. On the use of observations (UNFCCC/SBSTA) – Keynote talk by Carlos Fuller (SBSTA Chair) ...... 16
8. Status of the Global Observing System for Climate – Keynote talk by Adrian Simmons (European Centre for Medium-Range Weather Forecasts, Reading, UK) ........................................................ 16
9. Impact of the new Implementation Plan – Keynote talk by Alan Belward (JRC, EC) ................... 16
Posters ................................................................................................................................ 17
Poster Presenter: Alireza Moghaddam Nia – Performance Improvement of Support Vector Machine Technique for Monthly Rainfall Forecasting ................................................................................ 17
Poster Presenter: Okuku Ediang – Global Warming and the Linkage between Sea Surface Temperature Analysis along Coastline of Lagos, Nigeria ............................................................. 17
Poster Presenter: Nadine Gobron – JRC Copernicus Climate Change Service (C3S) F4P platform ....... 18
Session II : Successes of the current global observing system – (Chairs: Kenneth Holmlund and David Carlson) ...................................................................................................................... 19
Abstracts ............................................................................................................................ 19
1. ESA’s strategies and GCOS – Future Climate Observations Activities – Keynote talk by Volker Liebig (ESA/ESRIN) ............................................................................................................... 19
2. The ESA Climate Change Initiative: Exploiting satellite archives to respond to GCOS needs– Keynote talk by Pascal Lecomte (ESA/ESRIN) ............................................................................ 19
3. Climate at EUMETSAT – From Space-Based Measurements to Climate Data Records – Keynote talk by Jörg Schultz (EUMETSAT)h ........................................................................................... 20
4. The prospects and rationale for a global biogeochemical Argo system – Keynote talk by Ken Johnson (MBART) .................................................................................................................. 21
5. Global Terrestrial Network for Glaciers – from a research-based collaboration network towards an operational glacier monitoring service– Keynote talk by Michael Zemp (World Glacier Monitoring Service)hri ........................................................................................................................... 21
6. Coordination and Integration of Global Ocean Observing through JCOMM – Keynote talk by David Legler (NOAA) ...................................................................................................................... 21
7. Argo: past achievements, future risks and opportunities – Keynote talk by Toshio SUGA (Argo Steering Team) ..................................................................................................................... 22
- 3 -
8. CCl-based Sea Level ECV and GCOS Requirements – Anny Cazenave (LEGOS-CNES) ................ 22
9. Status of Surface Radiation Budget Observation for Climate – Nozomu Ohkawara (Japan Meteorological Agency, Tokyo, Japan) ...................................................................................... 23
10. WMO Global Atmosphere Watch Measurements of Greenhouse Gases: Quantifying the Main Driver of Climate Change – Edward Dlugokencky (NOAA ESRL GMD) ............................................ 23
11. Atmospheric ozone monitoring in the frame of WMO-Global Atmospheric Watch programme – Johanna Tamminen (Finnish Meteorological Institute) ................................................................. 24
12. Current Status of GOSAT and GOSAT-2 Projects – Ryoichi Imasu (University of Tokyo) ............. 25
13. Observation Systems in support of water-related Essential Climate Variables- The Global Terrestrial Network Hydrology – Wolfgang Grabs (German Federal Institute of Hydrology) ............... 25
Posters ................................................................................................................................ 27
Poster Presenter: Valerio Avitabile – Recent achievements on global forest biomass mapping and characterization of errors ........................................................................................................ 27
Poster Presenter: Michèle Barbier – Enhancement of autonomous ocean observation networks in the Atlantic Ocean ...................................................................................................................... 27
Poster Presenter: Luana Basso – Seasonality and inter-annual variability of CH4 fluxes from the eastern Amazon Basin inferred from atmospheric mole fraction profiles ......................................... 28
Poster Presenter: Luana Basso – A first Amazon CH4 budget based on atmospheric data ................. 28
Poster Presenter: Greg Bodeker – The GRUAN Implementation Plan and contributions to the GCOS Implementation Plan .............................................................................................................. 29
Poster Presenter: Michael Buchwitz – The Essential Climate Variable Greenhouse Gases as generated by the ESA project GHG-CCl.................................................................................................... 30
Poster Presenter: Ruud Dirksen – GRUAN: A reference data product for the Vaisala RS92 radiosonde 31
Poster Presenter: Ruud Dirksen – An overview of the GCOS Reference Upper-Air Network (GRUAN) .. 31
Poster Presenter: Emma Dodd – Towards a Combined Surface Temperature Dataset for the Arctic from the Along-Track Scanning Radiometers (ATSRs) ................................................................. 32
Poster Presenter: Fouad Gadouali – Evaluation of multiple satellite-derived rainfall products over Morocco ............................................................................................................................... 33
Poster Presenter: Carlos Garcia – The Brazilian Coastal Monitoring System (SiMCosta) for Climate Studies ................................................................................................................................ 33
Poster Presenter: Detlev Helmig – Reversal of Long-Term Trends in Ethane Identified from the Global Atmosphere Watch Reactive Gases Measurement Network .......................................................... 34
Poster Presenter: Viju John – A Fundamental Climate Data Record for Microwave Humidity Sounder Radiances ............................................................................................................................ 35
Poster Presenter: Suganth Kannan – Global observation system for earthquake data collection and its use in an Innovative Mathematical Model for Earthquake Prediction S. Kannan ............................... 35
Poster Presenter: Valeriy Khokhlov – Applicability of data on extreme temperatures for detection of regional climate change .......................................................................................................... 36
Poster Presenter: Varduhi Margaryan – The Dynamics Change of Average Annual Values of Air Temperature in Instrumental Period (On The Pattern of Mountainous Territory of the Republic of Armenia) .............................................................................................................................. 37
Poster Presenter: Patricia Miloslavich – Identifying priorities for global monitoring of marine biology and ecosystems .................................................................................................................... 38
Poster Presenter: Thomas Nagler – The International Snow Products Intercomparison and Evaluation Exercise - SnowPEx ............................................................................................................... 39
- 4 -
Poster Presenter: Toshiya Nakano – A long-term reference for detecting oceanic variations in the western North Pacific: JMA 50-year long 137°E repeat hydrographic section .................................. 40
Poster Presenter: Vishnu Rajendra Kumar – Understanding Regional Climatic Change with Glacier Terminus Fluctuations in Sikkim Himalaya, India ........................................................................ 40
Poster Presenter: Nick Rayner – A perspective on observing system needs for some aspects of climate science and services ................................................................................................... 41
Poster Presenter: John Remedios – Progress towards long-term land surface temperature datasets for climate studies ...................................................................................................................... 42
Poster Presenter: Vishwambhar Prasad Sati – Climate Change and its Implications: a Study on Perceptions, Adaption and Resilience in the Himalayan Region ..................................................... 43
Poster Presenter: Roger Saunders – The ESA Climate Modelling User Group’s assessment of satellite climate datasets .................................................................................................................... 43
Poster Presenter: Jinho Shin – Development of estimation method for essential climate variables using satellite data in South Korea ........................................................................................... 44
Poster Presenter: Bernadette Sloyan – Changes in Ocean Heat, Carbon Content and Ventilation: A review of the first decade of GO-SHIP global repeat hydrography ................................................. 45
Poster Presenter: Reiner Steinfeldt – Decadal Changes in the Storage of Anthropogenic Carbon in the Atlantic ................................................................................................................................ 46
Poster Presenter: Andreas Sterl – 15 years of Argo – the importance of observing the interior ocean . 46
Poster Presenter: Ad Stoffelen – Measuring atmosphere-ocean interaction ..................................... 47
Poster Presenter: Nandin-Erdene Tsendbazar – Spatial uncertainties and user-oriented data production for land cover ........................................................................................................ 47
Poster Presenter: Karin Veal – Relating trends in land surface-air temperature difference to soil moisture and evapotranspiration ............................................................................................. 48
Poster Presenter: Bert Wouters – Global land ice trends from satellite altimeter and gravity missions 48
B. Adequacy of the current global climate observations............................................................. 54
Session III: Relevance of the current ECVs to improve understanding of the global cycles of water, energy and carbon – (Chairs: Sybil Seitzinger, Toshio Suga, Bernadette Sloyan and Roger Pulwarty) 54
Abstracts ............................................................................................................................ 54
1. Observational constrains on the global carbon budget – Keynote talk by Corinne Le Quéré (Tyndall Centre University of East Anglia) ................................................................................. 54
2. Observations needed to advance understanding of the role of clouds in climate –Keynote talk by Sandrine Bony (LMD/IPSL) ..................................................................................................... 54
3. Roles of Air/Sea Exchange in the Cycles of Energy, Moisture and CO2 – Mark Bourassa (Florida State University) ................................................................................................................... 54
4. Measuring global forest biomass: current status and new developments – Shaun Quegan (University of Sheffield).......................................................................................................... 55
5. Essential Climate Variables in the Copernicus Global Land Service – Rosely Lacaze (HYGEOS) .... 55
6. Climate Monitoring from Space: The EUMETSAT Satellite Application Facility on Climate Monitoring – Martin Werscheck (DWD) ..................................................................................... 56
7. Optimized space collection of ECVs and threading ECVs back to MIT’s storied earth systems modeling efforts – Douglas Helmuth (Lockheed Martin-Space Systems Company Sunnyvale, Calif, United States) ...................................................................................................................... 57
8. A New Look at the Ocean Biogeochemistry ECVs – Toste Tanhua (GEOMAR Helmholtz Institute of Marine Research) .................................................................................................................. 57
- 5 -
9. The ESA Ocean Colour Climate Change Initiative (OC-CCI): meeting the Global Climate Observation System requirements for ocean colour data – Robert Brewin (Plymouth Marine Laboratory) .......................................................................................................................... 58
10. Fresh Water as an Essential Climate Variable in the Arctic Climate System – Dmitry Dukhovskoy (FSU)¨ ................................................................................................................................. 59
11. Upper tropospheric cloud systems from Satellite Observations : what can be achieved? A GEWEX perspective – Claudia Stubenrauch (CNRS/LMD) ........................................................................ 59
12. Comparing observations of fossil fuel-derived CO2 in California with predictions from bottom-up inventories – Heather Graven (Imperial College London) ............................................................. 60
Posters ............................................................................................................................... 61
Poster Presenter: Shawn Smith – Value of Automated Shipboard Weather Observations for Climate Studies - ICOADS Value-Added Database (IVAD) ....................................................................... 61
Poster Presenter: Masahisa Kubota – Intercomparison of various products of latent heat flux over the ocean .................................................................................................................................. 61
Poster Presenter: Bernadette Sloyan – GO-SHIP: An integrated physical, biogeochemical and biological ocean observing platform.......................................................................................... 62
Poster Presenter: Tianbao Zhao – Water Vapor Change from Radiosonde Observations and Reanalysis Products over China ............................................................................................................... 62
Poster Presenter: Gino Casassa – Water contribution of glaciers at an alpine basin in the central Andes of Chile and future projections ....................................................................................... 63
Session IV: User needs from diverse areas – (Chairs: Roger Pulwarty and Qingchen Chao) .............. 64
Abstracts ............................................................................................................................. 64
1. Soils and climate change: user needs for mitigation and adaptation – Keynote talk by Pete SMITH (Institute of Biological and Environmental Sciences, University of Aberdeen) ........................ 64
2. How much biology does the Global Climate Observing System need? – Keynote talk by Bob Scholes (GCSRI, South Africa) ................................................................................................. 64
3. Satellites for Climate Services - Case studies for Establishing an Architecture for Climate Monitoring from Space – Stephan Bojinski (WMO) ...................................................................... 65
4. Climate Service and Climate Observation in China – Qingchen Chao (Beijing Climate Center) ..... 65
5. Observations to support adaptation: Principles, scales and decision-making – Roger Pulwarty (NOAA) ................................................................................................................................ 66
6. Coordinating Global Land Cover Observations as Contribution to GCOS – Brice Mora (GOFC-GOLD Land Cover Office) ................................................................................................................. 66
7. Meteorological approaches to Earth Observation in relation to GCOS requirements – Christopher Merchant (University of Reading) ............................................................................................. 67
8. Data and meta-data exploration and data quality reporting for GCOS – Jared Lewis (Bodeker Scientific) ............................................................................................................................. 68
Posters ................................................................................................................................ 69
Poster Presenter: Okuku Ediang – Hazardous Wrecks Dynamics : An Overview in West Africa Coastal Areas................................................................................................................................... 69
Poster Presenter: Quentin Errera – Satellite Limb Sounders to Support the Stratosphere-troposphere Processes And Their Role in Climate (SPARC) community ............................................................ 69
Poster Presenter: Varduhi Margaryan – Problems Climate Change, Consequences Softening and Adaptation in the Republic of Armenia ...................................................................................... 70
Poster Presenter: Mikhaela Pletsch – Big, Open and Linked Data as a tool to real-time and history global climate observation at Monitoring Center of Essential Climate Variables ............................... 70
- 6 -
Poster Presenter: Nick Rayner – The EUSTACE project: combining different components of the observing system to deliver global, daily information on surface air temperature ............................ 71
Poster Presenter: Shawn Smith – ICOADS Value-Added Database (IVAD) ...................................... 72
Poster Presenter: Eric Vermote – Toward a Consistent Land Long Term Climate Data Records from Large Field of View Polar Orbiting Earth Observation Satellites ..................................................... 72
Poster Presenter: Christopher Merchant – Toward a Consistent Land Long Term Climate Data Records from Large Field of View Polar Orbiting Earth Observation Satellites .............................................. 73
C. Planning for future global climate observations .................................................................... 75
Session V: Future Observations and Communication of climate science – (Chairs: Pascal Lecomte, Michel Verstraete and Stephen Briggs) ..................................................................................... 75
Abstracts ............................................................................................................................. 75
1. Vital Signs for Managing Climate Change – Keynote talk by Charles Kennel (SCRIPPS Institution of Oceanography) .................................................................................................................. 75
2. Evolving Essential Climate Variables into Public-Private Partnerships for Societal Benefit – Keynote talk by Mike Tanner (NOAA) ........................................................................................ 76
3. Climate change impacts and mitigation processes – S. K. Sharma (Carman Residential and Day School) ................................................................................................................................ 76
4. Supporting activities to interdisciplinary global programmes as GCOS – Gueladio Cisse (ICSU) ... 77
5. Progress toward an Integrated Global Greenhouse Gas Information System (IG3IS) – Diane Stanitski (NOAA ESRL) ........................................................................................................... 77
6. The Copernicus Climate Change Service (C3S)- a European response to Climate Change ECMWF – Dick Dee (ECMWF) .............................................................................................................. 78
7. Planning and evaluating climate observing systems of the future – Elizabeth Weatherhead (University of Colorado Boulder, Boulder, Colorado, USA) ............................................................ 79
8. Space-based component of WMO Integrated Global Observing Systems (WIGOS) – Wenjian Zhang (WMO) ....................................................................................................................... 79
9. Integrating ocean observations across the coastal shelf boundary – Bernadette Sloyan (CSIRO) . 80
10. Ocean Heat Content – Keynote talk by Matthew Palmer (Met Office Hadley Centre) .................. 81
11. What are the needs for a post-COP21 monitoring? – Keynote talk by Philipe Cias (LSCE) ........... 81
12. The GEO Carbon Cycle and Greenhouse Gas Flagship – Antonio Bombelli (CMCC - Euro-Mediterranean Center on Climate Change) ................................................................................ 81
13. Essential Climate Variables to Support Climate Change Mitigation in the Land Use Sector – Martin Herold (Wageningen University) .............................................................................................. 82
14. First review of COP-21 and potential impacts on Space Agencies – Pascal Lecomte (Joint CEOS/CGMS WG Climate Chair - ESA) ...................................................................................... 83
15. The WCRP-FPA2 Polar Challenge- promoting a scalable, cost-effective and sustainable monitoring system – Michel Rixen (World Climate Research Programme, Geneva, Switzerland) ........................ 83
Posters ................................................................................................................................ 85
Poster Presenter: Andreas Becker – Towards climate robust high-resolution precipitation monitoring and re-analysis ..................................................................................................................... 85
Poster Presenter: Greg Bodeker – Stratosphere-troposphere Processes And their Role in Climate: Looking ahead ...................................................................................................................... 85
Poster Presenter: Mark Bourassa – A New Technique for Simultaneous Observations of Observations of Winds and Stress for Mesoscale and Larger Observations......................................................... 86
- 7 -
Poster Presenter: Nigel Fox – Enabling and demonstrating SI traceability of ECVs and climate data records ................................................................................................................................ 87
Poster Presenter: Nigel Fox – Traceable Radiometry Underpinning Terrestrial- and Helio- Studies (TRUTHS): Establishing a climate and calibration observatory in space .......................................... 88
Poster Presenter: Katherine Hill – A Tropical Pacific Observing System for 2020 and beyond (TPOS 2020) .................................................................................................................................. 88
Poster Presenter: Carlos Jimenez – Towards observation-based land evaporation data records: final results from the ESA WACMOS-ET project ................................................................................. 89
Poster Presenter: Carlos Jimenez – Land surface temperature retrieval from microwave observations: towards the production of a climate record ................................................................................ 90
Poster Presenter: Balasaheb Kulkarni – Climate change and people in state of Maharashtra ............. 91
Poster Presenter: Nathaniel Livesey – Atmospheric Limb Sounding: Accomplishments, the looming “gap”, and possibilities for filling it ........................................................................................... 91
Poster Presenter: Andrea Merlone – Metrology for climate observation .......................................... 92
Poster Presenter: Rosemary Nalubega – Community disaster risk management in Kotido district ...... 93
Poster Presenter: Matthew Palmer – The International Quality Controlled Ocean Database initiative (IQuOD): a community effort towards climate quality in situ observations ..................................... 94
Poster Presenter: Jelena Stamenkovic – Biomass and Soil Moisture Retrievals from Remote Sensing Data using Machine Learning Methods - Review ......................................................................... 94
Poster Presenter: Ad Stoffelen – Scatterometer-based ocean wind forcing fields ............................. 95
Poster Presenter: Peter Thorne – The GAIA-CLIM project: Making more optimal use of non-satellite data to characterise data from satellites ................................................................................... 95
Poster Presenter: Peter Thorne – System of systems approach to measurements: Formalising the reference-baseline-comprehensive networks concept: what, why, how? ........................................ 96
Poster Presenter: Michel Van Weele – Gaps Assessment and Impacts for atmospheric ECVs in the EU GAIA-CLIM project ................................................................................................................. 96
- 8 -
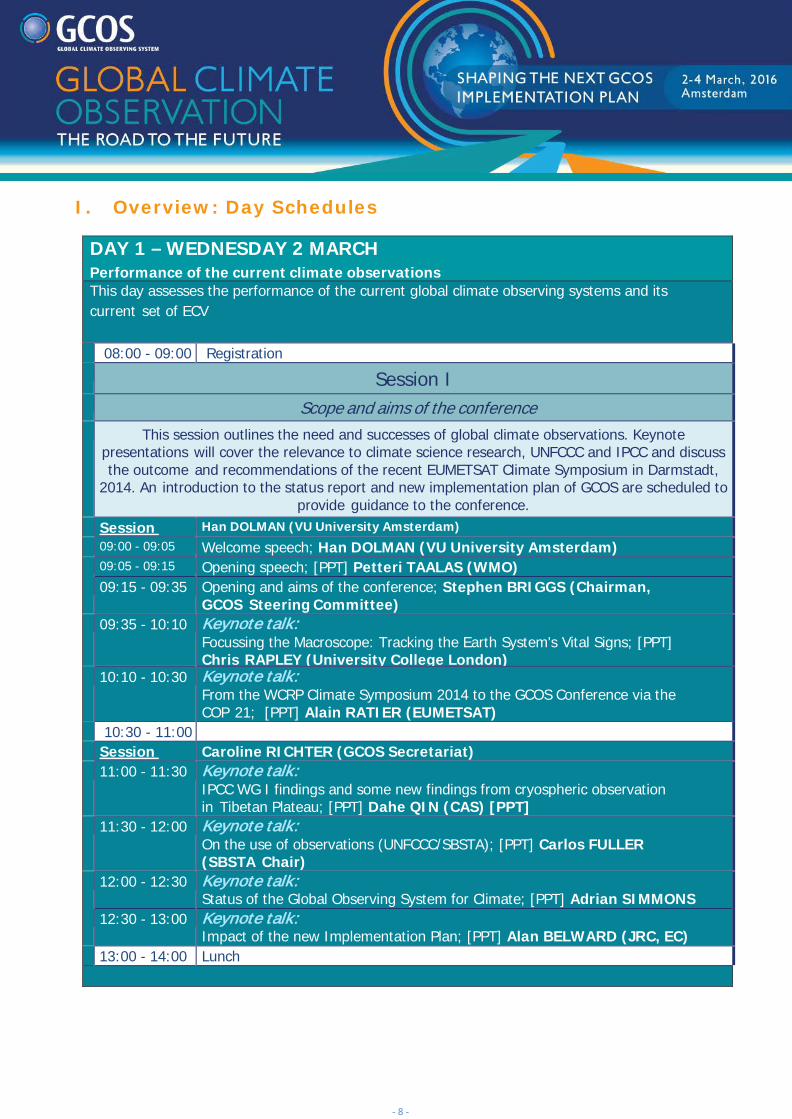
I. Overview: Day Schedules
DAY 1 – WEDNESDAY 2 MARCH Performance of the current climate observations This day assesses the performance of the current global climate observing systems and its current set of ECV
08:00 - 09:00 Registration Session I Scope and aims of the conference This session outlines the need and successes of global climate observations. Keynote
presentations will cover the relevance to climate science research, UNFCCC and IPCC and discuss the outcome and recommendations of the recent EUMETSAT Climate Symposium in Darmstadt,
2014. An introduction to the status report and new implementation plan of GCOS are scheduled to provide guidance to the conference.
Session
Han DOLMAN (VU University Amsterdam)
09:00 - 09:05 Welcome speech; Han DOLMAN (VU University Amsterdam) 09:05 - 09:15 Opening speech; [PPT] Petteri TAALAS (WMO) 09:15 - 09:35 Opening and aims of the conference; Stephen BRIGGS (Chairman,
GCOS Steering Committee) 09:35 - 10:10 Keynote talk:
Focussing the Macroscope: Tracking the Earth System's Vital Signs; [PPT] Chris RAPLEY (University College London)
10:10 - 10:30 Keynote talk: From the WCRP Climate Symposium 2014 to the GCOS Conference via the COP 21; [PPT] Alain RATIER (EUMETSAT)
10:30 - 11:00 Coffee break / Poster session Session
Caroline RICHTER (GCOS Secretariat)
11:00 - 11:30 Keynote talk: IPCC WG I findings and some new findings from cryospheric observation in Tibetan Plateau; [PPT] Dahe QIN (CAS) [PPT]
11:30 - 12:00 Keynote talk: On the use of observations (UNFCCC/SBSTA); [PPT] Carlos FULLER (SBSTA Chair)
12:00 - 12:30 Keynote talk: Status of the Global Observing System for Climate; [PPT] Adrian SIMMONS
12:30 - 13:00 Keynote talk: Impact of the new Implementation Plan; [PPT] Alan BELWARD (JRC, EC)
13:00 - 14:00 Lunch
- 9 -
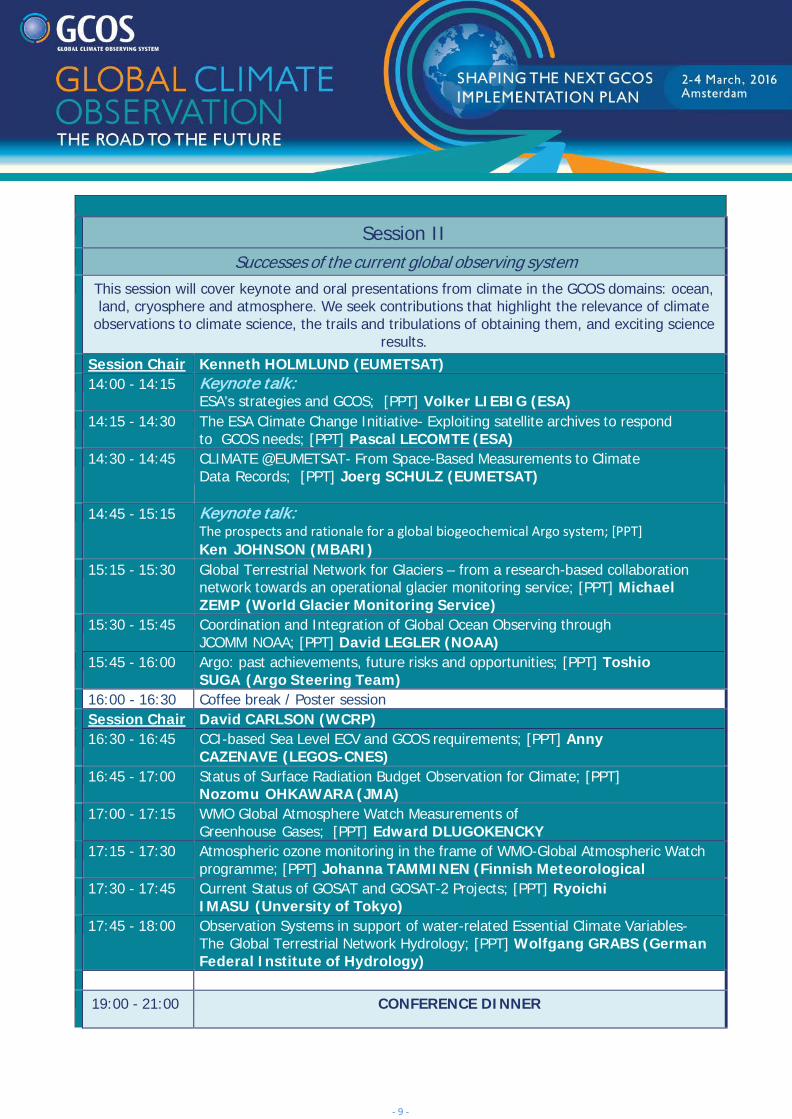
Session II Successes of the current global observing system This session will cover keynote and oral presentations from climate in the GCOS domains: ocean,
land, cryosphere and atmosphere. We seek contributions that highlight the relevance of climate observations to climate science, the trails and tribulations of obtaining them, and exciting science
results. Session Chair Kenneth HOLMLUND (EUMETSAT) 14:00 - 14:15 Keynote talk:
ESA's strategies and GCOS; [PPT] Volker LIEBIG (ESA) 14:15 - 14:30 The ESA Climate Change Initiative- Exploiting satellite archives to respond
to GCOS needs; [PPT] Pascal LECOMTE (ESA) 14:30 - 14:45 CLIMATE @EUMETSAT- From Space-Based Measurements to Climate
Data Records; [PPT] Joerg SCHULZ (EUMETSAT)
14:45 - 15:15 Keynote talk: The prospects and rationale for a global biogeochemical Argo system; [PPT] Ken JOHNSON (MBARI)
15:15 - 15:30 Global Terrestrial Network for Glaciers – from a research-based collaboration network towards an operational glacier monitoring service; [PPT] Michael ZEMP (World Glacier Monitoring Service)
15:30 - 15:45 Coordination and Integration of Global Ocean Observing through JCOMM NOAA; [PPT] David LEGLER (NOAA)
15:45 - 16:00 Argo: past achievements, future risks and opportunities; [PPT] Toshio SUGA (Argo Steering Team)
16:00 - 16:30 Coffee break / Poster session Session Chair David CARLSON (WCRP) 16:30 - 16:45 CCI-based Sea Level ECV and GCOS requirements; [PPT] Anny
CAZENAVE (LEGOS-CNES) 16:45 - 17:00 Status of Surface Radiation Budget Observation for Climate; [PPT]
Nozomu OHKAWARA (JMA) 17:00 - 17:15 WMO Global Atmosphere Watch Measurements of
Greenhouse Gases; [PPT] Edward DLUGOKENCKY 17:15 - 17:30 Atmospheric ozone monitoring in the frame of WMO-Global Atmospheric Watch
programme; [PPT] Johanna TAMMINEN (Finnish Meteorological 17:30 - 17:45 Current Status of GOSAT and GOSAT-2 Projects; [PPT] Ryoichi
IMASU (Unversity of Tokyo) 17:45 - 18:00 Observation Systems in support of water-related Essential Climate Variables-
The Global Terrestrial Network Hydrology; [PPT] Wolfgang GRABS (German Federal Institute of Hydrology)
19:00 - 21:00 CONFERENCE DINNER
- 10 -
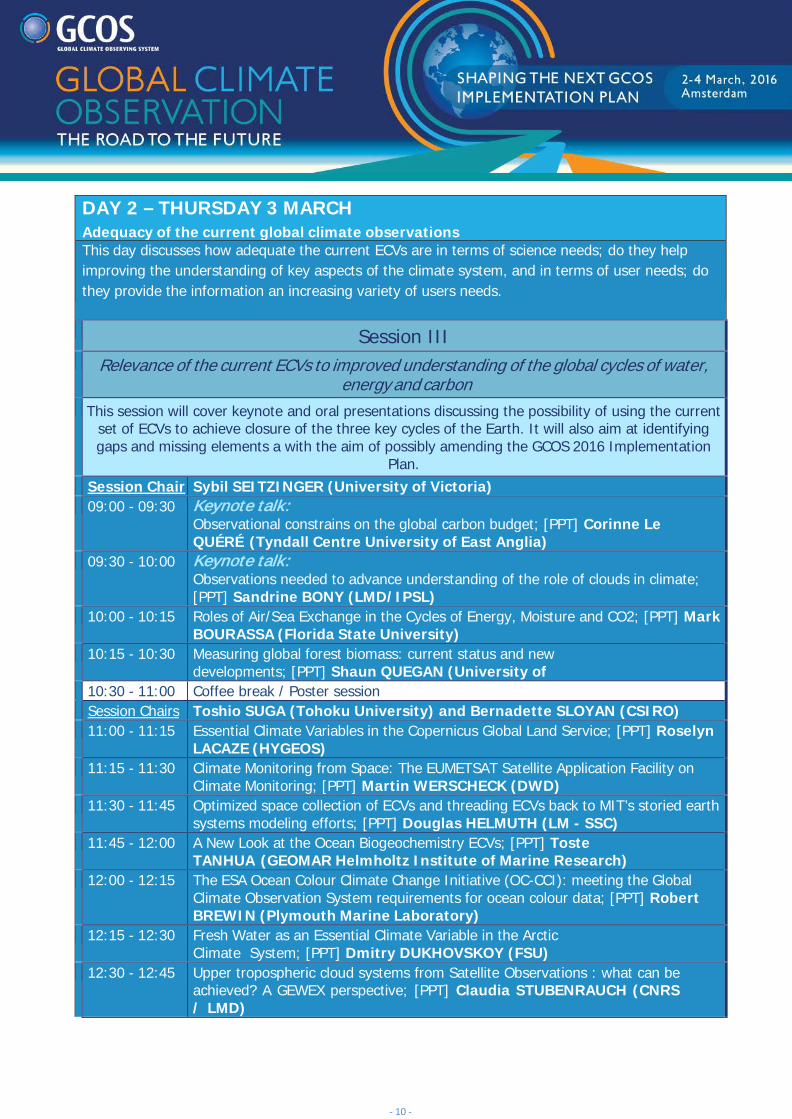
DAY 2 – THURSDAY 3 MARCH Adequacy of the current global climate observations This day discusses how adequate the current ECVs are in terms of science needs; do they help improving the understanding of key aspects of the climate system, and in terms of user needs; do they provide the information an increasing variety of users needs.
Session III Relevance of the current ECVs to improved understanding of the global cycles of water,
energy and carbon This session will cover keynote and oral presentations discussing the possibility of using the current
set of ECVs to achieve closure of the three key cycles of the Earth. It will also aim at identifying gaps and missing elements a with the aim of possibly amending the GCOS 2016 Implementation
Plan. Session Chair Sybil SEITZINGER (University of Victoria) 09:00 - 09:30 Keynote talk:
Observational constrains on the global carbon budget; [PPT] Corinne Le QUÉRÉ (Tyndall Centre University of East Anglia)
09:30 - 10:00 Keynote talk: Observations needed to advance understanding of the role of clouds in climate; [PPT] Sandrine BONY (LMD/IPSL)
10:00 - 10:15 Roles of Air/Sea Exchange in the Cycles of Energy, Moisture and CO2; [PPT] Mark BOURASSA (Florida State University)
10:15 - 10:30 Measuring global forest biomass: current status and new developments; [PPT] Shaun QUEGAN (University of
10:30 - 11:00 Coffee break / Poster session Session Chairs Toshio SUGA (Tohoku University) and Bernadette SLOYAN (CSIRO) 11:00 - 11:15 Essential Climate Variables in the Copernicus Global Land Service; [PPT] Roselyn
LACAZE (HYGEOS) 11:15 - 11:30 Climate Monitoring from Space: The EUMETSAT Satellite Application Facility on
Climate Monitoring; [PPT] Martin WERSCHECK (DWD) 11:30 - 11:45 Optimized space collection of ECVs and threading ECVs back to MIT’s storied earth
systems modeling efforts; [PPT] Douglas HELMUTH (LM - SSC) 11:45 - 12:00 A New Look at the Ocean Biogeochemistry ECVs; [PPT] Toste
TANHUA (GEOMAR Helmholtz Institute of Marine Research) 12:00 - 12:15 The ESA Ocean Colour Climate Change Initiative (OC-CCI): meeting the Global
Climate Observation System requirements for ocean colour data; [PPT] Robert BREWIN (Plymouth Marine Laboratory)
12:15 - 12:30 Fresh Water as an Essential Climate Variable in the Arctic Climate System; [PPT] Dmitry DUKHOVSKOY (FSU)
12:30 - 12:45 Upper tropospheric cloud systems from Satellite Observations : what can be achieved? A GEWEX perspective; [PPT] Claudia STUBENRAUCH (CNRS / LMD)
- 11 -
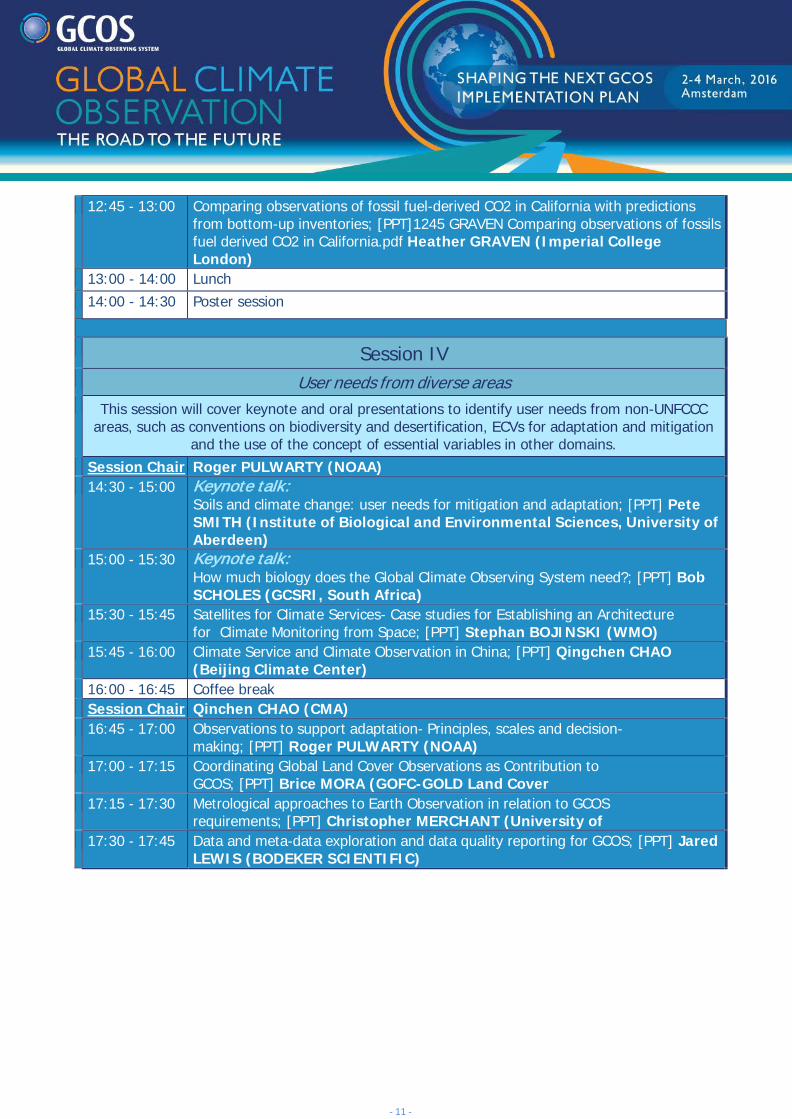
12:45 - 13:00 Comparing observations of fossil fuel-derived CO2 in California with predictions from bottom-up inventories; [PPT]1245 GRAVEN Comparing observations of fossils fuel derived CO2 in California.pdf Heather GRAVEN (Imperial College London)
13:00 - 14:00 Lunch 14:00 - 14:30 Poster session
Session IV User needs from diverse areas This session will cover keynote and oral presentations to identify user needs from non-UNFCCC
areas, such as conventions on biodiversity and desertification, ECVs for adaptation and mitigation and the use of the concept of essential variables in other domains.
Session Chair Roger PULWARTY (NOAA) 14:30 - 15:00 Keynote talk:
Soils and climate change: user needs for mitigation and adaptation; [PPT] Pete SMITH (Institute of Biological and Environmental Sciences, University of Aberdeen)
15:00 - 15:30 Keynote talk: How much biology does the Global Climate Observing System need?; [PPT] Bob SCHOLES (GCSRI, South Africa)
15:30 - 15:45 Satellites for Climate Services- Case studies for Establishing an Architecture for Climate Monitoring from Space; [PPT] Stephan BOJINSKI (WMO)
15:45 - 16:00 Climate Service and Climate Observation in China; [PPT] Qingchen CHAO (Beijing Climate Center)
16:00 - 16:45 Coffee break Session Chair Qinchen CHAO (CMA) 16:45 - 17:00 Observations to support adaptation- Principles, scales and decision-
making; [PPT] Roger PULWARTY (NOAA) 17:00 - 17:15 Coordinating Global Land Cover Observations as Contribution to
GCOS; [PPT] Brice MORA (GOFC-GOLD Land Cover 17:15 - 17:30 Metrological approaches to Earth Observation in relation to GCOS
requirements; [PPT] Christopher MERCHANT (University of 17:30 - 17:45 Data and meta-data exploration and data quality reporting for GCOS; [PPT] Jared
LEWIS (BODEKER SCIENTIFIC)
- 12 -
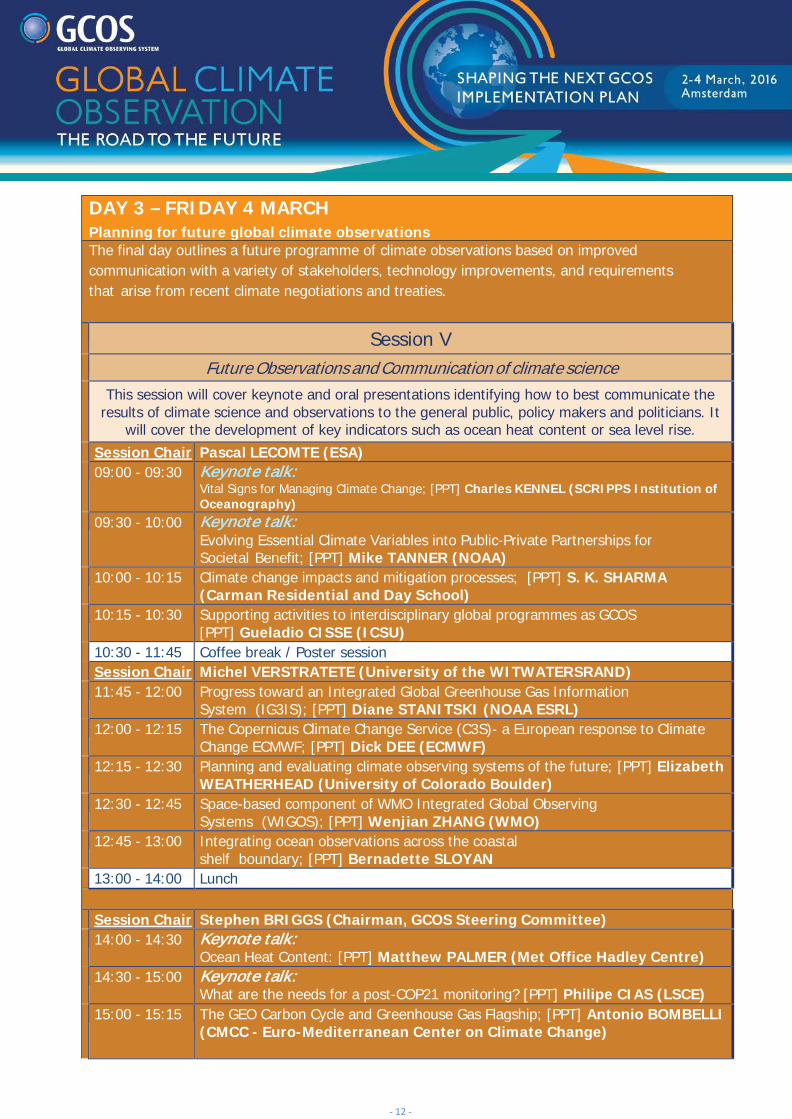
DAY 3 – FRIDAY 4 MARCH Planning for future global climate observations The final day outlines a future programme of climate observations based on improved communication with a variety of stakeholders, technology improvements, and requirements that arise from recent climate negotiations and treaties.
Session V Future Observations and Communication of climate science This session will cover keynote and oral presentations identifying how to best communicate the
results of climate science and observations to the general public, policy makers and politicians. It will cover the development of key indicators such as ocean heat content or sea level rise.
Session Chair Pascal LECOMTE (ESA) 09:00 - 09:30 Keynote talk:
Vital Signs for Managing Climate Change; [PPT] Charles KENNEL (SCRIPPS Institution of Oceanography)
09:30 - 10:00 Keynote talk: Evolving Essential Climate Variables into Public-Private Partnerships for Societal Benefit; [PPT] Mike TANNER (NOAA)
10:00 - 10:15 Climate change impacts and mitigation processes; [PPT] S. K. SHARMA (Carman Residential and Day School)
10:15 - 10:30 Supporting activities to interdisciplinary global programmes as GCOS [PPT] Gueladio CISSE (ICSU)
10:30 - 11:45 Coffee break / Poster session Session Chair Michel VERSTRATETE (University of the WITWATERSRAND) 11:45 - 12:00 Progress toward an Integrated Global Greenhouse Gas Information
System (IG3IS); [PPT] Diane STANITSKI (NOAA ESRL) 12:00 - 12:15 The Copernicus Climate Change Service (C3S)- a European response to Climate
Change ECMWF; [PPT] Dick DEE (ECMWF) 12:15 - 12:30 Planning and evaluating climate observing systems of the future; [PPT] Elizabeth
WEATHERHEAD (University of Colorado Boulder) 12:30 - 12:45 Space-based component of WMO Integrated Global Observing
Systems (WIGOS); [PPT] Wenjian ZHANG (WMO) 12:45 - 13:00 Integrating ocean observations across the coastal
shelf boundary; [PPT] Bernadette SLOYAN 13:00 - 14:00 Lunch
Session Chair Stephen BRIGGS (Chairman, GCOS Steering Committee) 14:00 - 14:30 Keynote talk:
Ocean Heat Content: [PPT] Matthew PALMER (Met Office Hadley Centre) 14:30 - 15:00 Keynote talk:
What are the needs for a post-COP21 monitoring? [PPT] Philipe CIAS (LSCE) 15:00 - 15:15 The GEO Carbon Cycle and Greenhouse Gas Flagship; [PPT] Antonio BOMBELLI
(CMCC - Euro-Mediterranean Center on Climate Change)
- 13 -
15:15 - 15:30 Essential Climate Variables to Support Climate Change Mitigation in the Land Use Sector; [PPT] Martin HEROLD (Wageningen University)
15:30 - 15:45 First review of COP-21 and potential impacts on Space Agencies; [PPT] Pascal LECOMTE (ESA)
15:45 - 16:00 The WCRP-FPA2 Polar Challenge- promoting a scalable, cost-effective and sustainable monitoring system; [PPT] Micheal RIXEN (WCRP)
16:00 - 16:30 Discussion and conclusion session Finish
- 14 -
II. Conference Objectives and Expected Outcomes Making further progress towards a fully implemented, sustainable, global observing system for climate is crucial for improving understanding of the workings of the climate system and assessing its impacts. The conference aims to provide the forum for: 1. A community assessment of the quality of the current observing system. We aim to
highlight key achievements in producing ECVs in the domains of GCOS: atmosphere, ocean and land and identify gaps;
2. A discussion on how the definition of ECVs contributes to understanding the key Earth
System cycles of energy, water and carbon. While GCOS expects the list of ECVs to be stable as it is used as the basis for planning (e.g. by satellite agencies) it needs to be re-considered periodically to ensure it still meets the needs of users;
3. Identifying future needs in relation to adaptation and mitigation requirements and other
conventions such as desertification, biodiversity and the SDG goals. An increasing focus on adaption and mitigation of climate change puts different demands on observing systems;
4. New developments, arising from requirements coming out of COP 21, and developments in
technology, IT and communication of climate issues with the general public and policy makers.
The main expected outcome should be a list of priorities and actions, some of which may be included in a new GCOS Implementation Plan. Key outcomes should be an assessment of the quality of the current observing system and potential for future actions and developments, including adaptation, mitigation and communication.
- 15 -
III. Abstracts and Posters
A. Performance of the current climate observations This day assesses the performance of the current global climate observing systems and its current set of ECVs.
Session I : Scope and aims of the Conference – (Chairs: Han Dolman and Carolin Richter)
This session outlines the need and successes of global climate observations. Keynote presentations will cover the relevance to climate science research, UNFCCC and IPCC and discuss the outcome and recommendations of the recent EUMETSAT Climate Symposium in Darmstadt, 2014. An introduction to the status report and new implementation plan of GCOS are scheduled to provide guidance to the conference.
Abstracts
1. Welcome speech from Han Dolman (VU University Amsterdam)
2. Opening speech from Petteri Taalas, WMO Secretary-General
3. Opening and aims of the conference; Stephen Briggs, Chairman, GCOS Steering Committee
4. Focusing the Macroscope: Tracking the Earth System's Vital Signs – Keynote talk by Chris Rapley (University College London)h
is RAPL The COP 21 agreement in Paris committed 195 nations to reducing their carbon emissions to limit global warming to well below 2degC, and to achieve ’net zero' carbon dioxide emissions in the latter part of this Century. Progress will be reviewed every five years starting in 2020. In the meantime, the signals of the climate change already under way are emerging ever more strongly from the noise of natural variability. The climate science community is thus confronted with several challenges. Firstly, given that the Earth is the most complex system we know of, there remains much to be done to understand its it functioning. This is especially the case whilst the planet transitions into new and previously unexplored operating states, with the possibility new modes of operation developing. Secondly, the community will need to identify the planet’s ‘vital signs’ , much like a medical patient, and to monitor their evolving trajectories, both as a fundamental measure of planetary ‘health’, but specifically to inform the 5 yearly review cycle of the COP. Thirdly, the community need to develop and exploit indicators of climate-change-related risks to human prosperity and wellbeing. To achieve these ends, a comprehensive, carefully targeted, reliable and appropriately sensitive operational observing system will be required. This the Global Climate Observing System needs to provide.
5. From the WCRP Climate Symposium 2014 to the GCOS Conference via the COP 21 – Keynote talk by Alain Ratier (EUMETSAT)
6. IPCC WG-I Findings and some new findings from cryospheric observation in Tibetan Plateau 21 – Keynote talk by Dahe Qin (CAS)
- 16 -
7. On the use of observations (UNFCCC/SBSTA) – Keynote talk by Carlos Fuller (SBSTA Chair)
8. Status of the Global Observing System for Climate – Keynote talk by Adrian Simmons (European Centre for Medium-Range Weather Forecasts, Reading, UK)
In October 2015, the GCOS programme published a report on the Status of the Global Observing System for Climate. The report presents an extensive account of how well climate is currently being observed, where progress has been made, and where progress is lacking or deterioration has occurred. Actions required to address the findings of the report are being formulated in preparing a new Implementation Plan for the Global Observing System for Climate, which will be published later in 2016 to succeed the current plan published in 2010. The report starts with introductory discussion covering the needs for and nature of sustained observation of the climate system, the internationally coordinated arrangements under which observations are made and processed, and the concept of the Essential Climate Variables (ECVs) that provides the organizational framework for the report. The report then systematically reviews overarching and cross-cutting topics. This is followed by reviews of observing networks and the observational status of each ECV. These reviews are provided separately for atmosphere, ocean and land. The report analyses data holdings and monitoring information provided by a number of international data centres and presents examples of observational data and derived global data products in the forms of time series and maps. Discussion is linked in an ordered manner to assessments of the progress on actions from the 2010 Implementation Plan. Preparation of the report drew on published material that included the IPCC’s Fifth Assessment Report, recent peer-reviewed scientific papers, workshop proceedings and observing-system manuals and guides. It relied on the expert judgement of contributors and a public review process. The presentation will summarize the report and highlight a number of its key findings.
9. Impact of the new Implementation Plan – Keynote talk by Alan Belward (JRC, EC)
- 17 -
Posters
Poster Presenter: Alireza Moghaddam Nia – Performance Improvement of Support Vector Machine Technique for Monthly Rainfall Forecasting Moslem Borji1, Alireza Moghaddam Nia2, Dawei Han3
1. MSc. Student of Watershed Management Engineering, Faculty of Natural Resources, University of Tehran, Karaj, Iran 2. Associate Professor of Hydrology, Faculty of Natural Resources, University of Tehran, Karaj, Iran 3. Professor of Civil Engineering, Faculty of Engineering, University of Bristol, Bristol, UK
Achievement of reliable and accurate forecasts of precipitation is one of today's challenging issues in water resources planning and management, and climate hazards mitigation. Even though a great amount of research has been conducted on application of data-driven techniques for hydro-climatic forecasting, but selecting best combination of inputs to such models is yet controversial among the community of modellers. The main objective of this study is to improve the performance of support vector machine (SVM) nonlinear model by Gamma Test (GT) and correlation analysis (CA) in forecasting monthly precipitation. For this purpose, Monthly climatic time series of Shiraz synoptic station, located in Fars province of Iran were employed during a 28-year period, 1983-2011, as a case study. The obtained results indicate that the coupled Gamma Test-Support Vector Machine (GT-SVM) model is able to provide more accurate forecasts of monthly rainfall compared to pure SVM model and also the coupled correlation analysis-Support Vector Machine (CA-SVM) model. The GT-SVM model yields R2=0.94 and RMSE=2 mm compared to (CA-SVM) model with R2=0.86 and RMSE=2.97 mm. To further improve the SVM model performance, using robustness of Gamma Test is proposed as one of the non-linear modelling tools. Keywords: rainfall forecasting, support vector machine, Gamma test, model inputs selection, Shiraz synoptic station, Iran.
Poster Presenter: Okuku Ediang – Global Warming and the Linkage between Sea Surface Temperature Analysis along Coastline of Lagos, Nigeria O.A. Ediang1, A.A. Ediang2 1. Marine Division, Nigerian Meteorological Agency, EKET, Nigeria - Email: [email protected] 2. The Nigerian Maritime Administration and Safety Agency, Apapa, Lagos,Nigeria - Email: [email protected]
Marine weather observers have since 1988 been making sea surface temperature observations at East mole station, about 2 kilometers from the Coast. The station uses the rubber sea – temperature bucket thermometer and makes observations on hourly basis, sea surface temperature has influence on Lagos coastal weather and it is important especially for coastal fishermen, offshore oil and gas industries, shipping vessels, coastal recreational and port handling facilities. Some evidences of global warming in Nigeria have been observed using sea surface temperature (SST) for the period of 1989 – 2007 which statistically analyzed, results shows that the Nigerian coastal waters is warmest in April and Coldest in August. The period 1989-2007 and 1993-2010, 2010-2014 mean yearly data of sea surface temperature (SST) show some of the Teleconnections with global warming. The attempt in this paper is however to highlight the features of sea surface temperature over the Lagos coastal waters. Indicating the global warming is evident in the environment of Nigeria Coastal line ,Since the Sea Surface Temperature(SST) graph plotted shows that the Temperatures for the past two decades are really changing.
- 18 -
Poster Presenter: Nadine Gobron – JRC Copernicus Climate Change Service (C3S) F4P platform N. Gobron, J. Adams, F. Cappucci, C. Lanconelli, O. Morgan, B. Mota, and M. Robustelli European Commission - Joint Research Centre - Institute for Environment and Sustainability - Land Resource Management Unit, Ispra, Italy
This paper presents the Climate Change Copernicus Service (C3S) fitness-for-purpose (F4P) platform which is actually developed at the JRC. This platform aims at monitoring several Earth Observation (EO) land Essential Climate Variables (ECVs) accuracies by assessing their compliance against GCOS criteria. One component uses a quality 3-D radiative transfer modelled-based approach for assessing 1) the ground-based measurements protocols traditionally used to validate EO products and 2) several space retrieval algorithms. In the second module, we propose an automatic review of their quality at global and regional scale and present new metrics, such as the Gamma Index, to check GCOS criteria compliance, including the stability assessment.
- 19 -
Session II : Successes of the current global observing system – (Chairs: Kenneth Holmlund and David Carlson)
This session will cover keynote and oral presentations from climate in the GCOS domains: ocean, land, cryosphere and atmosphere. We seek contributions that highlight the relevance of climate observations to climate science, the trails and tribulations of obtaining them, and exciting science results.
Abstracts
1. ESA’s strategies and GCOS – Future Climate Observations Activities – Keynote talk by Volker Liebig (ESA/ESRIN)
Following the successful COP 21 conference in Paris ESA is analysing the new requirements emerging from the final declaration and how space based Earth observation can contribute to fulfil them. ESA will propose to its Member States an extension of the Climate Change Initiative (CCI) at its Ministerial Council end 2016. The European Commission and ESA have studied future Carbon Monitoring Systems and an operational system is under discussion. Another element is to intensify the implementation of the UN REDD+ effort through the Global Forest Observation Initiative (GFOI). Other concrete activities in support of developing countries and more general in implementing the Climate Treaty are studied. An important element of future observation systems is to have a long term continuity of all climate relevant variables. The operational European Copernicus system will have 7 satellites in orbit by end 2017 and atmospheric instruments will be added around 2020, followed later by the altimetry missions to ensure long term observations. Additional elements are necessary to secure data continuity like the operational continuation of measurements of sea ice thickness and monitoring changes in the ice sheets that blanket Greenland and Antarctica.
2. The ESA Climate Change Initiative: Exploiting satellite archives to respond to GCOS needs– Keynote talk by Pascal Lecomte (ESA/ESRIN) P. Lecomte, S. Plummer, S. Pinnock, C. Downy, E. Pechorro, A. M. Trofaier and A. Stefaniak ESA Climate Office, European Space Agency, ECSAT, Fermi Avenue, Harwell Campus, Oxford, UK
Lack of understanding of many components of the Earth system limit our ability to assess what the impacts and consequences are of a change in climate. A key reason for this lack of understanding is limited global observations. To address this gap in information requires an integrated observing system comprising longterm, carefully calibrated and documented data sets of the Earth system from satellites and in situ observations complemented by numerical models to capture, understand and predict variations and trends in both space and time. As a contribution to needs expressed by both the IPCC and GCOS, the European Space Agency initiated the Climate Change Initiative to exploit the long-term global Earth Observation archives that ESA has established over the last thirty years, in preparation for the Sentinel series of satellites. Since 2010 the CCI programme has contributed to a rapidly expanding body of scientific knowledge on 13 ECVs, demonstrating new insights in climate research. Examples include instrumental contributions to the Randolph Glacier Inventory, the first globally complete inventory of glaciers, the Ice Sheet Mass Balance Intercomparison Exercise (IMBIE), which produced a reconciled estimate of ice sheet mass balance changes in Antarctica and Greenland, and their contribution to sea level rise, improved Global Mean Sea Level estimates
- 20 -
using Envisat data and Sea Surface Temperature and aerosols from (A)ATSR. In addition a major effort has been dedicated to unifying research teams to address ECV needs, providing an interface between the different domains: atmosphere, land, ocean and cryosphere and encouraging the interaction between the satellite teams and the wider climate research community. The CCI products are available through the CCI Open Data Portal and the intention is that the processing systems are transferred from CCI to operational programmes, such as Europe’s Copernicus Climate Change Service (C3S). While these developments represent a significant contribution to GCOS there is a pressing need to ensure the complete portfolio of high quality observational data sets are developed. Thus ESA is planning an extension of the CCI programme, CCI+, This will focus on ECVs that could not be included at the start of the CCI programme. An additional aim is to ensure that, for ECVs already included in CCI, all parameters required by GCOS are provided, GCOS requirements are met to the maximum feasible extent and all available missions contribute to the ECV data record.
3. Climate at EUMETSAT – From Space-Based Measurements to Climate Data Records – Keynote talk by Jörg Schultz (EUMETSAT)h Jörg Schulz, Rob Roebeling, Marie Doutriaux-Boucher, Viju John, Alessio Lattanzio, Frank Rüthrich, Arndt Meier, Andrey Bogdanov, Julia Figa, Craig Andersson, Axel Von Engeln, Christian Marquardt, Tim Hewison
The use of satellite data for assessing the status of past climate is still in its early stages. Satellite data became only available in the mid-1960s from some experimental research missions and first operational missions such as the fleet of geostationary satellites and also satellites in polar orbit were built for the purpose of monitoring and forecasting the weather. These data can well support environmental monitoring applications, however, it is recognised, that higher level applications such as climate variability and change analysis require well calibrated observations and long-term homogeneity of long time series. Satellite data of such kind are referred to as Climate Data Records (CDR) and are generated through careful recalibration and reprocessing activities. EUMETSAT addresses climate monitoring employing its historical and current operational satellite systems and in the planning of future satellite systems. The work involves specific scientific and technical efforts for the re-calibration of historical data and the extraction of climate data records. In particular, the scientific analysis of raw satellite data leading to the characterisation of uncertainties of the measurements, the identification and corrections of artefacts, as well as improved calibration of individual instruments and inter-calibration of several satellite instruments in a time series is fundamental to serve the generation of physically consistent data records of geophysical variables by reanalysis or the application of retrieval methods. Once the re-calibration process has been completed, instrument measurements can be reprocessed to extract basic physical parameters (e.g., reflectance, radiance, radar backscatter) and to produce long-time series known as Fundamental Climate Data Records (FCDR). These present the material from which geophysical parameters, e.g., GCOS Essential Climate Variables (ECVs) can be extracted. Production and continuous improvement of FCDRs are therefore a top priority for EUMETSAT. This demands in-depth understanding of instruments, revising calibration and characterisation data, algorithm research and complex techniques to determine uncertainty of the data. This presentation will demonstrate EUMETSAT's recent advances and prospects for providing useful satellite-based climate data records for major applications in climate science and services.
- 21 -
4. The prospects and rationale for a global biogeochemical Argo system – Keynote talk by Ken Johnson (MBART)h
5. Global Terrestrial Network for Glaciers – from a research-based collaboration network towards an operational glacier monitoring service– Keynote talk by Michael Zemp (World Glacier Monitoring Service)hri M. Zemp1, B.H. Raup3,4, F. Paul1,5, S.U. Nussbaumer1, N. Mölg1, H. Machguth1, M. Hoelzle2, I. Gärtner-Roer1, F. Fetterer3, R. Armstrong3
1. World Glacier Monitoring Service (WGMS), University of Zurich, Zurich, Switzerland 2. World Glacier Monitoring Service (WGMS), University of Fribourg, Fribourg, Switzerland 3. US National Snow and Ice Data Center (NSIDC), Boulder, USA 4. Global Land Ice Measurements from Space (GLIMS) initiative, Boulder, USA 5. Global Land Ice Measurements from Space (GLIMS) initiative, University of Zurich, Switzerland
Glaciers have been internationally recognized as an Essential Climate Variable. Their decline over the past century is not only a high-confidence indicator for climate changes but directly impacts on the local hazard situation, the regional water cycle, and global sea-level rise. The international coordination of glacier observations was initiated in 1894 and has resulted in unprecedented datasets of glacier distribution and changes (cf. http://www.gtn-g.org). Today, the Global Terrestrial Network for Glacier (GTN-G) is the framework for the coordinated glacier monitoring in support of the United Nations Framework Convention on Climate Change (UNFCCC). GTN-G is jointly run by the World Glacier Monitoring Service (WGMS), the US National Snow and Ice Data Center (NSIDC), and the Global Land Ice Measurements from Space (GLIMS) initiative. GTN-G actively compiles standardized glacier data based on a worldwide scientific collaboration network and through a series of research projects using NASA and ESA sensors. In this presentation, we provide a brief overview on the multi-level monitoring strategy, available datasets, and related web-interfaces. In view of the new GCOS implementation plan, we present recent progress in assessing global glacier distribution and changes, disclose remaining observational gaps in both in-situ and remote sensing datasets, and discuss challenges to be tackled on the way towards a truly operational glacier monitoring service.
6. Coordination and Integration of Global Ocean Observing through JCOMM – Keynote talk by David Legler (NOAA) D. Legler1, D. Meldrum2, K. Hill3, E. Charpentier4 1. NOAA, Climate Program Office, Washington, DC United States 2. Scottish Marine Institute, Oban , Scotland 3. GCOS/GOOS/WCRP Ocean Observations Panel for Climate/World Meteorological Organization, Geneva, Switzerland 4. Observing Systems Division, World Meteorological Organization
The primary objective of the JCOMM Observations Coordination Group (OCG) is to provide technical coordination to implement fully integrated ocean observing system across the entire marine meteorology and oceanographic community. JCOMM OCG works in partnership with the Global Ocean Observing System, which focusses on setting observing system requirements and conducting evaluations. JCOMM OCG initially focused on major global observing networks (e.g. Argo profiling floats, moored buoys, ship based observations, sea level stations, reference sites, etc), and is now expanding its horizon in recognition of new observing needs and new technologies/networks (e.g. ocean gliders). Over the next five years the JCOMM OCG is focusing its attention on integration and coordination in four major areas: observing network implementation particularly in response to integrated ocean observing requirements; observing system monitoring and metrics; standards and best practices; and improving integrated data management and access. This presentation will describe the scope and mission of JCOMM OCG; summarize the state of the global ocean observing system; highlight recent successes and resources for the research,
- 22 -
prediction, and assessment communities; summarize our plans for the next several years; and opportunities for the GCOS community.
7. Argo: past achievements, future risks and opportunities – Keynote talk by Toshio SUGA (Argo Steering Team) S. Wijffels1, D. Roemmich2, H. Freeland 3, and the Argo Steering Team 1. CSIRO Oceans and Atmosphere, Hobart, Australia 2. Scripps Institution of Oceanography, San Diego, USA 3. Institute of Ocean Sciences, Victoria, Canada
Since reaching global coverage in 2006, the Argo array of profiling floats has been delivering high-quality temperature and salinity profiles from depths of around 2000m to the surface every 10 days (www.argo.net). Argo now supplies the dominant subsurface ocean temperature and salinity data stream underpinning ocean, seasonal climate and weather forecasting. Papers reliant on Argo data are now being published faster than one per day, reporting breakthroughs in tracking ocean inventories of heat and freshwater, ocean change, deep ocean circulation, climate dynamics and air-sea interactions. We will touch on a few key applications and research results enabled by Argo. We will also describe the current status of Argo and its near term challenges and risks. We will also outline progress towards evolving the data system and the design of the Argo array, including progress on piloting extensions to cover existing gaps (marginal seas, deep and ice-covered oceans) and new parameters such as bio-chemical and optical measurements. As only one element of the Global Climate Observing System, Argo’s evolution requires strong integration with satellite and other in situ networks.
8. CCl-based Sea Level ECV and GCOS Requirements – Anny Cazenave (LEGOS-CNES) A. Cazenave1,2, J.-F. Legeais3, M. Ablain3, G. Larnicol3, B. Meyssignac1, J. Benveniste4, J. Johannessen5, M. Scharffenberg6, G. Timms7, S. Mbajon7, O. Andersen8, P. Cipollini9, M. Roca10, S. Rudenko11, J. Fernandes12, M. Balmaseda13, G. Quartly14, and L. Fenoglio-Marc15 1. LEGOS 2. ISSI 3. CLS 4. ESA 5. NERSC 6. University of Hamburg 7. CGI 8. DTU
9. NOC 10. IsardSAT 11. GFZ 12. University of Porto 13. ECMWF 14. PML 15. TUD
Sea level is one of the best indicators of climate change as it integrates changes of several components of the climate system in response to anthropogenic forcing and natural/internal variability. Among the 50 Essential Climate Variables (ECVs) defined by Global Climate Observing System (GCOS) to be monitored on the long time to improve our understanding of the changing climate, 26 are observable from space and among them, the “sea level” ECV. Since 2010, a consistent and continuous sea level record (at global and regional scales) is being produced under the auspices of the ESA Climate Change Initiative (CCI) programme, by combining data from several satellite altimetry missions. This project has led to the production of a homogeneous and accurate sea level record. This was achieved in several steps: 1) the user requirements have been collected and refined; 2) dedicated algorithms and optimized processing strategies were designed and tuned; 3) the geophysical corrections (orbit, atmospheric corrections, etc.) residual errors where reduced using improved algorithms; 4) instrumental drifts and bias have been scrutinized and upgraded. Such an improved product, used in synergy with other CCI ECVs (e.g., “ice sheets”) helps addressing important science questions such as “can we close the sea level budget over the altimetry era?”, “what is the deep ocean contribution to sea level rise and its role in the current Earth’s energy imbalance?”, “what are the causes of the regional and interannual sea level variability?”, “can we already
- 23 -
detect the anthropogenic forcing signature and separate it from the internal/natural climate variability?”, etc. Owing to the CCI support, the accuracy of the altimetry-based sea level ECV has been significantly improved at both global and regional scales, which has led to revisit and extend the GCOS accuracy requirements for both space and time segments of the spectrum, especially at regional and decadal time scales. Some efforts are still needed however to improve the sea level ECV at interannual time scale. In this presentation, we will deliver an overview of the importance of the sea level ECV in climate research and report on progress realized within the CCI project.
9. Status of Surface Radiation Budget Observation for Climate – Nozomu Ohkawara (Japan Meteorological Agency, Tokyo, Japan)
Surface radiation budget is a fundamental component for monitoring climate change and designated one of the climate essential variables (ECVs) of the Global Climate Observing System (GCOS). The status of surface radiation budget observation is reported in "Status of the Global Observing System for Climate" that was submitted at the 43rd session of the Subsidiary Body for Scientific and Technological Advice (SBSTA 43) ahead the COP21 in Paris, France in December 2015 under the United Nations Framework Convention on Climate Change (UNFCCC). The report says that the total amount of surface radiation budget data in national network and the baseline surface radiation network (BSRN) archived at world data centres has significantly increased and the data contributed considerably to infer best estimates for the global mean surface radiative components reported in the 5th IPCC assessment report. But regular receipt of data has remained about the same and data scarce areas also remain on the sea and in some regions on the land in these 5 years. Expanding of surface radiation budget observation network is necessary to enhance scientific knowledge for further understanding of climate change.
10. WMO Global Atmosphere Watch Measurements of Greenhouse Gases: Quantifying the Main Driver of Climate Change – Edward Dlugokencky (NOAA ESRL GMD) E.J. Dlugokencky1, O. Tarasova2 1. NOAA ESRL Global Monitoring Division, Boulder, CO, USA 2. World Meteorological Organization, Research Department, Geneva, Switzerland
The WMO Global Atmosphere Watch Programme (GAW) provides a framework that ensures high-quality atmospheric measurements of long-lived greenhouse gases (LLGHGs) by participating laboratories. Essential components of this framework include common, stable standard scales maintained by Central Calibration Laboratories; science-driven data quality objectives (DQO); centres to ensure measurement quality; and a World Data Centre to archive data and distribute them to end users. Activities are coordinated by a Scientific Advisory Group and GAW-sponsored technical meetings. Taken together, these activities ensure data are of sufficient quality for climate research. GAW global-scale measurements are used to accurately quantify the global burdens of LLGHGs, and they show that in 2014, their radiative forcing has increased by 2.94 W m-2 since 1750. Measurements of LLGHGs from GAW go beyond radiative forcing, though; they are also used to quantify GHG budgets of emissions and losses at global to regional scales, though further network improvements are required to support budget studies on smaller, policy-relevant scales. GAW measurements of CO2 and other related tracers show conclusively that atmospheric CO2 is increasing as a result of fossil fuel combustion, and that about half the annual emissions
- 24 -
remain in the atmosphere, while the remainder is partitioned between the oceans and the terrestrial biosphere. GAW observations help to understand the global methane budget and show no measurable increase in CH4 emissions, so far, in the rapidly warming Arctic. They also show that bottom-up inventories for SF6 reported to the UNFCCC largely underestimate emissions, with the important lesson that all GHG emission inventories must be evaluated with atmospheric measurements. WMO has proposed an Integrated Global Greenhouse Gas Information System that will quantify GHG fluxes and attribute emissions to specific source-types on policy relevant scales. The system will exploit spatial gradients in the observed abundance of GHGs using chemical transport models to quantify emissions, but this approach requires globally-harmonized observations and puts significant demands on measurement quality among laboratories. GAW provides the framework to ensure the appropriate level of quality. LLGHGs are the main driver of climate change and of utmost importance to GCOS. As a result, GAW networks for measurements of CO2, CH4, and N2O are designated global and comprehensive networks.
11. Atmospheric ozone monitoring in the frame of WMO-Global Atmospheric Watch programme – Johanna Tamminen (Finnish Meteorological Institute) A. F. Bais1,2 and SAG-Ozone members 1. Aristotle University of Thessaloniki, Thessaloniki, Greece 2. Chair, WMO/GAW Scientific Advisory Group on Ozone
The Global Atmosphere Watch (GAW) programme of WMO is a partnership involving the Members of WMO, contributing networks and collaborating organizations and bodies. This community provides reliable scientific data and information on the chemical composition of the atmosphere enabling monitoring of variability due to natural and anthropogenic factors. Ozone is an essential climate variable monitored by a global network of ground-based stations, aircraft and satellite-borne instruments for columnar measurements and vertical profiles.
The operation and quality of the observational network of ozone under GAW is coordinated and assessed with the aid of the Scientific Advisory Group (SAG) for ozone. For several decades GAW has been able to maintain the global spatial coverage of the Dobson and Brewer spectrophotometer total ozone and ozonesonde networks, and quality of the data provided. An important aspect for climate studies is to maintain traceability of measurements which extend for many decades. For ozone, this has been achieved through the world and regional calibration centres for Dobson and Brewer spectrophotometers and the world calibration centre for ozonesondes which have successfully operated for many years. Near real time (NRT) data provision is becoming an important component of GAW. For example, profile and column ozone data are used for weather, air quality and UV Index forecasting in the Monitoring of Atmospheric Composition and Climate (MACC) project. Many side activities have been initiated under GAW in collaboration with the IAMAS/International Ozone Commission (IO3C) and Network for the Detection of Atmospheric Composition Change (NDACC), aiming at the improvement of quality and comparability of data from different platforms, such as the homogenization of ozone profiles derived by ozonesondes (SI2N) and the assessment of absorption cross sections used for ozone retrieval (ACSO), which are both part of the IGACO (Integrated Global Atmospheric Chemistry Observations) activities within WMO-GAW. GAW disseminates data via the World Ozone Data Centre (http://www.woudc.org) and information to scientists and the public through a series of publications, including the Antarctic Ozone Bulletin, which is produced during the austral spring period since 2000. Finally GAW collaborates and has established linkages with various programmes and activities at European and International levels, such as, the NDACC, the EU In-service Aircraft for a Global Observing System (IAGOS) infrastructure project, the EU COST Action EUBREWNET, the EURAMET project Traceability for atmospheric total column ozone (ATMOZ), and so on.
- 25 -
12. Current Status of GOSAT and GOSAT-2 Projects – Ryoichi Imasu (University of Tokyo) R. Imasu1, T. Yokota2, T. Matsunaga2, Y. Yoshida2, T. Hirabayashi3, M. Nakajima3, N. Saitoh4, G. Inoue, T. Nakajima3, TCCON Partners 1. Atmosphere and Ocean Research Institute (AORI), The University of Tokyo, Japan 2. National Institute for Environmental Studies (NIES), Japan 3. Japan Aerospace eXploration Agency (JAXA), Japan 4. Center of Environmental Remote Sensing (CEReS), Chiba University, Japan
GOSAT (Greenhouse gases Observing Satellite) is the world’s first satellite dedicated to greenhouse gas monitoring from space, and it was successfully launched on January 23, 2009. Although it has finished its nominal operation period (5 years) in January 2014 and is currently in the extended operation period, it has still been monitoring the Earth’s atmosphere continuously. The data have been widely used not only for source/sink inversion of carbon dioxide and methane in global scale but also for assessing regional emission sources of the gases. The successor, GOSAT-2, will be launched in FY2017. Most of the design reviews for spacecraft, instruments, and ground data processing systems have been finished. The main sensor of GOSAT-2, Thermal And Near- infrared Sensor for carbon Observation – Fourier Transform Spectrometer (TANSO-FTS)-2 is designed based on CrIS (Cross-track Infrared Sounder) onboard NASA’s Suomi NPP for gas sounding.
It has a widened band in a short wavelength infrared region to detect carbon monoxide (CO). Intelligent pointing system, which is a dynamical system for targeting at selected clear sky scenes has been newly developed. It is expected that the detectability of clear sky scenes become larger twice or more compared with the current system. “GOSAT Air Pollution Watch” is being designed for rapid processing / distribution of GOSAT TANSO-Cloud and Aerosol Imager (TANSO-CAI) data for monitoring of air pollution caused mainly by particulate matters such as PM2.5 and Black Carbon (BC). Its testbed is already developed and basic performances have been demonstrated using TANSO-CAI data. Data processing algorithms in GOSAT Air Pollution Watch are based on but modified from GOSAT/GOSAT-2 algorithms for aerosol product generation to realize faster and timely data processing. Data from GOSAT Air Pollution Watch will be used to inform the current distribution of the polluted air. In addition, they will contribute to short term prediction of air pollution using atmospheric transport models. NIES would like to issue “Call for new GOSAT Air Pollution Watch partners” to extend the coverage of the testbed to Southeastern and South Asian countries. These activities may have close relationships to JCM (Joint Crediting Mechanism) activities between Japan and Asian countries.
13. Observation Systems in support of water-related Essential Climate Variables- The Global Terrestrial Network Hydrology – Wolfgang Grabs (German Federal Institute of Hydrology)
The Global Terrestrial Network for Hydrology (GTN-H) was established in 2001 as a baseline network in support of UNFCCC, and is an activity under the joint auspices of the Global Climate Observing System (GCOS), the Climate and Water Department of the World Meteorological Organization (WMO) and the Global Terrestrial Observation Network (GTOS). It also represents the observational arm of the Integrated Global Water Cycle Observations Community of Practice of the Global Earth Observation System of Systems (GEOSS). The presentation outlines the development and present status of GTN-H as a global hydrological network of networks. Together, these federated global data centres respond to the needs for global hydrometeorological data, information and data products that aim to provide the observational basis for the development of adaptation methods to climate change. Likewise, interaction with users of GTN-H services demonstrates the utility of the data provided through GTN-H for research including environmental change, identification of trends and the development of adequate response strategies. The presentation shows the large range of services provided to
- 26 -
a diverse user community in support of climate services and the increasing demands of users for high quality and timely earth observations. Opportunities for linking terrestrial earth observations with space-based observations are highlighted. The presentation discusses still existing challenges with regard to data sharing arrangements facilitating free and open access to data, and progress made with regard to standardization of data to improve accessibility. Looking ahead, the presentation outlines priority areas of work of GTN-H especially with regard to quality control, closing observational gaps and overall strengthening of in-situ data acquisition.
- 27 -
Posters
Poster Presenter: Valerio Avitabile – Recent achievements on global forest biomass mapping and characterization of errors V. Avitabile1, M. Herold 1, M. Santoro2 1. Wageningen University, Wageningen, the Netherlands 2. Gamma Remote Sensing, Gümligen, Switzerland
Aboveground biomass, one of the terrestrial Essential Climate Variables, plays a key role in the carbon cycle and climate processes, and biomass maps constitute key inputs for regional to global scale vegetation monitoring and modelling analysis. In the last few years there has been a large effort to use remote sensing observations to improve the spatial assessment of forest biomass, but large scale mapping is challenged by the complex relationship between biomass and satellite data, which varies with biome and forest structure, and by the scarcity of reference data used for calibrating this relationship. In addition, the accuracy assessment of biomass maps is a crucial but still problematic step, and currently a standard validation strategy for biomass products is not yet available. The scope of this presentation is to report on recent achievements related to global estimates of forest biomass and strategies for characterizing the accuracy of large-scale biomass maps. In the context of the EU GEOCARBON project we mapped forest biomass globally at 0.01 degree (c. 1km) resolution by developing two regional approaches and combining the respective products. In the tropical region we compiled and harmonized a variety of high-quality local biomass reference data to assess the spatial accuracy of existing regional maps and to optimally integrate them using a fusion approach into an improved pan-tropical biomass map (Avitabile et al., 2015). In the boreal region we quantified forest biomass on the basis of hyper-temporal observations of Envisat Advanced Synthetic Aperture Radar (ASAR) backscattered intensity using the BIOMASAR algorithm (Santoro et al., 2015) and biomass conversion and expansion factors. In the context of the ESA GlobBiomass project we propose a validation protocol to assess the uncertainty and accuracy of the biomass datasets. The validation concept consists of an internal uncertainty analysis, an independent validation, a product inter-comparison and a user assessment. We present a methodology to use different types of existing biomass data in a harmonized manner and propose the quality criteria to select the reference data, the procedures to harmonize and upscale the reference data, and the metrics to assess product quality. The methodology is partly benchmarked with the synergistic global biomass map to provide a first validation of the data product and understand the advantages and disadvantages of the validation strategies here reported.
Poster Presenter: Michèle Barbier – Enhancement of autonomous ocean observation networks in the Atlantic Ocean H. Claustre1, A. Boetius2, P. Testor3, S. Pouliquen4, R. Lampitt5, T. Kanzow6, B. Bourlès7, P. Blouch8, P. Afonso9, G. Obolensky4, F. Whoriskey10, M. Barbier1,11, F. Janssen2, I. Salter2, V. Turpin3
1. UPMC- CNRS, Laboratoire d’Océanographie de Villefranche, France 2. HGF-MPG Group for Deep Sea Ecology and Technology, Alfred Wegener Institute Helmholtz Centre for Polar and Marine Research, Bremerhaven, Germany 3. LOCEAN – CNRS,Paris, France 4. ERIC Euro-Argo, Brest, France 5. National Oceanography Centre, Southampton, UK
6. Alfred-Wegener-Institute, Helmholtz Centre for Polar and Marine Research, Bremerhaven,, Germany 7. Institut de Recherche et de Development, IRD,Brest, France 8. E-SURFMAR Operational Service, Brest, France 9. IMAR – Universidade dos Açores, Portugal 10. Dalhousie University, Canada 11. Ocean Synergies, Nice, France
Within the AtlantOS (Optimising and Enhancing the Integrated Atlantic Ocean Observing Systems) H2020 project, a specific work package is dedicated to development of autonomous observing networks. It is based on innovative platforms with multidisciplinary sensor modules such as gliders, drifters, moorings, floats and tagged animals. This work package is built on existing capacities for autonomous observing networks on both sides of the Atlantic. It will
- 28 -
improve the systematic collection of ocean observations recorded in-situ, and will enhance intersections not only between the various autonomous platforms but also with other ones, including ship-based platforms and remote sensing. Autonomous ocean observation technologies are enabling to reduce the costs of in-situ ocean observation, but so far they have to be optimized to integrate the biological and ecosystem dimension into observing systems. For each autonomous platform network of this work package, the work will first focus on the enhancement of data acquisition capabilities. This will be done by upgrading observatories through increasing their spatio-temporal coverage, by integrating new sensors allowing the measurement of Essential Ocean Variables and by linking to the biological dimensions. These developments will be in particular undertaken through sampling strategies resulting from Observing System Simulation Experiments. Data stream of each network will be standardized and, where possible, appropriate real-time and delayed-mode data quality control procedures will be implemented and more generally integrated into a more global and unified data management system. Finally, the autonomous observation networks will be promoted to a wider user community to enhance cross-system integration and to achieve the sustainability of such integrated networks of the future.
Poster Presenter: Luana Basso – Seasonality and inter-annual variability of CH4 fluxes from the eastern Amazon Basin inferred from atmospheric mole fraction profiles L.S. Basso1, L.V. Gatti2, M. Gloor1, J.B. Miller3, L.G. Domingues2,4, C.S.C. Correia2,4, V.F. Borges2,4 1. School of Geography, University of Leeds, Woodhouse Lane, Leeds LS92JT, UK 2. Centro de Ciências do Sistema Terrestre (CCST), National Institute for Space Research (INPE), São José dos Campos, Brazil 3. Global Monitoring Division, Earth System Research Laboratory, National Oceanic and Atmospheric Administration (NOAA), 325 Broadway, Boulder, Colorado 80305, USA 4. Instituto de Pesquisas Energéticas e Nucleares (IPEN) – Comissão Nacional de Energia Nuclear (CNEN), São Paulo, Brazil Email: [email protected]
The Amazon Basin is an important region for global CH4 emissions. It hosts the largest area of humid tropical forests, and around 20% of this area is seasonally flooded. In a warming climate it is possible that CH4 emissions from the Amazon will increase both as a result of increased temperatures and precipitation. To examine if there are indications of first signs of such changes we present here a 13-year (2000-2013) record of regularly measured vertical CH4 mole fraction profiles above the eastern Brazilian Amazon, Santarém (SAN; 2.86ºS; 54.95ºW). Since 2000 samples are collected, fortnightly, aboard light aircraft between 300m and 4.4km. Using a simple mass balance approach, we find substantial CH4 emissions with an annual average flux of 52.8±6.8 mg CH4 m-2 day-1. Were found a clear seasonality, with higher fluxes in two periods of the year: in the beginning of the wet season and during the dry season. Using a CO:CH4 emission factor estimated from the profile data, were estimated an influence of biomass burning around 15% of the total flux in dry season, indicating that biogenic emissions dominate the CH4 flux. This 13-year record shows that CH4 emissions upwind of SAN varied over the years, with highest emissions in 2008 (around 25% higher than in 2007), mainly during the wet season, representing 19% of the observed global increase.
Acknowledgment: FAPESP, NERC, CNPq, MCTI, NOAA and IPEN.
Poster Presenter: Luana Basso – A first Amazon CH4 budget based on atmospheric data L.S. Basso1, L.V. Gatti2, M. Gloor1, J.B. Miller3, L.G. Domingues2,4, C.S.C. Correia2,4, V.F. Borges2,4 1. School of Geography, University of Leeds, Woodhouse Lane, Leeds LS92JT, UK 2. Centro de Ciências do Sistema Terrestre (CCST), National Institute for Space Research (INPE), São José dos Campos, Brazil 3. Global Monitoring Division, Earth System Research Laboratory, National Oceanic and Atmospheric Administration (NOAA), 325 Broadway, Boulder, Colorado 80305, USA

- 29 -
4. Instituto de Pesquisas Energéticas e Nucleares (IPEN) – Comissão Nacional de Energia Nuclear (CNEN), São Paulo, Brazil Email: [email protected]
Tropical land regions have until recently been poorly observed with large-scale integrating in-situ observations. Considering that the Amazon Basin represents 50% of the world tropical rainforest and Methane (CH4) is the second most important anthropogenic greenhouse gases, contributing with around 18% to radiative forcing, and in 2014 the CH4 mixing ratio increases of 9ppb in comparison with the previous year, reaching 1833ppb, is important understand the behavior of the Amazon Basin in relation to this greenhouse gas. Then, observing the global importance of CH4 and uncertainties in the emission of this greenhouse gases in the Amazon Basin, this study aimed to determine CH4 emission in the Amazon Basin. Were used regular vertical profiles in 4 sites distributed over the basin from east to west, Alta Floresta (ALF; 8.80ºS, 56.75ºW), Rio Branco (RBA; 9.38ºS, 67.62ºW), Santarém (SAN; 2.86ºS; 54.95ºW) and Tabatinga (TAB; 5.96ºS, 70.06ºW). Since 2010 samples are collected, fortnightly, aboard light aircraft between 300m and 4.4km. From the flux estimates we calculated basin wide budgets with some differentiation of underlying processes based on carbon monoxide from fires. The results showed that the Amazon Basin was a source of CH4 during the study period, but the CH4 emission variable in the different regions and variability with the years, these can be related with the climatological variations, 2010 and 2012 were driers years and 2011 and 2013 were wet years. With these results is possible to observe the importance of conducting studies on a regional scale to elucidate the behavior of the entire Amazon Basin. And the importance of long-term studies due the variation in emissions year by year, so that the results can be assumed to average behavior a long time series is necessary to take into account the methane balance from the Amazon Basin. Acknowledgment: FAPESP, NERC, CNPq, MCTI, NOAA and IPEN.
Poster Presenter: Greg Bodeker – The GRUAN Implementation Plan and contributions to the GCOS Implementation Plan G.E. Bodeker1, P. Thorne2, R. Dirksen3
1. GRUAN co-chair, Bodeker Scientific, Alexandra, New Zealand 2. GRUAN co-chair, Maynooth University, Department of Geography, Maynooth, Ireland 3. Head of GRUAN Lead Centre, Deutscher Wetterdienst, Lindenberg, Germany
This presentation will summarize the current GRUAN Implementation Plan (IP), what aspects of that plan are likely to support the GCOS IP, and possible processes for ensuring that the GCOS and GRUAN IPs are well aligned. The current GRUAN IP, published as GCOS-165, covers the five year period 2013-2017. The goal of this IP is to take GRUAN through operationalization and expansion of the network, certification of measurement programmes at new and existing sites, and expansion of the range of GRUAN data products on offer. The work packages comprising are oriented around reference observations, data policy and data dissemination, site considerations and network composition, science, organization, outreach, and establishing data products for other GRUAN priority 2 variables. The GRUAN IP recognizes that sites have varying capabilities, funding mechanisms and affiliations to third party networks and organizations. By the end of the period spanned by the GRUAN IP, if it is successfully implemented, GRUAN shall consist of: • A network of 20 to 30 measurement sites each contributing to one or more GRUAN data
streams. Beyond 2017, the time horizon for this IP, the network is envisage to further expand to meet the longer term goal of 40 contributing sites;
• A network serving reference quality measurements of vertical profiles from the surface through the lower stratosphere (or higher where feasible) of temperature, pressure, water vapour, wind speed and direction, and ozone. To the extent possible, these measurements will be made using redundant systems including sondes and ground-based remote sensing;
- 30 -
• A set of sustainable long-term measurements being used by recognized target stakeholders, as demonstrated in the peer reviewed literature;
• A network with operational and research functions, embedded within the overarching WIGOS framework, and leading to improved capabilities and practices in other broader components of the Global Observing System and its applications.
In addition to discussing aspects of the GRUAN IP of a more strategic nature, the presentation will also touch on selected specific tasks identified within the IP that are likely to support the GCOS IP, e.g.: • Incorporating GRUAN material into GCOS and WIGOS Manuals and Guides; • Engaging with the satellite community to ensure that the value of GRUAN is fully exploited; • Interacting with NMHSs to encourage sites to join GRUAN; • Implementing an agreed procedure for monitoring GRUAN data usage to the extent
practical/allowable; • Coordinating with space-based measurement agencies to ensure that measurement
programmes at GRUAN sites are incorporated into satellite product validation programmes; • Continuing to process GRUAN sites through the site assessment and certification process; • Providing a scientific basis for sites to choose the optimal combination of measurement
technologies to best meet GRUAN needs.
Poster Presenter: Michael Buchwitz – The Essential Climate Variable Greenhouse Gases as generated by the ESA project GHG-CCl M. Buchwitz1, M. Reuter1, O. Schneising1, H. Boesch2, R. G. Detmers3, M. Alexe4, I. Aben3, P. Bergamaschi4, H. Bovensmann1, D. Brunner5, A. M. Sundström5, B. Buchmann5, J. P. Burrows1, A. Butz6, F. Chevallier7, C. D. Crevoisier8, B. Dils9, L. Feng11, C. Frankenberg10, O. P. Hasekamp3, W. Hewson2, J. Heymann1, S. Houweling3, T. Kaminski12, A. Laeng6, T. T. van Leeuwen3, G. Lichtenberg13, J. Marshall14, M. De Mazière9, S. Noël1, J. Notholt1, P. Palmer11, R. Parker2, M. Scholze15, G. P. Stiller6, E. De Wachter9, T. Warneke1, C. Zehner17
1. Institute of Environmental Physics (IUP), University of Bremen, Bremen, Germany 2. University of Leicester, Leicester, United Kingdom 3. SRON Netherlands Institute for Space Research, Utrecht, Netherlands 4. European Commission Joint Research Centre (EC-JRC), Institute for Environment and Sustainability (IES), Air and Climate Unit, Ispra, Italy 5. Swiss Federal Laboratories for Materials Science and Technology (Empa), Dübendorf, Switzerland 6. Karlsruhe Institute of Technology (KIT), Karlsruhe, Germany 7. Laboratoire des Sciences du Climat et de l'Environnement (LSCE), Gif-sur-Yvette, France. 8. Laboratoire de Météorologie Dynamique (LMD), Palaiseau, France 9. Belgian Institute for Space Aeronomy (BIRA), Brussels, Belgium 10. Jet Propulsion Laboratory (JPL), Pasadena, California, United States of America 11. University of Edinburgh, Edinburgh, United Kingdom 12. The Inversion Lab, Hamburg, Germany 13. Deutsches Zentrum für Luft- und Raumfahrt (DLR), Oberpfaffenhofen, Germany 14. Max-Planck-Institute for Biogeochemistry, Jena, Germany 15. Lund University, Lund, Sweden 16. European Space Agency (ESA), ESRIN, Frascati, Italy
The GHG-CCI project is one of several projects of the European Space Agency’s (ESA) Climate Change Initiative (CCI). The goal of the CCI is to generate and deliver data sets of various satellite-derived Essential Climate Variables (ECVs) in line with GCOS (Global Climate Observing System) requirements. The “ECV Greenhouse Gases” (ECV GHG) is the global distribution of important climate relevant gases – specifically atmospheric CO2 and CH4 - with a quality sufficient to obtain information on regional CO2 and CH4 sources and sinks. The main goal of GHG-CCI is to generate long-term highly accurate and precise time series of global near-surface sensitive satellite observations of CO2 and CH4. SCIAMACHY on ENVISAT and TANSO-FTS/GOSAT are currently the two main satellite instruments used within the GHG-CCI project because multi-year time series of near-surface sensitive atmospheric CO2 and CH4 data products can be derived from their radiance observations. In addition other satellite instruments such as IASI/METOP and MIPAS/ENVISAT
- 31 -
are also used. In the presentation an overview about the latest data products will be given and selected highlights from using the GHG-CCI data products to address important questions related to the sources and sinks of CO2 and methane will be presented.
Poster Presenter: Ruud Dirksen – GRUAN: A reference data product for the Vaisala RS92 radiosonde R.J. Dirksen1, M. Sommer1, C. von Rohden1, F.J. Immler2 1. GRUAN Lead Centre, Deutscher Wetterdienst, Lindenberg, Germany 2. European Commission, Brussels, Belgium
One of the main goals of the GCOS Reference Upper Air Network (GRUAN) is to perform reference observations of profiles of atmospheric temperature and humidity for the purpose of monitoring climate change. Two essential criteria for establishing a reference observation are measurement-traceability and the availability of measurement uncertainties. Radiosoundings have proven valuable in providing in-situ profiles of temperature, humidity and pressure at unmatched vertical resolution. Data products from commercial radiosondes often rely on black-box or proprietary algorithms, which are not disclosed to the scientific user. Furthermore, long-term time-series from these products are frequently hampered by changes in the hardware and/or the data processing. Data provided by GRUAN comply with the above-mentioned essential criteria for a reference product: the correction algorithms are open-source and well-documented and the data are traceable to SI units and include vertically resolved best-estimates of the uncertainties. Within GRUAN various, redundant independent measurement systems are employed. This variety and redundancy prevents manufacturer-dependency and at the same time enables the detection of biases in measurement systems. Currently, a GRUAN data product is available for the widely used Vaisala RS92 radiosonde. At the same time, GRUAN data products are being developed for various other measurement systems, so that ultimately GRUAN certified data products will be available for all measurement systems employed within GRUAN. This presentation introduces the GRUAN processing of RS92 radiosoundings, the correction algorithms that are applied, and the derivation of the vertically resolved uncertainty estimates. Well-known, dominant error sources for the RS92 profiles are related to solar radiation, causing a temperature error and a dry bias, and time-lag of the humidity sensor. The correction for radiation-related errors is based on laboratory experiments to measure the response of the RS92 sensors to solar irradiance. Verification of GRUAN RS92 humidity profiles show good agreement with coincident CFH soundings up to the tropopause, with a relative error smaller than 10%. Comparison of temperature profiles processed by GRUAN and by Vaisala shows negligible differences at night, and daytime differences of less than 0.1 K below 25 km. The bias between both temperature profiles are within the estimated uncertainty. Comparison of the humidity measurements shows moister GRUAN profiles at night. For daytime profiles the GRUAN profiles are up to 15% moister in the upper troposphere, which is largely attributed to the correction for the radiation dry bias. The major advantages of the GRUAN processing include the availability of uncertainty estimates and the storing of the radiosonde’s raw measurement data, which allows for reprocessing when new or improved corrections become available.
Poster Presenter: Ruud Dirksen – An overview of the GCOS Reference Upper-Air Network (GRUAN) R.J. Dirksen1, P. Thorne2, G. Bodeker3,.M. Sommer1
1. GRUAN Lead Centre, Deutscher Wetterdienst, Lindenberg, Germany 2. Maynooth University, Departments of Geography, Maynooth, Ireland 3. Bodeker Scientific, Alexandra, New Zealand
- 32 -
Measurements of primary state variables of the troposphere and stratosphere (primarily temperature, water vapor and pressure) are typically made to provide the input required by numerical weather prediction models. These same measurements then also constitute the primary source for meteorological reanalysis and climate analyses. The balloon-borne, ground-based and satellite-based systems used to make these measurements often undergo changes in instrumentation, data processing methods, retrieval techniques and calibration. These changes are often poorly documented and very are measurement series reprocessed to ensure long-term homogeneity of the climate data record. Such unphysical discontinuities in measurement data can lead to the deterioration of the quality of meteorological reanalyzes. To address this specific deficiency of the global climate-monitoring network, WMO and GCOS called for the establishment of a new state-of-the-art global network of high quality measurements of essential climate variables in the upper atmosphere. The establishment of GRUAN (GCOS Reference Upper-Air Network) has now been underway for several years and sites are providing reference quality measurements that adhere to GRUAN operating protocols. This presentation will provide an overview of the achievements of GRUAN to date, including:
• Protocols that have been established to ensure that measurements are of reference quality;
• What measurement systems are and will be operating at GRUAN sites; • What data products are expected to flow from those systems; • An overview of data currently flowing from GRUAN sites; • technical advancements within GRUAN to meet the needs of users of GRUAN data
products. GRUAN's goal is not only to produce long-term, carefully calibrated measurements with well-defined measurement uncertainties, but to also produce high-quality data suitable for focused process studies. How GRUAN balances operational and research goals will be included in the presentation, as well as the challenges that GRUAN faces, and plans for overcoming these challenges.
Poster Presenter: Emma Dodd – Towards a Combined Surface Temperature Dataset for the Arctic from the Along-Track Scanning Radiometers (ATSRs)
E. Dodd, K. Veal, G. Corlett, D. Ghent, J. Remedios
University of Leicester, Leicester, United Kingdom
Surface Temperature (ST) changes in the Polar Regions are predicted to be more rapid than either global averages or responses in lower latitudes. Observations increasingly confirm these findings, their urgency, and their significance in the Arctic. It is, therefore, particularly important to monitor Arctic climate change. Satellites are particularly relevant to observations of Polar Regions as they are well-served by low-Earth orbiting satellites. Whilst clouds often cause problems for satellite observations of the surface, in situ observations of surface temperatures are much sparser. The ATSRs are accurate infra-red satellite radiometers, designed explicitly for climate standard observations and particularly suited to surface temperature observations. ATSR radiance observations have been used to retrieve sea and land surface temperature for a series of three instruments over a period greater than twenty years. This series will be extended with the launch of SLSTR on Sentinel 3, which has the same key design features necessary for providing climate quality surface temperature datasets. We have combined land, ocean and sea-ice surface temperature retrievals from ATSR-2 and AATSR to produce a new surface temperature dataset with pixel level uncertainties for the
- 33 -
Arctic; the ATSR Arctic combined Surface Temperature (AAST) dataset. The method of cloud-clearing, use of auxiliary data for ice classification and the ST retrievals used for each surface-type will be described. We will establish the accuracy of sea-ice and land-ice retrievals with recent results from validation against in situ data. We will show time series of ST anomalies for each surface type. The time series for open ocean in the Arctic Polar Region shows a significant warming trend during the AATSR mission. Interpretation of this trend must take into consideration changes in open-water extent and this will be discussed. Time series for land, land-ice and sea-ice show high variability as expected but also interesting patterns. Overall, our purpose is to present the state-of-the-art for ATSR observations of surface temperature change in the Arctic and hence indicate confidence we can have in temperature change across all three domains, and in combination.
Poster Presenter: Fouad Gadouali – Evaluation of multiple satellite-derived rainfall products over Morocco
Fouad Gadouali1, Mohamed Messoulli2
1. National Meteorological Office, Casablanca, Morocco 2. Faculty of Sciences Semlalia, Cadi Ayyad University, Marrakech, Morocco
The Mediterranean region is a hot spot of climate variability but the relative paucity of long term surface rain-gauges measurements in its southern part makes obstacle to hydro-climate studies. In an attempt to overcome this lack, the focus of this study is to assess the accuracy and reliability of three high resolution satellite-derived rainfall products over Morocco. Tropical Rainfall Measuring Mission, version 7 (TRMM3B42V7), African Rainfall Climatology, version 2 (ARC2) and African Rainfall Estimation Algorithm, version 2 (RFE2.0) are evaluated against 18 rain-gauges in Morocco, at daily, monthly and yearly time scales for the period 2001-2014. Results show that, ARC2 and RFE2.0 globally perform well at identifying rainfall days in coastal and northern stations but with less satisfactory skills in some southern stations. In contrast TRMM3B42V7 produces more false alarms than hits in several stations. However, this product performs better at monthly time scale. All products manifest a slight underestimation of rainfall amount in the majority of stations. The largest bias between products and surface rain-gauges measurements is recorded in the southern region, which points out the need for applying bias adjustments before their use. The good performance of ARC2 which extends back to 1983 highlights the importance of its usefulness in different fields of application over Morocco. The low ability of TRMM3B42v7 at detecting rainfall days reflects a necessity to review the calibration time step of this product with surface rain-gauges. Key words: satellite rainfall products, TRMM, ARC2, RFE2, rainfall in Morocco
Poster Presenter: Carlos Garcia – The Brazilian Coastal Monitoring System (SiMCosta) for Climate Studies
C. A. E. Garcia1, A. M. Ciotti2, G. A. Cunha1 and E. S. Pereira1 1. Federal University of Rio Grande, Rio Grande, Brazil 2. Centro de Biologia Marinha (CEBIMAR), Universidade de São Paulo, Brazil
The SiMCosta aims to improve the Brazilian coastal observing systems, by using advanced and integrated methodologies, which can obtain, analyze and distribute permanent and continuous temporal series of high-quality essential climate variables (ECVs) collected in several points along the coast. The SiMCosta seeks to detect long-term trends, improve the capability of predicting the effects of climatic variability and climate changes and contribute with other national efforts of early warning systems for extreme events. The SiMCosta has been implemented by phases. In its first phase, 12 tidal gauges and 8 meteo-oceanographic buoys are being installed along the Brazilian coastline.
- 34 -
The SiMCosta buoys provide on-line data of the following atmospheric and oceanic ECVs: air temperature, wind speed and direction, air humidity, precipitation rate, atmospheric pressure, surface solar irradiance, air CO2 concentration, sea surface temperature, sea surface salinity, sea state (wave height and direction), current profile, chlorophyll and CDOM fluorescence, oxygen concentration, turbidity, pH and nitrate concentration. The SiMCosta data quality control structure follows the procedures adopted by the Quality Assurance of Time-series of Oceanographic Data - IOOS (Qartod). The tidal gauges measure sea surface level (radar) and the following atmospheric properties: temperature, wind speed and direction, air humidity, atmospheric pressure, precipitation rate and visibility. The sea level measured by the tidal stations will be referred to the high quality geodetic vertical datum maintained by the Brazilian Institute of Geography and Statistics (IBGE). The project SiMCosta was created in December 2011, attending a specific request from the Ministry of Environment (MMA) and an old need identified by the Brazilian scientific community. The Coastal Zone Network associated with the Brazilian Network for Global Climate Change Studies (Rede CLIMA) and the National Institute of Science and Technology for Climate Changes (INCT for Climate Changes) is responsible for establishing and implementing SiMCosta.
Poster Presenter: Detlev Helmig – Reversal of Long-Term Trends in Ethane Identified from the Global Atmosphere Watch Reactive Gases Measurement Network D. Helmig1, L. Carpenter2, A. Claude3, M. De Maziere4, L. Emmons5, F. Flocke5, B. Franco6, I. Galbally7, J. Hannigan5, J. Hueber1, H. Koide8, A. Lewis2, K. Masarie9, M. Lee10 , E. Mahieu6, S. Montzka9 , P. Novelli9, C. Plass-Dülmer3, A. Pozzer11, S. Punjabi2, S. Reiman12, F. Rohrer13, S. Rossabi1, K. Sato14, M. Schultz13, R. Steinbrecher15, D. Smale16, P. Tans9, O. Tarasova17, K. Thoning9,V. Thouret18 , K.Tørseth19, M.Vollmer12, C. Zellweger12 1. INSTAAR, University of Colorado, Boulder, USA 2. University of York, United Kingdom 3. DWD, Hohenpeissenberg, Germany 4. Institute for Space Aeronomy, Brussels, Belgium 5. NCAR, Boulder, USA 6. Institute of Astrophysics and Geophysics, University of Liège, Belgium 7. CSIRO, Aspendale, Australia 8. Japan Meteorological Agency, Tokyo, Japan 9. NOAA, Boulder, USA 10. Korea University, South Korea
11. MPI, Mainz, Germany 12. Swiss Federal Laboratories for Materials Science and Technology, Dübendorf, Switzerland 13. Institute for Energy and Climate Research, Forschungszentrum Jülich, Germany 14. ACAP, Niigata-shi, Japan 15. KIT, Garmisch-Partenkirchen, Germany 16. NIWA, Lauder, New Zealand 17. WMO, Geneva, Switzerland 18. Laboratoire d'Aérologie, CNRS, France 19. NILU, Kjeller, Norway
Long-term observations of reactive(i.e. short-lived) gases in the troposphere are important for understanding trace gas cycles, assessing impacts of emission changes, verifying numerical model simulations, and quantifying the contributions of short-lived compounds and their response to climate change. The World Meteorological Organization’s (WMO) Global Atmosphere Watch (GAW) program coordinates a global network of surface stations, some of which have measured reactive gases for more than 30 years. Gas species included under this umbrella are ozone, carbon monoxide, nitrogen oxides, and volatile organic compounds (VOCs). There are many challenges involved in setting-up and maintaining such a network over many decades and to ensure that data are of high quality, regularly updated, and made easily accessible to users. Observations of the non-methane hydrocarbon (NMHC) ethane from the GAW network have shown a recent, remarkable reversal of the northern hemisphere long-term trend. Ethane, the longest-lived, and at levels of ∼0.4 – 2.5 nmol mol-1 (ppb) the most abundant NMHC in the background atmosphere is released from seepage of fossil carbon deposits, volcanoes, fires, and from human activities, with fossil fuel extraction, distribution, and industrial use being the major sources. Global atmospheric ethane peaked around 1970, followed by a downward trend for the next four decades. This was primarily due to reduced
- 35 -
emissions from oil and gas industries and stricter air quality emission controls. The near 40-year trend of declining global ethane halted between 2005-2010 in the Northern Hemisphere, and has since reversed. These changes are occurring at a hemispheric scale, but are most evident in the eastern part of the North American continent, downwind over the North Atlantic, and in the free troposphere over Europe, and are most likely driven by emissions increases from North American oil and natural gas development. The ratio of ethane over other NMHC and ethane/methane relationships are used to infer associated emission changes of those gases, and, in combination with photochemical modeling, regional and continental scale impacts on surface ozone, which is an important climate gas. This study exemplifies the value of global reactive gases measurements and provides guidance for defining the observational requirements for monitoring these species.
Poster Presenter: Viju John – A Fundamental Climate Data Record for Microwave Humidity Sounder Radiances Viju O. John1,2, Roger W. Saunders1, Helen Hanlon2, William Ingram1 1. Met Office, Exeter, United Kingdom 2. EUMETSAT, Darmstadt, Germany
Microwave humidity sounding measurements have been shown to have significant impact in NWP models by improving the representation of the tropospheric water vapour distribution in the models. The aim of this project is to provide a fundamental climate data record (FCDR) of such measurements so that they can also be used to create climate quality datasets of tropospheric humidity for monitoring humidity variability and changes, compare with climate model simulations and assimilate in atmospheric reanalyses. In this project, as part of the EUMETSAT's Climate Monitoring Satellite Application Facility (CMSAF), an FCDR of microwave radiances covering the period 1993—2014 has been created and analysed. The main issue when creating these data was how to combine data from the different satellites. The individual satellite data records have been quality assessed and corrections calculated for users to remove instrumental biases. The inter-satellite biases have been calculated, using NOAA 18 as the reference for the others to be compared against. This provided a means of correcting the differences between satellites allowing us to combine records from different satellites and create a longer consistent time-series of radiances. Also a quality assessment was performed prior to the bias correction and any erroneous values that were discovered have been flagged. In summary, the CMSAF project has created a log of missing or bad data for input to a dataset of quality flags which can be applied to remove observations considered to be suspicious. Analysis of the individual satellites has shown differences between the records of the individual satellites and highlighted particular periods of data that should be used with caution. The presentation will present the analyses of 20+ years of radiances which reveals variability and changes in tropospheric water vapour for the last 20 years.
Poster Presenter: Suganth Kannan – Global observation system for earthquake data collection and its use in an Innovative Mathematical Model for Earthquake Prediction S. Kannan MathforUS LLC, Weston, Florida, 33327, United States of America
This paper highlights the relevance of global observation system and collection of continuous land and ocean based earthquake data and their usefulness in predicting future earthquakes and its effect on global climate change and balance. Using data from National Earthquake Information Center (NEIC), Spatial connection models
- 36 -
were constructed using KML programming language in Google earth program for two major earthquake fault zones, Turkey and Chile. The Innovative Mathematical Model for Earthquake Prediction (IMMEP) based on spatial connection theory and reverse Poisson’s distribution was developed. The Poisson Range Identifier (Pri) values were computed, and the Poisson’s Distribution was applied to the Pri values to arrive at a distance factor. Then Exponential and Hyper-Geometric distributions analysis were carried out. A rigorous mathematical algorithm was used to triangulate and merge the results from the three analysis into a common distance factor. The improved distance factor was utilized to carry out the earthquake prediction. By using technological advances and improving the probability of future earthquake predictions, this exciting science research results provides an effective adulation to global observation science. Utilizing the results of this research, public, policy makers and politicians can allocate their resources in appropriate locations to assist people during evacuation and save lives.
Poster Presenter: Valeriy Khokhlov – Applicability of data on extreme temperatures for detection of regional climate change V. Khokhlov, N. Yermolenko, O. Umanska, K. Sirichenko Odessa State Environmental University, Odessa, Ukraine
Climate change and especially extreme climatic events can greatly affect the nature, and the consequences will be felt in the economic, environmental and social spheres. It is widely recognized that the rise of global mean temperature, which are calculated using daily mean (TG) one, during last century is the most prominent feature of current climate. The extreme temperatures, minimum (TN) and maximum (TX), have also drastically changed. This study develops the approach using annual, winter and summer indices of extremes – TG10p, TN10p, TX10p are the numbers of days with TG, TN and TX less than 10th percentile, and TG90p, TN90p, TX90p are the numbers of days with TG, TN and TX greater than 90th percentile. These indices were calculated for Ukrainian sites focusing on Kyiv in the northern part and Odessa in the southern one – the sites with longest records. In this study, we analyzed not the numbers of appropriate days but the linear trends for the three periods – 1894-2014, 1981-2014, and 1998-2014. It is well known that the recent global warming was most prominent starting from the 1980s as well as it was reported in some studies that the steady increase in global surface temperature around a linear positive trend has paused in the 2000s. Nevertheless, the records do not reveal any hiatus in the third period as the number of cold days decreased and warm days increased in most cases. Moreover, the linear trends were sharper in the last 15 years compared with the period of 1981-2014 and, especially, with the period of 1894-2014. The small increase of cold day-times in Southern Ukraine must be single manifestation of the hiatus. The number of warm events increased more intensively than the number of cold ones decreased, especially in Southern Ukraine. For example in Odessa, the linear trend of TG10p showed the decrease by the 1 event per year whereas the TG90p increased by the 2 days per year. We can conclude that in order to assess regional climate change the use of extreme temperature indices can be more representative than common mean temperature.
- 37 -
Poster Presenter: Varduhi Margaryan – The Dynamics Change of Average Annual Values of Air Temperature in Instrumental Period (On The Pattern of Mountainous Territory of the Republic of Armenia) V. Margaryan Yerevan State University, Department of Physical Geography and Hydrometeorology, Faculty of Geography and Geology, Yerevan, Armenia, Alek Manoukian Street,1, 0025, Tel: (+ 374 98) 868740, Fax: (+ 374 10) 554641, Email: [email protected]
Air temperature is characteristics of situation on of links of climatic system (atmosphere). So, clarifying and estimation of regularities of temporal distribution of air temperature has importance, especially for more accurate definition of thermal balance, for productive using of thermal resources. Today the effects of climate change are felt around the world and Armenia is not an exception. Armenia is characterized by vulnerable mountainous ecosystems, arid climate, an active process of desertification and natural disasters are often observed, which makes the country more vulnerable the impacts of climate change. Air temperature is characteristics of links of climatic system (atmosphere). So, clarifying and estimation of regularities of temporal distribution of air temperature importance, especially for more accurate definition of thermal balance, for productive using of thermal resources. Given the above, the purpose of the work was to identify, analyze and assess the patterns of change in the dynamics of air temperature in the Republic of Armenia. For solving of suggested problems as a theoretical base have been used appropriate researches, as a raw material - actual data of long-term observations of air temperatures the meteorological station of the territory of republic for last 100 years, which are kept in the fond of Armstatehydromet of the Ministry of Territorial Management and Emergency Situations. As a methodological base in the work have been applied methods: mathematic-statistical, geographical, extrapolation, analysis, correlation, complex. In study area the values of average annual air temperature are within 14.3 ºC (Meghri) and -2.6 ºC (Aragats). During the year the warmest months are July-August, with average monthly temperature 9.0…27.0 ºC, and the coldest month are January with average monthly temperature –12.7…1.5 ºC. After researches became clear, that observes a tendency of increase of average annual values of air temperature in the territory the Republic of Armenia. And changes of air temperature in the different regions of Armenia in different seasons have different tendencies. So, for future prevention or decrease of air temperature is very important planting of greenery and creation of little basins. On the other hand it have to monitor the realization and care these works. The change of air temperature will its inevitable consequence on change of components of hydrothermal balance study area, on a violation of the ecological balance of natural ecosystems, as well as the social, environmental and economic development of study area. Therefore, to adapt to changing temperature needs an ecosystem approach, for mitigation – implementation of complex measures for adaptation. In Armenia air temperature changes have been estimated for different periods, and results have been used in first and second national messages of Climate Change of RA. The results show, that during last ten-years period in Armenia observes increasing of air temperature. During 1935-96 period for comparison to basic period (1961-1990) average annual temperature increased on 0.4 ºC, in 1935-2007 period – 0.85 ºC, in 1935-2012 period - on 1.03 ºC. It means that the temps of temperature increasing increased. Since 1994 the deviations of average annual temperature in comparison with average temperature in 1961-
- 38 -
1990 were only positive. By the forecasts of ECHAMS, GFDL, GISSER, HadCM3 models in Armenia predicts annual increase of air temperature for 1.1-1.5 ºC in 2011-2040, 2.0-3.0 ºC in 2041-2070, and 3.5-5.5 ºC – in 2071-2100. So, in the results of studies we have the following conclusions and suggestions: • In perennial observations notes a tendency of increase of annual average values of air
temperature; • Have been made many researches, but there are not studies systemized of reasons of air
temperature change yet, and existed are just for some sides of it. So, is better to continue studies and to develop future forecasts, using new models;
• Estimation of problems of air temperature dynamics change will get right solving, when will be known the relations, which it have with other components of nature area complex in conditions of direct influence of human.
Is necessary: • Providing of meteorological stations with modern equipment (especially automatic); • Developing of notification of population about the climate change; • Evaluation of the vulnerability of ecosystems as a result of changes in air temperature; • Realization legal-organization, institutional, technical arrangements for adaptation of
economy to new natural conditions and soften of climate change consequences; • Strengthening of scientific studies of climatic problems and implementation of new
technologies; • Working out of real climatic scenarios; • Working out of the programs for softening the negative effects of air temperature change; • Financial satisfy support from government and other donor organizations made
implementations must be visible for society, directed for realization of specific programs and have control by some organs;
• Providing of modern ways of availability and outspread of information; • Working out and implementation of qualification programs, organization of studying
processes, development of specialists’ qualification; • Realization and providing international scientific-educational cooperation, strengthening of
inter-agency cooperation.
Poster Presenter: Patricia Miloslavich – Identifying priorities for global monitoring of marine biology and ecosystems N. Bax1, S. Simmons2, P. Miloslavich3, W. Appeltans4, M. Andersen5, A. Fischer6, J. Gunn3, F. Marsac7
1. Commonwealth Scientific and Industrial Research Organisation (CSIRO), Australia 2. Marine Mammal Commission, USA 3. Australian Institute of Marine Science, Australia 4. Intergovernmental Oceanographic Commission (IOC) of UNESCO, IOC Project Office for IODE, Belgium 5. NOAA Fisheries, USA 6. Intergovernmental Oceanographic Commission (IOC) of UNESCO, Ocean Observations and Services Section, France
The Biology and Ecosystems Panel of GOOS aims to develop and coordinate efforts in the implementation of a sustained and targeted global ocean observation system driven by societal needs to include biological and ecosystem Essential Ocean Variables (EOVs). This system will answer relevant scientific and societal questions, and facilitate critical policy development and management decision-making on ocean and coastal resource sustainability and health. Biological and ecosystems EOVs must support management actions, comply with international conventions, and help predict how marine biodiversity and ecosystems will change in the future under increasing anthropogenic pressures. To identify biological and ecosystem EOVs, we are adapting the Framework for Ocean Observing to a DPSIR model (Drivers-Pressures-State-
- 39 -
Impact-Response). To identify societal drivers and pressures requiring sustained global ocean observations, we reviewed the goals and societal issues addressed by nearly 30 major international bodies/conventions. Main drivers identified in these conventions were the need of: knowledge (science/data access), development (sustainable economic growth), conservation (biodiversity and ecosystems), sustainable use (biodiversity and resources), environmental quality (health), capacity building (technology transfer), food security, threat prevention and impact mitigation (to different pressures), management improvement (integrate ecosystem approach). The main pressures identified were climate change, ocean acidification, extreme weather events, overfishing/ overexploitation, pollution/ eutrophication, mining, solid wastes. To establish the current state of ocean observation of biological and ecosystem variables, we will survey the major global and large-scale regional observing networks or programs, to learn the extent in terms of geographic area, temporal scale, spatial scale, variables measured, availability and readiness of data that they are covering. By following this process, the GOOS BioEco Panel will be able to develop a global monitoring program that is globally relevant; accessible to participants from developing, emerging and developed economies; build on and facilitate existing structures and groups; and scientifically transparent.
Poster Presenter: Thomas Nagler – The International Snow Products Intercomparison and Evaluation Exercise - SnowPEx T. Nagler1, G. Bippus1, C. Derksen2, R. Fernandes3, K. Luojus4, O.P. Mattila5, S. Metsämäki5, E. Ripper1, H. Rott1, R. Solberg6, B. Bojkov7
1. ENVEO IT GmbH, Innsbruck, Austria 2. Environment Canada, Toronto, Canada 3. Canada Centre for Remote Sensing, Ottawa, Canada 4. Finnish Meteorological Institute, Helsinki, Finland 5. Finnish Environment Institute, Helsinki,Finland 6. Norwegian Computing Center, Oslo, Norway 7. ESA/ESRIN, Frascati, Italy
Terrestrial snow cover is one of the Essential Climate Variables recommended by GCOS to be operationally monitored by means of satellite data. For climate research the quality of the satellite-based snow cover products is critical. The Snow Products Intercomparison and Evaluation Exercise (SnowPEx) is an international collaborative effort, funded by the ESA under the Quality Assurance framework for Earth Observation (QA4EO) in response to requirements from the WMO Global Cryosphere Watch (GCW). SnowPEx compares and evaluates satellite-based snow cover products of hemispheric to global extent, assesses the product accuracy, and identifies discrepancies between the various products. Furthermore, in support of climate studies, trends in the hemispheric seasonal snow coverage and snow mass are documented, based on an ensemble of satellite based snow products. Within two international workshops held in 2014 and 2015, the community consolidated the protocols and discussed results of the intercomparison and validation of the products and of the multi-dataset snow cover trends from various products. SnowPEx focuses on two parameters of the terrestrial snow cover, the snow extent (SE) from moderate resolution optical satellite data (MODIS, AVHRR, etc.) and the snow water equivalent (SWE) from passive microwave data (SSM/I, AMSR). Overall, 14 continental to global satellite SE products and 3 satellite based SWE products are participating in SnowPEx, with test areas spreading out over different environments and climate zones. For intercomparison, daily SE products from 5 years have been transformed to a common map projection and standardized evaluation protocols, developed within the project, are applied. The SE product evaluation applies statistical measures for quantifying the agreement between the various products, including the analysis of spatial patterns. Extensive validation of SE products is carried out using high resolution snow maps from about 450 Landsat scenes. In addition, in-situ snow
- 40 -
reference data are used in North America and Eurasia. The comparisons reveal statistical differences between various SE products of up to 30%, depending on the land surface type and complexity of terrain. SWE products at coarse spatial resolution from passive microwave sensors are evaluated against in-situ networks of snow mass measurements. The SWE products are also compared with gridded snow products from land surface models driven by atmospheric reanalysis. In addition, multi-year trends of various products are evaluated. We provide an overview on the contributing snow products, the protocols and the results of the intercomparison and evaluation of snow products, and report on multi-decadal trends in the various data sets. Further information on SnowPEx is available at https://earth.esa.int/web/sppa/activities/qa4eo/snowpex.
Poster Presenter: Toshiya Nakano – A long-term reference for detecting oceanic variations in the western North Pacific: JMA 50-year long 137°E repeat hydrographic section T. Nakano1,2, K. Murakami1, H. Inoue1,2, Y. Takatani1,2, A. Kojima1,2, M. Kitamoto1,2, M. Ishii2,1,E. Oka3, S. Katsura3, S. Sugimoto4, T. Suga4 1. Japan Meteorological Agency, Tokyo, Japan 2. Meteorological Research Institute, Tsukuba, Japan 3. Atmosphere and Ocean Research Institute, The University of Tokyo, Kashiwa, Japan 4. Department of Geophysics, Graduate School Science, Sendai, Tohoku University
Japan Meteorological Agency has been conducting ship-based repeat hydrographic and biogeochemical observations along the 137°E meridian since 1967 for winter and since 1972 for summer, and we celebrate its 50th anniversary this year. The 137°E section extends from 34°N south of Japan to 3°N off New Guinea, crossing major currents such as Kuroshio, North Equatorial Current (NEC), and North Equatorial Countercurrent (NECC) and major water masses such as Subtropical Mode Water (STMW), North Pacific Tropical Water (NPTW) and North Pacific Intermediate Water (NPIW) in the subtropical and tropical gyres. The 137°E section, as one of the GO-SHIP high-frequency repeat sections, has provided a comprehensive set of physical and biogeochemical measurements, including temperature, salinity, dissolved oxygen, nutrients and carbonate system parameters. The repeat survey along 137°E has been playing an important role as a long-term reference for detecting variations in ocean circulation, oceanic structure and air-sea interactions in the North Pacific, including those related to climate change. For example, the three major water masses mentioned above had significant decadal-scale (about 10 years) variations. These variations were associated with the variability of wind stress field in the central North Pacific characterized by two types of Aleutian Low (AL) changes: a change in the magnitude of AL and meridional movement of AL. The variation in the distribution of the STMW and NPTW were related to large eddy activity in the Subtropical Countercurrent and subtropical front regions between 15°N and 25°N. Furthermore, the137°E section revealed long-term changes of salinity and temperature in the surface and intermediate layers. Rapid freshening on both isobars and isopycnals began in mid-1990s and persisted for the past 20 years in the subtropical gyre. The freshening trend was strongest in STMW in the upper main thermocline, and also existed in a deeper layer corresponding to the Central Mode Water, extending over the whole ventilated thermocline/halocline. Trends of CO2 increase and acidification have also been clearly observed in both surface and interior of this section.
Poster Presenter: Vishnu Rajendra Kumar – Understanding Regional Climatic Change with Glacier Terminus Fluctuations in Sikkim Himalaya, India Vishnu Rajendra Kumar Dr Harisingh Gour Central University, Sagar, Madhya Pradesh, India, 470003
Glaciers being one of the most sensitive indicators of climate change contain huge repository of landforms that can be used as proxy data source to assess magnitude and frequency of
- 41 -
processes over time and space. Sikkim state lies in the Eastern Himalaya with climatic settings range from tropical to cryospheric and dominated by SW monsoon, followed by the winter rain from the South China Sea as well as the Mediterranean Westerly which directly influence the behavior of glaciers in the region. In such geo-climatic settings even any smaller changes in climate will be reflected very well in the secular movement of glaciers in region. We assessed 26 glaciers based on remote sensing data (1975 to 2014) and several field visits to the glaciers in the Sikkim Himalaya. In addition, we also assessed the impact of climatic parameters from 1957 to 2005, along with non-climatic parameters on glacial terminus behavior. On an average, glaciers retreated at ̴ 6.89 m yr -1 from 1975 to 2014 which is lower than other parts of the Himalaya as reported. Moreover, annual average temperature decreased (-0.24 oC) and precipitation increased (19.79 mm) during 1957-2005 at Gangtok station in Sikkim Himalaya. Out of 26 assessed glaciers, 15 glaciers remained stationary, and 11 glaciers retreated with varied rates. Only two glaciers retreated continuously for the entire assessment period. Temporally, the average rate of retreat increased from 6.60 m yr -1 (1975-1988) to 7.04 m yr -1 (1988-2000), 10.86 m yr -1 (2000-2005), which drastically reduced to 1.47 m yr -1 during 2005-2009. It is followed by an increased average rate of retreat of 7.66 m yr -1 between 2009 and 2014. Dissimilar patterns of glacial retreat for the entire Sikkim Himalaya in general, and within 10 km wide buffer zones, in particular, suggest a weak control of general climate on glacial fluctuations in this region. Moreover, non-climatic parameters have shown a strong control on glacier fluctuations as the glaciers with glacial lakes, glaciers with simple form, glaciers with snout aspect to E, SW, and ES and glaciers with a length below 7 km show higher rates of retreat than the others. Keywords: Sikkim Himalaya, Glaciers, climate change, non-climatic factors.
Poster Presenter: Nick Rayner – A perspective on observing system needs for some aspects of climate science and services N. Rayner Met Office Hadley Centre, Exeter, UK
Recently, we undertook an internal review of observational needs for some aspects of climate science, including improving climate projections, early warning of abrupt changes and operational monitoring and attribution. Here we reflect on what this means for the Global Climate Observing System. The evolving needs of climate science and services pose significant challenges for our observing system. In particular: the spatial and temporal resolution of the information needed is increasing; and the need to evaluate certainty in our observations requires that independent subsets of the observing system for any particular ECV are maintained, e.g. in order to assess stability of a long-term record, we require independent, stable reference data. There are some key observing system components upon which many climate research applications critically depend, including: the Argo array; satellite retrievals and in situ measurements of sea surface temperature; meteorological station measurements of temperature, precipitation, pressure, wind, etc; satellite retrievals of sea ice extent and thickness. Consistent observational information is often needed covering many decades, or the past century or two. This is particularly true when assessing our past and current vulnerability to extreme events and putting their projected future occurrence into that context, or in assessing surface temperature change relative to pre-industrial temperatures; the latter requires that we have a good understanding of what pre-industrial temperatures actually were. This means that, as well as maintaining observing systems into the future, we must
- 42 -
ensure that we derive maximum benefit from past observations that were made, but remain locked in paper archives; they need to be digitised. This need for consistency over many decades requires detailed understanding about how the measurements that have been made at one time in the past or in a certain location relate to other measurements from other times or other places; here again, apparent “redundancy” of different parts of the observing system and adequate metadata are essential in order that different types of measurements can be properly reconciled. As we move into an era of operational climate services, in many cases, observational information for an ECV needs to be delivered in near-real-time (within a day of measurement) or in short-delay mode (within two or three days of measurement) and that information needs to be consistent with the long-term record of that ECV. This is a tough challenge, but one that we need to address for services like climate-related event attribution, or seasonal forecasting.
Poster Presenter: John Remedios – Progress towards long-term land surface temperature datasets for climate studies J. Remedios1, D. Ghent1, C. Bulgin2, F. Goettsche3, S. Hook4, G. Hulley4, C. Jimenez5, C. Merchant2, S. Pinnock6, C. Prigent5, L. Schueller7, I. Trigo8, Y. Yu9 1. National Centre for Earth Observation, University of Leicester, UK 2. National Centre for Earth Observation, Dept. of Meteorology, University of Reading, UK 3. KIT, Karlsruhe, Germany 4. JPL, Pasadena, USA 5. L'Observatoire de Paris, Paris, France 6. European Space Agency, ECSAT, Harwell 7. Eumetsat, Darmstadt 8. IPMA, Lisbon, Portugal 9. NOAA/NESDIS, USA Hadley Centre, Exeter, UK
Land surface temperature (LST) is the mean radiative temperature of all objects comprising a surface, as measured by ground, air and spaceborne sesnors. It provides the thermodynamic temperature driving outgoing longwave flux (surface to atmosphere and space); differences with air temperature control sensible heat. The increasing availability of long-term LST data and a much improved understanding of LST have galvanized an increasing number of climate users, e.g., better representations of near-surface air temperature; diagnosis of dry spells in climate models; time series of surface temperature for the Arctic. LST is recognized as an important, driving physical variable for the land surface in the climate system, controlling partitioning of energy and fluxes of water/carbon. In this presentation, we overview the high quality and applicability of the longest serving (> 15 years), single sensor family data sets available from the thermal infrared instruments, the Along Track Scanning Radiometers (ATSR) and Moderate Resolution Spectro-radiometers (MODIS). We show how algorithm performances have been verified and validated, emphasizing the effects of new knowledge of emissivity, treatment of water vapour and handling of cloud effects. The efficacy of LST records for climate has been much improved by: estimation of contextual, pixel-level uncertainties; diurnal data sets from geostationary orbit (particularly the SEVIRI instrument); characterization of clear versus cloudy sky bias through the use of re-analyzed microwave data. We highlight significant progress and provide a summary of state-of-the-art for future long-term data sets and analyses for LST; geostationary and microwave data will play key roles.
- 43 -
Progress in LST has been greatly enhanced through the efforts of the CEOI WGCV LPV subgroup (http://lpvs.gsfc.nasa.gov/LST_home.html) and a new collective, the International Land Surface Temperature and Emissivity Working Group (ILSTE-WG) unifying users and providers (http://ilste-wg.org/); support has been provided by the ESA GlobTemperature and NASA Measures projects.
Poster Presenter: Vishwambhar Prasad Sati – Climate Change and its Implications: a Study on Perceptions, Adaption and Resilience in the Himalayan Region Vishwambhar Prasad Sati Department of Geography and Resource Management, Mizoram University, Aizawl – 796004, Mizoram, India
Climate change has become a burning and comprehensive issue worldwide. The Himalayan region characterizes highly elevated snow clad peaks, numerous glaciers, unstable slopes and fragile ecosystems that form the Himalaya vulnerable to climate change. This paper examines climate change and its implication in the Himalayan region. We conducted an empirical study on people’s perceptions, adaptation and resilience, and carried out a case study of two villages of the Garhwal Himalaya and 16 villages of Mizoram, the eastern extension of the Himalaya. Household level survey was conducted and total 1567 households were surveyed. The result shows that climate change has severe repercussions on land use pattern, cropping pattern and occupation in both regions. Melting of the Himalayan glaciers, low production and yields of crops, shifting of fruit crops and floral species towards the higher elevation, arable land abandonment and out migration are the major implications of climate change observed in the Garhwal Himalaya. Similarly, changing pattern of cultivation from shifting to permanent and changes in occupation have been observed in Mizoram. People’s perception on climate change is unanimous in both regions. Our study shows that about 90% people perceived climate change impact on agriculture and human occupation. In Mizoram, a number of people perceived that climate change has positive impact on agriculture and livestock production. The study suggests that adaptation and resilience of climate change through adopting area specific policy measures in both regions may cope with the menace of climate change.
Poster Presenter: Roger Saunders – The ESA Climate Modelling User Group’s assessment of satellite climate datasets R. Saunders1 and the Climate Modelling User Group2,3,4,5,6, 7, 8 1. Met Office, Exeter, U.K. 2. ECMWF, Reading, U.K. 3. MétéoFrance, Toulouse, France 4. Institut Pierre Simon Laplace, Paris, France 5. DLR, Oberpfaffenhofen, Germany
6. Ludwig Maximilian University of Munich, Munich, Germany 7. Max-Planck Institute, Hamburg, Germany 8. SMHI, Norköpping, Sweden
The ESA Climate Change Initiative (CCI) programme has been in operation for over five years now and climate quality satellite datasets are becoming available for 13 Essential Climate Variables (ECVs). The Climate Modelling User Group (CMUG) aims to bring together climate modelers and ocean/atmosphere reanalysis activities with the CCI efforts in order to minimize the time between the dataset production and their use by climate researchers. It does this in a number of ways. Firstly by evaluating the new climate data records to assess if they are ‘fit for purpose’ and reporting back any issues to the teams generating the datasets. CMUG provides an independent quality assurance role here. With CCI Phase 1 data now available the CMUG has started publishing the results of its independent analyses of these data. An assessment by CMUG of the CCI Phase 1 climate data records for several ECVs including sea surface temperature, ocean colour, sea level, soil moisture, land cover, aerosol and ozone datasets will be presented. New results showing consistency between the ECVs from the integrated CMUG assessments and through assimilation experiments will also be shown. These results help to build confidence in the quality of the CCI datasets. Another activity for CMUG is to develop the
- 44 -
tools necessary for assessing the CMIP5 climate model predictions using the CCI observational datasets. The results for some ECVs using this ESMVAL tool will be shown. Thirdly the plans for the delivery of these new CCI datasets to the climate research community will also be discussed as will the use of climate modeling, reanalyzes and CCI data for emerging climate services.
Poster Presenter: Jinho Shin – Development of estimation method for essential climate variables using satellite data in South Korea
J. Shin1, G. Ryu1, N. Park1, J, Ryu1, S. Lyu1, I. Shin1, K. Han1
1. National Meteorological Satellite Center, South Korea 2. Pukyong National University, South Korea
In order to produce a grid-based climate data for climate change monitoring and applying for climate models, and to provide a systematic advantage of the climate data applications through the quality control of the satellite data, Korea Meteorological Administration(KMA) of South Korea has conducted a project which is to continue to produce a satellite-based Essential Climate Variables (ECVs). This project conducted in 2014 represents the establishment of a long-term plan for the development of ECVs and retrievals of Sea Surface Temperature (SST), Outgoing Longwave Radiation (OLR), and Insolation (INS) that ECV products using Communication, Ocean and Meteorological Satellite (COMS), also known as Thematic Climate Data Records (TCDR). Also, the project carried out a primary research of Level 3 data product using SST products. First, this project provides a proposed procedure for the long-term plan for the TCDR, ECV production from COMS, include the initial development phase, continuing development and steady production phase, continuous production and services provision phase that each phase was specified with action plans. The phases were developed taking into account KMA’s international contribution for Sustained and coordinated processing of Environmental Satellite data for Climate Monitoring (SCOPE-CM) and priorities of the plan such as continuous production using the methodologies described in this project. In addition, the section includes an implementation plan for satellite-based standard climate Database. One of ECVs, SST was retrieved using 3 years of COMS data from April 2011 to March 2014 using infrared channel that are intercalibrated using annual or monthly Global Space-based Inter-Calibration System (GSICS) coefficients. Each product of SST whose channel is not calibrated, or calibrated using either annual or monthly GSICS coefficients was then analyzed and validated its performance. The results showed that SST products using GSICS coefficients had improved RMSE that GSICS calibration is considered a significant factor for improving quality of COMS SST production. Also, we found the Nighttime SST was not as affected by GSICS correction as the Daytime SST when two were compared that Nighttime SST maintained high accuracy since solar radiation has relatively less impact. We found from our analysis that both annual and monthly GSICS corrections have similar degree of improvements of SST accuracy. We assessed the impacts of the GSICS intercalibration on COMS-based OLR products. The data include infrared data (6.7 μm, 10.8 μm, 12.0 μm) of 3-year accumulation from April 2011 to 1 March 2014. We retrieved OLR in accordance with COMS Meteorological Data Processing System (CMDPS); also, we produced OLR applying GSICS annual and monthly coefficients. In order to validate its performance, we used Clouds and the Earth's Radiant Energy System (CERES), a sensor use broad-band to retrieve OLR, that we have found the OLR product used annual GSICS coefficients had the least difference with the reference data CERES. The GSICS corrected OLR had overall improvement of the data quality, but the difference between GSICS corrected and original OLR was trivial. We suspect that the spectral integration for the OLR production process negate the difference of GSICS corrected and original infrared channels.
- 45 -
Obtaining improved quality of OLR has significant of KMA’s involvement in SCOPE-CM. We have produced and analyzed insolation products both calibrated using annual and monthly coefficients of GSICS and not calibrated. The data used were COMS Level 1from beginning of April in 2011 to end of March in 2014, and the product procedure was obtained from the CMDPS. For the validation, we obtained ground truth data from37 stations operated by the KMA. We found from the validation that the difference of accuracy of products used annual GSICS coefficients and monthly GSICS coefficients were trivial. By comparing original INS and GSICS corrected INS, we found that the bias were significantly improved although only RMSE had minor changes. Especially in case of 13 × 13 pixels all covered by cloud, bias has been improved by up to 26.30099W/m2. The results conclude that GSICS correction of visible channel secured improved production of INS. KMA has further secured climate variable products for participation in the SCOPE-CM. Finally, we developed algorithms for producing the SST the Level 3 data and validated the products. The Level 3 data was transformed from the satellite data into equal-grid, and then they were composited daily and averaged over 5-day (penta) and annually. The results of validation indicate that original Level 3 does not show significant difference of accuracy with the Level 2 SST. However, daily composite and long-term average data had cold-bias which can be contributed by the fact that the method for removing pixels from eliminating clouds. Thereby, the improvement of quality control of cloud identification process and the in-situ observations for SST were discussed.
Poster Presenter: Bernadette Sloyan – Changes in Ocean Heat, Carbon Content and Ventilation: A review of the first decade of GO-SHIP global repeat hydrography B.M. Sloyan1, L.T. Talley2, R. A. Feely3, R. Wanninkhof4 1. Commonwealth Scientific and Industrial Research Organisation (CSIRO), Hobart, Tasmania, Australia 2. Scripps Institution of Oceanography, University of California, San Diego, La Jolla, California 3. Pacific Marine Environmental Laboratory, National Oceanic and Atmospheric Administration, Seattle, Washington 4. Atlantic Oceanographic and Meteorological Laboratory, National Oceanic and Atmospheric Administration, Miami, Florida
Global ship-based programs, with highly accurate, full water-column physical and biogeochemical observations repeated decadally since the 1970s, provide a crucial resource for documenting ocean change. The ocean, a central component of Earth’s climate system, is taking up most of Earth’s excess anthropogenic heat, with about 19% of this excess in the abyssal ocean beneath 2,000 m, dominated by Southern Ocean warming. The ocean also has taken up about 27% of anthropogenic carbon, resulting in acidification of the upper ocean. Increased stratification has resulted in a decline in oxygen and increase in nutrients in the Northern Hemisphere thermocline and an expansion of tropical oxygen minimum zones. Southern Hemisphere thermocline oxygen increased in the 2000s owing to stronger wind forcing and ventilation. The most recent decade of global hydrography has mapped dissolved organic carbon, a large, bioactive reservoir, for the first time and quantified its contribution to export production (~20%) and deep-ocean oxygen utilization. Ship-based measurements also show that vertical diffusivity increases from a minimum in the thermocline to a maximum within the bottom 1,500 m, shifting our physical paradigm of the ocean’s overturning circulation.
- 46 -
Poster Presenter: Reiner Steinfeldt – Decadal Changes in the Storage of Anthropogenic Carbon in the Atlantic R. Steinfeldt1, D. Kieke1, T. Tanhua2, E. Jeansson3, M. Rhein1
1. University of Bremen, Institute of Environmental Physics, Bremen, Germany 2. GEOMAR Helmholtz Centre for Ocean Research, Kiel, Germany 3. Uni Research Climate, Bjerknes Centre for Climate Research, Bergen, Norway
The oceans play a significant role in the storage of anthropogenic carbon (Cant). At present, about 25% of the anthropogenic CO2 emissions are stored in the global ocean, thus mitigating the greenhouse effect and global warming. The North Atlantic shows the highest column inventories of Cant due to the formation of deep water such as Labrador Sea Water and Overflow Waters from the Nordic Seas. In the subtropics, the majority of Cant is found in mode waters, and further south the Antarctic Intermediate Water plays a significant role in the storage of Cant. Here we use 30 years of CFC observations including those from WOCE and CLIVAR to calculate the concentrations of Cant and its variability. Column inventories are computed on decadal intervals, centered around 1990, 2000, and 2010. It is investigated, in how far the changes of Cant inferred from tracer data via the TTD method agree with the changes of total carbon for each water mass. Also the biogenic contribution of carbon changes inferred from oxygen and alkalinity data will be considered.
Poster Presenter: Andreas Sterl – 15 years of Argo – the importance of observing the interior ocean A. Sterl KNMI, De Bilt, The Netherlands
More than 90% of the excess energy entering the climate system goes into the ocean. Due to the large heat capacity of the ocean as compared to the atmosphere, small changes in this percentage can induce large changes in the atmosphere. Therefore, a good knowledge of ocean heat content variations is essential to understand climate variability and change. However, in the ocean the heat is out of sight of most observing systems. Satellites only see the upper millimetre or so of the ocean, and ship-board measurements are expensive and consequently sparse. The situation changed in 2000, when the Argo program started. Argo floats are autonomous devices that drift freely in the ocean. Every ten days, they actively move up and down through the water column down to a depth of 2 km and measure vertical profiles of temperature and salinity. Presently, nearly 4000 of these floats are active, providing a wealth of data from all parts of the ocean, including those that are hard to reach by ship like the Southern Ocean. The vast amount of data gathered since 2000 has greatly improved our knowledge of the ocean. It is possible to derive closed heat and sea level budgets for the ocean, revealing, e.g., that the excess heat has mainly been stored in the Southern Ocean. Investigating the drift of the floats it has been possible to derive flow patterns in the ocean interior that would be hard or even impossible to obtain by other means. As technology improves it becomes possible to widen the scope of Argo measurements. It is becoming possible to go deeper than 2 km, and sensor development makes it possible to equip Argo floats with bio-geochemical sensors (e.g., O2, chlorophyll, pH). The latter development will make it possible to investigate the interplay between physical and biological processes in the ocean.
- 47 -
Poster Presenter: Ad Stoffelen – Measuring atmosphere-ocean interaction Ad Stoffelen1, Frank Wentz2 1. KNMI, de Bilt, The Netherlands 2. RSS, Santa Rosa, California, USA
The exchange of momentum, heat, moisture and other constituents between the atmosphere and the ocean is key in the understanding of climate processes. The ocean surface wind or stress strongly affects these exchange processes and is observed for several decades by microwave scatterometers and radiometers. The International Ocean Vector Winds Science Team (IOVWST) climate working group addresses inter-sensor comparisons and satellite inter-calibration to achieve a seamless wind and surface stress climate data record for the active and passive instruments at varying operating wavelengths. Mesoscale interaction, moist convection dynamics, diurnal variability, circulation patterns and oscillations can be assessed in these observation records, as well as the evolution of extreme events over time. The calibration efforts against in situ observations furthermore enhance reanalysis products and help evaluate their representation of the above-mentioned processes. Reanalyses and CMIP5 climate models show systematic differences against the observed records, particularly in the extensive tropical and subtropical regions, which will be illustrated at the meeting. Other activities of the IOVWST are the calibration of extreme winds, the derivation of ocean forcing (stress) products and the evaluation of winds in coastal seas and near marginal ice zones, which will be briefly addressed.
Poster Presenter: Nandin-Erdene Tsendbazar – Spatial uncertainties and user-oriented data production for land cover Nandin-Erdene Tsendbazar, Sytze de Bruin, Martin Herold, Valerio Avitabile and Brice Mora Laboratory of Geo-Information Science and Remote Sensing, Wageningen University, P.O. Box 47, 6700 AA Wageningen, The Netherlands
Global scale land cover (LC) mapping has interested many researchers for last two decades as it is an input data source for various applications. However, current global land cover (GLC) maps often do not meet the accuracy and thematic requirements of multiple users. Along with the creation of new maps, current efforts for improving GLC maps focus on integrating existing maps. Such integration efforts may benefit from the use of multiple GLC reference datasets. Using available reference datasets, we aimed to asses spatial accuracy of recent GLC maps and integrate GLC datasets for creating an improved map. We attempted to address the thematic requirements of multiple users by demonstrating a concept of producing GLC maps with user-specific legends. Spatial correspondence with reference dataset was modelled for Globcover-2009, Land Cover-CCI-2010, MODIS-2010 and Globeland30 maps for a continental scale, Africa. Using a regression kriging method, the recent GLC maps and reference datasets were integrated to create an improved GLC map. Based on LC class probability maps produced from this integration, expected area fraction maps for LC classes at coarser resolution were created and used for characterizing additional mosaic classes that can be useful for users namely land system models and biodiversity assessments. Comparison of the spatial correspondences showed that the preferences for GLC maps varied spatially and this supports the notion of integrating GLC maps based on their relative strengths such as spatial accuracy. An integrated GLC map was created and overall correspondence with reference LC was 80% based on 10-fold cross validation of 24681 sample sites. This was globally 10% and regionally 6-13% higher than the correspondence of the input GLC maps. Furthermore, two GLC maps with user-specific legends for land system models and biodiversity assessments were created using expected area fraction maps of LC classes. Our results demonstrate the added value of using reference datasets and geostatistics for
- 48 -
improving GLC maps. This finding further motivates the efforts of releasing available reference datasets to the public by international communities such as the GOFC-GOLD and Geo-Wiki portal. As more and more reference datasets are becoming available to the public, GLC mapping can be further improved by using the pool of all available reference datasets. Area fraction maps of LC classes make the translation to required user-specific legends namely mosaic classes easier and thus can address the thematic requirements of multiple users. Future GLC mapping efforts are recommended should consider this into account.
Poster Presenter: Karin Veal – Relating trends in land surface-air temperature difference to soil moisture and evapotranspiration Karen Veal1, Chris Taylor2, Belen Gallego-Elvira2, Darren Ghent1, Phil Harris2, John Remedios1 1. University of Leicester, Leicester, UK 2. Centre for Ecology and Hydrology, Wallingford, UK
Soil water is central to both physical and biogeochemical processes within the Earth System. Drying of soils leads to evapotranspiration (ET) becoming limited or “water-stressed” and is accompanied by rises in land surface temperature (LST), land surface-air temperature difference (delta T), and sensible heat flux. Climate models predict sizable changes to the global water cycle but there is variation between models in the time scale of ET decay during dry spells. The e-stress project is developing novel satellite-derived diagnostics to assess the ability of Earth System Models (ESMs) to capture behaviour that is due to soil moisture controls on ET. Satellite records of LST now extend 15 years or more. MODIS Terra LST is available from 2000 to the present and the Along-Track Scanning Radiometer (ATSR) LST record runs from 1995 to 2012. This paper presents results from an investigation into the variability and trends in delta T during the MODIS Terra mission. We use MODIS Terra and MODIS Aqua LST and ESA GlobTemperature ATSR LST with 2m air temperatures from reanalyses to calculate trends in delta T and “water-stressed” area. We investigate the variability of delta T in relation to soil moisture (ESA CCI Passive Daily Soil Moisture), vegetation (MODIS Monthly Normalized Difference Vegetation Index) and precipitation (TRMM Multi-satellite Monthly Precipitation) and compare the temporal and spatial variability of delta T with model evaporation data (GLEAM). Delta T anomalies show significant negative correlations with soil moisture, in different seasons, in several regions across the planet. Global mean delta T anomaly is small (magnitude mostly less than 0.2 K) between July 2002 and July 2008 and decreases to a minimum in early 2010. The reduction in delta T anomaly coincides with an increase in soil moisture anomaly and NDVI anomaly suggesting an increase in evapotranspiration and latent heat flux with reduced sensible heat flux. In conclusion there have been distinct signals in delta T during recent decades and these provide an independent assessment of hydrologically-forced changes in the land surface energy balance which can be used as a metric for the assessment of Earth System Model and global surface flux products.
Poster Presenter: Bert Wouters – Global land ice trends from satellite altimeter and gravity missions Bert Wouters1, Jonathan L. Bamber2 1. Institute for marine and atmospheric research Utrecht, Utrecht University, The Netherlands 2. University of Bristol, Bristol, UK
Ice sheets, glaciers and ice caps are major contributors to current sea level change and ice losses have been increasing in recent decades. Yet, their remote location and vast sizes make it challenging to obtain a comprehensive picture of these changes from in-situ measurements
- 49 -
alone. Remote sensing observations are therefore of paramount importance to monitor the Earth’s ice covered regions. This presentation will show how satellite measurements can be used to derive reliable estimates of ice mass loss, and the progress that has been made in this domain in the last decade. We focus on elevation measurements made by NASA’s ICESat laser and ESA’s Cryosat-2 radar altimeter missions and combine their observations with results from the Gravity Recovery and Climate Experiment, which measures changes in the Earth’s gravity field. The results for Greenland, Antarctica and the Arctic glaciers and ice cap show that these glaciated regions can respond rapidly to changes in the atmosphere and ocean and highlight the importance of continuous, global monitoring of the cryosphere.
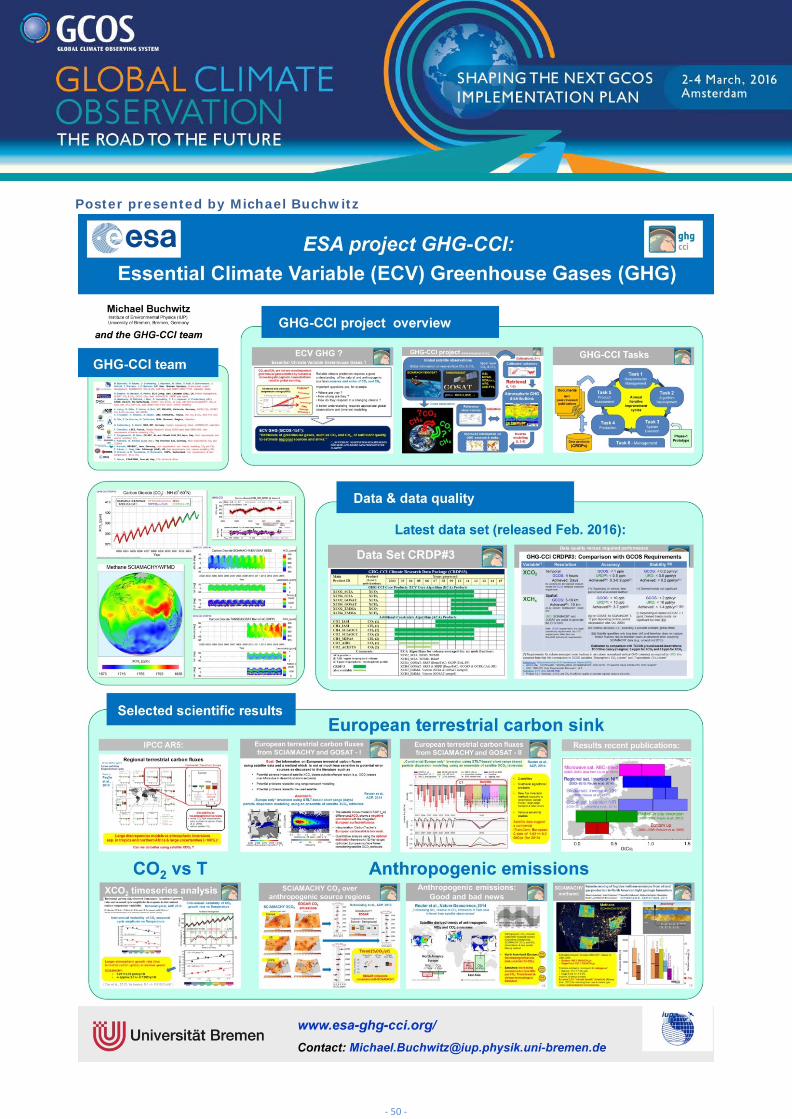
- 50 -
Poster presented by Michael Buchwitz
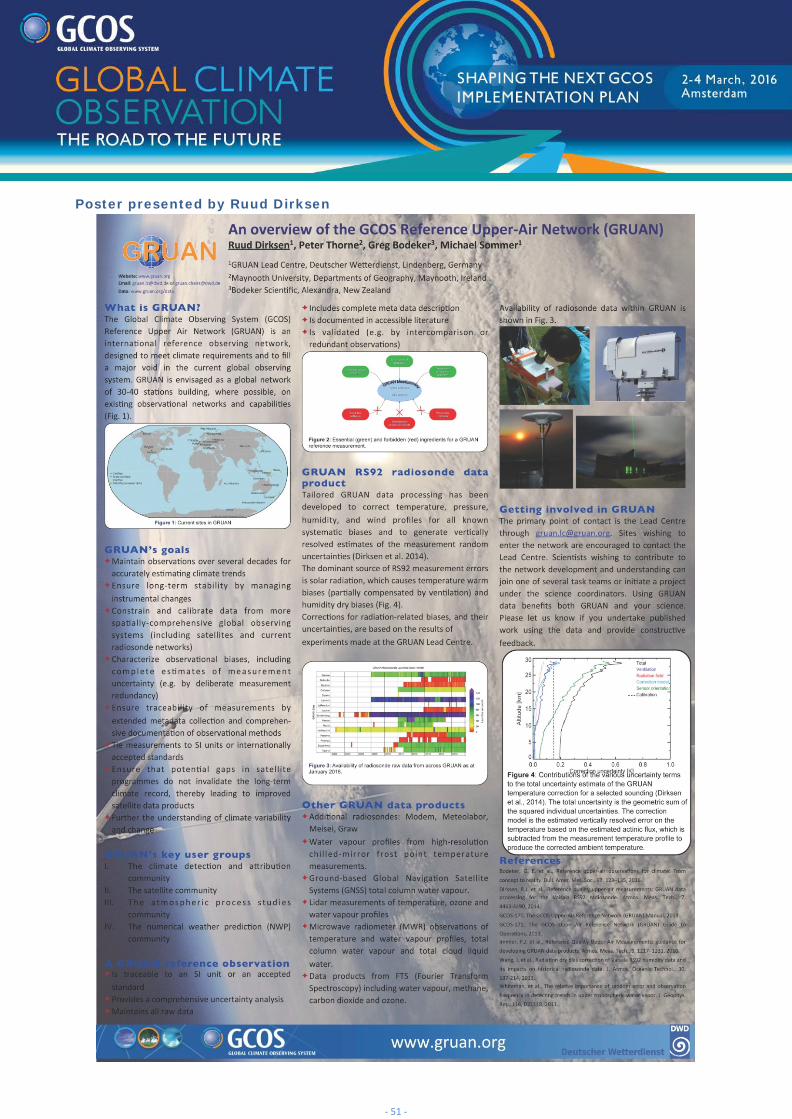
- 51 -
Poster presented by Ruud Dirksen
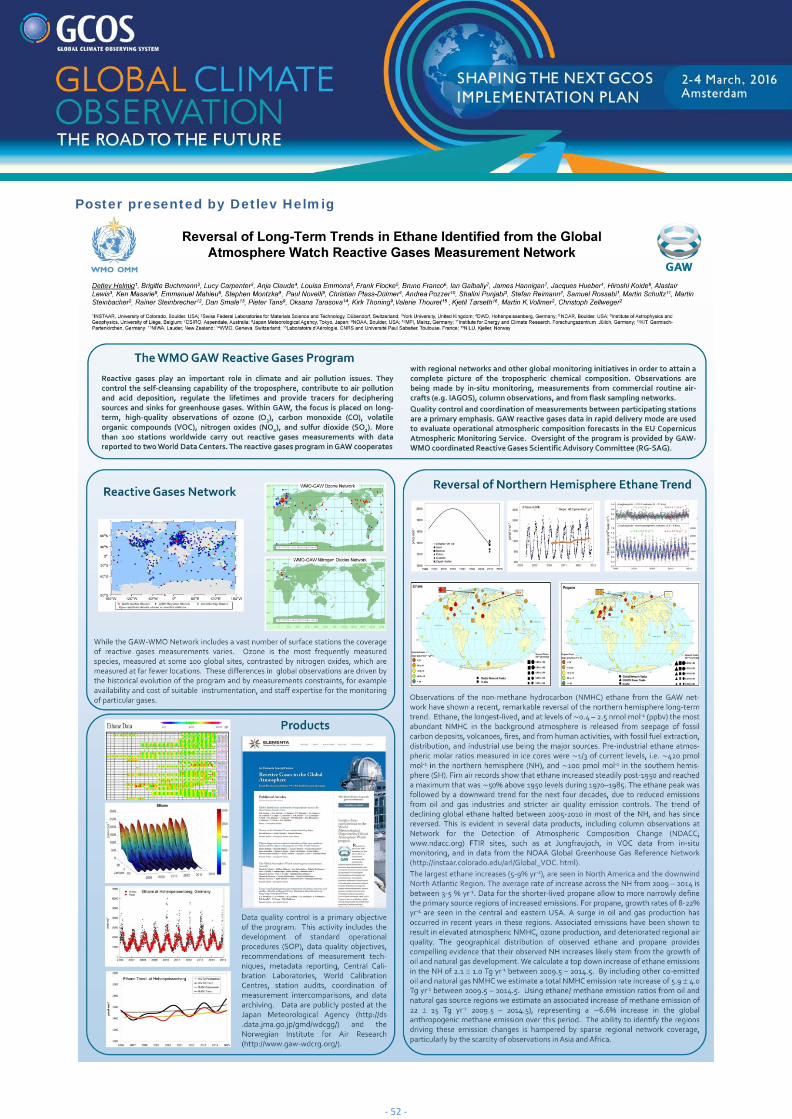
- 52 -
Poster presented by Detlev Helmig
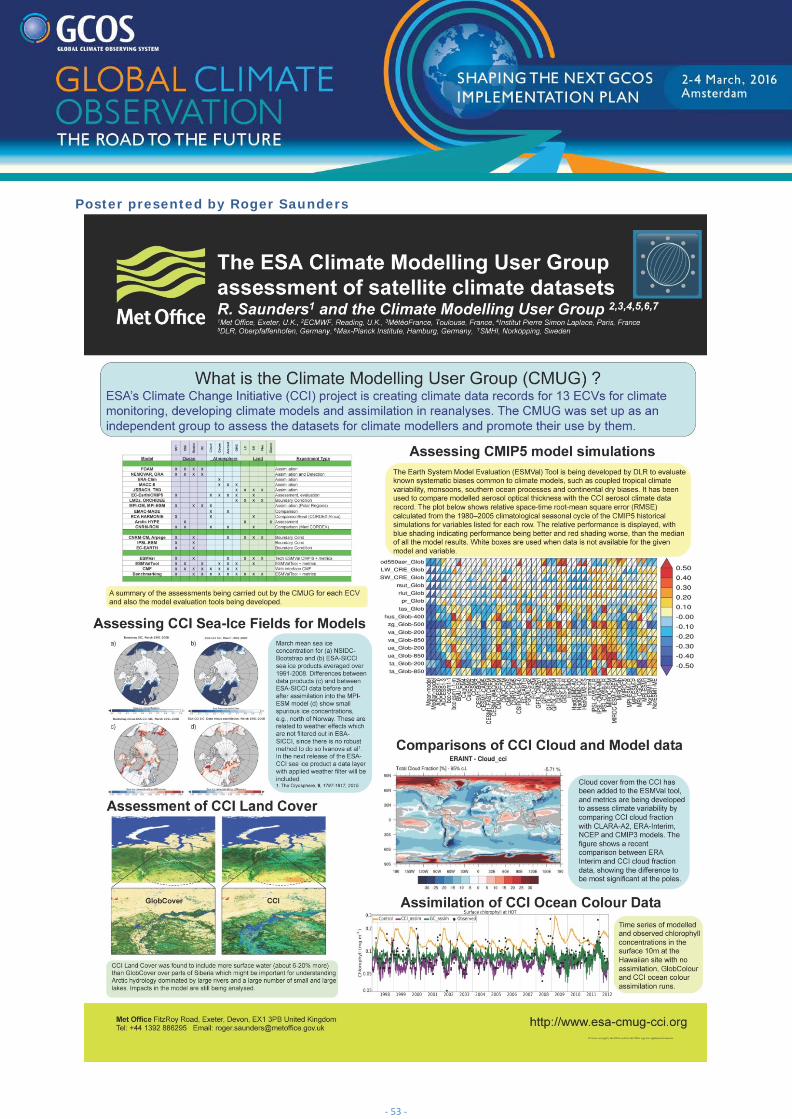
- 53 -
Poster presented by Roger Saunders
- 54 -
B. Adequacy of the current global climate observations This day discusses how adequate the current ECVs are in terms of science needs; of they help improving the understanding of key aspects of the climate system, and in terms of user needs; do they provide the information an increasing variety of user’s needs.
Session III: Relevance of the current ECVs to improve understanding of the global cycles of water, energy and carbon – (Chairs: Sybil Seitzinger, Toshio Suga, Bernadette Sloyan and Roger Pulwarty)
Abstracts
1. Observational constrains on the global carbon budget – Keynote talk by Corinne Le Quéré (Tyndall Centre University of East Anglia)
2. Observations needed to advance understanding of the role of clouds in climate –Keynote talk by Sandrine Bony (LMD/IPSL)
3. Roles of Air/Sea Exchange in the Cycles of Energy, Moisture and CO2 – Mark Bourassa (Florida State University) M. A. Bourassa1, T. Tanhua2, C. A. Clayson3, J. Edson4, S. T. Gille5, S. K. Gulev6, J. Johannessen7, S. A. Josey8, M. Kubota9, M. Mazloff5, S. Swart10, B. Ward11, R. Weller3, L. Yu3 1. Florida State University, Tallahassee, Florida, USA 2. GEOMAR, Germany 3. Woods Hole Oceanographic Institution, Woods Hole, Massachusetts, USA 4. University of Connecticut, USA 5. University of California San Diego, La Jolla, California, USA 6. IORAS, Moscow, Russia
7. Nansen Environmental and Remote Sensing Center, Bergen, Norway 8. National Oceanography Centre, Southamption, UK 9. Tokai Univeristy, Japan 10. Southern Ocean Carbon & climate Observatory, Council for Scientific & Industrial Research, Cape Town, South Africa 11. National University of Ireland, Ireland
Air/sea interaction plays critical roles in the exchanges of energy, moisture, and CO2 between the ocean and atmosphere. The ocean acts as a buffer by absorbing most of the Earth’s anthropogenic energy and CO2 increases. The rate at which the ocean can absorb this energy and CO2 is limited by (1) the values of these quantities on both sides of the air-sea interface and (2) the mixing of these quantities to and from the air-sea interface. GCOS goals are to measure air/sea exchanges or variables from which these changes can be estimated. Rates of moisture exchange are monitored through precipitation and evaporation. Energy exchange rates are the sum of radiative flux (solar and long-wave), sensible heat flux (SHF) and latent heat flux (LHF; which is LHF is proportional to evaporation). Over the oceans, the net radiative flux is approximately balanced by the LHF (SHF is a small term). Changes in either the radiative budget or ocean mixing rates, which depend largely on surface vector stress (a new ECV), will also modify the LHF, and hence modify weather patterns. SHF and LHF can be parameterized with observations of SST, near surface air temperature and humidity, surface pressure, and surface stress (a combination of wind and sea state). The GCOS requirements for these results in a 25Wm-2 uncertainty, which is less accurate than the 10Wm-2 desired to understand the circulation pathways of water masses modified by air/sea interaction. The 10Wm-2 goal might eventually be achieved through satellite observations, which would require in-situ observations for calibration.
- 55 -
The long term ocean sequestration of carbon is limited by transport to the ocean interior. Accurate observation of surface pCO2 is currently the only way to quantify ocean CO2 uptake on an annual time-scale. Currently the pCO2 observations are sparse, and extrapolation techniques have to be deployed to estimate annual air-sea fluxes of CO2. This interplay between satellite and in situ observations will be discussed, in the context of reducing uncertainty. The observational goals will be discussed in the contexts of roles of air/sea fluxes on synoptic to multi-decadal variability for both ocean and atmospheric impacts.
4. Measuring global forest biomass: current status and new developments – Shaun Quegan (University of Sheffield)
Above-ground forest biomass is a fundamental biophysical variable strongly linked to climate. Decreases in biomass through deforestation or forest degradation or increases due to forest growth translate respectively into CO2 emissions to the atmosphere and CO2 uptake from it. The emissions form a significant fraction of anthropogenic emissions of CO2, while the uptake slows the build-up of atmospheric CO2, but both are poorly quantified. Storing biomass in forests is also the only internationally agreed way to offset emissions (through the Kyoto Protocol), though the UN REDD+ initiative is also aimed firmly at reducing forest biomass loss. In addition biomass provides a key constraint on the land component of climate models, helps to quantify the carbon turnover time in forests, and is strongly linked to biodiversity and a range of ecosystem services needed for human welfare. In the boreal and temperate zones there are large numbers of in situ biomass measurements because of the information needs of commercial forestry. However, in the tropics, which is where information is most needed for climate purposes, the measurements are sparse and of limited representativeness. The difficulty and cost of tropical in ground-based measurements precludes any solution to this based only on more in situ data. In addition, there is an increasing need for gridded biomass data to support emission calculations and modelling. This has led to several efforts to exploit space-based measurements, together with ground data, to generate continental scale biomass maps. These are increasingly being supported by new ground based measurement techniques (notably Terrestrial Laser Scanners) together with biomass estimates from airborne lidar data. Furthermore, new space missions to measure biomass are planned to launch during the next 5 years, notably the NASA GEDI lidar and the European Space Agency BIOMASS P-band radar satellite, together with L-band radars to be flown by Argentina and NASA.
The current status of biomass measurements, their implications for our quantitative knowledge about the terrestrial carbon cycle, and the prospects opened up by these new developments in biomass estimation will be addressed in this talk. In addition, we will address the lack of any international organization responsible for biomass as an ECV, and the problems this presents.
5. Essential Climate Variables in the Copernicus Global Land Service – Rosely Lacaze (HYGEOS) R. Lacaze 1, B. Smets 2, K. Tansey 3, A. Verger 4, M. Weiss 5, S. Freitas 6, C. Paulik 7, L. Bertels 2, F. Camacho 8, J.-C. Calvet 9, F. Baret 5, M. Padilla 3, J. Sanchez 8, A. Jann 10 1 HYGEOS, Lille, France 2 VITO, Mol, Belgium 3 University of Leicester, Leicester, United Kingdom 4 CREAF, Barcelona, Spain 5 INRA, Avignon, France
6 IPMA, Lisbon, Portugal 7 Vienna University of Technology, Vienna, Austria 8 EOLAB, Valencia, Spain 9 Meteo-France, Toulouse, France 10 ZAMG, Vienna, Austria
The Copernicus Global Land Service (CGLS) provides continuously a set of bio-geophysical variables describing, over the whole globe, the vegetation dynamic and the energy budget at the continental surface. These generic products serve numerous applications such as agriculture and food security monitoring, weather forecast, climate change impact studies, water, forest and natural resources management.
- 56 -
The CGLS portfolio includes a number of Essential Climate Variables like the Leaf Area Index (LAI), the Fraction of PAR absorbed by the vegetation (FAPAR), the burnt areas, the surface albedo, the Land Surface Temperature (LST), the soil moisture, and the areas of water bodies. The LAI, FAPAR, burnt areas, albedo, and areas of water bodies are derived every 10 days from PROBA-V sensor data, the LST is derived from geostationary sensor data every hour while the soil moisture is derived from active microwave sensor data every day. Besides the timely NRT production, the available historical archives of sensors data (e.g. the SPOT/VEGETATION images) are processed, using the same innovative algorithms, to get consistent time series as long as possible. All Copernicus Global Land Service products are accessible, free of charge after registration through FTP/HTTP (http://land.copernicus.eu/global/) and through the GEONETCast satellite distribution system. The products are provided with documents describing the physical methodologies, the technical properties of products, and the results of validation exercises. This talk will present the status of the ECVs into the CGLS, including the results of their quality assessment. We will introduce as well the planned evolutions of the CGLS like the addition into the portfolio of new ECVs (e.g. the land cover), and the future use of Sentinel-3 data to ensure the continuity of the service and the extension of the time series.
6. Climate Monitoring from Space: The EUMETSAT Satellite Application Facility on Climate Monitoring – Martin Werscheck (DWD)
The EUMETSAT Satellite Application Facility on Climate Monitoring (CM SAF) develops, generates, archives and distributes high-quality satellite-derived products of the energy & water cycle in support to monitor, understand and adapt to climate variability and climate change. The product portfolio of the CM SAF comprises long time series of Essential Climate Variables (ECV’s) related to the energy & water cycle as defined by the Global Climate Observing System (GCOS), in particular the following parameters are derived:
• Global cloud parameters • Global precipitation (planned) • Global radiation at surface • Global water vapour • Regional (Europe & Africa) radiation top of the atmosphere • Regional latent and sensible heat flux (planned)
CM SAF provides Thematic Climate Data Records (TCDR) of the above listed parameters in netCDF format free of charge (www.cmsaf.eu). Some of these data records are available in a format compatible with Obs4MIPs / ESGF. For some of the TCDRs also the corresponding Interim Climate Data Records (ICDR) are produced on a regular basis. The CM SAF data records are to a large extend compliant with the GCOS Requirements for the Generation of Datasets and Products, including an assessment of the System Maturity per data record (according to the CORE-CLIMAX System Maturity Matrix Instruction Manual). The presentation will give an overview of the products & service portfolio as well as typical applications and perspectives for new developments and issues tackled (e.g. provision of error characteristics).
- 57 -
7. Optimized space collection of ECVs and threading ECVs back to MIT’s storied earth systems modeling efforts – Douglas Helmuth (Lockheed Martin-Space Systems Company Sunnyvale, Calif, United States)
Consistently collecting the earth’s climate signatures remains a priority for world governments and international scientific organizations. Applying a new rule based optimization tool to efficiently collect ~26 of the 50 ECVs from space provides guidance & opportunities for global collaboration. Threading critical ECVs back into the sub-models and mosaic of MIT’s probabilistic earth systems model (ESM), highlights how improvements in modelling accuracies and uncertainties can be a direct result of calibrated ECV collections. Multiple applications of such new tools clearly promote the advantages of global architecture collaboration. ‘Value assessment system architecture using rules’ (VASSAR) an optimization tool adapted for climate centric space collections of ECVs, highlighted just such opportunities. An graphical summary of these results is included. The valuable next step of tracing ECVs collection standards to MIT’s 20 year atmosphere-ocean-land general circulation modelling (AOGCM) investment, allows mapping of ECVs back to recent MIT modelling validation &verification efforts for inaccuracies and uncertainties. The benefits of space collections of calibrated ECVs (over time), means MIT’s storied modelling analysis can be improved based on differencing modelling results against the ECV measurements. The process to validate improvements and calibrate for uncertainties is just taking place in late 2015. A schematic representation of MIT’s probabilistic modelling (IGSM & EPPA) aligned with the actual space collections that advanced improvements in accuracy and value of the modelling; includes the ‘forward modelling’ of policy decisions and assessment of the impacts by human emissions on future climate changes.
8. A New Look at the Ocean Biogeochemistry ECVs – Toste Tanhua (GEOMAR Helmholtz Institute of Marine Research) T. Tanhua1, M. Telszewski2, R. Wanninkhof3 1. GEOMAR Helmholtz Centre for Ocean Research Kiel, Kiel, Germany 2. IOCCP Project Office, Institute of Oceanology of Polish Academy of Sciences, Sopot, Poland 3. Ocean Chemistry Division, NOAA/AOML, Miami, USA
The Framework for Sustained Ocean Observing (FOO, 2012) defines an implementation strategy for an enhanced global sustained ocean observing system that integrates physical, biogeochemical and biological observations and takes advantage of existing structures. The FOO has reformed the governance of the Global Ocean Observing System (GOOS). It is based on a systems approach of an observing system needed to fulfil societal requirements that is driven by processes (observations) which output actionable data and products. The FOO structure is supported by the Physics, Biogeochemistry (BGC) and Biology/Ecology Ocean Observing System Panels. These panels work together on the ocean observing strategy using the concept of Essential Ocean Variables (EOVs). The FOO implementation is driven by societal and scientific requirements, taking account of feasibility and readiness of observing elements (sensors, platforms, networks) for those EOVs. The sustainability, expansion, and integration of GOOS is based on expanding a set of societal issues, originally solely focussed on climate observations, to include interconnected fields like ocean pollution, food security and ecosystem stability. The set of Biogeochemistry EOVs determined by the ocean science community show substantial overlap with the Essential Climate Variables (ECVs) defined by GCOS in 2010 but
- 58 -
include additions in particular those addressing ecosystem health. This presentation focuses on harmonizing these two sets of Essential Variables, drawing on the updated set of requirements and the updated feasibility and readiness of the ocean observing system. We will layout the need for necessary modifications to the current set of ocean biogeochemistry ECVs and discuss the possible approach for the benefit of the GCOS Implementation Plan 2016.
9. The ESA Ocean Colour Climate Change Initiative (OC-CCI): meeting the Global Climate Observation System requirements for ocean colour data – Robert Brewin (Plymouth Marine Laboratory) S. Sathyendranath1, S. Groom1, T. Jackson1, M. Grant1, T. Platt1, D. Mueller2, H. Krasemann2,F. Mélin3, M. Dowell3, C. Brockmann4, M. Zühlke4, F. Steinmetz5, J. Swinton6, A. Farman6, S. Lavender6, V. Brotas7, A. Valente7 and P. Regner8 1. Plymouth Marine Laboratory, Plymouth, UK 2. Helmholtz-Zentrum Geesthacht, Geesthacht, Germany 3. European Commission - Joint Research Centre, Ispra, Italy
4. Brockmann Consult, Hamburg, Germany 5. HYGEOS, Lille, France 6. Telespazio VEGA UK, Luton, UK 7. University of Lisbon, Portugal 8. European Space Agency, Frascati, Italy
Chlorophyll-a and remote-sensing reflectance, Rrs, are identified as Essential Climate Variables (ECV) by GCOS, which has specified accuracy requirements for consistent, stable, error-characterized global satellite data products. The European Space Agency’s Ocean Colour Climate Change Initiative (OC-CCI) aims to develop and validate state-of the-art algorithms to meet the GCOS requirements from multi-sensor global satellite data products for climate research and modelling. OC-CCI is following a data processing paradigm of regular re-processing, utilizing ongoing research and developments in atmospheric correction, in-water algorithms, data merging techniques and bias correction. The project has released a set of global products (chlorophyll and Rrs at six wavelengths, inherent optical properties and diffuse attenuation coefficient) for September 1997 to end of July 2014 derived from SeaWiFS, MERIS and MODIS-Aqua data that were merged, after band-shifting MERIS and MODIS data to SeaWiFS wavebands and correcting for inter-sensor biases, for generating consistent reflectances. The uncertainty for Chlorophyll (estimated from relative errors) is within the GCOS 30% accuracy requirement, while most of the Rrs products show a bias not exceeding 5%, except for the green band (~9% at 555 nm). Nevertheless, further improvements are underway, including: better characterisation of coastal waters; improved cloud and sea-ice characterisation; extending the time series with additional satellite data; and greater consistency in processing between sensors. These improvements will be provided in v3 of the OC CCI products due for release in April 2016. Ocean colour is the only marine ECV in the ESA CCI programme that targets a biological field. Phytoplankton abundance, which can be indexed as chlorophyll concentration, is a key factor in the ocean carbon cycle and, hence, important in all pathways of carbon in the ocean. Since phytoplankton are at the base of the pelagic food web, they are fundamental to understanding how the marine ecosystem responds to climate variability and climate change. Further aspects of the ocean carbon cycle are under investigation in ESA SEOM and STSI projects associated with OC CCI, including: ocean acidification (a GCOS ECV), and phytoplankton primary production, pools of ocean carbon and phytoplankton functional types (none of which are currently GCOS ECVs). This presentation will present latest results from the OC CCI project including accuracy with respect to GCOS requirements, the application of ocean colour data in climate studies from a variety of perspectives and possible additional ECVs associated with the carbon cycle.
- 59 -
10. Fresh Water as an Essential Climate Variable in the Arctic Climate System – Dmitry Dukhovskoy (FSU)¨ D. Dukhovskoy1, A. Proshutinsky2, M.-L. Timmermans3, J. Bamber4, B. Curry5, R. Somavilla6, M. Bourassa1 1. Florida State University, Tallahassee, USA 2. Woods Hole Oceanographic Institution, Woods Hole, USA 3. Yale University, New Haven, USA
4. Woods University of Bristol, Bristol, UK 5. Woods University of Washington, Seattle, USA 6. Spanish Institute of Oceanography, Gijon, Spain
New insights gained from the analysis of observational records indicate that the Arctic has been experiencing substantial changes in the major environmental parameters in the 21st century. Arctic climate state is characterized by several climate variables such as sea ice thickness and concentration, air temperature, precipitation, sea-level atmospheric pressure, river and glacier runoff, ocean and sea ice circulation. This study considers fresh water (FW) as an essential climate variable of the Arctic ocean-ice-atmosphere system that can be used as an indicator and predictor of the Arctic change processes. FW plays a major role in the Arctic ocean-ice-atmosphere system impacting thermohaline processes, sea ice formation, and air-sea heat fluxes. Several conceptual models were suggested to explain quasi-decadal variability of the Arctic climate in the 20th century. In these models, the FW flux from the Arctic Ocean to the North Atlantic is a key factor controlling climate variability in the region. Since 1997, the Arctic climate has been transforming under rapidly changing environmental parameters. The conceptual models do not have a mechanism to explain and predict the recently observed changes of the Arctic system. One of the recently proposed explanations of observed Arctic climate change is related to the unabated Greenland Ice Sheet melt. It is surmised that under current climate conditions, accelerating FW flux from the Greenland Ice Sheet impacts thermohaline processes in the sub-Arctic seas influencing Arctic climate variability. The study investigates recent changes in salinity fields in the Arctic Ocean and the sub-Arctic seas (Baffin Bay, Labrador Sea, Subpolar Gyre, and the Nordic Seas), FW fluxes from the Arctic Ocean to the sub-Arctic seas, and Greenland FW discharge. In situ and satellite observations are analyzed in attempt to evaluate the evidence of Greenland FW in the sub-Arctic Seas. The interannual variability of the air-sea heat fluxes in the North Atlantic is discussed in order to relate this factor with observed thermohaline changes and air-sea fluxes in the area. Results from a numerical experiment that track propagation of the Greenland FW are discussed.
11. Upper tropospheric cloud systems from Satellite Observations : what can be achieved? A GEWEX perspective – Claudia Stubenrauch (CNRS/LMD) C. J. Stubenrauch1, G. L. Stephens2 1. LMD/IPSL, UPMC, Paris, France 2. NASA JPL, Pasadena, USA
Clouds in the upper troposphere, representing about 40% of the Earth’s total cloud cover, play a crucial role in the climate system by modulating the Earth's energy budget and heat transport. These clouds often form mesoscale systems extending over several hundred kilometres. Cirrus emerge as the outflow of convective and frontal systems or form in cold air supersaturated with water. Both their evolution with climate change and their feedback can only be reliably estimated if these cloud systems are adequately represented in climate models. Only satellite observations provide a continuous survey of the state of the atmosphere over the entire globe and across the wide range of spatial and temporal scales. The Global Energy and Water cycle Experiment (GEWEX) Cloud Assessment provided the first coordinated intercomparison of publically available, standard global cloud products retrieved from
- 60 -
measurements of multi-spectral imagers, IR sounders and lidar. While imagers on geostationary satellites have a better temporal resolution, the good spectral resolution of IR sounders makes them particularly sensitive to thin cirrus, also during night and when overlying low-level clouds. Recently GEWEX has initiated working groups on Process Evaluation Studies (PROES) to provide observational based metrics for a better understanding of physical processes. One goal of the GEWEX PROES working group on ‘Upper Tropospheric Clouds and Convection’ is to gain a better understanding of the role of convection on cloud feedbacks. Several studies have suggested that upper tropospheric clouds (and cirrus in particular) assert a control on convection itself and thus on precipitation and the hydrological cycle. Within this framework we are building a synergetic data base of upper tropospheric cloud systems derived from the Atmospheric InfraRed Sounder (AIRS), the Infrared Atmospheric Sounding Interferometers (IASI), coupled with information on the vertical structure from active instruments of the CALIPSO and CloudSat missions, rain rates from microwave sounder AMSR-E and from the Tropical Rainfall Measuring Mission (TRMM), on the life cycle from imagers on geostationary satellites and on thermodynamics from meteorological reanalyses.
12. Comparing observations of fossil fuel-derived CO2 in California with predictions from bottom-up inventories – Heather Graven (Imperial College London) H.D. Graven1, T. Lueker2, M. Fischer3, K. Brophy1, T. Guilderson4, R. Keeling2, T. Arnold5, R. Bambha6, W. Callahan7, E. Campbell8, C. Frankenberg9, Y. Hsu10, L. Iraci11, S. Jeong3, J. Kim2, B. LaFranchi6, S. Lehman12, A. Manning5, H. Michelson6, J. Miller13, S. Newman14, W. Paplawsky2, N. Parazoo9, C. Sloop7, S. Walker2, M. Whelan8, D. Wunch14 1. Imperial College London 2. Scripps Institution of Oceanography 3. Lawrence Berkeley National Laboratory 4. Lawrence Livermore National Laboratory 5. Met Office Hadley Centre 6. Sandia National Laboratory 7. Earth Networks
8. University of California, Merced 9. NASA Jet Propulsion Laboratory 10. California Air Resources Board 11. NASA Ames Research Center 12. University of Colorado, Boulder, 13. NOAA 14. California Institute of Technology
The US state of California has a progressive climate change mitigation policy, AB-32, enacted in 2006 to reduce greenhouse gas emissions 15% by 2020 and then a further 80% by 2050. Bottom-up inventories indicate California’s fossil fuel CO2 emissions are currently about 100 Mt C per year, but different inventories show discrepancies of ±15% in the state-wide total, and some larger discrepancies in various sub-regions of the state. We are developing a top-down framework for investigating fossil fuel and biospheric CO2 fluxes in California using atmospheric observations and models. California has a relatively dense collaborative network of greenhouse gas observations run by several universities, government laboratories and Earth Networks. Using this collaborative network, we conducted three field campaigns in 2014-15 to sample flasks at 10 tower sites across the state. Flasks were analysed for atmospheric CO2 and CO concentrations and for stable isotopes and radiocarbon in CO2 The flask observations of radiocarbon in CO2 allow patterns of fossil fuel-derived and biospheric CO2 to be distinguished at relatively high resolution across the state. We will report initial results from the observations showing regional gradients in fossil fuel-derived CO2 and fluctuations from changing weather patterns. We will compare the observations of fossil fuel-derived CO2 to predictions from several bottom-up inventories and two atmospheric models. Linking the flask data with observations from OCO-2, TCCON, aircraft flights and groundbased in situ analyzers, we will examine the variation in total CO2 and its drivers over California. Further analysis is planned to integrate the data into an inversion framework for fossil fuel and biospheric CO2 fluxes over California.
- 61 -
Posters
Poster Presenter: Shawn Smith – Value of Automated Shipboard Weather Observations for Climate Studies - ICOADS Value-Added Database (IVAD) S. R. Smith1, M. A. Bourassa1,2, S. J. Worley3, and D. I Berry4 1. Center for Ocean-Atmospheric Prediction Studies, The Florida State University, Tallahassee, USA 2. Earth, Ocean, and Atmospheric Science Department, The Florida State University, Tallahassee, USA 3. National Center for Atmospheric Research, Boulder, USA 4. National Oceanography Centre, Southampton, UK
The International Comprehensive Ocean-Atmosphere Data Set (ICOADS) Value-Added Database (IVAD) project will be described, highlighting its role in improving observational data for climate studies. The presentation will provide an overview of the IVAD project, with a focus on the role IVAD has in providing expert-developed adjusted data values (e.g., bias or height corrections) and uncertainty estimates for ECVs to the climate community. IVAD is designed to allow experts to add adjustments to individual marine reports in ICOADS and provides a mechanism for the adjustments to be served to the public alongside the original ICOADS marine reports. The IVAD concept will allow future developers of air-sea exchange products, satellite retrieval algorithms, and reanalyses to easily apply community-developed adjustments to individual marine reports without the need to locate numerous manuscripts and apply individual data adjustment algorithms. Distribution of IVAD records is made possible by enhancing the ICOADS underlying international marine meteorological archive (IMMA) data format to include unique identifiers on each record and the capability to add a documented IVAD specific attachment, where required. Development of IVAD records will be described, including those for diurnal ship heating biases in air temperature, estimated wind corrections, and enhanced cloud reports. Plans to distribute these initial IVAD records within the framework of release 3.0 of the ICOADS, to be published in 2016, will be provided.
Poster Presenter: Masahisa Kubota – Intercomparison of various products of latent heat flux over the ocean M. Kubota1, H. Tomita2, T. Hihara1 1. Tokai University, Shizuoka, Shizuoka, Japan 2. Nagoya University, Nagoya, Aichi, Japan
Latent heat fluxes play important roles in the exchanges of heat energy between the ocean and atmosphere. Since huge heat energy can be transferred from low-latitudes to mid- and high-latitudes as water vapor, latent heat flux is important in the climate system. Also, latent heat flux is important for the global hydrological cycle, because latent heat flux and water vapor are two sides of the same coin. Thus, latent heat flux between ocean and atmosphere is critical to our understanding of the climate and one of Essential Climate Variables (ECVs). Recently various turbulent heat flux products are provided. The products are divided into four categories, i.e., satellite, reanalysis, in situ and hybrid products. The characteristics of each product strongly depend on many factors such as data, algorithm and observation methods. Thus, it is important for flux users to know the differences between them and the accuracy of them. Our objectives are to clarify the differences between each global latent heat flux product and to compare the flux data in each product with buoy flux data. We used nine global products including satellite, reanalysis, in situ and hybrid products in this study. The temporal and spatial resolutions are different depending on each product. Thus, we unified the temporal resolution is monthly, and the spatial resolution is 0.25°. The analysis period is one year, 2008. When intercomparison of global products is carried out, what we don’t know true values as reference is a problematic issue. Thus, we assumed the ensemble median as a reference product. Also we compared flux data in each product with buoy data.
- 62 -
Poster Presenter: Bernadette Sloyan – GO-SHIP: An integrated physical, biogeochemical and biological ocean observing platform B.M. Sloyan1, R. Wanninkhof2, M. Kramp3 1. Commonwealth Scientific and Industrial Research Organisation (CSIRO), Hobart, Tasmania, Australia 2. Atlantic Oceanographic and Meteorological Laboratory, National Oceanic and Atmospheric Administration, Miami, Florida 3. JCOMMOPS, IOC-UNESCO
Heat, water and carbon are the fundamental elements of the climate system and the ocean is the dominant reservoir for both. To understand the oceanic branch of the system, we must observe on a global basis the storage and transport of heat, freshwater, and carbon in the ocean, and their exchange across the air-sea interface. In addition, the exchange of momentum across this interface drives much of the ocean’s circulation and must also be observed. GO-SHIP provides approximately decadal resolution of the changes in inventories of heat, freshwater, carbon, oxygen, nutrients and transient tracers, covering the ocean basins from coast to coast and full depth (top to bottom), with global measurements of the highest required accuracy to detect these changes. The GO-SHIP principal scientific objectives are: (1) understanding and documenting the large-scale ocean water property distributions, their changes, and drivers of those changes, and (2) addressing questions of how a future ocean that will increase in dissolved inorganic carbon, become more acidic and more stratified, and experience changes in circulation and ventilation processes due to global warming and altered water cycle. This talk will provide an overview of the present GO-SHIP network of sustained hydrographic sections and future directions of the program.
Poster Presenter: Tianbao Zhao – Water Vapor Change from Radiosonde Observations and Reanalysis Products over China T. Zhao Key Laboratory of Regional Climate-Environment Research for East Asia, Institute of Atmospheric Physics (IAP), Chinese Academy of Sciences (CAS), Beijing, China
Radiosonde humidity data provide the longest record for assessing changes in atmospheric water vapor, but they often contain large discontinuities because of changes in instrumentation and observational practices. In this study, the variations and trends in tropospheric humidity (up to 300 hPa) over China are analyzed using a newly homogenized radiosonde dataset. There are, however, many spurious changes and discontinuities in the raw radiosonde records resulting from changes in instruments, observational practice, processing procedures, station relocations, and other issues. Recently, the daily humidity records radiosonde derived from about 130 Chinese stations were homogenized using a new approach developed by Dai et al. (2011). It is shown that the homogenization removes the large shifts in the original records of humidity resulting from sonde changes in recent years in China, and it improves correlation of the precipitable water (PW) with precipitation and the spatial coherence of the PW trend during recent 40 years. The PW variations and changes are highly correlated with those in lower–midtropospheric mean temperature (r = 0.83), with a dPW/dT slope of ~7.6% K−1, which is slightly higher than the 7% K−1 implied by Clausius–Clapeyron equation with a constant relative humidity (RH). The radiosonde data show only small variations and weak trends in tropospheric RH over China. Using these homogenized observations, the PW from the NCEP/NCAR, NCEP/DOE, MERRA, JRA-55, JRA-25, ERA-Interim, ERA-40, CFSR and 20CR reanalyzes is evaluated for the period from 1979-2012 (1970-2001 for ERA-40). Results suggest that the PW biases in the reanalyzes are within ∼20% for most of northern and eastern China, but the reanalyzes underestimate the observed PW by 20%–40% over western China, and by ∼60% over the southwestern Tibetan Plateau. The newer-generation reanalyzes (e.g., JRA25, JRA55, CFSR and ERA-Interim) have smaller root-mean-square error (RMSE) than the older-generation ones
- 63 -
(NCEP/NCAR NCEP/DOE and ERA-40). Most of the reanalyzes reproduce well the observed PW climatology and interannual variations over China. However, few reanalyzes capture the observed long-term PW changes, primarily because they show spurious wet biases before about 2002. This deficiency results mainly from the discontinuities contained in reanalysis RH fields in the mid-lower troposphere due to the wet bias in older radiosonde records that are assimilated into the reanalyzes. Thus, more efforts are needed to remove spurious changes in input data for future long-term reanalyzes.
Poster Presenter: Gino Casassa – Water contribution of glaciers at an alpine basin in the central Andes of Chile and future projections G. Casassa1,2, A. Apey1, M. Bustamante1, C. Marangunic1, C. Salazar3 and D. Soza1 1. Geoestudios, San José de Maipo, Chile 2. Universidad de Magallanes, Punta Arenas, Chile 3. Hydro21 Consultores Ltda., San Bernardo, Chile
Glacier meltwater contribution is assessed for Yerba Loca basin, located in the central Andes of Chile, 30 km east of Santiago, 33º15’ S. This is a nivo-glacial basin, spanning an elevation between 1300 m and 5352 m a.s.l., with a total area of 110 km2 and a glacier area of 9.5 km3, including debris-free glaciers (2.1 km2), debris-covered glaciers (1.5 km2) and rock glaciers (5.9 km2). During the summer seasons of 2013/14 and 2014/15 several field campaigns were performed on 4 representative glaciers located in the upper Yerba Loca basin. The information provided by the glaciological and geodetic mass balances (including airborne LiDAR data), together with the energy balance and the analysis of water runoff data allows determining the monthly water yield during the summer and also the annual water yield. The hydrological year 2014-15 was extremely dry (~95% exceedance probability) with an unusually warm summer, resulting in practically no snow accumulation on the glaciers by the end of the summer. Subtracting the water contribution due to snow melt and also subtracting the loss of mass through sublimation, the annual water yields are 0.26 l/s/ha for the debris-free glacier, 0.17 l/s/ha for the debris-covered glacier, 0.07 l/s/ha for the “large” rock glacier (> 25 ha) and 0.03 l/s/ha for the “small” rock glacier (<25 ha), which correspond to geodetic mass balance losses of 1.31 m water equivalent (w.eq.), 0.75 m w.eq., 0.26 m w.eq. and 0.09 w.eq. for each glacier, respectively. The debris-free and debris-covered glaciers represent only 39% of the total glacier area, yet they provide 88% of the glacier runoff, whereas the rock glaciers (small and large) represent 61% of the total glacier area but they contribute only 12% of the glacier runoff. Based on these results a distributed energy-mass balance model was applied to the Yerba Loca basin and also to the whole Maipo basin which constitutes the main water supply to the city of Santiago (population 7 million). The model allows calculating the glacier meltwater contribution during a dry year such as 2014-2015, during a normal year and also the future water contribution under climate warming scenarios. As small and medium-sized glaciers start to reduce significantly within a few decades, their water yields will become less relevant until they are completely extinct.
- 64 -
Session IV: User needs from diverse areas – (Chairs: Roger Pulwarty and Qingchen Chao)
Abstracts
1. Soils and climate change: user needs for mitigation and adaptation – Keynote talk by Pete SMITH (Institute of Biological and Environmental Sciences, University of Aberdeen)
Intergovernmental Panel on Climate Change (IPCC) Tier 1 methodologies commonly underpin project-scale carbon accounting for changes in land use and management, and are used in frameworks for Life Cycle Assessment and carbon foot printing of food and energy crops. These methodologies were intended for use at large spatial scales. This can introduce error in predictions at finer spatial scales. There is an urgent need for development and implementation of higher tier methodologies that can be applied at fine spatial scales (e.g. farm/project/plantation) for food and bioenergy crop GHG accounting to facilitate decision making in the land-based sectors. Higher tier methods have been defined by IPCC and must be well evaluated and operate across a range of domains (e.g. climate region, soil type, crop type, topography), and must account for land use transitions and management changes being implemented. Furthermore, the data required to calibrate and drive the models used at higher tiers need to be available and applicable at fine spatial resolution, covering the meteorological, soil, cropping system and management domains, with quantified uncertainties. Testing the reliability of the models will require data either from sites with repeated measurements, or from chronosequences. Here I present current global capability for estimating changes in soil carbon at fine spatial scales, and present a vision for a framework capable of quantifying land use change and management impacts on soil carbon, which could be used for addressing issues such as bioenergy and biofuel sustainability, food security, forest protection, and direct/indirect impacts of land use change. The aim of this framework is to provide a globally-accepted standard of carbon measurement, data infrastructure and modelling appropriate for GHG accounting that could be applied at project to national scales (allowing outputs to be scaled up to a country level), to address the impacts of land use and land management change on soil carbon for climate mitigation and adaptation.
2. How much biology does the Global Climate Observing System need? – Keynote talk by Bob Scholes (GCSRI, South Africa)
Earth System Science teaches us that the living parts of the biosphere have a profound impact on its dynamics at various space and time scales. The GCOS list of fifty Essential Climate Variables (ECV) contains ten which are predominantly biological, a term which includes ecological. These include seven over land (the land cover, its leaf area, absorption of photosynthetic radiation, reflectance of radiation, aboveground biomass, soil carbon and fire occurrence), one in the cryosphere (permafrost) and two in the ocean (colour and phytoplankton). The presentation briefly surveys the status of observation efforts for these variables. It then discusses the key biological processes which interact substantively with the climate system and various space and time scales, including those which could be involved in abrupt future change in the 21st century. It concludes by suggesting how those not presently part of the ECV set could best be incorporated in our approaches to understanding and predicting the state of the planet.
- 65 -
3. Satellites for Climate Services - Case studies for Establishing an Architecture for Climate Monitoring from Space – Stephan Bojinski (WMO) Stephan Bojinski1, Mark Dowell2, Richard Eckman3, Ignatius Gitonga Gichoni4, Robert Husband5, Pascal Lecomte6, Wenjian Zhang1 1. WMO 2. European Commission Joint Research Centre 3. NASA 4. Kenya Meteorological Department 5. EUMETSAT 6. ESA
The paper describes a number of case studies that demonstrate the direct or indirect value of Earth observation satellites for climate services. Climate services, i.e. climate information prepared and delivered to meet a user’s needs (WMO, 2011), are recognized as vital for decision-making in climate-sensitive societal sectors, such as food security, water management, disaster risk reduction, and health. Against a backdrop of human-induced climate change and the need for adaptation and mitigation, reliable, quality-controlled climate information at global level is essential to inform decisions. Satellites are uniquely placed to provide a global perspective on the climate system, to contribute to the monitoring of 26 Essential Climate Variables (GCOS, 2011), as well as to inform regional and local climate analyses. The 13 case studies described in the paper start from a wide range of end users’ perspective and their needs for climate services, including those of farmers, house owners, ecosystem managers, agriculture and health authorities, coastal protection agencies, energy companies, the finance and insurance industry, development fund agencies, and government policy and decision makers. The case studies then demonstrate the importance of satellites for preparing the climate services needed by these communities. Satellite-based climate data records provide a critical baseline and input to reanalyses that underpin climate services. In many examples, satellite data records are complemented by climate data records from surface-based observing systems, and other sources of information (models, socio-economic data) to generate the service. The importance to climate services of near-real-time satellite data that do not or only partially meet climate standards is also shown. Coordination of climate observing and modelling systems, the integrated use of climate data, and effective user-provider feedback mechanisms in all climate-sensitive sectors are therefore essential for advancing the development of climate services. Target audiences of the full report are (i) decision-makers, funding agencies, and climate service users, with the objective to demonstrate the value of satellites for climate services, and (ii) satellite agencies, with the objective to demonstrate the need for enhanced coordination within the Architecture that will address the thematic breadth of climate services. The report supplements the Strategy Towards an Architecture for Climate Monitoring from Space (Dowell et al., 2013), a joint coordination effort by space agencies and WMO in support of the GFCS, and provides a basis for validating the proposed end-to-end Architecture (and its “logical view”) from a user perspective.
4. Climate Service and Climate Observation in China – Qingchen Chao (Beijing Climate Center) Qingchen Chao1, Penglin Wang1, Yu Nie1 and Fanghua Wu1 1. Beijing Climate Center, Beijing, China
Beijing Climate Center is the WMO Regional Climate Center in RAII whose responsibility includes to monitor and diagnose global atmospheric and oceanic conditions, as well as extreme climate events, to issue climate prediction and impact assessments from monthly up
- 66 -
to interannual time scales, especially in China and East Asia, to develop climate system model. From user’s perspective, there are still gaps between climate service needs and data. For example, there is less information of ice, ocean and biological observation to be used in routine operation. Meanwhile, the observation of social and economic variable is weaker than natural system, which is a big bottleneck for us to adapt and mitigate climate change. In this presentation, we will present some cases to show the needs to better service the social and economic development. Finally, enhancing the observational ability and sharing the data will be suggested.
5. Observations to support adaptation: Principles, scales and decision-making – Roger Pulwarty (NOAA) R.S. Pulwarty1, K. Hill2, E.D. Harrison1 1. National Oceanic and Atmospheric Administration WMO 2. GCOS Secretariat
As has been long noted, a comprehensive, coordinated observing system is the backbone of any Earth information system. Demands are increasingly placed on earth observation and prediction systems and attendant services to address the needs of vulnerable sectors including energy, water, health, transportation, agriculture, disaster risk reduction, and national security. Climate services include building capacity to interpret information and guide data standards in the promotion of social and economic development across climate timescales climate. Key concerns arise from forcings on subseasonal to decadal and longer-term timescales, and land surface feedbacks on forecast reliability, among others. Climate data and information are central for developing decision options that are sensitive to climate-related uncertainties and the design of flexible adaptation pathways. Ideally monitoring should be action oriented to support climate risk assessment and adaptation including informing robust decision making to multiple risks over the long term. Based on the experience of global observations programs and empirical research we outline (1) Challenges in developing effective monitoring and climate information systems to support adaptation, (2) The types of observations of critical importance needed for sector planning to enhance food, water and energy security, and to improve early warning for disaster risk reduction, (3) Observations needed for adaptation including the identification of thresholds, (4) The benefits and the limits of linking regional model output to local observations including analogs and verification for adaptation planning. To support these goals a robust systems of integrated observations are needed to characterize the uncertainty surrounding emergent risks including overcoming unrealistically precise information demands. While monitoring systems design and operation should be guided by the standards and requirements of management, support is needed for those who provide information to the system (e.g. hydromet services). Drawing on information needs to support climate risk management (in drought, water resources and other areas) we outline principles of effective monitoring and develop preliminary strategic guidance for information systems to support preparedness and adaptation being developed through the GEO, GCOS and Global and national frameworks for climate services. Issues and opportunities will be highlighted through specific cases such as sea level and drought.
6. Coordinating Global Land Cover Observations as Contribution to GCOS – Brice Mora (GOFC-GOLD Land Cover Office) B. Mora1, M. Herold2, N.E. Tsendbazar2, F.M. Seifert3, O. Arino3 1. GOFC-GOLD Land Cover Project Office, Wageningen, The Netherlands 2. Laboratory of Geo-Information Science and Remote Sensing, Wageningen University,Wageningen, The Netherlands 3. European Space Agency - ESRIN, Frascati, Italy
- 67 -
Observation of the Earth’s land cover at global scale is essential to characterise climate variability and change, and for understanding the causes. Land cover has a direct influence on water and energy exchanges with the atmosphere, and changes greenhouse gas and aerosol sources and sinks. A series of global scale land cover products, including reference data, has been released over the past decade. However they differ in terms of spatial, and time resolutions, but also in terms of standards which makes product inter-comparison and change assessment difficult, if not impossible. In parallel, specific global-scale products such as tree cover percentage have been published. They aim to support notably monitoring and reporting activities in the context of the recent Climate Agreement. Although these products provide useful information, they do not always meet the needs of some user communities, and proper guidance is often needed to ensure an appropriate use. This presentation will provide an overview of the current state of available global land cover datasets, and discuss possible avenues to overcome the current issues pointed out by different stakeholders (e.g., product inter-comparison, accuracy assessment), in the context of GCOS Implementation Plan.
7. Meteorological approaches to Earth Observation in relation to GCOS requirements – Christopher Merchant (University of Reading) C.J. Merchant1, J. Mittaz1,2, E. Woolliams2, R. Roebeling3, M. Burgdorf4, Y. Govaerts5, R. Giering6, T. Popp7 and D. Moore8 1. University of Reading, Reading, UK. 2. National Physical Laboratory, Teddington, UK 3. EUMETSAT, Darmstadt, Germany 4. University of Hamburg, Hamburg, Germany
5. Rayference, Belgium 6. FastOpt, Hamburg, Germany 7. DLR, Oberpfaffenhofen, Germany 8 University of Leicester, Leicester, UK
Essential climate variables (ECVs) measure parameters that quantify the state of the climate system and elucidate processes of change. To understand change in the climate system requires differences in the value of an ECV to be quantified across time at a relevant spatial scale. GCOS requirements are currently inadequate for specifying the “accuracy” & “stability” of ECV products at intermediate spatio-temporal scales important for climate applications. For robust science, accounting for observational uncertainty is needed. The key uncertainty is often the uncertainty in the comparison of (difference between) two observations aggregated at a certain spatio-temporal scale. A wide range of space-time scales need to be observed for climate science: any combination of space and time resolution for a given ECV may be relevant to different cases. The uncertainty in a difference is scale dependent. For EO-based ECV products, this scale dependence is never trivial – e.g., when aggregating data to a coarser scale, classic “1- over-root-n” averaging of single-pixel uncertainty estimates will generally give an unrealistic uncertainty estimate – often wildly optimistic. Providing users of climate data records with uncertainty information at the scale of their climate application is a complex challenge, and is essentially not addressed at present. The complexity arises because different error sources matter on different scales. Random errors average down; bias errors disappear when calculating differences; such errors are not problematic. However, many errors in EO have spatial structure (which may be time dependent) and temporal correlation. Effects that are negligible in the total uncertainty of a single observation can dominate the uncertainty at a different scale. GCOS requirements take limited account of this by specifying both an “accuracy” requirement (at relatively high resolution) and a “stability” requirement (for the validity of long-term trends). Limitations of the current status include: satellite providers focus on meeting single observation accuracy requirements, with limited analysis of the implications of structured errors for climate applications; those deriving ECVs have no means of developing uncertainty
- 68 -
estimates for their products across the required range spatio-temporal scales; and the ability to estimate and verify ECV product stability is often minimal. Metrological analysis of historic Earth Observations can address these limitations, and is being pursued in the project FIDUCEO (www.fiduceo.eu). Metrology is the science of measurement: there is a body of knowledge and practice that can inform EO as an observational science. In a metrological approach, the observing system is analysed and every effect is characterised and propagated to obtain the amplitude, spatio-temporal structure and correlations of the errors it causes, first in the fundamental climate data record (level 1) and in turn in derived geophysical variables (level 2, ECVs). Rigorous analysis of structured errors at level 1 will support ECV producers in developing downstream uncertainty on multiple scales – including the ability to provide traceable, bottom-up estimates of both “GCOS-style” accuracy and stability to assess performance against GCOS requirements.
8. Data and meta-data exploration and data quality reporting for GCOS – Jared Lewis (Bodeker Scientific) J. Lewis1, G.E. Bodeker1 1. Bodeker Scientific, Alexandra, New Zealand
A key way to assure the quality of measurements being made by the observing networks within GCOS, is to provide near real-time metrics of data quality to the sites within networks making the measurements. It is also important to provide tools to the users of databases serving measurements made by networks within GCOS to explore both the data and meta-data within those databases. This is particularly important for high value databases such as the OSCAR database. This presentation will demonstrate tools that have been developed for GRUAN to facilitate the exploration of GRUAN meta-data, which are applicable to databases across GCOS. A demonstration will be given of the application of novel tools to a number of databases that can easily be adapted to facilitate the exploration of a wide variety of different meta-data. The same tools can also be used to report on data quality to sites within networks. The presentation will include a real-time demonstration of these tools in action.
- 69 -
Posters
Poster Presenter: Okuku Ediang – Hazardous Wrecks Dynamics : An Overview in West Africa Coastal Areas O. Ediang1, A.A. Ediang2
1. Marine Division, Nigerian Meteorological Agency, PMB1215 OSHODI Lagos, Nigeria - Email: [email protected] 2. The Nigerian Maritime Administration and Safety Agency, 6 Burmal Road, Apapa, Lagos,Nigeria Email: [email protected]
In recent years ocean technology has leaped to the aid of scientists by providing them with cost-effective tools that can take measurements of essential biogeochemical variables autonomously, i.e. sensors on autonomous platforms. These autonomous measurements are complementary to efforts carried out by traditional ship-based sampling, with the aim of improving data coverage worldwide. Yet, despite these options becoming more readily available, there is still a gap between the technology (investigators and technicians that deploy these technologies) and the end-user. The high rate of abandoned shipwrecks all over the country's coastal waters has become a major source of headache to both the government and Nigerians, especially regionally in Africa (West Africa). The attempt in this study is however to highlight and examine the role of hazardous wrecks and the meteorological monitoring systems along the coastline of West Africa, Nigeria in particular is discussed. Also considered has been given to the factors affecting developments in the maritime transports by ships, vessels etc by hazardous wrecks and its impacts on navigation and marine safety. The paper conclude by drawing the attention and stimulation of the private sector, urged the relevant stakeholders to expedite action on plans to remove the vessels, causing navigational hazards to other vessels entering the ports, just as it might trigger flooding of the nation's shorelines. Also developing the markets for viable maritime activities, obtaining the necessary finance for viable maritime technologies in the African continental coastlines. Key Words: Hazardous Wrecks, Coastal areas of Nigeria, Meteorology, Coastal degradation, Navigation and Marine safety.
Poster Presenter: Quentin Errera – Satellite Limb Sounders to Support the Stratosphere-troposphere Processes And Their Role in Climate (SPARC) community Q. Errera1, M.J. Alexander2, M. Hegglin3, W. Randel4, K. Rosenlof5, M. Santee6, S. Tegtmeier7 1. Royal Belgian Institute for Space Aeronomy (BIRA-IASB), Brussels, Belgium 2. NorthWest Research Associates, Boulder, CO, USA 3. University of Reading, Reading, United Kingdom 4. National Center for Atmospheric Research, Boulder, CO, USA 5. NOAA Earth Science Research Laboratory, Boulder, CO, USA 6. Jet Propulsion Laboratory, California Institute of Technology, Pasadena, CA, USA 7. GEOMAR Helmholtz Centre for Ocean Research Kiel, Kiel, Germany
Stratosphere-troposphere Processes And Their Role in Climate (SPARC) is a core project of the World Climate Research Program (WCRP) focusing on the atmospheric sciences. Among other activities, SPARC promotes and coordinates atmospheric climate research and scientific reports (e.g. Chemistry Climate Model Validation – CCMVal) in support of the international climate and ozone assessments. Many of these contributions rely on the availability of high vertical resolution profiles of the atmospheric composition (chemical constituents and aerosols) and temperature provided by satellite limb sounders between the upper troposphere and the mesosphere. We had a wealth of stratospheric limb observations during the past 30 years and the long observational records have provided key data to evaluate atmospheric behaviour and
- 70 -
constrain model simulations. Today, five of them are still measuring (ACE-FTS, Odin-SMR, Odin-OSIRIS, Aura MLS and OMPS-LP/SNPP), but they are ageing and there are currently no plans (by any country/agency) to replace them with similar capabilities. This contribution aims at reviewing the manifold scientific use of data sets from limb satellites by the SPARC community. We will discuss the implications of the expected lack of adequate limb measurements in the near future and will provide recommendations for the next GCOS implementation plan.
Poster Presenter: Varduhi Margaryan – Problems Climate Change, Consequences Softening and Adaptation in the Republic of Armenia V. Margaryan Yerevan State University, Department of Physical Geography and Hydrometeorology, Faculty of Geography and Geology, Yerevan, Armenia, Alek Manoukian Street,1, 0025, Tel: (+ 374 98) 868740, Fax: (+ 374 10) 554641, Email: [email protected]
Climate change is a serious problem for humanity. Influences of climate change are sensed in around the world today. The Republic of Armenia as a country with dry climatic conditions is vulnerable in the whole territory of country to climate change. By the estimation of World Bank in the region of Europe and Central Asia Armenia is most sensible country to climate change. So, the main goal in the work was to study, clarify and analysis climate changes in the territory of the Republic of Armenia and work out productive ways of softening of waited influence and adaptation of climate change. The theoretical basis for solving the tasks of research, in particular, are the research works about climate change and its effects’ mitigation. As a methodological basis used by our scientific work are characterization, analysis, statistical analysis, mathematical and correlation methods. As a basic material, flow, temperature and precipitation data have been taken from the Hydromet Service. In the result of studies became clear, that in the territory of republic observe tendencies of decreasing of annual number of atmospheric precipitation and increasing of annual average air temperature. Decreasing of waited water resources, increasing of drainage territory, increasing the frequency of hydro meteorological dangerous events, negative changes of natural ecosystems will reflect negatively on health of population, vulnerable spheres of economy. So, taking account above-mentioned, in the work have been suggested the methods of softening and adaptation of consequences of effects of climate change in studying area, for its realization are necessary large capital investments. It is very important the circumstance to work out the mechanisms of acquisition of financial mean, also immediate participation of society in arrangements to softening of consequences of climate change.
Poster Presenter: Mikhaela Pletsch – Big, Open and Linked Data as a tool to real-time and history global climate observation at Monitoring Center of Essential Climate Variables M.A.J.S. Pletsch1, R. Matheus2, T.S. Körting1, V.F. Velázquez3 1. Brazilian Institute of Space Research (INPE), São José dos Campos, Brazil 2. Delft University of Technology, Delft, Netherlands 3. University of São Paulo - School of Arts, Science and Humanities, São Paulo, Brazil
Currently, 50 Essential Climate Variables (ECVs) are required to support the work of the United Nations Framework Convention on Climate Change (UNFCCC) and the Intergovernmental Panel on Climate Change (IPCC). The variables were developed according to theirs techno-economic feasibility and were divided in three main domains: 1) Atmospheric (over land, sea and ice); 2) Oceanic; 3) Terrestrial. The observations refer to physical and chemical data that require
- 71 -
expert knowledge in their specific areas of study. Those large datasets characterizes the Big, Open and Linked Data (BOLD). It means to have simultaneously a huge quantity, diversity, variety and velocity of data collection, storage and analyze of standardized and open data format. The recent computer hardware and software features and capacity enabled to deal with BOLD of ECVs. Even considering the advances, stakeholders as scientists and governments, still face issues to analyze the BOLD of ECVs. From this puzzle, this paper aims to consider the current development challenges to improve the UNFCCC and the IPCC international public policy. As an approach to reach the objective of this paper, it was conducted a scientific and practical literature review identifying gaps on: 1) ECVs data and infrastructure; 2) integration and analysis of data; 3) Decision-making and public policies. The expected results are guidelines with a set of recommendations on each aforementioned gaps with the objective of improving the data quality and collection of ECVs, creating an Information and Communications Technology (ICT) infrastructure and architecture that support sufficient computing capacity to enable BOLD work, creating a diversified team of analysis to deal with BOLD and creating an integrated and real-time Monitoring Center of ECVs. This Center aims to enable a faster and effective international, national, regional and local data analysis and decision making that will combine the identified recommendations: i) automatized data collection from huge number of sensors on Earth (Internet of Things) - requiring the installation of sensors in several points on the planet; ii) automatized storage and access (modern open data portal) of data from sensors on the planet - requiring massive computational capacity to storage, treat and process data; iii) automatized data analysis (mathematical modeling) - requiring multidisciplinary teams that deal with data analysis and with expertise on environmental public policies; and, iv) dashboards at videowall (big screens on a wall) displaying the data analysis of real-time and history of BOLD of ECVs on a business intelligence with geographical and analytical report features.
Poster Presenter: Nick Rayner – The EUSTACE project: combining different components of the observing system to deliver global, daily information on surface air temperature N. A. Rayner1, R. Auchmann2, J. Bessembinder3, S. Brönnimann2, Y. Brugnara2, E. Conway4, D. Ghent5, E. Good1, K. Herring1, J. Høyer6, J. Kennedy1, F. Lindgren7, K. Madsen6, C. Merchant8, J. Mitchelson1, C. Morice1, P. Ortiz5, J. Remedios5, G. van der Schriery3, A. Stephens4, R. Tonboe6, A. Waterfall4 and R. I. Woolway8 1. Met Office Hadley Centre, Exeter, UK 2. Oeschger Centre, University of Bern, Bern, Switzerland 3. KNMI, de Bilt, The Netherlands 4. CEDA, STFC, Harwell, UK
5. University of Leicester, Leicester, UK 6. Danish Meteorological Institut, Copenhagen, Denmark 7. University of Bath, Bath, UK 8. University of Reading, Reading, UK
Day-to-day variations in surface air temperature affect society in many ways and are fundamental information for many climate services; however, daily surface air temperature measurements are not available everywhere. A global daily analysis cannot be achieved with measurements made in situ alone, so incorporation of satellite retrievals is needed. To achieve this, we must develop an understanding of the relationships between traditional surface air temperature measurements and retrievals of surface skin temperature from satellite measurements, i.e. Land Surface Temperature, Ice Surface Temperature, Sea Surface Temperature and Lake Surface Water Temperature. Here we reflect on our experience so far within the Horizon 2020 project EUSTACE of using satellite skin temperature retrievals to help us to produce a fully-global daily analysis (or ensemble of analyses) of surface air temperature on the centennial scale, integrating different
- 72 -
ground-based and satellite-borne data types and developing new statistical models of how surface air temperature varies in a connected way from place to place. Our experience also allows us to consider requirements for various aspects of the surface temperature observing system, e.g.: • The information needed to provide consistent, multi-component estimates of uncertainty in surface skin temperature retrievals from satellites; • The impact of inhomogeneities in daily surface air temperature measurement series from weather stations; • The information needed to develop sufficient understanding of the relationship between skin and air temperature to allow us to combine information from these different observing system components; • What we need to evaluate our results; • The information needed in order to enable the use of new statistical techniques to provide information on higher spatial and temporal scales than currently available, making optimum use of information in data-rich eras.
Poster Presenter: Shawn Smith – ICOADS Value-Added Database (IVAD) S. R. Smith1, M. A. Bourassa1,2, S. J. Worley3, and D. I Berry4 1. Center for Ocean-Atmospheric Prediction Studies, The Florida State University, Tallahassee, USA 2. Earth, Ocean, and Atmospheric Science Department, The Florida State University, Tallahassee, USA 3. National Center for Atmospheric Research, Boulder, USA 4. National Oceanography Centre, Southampton, UK
The International Comprehensive Ocean-Atmosphere Data Set (ICOADS) Value-Added Database (IVAD) project will be described, highlighting its role in improving observational data for climate studies. The presentation will provide an overview of the IVAD project, with a focus on the role IVAD has in providing expert-developed adjusted data values (e.g., bias or height corrections) and uncertainty estimates for ECVs to the climate community. IVAD is designed to allow experts to add adjustments to individual marine reports in ICOADS and provides a mechanism for the adjustments to be served to the public alongside the original ICOADS marine reports. The IVAD concept will allow future developers of air-sea exchange products, satellite retrieval algorithms, and reanalyses to easily apply community-developed adjustments to individual marine reports without the need to locate numerous manuscripts and apply individual data adjustment algorithms. Distribution of IVAD records is made possible by enhancing the ICOADS underlying international marine meteorological archive (IMMA) data format to include unique identifiers on each record and the capability to add a documented IVAD specific attachment, where required. Development of IVAD records will be described, including those for diurnal ship heating biases in air temperature, estimated wind corrections, and enhanced cloud reports. Plans to distribute these initial IVAD records within the framework of release 3.0 of the ICOADS, to be published in 2016, will be provided.
Poster Presenter: Eric Vermote – Toward a Consistent Land Long Term Climate Data Records from Large Field of View Polar Orbiting Earth Observation Satellites E. Vermote1, J.C. Roger2, B. Franch2, C. Justice2 1. NASA Goddard Space Flight Center, Code 619, Greenbelt, MD, USA 2. University of Maryland, College Park, MD, USA
Surface reflectance is one of the key products used in developing several land Essential Climate Variables, such as Vegetation Indices, Albedo and LAI/FPAR, it is therefore seminal to detecting trends in the biosphere and land surface and has been classed by NOAA as a “Fundamental Climate Data Record (FDCR) for Land”. Building a long-term surface reflectance data record of climate quality implies combining different instruments, sensors and satellites,
- 73 -
accounting for different spatial resolutions and spectral characteristics, assuring consistent calibration, and correcting for atmospheric and directional effects. As the spatial resolution issue is addressed by aggregating the original data to a resolution still suitable for climate studies (e.g. 0.05 degree latitude, longitude), the instrument calibration becomes the first major hurdle one has to go through before being able to proceed any further. In this work, we use robust reflectance data records and inter-comparison methods that we have developed over the past several years (consisting of atmospheric correction, directional effect correction and spectral normalization) to establish and verify the inter-consistency of the reflectance products from the AVHRR sensors on-board NOAA 7, 9, 11, 14, 16, 17 and 18, the MODIS sensors on-board Aqua and Terra and the VIIRS sensors on-board Suomi-NPP and JPSS1. The resulting dataset being the 35+ years surface reflectance product and vegetation indices from 1981 to present which provides a solid basis for deriving a number of Terrestrial Essential Climate Variables.
Poster Presenter: Christopher Merchant – Toward a Consistent Land Long Term Climate Data Records from Large Field of View Polar Orbiting Earth Observation Satellites A.N. Tyler1, S.B. Groom2, C.J.Merchant3, P.D. Hunter1, E. Spyrakos1, C. Riddick1, S.G.H. Simis2, R. O’Donnell4, C.A. Miller4, E.M. Scott4, C. Brockmann5 1. Biological and Environmental Sciences, School of Natural Sciences, University of Stirling, UK 2. Remote Sensing Group, Plymouth Marine Laboratory, Prospect Place, The Hoe, Plymouth, UK 3. Dept. of Meteorology, University of Reading Room 184, Harry Pitt Building, 3 Earley Gate, PO Box 238 Whiteknights, Reading, RG6 6AL 4. School of Mathematics and Statistics, University of Glasgow, Glasgow, UK 5. Brockmann Consult, Max-Planck-Str. 2, 21502 Geesthacht, Germany
- 74 -
Poster presented by Christopher Merchant
- 75 -
C. Planning for future global climate observations The final day outlines a future programme of climate observations based on improved communication with a variety of stakeholders, technology improvements, and requirements that arise from recent climate negotiations and treaties.
Session V: Future Observations and Communication of climate science – (Chairs: Pascal Lecomte, Michel Verstraete and Stephen Briggs)
Abstracts
1. Vital Signs for Managing Climate Change – Keynote talk by Charles Kennel (SCRIPPS Institution of Oceanography) C.F. Kennel1, S.A. Briggs2, D.G Victor3 1. Scripps Institution of Oceanography, UC San Diego, USA. 2. ESA-ECSAT, Harwell, UK. 3. School of Global Policy and Strategy, UC San Diego, USA.
Many quantities have been used to describe climate and its likely trajectory. Yet policy makers and the public hear mostly about only one of them - global surface temperature. The goals of climate policy are rarely expressed in terms other than global temperature and much of the public debate is around this single parameter. The 2C goal adopted by UNFCCC has been identified by IPCC as critical and has the merit of being simple and understandable. But surface temperature is by no means the best or the most unequivocal tracer of climate change: less than 2% of global energy content goes into heating the atmosphere. There are also many other and possibly better indicators to communicate the rate and extent of climate change – sea level rise, ice extent, ocean acidification, and so on. While many climate change metrics and indicators already exist, there is a need for an agreed set of planetary vital signs that replaces the sole use of temperature to focus policy analysis. The two-degree goal focused the work of the scientific and policy communities. Now attention is turning to how to make and measure progress in climate change mitigation and adaptation after COP21. This time, the policy community will need a basket of indicators to organize attention. In addition to metrics that track changes in the physical climate, policy makers need risk indicators. Change metrics and risk indicators differ in the way they handle uncertainty. Climate change metrics track most probable outcomes and not outliers. On the other hand, the greatest risks are often associated with those outliers. Clearly, the methods used to develop climate metrics cannot be translated wholesale into those that produce risk indicators. Neither type suffices. Both are needed. Risk can only be defined in relation to desired objectives. As an important example, in September 2015, the UN General Assembly endorsed a set of 17 sustainable development goals and 169 associated scientific and social indicators, of which at least 65 are directly related to spatially disaggregated descriptors of the physical Earth system.
- 76 -
An international effort convening natural and social scientists, policy experts, decision makers, and communicators should commence forthwith to design the initial vital signs. If initial vital signs are not in place at the entry into force of COP-21 commitments in 2020, it will be hard to infuse them into policy analyses later. The 2020 deadline would indicate a timeline something like: • Phase A (2016-2018): Nomination and vetting of initial vital signs; • Phase B (2018-2020): Beta-testing (experimental production), development of certification
and governance mechanisms, finalization of basket; • Phase C (2020- ): Implementation.
2. Evolving Essential Climate Variables into Public-Private Partnerships for Societal Benefit – Keynote talk by Mike Tanner (NOAA) Michael D. Tanner1 1. NOAA National Centers for Environmental Information, Center for Weather and Climate; Asheville, North Carolina, USA
Based on the GCOS ECVs, the understanding of climate risks and impacts of extreme events is growing for public and private companies. Government and other organizations are investing in building capacity for adaptation and resiliency of their infrastructure, energy supply, and other core operational elements. As private sector companies start assessing their options, it raises several needs for relevant climate and environmental information for improved risk management and opportunities for innovation. In addition, key fundamental questions arise such as “How do I analyse the risks to my company,” “What are the information sources for data and expert services,” and “What is the motivation or business case?” This discussion will 1) provide an overview of the National Oceanic and Atmospheric Administration (NOAA) National Centers for Environmental Information (NCEI) as an information source, 2) give insights into climate change trends, nationally and locally, and 3) portray examples of climate adaptation and resilience from other companies and organizations. In addition, I will discuss a framework that showcases how government and private sector sectors are moving forward in investing in resiliency. This dialogue is an opportunity for interaction between government, industry, and academic leaders about the role of environmental information in fostering greater resilience in the public and private sectors. Earlier this year NOAA Satellite and Information Services (NESDIS) moved into a new organizational structure, including the merger of our four data centers into the National Centers for Environmental Information. NCEI is responsible for hosting and providing access to one of the largest archives, with comprehensive oceanic, atmospheric, and geophysical data. From the depths of the ocean to the surface of the sun and from million-year-old tree rings to near real-time satellite images, NCEI is one of the leading authorities for environmental information. This is a great opportunity to grow awareness of the products and services that NCEI’s Center for Weather and Climate provides that can and do supplement and support critical decisions made across the public-private sector impacting citizens across the U.S. and world each day.
3. Climate change impacts and mitigation processes – S. K. Sharma (Carman Residential and Day School)
Climate change is considered to be one of the most serious threats to sustainable development, with adverse impacts on rising sea levels, desertification, extreme storms, loss of farmland and food sources, salinization of fresh water, and other physical and health-related
- 77 -
effects can lead to increases in civil strife, the number of environmental refugees, and conflicts among nations. Scientists agree that rising concentrations of anthropogenically produced greenhouse gases in the Earth’s atmosphere are leading to changes in the climate. The local observations of climate change in India are witnessed by fact that the frequency of hot days and multiple-day heat waves have increased in past century followed by the Increase in deaths due to heat stress in recent years ; the entire Himalayan Hindu Kush ice mass has decreased in the last two decades. Hence, water supply in areas fed by Himalayan glacier melt, on which hundreds of millions of people in India depend, are negatively affected ; precipitation decline and droughts in most delta regions of India due to warmer climate have resulted in drying up of wetlands and severe degradation of ecosystems ; the gross per capita water availability in India will decline from ~1820 m3/yr in 2001 to as low as ~1140m3/yr in 2050. Serious and recurrent floods and droughts ; sea-level rise leads to intrusion of saline water into the fresh groundwater in coastal aquifers and thus adversely affects groundwater resources ; for two small and flat coral islands at the coast of India, the thickness of freshwater lens was computed to decrease from 25m to 10m and from 36m to 28m, respectively, for a sea level rise of only 0.1m ; more than 1million people in the Ganges-Brahmaputra delta will be directly affected by 2050 from risk through coastal erosion and land loss, primarily as a result of the decreased sediment delivery by the rivers, but also through the accentuated rates of sea-level rise. The world is already 0.3ºC warmer than the recommended maximum temperature cap and we are 50ppm CO2e above the maximum greenhouse gas cap. It is clear that we have already commenced the process of causing dangerous climate change now. Raising public awareness of climate change through mass media is crucial for transforming individual behaviour and amassing support to policy measures. Adaptation and mitigation to the adverse impacts of climate change increasingly becomes a necessity across the globe. This is not for its own sake, but to ensure that sustainable development will be possible, that investments into poverty reduction, food and water security and health will not be undone and that progress achieved towards the Millennium Development Goals will not be reversed. The key strategies for cutting greenhouse gas emissions to zero are resource efficiency backed up by the substitution of renewable energy for fossil fuel sources. The major drawing down of CO2 can be achieved by using natural carbon sinks and deliberate human capture and sequestration of this gas such as growing biomass for use as biofuel and capture the CO2 when the fuel is combusted and then geosequester it or by growing forests that create water dynamics that efficiently capture heat from the land surface and redistribute it to the upper boundary of the troposphere where it can more easily radiate into space.
4. Supporting activities to interdisciplinary global programmes as GCOS – Gueladio Cisse (ICSU)
5. Progress toward an Integrated Global Greenhouse Gas Information System (IG3IS) – Diane Stanitski (NOAA ESRL) Diane M. Stanitski1, James H. Butler1, Philip L. DeCola2, Oksana Tarasova3, Deon Terblanche3 1. NOAA Earth System Research Laboratory, Boulder, Colorado, USA 2. Sigma Space Corporation, Washington DC, USA 3. World Meteorological Organization, Geneva, Switzerland
Accurate and precise measurements show the inexorable rise of atmospheric greenhouse gas (GHG) concentrations from human socioeconomic activity. As the negative impacts of rising global temperatures are becoming increasingly evident, nations, states, cities and private enterprises are accelerating efforts to reduce emissions of GHGs. Atmospheric measurements and models are already being used to provide emissions information on a global and continental scale through existing networks, but these efforts currently provide insufficient information at the human-dimensions to inform valuable and additional actions for reducing GHG emissions.
- 78 -
The UNFCCC process and the resulting Paris Agreement stand upon the bedrock of sound scientific research and observations. Likewise, the successful management and evaluation of GHG emissions reduction policies will also depend on GHG concentration measurements and our ability to follow their changes over a range of temporal and spatial scales. Based upon the recent advances in GHG observation technologies, the means of acquiring socioeconomic activity data, and the computational models used to merge these data, WMO and its partners are developing a plan for an Integrated Global Greenhouse Gas Information System (IG3IS) able to evaluate the efficacy of policy, reduce emission inventory uncertainty, inform additional mitigation actions, and support the planning and management of Intended Nationally Determined Contribution (INDC) mitigation efforts by nations as part of the Paris Agreement. To work effectively, IG3IS must deliver useful information at national and sub-national, policy-relevant scales. Existing surface-based networks, emerging networks in developing countries, and new aircraft-based measurements and satellite observations make a difference, but additional observations and improved transport modelling are critical. This presentation will look at what is available, what the gaps are, and how IG3IS intends to address them.
6. The Copernicus Climate Change Service (C3S)- a European response to Climate Change ECMWF – Dick Dee (ECMWF) J.-N. Thépaut1, D. Dee1, B. Pinty2
1. ECMWF 2. DG-GROW, European Commission
In November 2014, The European Centre for Medium-range Weather Forecasts (ECMWF) signed an agreement with the European Commission to deliver two of the Copernicus Earth Observation Programme Services on the Commission’s behalf. The ECMWF delivered services - the Copernicus Climate Change Service (C3S) and Atmosphere Monitoring Service (CAMS) – will bring a consistent standard to how we measure and predict atmospheric conditions and climate change. They will maximise the potential of past, current and future earth observations - ground, ocean, airborne, satellite - and analyse these to monitor and predict atmospheric conditions and in the future, climate change. With the wealth of free and open data that the services provide, they will help business users to assess the impact of their business decisions and make informed choices, delivering a more energy efficient and climate aware economy. These sound investment decisions now will not only stimulate growth in the short term, but reduce the impact of climate change on the economy and society in the future. C3S is in its proof of concept phase and through its climate data store will provide: • global and regional climate data reanalyses; • multi-model seasonal forecasts; • customisable visual data to enable examination of wide range of scenarios and model the
impact of changes; • access to all the underlying data, including climate data records from various satellite and
in-situ observations. In addition, C3S will provide key indicators on climate change drivers (such as carbon dioxide) and impacts (such as reducing glaciers). The aim of these indicators will be to support European adaptation and mitigation policies in a number of economic sectors. The presentation will provide an overview of this newly created Service, its various components and activities, and a roadmap towards achieving a fully operational European
- 79 -
Climate Service at the horizon 2019-2020. It will focus on the requirements for quality-assured Observation Gridded Products to establish an operational delivery of a series of gridded long-term Climate Data Records (CDRs) of Essential Climate Variables (ECVs), along with associated input data and uncertainty estimation.
7. Planning and evaluating climate observing systems of the future – Elizabeth Weatherhead (University of Colorado Boulder, Boulder, Colorado, USA)
Observations are needed to respond to critical needs of climate science. Five high priority areas have been identified for climate research by the World Climate Research Program: clouds, circulation and climate sensitivity; regional sea level change and coastal impacts; melting ice; climate extremes; and water availability. Each of these challenges involves many important scientific questions that can be focused around three themes of long-term changes, mechanisms and projections. For some of these questions, a primary challenge to scientific progress is the lack of appropriate observations. Within the US there is an effort to identify observationally limited scientific questions around the framework of these grand challenges. The first part of the challenge is to develop appropriate hypotheses and identify the observations that are needed to address these hypotheses. The second part of the challenge is to critically evaluate proposed observing systems to determine their appropriateness for addressing the scientific question. At a minimum, proposed observing systems will need to have the accuracy, spatial coverage/resolution, temporal resolution and completeness to address the scientific hypotheses. The evaluation of these criteria is best carried out as an independent effort to assure that the investments are appropriate and the science needs are adequately addressed. This presentation will summarize the efforts to coordinate these ideas within the US and offer examples of approaches for evaluation of planned observing systems. Current techniques build from successful weather Observing System Simulation Experiments (OSSEs) but with critical adaptation to climate questions. Techniques have been successfully applied to carbon fluxes, total column ozone trends and water vapor measurements. By placing climate science questions as the starting point, there future observing systems are more likely to serve the needs of the science community in addressing the most important areas of research. The identification of critical observations also opens the door for unexpected breakthroughs in observing capabilities, such as has occurred with Global Positioning System occultation and dispersed pressure sensors.
8. Space-based component of WMO Integrated Global Observing Systems (WIGOS) – Wenjian Zhang (WMO)
The Seventeenth of World Meteorological Congress (2015, Geneva) decided to implement the Pre-Operational Phase WMO Integrated Global Observing System (WIGOS) for the Financial Period (2016-2019), with the purpose and the vision for further developing an integrated, coordinated and comprehensive observing system (including both surface-based and space-based components) to satisfy, in a cost-effective and sustained manner, the evolving observing requirements of Members in delivering their weather, climate, water and related environmental services. WIGOS will provide a framework for enabling the integration and optimized evolution of WMO observing systems, and of WMO’s contribution to co-sponsored systems (GCOS, GOOS, GTOS) and GEOSS, resulting in increased knowledge and enhanced services across all WMO Programmes.
- 80 -
For facilitating the long-term planning and development of WIGOS, in September 2014, the Extraordinary Session of the Commission for Basic Systems (CBS-Ext(2014)) encouraged the initiative to develop a new Vision of the WMO Integrated Global Observing System (WIGOS), including component observing systems (i.e. surface-based component and space-based component) in 2040. The new horizon of the vision was set to 2040 in order to be ahead of currently firm satellite plans, since a vision document should serve as guidance in the early planning stage rather than just reflect existing plans. The Vision shall be ambitious but achievable. The development of a WIGOS Space Vision was approached by three different angles. First of all, the new vision should aim to respond to the Global Societal Needs (GSNs) addressed in the WMO Strategic Plan and with the anticipated evolution of these GSNs in the horizon of 2040, in the context of WIGOS and of the increasing maturity of space applications and the emerging requirements of WMO important application areas which are not fully addressed by current plans (e.g. to Global Framework for Climate Services, air quality, hydrology, and cryosphere monitoring). Secondly, the vision should consider the opportunities opened or anticipated from advances in satellite and instrument technology, including the advent of a new generation of low earth orbit (LEO) and geostationary meteorological environmental satellites (GEO) launches around the global in the 2015-2030+ timeframe and will provide services till 2040; lessons learnt from demonstration missions that, by 2040, will be mature for transition from R&D or demonstration stage to operational stage (e.g. GPM, GRACE, SMOS, Doppler lidar, etc.), and possible new concepts. Rapid progress in technological capabilities will allow improved performances in terms of spectral, spatial, temporal and radiometric resolution, which also bears on the amount of data to be exchanged. Finally, attention should be paid to emerging changes in the provider community considering the increased number of space-faring nations, the range of possible approaches between large and very small satellite programmes, and the balance to be found between an increasing capability of the private sector to contribute to the system and the specific responsibilities of governmental entities. Opportunities and risks should be carefully analysed considering the possible technological evolution, as well as the key strategies for optimal integration of space-based and surface-based observation capabilities. The presentation will communicate the WMO Strategic Plan, which provides a high-level statement of the future direction and priorities of the WMO. Building on the Global Societal Needs described in the Strategic Plan, the roadmap for developing WIGOS Space vision 2040 will be presented, capturing the vision and anticipation of climate and GCOS services requirements in the 2040 time horizon, taking into consideration the great opportunities and benefits of planned new generation of meteorological and environmental satellites and the potential critical gaps for meeting future climate requirements.
9. Integrating ocean observations across the coastal shelf boundary – Bernadette Sloyan (CSIRO) B.M. Sloyan1, J. Wilkin2, R. E. Todd3, C. A. Edwards4 1. Commonwealth Scientific and Industrial Research Organisation (CSIRO), Hobart, Tasmania, Australia 2. Institute of Marine and Coastal Sciences, Rutgers University, NJ, USA 3. Woods Hole Oceanographic Institution, MA, USA 4. University of California, Santa Cruz, CA, USA
The coastal ocean and near shore zone influences a diverse range of human activities including maritime industry, recreation, and defence, and it plays a vital role in environmental health and productivity that deliver important ecosystem services. Coastal circulation is driven by local terrestrial influences at the land shore boundary, coastal zone meteorology, tides, and
- 81 -
equally importantly by remote forcing at the shelf-sea/open-ocean boundary. On coasts for which estimates exist, fluxes of nutrients and carbon across this boundary are leading order terms in the nitrogen and carbon budgets of shelf ecosystems. The coastal ocean and shelf edge dynamics have immediate impact on ecosystem function and productivity on weekly to seasonal time scales, but can also drive multi-decadal changes in ecosystem structure through effects on habitat ranges and biodiversity. Changes in watershed land use and global weather will alter the net volume and characteristics of variability of river flows discharge into the coastal zone. The provision of robust three-dimensional and time-varying coastal and shelf circulation models is seemingly within reach through advances in data-assimilative ocean models. However, development of integrated systems (ocean, land and atmosphere) that could deliver the scope of observations required and the model capable of fully utilizing them is challenging. To succeed, this will require a coordinated international effort that brings together the expertise in observations and modelling across all domains.
10. Ocean Heat Content – Keynote talk by Matthew Palmer (Met Office Hadley Centre)
11. What are the needs for a post-COP21 monitoring? – Keynote talk by Philipe Cias (LSCE)
12. The GEO Carbon Cycle and Greenhouse Gas Flagship – Antonio Bombelli (CMCC - Euro-Mediterranean Center on Climate Change) A. Bombelli1, J.H. Butler2, J.G. Canadell3, P. Ciais4, P. DeCola5, A.J. Dolman6, W.L. Kutsch7, H .Loescher8, H. Muraoka9, A. Obregón10, S.E. Plummer11, N. Saigusa12, T. Tanhua13, M. Telszewski14, A.T. Vermeulen15, L. Yi IAP/CAS16 1. CMCC, Italy 2. NOAA, US 3. CSIRO, Australia 4. LSCE, France 5. SIGMA, US 6. VU University, Amsterdam, Netherlands 7. ICOS, Finland 8. NEON, US
9. Gifu Univ., Japan 10. GEO, int. 11. ESA Climate Office, UK 12. NIES, Japan 13. GEOMAR, Germany 14. IOCCP, int. 15. ICOS, Lund Univ., Sweden 16. IAP/CAS, China
The budgets of carbon and other greenhouse gases (GHGs) still carry many uncertainties that make evaluating the success of climate change mitigation and adaptation strategies difficult. Improvements in long-term, high quality observing systems within and across the atmospheric, oceanic, terrestrial, and human domains are required to quantify GHG sources and sinks, to understand changes in the carbon cycle and hence the climate system, and to address society’s efforts to mitigate and adapt to climate change. Many observing efforts and initiatives are currently in place at global and regional levels, but what is needed is a global coordinating mechanism to provide useful and comparable information to resource managers and policy makers. A global initiative, the GEO-Carbon Cycle and GHG Flagship, is proposed in the framework of GEO to promote interoperability and provide integration across the different parts of the system, particularly at the interfaces of the different domains. The intention is neither to rewrite new strategies nor duplicate existing efforts, but instead to build on existing initiatives and networks, ensure their continuity and coherence, and fill in the missing pieces to obtain a comprehensive, globally coordinated, carbon observation and analysis system.
- 82 -
The GEO-Carbon Flagship shall address policy agendas and will operate as a common and open platform to plan and implement strategies and joint activities at the global level from science to policy. The main aim of the Flagship is to develop an independent system for monitoring and evaluating changes in the carbon cycle and GHG emissions as they relate to human activities and climate change, and to provide decision makers with timely and reliable policy-relevant information, recommendations, and services. Such services would include physical information, such as changes in distributions and fluxes, but also cost-estimates and evaluations of social impacts associated with emissions reduction, land-change, or ocean management efforts. Among the first activities will be identification of users and needs, along with an analysis of knowledge gaps, how such gaps can be addressed effectively, and how the existing networks and observing approaches can be reconciled and used more effectively.
13. Essential Climate Variables to Support Climate Change Mitigation in the Land Use Sector – Martin Herold (Wageningen University) M. Herold1, R. M. Roman1 , B. Mora1 , C. Richter2 , O. Arino3, F. M. Seifert3 1. Wageningen University, The Netherlands 2. GCOS secretariat, WMO, Geneva, Switzerland 3. ESA-ESRIN, Frascati, Italy
Long-term observation is fundamental to the provision of sound and accessible information needed for sustainable environmental resource management globally including mitigation of greenhouse gas emissions, and the adaptation to climate change that is already an inevitable consequence of past emissions. Opportunities to improve the quality of observations need to be pursued in order to strengthen information available for these purposes, on a global basis and in particular for least developed regions. So far the monitoring of Essential Climate Variables (ECVs) identified by the Global Climate Observing System (GCOS) has focused mainly on the physical climate system, and the needs of climate modelers and others undertaking work assessed by IPCC Working Group I, with little attention paid to human activities and the needs and requirements of climate change mitigation. Accordingly, GCOS and GOFC-GOLD organized an expert meeting, which took place from 5-7 May 2014 at WMO headquarters (http://www.wmo.int/pages/prog/gcos/index.php?name=ObservationsforMitigation). The meeting considered observation requirements for mitigation, reviewed the ECVs and associated guidelines and their adequacy for mitigation, and how to address gaps and deficiencies identified. The meeting focused on land use to exemplify ideas and options to expand upon ECV observations because the AFOLU sector is currently the sector with the largest data gaps and user needs, and also the sector where the ECV concept seems to be most relevant to mitigation. The discussions have led to important considerations for the role and importance of ECV’s in land-based mitigation and has important influence for the type, quality and consistency of space-data needed to support ECV monitoring. The workshop results have been synthesized and as a result GCOS expects that the revised focus of the ECVs will: • Better consider the relationship between ECVs (especially those related to biomass, land
cover, fire, and soil carbon) and the IPCC greenhouse gas inventory guidance for AFOLU, and suggest a revision to the ECV list in time for the next Implementation Plan;
• Consider how ECVs relate to the remote sensing product list; • Stimulate the generation of a full global map of land use changes, tracking reported
emissions data under the IPCC land use categories;
- 83 -
• Better coordinate with information important for mitigation (not covered within the current ECV context) on land management, drivers and agents of change, and other economic indicators.
The presentation will describe these new developments and give examples on how they can be put in practice.
14. First review of COP-21 and potential impacts on Space Agencies – Pascal Lecomte (Joint CEOS/CGMS WG Climate Chair - ESA)
The Committee of Earth Observation Satellites was represented in both formal events as the Subsidiary Body for Scientific and Technological Advice (SBSTA) and various side events, both at Le Bourget for the official COP and at Le Grand Palais for a Public side event. An universal agreement was reached on 12 December and approved by the 195 parties present at the Conference. The main aim of which is to keep a global temperature rise this century well below 2 degrees Celsius and to drive efforts to limit the temperature increase even further to 1.5 degrees Celsius above preindustrial levels. This agreement was acknowledged by Christiana Figueres, Executive Secretary of the United Nations Framework Convention on Climate Change (UNFCCC), who said: “One planet, one chance to get it right and we did it in Paris. We have made history together. It is an agreement of conviction. It is an agreement of solidarity with the most vulnerable. It is an agreement of long-term vision, for we have to turn this agreement into an engine of safe growth.” In addition, it captures essential elements to drive action forward by covering all the crucial areas identified as essential for a landmark conclusion: • Mitigation – reducing emissions fast enough to achieve the temperature goal; • A transparency system and global stock-take – accounting for climate action; • Adaptation – strengthening ability of countries to deal with climate impacts; • Loss and damage – strengthening ability to recover from climate impacts; • Support – including finance, for nations to build clean, resilient futures. As well as setting a long-term direction, countries will peak their emissions as soon as possible and continue to submit national climate action plans that detail their future objectives to address climate change. The scope of this oral presentation is to present the impact of the results of COP-21 on the programmes and activities to be carried out by CEOS and the Space Agencies .
15. The WCRP-FPA2 Polar Challenge- promoting a scalable, cost-effective and sustainable monitoring system – Michel Rixen (World Climate Research Programme, Geneva, Switzerland)
The World Climate Research Programme (WCRP) and the Prince Albert II of Monaco Foundation (FPA2) are promoting a Polar Challenge (www.wcrpclimate.org/polarchallenge) that will reward the first team to complete a 2000 km mission with an Autonomous Underwater Vehicle (AUV) under the Arctic or Antarctic sea-ice. Bonus awards will go to the team that can demonstrate that they have taken regular measurements of sea-ice thickness or draft and to those who successfully transmit their under-ice position and environmental data to operational networks. In situ ocean observations in polar regions are inherently expensive, risky and sparse, even more so under the sea-ice. A new paradigm is required to complement remotely sensed Earth observations.
- 84 -
WCRP and FPA2 aim to promote technological innovation towards a future cost-effective, autonomous and scalable observing network for sea-ice covered regions based on a fleet of AUVs. The ultimate goal is to achieve what ARGO (www.argo.ucsd.edu/) has accomplished for the open ocean. This initiative can have a tremendous impact in shaping future climate research in the polar regions. New collocated multidisciplinary data sets of sea-ice and under-ice properties at unprecedented temporal and spatial resolution far into unexplored territories could revolutionize our knowledge of climate change in those regions, for example, in the areas of heat fluxes and storage, fresh water exchanges, carbon sequestration and ocean acidification. Ultimately, this proof of concept could be scaled up into a game-changing ocean monitoring network for the poles with wide-ranging benefits for climate research and services as well as for other sectors such as climate adaptation and mitigation policies, environmental protection, weather forecast, tourism, safety, security, transport, energy, biodiversity, fisheries and insurance.
- 85 -
Posters
Poster Presenter: Andreas Becker – Towards climate robust high-resolution precipitation monitoring and re-analysis A. Becker1, R. Hollmann2, M. Werscheck 1. Global Precipitation Climatology Centre, Deutscher Wetterdienst, Offenbach am Main, Germany 2. Satellite Application Facility on Climate Monitoring, Deutscher Wetterdienst, Offenbach am Main, Germany
Precipitation is a key element of the hydrological cycle. Its amount, intensity and duration as well as changes in totals, variability and extremes have a direct impact on the community regarding e.g. water availability, droughts, and flooding. However, the IPCC AR5 WG1 report has again identified deficiencies in the capabilities of current precipitation data sets and gridded analyses in terms of coverage, geo-spatial resolution and data homogeneity, limiting confidence in assessments and their attribution to climate change. On the other hand climate change and the related adaptation pressures have enhanced the demand for timely access to accurate, consistent, reproducible and current data in particular on the essential climate variable precipitation, including its robustness for climatological assessments. We provide an overview on recent achievements (post AR5 WG1) in precipitation monitoring specific for the supporting observational regimes (in-situ, satellite, radar and micro-link) but also through the combination, cross-calibration and re-processing of observations and ultimately through re-analyses products such as the first European coupled reanalysis of the 20th century currently built by the ERA-CLIM2 project. We want to show the current and future capability of the integrated assessment and utilization of the variety of monitoring and re-analysis approaches to: • Tailor products for the growing user community; • Assess the uncertainty and reliability of precipitation products; • Increase data homogeneity for trend analysis; • Cross-fertilize purely observational and model based re-analyses; • Develop and provide a global (land & ocean) precipitation product by merging/fusing gauge and satellite information. Extreme precipitation is of particular relevance and accompanied by high vulnerabilities especially in urban areas. Here high-resolution measurements and analysis of precipitation is crucial in order to describe the hydrological response and to improve water risk management. In this context radar based precipitation climatology bears the potential to enhance the geo-temporal resolution of heavy precipitation risk maps by at least one order of magnitude. We show examples how most recent precipitation observation and re-analysis based data sets do and will contribute to the WCRP GC on ‘Understanding and Predicting Weather and Climate Extremes’ and on ‘Water Availability’ and become more and more instrumental to size measures in the field of adaptation against changing hydro-climatological backgrounds from global to urban scales.
Poster Presenter: Greg Bodeker – Stratosphere-troposphere Processes And their Role in Climate: Looking ahead G.E. Bodeker1, M.J. Alexander2, N.R.P. Harris3, J. Perlwitz4, F. Tummon5 1. Bodeker Scientific, Alexandra, New Zealand 2. Northwest Research Associates, Boulder, USA 3. University of Cambridge, Cambridge, United Kingdom 4. NOAA/ESRL/PSD & CIRES, Boulder, USA 5. ETH-Zurich, Zurich, Switzerland
This poster describes the new Implementation Plan of Stratosphere-troposphere Processes And their Role in Climate (SPARC). SPARC is one of the four core projects of the World Climate Research Programme (WCRP). Its overall challenge is to promote and coordinate cutting-edge
- 86 -
international research activities on how chemical and physical processes in the atmosphere interact with climate and climate change. Historically SPARC concentrated on the role of the stratosphere in climate, but it now includes foci throughout the atmosphere in recognition of the latest research, which clearly calls for a “Whole Atmosphere” approach. Furthermore, the interdisciplinary nature of climate research has led SPARC to develop collaborations with other WCRP core projects and working groups in support of the WCRP Grand Challenges. The SPARC Scientific Themes define the breadth and foci of the project’s work and form the foundation on which individual SPARC Activities are based. The themes for SPARC’s new Implementation Plan are (1) Atmospheric Dynamics and Predictability, (2) Chemistry and Climate, and (3) Long-term Records for Climate Understanding. The ideas developed in the new Implementation Plan are described in this poster, with a clear emphasis on how it interacts with the Global Climate Observing System. SPARC has a long history of evaluating data sets of particular atmospheric importance, and it has produced international assessments of quantities such as ozone, water vapour and temperature.
Poster Presenter: Mark Bourassa – A New Technique for Simultaneous Observations of Observations of Winds and Stress for Mesoscale and Larger Observations M.A. Bourassa1, E. Rodriguez2, D. Chelton3, T. Farrar4, N. Maximenko5, S.L. Morey1, R. Samuelson3, S.P. Xie6, A. Thompson7 1. Florida State University, Tallahassee, USA 2. California Institute of Technology and JPL, Pasadena, USA 3. Oregon State University, Corvalis, USA
4. Woods Hole Oceanographic Institution, USA 5. University of Hawaii, Honolulu, USA 6. University of California, San Diego, USA 7. California Institute of Technology
The air-sea interface is a critical link in the Earth’s climate system; incomplete knowledge of the dynamics at this interface causes significant errors in the representation of horizontal and vertical mass and heat transports in the upper ocean, and limits the accuracy of climate and seasonal forecast models. Global surface currents are the most important and least directly observed ocean currents. The global relation between the surface wind and the speed and direction of wind-driven surface currents is unknown and unobserved. Errors in near-surface currents have important implications for vertical and horizontal transports of upper-ocean heat. The lack of understanding of surface currents and their relation to surface winds limits our ability to predict phenomena and processes as: meridional and zonal tropical heat transport; equatorial currents and upwelling; ENSO and MJO dynamics; tropical eastern Pacific and Atlantic sea-surface temperature and air-sea interaction, as well as dispersal of pollutants and floating marine debris. Both ENSO and the MJO influence the likelihood of hurricanes forming. Hurricanes can have a large impact on property and infrastructure. ENSO has a large impact on interannual shifts in weather and hence large impacts on agriculture as well as aquaculture. Variability in ocean currents impacts fisheries, pollutant transport, and the transport of ice and melt water in high latitudes. These Arctic wind and currents strongly influence the vertical and horizontal heat transport in the Arctic Seas, and have been hypothesized to influence similar transports in the North Atlantic Ocean. While satellite altimetry offers global estimates of geostrophic current, surface currents include a large ageostrophic component (especially in climatically important equatorial oceans), and have never been observed globally from space. New technology exists (space-based microwave Doppler radar scatterometry) to address this
- 87 -
fundamental gap in the global ocean-atmosphere observing system. This new technology offers the first opportunity to obtain the contemporaneous collocated global observations of surface winds (or stress) and surface currents that are required to address these basic Earth science questions.
Poster Presenter: Nigel Fox – Enabling and demonstrating SI traceability of ECVs and climate data records N Fox, T. Scanlon, J. Nightingale, A. Barker, E. Woolliams National Physical Laboratory, Teddington, UK
The need for SI traceability to ensure integrity and trust in the Essential Climate Variables (ECVs) and services and information derived from them is well established. However, the means to achieve and demonstrate this in a universally consistent manner across the world and between variables, particularly for the complex bio-geophysical variables that make up many of the ECVs is challenging. In 2010, the WMO and the National metrology Institutes (NMIs), guardians of the SI, through its international coordinating body, Bureau International des Poids et Mesures (BIPM) held a workshop to instigate a dialogue to start to address this issue. Some NMIs were already highly active whilst others were relatively new to the field but all concluded the urgency and priority to work closer with the climate community to better understand its needs and where appropriate to develop new standards and methods. In parallel, space agencies and other international bodies, GEO, CEOS, EU were similarly recognising the need for improved quality assurance and means to evidence uncertainty. Concepts such as the Quality assurance framework for Earth Observation (QA4EO) were born and initiatives such as ESA climate change initiative started to specify the need for traceability in a more rigorous manner. In 2013 the EU initiated, amongst others, a project called QA4ECV to develop and demonstrate a QA framework for ECVs, to be built around ‘metrological traceability’ and another called MetEOC to develop new SI standards and methods for ECVs in 2014. In these latter projects, it has been recognised that the concept of SI traceability has to extend beyond the physical measurand to encompass the retrieval algorithm and provide the means to ascribe an uncertainty to the resultant climate information in a manner that is easily interpreted by all users. In May 2015, NPL in conjunction with ESA, Eumetsat, EU, UK meteorological offices and University of Reading organized a meeting of climate experts to consider the ECVs and their specifications in terms of metrological rigour, consistency and how well these are being met. The workshop produced a set of recommendations to both the climate and metrology community on priorities and actions to address to improve SI traceability. These, together with examples on proposed new QA strategies, generic tools and methods to aid the climate community move towards a coherent fully SI traceable climate observing system will be described.
- 88 -
Poster Presenter: Nigel Fox – Traceable Radiometry Underpinning Terrestrial- and Helio- Studies (TRUTHS): Establishing a climate and calibration observatory in space N. Fox1, R. Bantjes2, H. Brindley2, J. Gorrono1,P. Green1, D. Lobb3, A. O’Neill4, J. Reed5, J. Russell2, R. Winkler1
1. National Physical Laboratory, Teddington, UK 2. Imperial College London, UK 3. Surrey Satellite Technology Ltd, Guildford, UK
4. University of Cambridge, Cambridge, UK 5. Airbus, Stevenage, UK
Climate change; reliably forecasting its impact (reducing variance), and monitoring mitigation strategies requires reliable long term climate data records (CDR) of the essential climate variables (ECVs). The majority of ECVs require observations from satellites. These must be trustable, and of sufficient accuracy to facilitate the detection of small trends from a background of natural variability. Since the size of the trend is small, robust detection and attribution takes many decades and consequently multiple satellites. Each must be unequivocally harmonised with no risk of unaccounted bias or instrumental drift to provide the evidence needed to implement and sustain action by the World’s policy makers. Traceability to international standards (SI) in-orbit is a key requisite to ensure integrity of the data collected by satellites but achieving this at an appropriate level of uncertainty remains a significant challenge. Space agencies and international bodies like CEOS and WMO (Global Space Inter-calibration System, GSICS) strive to develop methods to aid interoperability and consistency but as yet cannot achieve uncertainty levels much below a few percent and even in these cases struggle to demonstrate full SI traceability. However this is recognized and has led to a strategy for climate monitoring from space, http://www.wmo.int/pages/prog/sat/documents/ARCH_strategy-climate-architecture-space.pdf. This strategy identifies the critical need for an SI traceable climate observing system and recommends the launch of a few well-calibrated reference satellites to underpin it. Such sensors would also make benchmark measurements of the state of the Earth’s climate from which to monitor change. TRUTHS, (this paper), and its US sister CLARREO, are designed to address this challenge. Between them they provide SI traceable spectrally resolved measurements of the Earths radiation; incoming and reflected solar radiation and in for CLARREO emitted thermal infrared radiation at uncertainty levels close to that of the ideal observing system so that their data and ability to detect a trend is limited by natural variability and not instrument or sampling errors. TRUTHS takes a primary standard into orbit as an on-board reference and provides measurements of incoming and global reflected (320 - 2350 nm at 5 nm FWHM) at 50 m GIFOV with an uncertainty of 0.3% (0.01 % for total solar irradiance). These fundamental climate (Ir)radiances can be convolved into the building blocks of many ECVs and EO applications (e.g. Carbon cycle). Although not necessarily delivering all of them itself it will enable an integrated global observing system through reference calibration.
Poster Presenter: Katherine Hill – A Tropical Pacific Observing System for 2020 and beyond (TPOS 2020) W. Kessler1, N. Smith2, K. Hill3 1. NOAA Pacific Marine Environmental Laboratory, Seattle, USA 2. GODAE Ocean Services, Melbourne, Australia 3. Global Climate Observing System, World Meteorological Organization, Geneva, Switzerland
The international TPOS 2020 Project arose out of a Tropical Pacific Observing System review and workshop in January 2014, which discussed challenges in sustaining the TAO-TRITON array during 2012-2013, among other things. The Project is aimed at redesigning the observing system, including the tropical Pacific arrays, in light of new scientific understanding
- 89 -
and new ocean technology since its original design in the 1980s-90s. Observing and understanding ENSO remains a fundamental motivation, extending to biogeochemical phenomena, to processes on smaller scales such as diurnal mixing that may rectify into the low frequency, and to the interaction of the coupled boundary layers of the upper ocean and lower atmosphere. The primary stakeholders remain the operational climate prediction centers and the design will include support for research into physical processes, especially those not well represented in current-generation climate models. Current-generation forecast systems (data assimilation and the model physics) have a number of challenges to make effective use of observations, thus the modeling centers are well-represented in the TPOS 2020 structure and our sampling is targeted to where the forecasts systems need guidance for improvement While the design will look at options for evolution of the present arrays, the long climate records built up at mooring sites, repeated ship surveys, and island stations are fundamental to detecting and diagnosing both natural climate variability and climate change. Task teams have been established in specific topic areas, and a number of focused research projects are being developed to support the redesign process. An interim report will be released mid-2016 with the opportunity for community comment; it will be presented to agencies and other stakeholders for review and input. This presentation will discuss the motivation, guiding principles, and potential changes of direction for the tropical Pacific observing system.
Poster Presenter: Carlos Jimenez – Towards observation-based land evaporation data records: final results from the ESA WACMOS-ET project C. Jimenez1, D.G. Miralles2,3, D. Michel4, M.F. McCabbe5, A. Ershadi5 and the WACMOS-ET team 1. Estellus, Paris, France 2. VU University Amsterdam 3. Ghent University 4. Swiss Federal Institute of Technology (ETH) 5. King Abdullah University of Science and Technology (KAUST)
Terrestrial evaporation (ET) links the continental water, energy and carbon cycles. Understanding the magnitude and variability of ET at the global scale is an essential step towards reducing uncertainties in our projections of climatic conditions and water availability for the future. However, the requirement of global observational data of ET can neither be satisfied with our sparse global in situ networks, nor with direct satellite observations. This situation has led to the recent rise of algorithms dedicated to deriving ET fields from satellite data indirectly, based on combining satellite-observable ET drivers within predictive models Up to date, and despite the efforts from different initiatives like GEWEX LandFlux (hydrology.kaust.edu.sa/Pages/GEWEX_Landflux.aspx), the uncertainties inherent in the resulting global ET datasets have remained largely unexplored, partly due to a lack of inter-product consistency in forcing data. In response to this need, the ESA WACMOS-ET project (wacmoset.estellus.eu) has contributed to LandFlux efforts by (a) developing a reference input dataset to derive and validate ET estimates, and (b) performing a cross-comparison, error characterization and validation exercise of four selected ET algorithms driven by this reference input dataset and by in situ forcing data. In this presentation we will highlight the main conclusions of the ESA WACMOS-ET project. Overall, two of the ET algorithms (the Priestley and Taylor JPL model and the Global Land Evaporation Amsterdam Model, GLEAM) yield estimates that are closer to independent ET
- 90 -
retrievals at multiple spatial and temporal scales. Based on precipitation and runoff measurements, all four algorithms demonstrate some skill to close the water balance over the multiple catchments. Nonetheless, analyses of the global ET fields reveal significant differences amongst the four models, particularly in regards to the partitioning of ET into different components (transpiration, soil evaporation, interception) and the representation of sub-daily ET variability. Overall, WACMOS-ET has led to significant progress in assessing ET algorithm performance and contributed to activities that has resulted in the release of a new 3-hourly 1987-2007 global ET product by LandFlux. However, numerous questions remain in our goal to generate accurate datasets of ET from remote sensing data. Since certain algorithms work better under certain circumstances, a better characterization of forcing uncertainties and algorithm structural deficiencies will enable the generation of multi-product ensembles that may outperform the individual products. Ongoing activities strive towards this direction.
Poster Presenter: Carlos Jimenez – Land surface temperature retrieval from microwave observations: towards the production of a climate record C. Jimenez1,2, C. Prigent3,2,1, F. Aires3,2,1, S. Ermida4 1. Estellus, Paris, France 2. LERMA, Observatoire de Paris, Paris, France 3. CNRS, Paris, France 4. IPMA, Lisboa, Portugal
Passive microwave measurements are less affected by clouds than IR observations. The Land Surface Temperature (LST) can be derived from microwave measurements, regardless of the cloud conditions. However, retrieving LST from microwave is still challenging. Contrarily to the infrared emissivities, the microwave emissivities vary strongly with surface properties (soil moisture, vegetation, snow). Moreover, the microwave radiation can emanate from the subsurface, not from the surface skin as in the infrared. A methodology has been developed in the past to estimate the LST, along with atmospheric water vapor, cloud liquid water, and surface emissivities over land, from passive microwave imagers. It is based on a neural network inversion, trained on a large data set of simulated radiances, and makes use of first guess information about microwave emissivity, coincident surface skin temperature, and the overlying atmosphere. The theoretical root mean square error of the LST retrieval over the globe is 1.3 K under clear-sky conditions and 1.6 K in cloudy conditions. These LSTs have been compared with in situ LST measurements, with errors of ~4 K as compared to in situ measurements for most LST stations. The performance of the algorithm is similar under clear and cloudy conditions. However, this neural network inversion requires a large range of ancillary observations that are difficult to collect in near-real time. Here, we present a new retrieval approach, limiting the number of ancillary inputs that are required while maintaining the LST accuracy. An algorithm, easily and broadly applicable to past and current microwave imagers, has been developed based on a neural network inversion trained on the LST retrievals obtained with the method previously described. The only inputs required by the new algorithm are the brightness temperatures provided by the microwave conical scanners, from 19 to 90 GHz, and pre-calculated atlases of microwave land surface emissivities, at the same frequencies. Global LST estimates derived from the new approach will be presented and compared with in situ observations (over a large range of environments) and with different sources of infrared satellite estimates (under clear sky conditions). The final objective of this project is to produce a long climate record of an “all weather” LST, applying the methodology to all conical scanners in the microwaves (SSM/I, SSMI/S, AMRS-E)
- 91 -
and limiting the inconsistency related to inter-calibration problems and to overpassing local times. This new dataset will complement the available IR datasets for the cloudy cases, and better describe the diurnal cycle of the LST regardless of the cloud conditions.
Poster Presenter: Balasaheb Kulkarni – Climate change and people in state of Maharashtra Balasaheb G. Kulkarni1, Mrunalini Kulkarni1, Sandhya Kupekar2, Atual Babar3 1. College of Science & Technology, Mumbai 2. M.P.A.S.C. college , Panvel 3. The Institute of Science, Mumbai,India
Maharashtra, one of India’s largest and most populous state now a days is facing up to the increasing threat of climate change. Agriculture is the main occupation in the state employing over 64% of the people and impact of climate change is seen on agri product. Further, climate change also affects human health. However, still awareness is lacking among the people of Maharashtra regarding various parameters of climate change and its effects. Therefore, during present investigation a survey was conducted involving school children, undergraduate students and adults from various sectors to know the level awareness of climate change and its effects. The survey was conducted in Metropolitan city Mumbai and semi urban area of Panvel near Mumbai. School children from 8 to 10th standard, undergraduate students, fishermen and women of these selected areas were given questionnaire asking various questions about climate change. Many school children and undergraduate students reported that they are aware of climate change but not aware of its problems and how to tackle it. Whereas fishermen of Panvel area were agreed that climate change has affected fishery harvest but not sure which factor of climate change caused it. More than 50% respondents said that they are getting information of climate change from print and electronic media. However, most of these people are unaware of health problems caused by climate change. Fishermen and coastal people were not aware of ocean acidification and possible damage to the ocean resources due to ocean acidification. Furthermore, most of the respondents did not know how to minimize climate change Present survey indicates that in Maharashtra still there is need to make people literate about climate change and its effects on human health.
Poster Presenter: Nathaniel Livesey – Atmospheric Limb Sounding: Accomplishments, the looming “gap”, and possibilities for filling it N. J. Livesey on behalf of the extended Aura Microwave Limb Sounder (MLS) Science Team Jet Propulsion Laboratory, California Institute of Technology, California, USA
The recent decade has been characterized as a “golden age” for space-borne atmospheric observations, with an extensive suite of atmospheric parameters observed from multiple vantage points. For example, the unparalleled insights derived from the “A-Train” constellation’s collocated observations of multiple atmospheric (as well as land and ocean) variables has underscored the benefits that accrue from a comprehensive multi-sensor, multi-disciplinary approach to Earth observation. Although many of the current generation of measurement records, including from the A-Train, will be extended by future missions (e.g., those in the European Metop and/or US JPSS programs), a notable and very critical “gap” (arguably a cessation) is looming in the established long-term record of limb sounding observations of atmospheric composition, temperature and humidity from the upper troposphere (~10 km) through the mesosphere (90+ km). This gap in limb sounding and its implications are heavily stressed in the recent GCOS “Status of the Global Observing System for Climate” report.
- 92 -
We [1] review the existing record of limb observations and highlight some of the scientific findings these measurements have enabled; [2] describe the impending void in the limb observation record – with only two sensors, measuring a limited number of species and, in one case, with sparse spatial sampling, planned for launch in the coming decade (compared to a peak of 12 instruments operational during the 2000s); and [3] outline a new range of possible sensors, including some low-cost options that simply fill the gap, as well as others that also augment the record with measurements having significantly improved spatial and temporal resolution.
Poster Presenter: Andrea Merlone – Metrology for climate observation A. Merlone1, G. Coppa1, G. Lopardo1,.C. Musacchio1, A. Piccato1, F. Sanna1, C. C. Garcia Izquierdo2, Y. –G. Kim3, F. Sparasci4, P. Thorne5, J. Zhang6, G. Strouse7, E. Van der Ham8, J. Tamba9, T. Usuda9, E. Ejigu10, S. Bell11, M. de Podesta11, T. Gardiner11, C. Monte12, V. Ebert12, P. Pavlacek13, D. Groselj 14, M. Heinonen15, M. Kalemci16, G. Beges17, J. Drnovsek17, D. Hudoklin17, J. Bojkovski17, A. Castrillo18, L. Lanza19, A.Viola20, V. Vitale20, R. Emardson21, R. Feistel22 1. Istituto Nazionale di ricerca Metrologica, Torino, IT 2. Centro Español de Metrologia, Tres Cantos, ES 3. Korea Research Institute of Standards and Science, Daejeon, KR 4. LNE-Cnam, La Plaine Saint-Denis, FR 5. Maynooth University, Maynooth, IE 6. National Institute of Metrology, Beijing, PRC 7. National Institute for Standard and Technology, Gaithersburg, Md, US 8. National Measurement Institute of Australia, Lindfield, AU 9. National Metrology Institute of Japan, AIST, Tsukuba, JP 10. National Metrology Institute of South Africa, Pretoria, ZA 11. National Physical Laboratory, Teddington, UK 12. Physikalisch-Technische Bundesanstalt (PTB), Braunschweig, DE 13. Slovak Institute of Metrology, Bratislava, SK 14. Slovenian Environment Agency, Lubljana, 15. VTT Technical Research Centre of Finland, Centre for Metrology MIKES, Espoo, FI 16. TUBITAK Ulusal Metroloji Enstitusu, Gebze, Kocaeli, TK 17. University of Ljubljana, faculty of electrical engineering – UL-LMK, Ljubljana, SI 18. Seconda Università di Napoli, Dipartimento di Matematica e Fisica, Caserta, IT 19. Università degli Studi di Genova, Genova, IT 20. Istituto di Scienze dell’Atmosfera e del Clima – CNR – Bologna, IT 21. Technical Research Institute of Sweden – SP, Boras, SE 22. Leibniz Institute for Baltic Sea Research, Warnemuende, DE
As stated by GCOS “Long-term, high-quality and uninterrupted observations of the atmosphere, land and ocean are vital for all countries, as their economies and societies become increasingly affected by climate variability and change”. High-quality observation is possible only if based on a sustained traceability to SI and with documented uncertainties associated to the measured values. Following the signature of the MRA by the WMO , in April 2010, the CCT of the CIPM, in its XXV meeting of May 2010 submitted a recommendation to CIPM. The document highlighted the need to encourage National Metrology Institutes (NMIs) [...] to face new perspectives, needs, projects and activities related to the traceability, quality assurance, calibration procedures and definitions for those quantities involved in climate studies and meteorological observations and to support a strong cooperation between NMIs and Meteorological Institutions at local, national and international levels. In response to this call, several Joint Research Projects (JRPs) in metrology have been established. Their objective is to improve calibration procedures and measurement techniques for some Essential Climate Variables (ECVs), focusing especially on temperature, pressure and water vapour. Additional objectives have included investigations of sensor characteristics and the improvement of measurement devices and their use in the field. The impact effort is
- 93 -
demonstrated also by the involvement of key international scientific Institutions such as GRUAN , ISTI , IAPWS , and prominent Manufacturers and Universities. The overall aim is to make a further step towards establishing full data comparability, consistency and long-term continuity, through a comprehensive evaluation of the measurement uncertainties for the quantities involved in the global climate observations. The improvement of quality of ECVs records, through the inclusion of measurement uncertainty budgets, will also highlight possible strategies for the reduction of the uncertainty. This contribution will report on JRPs advances, events and task group activities, with the vision to establish a permanent bridge between metrologists and climatologists, through which to strengthen and develop collaborations, joint activities/projects and results dissemination to the whole society.
Poster Presenter: Rosemary Nalubega – Community disaster risk management in Kotido district R. Nalubega1, R. Lutwama2, S. Namugumya3 1. Global Initiative Uganda (GIU)-Masaka, Uganda 2. Grassland Uganda (GU)-Mukono, Uganda 3. Makerere University, Kampala, Uganda
Background: Communities in semi-arid regions usually experience environmental shocks like disasters and floods. Kotido district is part of the seven districts that form up the pastoral Karamoja region. This study seeks to establish factors that affected flood disaster management in Kotido district. Methodology: The study focused on 238 randomly selected internally displaced camp residents. Key informant interviews were conducted and data qualitatively analyzed to assess issues that impeded successful mitigation of flood disasters. Findings: Continued degradation of wetlands for crop cultivation and cattle over grazing were partly responsible for increased flooding during rainy seasons and drought during dry seasons. The absence of accessible micro-finance credit schemes to support recovery efforts of the communities’ drastically undermined measures to reduce the impact of flood disasters. The district was reported to have lacked contingency plans to show the risks and likelihood of related disasters occurring with potential effects at the community level hence impeding disaster management and preparedness. Both the government of Uganda and the local government of Kotido district had not practically earmarked emergency funds for disaster response. The affected communities had no storage facilities for emergency relief items like medicine and food. The idea of having community level food stores and granaries died out and this amplified the flood disaster with famine making disaster management difficult. The poor nature of the community’s temporary mud bricks and wattle roofed huts exacerbated the impact of the floods since many huts were just washed down prompting more relief items like tents straining the relief efforts. Conclusion: Gross awareness creation at the community level and alternative means of livelihood that do not constrain non-renewable resources have to be persistently addressed to mitigate against natural disasters in the district. Key Words: Disaster, risk management, community initiatives.
- 94 -
Poster Presenter: Matthew Palmer – The International Quality Controlled Ocean Database initiative (IQuOD): a community effort towards climate quality in situ observations Matthew D. Palmer1, Catia M. Domingues2 and the IQuOD Science Team 1. Met Office Hadley Centre, Exeter, United Kingdom 2. Institute for Marine and Antarctic Studies, University of Tasmania, Australia
Historical ocean profile observations provide a critical element for a host of ocean and climate research activities. These include providing initial conditions for seasonal-to-decadal prediction systems, evaluating past variations in sea level and Earth’s energy imbalance, ocean state estimation and climate model evaluation and development. The International Quality controlled Ocean Database (IQuOD) initiative represents a community effort to create the most globally complete profile dataset, with comprehensive metadata and uncertainty information to promote progress in all of the above research avenues. Internationally agreed “best practice” approaches to data quality control will be developed, documented and shared with the wider research community through open-source code bases. The freely available IQuOD database will be based on, and served alongside, the World Ocean Database – the most complete and widely used ocean profile database in the world. IQuOD aims to extract maximum value from the historical ocean observations and help inform data practices for current and future climate observing systems through: (1) development of community best practice automated quality control procedures; (2) development of community best practice expert quality control procedures; (3) development of uncertainty estimates for each observation in a profile; (4) development of algorithms to populate missing profile metadata, e.g., to facilitate improved XBT bias corrections; (5) assembly and distribution of the IQuOD database; and (6) knowledge transfer and capacity building through international collaboration. While the initial focus of IQuOD activities is on temperature observations, these efforts are designed to set a template to expand later into other variables, such as salinity and oxygen.
Poster Presenter: Jelena Stamenkovic – Biomass and Soil Moisture Retrievals from Remote Sensing Data using Machine Learning Methods - Review A. Iftikhar1,2, F. Greifeneder3, J.Stamenkovic4, M. Neumann5, C. Notarnicola3 1. Department of Geography, University College Cork, Cork, Ireland 2. Spatial Analysis Unit, Teagasc, Dublin, Ireland 3. Institute for Applied Remote Sensing, EURAC, Bolzano, Italy 4. École Polytechnique Fédérale de Lausanne (EPFL), Lausanne, Switzerland 5. Jet Propulsion Laboratory, California Institute of Technology, USA
The vast increase in remote sensing data from both space-borne and airborne platforms, as well as from UAV and ground measurements has governed the interest of scientific community towards new and more efficient retrieval methodologies. Special importance is put on the large extent and the high sampling rate (spectral, temporal and spatial) of remote sensing images. In addition, the launch of the Sentinel constellations will provide the users with high volume of new data, with increased temporal and spatial resolution and, what is very important, free of charge. In order to analyze these data and to obtain relevant information, such as essential climate variables (ECV), clearly defined methodologies need to be proposed and exploited. Special attention is given to machine learning methods, due to their capability to handle non-linear problems and to process both small and large number of data samples. The main objective of this work is to provide a review of the current state of research related to the retrieval of two important land bio/geophysical parameters, vegetation biomass and soil moisture, from remote sensing data, using machine learning methods. Furthermore, the potential added value of the synergy of multi-sensor is investigated. In this scope two different environmental conditions are assessed, agricultural areas and mountain grassland.
- 95 -
Poster Presenter: Ad Stoffelen – Scatterometer-based ocean wind forcing fields Ad Stoffelen1, Ana Trindade2, Jos de Kloe1, Marcos Portabella2 1. KNMI, The Netherlands 2. Institut de Ciències del Mar, CSIC, Barcelona, Spain
Surface winds derived from earth Observation satellites are increasingly required for use in monitoring and forecasting of the ocean. A drawback of space-borne wind observing systems, such as scatterometers, is that they provide time and space coverage unsuitable for, among others, high-resolution ocean model forcing. As such, blended ocean forcing products combining scatterometer data and numerical weather prediction (NWP) output, are being developed over the past few years. These products, which provide full global coverage at increased temporal resolution (e.g., daily), however, generally only resolve spatial scales closer to NWP-resolved (200km) rather than scatterometer-resolved scales (25 km). Therefore, information on wind-current interaction, on the diurnal wind cycle and on wind variability in moist convection areas is lost in these blended products. Moreover, known systematic NWP model (parameterization) errors are propagated in the blended products at times and locations where no scatterometer winds are available. Direct forcing from ERA-interim or an operational global meteorological model results in even more extensive physical drawbacks, but has the advantage of increased temporal coverage. We propose to maintain this increased temporal coverage in a gridded wind and stress product, but also to maintain most beneficial physical qualities of the scatterometer winds, i.e., 25-km spatial resolution, wind-current interaction, variability due to moist convection, etc., and, at the same time avoid the large-scale NWP parameterization and dynamical errors. In fact, collocations of scatterometer and global NWP winds show these physical differences, where the local mean and variability of these differences are rather constant in time and thus could be added to the ERA-interim time record in order to better represent physical interaction processes and avoid NWP model errors. Correction of either the wind vector biases and wind vector variability is expected to affect ocean forcing. Moreover, the collocation process provides NWP winds, but sampled like a scatterometer and, therefore, provides information on the scatterometer wind sampling error. Prior to merging different scatterometer data sources, a comprehensive characterization of the scatterometer corrections is required. We provide an assessment of the corrections and sampling errors for the tandem scatterometer data set composed by ASCAT-A/B, RapidScat, Oceansat-2 and HY-2A, which, so far offer the most complementary orbits in terms of the diurnal cycle. All comparisons involve the stress-equivalent 10m wind, U10S, which avoids effects of atmospheric stratification and mass density to affect the computed wind differences. U10S may be easily computed from global NWP or moored buoy measurements for comparison to the scatterometer equivalents. U10S, in turn, can be easily related to ocean surface stress.
Poster Presenter: Peter Thorne – The GAIA-CLIM project: Making more optimal use of non-satellite data to characterise data from satellites P. Thorne1, A. Mikalsen2, F. Madonna3, K. Kreher4, J.C. Lambert5, B. Bell6, J. Schulz7, M. de Maziere5, B. Ingleby8, G. de Leeuw9, A. Fasso10
1. Maynooth University, Maynooth, Ireland 2. NERSC, Bergen, Norway 3. CNR, Potenza, Italy 4. BKS, Germany 5. BIRA-IASB, Brussels, Belgium
6. Met Office, Exeter, UK 7. EUMETSAT, Darmstadt, Germany 8. ECMWF, Reading, UK 9. FMI, Helsinki, Finland 10. University of Bergamo, Bergamo, Italy
The GAIA-CLIM project is a Horizon 2020 project running 2015-2018 that brings together 18 European partners to advance our ability to use non-satellite measurements to characterize satellite data. The project aims to achieve this by using high quality, metrologically well-characterized data such as those arising from GRUAN, NDACC and TCCON, and understanding the inevitable additional uncertainty in any comparison arising from non-coincidence of satellite
- 96 -
and non-satellite measurements. Use of such an approach assures a meaningful assessment of the satellite data. Several approaches shall be developed and compared. A Virtual Observatory facility to visualize and analyze the co-locations arising shall be developed by several partners and hosted by EUMETSAT, as a demonstrator of capabilities. Possible avenues to operationalization of this facility shall be given, but such operationalization necessarily will require a different mechanism than a time-bounded research project. The project is also to provide an inventory of remaining gaps and their impacts leading to a documentation of prioritized recommendations as to next steps to improve our ability to use non-satellite data to characterize satellite data. This shall be developed in concert with the broader community through a series of user workshops as well as solicited input. An early draft of the gaps analysis and impacts document and feedback template is available at www.gaia-clim.eu/page/gaid . This presentation shall outline project aims, structure, and important outcomes to date.
Poster Presenter: Peter Thorne – System of systems approach to measurements: Formalising the reference-baseline-comprehensive networks concept: what, why, how? P. Thorne1, J. Schulz2, D. Tan3, B. Ingleby4, F. Madonna5, G. Pappalardo5, T. Oakley6, A. Mikalsen7
1. Maynooth University, Maynooth, Ireland 2. EUMETSAT, Darmstadt, Germany 3. Unaffiliated 4. ECMWF, Reading, UK
5. CNR, Potenza, Italy 6. GCOS Secretariat, Geneva, Switzerland / Met Office, Exeter, UK 7. NERSC, Bergen, Norway
There are many documents and networks that make reference to a “system of systems” observing architecture, but there is no common concept, let alone adoption, to date. Different networks in different domain areas follow distinct practices, leading to a mosaic of conventions that serve to obfuscate and confuse more than illuminate or help. Following the discussions at the network meeting that preceded the GCOS Atmospheric Observing Panel for Climate (AOPC) meeting in 2014 (reported in GCOS-182), under the auspices of GAIA-CLIM, an effort has been made to articulate a possible pathway forwards that consists of: reference, baseline and comprehensive observing networks. Several assessment strands relating to aspects such as metadata, measurement continuity, uncertainty quantification and accessibility have been proposed. These are similar to, but distinct from, the dataset maturity matrix approach developed under the CORE-CLIMAX project, because the maturity matrix is reflecting the distinction between basic measurements and derived products. The approach proposed by GAIA-CLIM builds upon the outcomes agreed in GCOS-182 and has been developed with input from the GCOS Implementation Manager. Possible next steps towards broader community adoption shall be covered.
Poster Presenter: Michel Van Weele – Gaps Assessment and Impacts for atmospheric ECVs in the EU GAIA-CLIM project M. van Weele1, P. Thorne(coord.)2, and EU GAIA-CLIM project partners 1. The Royal Netherlands Meteorological Institute, De Bilt, The Netherlands 2. Maynooth University, Maynooth, Ireland
The aim of the EU H2020 Gap Analysis for Integrated Atmospheric ECV CLImate Monitoring (GAIA-CLIM) project is to improve our ability to use ground-based and non-satellite observations to characterise satellite observations for a number of atmospheric Essential Climate Variables (ECVs), specifically temperature, water vapour (H2O), ozone (O3), carbon dioxide (CO2), methane (CH4) and aerosols. On of the key outcomes will be a “Virtual Observatory” facility of co-locations and their uncertainties.
- 97 -
Another key outcome will a report (GAID = Gaps Assessment and Impacts Document) on gaps in capabilities or understanding, which shall be used to inform subsequent Horizon 2020 activities. Here we will a summary of Version 2 of the GAID including the gaps (‘user needs’) that have been identified during the first year of the project. The GAID will be kept as a living document to be updated based on latest insights throughout the 3-year GAIA-CLIM project lifetime (Mar 2015- Feb 2017). Feedback on the GAID is welcome through the dedicated interactive website: http://www.gaia-clim.eu/page/gaid.
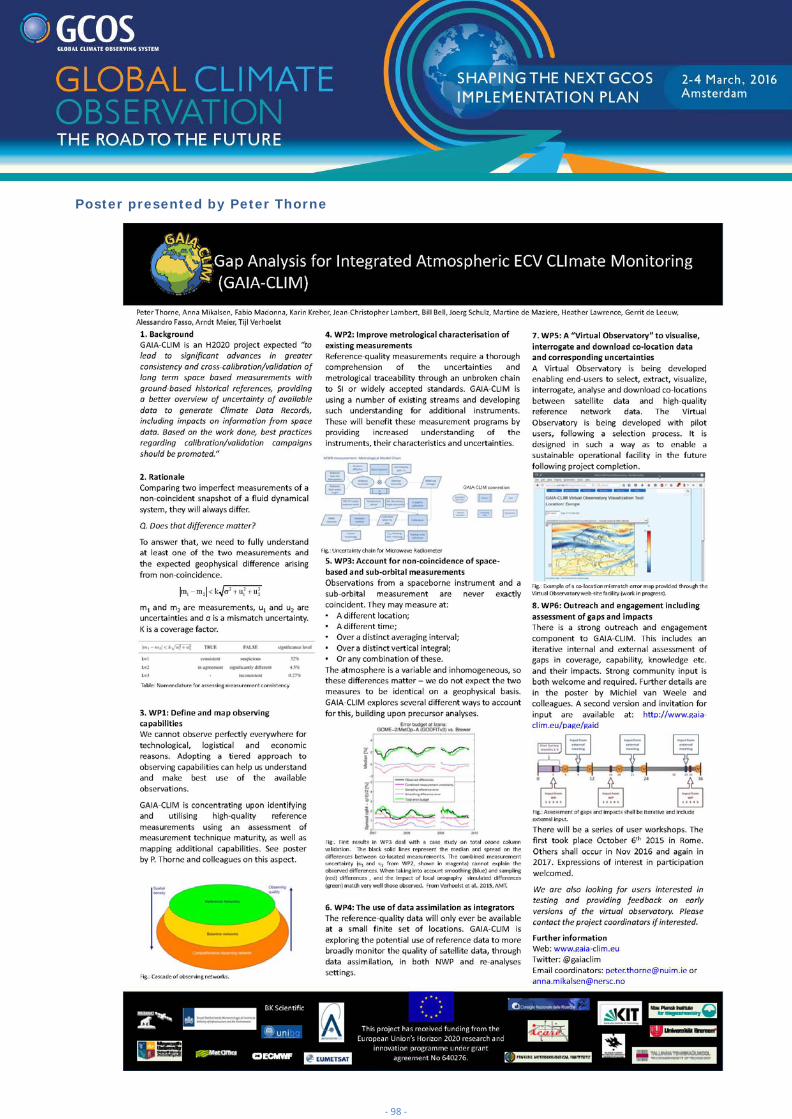
- 98 -
Poster presented by Peter Thorne
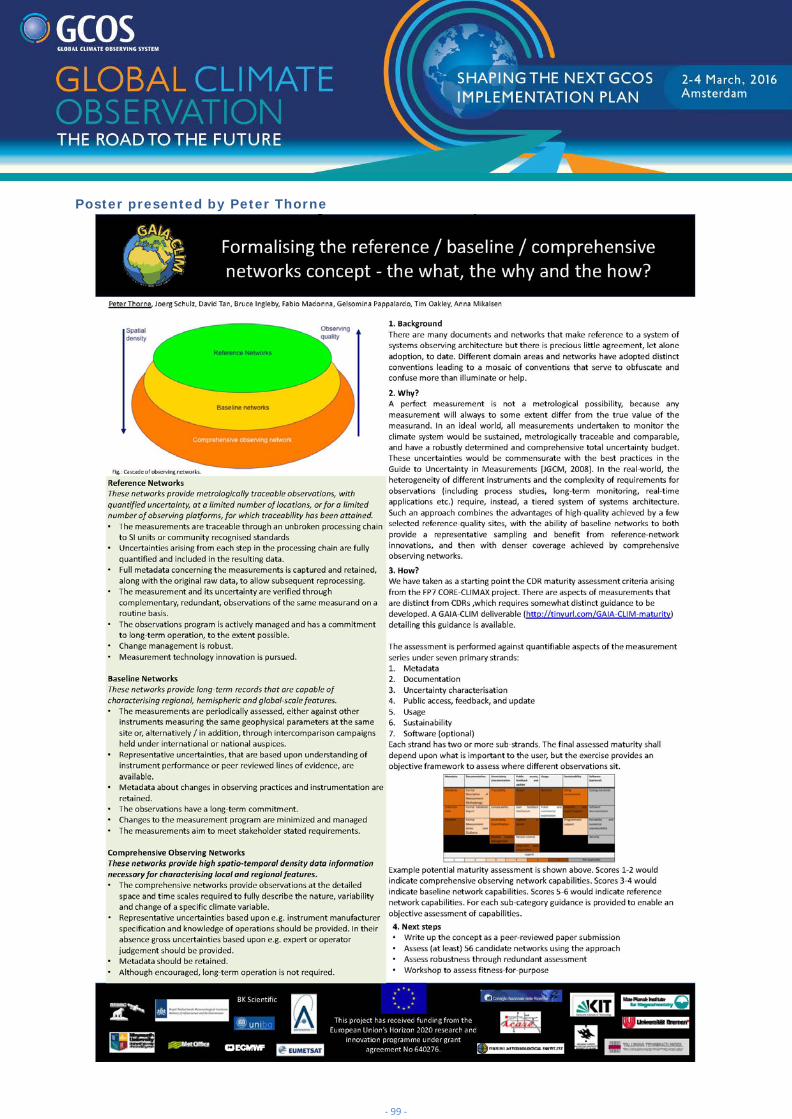
- 99 -
Poster presented by Peter Thorne
Organized by With support of
Other sponsors
GCOS Secretariat Global Climate Observing System
c/o World Meteorological Organization 7 bis, Avenue de la Paix
P.O. Box No. 2300 CH-1211 Geneva 2, Switzerland
Tel: +41 22 730 8275/8067 Fax: +41 22 730 8052 Email: [email protected]


