IZA DP No. 1897 Gender Differences in Educational Attainment: Evidence on the Role of the Tracking Age from a Finnish Quasi-Experiment Tuomas Pekkarinen DISCUSSION PAPER SERIES Forschungsinstitut zur Zukunft der Arbeit Institute for the Study of Labor December 2005
Transcript
IZA DP No. 1897
Gender Differences in Educational Attainment:Evidence on the Role of the Tracking Agefrom a Finnish Quasi-Experiment
Tuomas Pekkarinen
DI
SC
US
SI
ON
PA
PE
R S
ER
IE
S
Forschungsinstitutzur Zukunft der ArbeitInstitute for the Studyof Labor
December 2005
Gender Differences in Educational Attainment:
Evidence on the Role of the Tracking Age from a Finnish Quasi-Experiment
Any opinions expressed here are those of the author(s) and not those of the institute. Research disseminated by IZA may include views on policy, but the institute itself takes no institutional policy positions. The Institute for the Study of Labor (IZA) in Bonn is a local and virtual international research center and a place of communication between science, politics and business. IZA is an independent nonprofit company supported by Deutsche Post World Net. The center is associated with the University of Bonn and offers a stimulating research environment through its research networks, research support, and visitors and doctoral programs. IZA engages in (i) original and internationally competitive research in all fields of labor economics, (ii) development of policy concepts, and (iii) dissemination of research results and concepts to the interested public. IZA Discussion Papers often represent preliminary work and are circulated to encourage discussion. Citation of such a paper should account for its provisional character. A revised version may be available directly from the author.
Gender Differences in Educational Attainment: Evidence on the Role of the Tracking Age from a Finnish Quasi-Experiment
This paper studies the relationship between the timing of tracking of pupils into vocational and academic secondary education and gender differences in educational attainment and income. We argue that in a system that streams students into vocational and academic tracks relatively late (age 15-16), girls are more likely to choose the academic track than boys because of gender differences in the timing of puberty. We exploit the Finnish comprehensive school reform of the 1970’s to analyze this hypothesis. This reform postponed the tracking of students from the age of 10-11 to 15-16 and was adopted gradually by municipalities so that we can observe members of the same cohorts in both systems. We find that the postponement of the tracking age increased gender differences in the probability of choosing the academic secondary education and in the probability of continuing into academic tertiary education. The reform had particularily negative effects on boys from non-academic family backgrounds. Finally, the reform decreased the gender wage gap in adult income by four percentage points. JEL Classification: I20, J16 Keywords: education, tracking, gender wage gap Corresponding author: Tuomas Pekkarinen Nuffield College Oxford, OX1 1NF United Kingdom Email: [email protected]
1 IntroductionOn many measures of educational attainment, women have caught up with or, in manycountries, surpassed men in the past few decades. For example, today both in the UnitedStates and in many countries of the European Union well over 50% of the students in theacademic higher education are women. This development is particularly interesting in thelight of increasing returns to education that have been well documented in the literature.1
Given these considerable changes in the returns, one would expect the female dominancein higher education to have signi�cant e¤ects on the relative economic position of women.Yet this gradual increase in the female educational attainment has received surpris-
ingly little attention in the literature. The few papers that directly address the issuehave focused on gender di¤erences in college attendance in the US. But these explana-tions fail to account for interesting cross-country di¤erences in the relative educationalattainment of women. In the European Union, for example, the percentage of women inhigher education is particularly high in the Nordic countries whereas it is substantiallylower in some of the continental countries. These cross-country di¤erences suggest thatthe structure of the educational system may have something to do with the di¤erences inthe educational attainment of girls and boys.In this paper, we examine the e¤ect of the structure of the educational system on
gender di¤erences in educational attainment. More speci�cally, we focus on the e¤ect oftracking age. Most educational systems stream pupils into general or vocational tracksin secondary school. Typically, only one of these tracks, the general or academic track,enables the pupils to continue into academic tertiary education. The age at which thistype of tracking is done varies across countries and may or may not coincide with theend of full-time compulsory education. Here, we argue that in systems where tracking isdone relatively late, typically at the age of 16, girls are more likely to choose the academicsecondary education than boys because of gender di¤erences in the timing of puberty.Boys and girls are more or less at the same stage of cognitive and psychological de-
velopment before the age of 11, but after this their developments momentarily diverge.Girls enter puberty on average two years earlier than boys and by the age of 14 mostgirls are at the end of puberty. Boys, on the other hand, and especially the late-maturersamong them, are going through important physical and psychological changes at that ageand these changes are known to have adverse e¤ects on course grades and educationalaspirations. Hence, in educational systems where the choice between general and voca-tional educational tracks is done at around the age of 14 to 16, boys and girls are forcedto make educational investment decisions at a time when the information they receive ontheir academic abilities and their aspirations can be very di¤erent.Our strategy is to use the comprehensive school reform that was conducted in Finland
during 1972-1977 as a quasi-experiment to test this argument. This reform transformedthe Finnish educational system from an early tracking system to a late tracking system.Whereas in the old system the students were split into general and vocational tracks atthe age of 11, in the new system this decision was postponed to the age of 16. This reformwas conducted gradually by municipalities so that we observe individuals in cohorts bornbetween 1961-1965 in both systems. Using this within cohort variation in the age atwhich the choice between the general and vocational tracks is made, we examine how thisreform a¤ected gender di¤erences in the probabilities of choosing the academic track andcontinuing into academic post-secondary education as well the e¤ects of the reform onadult income of men and women.Our results show that the postponement of tracking had a positive e¤ect on the girls�
probability of choosing the academic track while for boys this e¤ect was negative. As
1See, for example Katz and Autor (1999) and Acemoglu (2002).
2
a result of this reform the gender di¤erence in the probability of going into academicsecondary education increased by three percentage points in favour of girls. This cor-responds to a 25 % increase in the gender di¤erence. The negative e¤ect on boys wasparticularly strong among families where fathers had no academic education. Similarly,the reform also increased the gender di¤erence in the probability of going into academictertiary education by two percentage points in favour of girls. Finally, gender wage gapdecreased by four percentage points as a result of the reform.To the best of our knowledge, this paper is the �rst one to examine the e¤ect of
the educational systems on the gender di¤erences in educational attainment. Most ofthe previous literature on gender di¤erences in educational attainment has focused onthe developing countries where the households typically invest less on their daughters�education than that of their sons.2 On the other hand, the literature on developedcountries, where the gender di¤erences have been reversed, is scarce. We are aware of onlytwo papers that directly examine the gender gap in educational attainment: Charles andLuoh (2003) as well as Jacob (2002) focus on the gender di¤erences in college attendancein the United States and attempt to explain these di¤erences with the gender di¤erencesin the wage dispersion of college graduates and in non-cognitive skills.The strategy adopted here has similarities to studies in the vast literature that uses
di¤erences in educational systems across regions and countries for a variety of purposes.3
Most interestingly, from our point of view, Meghir and Palme (2004), Aakvik et al (2003),as well as Black et al (2005) use Swedish and Norwegian educational reforms, respectively,to study the inter-generational transmission of education and the heterogeneity of thereturns to education. These reforms were very similar to the Finnish reform studied here.However, we are aware of only two papers that explicitly study the consequences of thetracking of pupils into di¤erent educational tracks. Dustmann (2004) uses German dataand argues that in a system, such as the German one, where tracking takes place at a veryearly age, the social mobility through education is low. Hanushek and Wößmann (2005)examine the e¤ect of tracking age on the performance of students with international PISAtest score data.The economic consequences of the early experiences in one�s life have recently caught
the attention of the economists. Carneiro and Heckman (2003), for example, stress thatthe most successful policy interventions in education are done early when the cognitiveskills of individuals are still developing. Other authors have emphasized the importanceof adolescent experience. Persico et al (2004) show that the contemporaneous correlationbetween adult height and adult income disappears when one controls for teenage heightof individuals. They interpret this result as indicating that one�s social status duringteenage years, which is positively correlated with teenage height, has a positive e¤ecton adult economic outcomes. In a related paper, Galeotti and Müller (2005) providedirect evidence on the positive e¤ects of social popularity during teenage years. Thesestudies show that adolescent experiences can have long-lasting economic consequences.This paper is an attempt to highlight one particular channel through which these e¤ectsmay work: individuals make important educational choices during adolescence and thesechoices are a¤ected by the pace of physical and psychological changes during adolescence.How educational systems treat individuals at di¤erent stages of their development has
been a concern among educationalists for a long time. Indeed, one the leading scholars ofadolescent development, J.M.Tanner, argued in his 1961 book "Education and Physical
2For example, a special issue of the Journal of Human Resources looks at this issue. See, Harris andWillis (1994) on Taiwan, Deolalikar (1994) on Indonesia, and Vijverberg (1994) on Côte d�Ivoire.
3In particluar, the studies that use variation in compulsory schooling estimate returns to educationsuch as the in�uential study by Angrist and Krueger (1991) and more recent papers by Oreopoulos (2003)as well as Pischke and von Wachter (2004).
3
Growth" for an educational system that would treat individuals according to their devel-opmental as opposed to chronological age. Gender di¤erences in the timing of pubertyare probably among the most robust biological di¤erences in the development of boys andgirls. At the chronological age of 14 to 16 girls are on average older than boys as measuredby developmental age. Yet, educational systems tend to treat boys and girls equally de-spite these di¤erences in the pace of physical and psychological development. We believethat the Finnish comprehensive school reform, because of its quasi-experimental nature,provides an excellent setting to examine the economic e¤ects of the interaction of latetracking and gender di¤erences in the timing of puberty.Structure of the paper is as follows. In the following section, we discuss cross-country
di¤erences in educational systems and the gender gap in educational attainment. Inthis section, we also describe the Finnish comprehensive school reform in detail. We thenmove on to discuss the theoretical arguments for the existence of the gender gap before wepresent the data and discuss the results in the �fth section. The sixth section concludes.
2 Educational systems in the industrialised countriesUnlike in the most widely studied American system, where the pupils are not streamedinto di¤erent educational tracks before they leave secondary education, in Europe most ofthe educational systems stream pupils into general and vocational tracks before the endof upper secondary school. These tracking decision have long term consequences sincetypically only the pupils that have chosen the academic track in the secondary school areeligible to continue to higher academic education at the tertiary level. Switching betweentracks in the secondary school is usually considered costly if not altogether impossible.The tracking is done either at the start or at the end of the lower secondary school and
the age at which it is done varies across countries. Broadly speaking, we can divide theEuropean educational systems into three groups. The �rst group of countries - Austriaand Germany -resemble the Finnish pre-reform educational system. There the trackingis done at the transition from the primary to lower secondary school at the age of 10. Wecall these countries the "early tracking" countries. At the other extreme are the countriesthat keep their lower secondary education integrated and track pupils at the transitionfrom lower to upper secondary school. The latest age at which this happens is 16. Wecall the countries with this kind of system - Denmark, Spain, Finland, Iceland, Norway,and Sweden - the "late tracking" countries. The rest of the Western European countriestrack pupils during lower secondary school at some point during ages 12 to 15.Table 1 reports the tracking ages and summary statistics on the gender di¤erences in
education in Western European countries. One can distinguish gender di¤erences at twolevels. First of all, there are gender di¤erences in the number of students that choose theacademic track that enables them to continue to tertiary education. These di¤erences arereported in the second column. Second, the number of students that end up attendingtertiary education institutions may di¤er by gender and these di¤erences are reported inthe third column.Table 1 reveals a clear pattern between gender di¤erences in educational attainment
and the tracking age. Along all the dimensions that gender di¤erences are measured intable 1 the percentage of women tends to be higher in the late tracking than in the earlytracking countries. In the late tracking countries, women are in a clear majority amongthe pupils who continue into the upper secondary education and in these countries theirmajority is larger in the academic track. Finally, the percentage of women in the tertiaryeducation is close to 60% in the late tracking countries while men are still in a slightmajority in Germany.
4
These di¤erences between early- and late-tracking countries suggest that educationalsystems may have di¤erent e¤ects on men and women. Naturally, cross-country di¤er-ences shouldn�t be interpreted as evidence on the di¤erent e¤ects of tracking age on theeducational investment decisions of boys and girls. It is very likely that there are a multi-tude of factors that vary across countries and also have an e¤ect on the gender di¤erencesin educational attainment. This is why in the analysis below, we focus on a single coun-try, Finland, and exploit the educational reform that postponed the selection betweenthe general and vocational tracks by �ve years for a part of the population as a naturalexperiment.
3 Finnish comprehensive school reform of 1972-1977The Finnish pre-reform and post-reform educational systems are depicted in table 2. Fin-land followed the rest of the Nordic countries in the 1970�s and implemented a thoroughreform of its secondary education system. The Swedish and Norwegian reforms are de-scribed in detail in Meghir and Palme (2004) and Aakvik et al (2003) respectively. Thesereforms were in�uenced by the expansion of secondary schooling in the United States.The aim of the reforms was to extend the years of compulsory schooling to same levels asin other industrialised countries and to widen the access to general secondary education.The Finnish pre-reform educational system dated back to 1921. Compulsory education
in this system was provided by six year long folk school. Pupils entered the folk schoolat the age of 7 and in the fourth grade, at the age of 10-11, they could apply to the lowergeneral secondary school which provided eligibility for upper general secondary schooland subsequently to academic tertiary education. The access to the academic secondaryeducation was based on the pupil�s school achievement. The pupils who chose not toapply remained in folk school for two more years after which the compulsory educationwas �nished. After this, the folk school students could still continue at civic school, whicho¤ered a two- or three-year education. After civic school, it was possible to move up tovocational school.The school system was reformed in the 1970s. This reform introduced a new curricu-
lum and changed the structure of the educational system. The previous folk school, civicschool and lower secondary school were replaced by a nine-year comprehensive schoolo¤ering general basic education. Now, all the pupils followed the same curriculum inthe same establishments and the tracking into general and vocational tracks was post-poned until the age of 16. At the same time, upper secondary school was separated fromsecondary school to form a distinct form of institution.The reform was not adopted simultaneously in all the Finnish municipalities. There
was a considerable amount of resistance to the reform and as a compromise it was agreedto carry out the transition into the comprehensive school gradually by municipalities.This gradual adoption of the new system was supposed to allow for the smooth transitionto the new system. The transition took place between 1972 and 1977 so that in eachmunicipality that adopted the reform, the pupils from the �rst to the �fth grade (i.e.pupils aged 7-11) in the folk school were immediately a¤ected by the reform.Table 3 illustrates how the reform a¤ected cohorts born between 1960-1966 in di¤erent
municipalities. The shaded areas in the table indicate cells that were enrolled in the post-reform educational system. Since the individuals born in 1960 were in the sixth gradein 1972, the year the reform started, the members of this cohort were not a¤ected bythe reform. However, the 1961 cohort was in the �fth grade in year 1972 and individualsliving in the municipalities that adopted the reform that year were enrolled in the newsystem. Similarly, in the 1962 cohort the individuals in the municipalities that adopted thereform in 1972 and 1973 were enrolled in the system. Table 3 conveniently illustrates the
5
di¤erence-in-di¤erences setting that we will use in our analysis below. More speci�cally,within cohorts 1961-1965 we have variation in the tracking age across municipalities thatadopted the reform between 1972-1977 and within municipalities there is variation in thetracking age across cohorts 1960-1966.The adoption of the reform was, in principle, dictated by the geographical location
of the municipality. Figure 1 illustrates how the reform spread through the Finnishmunicipalities during 1972-1977. The �rst municipalities that adopted the reform in 1972were predominantly situated in the province of Lapland, the extreme north of the country.In 1973 the reform was mostly adopted in the north-eastern regions. From thereon thereform spread so that it was adopted in 1974 in the northwest, in 1975 in south-east,in 1976 in the south-west and �nally in 1977 in the capital Helsinki and its surroundingsuburbs.The geographical ordering of the adoption of the reform means that the adoption order
is correlated with municipal income and education levels. Northern and eastern regionsof Finland have typically lower levels of income and education than the more urbanisedsouthern and western regions. This problem is illustrated in table 4 where we reportthe average taxable income of the adult population and the percentage of individualswith tertiary degrees in pre-and post reform municipalities by reform years. As is clearfrom table 4, the municipalities that adopt the post-reform system �rst have clearly lowereducation and income levels than the municipalities that adopt the new system later.This pattern highlights the importance of controlling for municipal �xed e¤ects in ourregressions below.
4 MotivationStandard models of the demand for education view education as an investment. Whendeciding between di¤erent levels of education the students weigh forgone earnings anddirect costs of education (both monetary and psychic) against the future gains fromcompleted education. What is common to these models is that educational investmentsare usually treated as one-o¤ decisions where there is no uncertainty about whether theindividual will �nish the program of schooling or not. Moreover, education is treated ashomogeneous so that di¤erences across �elds of education are not addressed.But in practice education consists of a series of sequential choices concerning the
amount and the type of education. At various stages, the individuals are faced with thedecision of whether to drop out of education or whether to choose a particular educationaltrack. In the developed countries, these choices typically are made during the secondaryschooling and at the transition from secondary to tertiary educationAltonji (1993) has presented a model that treats education as sequential choice and
that allows for uncertainty about whether one is able to �nish the chosen educationprogramme or not. The model was originally designed to analyze the choice of whether toattend college and the choice of college major, but it suits our context as well. Basically,the model views individuals as choosing between dropping out (working) or attendingschool at two levels, that in our case would be general and vocational, and describes hownew information about ones preferences and academic performance in�uences the decisionof whether to continue to upper secondary education and which track to follow.In the context of Altonji�s model, the factors that can give rise to gender di¤erences in
the choice of track are gender di¤erences in the academic performance and in one�s beliefsabout the ability to �nish the general educational track. If boys�school performance is,on average, lower and they believe that this re�ects their true academic ability, it wouldnot be surprising to see boys as less likely to choose the academic educational track.
6
Figure 1: The adoption of the comprehensive school reform by the municipalities,1972-1977.
7
0
0.5
1
1.5
2
2.5
3
3.5
4
4.5
5
5 7 9 11 13 15 17 19Age
Hei
ght g
ain,
cm
per
yea
r
GirlsBoys
Figure 2: Adolescent spurt in height growth for normally maturing boys and girls. Figurefrom Tanner (1961). Data from Shuttleworth (1939).
The gender di¤erences in the timing of adolescence may give rise to such gender di¤er-ences in academic performance and educational aspirations. In fact, there is a substantialbody of literature in the education and psychology literature that document the diverg-ing development of boys and girls around the age of 12 to 16.4 First of all, it is wellknown that girls enter puberty on average 1.5 to 2 years earlier than boys: the averagestarting age of puberty for girls in the developed countries is 12 or 13 whereas for boysit is 14. Figure 1 shows the average height gain of boys and girls who mature near thegender-speci�c population means. The spurt in height gain is usually strongly correlatedwith other physical changes at adolescence. Figure 1 clearly shows the gender di¤erencein the timing of this spurt. Tanner (1961) stresses that from the age of 10 and a halfonwards girls are approximately two years older than boys in terms of developmentalage. Second, several studies have found that school achievement, in terms of grades, fallsover the adolescent years. In particular, studies such as Duke et al (1982) and Dubas etal (1991) have found that late-maturing boys between the ages of 13 and 17 rank lowerthan their peers on IQ, standardised achievement tests, and educational expectations andaspirations. Burgess et al (2004) document a consistent gender gap, across both the at-tainment and ability distribution, in performance tests in favour of girls in the Englishschools at the age 14-16.These gender di¤erences in pubertal timing have lead some authors, such as Waber
(1977), to suggest that early pubertal timing can lead to persistent sex di¤erences incognition, but these claims have not been supported by subsequent work. However,pubertal timing does not have to cause persistent gender di¤erences in order to havelasting e¤ects on the educational attainment in late tracking educational systems. Allthat matters is that at the time when the decision between general and vocational trackis made, girls and boys di¤er in their achievement and aspirations. We interpret thepsychological literature as suggesting that they do. We thus expect to see larger genderdi¤erences in educational attainment in the favour of women in the late tracking systemsthan in the early tracking systems
4For a survey of the literature, see Petersen (1988) and Le¤ert and Petersen (1995).
8
5 Data and resultsAs the previous sections show, the Finnish comprehensive school reform of the 1970�sprovides a promising natural experiment setting in which to test the e¤ect of the post-ponement of tracking on male and female students. In this section, we brie�y describethe data that we use to study the gender di¤erences in educational attainment. We thenpresent the results on the e¤ect of the reform on the probability of choosing the academictrack and continuing into tertiary education as well as adult income.
5.1 DataThe data that we use in this paper come from the Finnish Longitudinal Census Data Files(FLCD). FLCD are a data source provided by the Statistics Finland that in principlecontains information on all the 6.3 million individuals who had legal residence in Finlandduring the census years 1970, 1975, 1980, 1985, 1990, 1995 and 2000. The data come fromregister-based censuses that are made possible by the systems of personal identity codes.The data contain information on the economic activity, education, income, and dwellingconditions of the individuals. Furthermore, the household identi�ers can be used to linkfamily members to each other.We have access to a 10% sample of the cohorts born in 1960-1966. This sample contains
information on 52 549 individuals. The information on the individual�s birthday and themunicipality of residence were used to determine whether the individuals was a¤ected bythe comprehensive school reform or not. The criterion to be classi�ed as a¤ected by thereform was to be in a �fth grade or below at the year when the municipality adopted thereform. Altogether 23 474 individuals (45%) in our data fall into the treatment group.5
Since the information on income and educational attainment in the data come fromgovernment register they can be considered as highly reliable. However, especially theeducation variables do have their drawbacks. As is typical for these kind of register data,we have only information on the completed degrees obtained. Thus, we cannot observedrop-outs in our data. Educational attainment is presented in the data as a �ve-digitcode giving details about the level and the �eld of education, degree, programme of studyand major subject. Using this information and our knowledge of the Finnish educationalsystem we are able to determine whether the individual chose the academic or vocationaltrack in the secondary school. The income measure that we use is the income subjectto state taxation in the year 2000. The source of this information is the Finnish taxadministration.
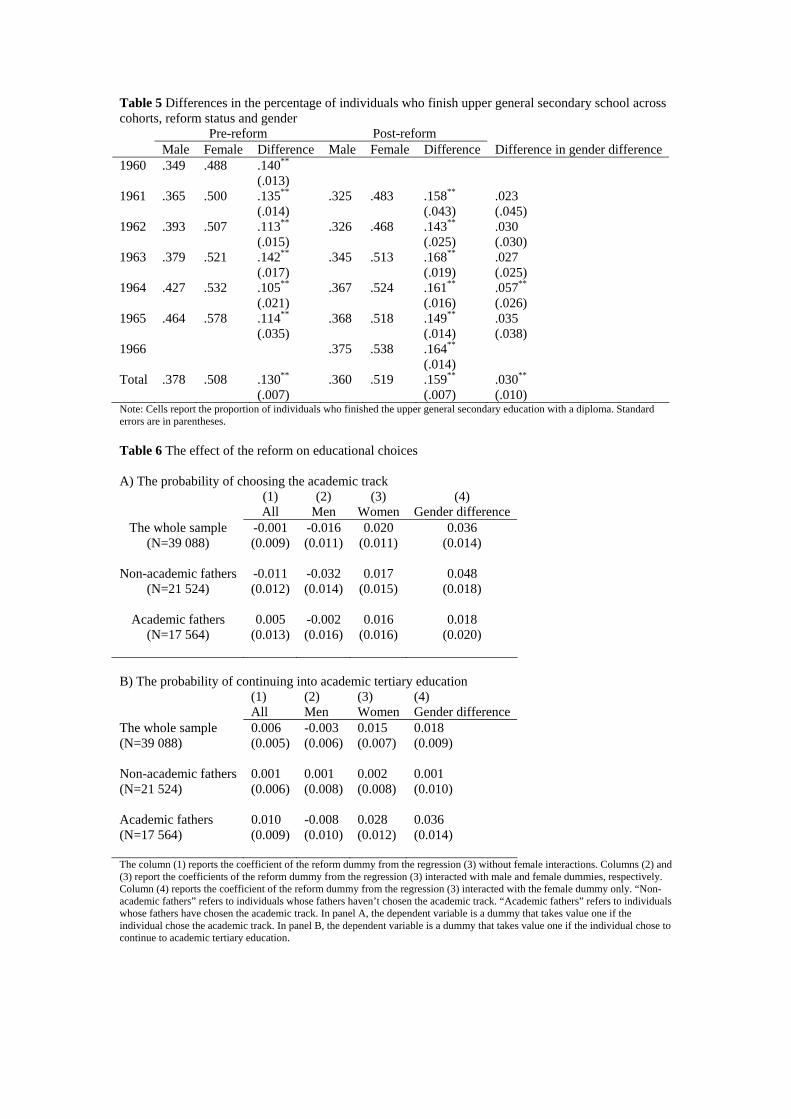
5.2 ResultsWe are interested in evaluating the impact of the reform on three outcome variables: theprobability that the individual chooses the academic track in the secondary school, theprobability that the individual chooses to continue into academic tertiary education afterthe secondary school, and income in year 2000. To examine the e¤ect of the reform onthe gender di¤erences in each of these variables, we estimate the e¤ect of the reform onmales and females and calculate the e¤ect on the gender di¤erence. Finally, to allowfor heterogeneous e¤ects by parental background we repeat the analysis in subgroupsindividuals with high- and low-educated fathers.In table 5, we report some descriptive evidence on the e¤ects of the reform on our
primary outcome variable of interest: the gender di¤erences in the probability of choosingthe academic track. The �rst thing to notice from the table is that since we have data on
5552 individuals moved out of the country and 90 individuals died before their treatment status couldbe determined.
9
the cohorts 1960-1966 we have pre- and post-reform observations on all the municipalitiesin our data. Thus, the �rst row in table 5 corresponding to the 1960 cohort gives theaverage baseline gender di¤erence in the probability of choosing the academic track. Incohorts 1961-1965, there are observations on both pre- and post-reform municipalities.Gender di¤erences tend to be larger in the post-reform municipalities although the di¤er-ence in the gender di¤erence is only signi�cant in the 1965 cohort. When we come to thecohort born in 1966, all the municipalities have adopted the post-reform system. A crudeway of evaluating the impact of the reform on the gender di¤erence is to compare the 1960and 1966 cohorts. This comparison implies that the reform increased gender di¤erencesby 2.4 percentage points. Finally, in the last row of table 5, we have calculated the pooledprobabilities in pre- and post-reform groups. The gender di¤erence is 3 percentage pointshigher in the post-reform group.To estimate the e¤ect of the reform on our outcome variables of interest, we run
following linear di¤erence-in-di¤erences regressions:
Yicm = b0 + b0
1ci + �1ricm + (b2 + b0
3ci + �2ricm) � Fi + 0mi + eicm (1)
where Yicm is the outcome variable of the individual i belonging to cohort c and livingin municipality m, ci and mi are the cohort and municipality dummies, and ricm is adummy that takes value 1 if the individual belongs to a cohort that went through thepost-reform system in the municipality m. We interact the constant, the cohort dummies,and the e¤ect of the reform with the female dummy Fi to look at the di¤erent e¤ects ofthe reform by gender.All the regressions are estimated by OLS. Thus, when Yicm is a binary variable, as it is
in the case of the probability of choosing the academic track or continuing into academictertiary education, we are running linear probability models. Although we are aware ofthe drawbacks of the linear probability models, we chose this estimation method becausethe analysis of interactions is much more straightforward in the linear case than it is withnon-linear models. Nevertheless, the estimation of (1) by probit gave qualitatively verysimilar results. Standard errors are computed allowing for clustering at the municipalitylevel.
5.2.1 The e¤ect of the reform on educational choices
Table 6 reports the estimated e¤ects of the reform on the educational choices of theindividuals. We report the results for the whole sample, by gender, and the e¤ect onthe gender di¤erence. To allow for heterogeneous e¤ects by family background, we alsoreport the e¤ects in the subgroups of individuals with academic and non-academic fa-thers. Academic fathers refer to parents that had chosen the academic track in their ownchildhood.As can be seen from panel A of table 6, the overall e¤ect of the reform on the proba-
bility of choosing the academic track is negligible. This is also true, when we break downthe overall e¤ect by parental background. Even thought the overall e¤ect on individualswith non-academic fathers is negative it is not signi�cant. However, breaking down thee¤ect by gender reveals some clear di¤erences. The e¤ect is slightly negative for boysand slightly positive for girls. This translates to a 3.6 percentage point increase in thegender di¤erence. Furthermore, the negative overall e¤ect on boys is driven by the strongnegative e¤ect that the reform had on the boys from non-academic backgrounds. Thegender di¤erence in this category increased by almost �ve percentage points. For girls,on the other hand, the e¤ect is positive irrespective of the family background.The di¤erent e¤ects of the reform on the probability of choosing the academic track
by gender are re�ected in the probability of attending academic tertiary education as
10
well. Panel B of table 6 reports the e¤ect of the reform on this probability. Again, theoverall e¤ect is zero and the e¤ect on boys is slightly negative whereas it is clearly positivefor girls. The gender di¤erence in the probability of continuing into academic tertiaryeducation increased by 1.8 percentage points as a result of the reform. Now, the positivee¤ect on girls is coming predominantly from girls with academic family background.
5.2.2 The e¤ect of the reform on income
In table 7 we report the similar decomposition of the e¤ects of the reform on log income in2000. We use all taxable earnings of the individuals as our income variable. This includeswage and capital income as well as transfers.The overall e¤ect of the reform on income is zero. There is some indication that the
overall e¤ect would be negative on the individuals from non-academic families but thee¤ect is not signi�cant. But the decomposition of the e¤ect by gender reveals once againdi¤erences. The reform decreased male earnings by 2.9 percentage points and while forwomen it had a weak positive e¤ect. The gender wage gap decrease by 4.1 percentagepoints as a results of the reform. Given that the raw gender wage gap in these cohorts is28% this translates into a 14% decrease in the gender wage gap.The fall in the gender wage gap was particularly strong among individuals from aca-
demic background. This is the group where the girls were encouraged to continue intoacademic tertiary education by the reform. The gender wage gap among individuals fromacademic background decreased by nearly six percentage points.
6 ConclusionsGender di¤erences in educational attainment have received little attention in the eco-nomics literature despite the increasing returns to education in recent decades. Here, weexamine the hypothesis according to which the female dominance in higher education canbe, at least partly, explained by the age at which students are streamed into general andvocational educational tracks. We argue that the educational systems that stream stu-dents late, that is around the age of 16, tend to favour girls because of gender di¤erencesin the timing of puberty. Girls are momentarily ahead of boys in both biological andpsychological development at the ages of 14 to 16 and this may be re�ected in long termeducational outcomes, if important decisions are taken at that age.Finnish comprehensive school reform of the 1970�s can be used to analyse this hypoth-
esis. This reform postponed the tracking age from 11 to 16 and was adopted gradually byprovinces so that we can observe members of the same cohort in di¤erent systems. Weuse Finnish census data to study the e¤ects of the reform on the educational attainmentof men and women in the cohorts that contain individuals from both pre- and post-reformeducational systems. We �nd that the reform increased the gender di¤erence in the prob-ability of choosing the academic track in the secondary school and in the probability ofcontinuing into academic tertiary education. As a result of the reform, the gender wagegap decreased by four percentage points.The e¤ects of the reform also di¤ered by family background. Particularly negatively
a¤ected were the boys from families where the father had no academic education. Theirprobability of choosing the academic track decreased by three percentage points and thisled to a negative e¤ect on income of the same magnitude. It is plausible that these boyswould be the most vulnerable to puberty shock on academic achievement and aspirations.While the negative e¤ects on puberty may be dampened by the family background e¤ectsamong boys from academic families, the boys from non-academic families are less likelyto receive such encouragement from their homes.
11
References[1]Aakvik, A., Salvanes, K. G., and K. Vaage, (2003): "Measuring heterogeneity inthe returns to schooling in Norway using educational reforms", Centre for EconomicPolicy Research, Discussion paper No. 4088.
[2]Acemoglu, D. (2002): "Technical change, inequality, and the labor market", Journalof Economic Literature, 40, 7-72.
[3]Altonji, J. G., (1993): "The demand for and the return to education when educationoutcomes are uncertain", Journal of Labor Economics, 30 (3), 409-438.
[4]Angrist, J. D. and A. B. Krueger, (1991): "Does compulsory school attendance a¤ectschooling and earnings?", Quarterly Journal of Economics, 106 (4), 979-1014.
[5]Becker, G. S. (1981): A Treatise on the Family, Harvard University Press, Cambridge.
[6]Black, S., P. Devereux, ja K-G. Salvanes, (2005): �Why the apple doesn�t fall far:Understanding intergenerational transmission of human capital�, American EconomicReview, forthcoming.
[7]Burgess, S., B. McConnell, C. Propper, and D. Wilson, (2004): "Girls rock, boysroll: An analysis of the age 14-16 gender gap in English schools", Scottish Journal ofPolitical Economy, Vol. 51, No. 2, 209-229.
[8]Carneiro, P. and J.J. Heckman, (2003): "Human capital policy", in J.J. Heckman andA.B. Krueger (eds): Inequality in America: What Role for Human Capital Policies?,MIT Press, Cambridge, Massachusetts.
[9]Charles, K. K. and M-C. Luoh, (2003): "Gender di¤erences in completed schooling",Review of Economics and Statistics, 85 (3), 559-577.
[10]Deolalikar, A. B., (1993): "Gender di¤erences in the returns to schooling and schoolenrollment rates in Indonesia", Journal of Human Resources, 28, 4, 899-932.
[11]Dubas, J.S., Graber, J. A., and A. C. Petersen, (1991): "The e¤ects of pubertaldevelopment on achievement during adolescence", American Journal of Education,99, 444-460.
[12]Duke, P. M., Jennings, D. J., Dornbusch, S., and B. Siegel-Gorelick, (1982): "Ed-ucational correlates of early and late sexual maturation in adolescence", Journal ofPediatrics, 100, 633-637.
[13]Dustmann, C. (2004): "Parental background, secondary school track choice, andwages", Oxford Economic Papers, forthcoming.
[14]A. Galeotti and G. Müller, (2005): "Friendship relations in the school class and adulteconomic attainment", unpublished manuscript, Erasmus University, Rotterdam.
[15]Hanushek, E. A. and L. Wößmann, (2005): "Does educational tracking a¤ect perfor-mance and inequality? Di¤ernences-in-di¤erences evidence across countries", CESIfoWorking paper.
[16]Jacob, B. A., (2002): "Where the boys aren�t: Non-gognitive skills, returns to school-ing and the gender gap in higher education", Economics of Education Review, 21 (6),589-598.
12
[17]Katz, L. F. and D. A. Autor, (1999): "Changes in the wage structure and earningsinequality", in O. Ashenfelter and D. Card (eds.): Handbook of Labor Economics, Vol3A, North-Holland, Amsterdam.
[18]Le¤ert, N. and A. C. Petersen, (1995): "Patterns of development during adolescence",in M. Rutter and D. J. Smith (eds): Psychosocial Disorders in Young People, JohnWiley & Sons.
[19]Meghir, C. and M. Palme, (2004): "Ability, parental background, and educationpolicy: Empirical evidence from a social experiment", American Economic Review,forthcoming.
[20]Oreopoulos, P. (2003): "Do dropouts drop out too soon? International evidence fromchanges in school leaving laws", mimeo, University of Toronto.
[21]Persico, N., A. Postlewaite, and D. Silverman, (2004): "The e¤ect of adolescent expe-rience on labor market outcomes: The case of height", Journal of Political Economy,112 (5), 1019-53.
[22]Parish, W. L. and R. J. Willis, (1993): "Daughters, education, and family budgets:Taiwan experiences", Journal of Human Resources, 28, 4, 863-898.
[23]Petersen, A. C., (1988): "Adolescent development", Annual Review of Psychology, 39,583-607.
[24]Pischke, J-S. and T. von Wachter, (2004): "The e¤ect of compulsory schooling inGermany", mimeo, London School of Economics.
[25]Shuttleworth, F. K., (1939): "The physical and mental growth of girls and boys agesix to nineteen in relation to age at maximum growth", Monographs of the Society forResearch in Child Development, Vol 4, No 3.
[26]Tanner, J. M., (1961): Education and physical growth, University of London Press,London.
[27]Waber, D. P., (1976): "Sex di¤erences in cognition: A function of the maturationrate?", Science, 192, 572-574.
[28]Vijverberg, W. P. M., (1993), "Educational investments and returns for men andwomen in Cote d�Ivoire", Journal of Human Resources, 28, 4, 933-974.
13
Table 1 Tracking age and the proportion of women in upper secondary and tertiary education in European countries 1998-2003. (1)
Tracking age
(2) Proportion of women in upper general secondary education
(3) Proportion of women in tertiary education
Early tracking Austria 10 0.547 0.513 Germany 10 0.546 0.482 In between Luxembourg 12 0.547 0.522 Netherlands 12 0.532 0.500 Belgium 14 0.540 0.527 France 13 0.560 0.545 Greece 15 0.544 0.506 Italy 14 0.543 0.556 Portugal 15 0.550 0.565 Late tracking Denmark 16 0.569 0.568 Spain 16 0.537 0.529 Finland 16 0.576 0.538 Iceland 16 0.585 0.623 Norway 16 0.563 0.585 Sweden 16 0.582 0.584 Note: Tracking age refers to the age at which pupils are streamed into vocational and general secondary education. Proportion of women in upper secondary education is the share of women in the educational track that enables the student to participate in the academic tertiary education. Proportion of women in tertiary education is the share of women in the population of students in the tertiary education institutions. Source: Eurostat.
Table 2 Finnish educational systems
The pre-reform system
Age
7 8 9 10 11 12 13 14 15 16 17 18 19 20 21 22 23 24 25 Folk school General secondary school Universities Civic school Vocational schools
The post reform-system
Age 7 8 9 10 11 12 13 14 15 16 17 18 19 20 21 22 23 24 25 Comprehensive school General secondary
school Universities
Vocational school Higher vocational education
Table 3 The adoption of the reform by cohorts The reform year Birth cohort 1972 1973 1974 1975 1976 1977 1960 6th grade - - - - - N=606 N=905 N=1,262 N=1,401 N=1,334 N=804 1961 5th grade 6th grade 7th grade 8th grade 9th grade - N=577 N=969 N=1,362 N=1,283 N=1,401 N=816 1962 4th grade 5th grade 6th grade 7th grade 8th grade 9th grade N=645 N=939 N=1,339 N=1,331 N=1,431 N=791 1963 3rd grade 4th grade 5th grade 6th grade 7th grade 8th grade N=645 N=913 N=1,297 N=1,409 N=1,485 N=819 1964 2nd grade 3rd grade 4th grade 5th grade 6th grade 7th grade N=592 N=907 N=1,299 N=1,352 N=1,481 N=854 1965 1st grade 2nd grade 3rd grade 4th grade 5th grade 6th grade N=553 N=872 N=1,234 N=1,349 N=1,338 N=868 1966 - 1st grade 2nd grade 3rd grade 4th grade 5th grade N=550 N=771 N=1,204 N=1,267 N=1,409 N=844 Note: The shaded areas indicate cells that adopted the post-reform educational system. N refers to the sample size in each cell in the data that are used in the analysis. Table 4 Mean municipal education in the pre- and post-reform municipalities Pre-reform Post-reform Birth Cohort
% individuals
Mean municipal education
Mean municipal income
% individuals
Mean municipal education
Mean municipal income
1960 100 10.15 9 423 0.00 . 1961 91 10.44 9 553 9 7.89 8 235 1962 75 11.04 9 957 25 7.75 7 905 1963 56 12.02 10 638 44 8.12 8 091 1964 36 13.75 11 680 64 8.649 8 467 1965 14 19.47 14 385 86 9.12 8 897 1966 0 . 100 10.55 9 647 % individuals refers to the percentage of the cohort that falls into each category. Mean municipal education is the average percentage of individuals with a tertiary degree in the municipalities in 1980. Mean municipal income is the average taxable income in the municipalities in 1980 in euros.
Table 5 Differences in the percentage of individuals who finish upper general secondary school across cohorts, reform status and gender Pre-reform Post-reform Male Female Difference Male Female Difference Difference in gender difference 1960 .349 .488 .140**
(.013)
1961 .365 .500 .135**
(.014) .325 .483 .158**
(.043) .023 (.045)
1962 .393 .507 .113**
(.015) .326 .468 .143**
(.025) .030 (.030)
1963 .379 .521 .142**
(.017) .345 .513 .168**
(.019) .027 (.025)
1964 .427 .532 .105**
(.021) .367 .524 .161**
(.016) .057**
(.026) 1965 .464 .578 .114**
(.035) .368 .518 .149**
(.014) .035 (.038)
1966 .375 .538 .164**
(.014)
Total .378 .508 .130**
(.007) .360 .519 .159**
(.007) .030**
(.010) Note: Cells report the proportion of individuals who finished the upper general secondary education with a diploma. Standard errors are in parentheses. Table 6 The effect of the reform on educational choices A) The probability of choosing the academic track
B) The probability of continuing into academic tertiary education (1) (2) (3) (4) All Men Women Gender difference The whole sample 0.006 -0.003 0.015 0.018 (N=39 088) (0.005) (0.006) (0.007) (0.009) Non-academic fathers 0.001 0.001 0.002 0.001 (N=21 524) (0.006) (0.008) (0.008) (0.010) Academic fathers 0.010 -0.008 0.028 0.036 (N=17 564) (0.009) (0.010) (0.012) (0.014) The column (1) reports the coefficient of the reform dummy from the regression (3) without female interactions. Columns (2) and (3) report the coefficients of the reform dummy from the regression (3) interacted with male and female dummies, respectively. Column (4) reports the coefficient of the reform dummy from the regression (3) interacted with the female dummy only. “Non-academic fathers” refers to individuals whose fathers haven’t chosen the academic track. “Academic fathers” refers to individuals whose fathers have chosen the academic track. In panel A, the dependent variable is a dummy that takes value one if the individual chose the academic track. In panel B, the dependent variable is a dummy that takes value one if the individual chose to continue to academic tertiary education.
Table 7 The effect of the reform on log taxable income in 2000, euros (1) (2) (3) (4) All Men Women Gender difference The whole sample -0.004 -0.029 0.012 0.041 (N=38 556) (0.012) (0.016) (0.015) (0.020) Non-academic fathers -0.013 -0.032 -0.004 0.028 (N=21 252) (0.016) (0.021) (0.018) (0.024) Academic fathers 0.005 -0.027 0.030 0.058 (N=17 304) (0.018) (0.024) (0.022) (0.029) The column (1) reports the coefficient of the reform dummy from the regression (3) without female interactions. Columns (2) and (3) report the coefficients of the reform dummy from the regression (3) interacted with male and female dummies, respectively. Column (4) reports the coefficient of the reform dummy from the regression (3) interacted with the female dummy only. “Non-academic fathers” refers to individuals whose fathers haven’t chosen the academic track. “Academic fathers” refers to individuals whose fathers have chosen the academic track.