15
1 GHG Inventory Quantification and reporting of greenhouse gas emissions in accordance with the Corporate GHG Protocol 16 th April 2021

1
GHG Inventory
Quantification and reporting of greenhouse gas emissions in accordance
with the Corporate GHG Protocol
16th April 2021

2
INDICE
INTRODUCTION ............................................................................................................. 3
BOUNDARIES AND CALCULATION METHODS ....................................................................... 4
Organizational boundaries .......................................................................................................... 4
Operating boundaries ................................................................................................................. 4
Reference year ........................................................................................................................... 5
Inventory recalculation in the reference year ............................................................................... 5
Calculation method ..................................................................................................................... 6
Qualitative estimation of the uncertainties ................................................................................... 7
RISULTS .......................................................................................................................... 9
Scope 1 emissions
Scope 2 emissions
Scope 3 emissions
Verification statement………………………………………… ……………………………………………………………………………..13
Annex
3
INTRODUCTION
The purpose of this document is to analyse and report on the Greenhouse Gas (GHG) emissions produced by
the Enel Group’s activities, relating to the generation and distribution of electricity and the sale of electricity
and gas.
The reporting of emissions is carried out in accordance with the international Greenhouse Gas Protocol –
published by the World Business Council for Sustainable Development and World Resource Institute – and
with the GRI standard (Global Reporting Initiative), and has been made public as part of Enel’s Sustainability
Report, which constitutes the consolidated non-financial Declaration
(www.enel.com/investors/sustainability).
On the path to complete decarbonisation by 2050, Enel has provided a roadmap with medium-term
objectives, certified by the Science Based Targets initiative (SBTi), with an expected 80% reduction in direct
greenhouse gas emissions per kWh by 2030 compared to 2017 levels. It has also undertaken to reduce its
indirect emissions associated with the sale of natural gas on the retail market by 16% by 2030, compared to
2017 data.
For the sake of transparency, Enel has responded to the CDP (former Carbon Disclosure Project) for
several years and was placed on the 2020 A List.
4
BOUNDARIES AND CALCULATION METHODS
Organisational boundaries
Direct and indirect greenhouse gas emissions are reported based on the Group's financial consolidation
scope. For the list of Companies included in the inventory, please refer to the list in Annex 1. Environmental
data is collected for thermoelectric, renewable and nuclear plants, for photovoltaic panel production plants,
for all distribution activities and for the Enel sites in its countries of operation.
The data is consolidated for the various activities at 100% of their value, regardless of Enel's percentage of
ownership, except for the nuclear sector for which data is reported based on criteria in proportion to
ownership.
Operating boundaries
Listed below are the GHG emission sources broken down into 1,2 and 3 scopes:
Scope 1
- combustion of fossil fuels in electricity generation activities;
- combustion of fossil fuels in generators used for electricity generation and distribution activities;
- combustion of fossil fuels in vehicles under the Company’s control;
- SF6 losses in electricity generation and distribution activities;
- HFCs gas losses from cooling systems;
- NF3 losses from the production of solar panels;
- combustion of fuels for heating offices and canteens.
Scope 2
- consumption of electricity purchased by the network for civil use (electronic equipment, heating,
lighting) or for electricity generation in thermoelectric and hydroelectric plants and for distribution.
Since 2016, all supplies of electricity for the offices and Italian generation sites come from renewable
sources. This supply includes the issue of green certificates by the competent authority.
- dissipation of energy from network losses relating to non-owned transmission systems and
distribution losses from the network under the Enel’s operational control (Joule effect).
Scope 3
Listed below are the sources in question divided into the categories of the GHG Protocol:

5
- Category 3. Fuels and energy-related activities (not included in Scope 1 and 2): fugitive emissions
during the mining of coal used in thermoelectric power plants;
- Category 4. Transportation and distribution upstream of the energy generation: coal transportation
by land and sea, transportation of fuels, raw materials and waste on wheels;
- Category 11. Use of sold goods: emissions due to the use in retail of electricity and gas by end
customers.
Reference year and base year
This report refers to the GHG analysis and quantification for the calendar year 2020. The base year, which is
used to monitor emission performance, is 2017.
Enel aims to reduce CO2 emissions (Scope 1) by 80% by 2030 from the base year 2017, certificated Science
Based Target Initiative, per kWh in line with the Group's strategy which plans to increase capacity from
renewable sources and gradually phase out coal-fired plants, enabling an increase in zero-emission
generation. With this mind, the CO2eq emissions in the base year are not recalculated. With reference to the
GHG inventory, the value of the emissions will be recalculated in the future, when necessary, for changes in
assets for sale as indicated in the GHG protocol.
Enel has set a further goal, certified by SBTi, to achieve a 16% reduction in absolute indirect emissions
associated with the consumption of gas by end customers by 2030 compared to the base year 2017 (Scope
3, category 11).
Inventory recalculation in the reference year
Following the exit from the boundary of financial consolidation of the Russian coal-fired thermoelectric
power plant of Reftinskaya for sale on 1 October 2019, the greenhouse gas emissions for the year 2017 were
recalculated, in line with the reference methodology, without the presence of the activity of this plant. The
2017 values reported in the Sustainability Report, as already descrived above, instead take into account the
full scope of Enel's business in the base year.
6
Calculation method
Environmental data for the generation and distribution of electricity is collected on an annual basis in an
internal database called EDEN (Enel Data on Environment). The data was entered for technology directly
from the various organisational levels responsible for the data (plant or country). As soon as any data is
entered it undergoes formal controls and consistency assessments and subsequent series of validations.
The Group's GHG emissions are calculated centrally, except for CO2 emissions from thermoelectric
generation, which are collected directly from plants and submitted annually for certification by the relevant
bodies by country (for Italy, Spain and Portugal, verified emissions are registered in the European Union
registry which includes all countries participating in the EU ETS).
The fuel emission factors used for calculations are those required by the IPCC guidelines (Intergovernmental
Panel on Climate Change): 2006 IPCC Guidelines for National Greenhouse Gas Inventories https://www.ipcc-
nggip.iges.or.jp/public/2006gl/
The GWP figures (Global Warming Potential) refer to the ‘Global Warming Potential values’ document of the
GHG Protocol, Fifth Assessment Report (AR5 – 100 year)
https://www.ghgprotocol.org/sites/default/files/ghgp/Global-Warming-Potential-
Values%20%28Feb%2016%202016%29_1.pdf
The CO2 specific emissions are a component of the calculation of the energy emissions from the network
calculated on the basis of the national production mix and the energy dissipated due to technical network
losses. The calculation is carried out by multiplying the country-specific emission factors by the quantity of
energy withdrawn / dissipated in the country and adding all the contributions. A similar calculation is made
for scope 3 emissions, use of electricity by end users, for the portion of the sold electricity that exceeds the
energy produced in the country by Enel, whose emissions are already accounted for in scope 1.
The country-specific emissions, expressed in CO2/kWh, used in the calculations of Scope 2 and Scope 3 are
taken from the Enerdata provider, which reports the best estimates/updates on the current figures for the
previous year (-1). Where this is not available, the specific emission for year (-2) is considered valid.
7
Qualitative estimation of uncertainty
Scope 1
Emissions from thermal, coal, oil, gas and combined cycle plants account for over 99% of the value for Scope
1. The plants are located in Europe (Italy, Spain, Portugal), in Russia and South America (Argentina, Brazil,
Chile, Colombia and Peru). 53% of direct CO2 emissions from thermoelectric generation is subject to the
Emission Trading EU ETS Directives and over 91% of these emissions come from Class C plants (emissions
over 500,000 t CO2 per year, Commission Regulation (EU) No. 601/2012).
The CO2eq emissions for the generation of CH4 and N2O are calculated based on the fuels in the EDEN
database on annual base. The fuel amounts used in power plants are subject to metrological checks also for
billing purposes.
For the other CO2 emission values (losses and refills of refrigerant gases and SF6) the basis for calculation is
the data put into EDEN using the IPCC emission factors (Fifth Assessment Report (AR5 - 100 year) and GWP
of the GHG Protocol.
Scope 2
To calculate the energy taken from the network or from energy dissipation due to distribution network and
transmission system losses, the level of uncertainty is key (fiscal measuring device).
The technical network losses, due to the heat generated by the passage of electric current in a
conductor (Joule effect), are not calculated by means of an energy balance mechanism as is the case
for total losses (technical and commercial) but with recognized standards with minimum degree of
uncertainty.
Measures are also implemented to manage / decrease the associated uncertainty through periodic
internal reviews of the process of managing business data and the results obtained.
The application of these considerations allows to minimize the error associated with the calculation
of direct and indirect emissions.
Scope 3
Calculations related to the extraction and transport of coal and those relating to the transport of
fuels, raw materials and waste are based on assumptions constructed with the use of all the possible
relevant information. The details of the assumptions are reported annually in the notes of the

8
numerical annex of the Environmental Sustainability of the Sustainability Report. This approach was
selected in consideration of the high number of plants and countries in which Enel operates.
The calculation of the emissions deriving from the use of electricity and gas sold by Enel in the retail
market is quantified on the basis of Enel's certified sales values, the uncertainty of which is
instrumental (tax counters). IPCC factors are used in the calculations (2006 IPCC Guidelines for
National Greenhouse Gas Inventories, Table 1.4, page 1.24).

9
RESULTS
Scope 1 Emissions
In 2020, direct emissions (Scope 1) amount to 45,255,000 tCO2eq.
The share of emissions from the thermal power generation sector amounted to 44,670,284 tCO2 and
accounts for more than 99% of the total value of Scope 1.
2020 2017
CO2 emissions from electricity generation and heat (Mt) 44.70 85.52
The significant decrease in the value of CO2 emissions from thermoelectric sources compared to the base
year is mainly due to the lower production from coal (-75%) vs 2017 compared to an overall decrease for the
same perimeter of thermoelectric production equal to 38% in three years.
The indicators relating to the Group's specific CO2 emissions are as follows:
- The ratio between total emissions from thermoelectric plants, which is undergoing the verification, and the
Group's total production including heat (expressed in energy units).
For 2020, this ratio amounts to 211 g/kWh.
- The ratio between total emissions from scope1, which is undergoing the verification, and the Group's total
production including heat (expressed in energy units).
For 2020, this ratio amounts to 214 g/kWh.
Scope 1 also includes the CO2 emissions generated during the petrol and diesel combustion process in the
engines of vehicle controlled by the Company and by the combustion of diesel in generators used in energy
generation technologies, as well as in electricity distribution activities. The combustion processes from fossil
fuels also include the generation of N2O (GWP=265) and CH4 (GWP=28) expressed as a CO2 equivalent. For
2020, the sum of the two components totalled 114,805 tCO2eq
Other direct CO2 equivalent emissions originated from the leakage to the atmosphere of SF6 (GWP=23,500),
which occurs mainly within the scope of electricity Distribution and, secondarily in energy power plants. The
quantities released to the atmosphere in 2020for the entire scope of the Group amount to 6,656 kg and
156,418 tCO2eq, of which Distribution accounts for 84%. As regards Scope 1, Enel considers the emissions of
leakage to the atmosphere of gases and refrigerant gas mixtures calculated by applying the average GWP
value of the gas. The emissions of these substances in 2020 correspond to 71,153tCO2eq.
As of 2020, reporting also covered emissions from NF3 losses amounting to 10t CO2eq in the year for the
production of photovoltaic panels.
10
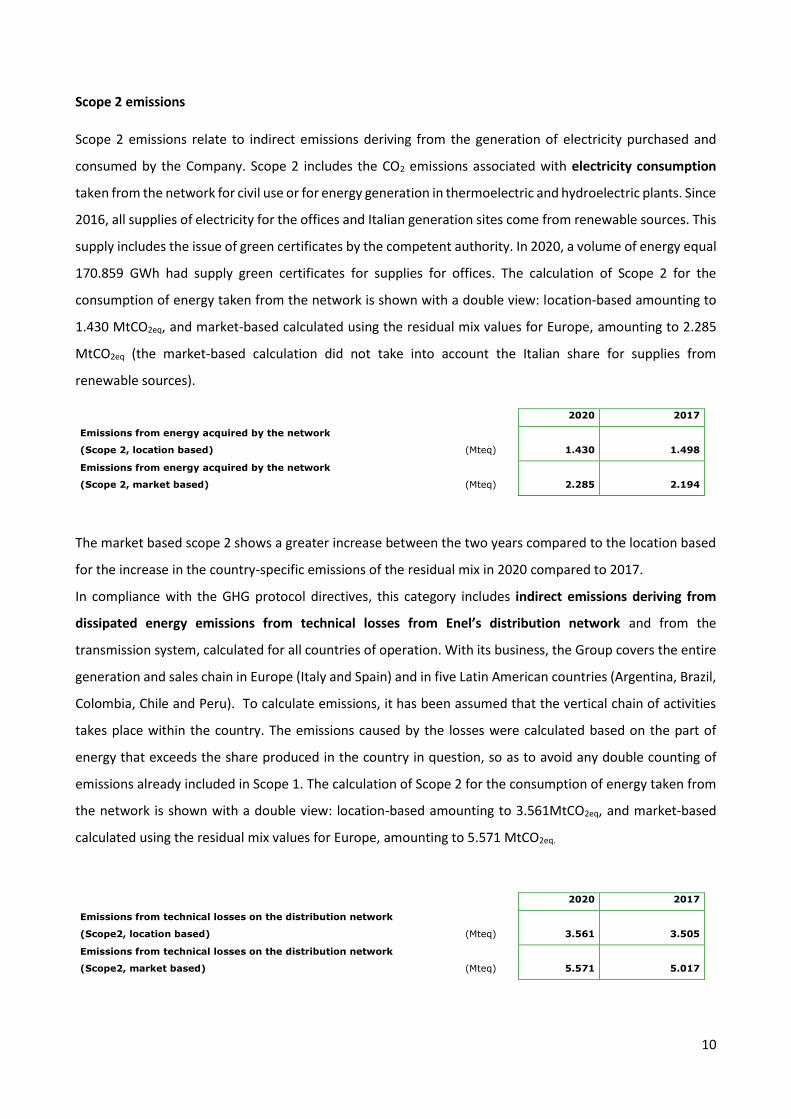
Scope 2 emissions
Scope 2 emissions relate to indirect emissions deriving from the generation of electricity purchased and
consumed by the Company. Scope 2 includes the CO2 emissions associated with electricity consumption
taken from the network for civil use or for energy generation in thermoelectric and hydroelectric plants. Since
2016, all supplies of electricity for the offices and Italian generation sites come from renewable sources. This
supply includes the issue of green certificates by the competent authority. In 2020, a volume of energy equal
170.859 GWh had supply green certificates for supplies for offices. The calculation of Scope 2 for the
consumption of energy taken from the network is shown with a double view: location-based amounting to
1.430 MtCO2eq, and market-based calculated using the residual mix values for Europe, amounting to 2.285
MtCO2eq (the market-based calculation did not take into account the Italian share for supplies from
renewable sources).
2020 2017
Emissions from energy acquired by the network
(Scope 2, location based) (Mteq) 1.430
1.498
Emissions from energy acquired by the network
(Scope 2, market based) (Mteq) 2.285 2.194
The market based scope 2 shows a greater increase between the two years compared to the location based
for the increase in the country-specific emissions of the residual mix in 2020 compared to 2017.
In compliance with the GHG protocol directives, this category includes indirect emissions deriving from
dissipated energy emissions from technical losses from Enel’s distribution network and from the
transmission system, calculated for all countries of operation. With its business, the Group covers the entire
generation and sales chain in Europe (Italy and Spain) and in five Latin American countries (Argentina, Brazil,
Colombia, Chile and Peru). To calculate emissions, it has been assumed that the vertical chain of activities
takes place within the country. The emissions caused by the losses were calculated based on the part of
energy that exceeds the share produced in the country in question, so as to avoid any double counting of
emissions already included in Scope 1. The calculation of Scope 2 for the consumption of energy taken from
the network is shown with a double view: location-based amounting to 3.561MtCO2eq, and market-based
calculated using the residual mix values for Europe, amounting to 5.571 MtCO2eq.
2020 2017
Emissions from technical losses on the distribution network
(Scope2, location based) (Mteq) 3.561
3.505
Emissions from technical losses on the distribution network
(Scope2, market based) (Mteq) 5.571 5.017

11
Scope 3 emissions
Scope 3 emissions are generated as a consequence of Company activities and do not derive from controlled
or owned sources. These indirect emissions concern Enel’s entire value chain, from generation and
transportation through to the sale of energy.
Electricity generation activities: CO2eq emissions resulting from the energy generation of thermal plants
have been estimated for all countries of operation, with a particular focus on coal-fired generation.
The emissions fall into the following Scope 3 categories of the GHG Protocol:
Category 3. Fuel and energy related activities (not included in scope 1 or 2)
In this group, the fugitive methane emissions from coal during the mining stage has been estimated for the
amount used by coal-fired power plants over the year reported as CO2eq (GWP = 28).
2020 2017
Coal mining (Mteq) 1.061 3.816
The decrease in value in 2020 compared to 2017 is due to the lower use of coal due to the reduction in coal
thermal production.
Category 4. Upstream transportation and distribution
This category includes the reporting of emissions due to the transportation of used fuels (coal, diesel oil, fuel
oil, biomass), consumables (e.g. chemical compounds) for the operation of plants and the transportation of
waste. For coal, the share of emissions relating to transportation by sea (ship) has been calculated; trucks
were taken into account for other transportation. For all calculations, basic assumptions were made
regarding the length of the trip, the emissions of the mode of transport used and its frequency. From 2020
the calculation of the emissions related to the transport by ship is based on the real transport of the fossil
fuel.
2020 2017
Coal transportation by sea (Mteq) 0.104 0.805
Coal transportation by train (Mteq) 0 0
The decrease in values in 2020 compared to 2017 is due to the lower coal and thermoelectric production
which led to a lower use of fuels and raw materials, with a lower production of waste.
Electricity and gas market activities: the emissions deriving from the use of electricity and gas by end
customers in the retail market were calculated.

12
Category 11- Use of the sold products
Calculation is provided for the emissions relating to the gas and electricity market in Europe and the
electricity market in Europe and Latin America generated during the final phase of use of the products sold
to end customers.
Retail gas market: Enel operates in this market in Europe (Italy, Spain and Romania). The emission value
resulting from the combustion of natural gas is calculated based on the energy value (TWh) of gas sold,
multiplied by its emission factor (source: IPCC for CO2, N2O and CH4).
Retail electricity market: With its business, Enel covers the entire generation and sales chain in Europe (Italy
and Spain) and in five Latin American countries (Argentina, Brazil, Colombia, Chile and Peru). To calculate
emissions, it has been assumed – as already described for emissions from network losses under Scope 2 –
that the vertical chain of activities takes place within the same country. The emissions of the share sold and
produced by the company have not been included in the calculation since they already fall under Scope 1.
The share for the fraction sold but not produced by country was calculated by multiplying the energy amount
by the specific country-level emission (source: Enerdata). Emissions from network losses are not included in
the calculation since they are reported under Scope 2.
2020 2017
Use of products sold by end users: electricity market (Mteq) 25,041 25,460
Use of products sold by end users: gas market (Mteq) 21,483 25,290
Exclusions
This reporting was based on a materiality criterion, with the following exceptions:
- Companies belonging to the business line of Enel X
- The calculation of the Scope 1 emissions of biogenic carbon emissions from the decomposition
of organic matter in hydro-electric dams
- The calculation of the Scope 3 emissions relating to lignite (which became marginal after
leaving the scope of Slovak plants in 2016)

13
The GHG inventory statements for 2020 were audited by DNV GL, with a reasonable level of certainty for
Scope 1, Scope 2 and Scope 3 emissions, limited to the sale of natural gas, and with a limited level of certainty
for the other Scope 3 emissions included in the inventory’s scope of application. The audit was conducted
according to Standard ISO 4064-3 for the compliance of Greenhouse Gas (GHG) Inventories with the
WBCSD/WRI Corporate accounting and Reporting Standard (GHG Protocol). This activity also included an
analysis of GHG emissions for the base year 2017 due to a change in the boundary for the exit for sale of a
coal-fired thermoelectric asset in Russia.

14

15
Annex
List of Companies within the scope of the inventory
Note: Group companies with thermoelectric, nuclear and renewable energy production plants, photovoltaic panels
production, and offices in the countries of operational presence relating to energy production and distribution
activities fall within the perimeter.
Central Dock Sud
Condensa
Edesur
e-distribuzione
Emgesa
Endesa
Enel Cien
Enel Distribución Ceará
Enel Distribución Chile
Enel Distribución Goias
Enel Distribución Perú
Enel Distribución Río
Enel Distribución Sao Paulo
Enel Distributie Banat
Enel Distributie Dobrogea
Enel Distributie Muntenia
Enel Generación Costanera
Enel Generación Chile
Enel Generación El Chocon
Enel Generación Fortaleza
Enel Generación Perú
Enel Generación Piura
Enel Green Power Brasil partecipacoes Ltda
Enel Green Power Cachoeira Dourada
Enel Green Power Chile Ltda
Enel Green Power Costa Rica
Enel Green Power Espana
Enel Green Power Guatemala
Enel Green Power Hellas
Enel Green Power India Privated Limited
Enel Green Power Mexico S de RL de CV
Enel Green Power North America Development LCC
Enel Green Power Panama
Enel Green Power Romania
Enel Green Power RSA (Pty)
Enel Green Power SpA
Enel Green Power Volta Grande
Enel Produzione IT
Enel Servizi


