1 Jayant A. Sathaye, Larry Dale, Willy Makundi and Peter Chan Lawrence Berkeley National Laboratory Berkeley, CA With input from Niels Anger, ZEW Inc. Germany and Ken Andrasko, US EPA (now at the World Bank), Washington DC Presented at World Bank, Washington, DC 27 May 2008 Work supported by US EPA, Climate Change Division. GHG Mitigation Potential in Global Forests
Transcript
1
Jayant A. Sathaye, Larry Dale, Willy Makundi and Peter Chan
Lawrence Berkeley National Laboratory
Berkeley, CA
With input from
Niels Anger, ZEW Inc. Germany and
Ken Andrasko, US EPA (now at the World Bank), Washington DC
Presented at
World Bank, Washington, DC
27 May 2008
Work supported by US EPA, Climate Change Division.
GHG Mitigation Potential in Global Forests
2
Contents
• GCOMAP Model Description
• Deforestation Processes and Costs
– GCOMAP analysis ongoing for the UK Eliasch and the
Australian Review
– What is magnitude of costs? Do these vary by region?
How good are the data?
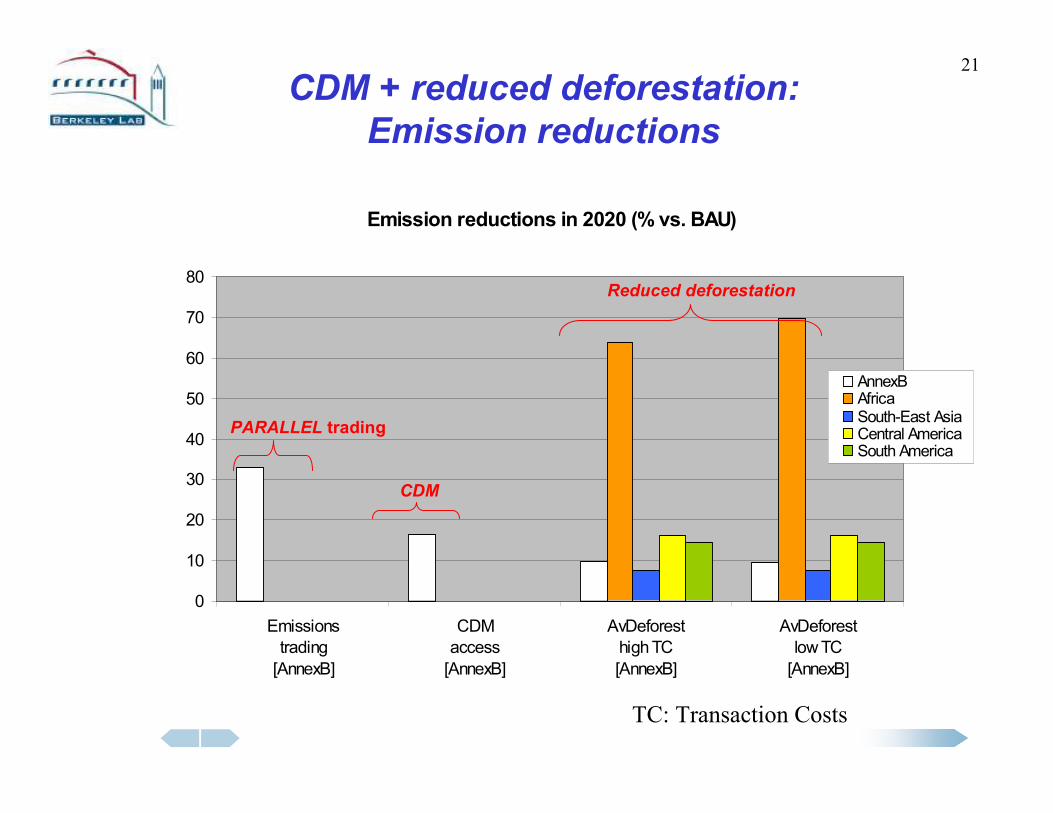
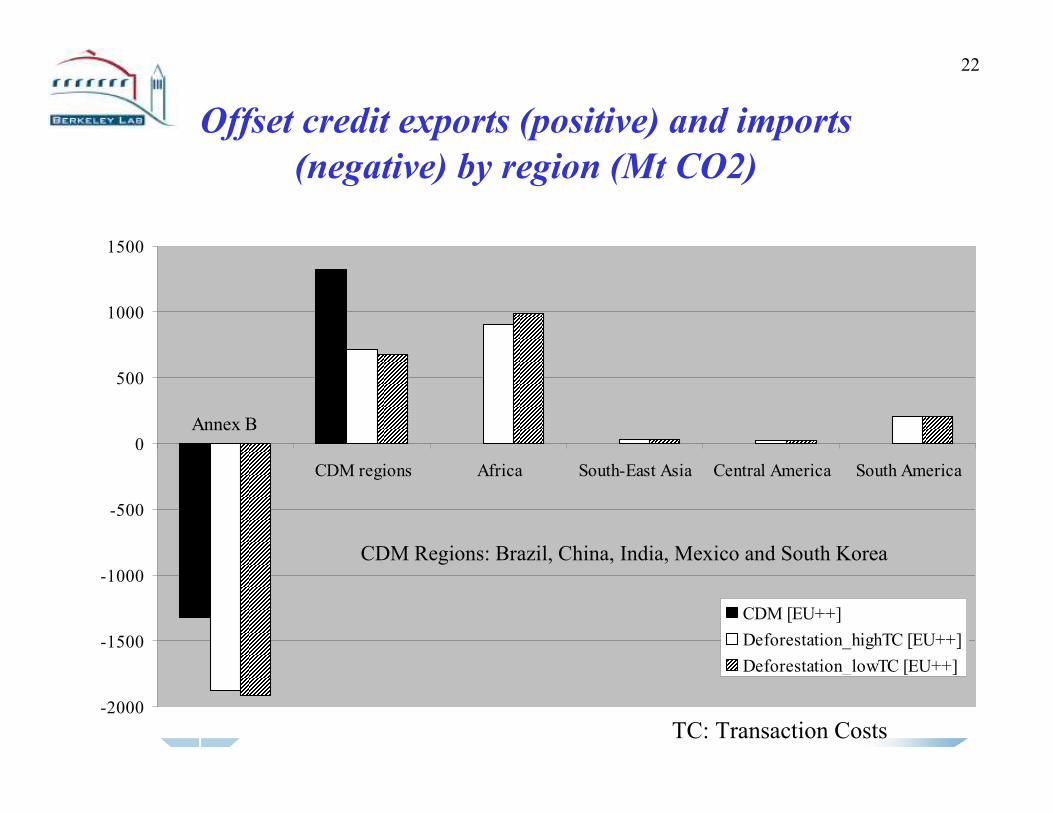
• Post-Kyoto emissions trading and reducing
deforestation
– What is the fraction of 2020 Annex 1 emissions
reduction that reducing deforestation can contribute?
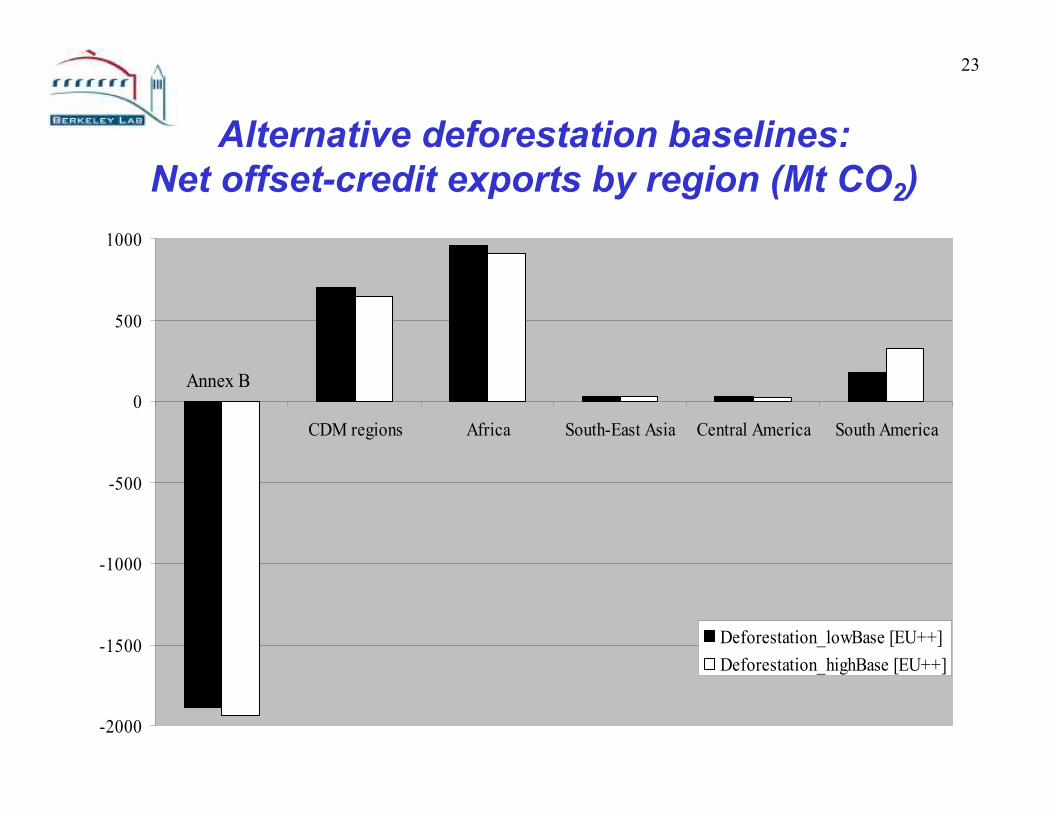
What is the impact of uncertain baselines?
• Summary and Conclusions
3
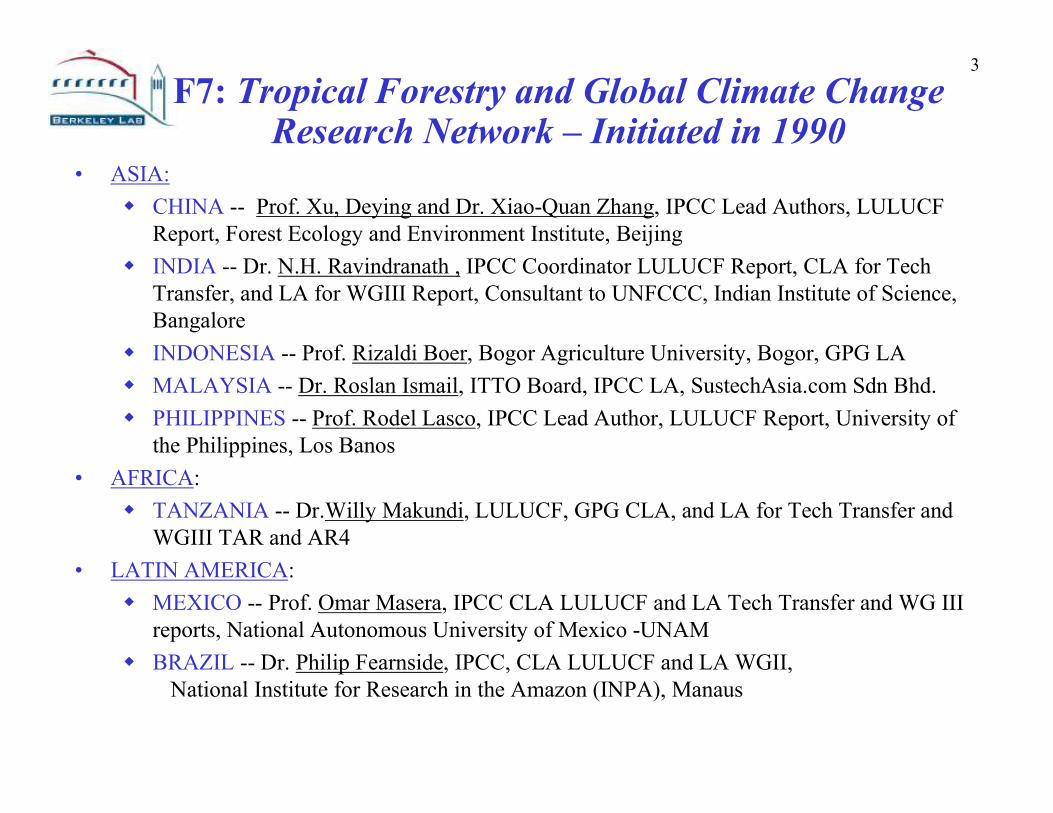
F7: Tropical Forestry and Global Climate Change Research Network – Initiated in 1990
• ASIA:
� CHINA -- Prof. Xu, Deying and Dr. Xiao-Quan Zhang, IPCC Lead Authors, LULUCF
Report, Forest Ecology and Environment Institute, Beijing
� INDIA -- Dr. N.H. Ravindranath , IPCC Coordinator LULUCF Report, CLA for Tech
Transfer, and LA for WGIII Report, Consultant to UNFCCC, Indian Institute of Science,
Bangalore
� INDONESIA -- Prof. Rizaldi Boer, Bogor Agriculture University, Bogor, GPG LA
� MALAYSIA -- Dr. Roslan Ismail, ITTO Board, IPCC LA, SustechAsia.com Sdn Bhd.
� PHILIPPINES -- Prof. Rodel Lasco, IPCC Lead Author, LULUCF Report, University of
the Philippines, Los Banos
• AFRICA:
� TANZANIA -- Dr.Willy Makundi, LULUCF, GPG CLA, and LA for Tech Transfer and
WGIII TAR and AR4
• LATIN AMERICA:
� MEXICO -- Prof. Omar Masera, IPCC CLA LULUCF and LA Tech Transfer and WG III
reports, National Autonomous University of Mexico -UNAM
� BRAZIL -- Dr. Philip Fearnside, IPCC, CLA LULUCF and LA WGII,
National Institute for Research in the Amazon (INPA), Manaus
4
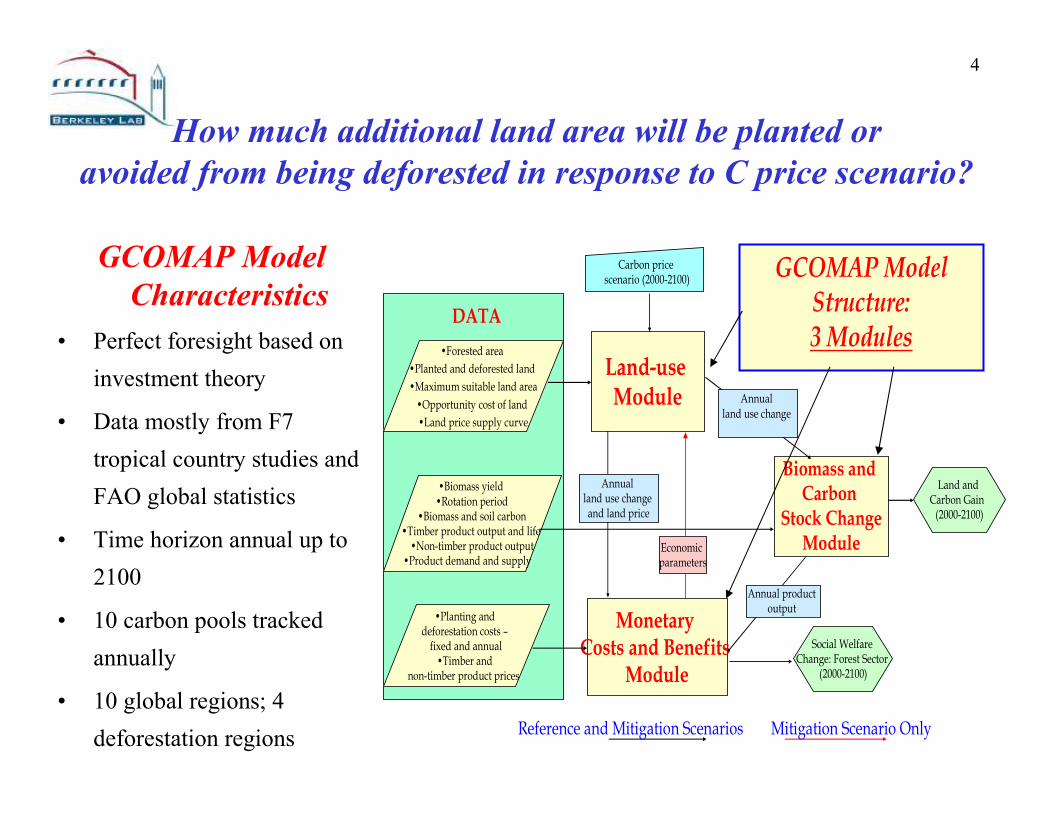
GCOMAP Model
Characteristics
• Perfect foresight based on
investment theory
• Data mostly from F7
tropical country studies and
FAO global statistics
• Time horizon annual up to
2100
• 10 carbon pools tracked
annually
• 10 global regions; 4
deforestation regions
GCOMAP Model
Structure:
3 Modules
Land-use Module
Monetary Costs and Benefits
Module
Biomass and Carbon
Stock ChangeModule
•Forested area
•Planted and deforested land
•Maximum suitable land area
•Opportunity cost of land
•Land price supply curve
•Biomass yield •Rotation period
•Biomass and soil carbon•Timber product output and life •Non-timber product output
•Product demand and supply
•Planting and deforestation costs –fixed and annual•Timber and
non-timber product prices
Carbon price scenario (2000-2100)
Annual land use change and land price
Economic parameters
Annual product output
Annual land use change
Land and Carbon Gain (2000-2100)
DATA
Mitigation Scenario OnlyReference and Mitigation Scenarios
Social Welfare Change: Forest Sector
(2000-2100)
How much additional land area will be planted or
avoided from being deforested in response to C price scenario?
5
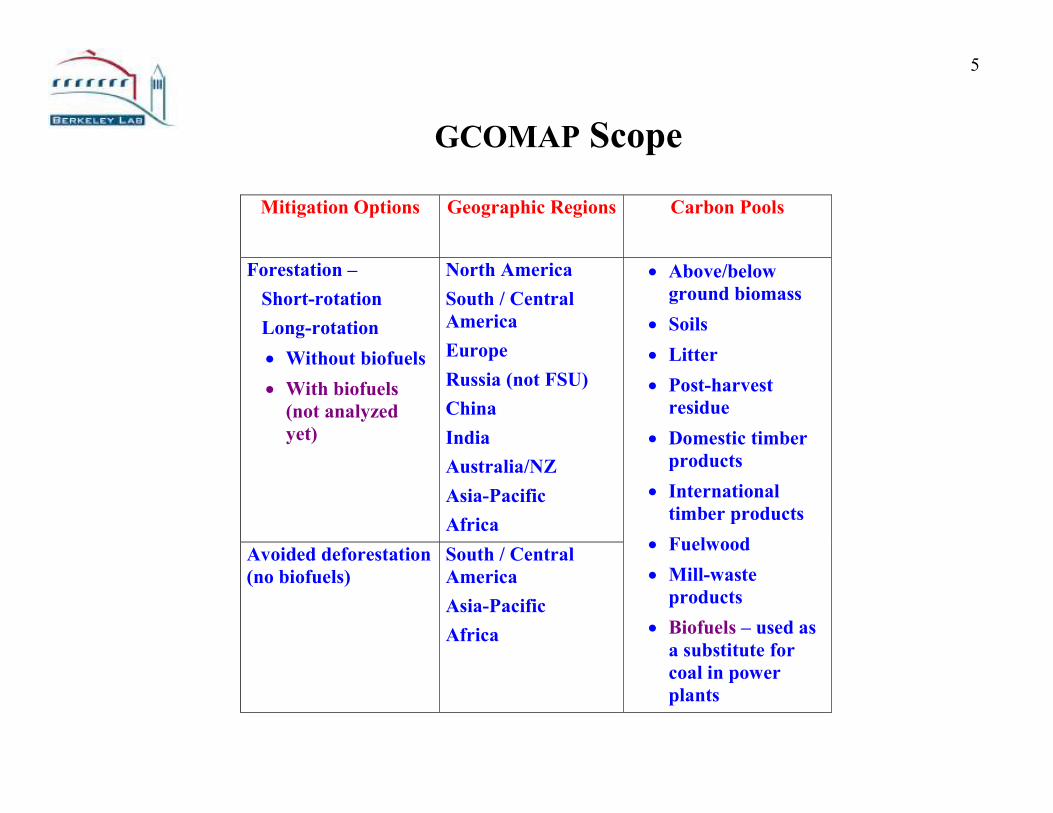
GCOMAP Scope
Mitigation Options Geographic Regions Carbon Pools
Forestation –
Short-rotation
Long-rotation
• Without biofuels
• With biofuels
(not analyzed
yet)
North America
South / Central
America
Europe
Russia (not FSU)
China
India
Australia/NZ
Asia-Pacific
Africa
Avoided deforestation
(no biofuels)
South / Central
America
Asia-Pacific
Africa
• Above/below
ground biomass
• Soils
• Litter
• Post-harvest
residue
• Domestic timber
products
• International
timber products
• Fuelwood
• Mill-waste
products
• Biofuels – used as
a substitute for
coal in power
plants
6
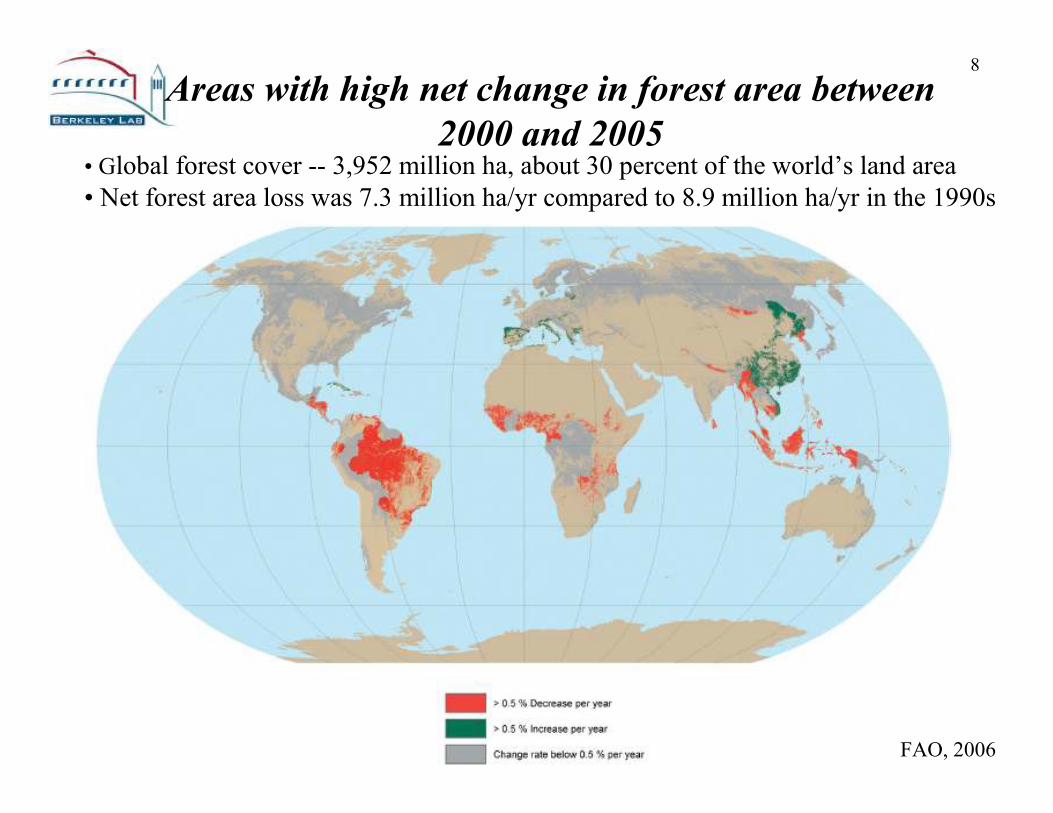
GCOMAP Simulates Carbon Balance for Forestation and
2000 and 2005• Global forest cover -- 3,952 million ha, about 30 percent of the world’s land area
• Net forest area loss was 7.3 million ha/yr compared to 8.9 million ha/yr in the 1990s
FAO, 2006
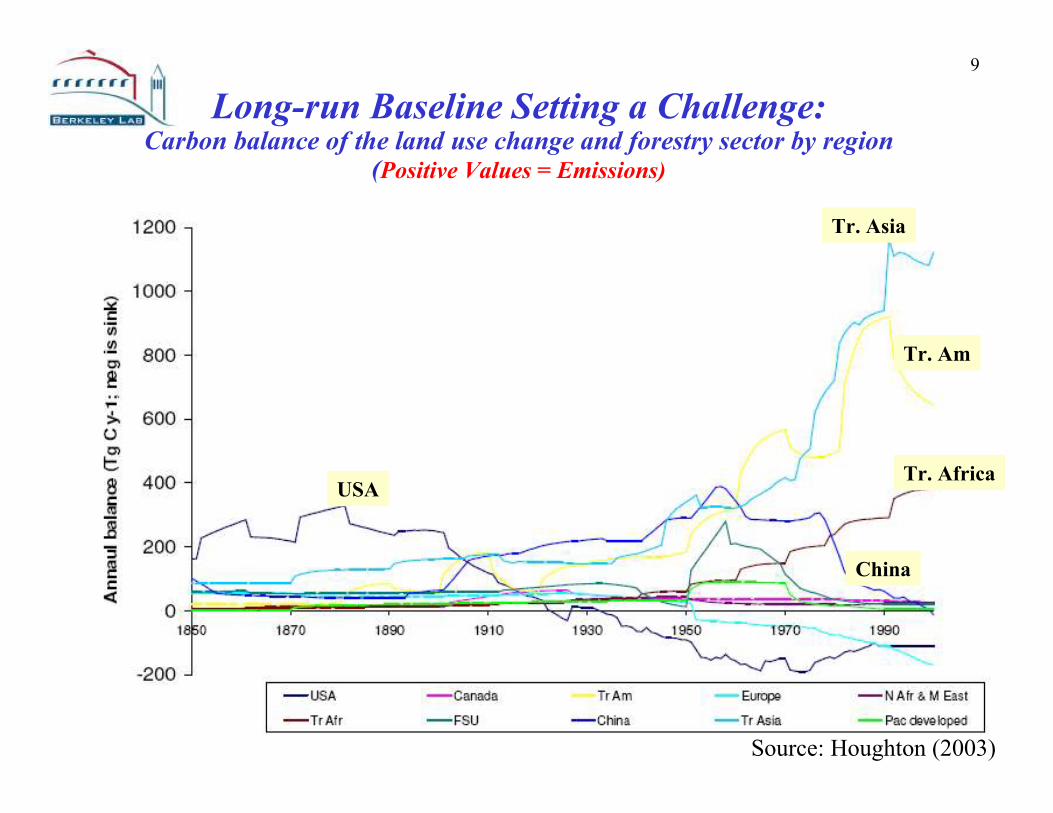
9
Long-run Baseline Setting a Challenge:Carbon balance of the land use change and forestry sector by region
(Positive Values = Emissions)
Tr. Asia
USATr. Africa
Tr. Am
China
Source: Houghton (2003)
10
GCOMAP Deforestation Rate: Historical and Projected
Region
Change in
Deforestation
Rate (%/yr)
Deforestation Rates (% / year)
1990 –00 2000 2020 2040 2050 2100
Africa + 0.026 0.80 1.29 0.78 0.65 0.26
Rest of Asia - 0.005 1.03 0.82 0.60 0.52 0.12
Central
America
- 0.011 1.19 0.97 0.75 0.65 0.37
South
America
- 0.030 0.40 0.26 0.21 0.20 0.13
The deforestation rate gives the percent decline in the forest area per year (-) rate is an annual decline in the deforestation rate Based on FAO 2001 – Forest Resource Assessment-2000; Kaimovitz 1996 Livestock and deforestation in Central America in 1980s and 1990s; Barraclough and Ghimire 2000. Agricultural Expansion and Tropical Deforestation
• Global deforestation 17 Mha/yr in 1990s; 13 Mha/yr in 2000-05 (FAO)
•Projected rate is an extrapolation of historical deforestation rate
Carbon Emissions from Deforestation: Reference Cases (Zero Carbon Price)
GCOMAP and IPCC SRES Scenarios
(Africa, Asia, Latin America, and the Middle East)