Potential Mitigation of GHG Emissions in Brazil Christophe de Gouvello Lead Author The World Bank Supervision Team from the World Bank: Adriana Gonçalves Moreira, AFOLU, Alexandre Kossoy, Carb Finance Barbara Farinelli, SD Benoit Bosquet, AFOLU Christophe de Gouvello, TTL, Flavio Chaves, Transport, Fernanda Pacheco, Program Assistant Francisco Sucre, Oil dand Gas Fowzia Hassan, Operation Analyst Garo Batmanian, Amazon Region Jennifer Chang, Finance Mark Lundell, SD, sector leader Mauro Lopes de Azeredo, LCC5C, External Communication Pamela Sud, JPA Paul Procee, Transport, Environment Rogerio Pinto, Consultant, ETC Team of Brazilian Specialists CEAF Regis Manoel Liana CETESB João Wagner, Josilene Ticianeli Vanuzini Ferrer, Fátima Aparecida Carrara, Marcos Cunha COPPE- UFRJ Roberto Schaeffer, Alexandre Szklo, Bruno S. M. C.Borba, André F.P.de Lucena, David C. Branco, Amaro Pereira CPTEC/ INPE Saulo Freitas, Karla Longo, Ricardo Siqueira EMBRAPA Luis Barioni, Geraldo Martha, Bruno Alves, Magda Lima UFMG Britaldo Soares, Letícia Hissa ICONE André Nassar, Leila Harfuch Iniciativa Verde Osvaldo Martins, Magno Castelo Branco, Renato Toledo INT Maurício Henriques LOGIT Fuad Jorge Alves José, Ronaldo Balassiano, Wagner C.Martins Plantar Fábio Marques UNICAMP Arnaldo Silva, Gilberto Jannuzzi, Rodolfo Gomes USP Sérgio Pacca and Júlio Hato
Transcript
Potential
Mitigation of
GHG Emissions
in Brazil
Christophe de Gouvello
Lead AuthorThe World Bank
Supervision Team from the World Bank:
Adriana Gonçalves Moreira, AFOLU,
Alexandre Kossoy, Carb Finance
Barbara Farinelli, SD
Benoit Bosquet, AFOLU
Christophe de Gouvello, TTL,
Flavio Chaves, Transport,
Fernanda Pacheco, Program Assistant
Francisco Sucre, Oil dand Gas
Fowzia Hassan, Operation Analyst
Garo Batmanian, Amazon Region
Jennifer Chang, Finance
Mark Lundell, SD, sector leader
Mauro Lopes de Azeredo, LCC5C, External Communication
Pamela Sud, JPA
Paul Procee, Transport, Environment
Rogerio Pinto, Consultant, ETC
Team of Brazilian Specialists
CEAF Regis Manoel Liana
CETESB
João Wagner, Josilene Ticianeli Vanuzini
Ferrer,
Fátima Aparecida Carrara, Marcos Cunha
COPPE-
UFRJ
Roberto Schaeffer, Alexandre Szklo,
Bruno S. M. C.Borba,
André F.P.de Lucena, David C. Branco,
Amaro Pereira
CPTEC/
INPE
Saulo Freitas, Karla Longo, Ricardo
Siqueira
EMBRAPALuis Barioni, Geraldo Martha,
Bruno Alves, Magda Lima
UFMG Britaldo Soares, Letícia Hissa
ICONE André Nassar, Leila Harfuch
Iniciativa
Verde
Osvaldo Martins, Magno Castelo Branco,
Renato Toledo
INT Maurício Henriques
LOGITFuad Jorge Alves José, Ronaldo
Balassiano, Wagner C.Martins
Plantar Fábio Marques
UNICAMPArnaldo Silva, Gilberto Jannuzzi, Rodolfo
Gomes
USP Sérgio Pacca and Júlio Hato
18%
14%
5%64%
Energy
Transport
Waste
Land Use and Land Use Change
18%
14%
5%
41%
18%
5%Energy
Transport
Waste
Deforestation
Livestock
Agriculture
18%
14%
5%64%
Energy
Transport
Waste
Land Use and Land Use Change
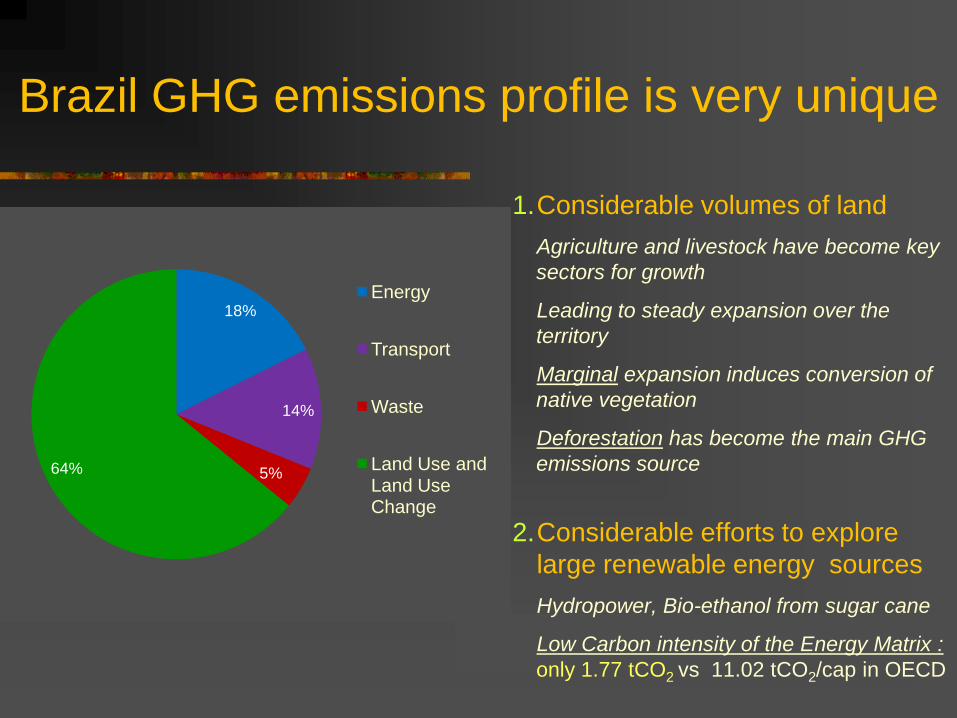
Brazil GHG emissions profile is very unique
1.Considerable volumes of land
Agriculture and livestock have become key
sectors for growth
Leading to steady expansion over the
territory
Marginal expansion induces conversion of
native vegetation
Deforestation has become the main GHG
emissions source
2.Considerable efforts to explore
large renewable energy sources
Hydropower, Bio-ethanol from sugar cane
Low Carbon intensity of the Energy Matrix :
only 1.77 tCO2 vs 11.02 tCO2/cap in OECD
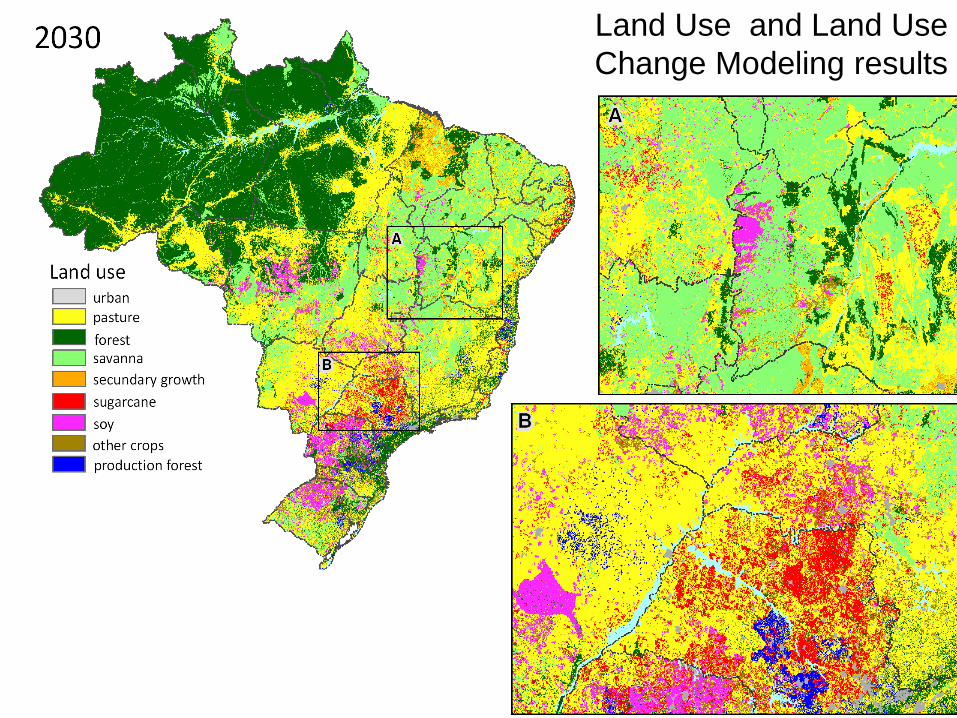
A – Land Use, Land Use Change and Forestry
Four main steps:
1) Calculation of the Available Area for agricultural expansion
2) Modeling of future spatial Land Use Change,including Deforestation (2010 - 2030)
3) Model GHG Emissions as a function of Land Use Change
4) Test technical options to reduce deforestation and emissions.
Land Use and Land Use
Change Modeling results
Land Use and Land Use
Change Modeling results
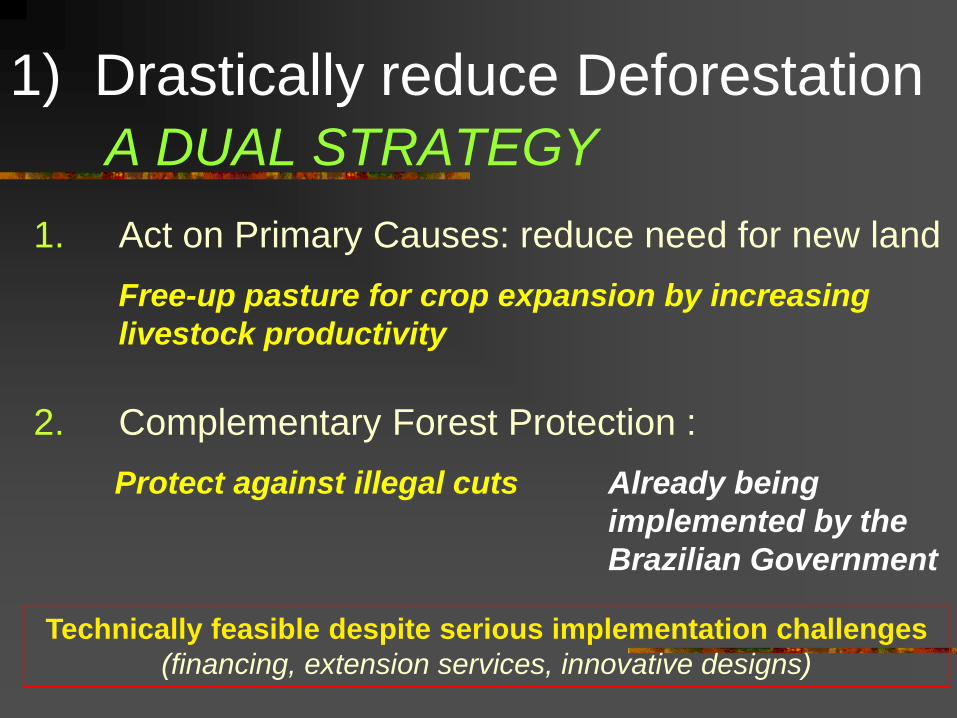
1. Act on Primary Causes: reduce need for new land
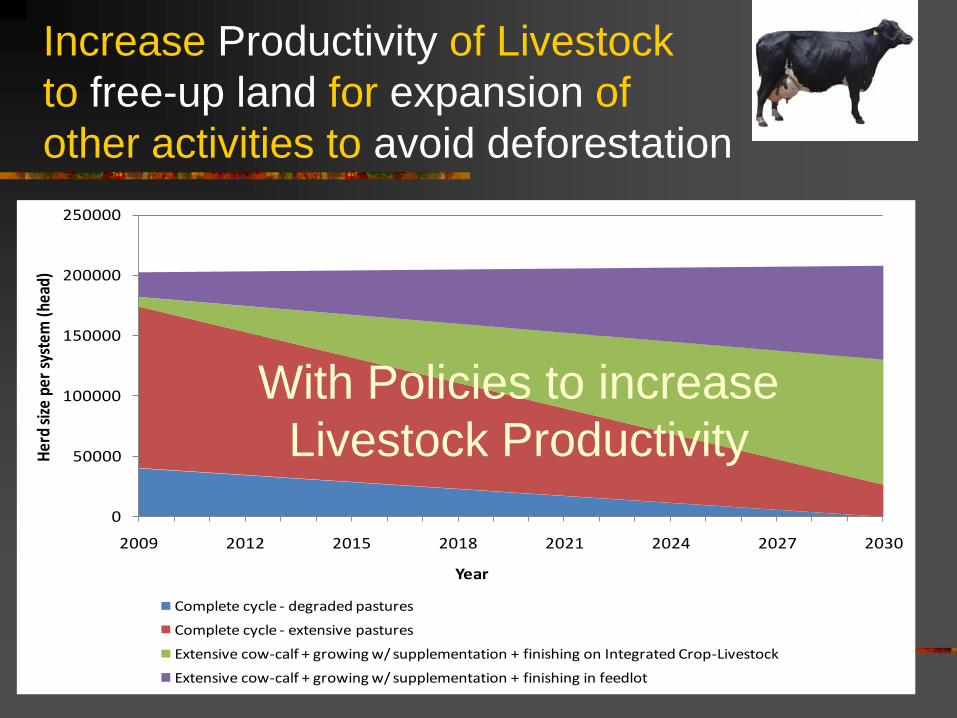
Extensive cow-calf + growing w/ supplementation + finishing in feedlot
With Policies to increase
Livestock Productivity
1 a 2,0 ua/ha/ano
Integrated Livestock and
Agriculture Systems
1rst Year:
Rice + Eucalyptus
2nd Year:
Eucalyptus + Soyabean
3rd Year:
Eucalyptus + Pasture3rd to 10th Year:
Eucalyptus + Pasture + Animals
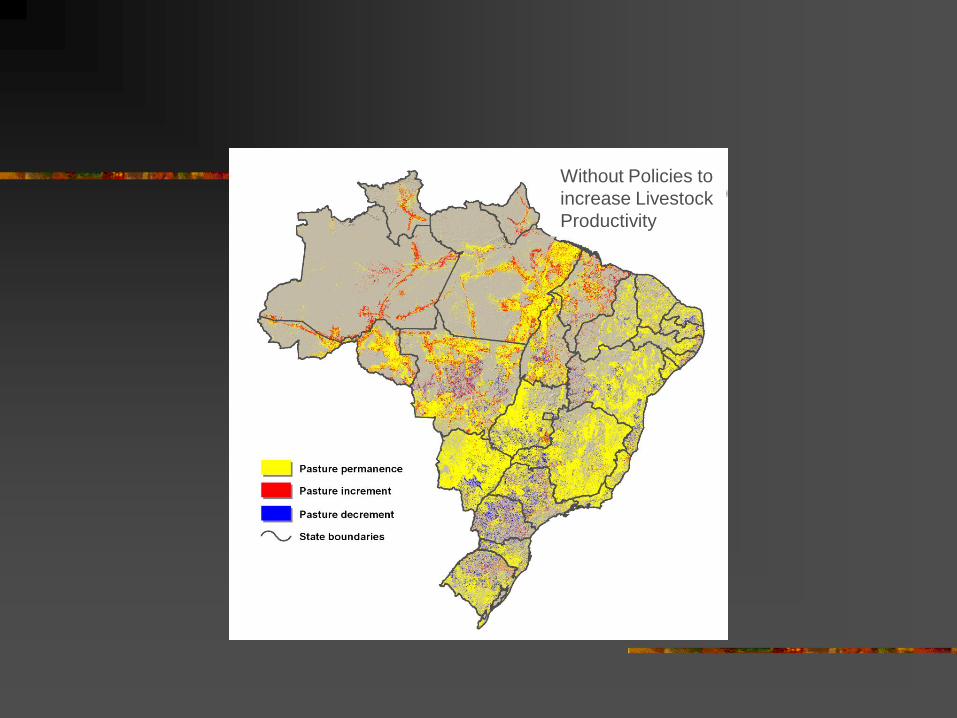
Without Policies to
increase Livestock
Productivity
With Policies to
increase Livestock
Productivity
-
25
50
75
100
125
150
175
200
225
250
275
300
2006
2007
2008
2009
2010
2011
2012
2013
2014
2015
2016
2017
2018
2019
2020
2021
2022
2023
2024
2025
2026
2027
2028
2029
2030
SOYBEAN
CORN
FOREST
BEAN
SUGAR-
CANE
RICE
COTTON
PASTURE
-
25
50
75
100
125
150
175
200
225
250
275
2006
2007
2008
2009
2010
2011
2012
2013
2014
2015
2016
2017
2018
2019
2020
2021
2022
2023
2024
2025
2026
2027
2028
2029
2030
REFORES-
TATION
SOYBEAN
CORN
FOREST
BEAN
SUGAR-
CANE
RICE
COTTON
PASTURE
Potential Impact of Increased Livestock productivity
to free-up pastures for expansion of other activities
without deforesting (Millions of Hectares)
Without Policies to increase
Livestock Productivity
With Policies to increase
Livestock Productivity
1. Native Forest Recovery
Brazil Law is unique: Mandatory Restoration of
Legal Forest Reserves
2. Plantations for Renewable Charcoal for Steel Industry
2) Sequestration :
Large Opportunities
Trade-off between legal compliance and risk of Carbon Leakage
(less land remains available for crop expansion)
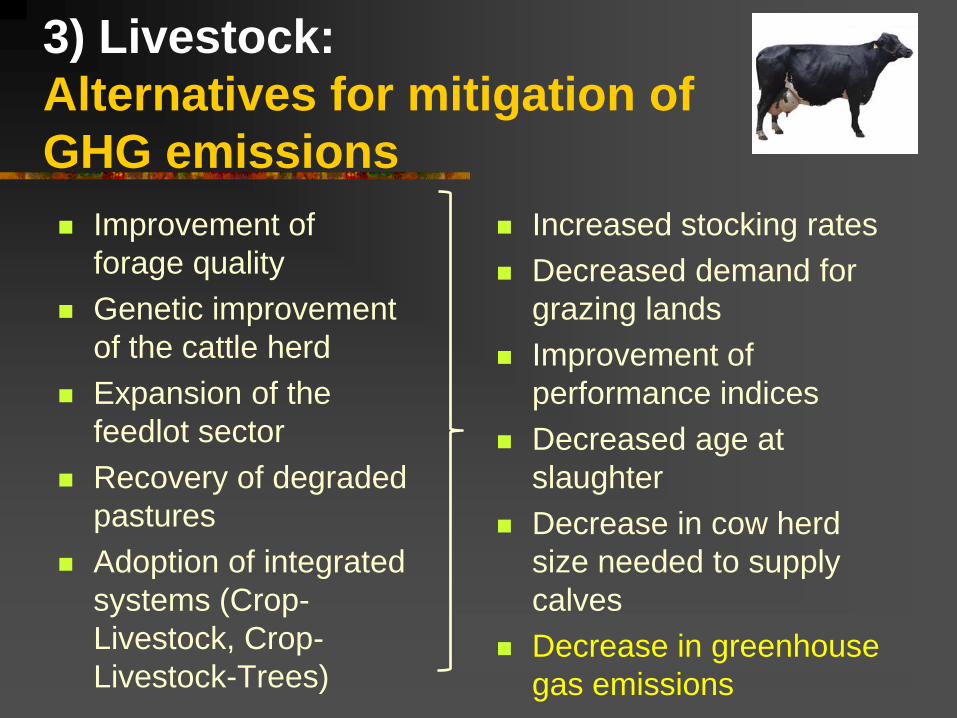
3) Livestock:
Alternatives for mitigation of
GHG emissions
Improvement of
forage quality
Genetic improvement
of the cattle herd
Expansion of the
feedlot sector
Recovery of degraded
pastures
Adoption of integrated
systems (Crop-
Livestock, Crop-
Livestock-Trees)
Increased stocking rates
Decreased demand for
grazing lands
Improvement of
performance indices
Decreased age at
slaughter
Decrease in cow herd
size needed to supply
calves
Decrease in greenhouse
gas emissions
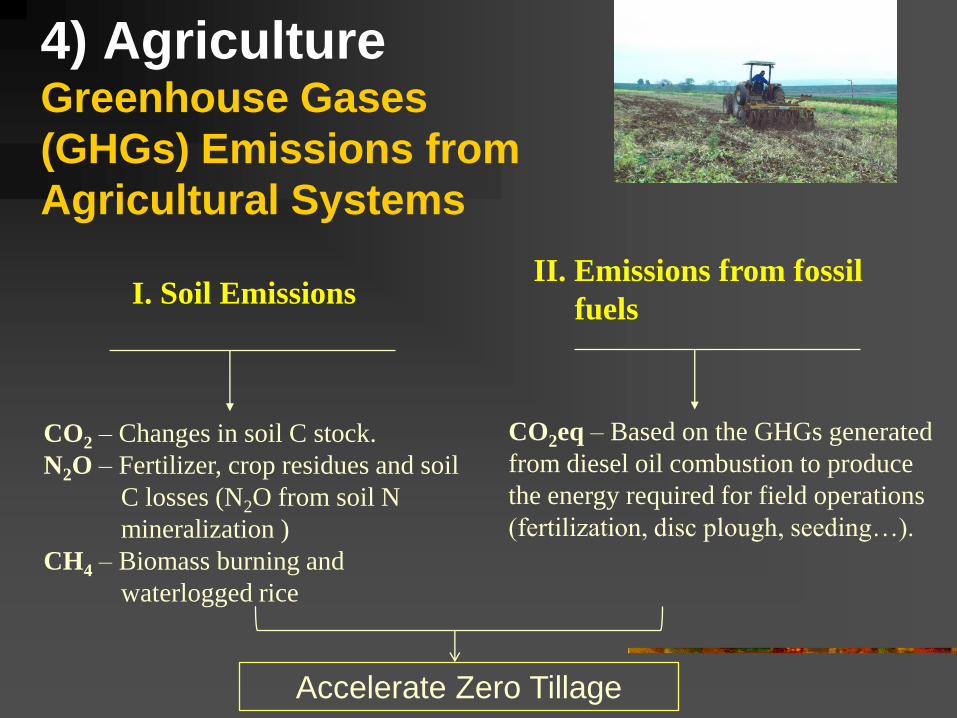
4) AgricultureGreenhouse Gases
(GHGs) Emissions from
Agricultural Systems
I. Soil EmissionsII. Emissions from fossil
fuels
CO2 – Changes in soil C stock.
N2O – Fertilizer, crop residues and soil
C losses (N2O from soil N
mineralization )
CH4 – Biomass burning and
waterlogged rice
CO2eq – Based on the GHGs generated
from diesel oil combustion to produce
the energy required for field operations
(fertilization, disc plough, seeding…).
Accelerate Zero Tillage
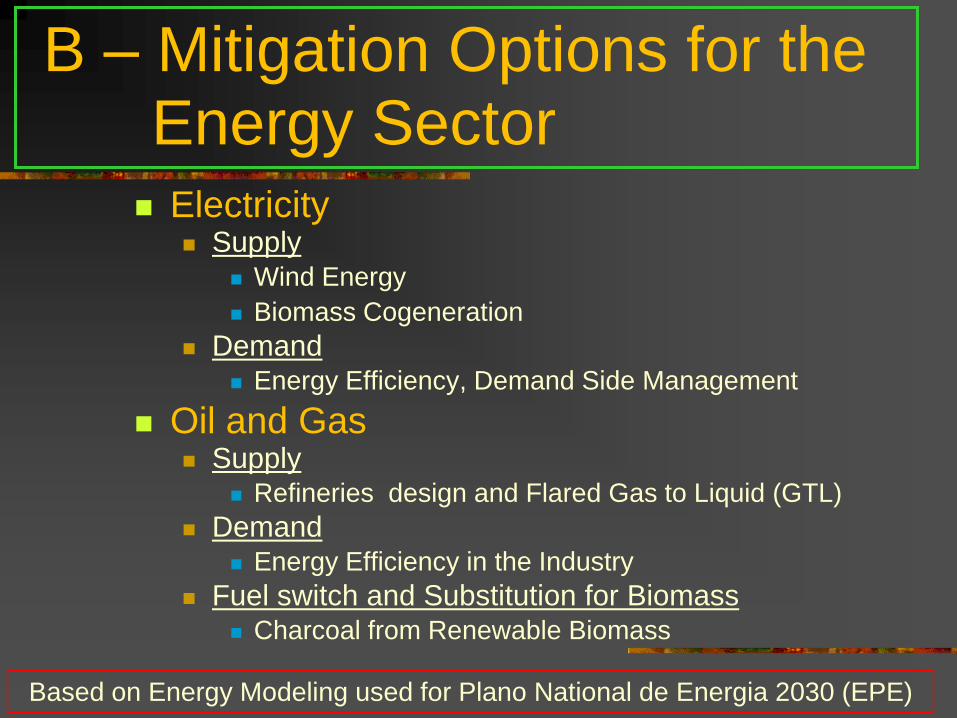
Electricity Supply
Wind Energy
Biomass Cogeneration
Demand Energy Efficiency, Demand Side Management
Oil and Gas Supply
Refineries design and Flared Gas to Liquid (GTL)
Demand Energy Efficiency in the Industry
Fuel switch and Substitution for Biomass Charcoal from Renewable Biomass
B – Mitigation Options for the Energy Sector
Based on Energy Modeling used for Plano National de Energia 2030 (EPE)
Industrial Consumption of Energy from
Fossil Fuels Technical options cover the following five main areas:
Energy Efficiency (optimization of combustion, heat recovery inindustrial processes, steam recovery, furnace heat recovery,implementation of new technologies and processes, and other measures)
Recycling and Reducing Materials Used
Inter-energy substitution 1 (Fossil Fuels for Fossil Fuels)
Inter-energy substitution 2 (Fossil for Renewable Alternatives)
Reduction in the Use of Non-renewable Biomass (charcoal fromrenewable biomass from native forests)
Sub-sectors from considered industries: Cement, Iron andSteel, Minerals, Chemicals, Non-Iron Metals, Textiles, Food andDrink, Celluloses and Paper, Ceramics and other (based on the NationalEnergy Balance – BEN 2008)
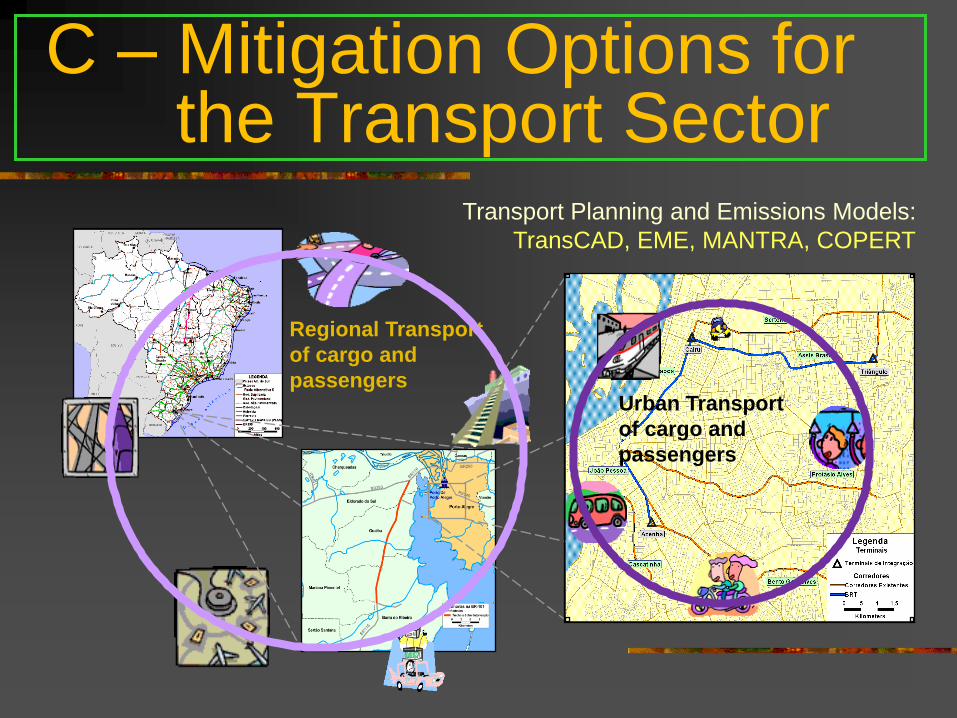
Regional Transport
of cargo and
passengersUrban Transport
of cargo and
passengers
C – Mitigation Options for the Transport Sector
Transport Planning and Emissions Models:
TransCAD, EME, MANTRA, COPERT
19
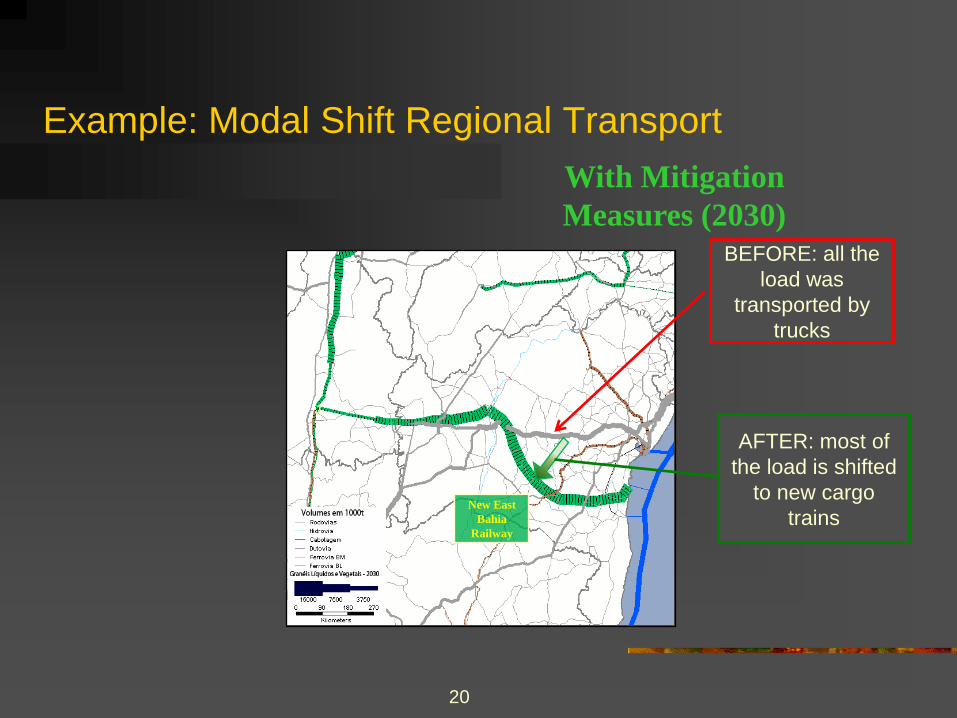
Example: Modal Shift Regional Transport
Without Mitigation
Measures (2030)
All the load is
transported by
trucks
20
Example: Modal Shift Regional Transport
With Mitigation
Measures (2030)
New East
Bahia
Railway
BEFORE: all the
load was
transported by
trucks
AFTER: most of
the load is shifted
to new cargo
trains
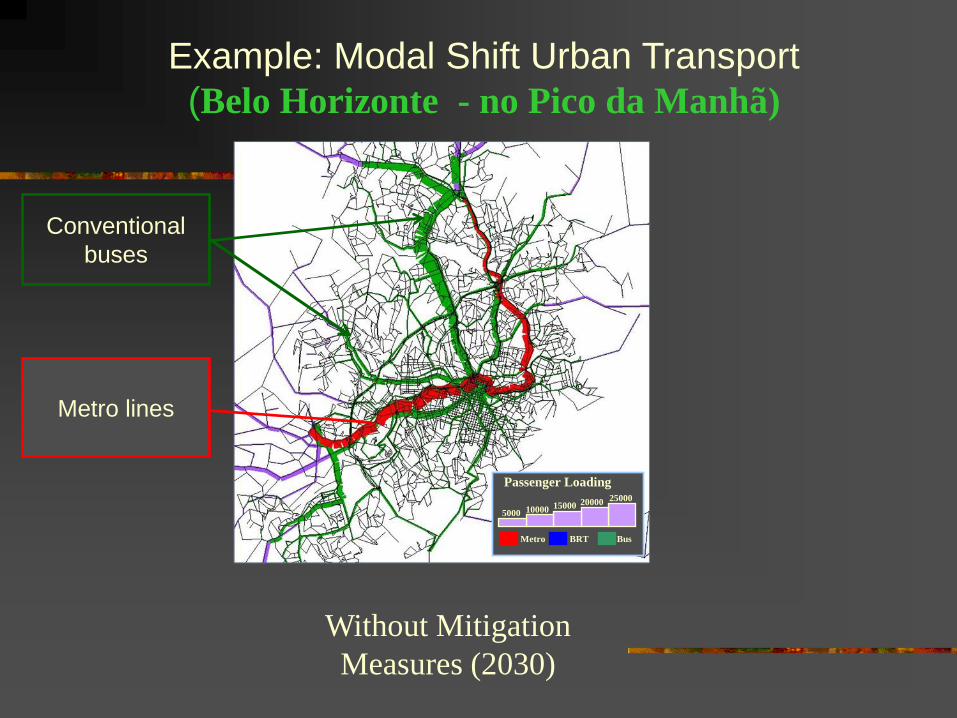
Metro BusBRT
Passenger Loading
5000 10000 15000 20000 25000
Without Mitigation
Measures (2030)
Conventional
buses
Metro lines
Example: Modal Shift Urban Transport
(Belo Horizonte - no Pico da Manhã)
Metro BusBRT
Passenger Loading
5000 10000 15000 20000 25000 New Additional
Metro lines
New BRT
substituting
conventional
buses
Example: Modal Shift Urban Transport
(Belo Horizonte - no Pico da Manhã)
With Mitigation
Measures (2030)
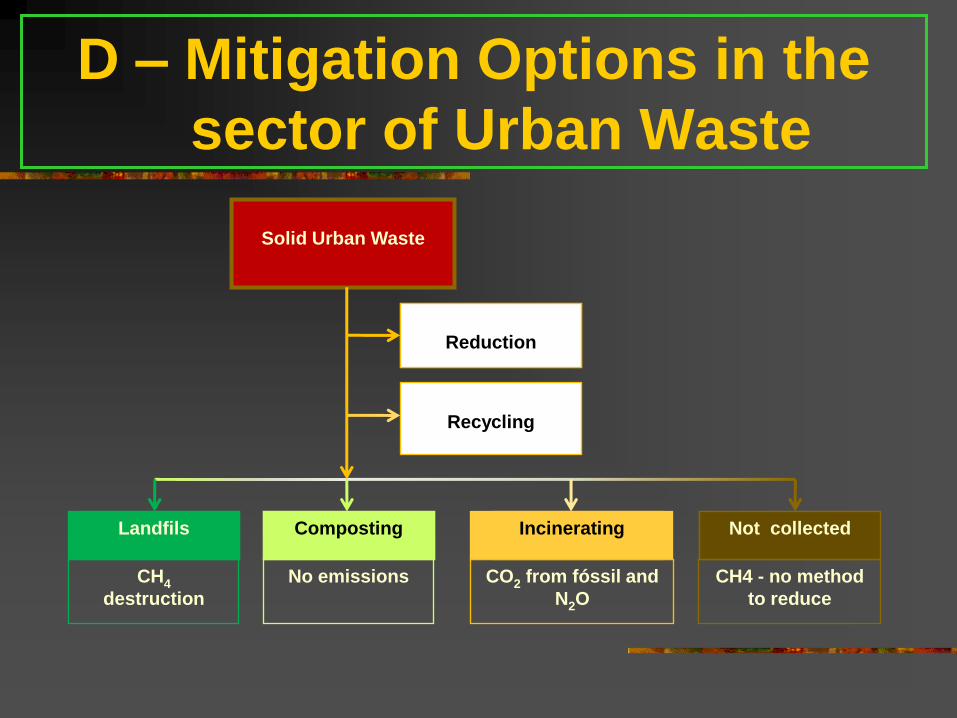
D – Mitigation Options in the
sector of Urban Waste
Solid Urban Waste
Reduction
Recycling
Landfils
CH4
destruction
Composting
No emissions
Incinerating
CO2 from fóssil and
N2O
Not collected
CH4 - no method
to reduce
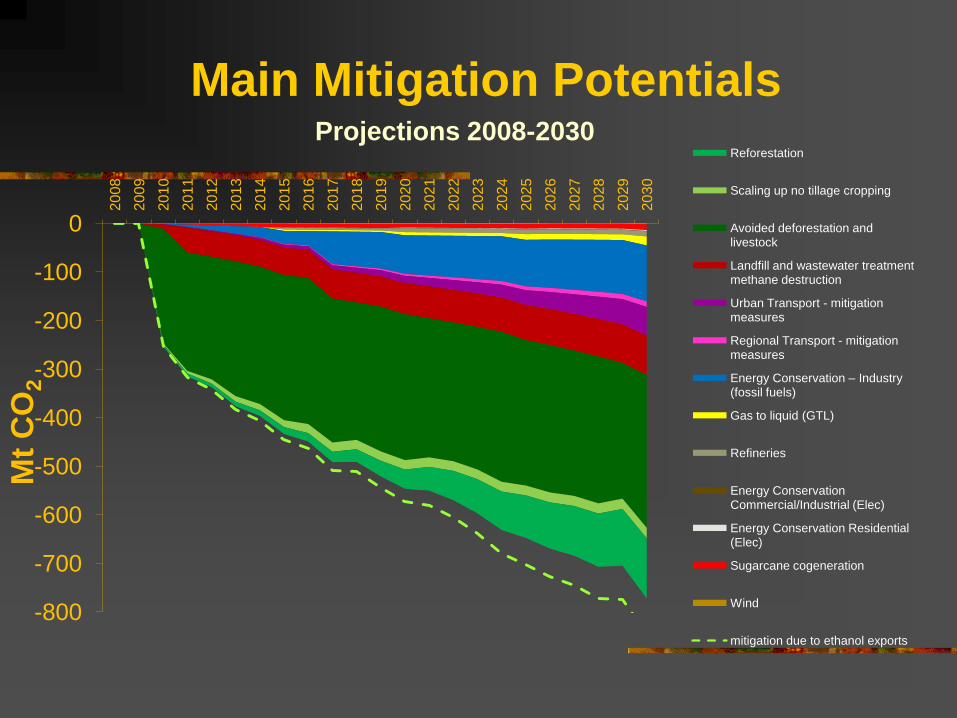
Projections 2008-2030
Main Mitigation Potentials
-800
-700
-600
-500
-400
-300
-200
-100
0
2008
2009
2010
2011
2012
2013
2014
2015
2016
2017
2018
2019
2020
2021
2022
2023
2024
2025
2026
2027
2028
2029
2030
Mt
CO
2
Reforestation
Scaling up no tillage cropping
Avoided deforestation and livestock
Landfill and wastewater treatment methane destruction
Urban Transport - mitigation measures
Regional Transport - mitigation measures
Energy Conservation – Industry (fossil fuels)
Gas to liquid (GTL)
Refineries
Energy Conservation Commercial/Industrial (Elec)
Energy Conservation Residential (Elec)
Sugarcane cogeneration
Wind
mitigation due to ethanol exports
Cumulative Emissions
Reductions
2010-2030
Inform the Decision Making Process
Example: Cogeneration from Sugarcane
Is there a low carbon option ? Extracting condensing turbine, 90 bars
What is the mitigation potential ? 158 MtCO2e (7.5MtCO2/year)
Does it make sense economically from a
planning perspective ?YES:
Marginal Abat. Cost = - $ 105 /tCO2
(8% social discount rate)
Would it happen spontaneously ? NO:
Sector Expected IRR is 18% > 8%
Incentive required = + $ 8 /tCO2
How much financing needed ? Additional investment = + $ 35 billion