552 GIDA THE JOURNAL OF FOOD E-ISSN 1309-6273, ISSN 1300-3070 Research / Araştırma GIDA (2021) 46 (3) 552-565 doi: 10.15237/gida.GD21045 DETERMINATION OF THE FACTORS THAT CAUSE BITTERNESS DURING SHELF-LIFE IN WHITE CHEESE PRODUCED USING ULTRAFILTRATED MILK Zerrin Arısoy, Zübeyde Öner * Süleyman Demirel University, Engineering Faculty, Department of Food Engineering, Isparta, Turkey Received/Geliş: 25.02.2021; Accepted/Kabul: 25.03.2021; Published online/Online baskı: 05.04.2021 Arısoy, Z., Öner, Z. (2021). Determination of the factors that cause bitterness during shelf-life in white cheese produced using ultrafiltrated milk. GIDA (2021) 46 (3) 552-565 doi: 10.15237/gida.GD21045. Arısoy, Z., Öner, Z. (2021). UF Beyaz peynirde raf ömrü boyunca acılaşmaya neden olan faktörlerin belirlenmesi. GIDA (2021) 46 (3) 552-565 doi: 10.15237/gida.GD21045. ABSTRACT This study aimed to determine the causes of bitterness problems in white cheese produced by ultrafiltration (UF). To investigate the association between the bitterness with the enzyme use or by the starter culture, white cheese was produced using UF-pasteurized and UF-raw milk with two different coagulating enzymes and two starter cultures with different proteolytic activities. Sensory analysis, protein, water-soluble nitrogen, 12% trichloroacetic acid-soluble nitrogen, 5% phosphotungstic acid-soluble nitrogen and acid degree values were determined on day 1, 30, 60 and 90 of the ripening periods. During the ripening process, bitterness was determined in the cheese samples due to proteolysis. The A cheese sample, which was produced using chymosin enzyme and a starter culture with high proteolytic activity, was determined to be the sample with the highest bitterness level in the sensory analyses, SDS-PAGE electrophoresis and HPLC analysis. 72.26% αs-casein hydrolysis was determined in the A cheese sample. According to HPLC results, a high hydrophobic peptide formation was determined with the increase in the area of hydrophobic peptides with a rate of 106% between 40 and 60 minutes. Keywords: Cheese, proteolysis, ultrafiltration, bitterness UF BEYAZ PEYNİRDE RAF ÖMRÜ BOYUNCA ACILAŞMAYA NEDEN OLAN FAKTÖRLERİN BELİRLENMESİ ÖZ Bu çalışmada, ultrafiltrasyon (UF) işlemi ile işlenen süt kullanılarak üretilen beyaz peynirdeki acılık sorunlarının nedenlerini belirlemek amaçlanmıştır. Acılık ile enzim kullanımı veya başlangıç kültürü arasındaki ilişkiyi araştırmak için, iki farklı pıhtılaşma enzimi ve farklı proteolitik aktivitelere sahip iki başlangıç kültürüyle UF-pastörize ve UF-çiğ süt kullanılarak beyaz peynir üretilmiştir. Olgunlaşma periyodunun 1., 30, 60, ve 90. günlerinde protein, suda çözünen azot, %12 triklorasetik asitte çözünen azot, % 5 fosfotungustik asitte çözünen azot, asit değeri ve duyusal özellikler belirlenmiştir. Olgunlaşma sürecinde peynir örneklerinde proteoliz nedeniyle acılık meydana gelmiştir. Kimozin enzimi ve proteolitik aktivitesi yüksek bir starter kültür kullanılarak üretilen A peynir numunesinin duyusal analizler, SDS-PAGE elektroforezi ve HPLC analizlerinde en yüksek acılık seviyesine sahip * Corresponding author / Yazışmalardan sorumlu yazar: : [email protected]✆: (+90) 246 211 15 96 Zübeyde Öner; ORCHID ID: 0000-0003-2557-0731 Zerrin Arısoy; ORCHID ID:0000-0002-8413-7607
Transcript
552
GIDA THE JOURNAL OF FOOD E-ISSN 1309-6273, ISSN 1300-3070
Research / Araştırma GIDA (2021) 46 (3) 552-565
doi: 10.15237/gida.GD21045
DETERMINATION OF THE FACTORS THAT CAUSE BITTERNESS DURING SHELF-LIFE IN WHITE CHEESE PRODUCED USING ULTRAFILTRATED
MILK
Zerrin Arısoy, Zübeyde Öner* Süleyman Demirel University, Engineering Faculty, Department of Food Engineering, Isparta, Turkey
Received/Geliş: 25.02.2021; Accepted/Kabul: 25.03.2021; Published online/Online baskı: 05.04.2021
Arısoy, Z., Öner, Z. (2021). Determination of the factors that cause bitterness during shelf-life in white cheese produced using ultrafiltrated milk. GIDA (2021) 46 (3) 552-565 doi: 10.15237/gida.GD21045. Arısoy, Z., Öner, Z. (2021). UF Beyaz peynirde raf ömrü boyunca acılaşmaya neden olan faktörlerin belirlenmesi. GIDA (2021) 46 (3) 552-565 doi: 10.15237/gida.GD21045.
ABSTRACT This study aimed to determine the causes of bitterness problems in white cheese produced by ultrafiltration (UF). To investigate the association between the bitterness with the enzyme use or by the starter culture, white cheese was produced using UF-pasteurized and UF-raw milk with two different coagulating enzymes and two starter cultures with different proteolytic activities. Sensory analysis, protein, water-soluble nitrogen, 12% trichloroacetic acid-soluble nitrogen, 5% phosphotungstic acid-soluble nitrogen and acid degree values were determined on day 1, 30, 60 and 90 of the ripening periods. During the ripening process, bitterness was determined in the cheese samples due to proteolysis. The A cheese sample, which was produced using chymosin enzyme and a starter culture with high proteolytic activity, was determined to be the sample with the highest bitterness level in the sensory analyses, SDS-PAGE electrophoresis and HPLC analysis. 72.26% αs-casein hydrolysis was determined in the A cheese sample. According to HPLC results, a high hydrophobic peptide formation was determined with the increase in the area of hydrophobic peptides with a rate of 106% between 40 and 60 minutes. Keywords: Cheese, proteolysis, ultrafiltration, bitterness
UF BEYAZ PEYNİRDE RAF ÖMRÜ BOYUNCA ACILAŞMAYA NEDEN OLAN FAKTÖRLERİN BELİRLENMESİ
ÖZ
Bu çalışmada, ultrafiltrasyon (UF) işlemi ile işlenen süt kullanılarak üretilen beyaz peynirdeki acılık sorunlarının nedenlerini belirlemek amaçlanmıştır. Acılık ile enzim kullanımı veya başlangıç kültürü arasındaki ilişkiyi araştırmak için, iki farklı pıhtılaşma enzimi ve farklı proteolitik aktivitelere sahip iki başlangıç kültürüyle UF-pastörize ve UF-çiğ süt kullanılarak beyaz peynir üretilmiştir. Olgunlaşma periyodunun 1., 30, 60, ve 90. günlerinde protein, suda çözünen azot, %12 triklorasetik asitte çözünen azot, % 5 fosfotungustik asitte çözünen azot, asit değeri ve duyusal özellikler belirlenmiştir. Olgunlaşma sürecinde peynir örneklerinde proteoliz nedeniyle acılık meydana gelmiştir. Kimozin enzimi ve proteolitik aktivitesi yüksek bir starter kültür kullanılarak üretilen A peynir numunesinin duyusal analizler, SDS-PAGE elektroforezi ve HPLC analizlerinde en yüksek acılık seviyesine sahip
* Corresponding author / Yazışmalardan sorumlu yazar:
numune olduğu belirlenmiştir. A peynir örneğinde alfa kazein %72.26 oranında hidrolize olmuştur. HPLC sonuçlarına göre hidrofobik peptit alanında (40-60 dak arasında) % 106 oranında artış belirlenmiştir. Anahtar kelimeler: peynir, proteoliz, ultrafiltrasyon, acılaşma
INTRODUCTION White cheese is the most popular cheese in Turkey in terms of both production and consumption (Üçüncü, 2008). With the developing technology, modern methods such as membrane technology, in addition to classical methods, have been used in cheese production (Soltani, 2013). In dairy industry, traditional White cheese production lines have been replaced by a more modern ultrafiltration (UF) system. Proteolysis, one of the main biochemical reactions during ripening of cheese, plays a vital role in flavor development of most cheese types (Sousa et al., 2001). During cheese production, the primary proteolysis of casein is mostly carried out by rennet added to milk, while secondary proteolysis is carried out by hydrolysis of casein derivatives to small peptides and amino acids by starter cultures (Hayaloğlu and Özer, 2011). In proteolysis, casein is first broken down to peptides with large molecular weights by coagulating enzymes, then into small-molecular-weight peptides by the enzymes produced by starter cultures and then into free amino acids by peptidases (Üçüncü, 2008). It has been stated that lactic acid bacteria are responsible for the hydrolysis of casein-derived peptides (Hayaloğlu et al., 2004). Cell membrane-bound proteinases of Lactococcus spp. are involved in the process by the hydrolysis of large peptides produced from αs1-casein or from β-casein by plasmin. Intracellular peptidases released from degraded cells are responsible for the breakdown of small peptides and the formation of free amino acids (Cinbaş, 2004). Bitterness taste in cheese associated with enzymes from starter microorganisms as well as from naturaly present microorganisms could be caused by peptides formed as a result of the hydrolysis of αs1 and β-casein. Accordingly, the proteolytic enzyme concentration and proteolytic properties of the starter culture must be known. Therefore, the selection of product-specific starter culture, production method, and ripening conditions are of great importance (Kılıç and Eren-Vapur, 2003).
The bitter taste is a characteristic found in many foods and produced by different inorganic and organic substances. The taste of inorganic salts can be bitter as well as some amino acids (Üçüncü, 2008). Bitter peptides containing hydrophobic amino acids released by rennet and starter cultures in the clot are the main factors of bitter taste seen in many types of cheeses (especially cheeses produced using mesophilic cultures) and these peptides are formed by the effect of proteolytic enzymes on casein. Accordingly, the factors that cause bitterness include raw milk quality, psychrotrophic bacteria in the environment, milk composition, cooking temperature of curd, salt concentration, the amount of released whey, pH of the cheese, hygienic conditions, type of starter culture and the amount of rennet enzyme used. Among these factors, the types and amounts of rennet and starter culture are the most important factors for bitterness in cheese (Yıldırım et al., 2011). Soltani et al. (2016) investigated the effect of camel chymosin and microbial enzyme (Rhizomucor miehei) on the microstructure and rheological properties of Iran UF White cheese during the 90-day ripening period. The reserachers found that the degradation of αs1-casein was affected by the coagulants used however β-casein degradation was not affected by these factors. This study aimed to determine the levels of proteolysis, electrophoretic (SDS-PAGE) properties and peptide distribution in white cheese. The effects of starter culture, different milk coagulants and ripening time on these properties were also investigated. The causes of the sensory defect bitterness were thus investigated in the study. MATERIAL AND METHODS Cheeses were produced from raw cow’s milk in the ultrafiltrated White cheese line in Isparta
Z. Arısoy, Z. Öner
554
Cebeci Milk and Dairy Products factory in Turkey. The differences in UF White cheese production are given in Table 1. Raw cow's milk was transferred to the UF unit following the necessary chemical analysis. The obtained retentate was pasteurized at 80-82 °C for 15 seconds, homogenized and cooled, and then cooled to the 30-32 °C fermentation temperature and transferred to the filling unit. The coagulating enzyme (400 mL/1000kg retentateChymax Plus and 100 mL/1000kg retentateMaryzm 55) and the starter culture (50 DCU/1000kg retentates) were added to the retentate in the mixing tank. In the filling unit, the milk in the mixing tank was filled into the packages. Following the curd formation, a dry salting procedure was carried out. Cheese manufacturing was performed in duplicate and all the analyses were carried out with two parallels. Cheese working model is given below. A cheese sample: White (Beyaz) cheese produced from ultrafilter pasteurized milk using starter
culture with high proteolytic activity and chymosin enzyme B cheese sample: White (Beyaz) cheese produced from ultrafilter pasteurized milk using starter culture with high proteolytic activity and microbial enzyme C cheese sample: White (Beyaz) cheese produced from ultrafilter pasteurized milk using starter culture with low proteolytic activity and chymosin enzyme D cheese sample: White (Beyaz) cheese produced from ultrafilter pasteurized milk using starter culture with low proteolytic activity and microbial enzyme E cheese sample: White (Beyaz) cheese production from raw milk by ultrafiltration with chymosin enzyme F cheese sample: White (Beyaz) cheese production from ultrafilter raw milk by microbial enzyme.
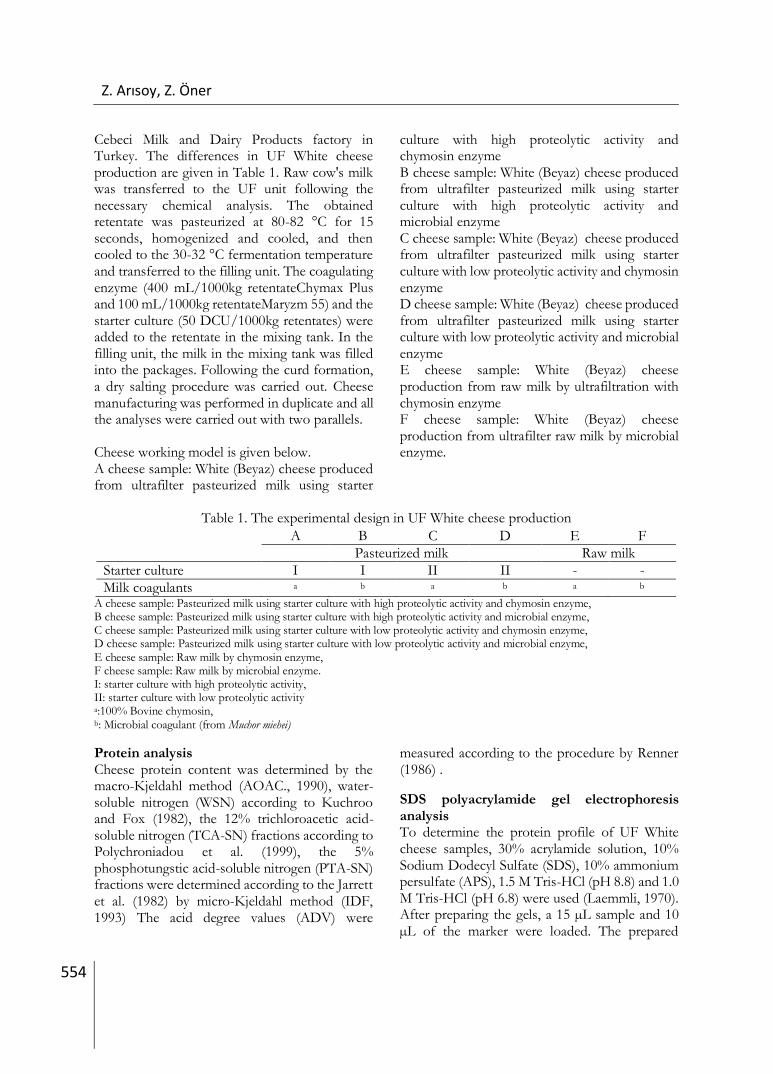
Table 1. The experimental design in UF White cheese production
A cheese sample: Pasteurized milk using starter culture with high proteolytic activity and chymosin enzyme, B cheese sample: Pasteurized milk using starter culture with high proteolytic activity and microbial enzyme, C cheese sample: Pasteurized milk using starter culture with low proteolytic activity and chymosin enzyme, D cheese sample: Pasteurized milk using starter culture with low proteolytic activity and microbial enzyme, E cheese sample: Raw milk by chymosin enzyme, F cheese sample: Raw milk by microbial enzyme. I: starter culture with high proteolytic activity, II: starter culture with low proteolytic activity a:100% Bovine chymosin, b: Microbial coagulant (from Muchor miehei)
Protein analysis Cheese protein content was determined by the macro-Kjeldahl method (AOAC., 1990), water-soluble nitrogen (WSN) according to Kuchroo and Fox (1982), the 12% trichloroacetic acid-soluble nitrogen (TCA-SN) fractions according to Polychroniadou et al. (1999), the 5% phosphotungstic acid-soluble nitrogen (PTA-SN) fractions were determined according to the Jarrett et al. (1982) by micro-Kjeldahl method (IDF, 1993) The acid degree values (ADV) were
measured according to the procedure by Renner (1986) .
SDS polyacrylamide gel electrophoresis analysis To determine the protein profile of UF White cheese samples, 30% acrylamide solution, 10% Sodium Dodecyl Sulfate (SDS), 10% ammonium persulfate (APS), 1.5 M Tris-HCl (pH 8.8) and 1.0 M Tris-HCl (pH 6.8) were used (Laemmli, 1970). After preparing the gels, a 15 µL sample and 10 µL of the marker were loaded. The prepared
A B C D E F
Pasteurized milk Raw milk
Starter culture I I II II - -
Milk coagulants a b a b a b
UF White cheese
555
electrophoresis apparatus was run in a system under 80-100 V constant current approximately for three hours. SDS-Page electropherograms of cheese samples were evaluated using the Bio-Rad ChemiDoc MP Imaging System.
Proteolysis in cheese samples by HPLC UF White cheese samples were lyophilized using the VirTisbenchtop SLC device. Accordingly, 2.5 g lyophilized cheese sample was weighed, dissolved in 5 mL 0.1% trifluoroacetic acid (0.1% TFA deionized water) and then centrifuged at 14000 rpm for 30 minutes at 4°C. Centrifuged cheese samples were passed through a 0.45-μm filter and 750 µL sample was injected into the HPLC column (Donkor et al., 2007). Reverse Phase High-performance Liquid chromatography (HPLC, Shimadzu LC-20 AT Kyoto-JAPAN) and Zorbax 300 SB-C monometric column were used for the analysis of peptides in cheeses.
Sensory evaluation of cheese After 1, 30 and 90 days of ripening the UF white cheeses were sensory evaluated. Cheese samples were appraised for taste and flavour (0-40 scale), body and texture (0-40 scale) and appearance (0-20 scale) by a trained panel of six judges familiar with UF white cheese (Peppas et al.1996).
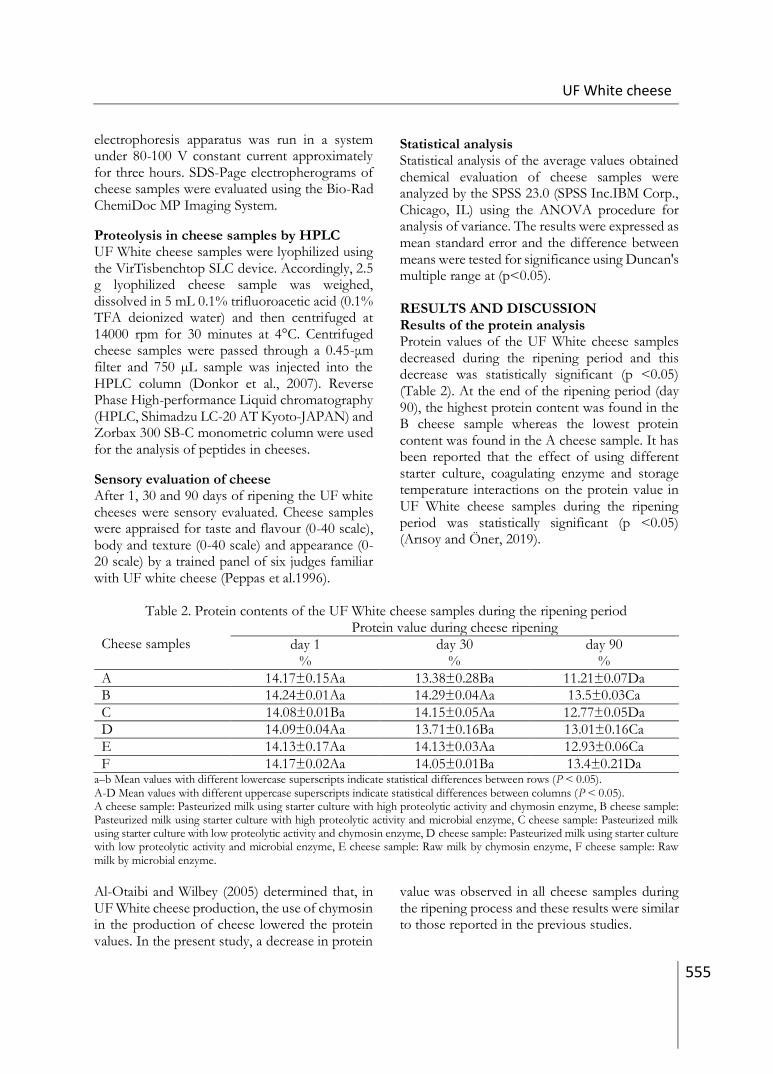
Statistical analysis Statistical analysis of the average values obtained chemical evaluation of cheese samples were analyzed by the SPSS 23.0 (SPSS Inc.IBM Corp., Chicago, IL) using the ANOVA procedure for analysis of variance. The results were expressed as mean standard error and the difference between means were tested for significance using Duncan's multiple range at (p<0.05). RESULTS AND DISCUSSION Results of the protein analysis Protein values of the UF White cheese samples decreased during the ripening period and this decrease was statistically significant (p <0.05) (Table 2). At the end of the ripening period (day 90), the highest protein content was found in the B cheese sample whereas the lowest protein content was found in the A cheese sample. It has been reported that the effect of using different starter culture, coagulating enzyme and storage temperature interactions on the protein value in UF White cheese samples during the ripening period was statistically significant (p <0.05) (Arısoy and Öner, 2019).
Table 2. Protein contents of the UF White cheese samples during the ripening period
Cheese samples
Protein value during cheese ripening
day 1 %
day 30 %
day 90 %
A 14.17±0.15Aa 13.38±0.28Ba 11.21±0.07Da
B 14.24±0.01Aa 14.29±0.04Aa 13.5±0.03Ca
C 14.08±0.01Ba 14.15±0.05Aa 12.77±0.05Da
D 14.09±0.04Aa 13.71±0.16Ba 13.01±0.16Ca
E 14.13±0.17Aa 14.13±0.03Aa 12.93±0.06Ca
F 14.17±0.02Aa 14.05±0.01Ba 13.4±0.21Da a–b Mean values with different lowercase superscripts indicate statistical differences between rows (P < 0.05). A-D Mean values with different uppercase superscripts indicate statistical differences between columns (P < 0.05). A cheese sample: Pasteurized milk using starter culture with high proteolytic activity and chymosin enzyme, B cheese sample: Pasteurized milk using starter culture with high proteolytic activity and microbial enzyme, C cheese sample: Pasteurized milk using starter culture with low proteolytic activity and chymosin enzyme, D cheese sample: Pasteurized milk using starter culture with low proteolytic activity and microbial enzyme, E cheese sample: Raw milk by chymosin enzyme, F cheese sample: Raw milk by microbial enzyme.
Al-Otaibi and Wilbey (2005) determined that, in UF White cheese production, the use of chymosin in the production of cheese lowered the protein values. In the present study, a decrease in protein
value was observed in all cheese samples during the ripening process and these results were similar to those reported in the previous studies.
Z. Arısoy, Z. Öner
556
An increase was observed at WSN in all cheese samples during the ripening process (Table 3). In the cheese samples produced with UF-pasteurized milk (A-D cheese samples), water-soluble nitrogen values were determined in the range of 0.154-0.241 on the 30th day of the ripening and in the range of 0.249-0.543 on the 90th day of the ripening. Among the cheese samples produced using chymosin, water-soluble nitrogen value was found to be in the range of 0.154-0.543 in the A cheese sample produced with the starter culture with high proteolytic activity while this value was in the range of 0.154-0.249 in the C cheese sample produced using the starter culture with low proteolytic activity. The initial WSN values were the same whereas a higher increase was observed in the A cheese sample due
to the use of Lb. helveticus. In the cheese samples produced with the microbial enzyme, the WSN values in the B cheese sample produced using the starter culture with high proteolytic activity were in the range of 0.241-0.476 while these values were in the range of 0.188-0.510 in the D cheese sample produced using the starter culture with low proteolytic activity (Table 3). Although the initial WSN value of the D cheese sample produced using the starter culture with low proteolytic activity was lower than that of the B sample, it showed a higher increase on day 90 of the ripening period. The ripening index value in soluble protein ranged from 6.94 to 30.94 %. The highest increase was observed in the A cheese sample in which bitterness was the highest.
Table 3. WSN, TCA-SN, PTA-SN and the Ripening index values of the UF White cheese samples
Ripening Time (day) A B C D E F
WSN 30 0.154 0.241 0.154 0.188 0.272 0.361
90 0.543 0.476 0.249 0.510 0.403 0.524
Ripening index to WSN 30 7.34 10.76 6.94 8.74 12.27 16.41
A cheese sample: Pasteurized milk using starter culture with high proteolytic activity and chymosin enzyme, B cheese sample: Pasteurized milk using starter culture with high proteolytic activity and microbial enzyme, C cheese sample: Pasteurized milk using starter culture with low proteolytic activity and chymosin enzyme, D cheese sample: Pasteurized milk using starter culture with low proteolytic activity and microbial enzyme, E cheese sample: Raw milk by chymosin enzyme, F cheese sample: Raw milk by microbial enzyme.
Soltani (2013), in their study on the effect of different salt ratio and storage time on the properties of UF white cheese produced in Iran, has reported that WSN values were in the range of 0.368-0.743 and increased during the storage process. In numerous studies, it has been reported that WSN values increased during the ripening
process in White cheese produced by the UF method and the traditional method Güven and Karaca (2001), Topcu (2004), Karami et al., (2009), Öner (2015), Sarafi et al., (2020). As seen in Table 3, TCA value increased in all cheese samples during the ripening process
UF White cheese
557
whereas it decreased in the E sample produced using UF-raw milk and chymosin. On the 30th day of the ripening period, the lowest TCA value was determined in the F sample produced using UF-raw milk and microbial enzyme whereas the highest value was obtained from the A cheese sample produced using chymosin enzyme and the starter culture with high proteolytic activity. On the 90th day of ripening, the lowest TCA-SN value was determined in the E cheese sample produced using UF-raw milk and chymosin whereas the highest TCA-SN value was determined in the C cheese sample produced using chymosin enzyme and the starter culture with low proteolytic activity. The ripening index values were found to be higher than 7 in the A cheese sample which also had the highest bitterness value and the C sample which had a lower bitterness value. Alizadeh et al. (2006) have reported that the rennet had a significant effect on the nitrogen dissolved in TCA in Iranian white cheese (p <0.05). Karaca (2007) and Soltani (2013) have reported that, in UF White cheeses produced using different concentrations of salt, the nitrogen
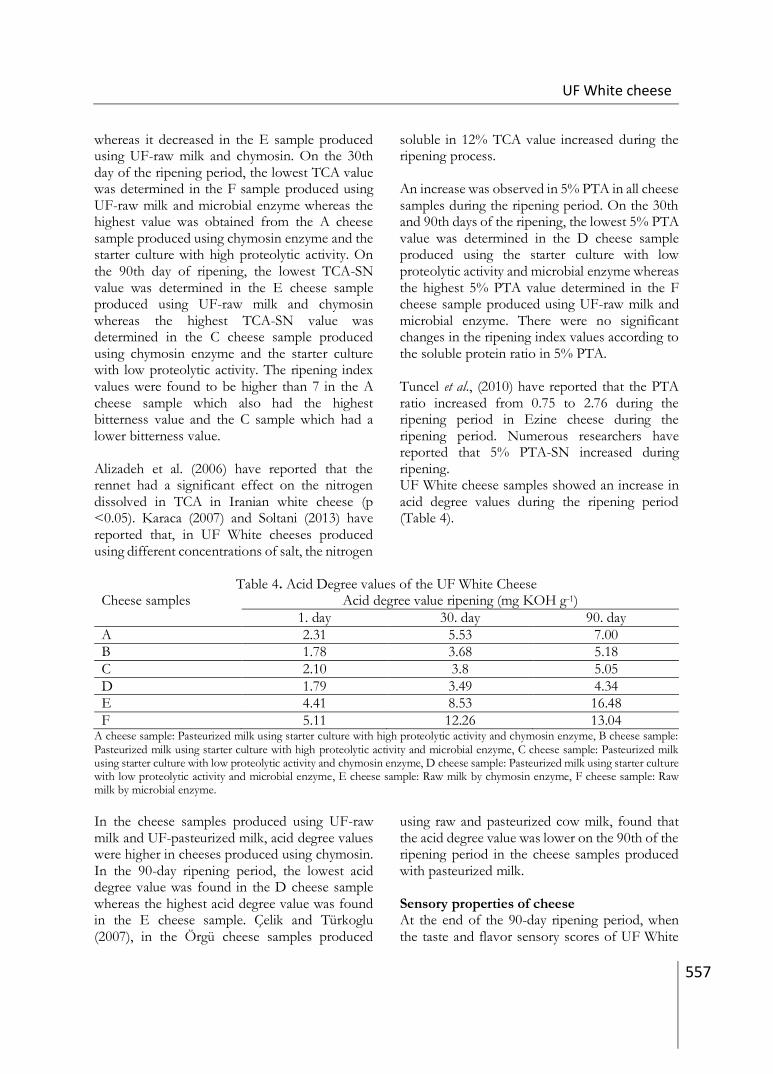
soluble in 12% TCA value increased during the ripening process. An increase was observed in 5% PTA in all cheese samples during the ripening period. On the 30th and 90th days of the ripening, the lowest 5% PTA value was determined in the D cheese sample produced using the starter culture with low proteolytic activity and microbial enzyme whereas the highest 5% PTA value determined in the F cheese sample produced using UF-raw milk and microbial enzyme. There were no significant changes in the ripening index values according to the soluble protein ratio in 5% PTA. Tuncel et al., (2010) have reported that the PTA ratio increased from 0.75 to 2.76 during the ripening period in Ezine cheese during the ripening period. Numerous researchers have reported that 5% PTA-SN increased during ripening. UF White cheese samples showed an increase in acid degree values during the ripening period (Table 4).
Table 4. Acid Degree values of the UF White Cheese
Cheese samples Acid degree value ripening (mg KOH g-1)
1. day 30. day 90. day
A 2.31 5.53 7.00
B 1.78 3.68 5.18
C 2.10 3.8 5.05
D 1.79 3.49 4.34
E 4.41 8.53 16.48
F 5.11 12.26 13.04 A cheese sample: Pasteurized milk using starter culture with high proteolytic activity and chymosin enzyme, B cheese sample: Pasteurized milk using starter culture with high proteolytic activity and microbial enzyme, C cheese sample: Pasteurized milk using starter culture with low proteolytic activity and chymosin enzyme, D cheese sample: Pasteurized milk using starter culture with low proteolytic activity and microbial enzyme, E cheese sample: Raw milk by chymosin enzyme, F cheese sample: Raw milk by microbial enzyme.
In the cheese samples produced using UF-raw milk and UF-pasteurized milk, acid degree values were higher in cheeses produced using chymosin. In the 90-day ripening period, the lowest acid degree value was found in the D cheese sample whereas the highest acid degree value was found in the E cheese sample. Çelik and Türkoglu (2007), in the Örgü cheese samples produced
using raw and pasteurized cow milk, found that the acid degree value was lower on the 90th of the ripening period in the cheese samples produced with pasteurized milk. Sensory properties of cheese At the end of the 90-day ripening period, when the taste and flavor sensory scores of UF White
Z. Arısoy, Z. Öner
558
cheeses were examined, cheese samples produced with UF pasteurized milk (A, B, C, D) had the lowest score of A and C cheese samples. The cheeses made from raw milk (E; F) were not taken into sensory evaluation. The organoleptic evaluation results indicated that flavor of A and C cheese samples were bitterness taste is felt. These
results were pointed in Fig. 1. The highest rate of bitterness was observed in the A cheese sample produced by chymosin enzyme and starter culture with high proteolytic activity. C cheese sample were observed less bitterness taste than A cheese samples.
Figure 1. Flavor properties of UF-white cheese at day 1-90
A cheese sample: Pasteurized milk using starter culture with high proteolytic activity and chymosin enzyme, B cheese sample: Pasteurized milk using starter culture with high proteolytic activity and microbial enzyme, C cheese sample: Pasteurized milk using starter culture with low proteolytic activity and chymosin enzyme, D cheese sample: Pasteurized milk using starter culture with low proteolytic activity and microbial enzyme
Sodium Dodecyl Sulfate Polyacrylamide Gel Electrophoresis The gel obtained after the electrophoresis procedure carried out to determine the level of proteolysis and monitoring the hydrolysis of casein was transferred to the digital media using a scanner and then the changes in αs-casein, β-
casein, α- lactalbumin, β-lactoglobulin values were densitometrically determined using Bio-Rad molecular analyst (Image Lab Software Version 5.2). The electrophoresis gel image of the cheese samples is given in Figure 2 while the changes in protein ratios (%) are given in Table 5.
Figure 2. SDS Page profiles in UF cheese sample Data are presented as, A: a +I, B: b +I, C: a+II, D: b+II, E: UF raw milk+a, F: UF raw milk+ b I: starter culture with high proteolytic activity, II: starter culture with low proteolytic activity a : 100% Chymosin, b:Muchor miehei proteas,
A
B
C
D
UF White cheese
559
As seen in Figure 2, αs-casein and β-casein bands were dense on day 30 of the ripening period in the A and C cheese samples. On day 90, casein hydrolysis started, and the density of these bands
decreased with the breakdown of αs-casein and β-casein.
Table 5. The variations of casein ratio in UF cheese samples (%) (n=4)
Cheese samples Casein
%
Ripening time % The variations of casein ratio
30 day 90.day
A α- casein 44.1±1.36 12.23±1.41 -72.26
β- casein 32.45±3.11 26.14±0.32 -19.44
B α- casein 48.24±1.31 33.14±0.89 -31.30
β- casein 30.03±1.76 30.76±1.18 +2.43
C α- casein 39.01±2.14 26.91±0.36 -31.02
β- casein 38.52±5.93 26.11±0.39 -32.22
D α- casein 44.32±2.37 35.41±1.44 -20.10
β- casein 32.66±1.32 29.93±2.09 -8.36
E α- casein 44.94±2.77 38.16±1.21 -15.09
β- casein 32.3±5.74 27.85±0.66 -13.78
F α- casein 37.41±1.62 35.14±0.97 -6.07
β- casein 33.93±8.59 23.32±0.78 -31.27 A cheese sample: Pasteurized milk using starter culture with high proteolytic activity and chymosin enzyme, B cheese sample: Pasteurized milk using starter culture with high proteolytic activity and microbial enzyme, C cheese sample: Pasteurized milk using starter culture with low proteolytic activity and chymosin enzyme, D cheese sample: Pasteurized milk using starter culture with low proteolytic activity and microbial enzyme, E cheese sample: Raw milk by chymosin enzyme, F cheese sample: Raw milk by microbial enzyme
During the ripening period, a decrease was observed in the percentile values of αs-casein and β-casein in cheese samples. In the A cheese sample, produced with UF pasteurized milk, which had the highest bitterness value in sensory evaluations, αs-casein decreased by 72.26% on day 90 compared to that on day 30, while β-casein ratio decreased by 19.44%. The β-casein ratio remained constant only in the B cheese sample produced only using a microbial enzyme (Table 5). Caseins have hydrophilic properties as well as hydrophobic parts. The C-terminal exhibits hydrophilic properties. Hydrophobic properties are known to cause bitterness (Fox and Brodkorb, 2008). Karaca (2007), has reported that, in the white cheese, αs1-caseins were more hydrolyzed than β-caseins, the proteolytic enzyme-containing cheese samples in the ratio of αs1-casein were more
fragmented compared to the control cheese sample. Soltani (2013) has concluded that, on the first day of ripening, no significant differences were determined between the electrophoretogram bands in UF White cheese samples, αs1-casein and β-casein were hydrolyzed after day 45 and, with the increase in salt ratios on day 45 and 90, a reduction was determined in the hydrolysis products of αs1- casein. Akhgar et al. (2016) have reported that αs1-casein is hydrolyzed faster than β-casein during 60 days of ripening period in Iranian UF White cheese. Al-Otaibi and Wilbey (2005, 2006), have concluded that the rate of αs1-casein hydrolysis increased during the 15-week ripening process in UF White cheese using chymosin at different ratios. Hesari et al. (2006) in Iranian UF White cheese produced without adding starter cultures,
Z. Arısoy, Z. Öner
560
compared the electrophoretic patterns in three types of cheese and have reported that β-casein degradation was negligible whereas αs1-casein was hydrolyzed to αs1-CN (f24-199). It was determined that, compared to the control samples, there was an αs1-casein hydrolysis in cheese samples with no starter culture, αs1-casein remained intact in samples produced without using a coagulating enzyme, αs1-CN (f24-199) was not produced after one and two months of ripening. As a result, the researcher has stated that, in Iranian UF white cheese, the first proteolysis of casein was mainly carried out by enzymes in the coagulant. In Iranian UF White cheese produced without using a coagulating enzyme, it has been stated that milk acid proteinase cathepsin D, which should have a chymosin-like effect on the degradation of αs1-casein in white cheese, had a little contribution. Fathollahi et al. (2010) reported that the breakdown of β-casein and as1-casein in UF cheese has been an evident factor in textural changes of Iranian UF White cheese. Changes in the Peptide Profile RP-HPLC technique is used to determine ripening in cheese. The number of peaks, heights, hydrophilic and hydrophobic areas in the chromatogram provides information about the cheese proteolysis (Topçu, 2004). Hydrophilic
peptides yield chromatograms earlier than hydrophobic peptides do. Low-molecular-weight peptides and free amino acids are eluated at minute 10-40 of the retention time (Engels and Visser, 1994; Soltani, 2013). Proteolysis is the most important and complex biochemical event that occurs during the ripening in most cheese types. In addition to softening of cheese, cheese flavor develops with the contribution of proteolysis, the formation of amino acids and peptides that directly contribute to the aroma of cheese (Katsiari et al., 2000). The high hydrophobicity of αs1 and β-casein are among the reasons for the formation of bitter taste as a result of hydrolysis (Fox et al.,1995). It has been reported that αs1 and β-casein may be the source of the bitter peptides produced by proteinases found in the cell walls of the starter bacteria while rennet can produce bitter-tasting peptides from all casein fractions (Lemieux and Simard, 1991). The changes in the area formed by the hydrophilic and hydrophobic peptides formed according to the HPLC results on day 30 and 90 of the ripening period of the cheese samples are shown in Table 6.
Table 6. The changes the hydrophilic and hydrophobic areas in UF cheese samples (n=2)
Cheese samples Ripening time
(d) Hydrophilic areas % variations
Hydrophobic areas
% variations
A 30 253.775.370
+38 836.313.410
+106 90 349.961.794 1.723.737.389
B 30 205.637.457
+80 963.426.789
+41 90 370.988.666 1.362.504.949
C 30 264.565.060
+12 1.441.623.572
-6 90 296.539.601 1.353.039.704
D 30 243.725.032
+55 1.452.444.292
+14 90 377.096.366 1.655.199.525
E 30 252.667.631
+12 1.319.441.962
-18 90 283.525.132 1.087.225.719
F 30 217.761.973
+76 1.372.067.507
-12 90 382.842.080 1.212.097.909
A cheese sample: Pasteurized milk using starter culture with high proteolytic activity and chymosin enzyme, B cheese sample: Pasteurized milk using starter culture with high proteolytic activity and microbial enzyme, C cheese sample: Pasteurized milk using starter culture with low proteolytic activity and chymosin enzyme, D cheese sample: Pasteurized milk using starter culture with low proteolytic activity and microbial enzyme, E cheese sample: Raw milk by chymosin enzyme, F cheese sample: Raw milk by microbial enzyme.
UF White cheese
561
As seen in Table 6, the highest increase in the hydrophobic area was observed in the A cheese sample (106%) produced using UF-pasteurized milk, chymosin enzyme and the starter culture with high proteolytic activity. No significant changes were observed in the hydrophilic and hydrophobic areas in the C cheese sample produced using chymosin enzyme and the starter culture with low proteolytic activity where increases were observed in the hydrophilic areas in the B and D cheese samples produced using the microbial enzyme. Decreases were observed in the hydrophobic area in the E and F
cheese samples produced using UF raw milk whereas an increase was observed in the hydrophilic area in the F cheese sample. In the cheese samples produced with UF-raw milk, it was determined that protein degradation was high on day 30, due to the high microorganism load, whereas it decreased on day 90. A comparison of HPLC-chromatograms of the A cheese sample which had bitter sensory properties and the D cheese sample D which had no bitter sensory properties is given in Figure 3.
Figure 3. Reverse-phase high performance liquid chromatograms (A214 nm) in the A and D cheese
samples Black peak: A cheese sample day 90 Pink peak : D cheese sample day 90
In Figure 3, it was seen that the number of hydrolysis products increased after 45 minutes in the A cheese sample. There were increases in peaks in the A sample at minute 52 and 56. Öner (2015) has reported that the levels of hydrophobic and hydrophilic peptides and their ratios changed significantly during ripening in White cheese. Hesari et al. (2006) have found that starter culture affected the production of hydrophilic peptides. Agboola et al. (2004) have
stated that the level of hydrophobic peptides in the cheese produced using microbial enzyme was the lowest at the end of the ripening process (30-90 days). The researchers found that the ratio of hydrophobic peptides to hydrophilic peptides was the lowest. The researchers have also reported that the hydrophobic peptide levels measured at 214 nm increased between days 7 and 60 in cheese samples produced using microbial enzyme whereas decreased between days 60 and 90. In
0.0 25.0 50.0 75.0 min
0
2500000
5000000
7500000
10000000
12500000
uV
Z. Arısoy, Z. Öner
562
addition, in all the cheeses produced using abomasum rennet, hydrophobic peptides increased during the ripening process. Hesari et al. (2006), in their study on Iranian UF White cheese samples, have stated that the most important difference between ethanol-insoluble fractions of the peptide profiles of the control cheeses and the cheeses produced using with no starter culture was that the retention time occurred between minutes 10 and 30. During this period, the peptide concentration in the cheeses produced using with no starter culture was lower than that of the control group. Soltani (2013) has reported that there were no significant differences between the samples in the peptide profiles of UF White cheeses in the first 20 minutes of the retention time during the ripening period. The researcher has stated that the differences between the samples in the peptide profiles of UF White cheeses were detected in 20-60 minutes in the retention time and that the peak concentration decreased as the salinity increased. Akhgar et al. (2016) and Banihashemi et al. (2020) have reported that the HPLC chromatograms of the soluble fractions of slurry-added UF White cheese and the control cheese at pH 4.6 showed significant differences in terms of peptide profiles. The researcher has stated that the peptides formed at retention times of 22.5, 28.7, 36, 60, 66 and 68 minutes, the peaks observed during the retention time of 22.5-36 minutes were of low-molecular-weight-peptides and free amino acids whereas peaks of the hydrophobic peptides formed at later retention times. Al-Otaibi and Wilbey (2005) using different rates of chymosin enzyme and salt in the process of UF White cheese showed that bitterness taste was occured from the 12th week. They reported that this was caused by proteolytic enzymes, starter cultures and low salt content. CONCLUSION The changes in the protein content during the ripening process were statistically significant (P <0.05). According to the protein content soluble
in TCA, the highest ripening value was determined in the A and C cheese samples. These samples were also determined to have bitterness. A significant increase was observed in the hydrophobic peptide values in the A samples which had the highest bitterness values during the 90-day ripening period. In the A and C cheese samples in which bitterness were detected, it was determined by the SDS-Page that the αs-casein and β-casein bands were dense on day 30, whereas, on day 90, the density of these bands decreased with the onset of casein hydrolysis. The ratios of αs-casein and β-casein decreased during storage in all UF White cheese samples however there were no changes in the ratio of β-casein in the B cheese sample produced using microbial enzyme and the starter culture with high proteolytic activity. The highest decrease in the β-casein ratio was found in the C cheese sample (32.22%) produced using chymosin enzyme and starter culture with low proteolytic activity. The highest increase in the hydrophobic area was observed in the A cheese sample (106%) produced with UF pasteurized milk, using chymosin enzyme and the starter culture with high proteolytic activity. As a result, it was determined that the use of chymosin enzyme and the starter culture with high proteolytic activity in the production of UF White cheese caused a decrease in protein ratio whereas it increased proteolysis. Furthermore, the rate of αs-casein degradation increased, and hydrophobic peptides increased during the ripening period. On the other hand, it was determined that αs-casein degradation rate decreased, and an increase was observed in the hydrophilic area in the case where microbial enzyme and the starter culture with low proteolytic activity were used. Therefore, it was determined that the use of microbial enzyme and the starter culture with low proteolytic activity in UF White cheese production and carrying out the production procedure at the appropriate temperature is important for the prevention of bitterness in cheese.
UF White cheese
563
ACKNOWLEDGEMENTS This study was supported by SDU BAP project number 4869 YL1-17. We would like to thank to SDU-BAP group for supporting to the project. CONFLICT OF INTEREST The authors declare no conflict of interest. AUTHOR CONTRIBUTIONS Zübeyde Öner: Contributed as the thesis supervisor. The Master's thesis student Zerrin Arısoy carried out the preparation of samples, analyses, reporting, and writing and correction of literature sources. Both of authors were responsible for interpretation and discussion of the results. Both of authors approved the submitted version. REFERENCES Agboola, S., Chen, S., Zhao, J. (2004). Formation of Bitter Peptides During Ripening of Ovine Milk Cheese Made With Different Coagulants. Dairy J, 84: 567- 578, doi: 10.1051/lait:2004032.
Akhgar, R.N.R., Hesari, J., Damirchi, S.A. (2016). Effect of Slurry Incorporation into Retentate on Proteolysis of Iranian Ultrafiltered White Cheese. J Food Sci, 34: 173-179, 10.17221/361/2015-CJFS.
Alizadeh, M., Hamedi, M., Khosroshahi, A. (2006). Modeling of Proteolysis and Lipolysis İn Iranian White Brine Cheese. Food Chem, 97(2): 294-301, doi: 10.1016/j.foodchem.2005.05.009.
Al-Otaıbı, M.M., Wılbey, R.A. (2005). Effect of Chymosin and Salt Reduction on the Quality of Ultrafiltrated White-Salted Cheese. J Dairy Res, 72:234-242, doi: 10.1017/S0022029905000762.
Al-Otaibi, M.M., Wilbey, RA. (2006). Effect of Chymosin Reduction and Salt Substitution on the properties of White Salted Cheese. Int Dairy J, 16: 903-909, doi: 10.1016/j.idairyj.2005.08.006.
AOAC. (1990). Official Methods of Analysis, 15th Ed., Association of Official Analysis Chemists: Arlington, VA, USA
Arısoy, Z., Öner, Z. (2019). Ultrafiltrasyon Tekniği İle Üretilen Beyaz Peynirlerin Kimyasal ve Mikrobiyolojik Özellikleri Üzerine Farkli Pihtilaştirici Enzimlerin Etkisi [The Effect of
Different Coagulation Enzymes on the Chemical and Microbiological Properties of Ultrafiltrated White Cheese] Kırklareli University J Eng Sci, 5(1): 68-86, doi: 10.34186/klujes.565223.
Banihashemi, S.A., Nikoo, M., Ghasempour, Z., Ehsani, A. (2020). Bioactive peptides fractions from traditional Iranian Koopeh cheese; lactic fermentation products. Biocatalysis Agric Biotechnol , 29: 101798, doi: 10.1016/j.bcab.2020.101798.
Cinbaş, T. (2004). İki Farklı Üretim Yöntemiyle Üretilen Beyaz Peynirlerde Proteoliz ve Lipoliz [Proteolysis and Lipolysis in White Cheese Produced by Two Different Production Methods], Istanbul Technical University Master thesis, Istanbul, Turkey, 66p.
Çelik, Ş., Türkoğlu, H. (2007). Ripening of Örgü Cheese Manufactured with Raw or Pasteurized Milk: Composition and Biochemical Properties. Int J Dairy Technol, 60(4): 253-258, doi: 10.1111/j.1471-0307.2007.00344.x.
Donkor, O.N., Henriksson, A., Singh, T.K., Vasiljevic, T., Shah, N.P. (2007). ACE Inhibitory Activity of Probiotic Yoghurt, Int Dairy J, 17: 1321-1331, doi: 10.1016/j.idairyj.2007.02.009.
Engels, W.J.M., Vısser, S. (1994). Isolation and Comparative Characterization of Components That Contribute to the Flavor of Different Types of Cheese. Netherlands, Milk Dairy J, 48: 127-140.
Fathollahi, I., Hesari, J., Azadmard, S., Oustan, S. (2010). Influence of Proteolysis and Soluble Calcium Levels on Textural Changes in The Interior and Exterior of Iranian UF White Cheese During Ripening. World Academy of Science, Engineering andTechnology. Int J Nutr Food Eng, 66: 399-404, doi: 10.5281/zenodo.1076508.
Fox, P.F., Brodkorb, A. (2008). The Casein Micelle Historical Aspects, Current Concepts and Significance. Int Dairy J, 18: 677-684, doi: 10.1016/j.idairyj.2008.03.002.
Fox, P.F., McSweeney, P.L.H, Singh T.K. (1995). Methods for Assessing Proteolysis in Cheese during Maturation. In: Chemistry of Structure-Function Relationships in Cheese, Springer, Boston, MA, pp: 161-194.
Güven, M., Karaca, O.B. (2001). Proteolysis Levels of White Cheese Salted and Ripend in Prepared from Various Salt. Int J Dairy Technol, 54(1): 29-33, doi: 10.1046/j.1471-0307.2001.00003.x.
Hayaloglu, A.A., Guven, M., Fox, P.F., Hannon, J.A., Mcsweeney, P.L.H. (2004). Proteolysis in Turkish White-Brined Cheese Made with Defined Strains of Lactococcus. Int Dairy J, 14: 599-610, doi: 10.1016/j.idairyj.2003.12.008.
Hayaloğlu, A. A., Özer, B. (2011). Peynirde Olgunlaşma [Ripening in cheese]. In: Peynir Biliminin Temelleri (173-203), Hayaloğlu A.A. ve Özer B. (Ed.), Sidas, İzmir, pp: 173-203.
Hesari, J., Ehsani, M.R., Khosroshahi, A., McSweeney, P.L. (2006). Contribution of Rennet and Starter to Proteolysis İn Iranian UF White Cheese. Dairy J, 86: 291-302, doi: 10.1051/lait:2006011.
Jarrett, W.D., Aston, J.W., Dulley, J.R. (1982). A Simple Method for Estimating Free Amino Acids in Cheddar Cheese. Aust J Dairy Technol, 37 (2): 55.
Karaca, O.B. (2007). Mikrobiyel Kaynaklı Proteolitik ve Lipolitik Enzim Kullanımının Beyaz peynirlerin Özellikleri ve Olgunlaşmaları Üzerine Etkileri [Effects of Using of Proteolytic and Lipolytic Enzyme on Properties of White Cheeses] Çukurova University Food Engineering, Adana, Turkey, 149 p.
Karami, M., Ehsani, M.R., Mousavi, S.M., Rezaei, K., Safari, M. (2009). Changes in The Rheological Properties of Iranian UF-Feta Cheese During Ripening. Food Chem, 112(3): 539-544, doi: 10.1016/j.foodchem.2008.06.003.
Katsiari, M.C., Alichanidis, E., Voutsinas, L.P., Roussis, I.G. (2000). Proteolysis in Reduced Sodium Feta Cheese Made by Partial Substitution of NaCl by KCl. Int Dairy J, 10: 635-646, doi: 10.1016/S0958-6946(00)00097-2.
Kılıç, S., Eren Vapur, U. (2003). Peynirde Acılık Problemi, Etki Eden Faktörler ve Kontrol Altına Alınması [Bitter Flavor Development in Cheese,
Factors Likely to Infllence and Control of Cheese Bitterness]. Bilimsel Gıda, 4: 35-37.
Kuchroo, C.N., Fox, P.F. (1982). Soluble Nitrogen in Cheddar Cheese Comparison of Extraction Procedures. Milchwissenschaft, 37(6): 331-335.
Laemmli, U.K. (1970). Cleavage of Structural Protein during the Assembly of the Head of Bacteriophage T4. Nature, 227:680-685, doi: 10.1038/227680a0.
Lemieux, L., Simard, R. E. (1991). Bitter Flavour in Dairy Products I. A Review of the Factors Likely to Influence its Development Mainly in Cheese Manufacture. Lait, 71: 599-636.
Öner, Z. (2015). Beyaz, Kaşar ve Tulum Peynirinde Biyoaktif Peptitlerin Belirlenmesi ve Tanımlanması [Identification and Characterization of Bioactive Peptides in Beyaz, Kashar, and Tulum cheeses], TÜBİTAK Project Report, 137 p.
Peppas, C.P., Kanolly, E., Voutsinas, L.P., Mallatou, H. (1996). Effect of starter level draining time and aging on the physicochemical, organoleptic and rheological properties of feta cheese. J Soc Dairy Technol, 49: 73-79, doi: 10.1111/j.1471-0307.1996.tb02494.x
Polychronıadou, A., Michaelidou, A., Paschaloudis, N. (1999). Effect of Time, Temperature and Extraction Method on the Trichloroacetic Acid-Soluble Nitrogen of Cheese. Int Dairy J, 9(8): 559-568, doi: 10.1016/S0958-6946(99)00122-3.
Renner, E. (1986). Milchpraktikum Skriptum zu den Übungen. Justus-Liebig-Universität
Sharafi; S., Nareghi, L., Eyvazzade, O., Ebrahimi, M.T.A. (2020). The Physicochemical, Texture Hardness and Sensorial Properties of Ultrafiltrated Low Fat Cheese Containing Galactomannan and Novagel Gum. Acta Sci Polo Technol Aliment, 19(1): 83-100, doi: 10.17306/J.AFS.2020.0685.
Soltani, M. (2013). İran’da Üretilen Ultrafiltre Beyaz Peynirin Özellikleri Üzerine Tuz Oranı ve Depolama Süresinin Etkileri [Effects of Salt Ratio and Storage Time on Properties of Ultrafilter
UF White cheese
565
White Cheese Produced in Iran] Çukurova University PhD thesis, Adana, Turkey, 168 p.
Soltani, M., Boran, O.S., Hayaloğlu, A. A. (2016). Effect of Various blends of Camel Chymosin and Microbial Rennet (Rhizomucor miehei) on Microstructure and Rheological Properties of Iranian UF White Cheese. LWT -Food Sci Technol, 68: 724-728, doi: 10.1016/j.lwt.2016.01.028
Sousa, M.J., Ardo, Y., Mcsweeney, P.L.H. (2001). Advances in the Study of Proteolysis during Cheese Ripening. Int Dairy J, 11: 327–345, doi: 10.1016/S0958-6946(01)00062-0.
Topçu, A. (2004). Kaşar ve Beyaz Peynirlerde Acılaşmaya Yol Açan Peptidlerin Saptanması ve Starter Kültürlerin Etkisinin İncelenmesi [Determination of Peptides Causing Bitter in
Cheddar and White Cheeses and Investigation of the Effects of Starter Cultures] Hacettepe University PhD thesis, Ankara, Turkey, 158 p.
Tuncel, N.B, Güneşer, O., Engin, B., Yaşar, K., Zorba, N.N., Karagül-Yüceer, Y. (2010). Ezine Peyniri II. Olgunlaşma Süresince Proteoliz Düzeyi. J Food, 35(1): 1-6.
Üçüncü, M. (2008). A’dan Z’ye Peynir Teknolojisi [Cheese Technology from A to Z] Meta Basım Matbaası 2. Press 1236p İzmir, Turkey.
Yıldırım, Z., Atamer, M., Yıldırım, M. (2011). Peynirde Kalite Faktörleri [Quality Factors in Cheese]. In: Peynir Biliminin Temelleri, Hayaloğlu A.A. ve Özer B. (Ed.), Sidas, İzmir, Turkey, pp: 417-447.