24
Global Defense Outlook 2015 Defense and Development
| Date post: | 22-Jan-2018 |
| Category: |
News & Politics |
| Upload: | jack-midgley |
| View: | 302 times |
| Download: | 2 times |
Global Defense Outlook 2015Defense and Development
2
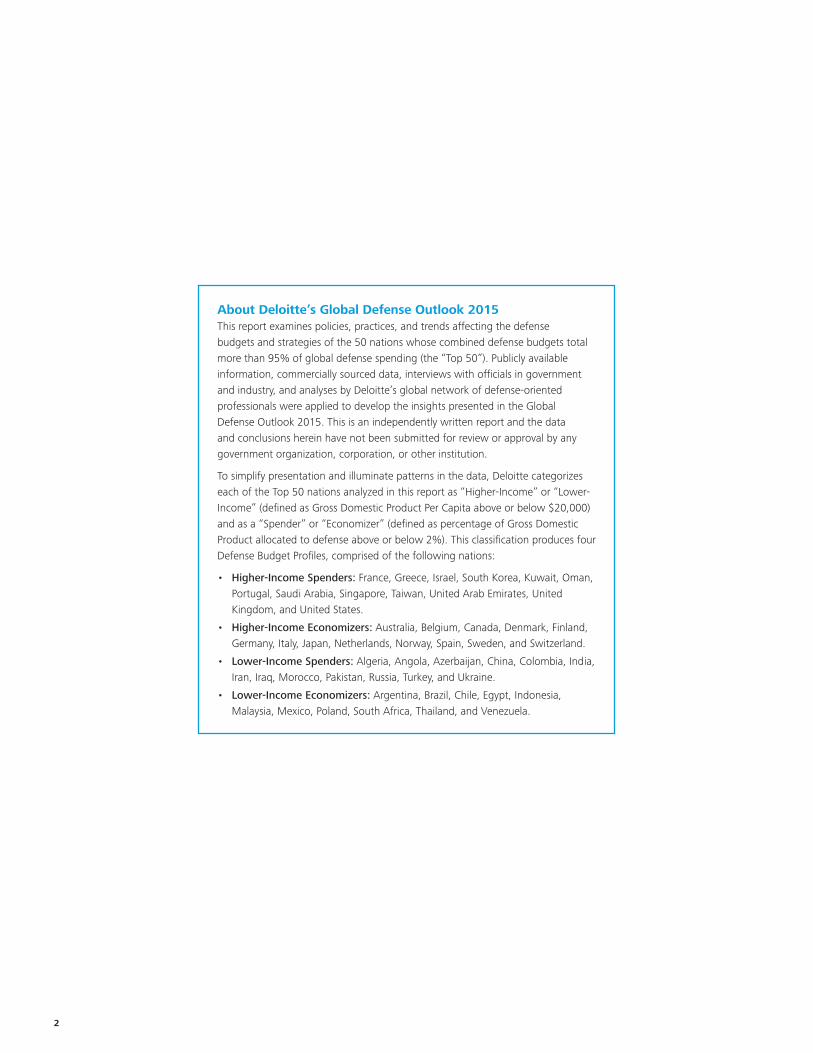
About Deloitte’s Global Defense Outlook 2015This report examines policies, practices, and trends affecting the defense budgets and strategies of the 50 nations whose combined defense budgets total more than 95% of global defense spending (the “Top 50”). Publicly available information, commercially sourced data, interviews with officials in government and industry, and analyses by Deloitte’s global network of defense-oriented professionals were applied to develop the insights presented in the Global Defense Outlook 2015. This is an independently written report and the data and conclusions herein have not been submitted for review or approval by any government organization, corporation, or other institution.
To simplify presentation and illuminate patterns in the data, Deloitte categorizes each of the Top 50 nations analyzed in this report as “Higher-Income” or “Lower-Income” (defined as Gross Domestic Product Per Capita above or below $20,000) and as a “Spender” or “Economizer” (defined as percentage of Gross Domestic Product allocated to defense above or below 2%). This classification produces four Defense Budget Profiles, comprised of the following nations:
• Higher-Income Spenders: France, Greece, Israel, South Korea, Kuwait, Oman, Portugal, Saudi Arabia, Singapore, Taiwan, United Arab Emirates, United Kingdom, and United States.
• Higher-Income Economizers: Australia, Belgium, Canada, Denmark, Finland, Germany, Italy, Japan, Netherlands, Norway, Spain, Sweden, and Switzerland.
• Lower-Income Spenders: Algeria, Angola, Azerbaijan, China, Colombia, India, Iran, Iraq, Morocco, Pakistan, Russia, Turkey, and Ukraine.
• Lower-Income Economizers: Argentina, Brazil, Chile, Egypt, Indonesia, Malaysia, Mexico, Poland, South Africa, Thailand, and Venezuela.
Global Defense Outlook 2015 Defense and Development 3
Contents
4 Executive summary
5 The new defense environment5 Declining militarization as budget growth shifts to Asia10 Chronic, concentrated violence12 Widening cyber risk gap
14 Defense policy challenges for government and business14 Managing defense relationships in Asia: Institutions versus ad-hocracy14 Responding to the globalizing defense industry: Comparative advantage versus autonomy16 Promoting defense export growth: Expanding supply versus flat demand17 Managing the rising cost of military compensation: Cost versus productivity
19 Defense and Development
21 Contributors
22 Endnotes

4
Executive summary
New defense environmentRapid, sustained economic development in Asia, and broad-based declines in levels of military operations, are poised to reduce global levels of militarization and to narrow the capability gap between armed forces worldwide. As the global economy becomes less reliant on military spending, Higher-Income nations limit the growth of defense budgets to accommodate domestic economic priorities, and Lower-Income nations boost defense budgets to accelerate economic development and enhance defense capabilities.
Chronic, concentrated violenceAmong most of the Top 50, deaths from terrorism and battle have continued their long-term decline and are below their pre-9/11 levels. The global conflict situation can be categorized as chronic, concentrated violence—chronic because conflict tends to persist in those areas where it occurs, and concentrated because most conflict is confined to a small number of countries, most of which are not among the Top 50 defense spenders. In most of the world, deaths from terrorism and battle are becoming much less frequent.
Widening cyber risk gapThe Higher-Income Top 50 nations are growing more vulnerable to cyberattacks. The highest level of cyber-related risk is associated with the Higher-Income Economizers. The Lower-Income Top 50 have significantly lower levels of vulnerability.
Defense policy challenges for government and businessManaging defense relationships in Asia: Institutions versus ad-hocracyAsia’s share of global defense spending has more than doubled since 1990 (from 10 percent to 26 percent), while Europe’s share has dropped from 44 percent to 24 percent. But shifts in the global quantity and quality of defense resources have not been matched by improvements in the institutions and processes used to manage security challenges, opening the path to misunderstanding, crisis, and conflict.
Responding to the globalizing defense industry: Comparative advantage versus autonomyThe worldwide levelling of military technology, as science and engineering capability becomes more diffuse, may have less to do with underfunding in America than with continued Asian economic development. As defense industrial capability develops, defense leaders will face difficult decisions about which military technologies to produce at home and which to buy from an increasingly capable global defense industrial base.
Promoting defense export growth: Expanding supply versus flat demandThe non-U.S. Higher-Income nations are limiting the growth of procurement budgets while Lower-Income nations are growing procurement budgets and building defense industrial bases. Defense companies and governments are responding by promoting exports, but a mismatch may be growing between defense market supply and demand.
Managing the rising cost of military compensation: Cost versus productivityAccelerating economic development has created new challenges for defense ministries struggling to recruit and retain the quantity and quality of personnel required to operate increasingly sophisticated defense equipment.
Global Defense Outlook 2015 Defense and Development 5
The combined annual defense budget of the 50 largest defense spenders now exceeds $1.6 trillion—an amount greater than the Gross Domestic Product (GDP) of all but the 11 largest national economies”.1 Defense budgets support national workforces and industrial development, as well as military capabilities, and these budgets are instruments of national economic policy as well as defense strategy.
Rapid, sustained economic growth in Asia, and broad-based declines in global levels of military operations, have transformed the defense environment. Over the next five years, these deep-rooted trends are likely to reduce global levels of militarization, and to narrow the capability gaps between armed forces worldwide—even as vulnerability to cyberattack grows rapidly in the richest countries.
Declining militarization as budget growth shifts to AsiaAs growth and development continue worldwide, the global economy is becoming less reliant on military spending. Higher-Income nations are reducing the growth of defense budgets to accommodate domestic economic priorities, and Lower-Income nations are generally increasing defense spending to accelerate economic development while enhancing defense capabilities.
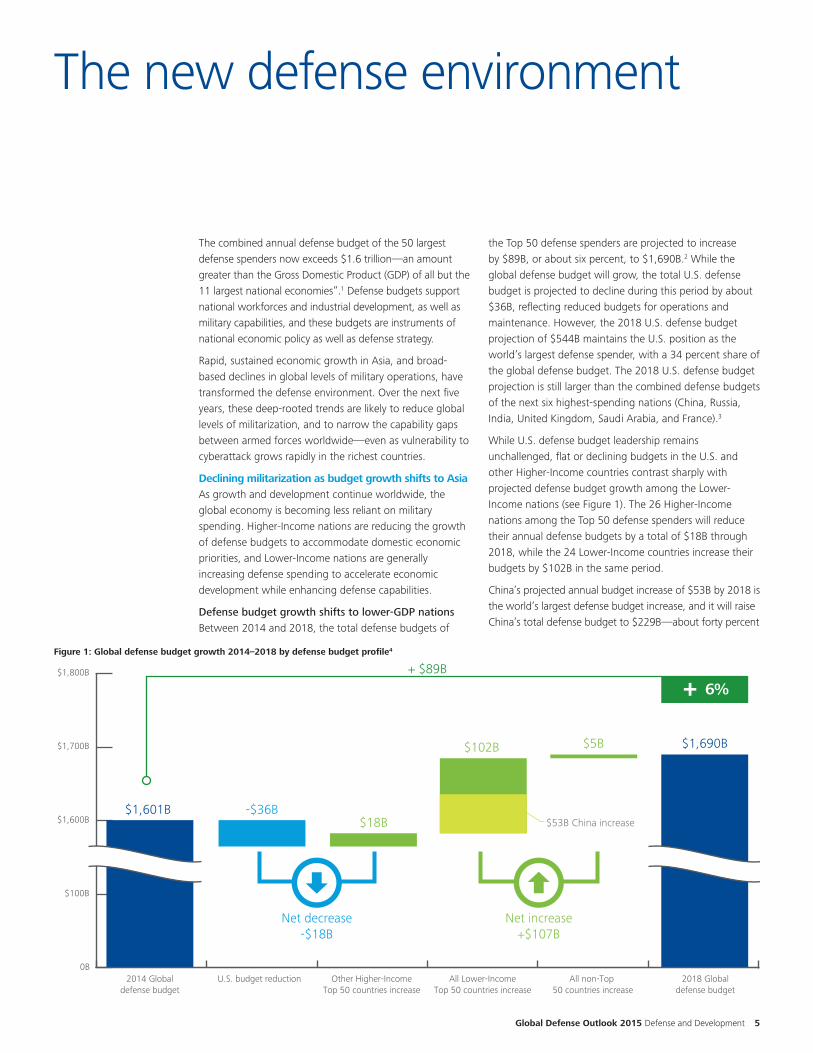
Defense budget growth shifts to lower-GDP nationsBetween 2014 and 2018, the total defense budgets of
the Top 50 defense spenders are projected to increase by $89B, or about six percent, to $1,690B.2 While the global defense budget will grow, the total U.S. defense budget is projected to decline during this period by about $36B, reflecting reduced budgets for operations and maintenance. However, the 2018 U.S. defense budget projection of $544B maintains the U.S. position as the world’s largest defense spender, with a 34 percent share of the global defense budget. The 2018 U.S. defense budget projection is still larger than the combined defense budgets of the next six highest-spending nations (China, Russia, India, United Kingdom, Saudi Arabia, and France).3
While U.S. defense budget leadership remains unchallenged, flat or declining budgets in the U.S. and other Higher-Income countries contrast sharply with projected defense budget growth among the Lower-Income nations (see Figure 1). The 26 Higher-Income nations among the Top 50 defense spenders will reduce their annual defense budgets by a total of $18B through 2018, while the 24 Lower-Income countries increase their budgets by $102B in the same period.
China’s projected annual budget increase of $53B by 2018 is the world’s largest defense budget increase, and it will raise China’s total defense budget to $229B—about forty percent
Figure 1: Global defense budget growth 2014–2018 by defense budget profile4
0B
$100B
$1,600B
$1,700B
$1,800B
2014 Globaldefense budget
U.S. budget reduction
$1,601B
$1,690B
-$36B$18B
$102B $5B
6%+ $89B
Other Higher-IncomeTop 50 countries increase
All Lower-IncomeTop 50 countries increase
All non-Top 50 countries increase
2018 Globaldefense budget
Net decrease-$18B
Net increase+$107B
$53B China increase
The new defense environment
6
of the U.S. defense budget, and more than four times the annual defense budget of its regional rival, Japan. China’s projected budget increase represents sixty percent of the net increase in global defense budgets through 2018.
Accelerating defense budget growth in China and other Lower-Income states, and declines or flat budget growth in their Higher-Income counterparts—how can this be explained? The sharp distinction on the basis of GDP suggests an economic answer, rather than a political one.
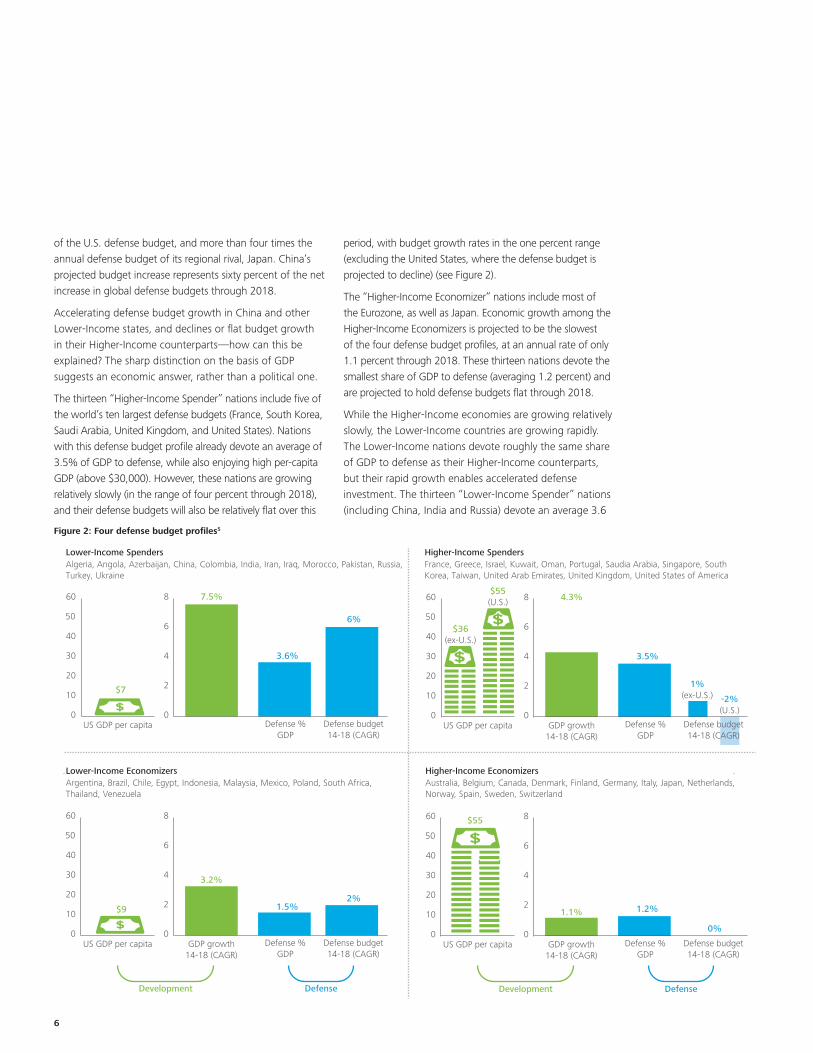
The thirteen “Higher-Income Spender” nations include five of the world’s ten largest defense budgets (France, South Korea, Saudi Arabia, United Kingdom, and United States). Nations with this defense budget profile already devote an average of 3.5% of GDP to defense, while also enjoying high per-capita GDP (above $30,000). However, these nations are growing relatively slowly (in the range of four percent through 2018), and their defense budgets will also be relatively flat over this
period, with budget growth rates in the one percent range (excluding the United States, where the defense budget is projected to decline) (see Figure 2).
The “Higher-Income Economizer” nations include most of the Eurozone, as well as Japan. Economic growth among the Higher-Income Economizers is projected to be the slowest of the four defense budget profiles, at an annual rate of only 1.1 percent through 2018. These thirteen nations devote the smallest share of GDP to defense (averaging 1.2 percent) and are projected to hold defense budgets flat through 2018.
While the Higher-Income economies are growing relatively slowly, the Lower-Income countries are growing rapidly. The Lower-Income nations devote roughly the same share of GDP to defense as their Higher-Income counterparts, but their rapid growth enables accelerated defense investment. The thirteen “Lower-Income Spender” nations (including China, India and Russia) devote an average 3.6
Figure 2: Four defense budget profiles5
Higher-Income EconomizersAustralia, Belgium, Canada, Denmark, Finland, Germany, Italy, Japan, Netherlands, Norway, Spain, Sweden, Switzerland
Lower-Income EconomizersArgentina, Brazil, Chile, Egypt, Indonesia, Malaysia, Mexico, Poland, South Africa, Thailand, Venezuela
0
10
20
30
40
60
Defense %GDP
0
2
4
6
8
US GDP per capita GDP growth14-18 (CAGR)
Defense budget14-18 (CAGR)
3.2%
1.5%2%
50
Development Defense
0
10
20
30
40
60
Defense %GDP
0
2
4
6
8
US GDP per capita GDP growth14-18 (CAGR)
Defense budget14-18 (CAGR)
1.1% 1.2%
0%
50
Development Defense
$9
$55
0
10
20
30
40
60
Defense %GDP
0
2
4
6
8
US GDP per capita
Lower-Income SpendersAlgeria, Angola, Azerbaijan, China, Colombia, India, Iran, Iraq, Morocco, Pakistan, Russia, Turkey, Ukraine
Defense budget14-18 (CAGR)
7.5%
3.6%
6%50
$7
Higher-Income SpendersFrance, Greece, Israel, Kuwait, Oman, Portugal, Saudia Arabia, Singapore, South Korea, Taiwan, United Arab Emirates, United Kingdom, United States of America
0
10
20
30
40
60
Defense %GDP
0
2
4
6
8
US GDP per capita GDP growth14-18 (CAGR)
Defense budget14-18 (CAGR)
4.3%
3.5%
1%(ex-U.S.)
50
-2%(U.S.)
$36(ex-U.S.)
$55(U.S.)
Global Defense Outlook 2015 Defense and Development 7
percent of GDP to defense (versus 3.5 percent for the Higher-Income spenders), but their higher average rate of economic growth (7.5 percent through 2018, versus 4.3 percent for the Higher-Income group) drives six percent annual growth in defense spending, projected to reach a thirteen-country total of $475B by 2018, or nearly thirty percent of the total global defense budget. Even at this level, the combined budgets of all thirteen Higher-Income Spenders will approach only ninety percent of the 2018 U.S. defense budget. The combined budgets of the three largest Lower-Income spenders—China, India and Russia ($388B)—are projected to equal only 71 percent of the 2018 U.S. defense budget, demonstrating the continued global preponderance of U.S. defense resources.
The 11 “Lower-Income Economizers” are projected to budget more than $104B for defense in 2018, accounting for about 6.5 percent of the global defense budget and twenty percent of the 2018 U.S. defense budget. Brazil’s budget represents one-third of the total defense budget of this group, which will increase defense spending at a rate of two percent annually through 2018, a rate slower than projected economic growth of 3.2 percent.
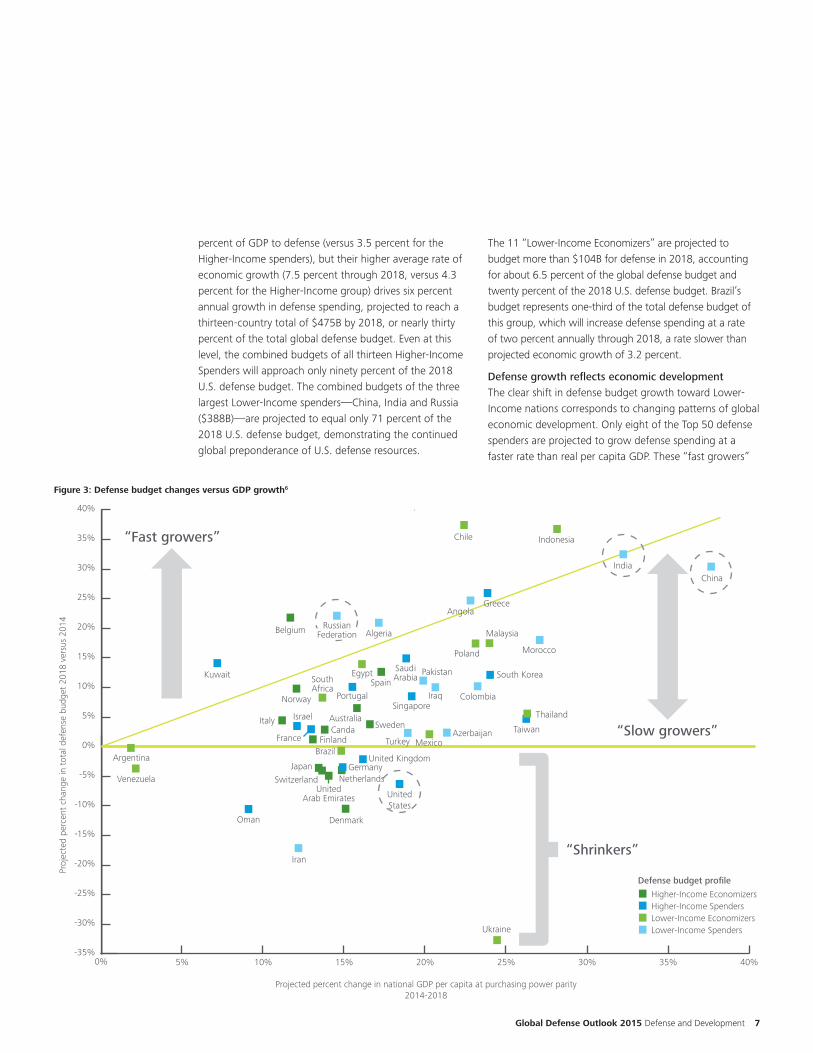
Defense growth reflects economic developmentThe clear shift in defense budget growth toward Lower-Income nations corresponds to changing patterns of global economic development. Only eight of the Top 50 defense spenders are projected to grow defense spending at a faster rate than real per capita GDP. These “fast growers”
Figure 3: Defense budget changes versus GDP growth6
Proj
ecte
d pe
rcen
t ch
ange
in t
otal
def
ense
bud
get
2018
ver
sus
2014
Projected percent change in national GDP per capita at purchasing power parity2014-2018
0% 5% 10% 15% 20% 25% 30% 35% 40%-35%
-30%
-25%
-20%
-15%
-10%
-5%
0%
5%
10%
15%
20%
25%
30%
35%
40%
Higher-Income EconomizersHigher-Income SpendersLower-Income EconomizersLower-Income Spenders
Defense budget profile
“Slow growers”
“Fast growers”
“Shrinkers”
Chile Indonesia
IndiaChina
GreeceAngola
AlgeriaRussian
FederationBelgium
Kuwait
Argentina
Venezuela
Oman
Iran
Mexico
Ukraine
Denmark
UnitedStates
Thailand
Malaysia
Morocco
South Korea
Colombia
SaudiArabia
IraqNorway
ItalyCanda
Finland
Israel AustraliaSingapore
EgyptSpain
Portugal
TaiwanAzerbaijan
BrazilFrance
GermanyJapanNetherlands
Pakistan
Poland
SouthAfrica
Sweden
Switzerland
United Kingdom
UnitedArab Emirates
Turkey
8
are Russia, Algeria, Angola, Belgium, Chile, Greece, Indonesia, and Kuwait (see Figure 3).
Russia’s defense budget is projected to grow by more than 30 percent from 2014 to 2018, reaching $95B, as the State Armaments Plan (Russian acronym GPV) accelerates and extends the recapitalization of Russia’s post-Soviet armed forces. This program, initiated before the current sanctions program sharply reduced projected Russian economic growth, includes acquisition of more than 700 new combat vehicles, 1,545 multirole vehicles,126 new fixed-wing aircraft, and 88 helicopters as well as recently-commissioned ballistic missile submarines and new Intercontinental Ballistic Missiles (ICBMs).7 Slowing Russian economic growth, driven by sanctions stemming from operations in Ukraine, and the long-term demands of Russia’s defense recapitalization effort resulted in projected defense spending growth exceeding the projected GDP growth rate.
The defense budgets of the remaining seven “fast growers” will average only $8.5B in 2018. At a total of $59.4B, the budgets of the seven non-Russian fast growers represent only three percent of the projected global defense budget. All of the remaining 42 nations,
accounting for more than 90 percent of the total global defense budget, are projected to increase defense spending at rates less than or equal to their projected rates of real per capita GDP growth.
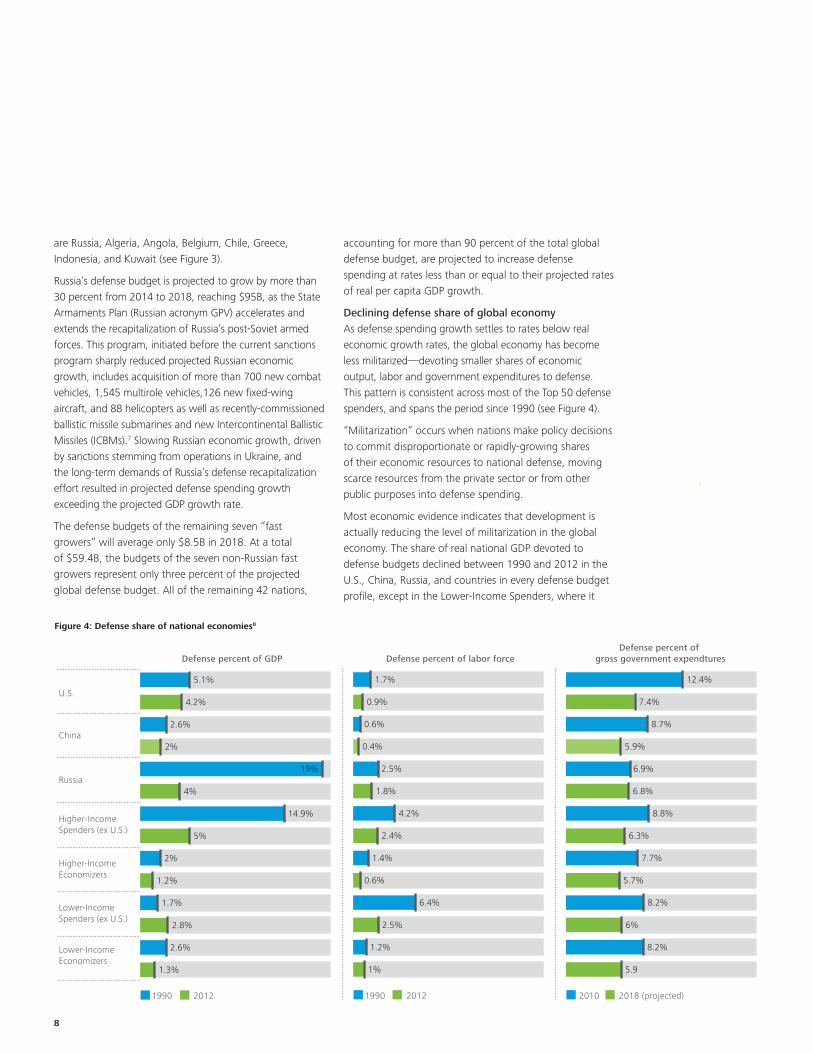
Declining defense share of global economyAs defense spending growth settles to rates below real economic growth rates, the global economy has become less militarized—devoting smaller shares of economic output, labor and government expenditures to defense. This pattern is consistent across most of the Top 50 defense spenders, and spans the period since 1990 (see Figure 4).
“Militarization” occurs when nations make policy decisions to commit disproportionate or rapidly-growing shares of their economic resources to national defense, moving scarce resources from the private sector or from other public purposes into defense spending.
Most economic evidence indicates that development is actually reducing the level of militarization in the global economy. The share of real national GDP devoted to defense budgets declined between 1990 and 2012 in the U.S., China, Russia, and countries in every defense budget profile, except in the Lower-Income Spenders, where it
Figure 4: Defense share of national economies8
Higher-Income Economizers
Russia
China
U.S.
5.1%
Lower-Income Economizers
Higher-Income Spenders (ex U.S.)
Lower-Income Spenders (ex U.S.)
4.2%
2.6%
2%
19%
4%
14.9%
5%
2%
1.2%
1.7%
2.8%
2.6%
1.3%
1990 2012
Defense percent of GDPDefense percent of
gross government expendtures
12.4%
7.4%
8.7%
5.9%
6.9%
6.8%
8.8%
6.3%
7.7%
5.7%
8.2%
6%
8.2%
5.9
2010 2018 (projected)
1.7%
0.9%
0.6%
0.4%
2.5%
1.8%
4.2%
2.4%
1.4%
0.6%
6.4%
2.5%
1.2%
1%
1990 2012
Defense percent of labor force
Global Defense Outlook 2015 Defense and Development 9
increased from 1.7 percent to 2.8 percent. Most of this change was driven by India, Turkey, Algeria, and Pakistan.
Nations increase the share of their labor force devoted to defense when they militarize, through conscription or other measures. But the defense share of labor force fell in the U.S., China, Russia, and all four defense budget profiles. Defense-related work occupies a shrinking share of the global labor force.
As economies develop and citizens increase their incomes, governments are pressed to provide social services including civil infrastructure, education, and health care, in addition to national defense. If a national economy is becoming more militarized, then it would be expected to devote a larger share of government expenditures to national defense, diverting resources from other public purposes. But Figure 4 shows that this has not occurred.
In every defense budget profile—even in the U.S. and China—defense is projected to consume a reduced share of government expenditures.
Worldwide, by multiple measures, and over an extended period, the global economy has become less dependent on defense spending.
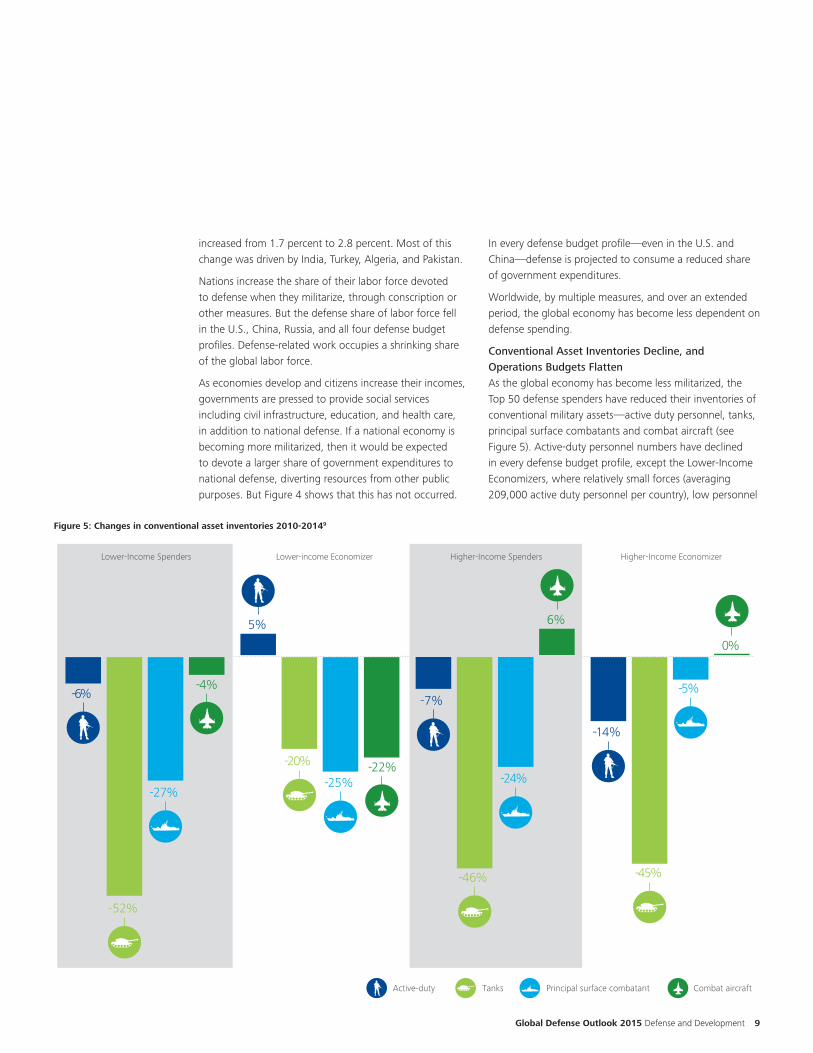
Conventional Asset Inventories Decline, and Operations Budgets FlattenAs the global economy has become less militarized, the Top 50 defense spenders have reduced their inventories of conventional military assets—active duty personnel, tanks, principal surface combatants and combat aircraft (see Figure 5). Active-duty personnel numbers have declined in every defense budget profile, except the Lower-Income Economizers, where relatively small forces (averaging 209,000 active duty personnel per country), low personnel
Figure 5: Changes in conventional asset inventories 2010-20149
-7%
-46%
-24%
6%
-14%
-45%
-5%
0%
-6%
-52%
-27%
5%
-20%
-25% -22%
Higher-Income Spenders Higher-Income EconomizerLower-Income Spenders Lower-income Economizer
Active-duty Tanks Principal surface combatant Combat aircraft
-4%
10
costs (averaging $31,000 per active-duty service member), and lower levels of defense technology create incentives to increase active duty members.
Tank inventories have dropped sharply worldwide, as the high fixed cost and low utilization of these systems have reduced their perceived value. Combat aircraft inventories have generally fallen, except among the Higher-Income Spenders, where advanced technology and higher budgets support acquisition and operation of these sophisticated systems.
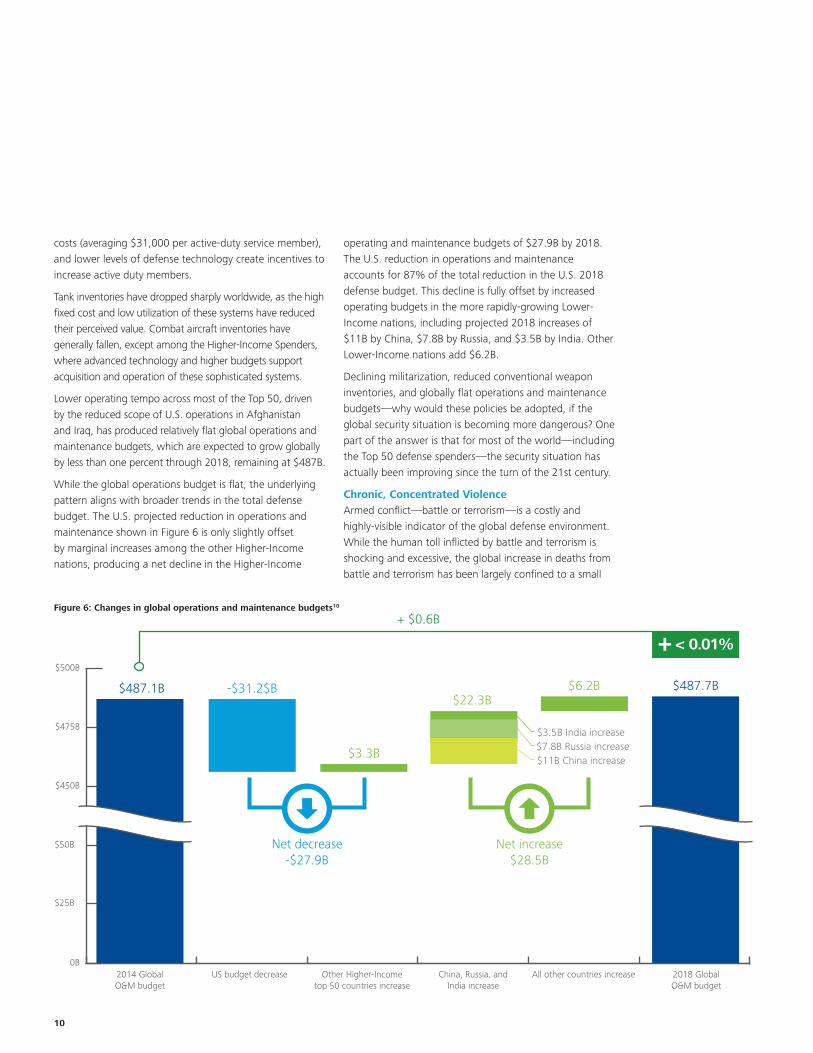
Lower operating tempo across most of the Top 50, driven by the reduced scope of U.S. operations in Afghanistan and Iraq, has produced relatively flat global operations and maintenance budgets, which are expected to grow globally by less than one percent through 2018, remaining at $487B.
While the global operations budget is flat, the underlying pattern aligns with broader trends in the total defense budget. The U.S. projected reduction in operations and maintenance shown in Figure 6 is only slightly offset by marginal increases among the other Higher-Income nations, producing a net decline in the Higher-Income
operating and maintenance budgets of $27.9B by 2018. The U.S. reduction in operations and maintenance accounts for 87% of the total reduction in the U.S. 2018 defense budget. This decline is fully offset by increased operating budgets in the more rapidly-growing Lower-Income nations, including projected 2018 increases of $11B by China, $7.8B by Russia, and $3.5B by India. Other Lower-Income nations add $6.2B.
Declining militarization, reduced conventional weapon inventories, and globally flat operations and maintenance budgets—why would these policies be adopted, if the global security situation is becoming more dangerous? One part of the answer is that for most of the world—including the Top 50 defense spenders—the security situation has actually been improving since the turn of the 21st century.
Chronic, Concentrated ViolenceArmed conflict—battle or terrorism—is a costly and highly-visible indicator of the global defense environment. While the human toll inflicted by battle and terrorism is shocking and excessive, the global increase in deaths from battle and terrorism has been largely confined to a small
Figure 6: Changes in global operations and maintenance budgets10
0B
$50B
$25B
$450B
$475B
$500B
2014 GlobalO&M budget
US budget decrease
$487.1B $487.7B-$31.2$B
$3.3B
$22.3B$6.2B
< 0.01%
+ $0.6B
Other Higher-Incometop 50 countries increase
China, Russia, andIndia increase
All other countries increase 2018 GlobalO&M budget
Net decrease-$27.9B
Net increase$28.5B
$11B China increase$7.8B Russia increase$3.5B India increase
Global Defense Outlook 2015 Defense and Development 11
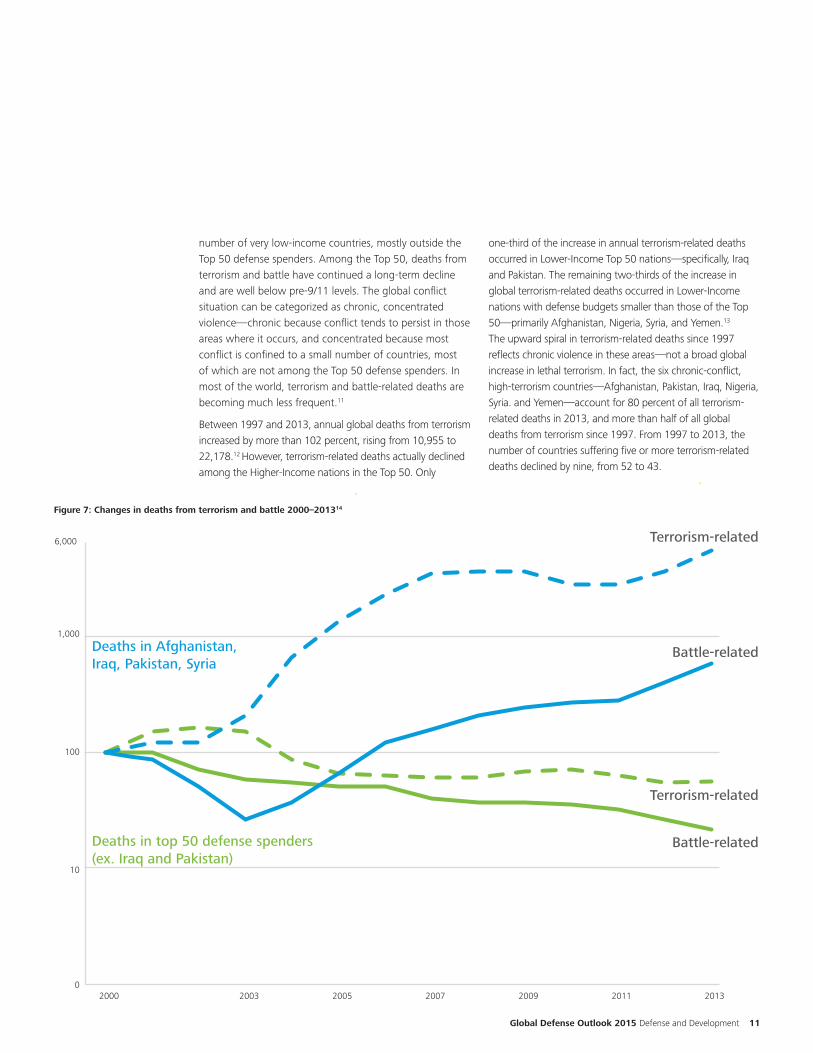
number of very low-income countries, mostly outside the Top 50 defense spenders. Among the Top 50, deaths from terrorism and battle have continued a long-term decline and are well below pre-9/11 levels. The global conflict situation can be categorized as chronic, concentrated violence—chronic because conflict tends to persist in those areas where it occurs, and concentrated because most conflict is confined to a small number of countries, most of which are not among the Top 50 defense spenders. In most of the world, terrorism and battle-related deaths are becoming much less frequent.11
Between 1997 and 2013, annual global deaths from terrorism increased by more than 102 percent, rising from 10,955 to 22,178.12 However, terrorism-related deaths actually declined among the Higher-Income nations in the Top 50. Only
one-third of the increase in annual terrorism-related deaths occurred in Lower-Income Top 50 nations—specifically, Iraq and Pakistan. The remaining two-thirds of the increase in global terrorism-related deaths occurred in Lower-Income nations with defense budgets smaller than those of the Top 50—primarily Afghanistan, Nigeria, Syria, and Yemen.13
The upward spiral in terrorism-related deaths since 1997 reflects chronic violence in these areas—not a broad global increase in lethal terrorism. In fact, the six chronic-conflict, high-terrorism countries—Afghanistan, Pakistan, Iraq, Nigeria, Syria. and Yemen—account for 80 percent of all terrorism-related deaths in 2013, and more than half of all global deaths from terrorism since 1997. From 1997 to 2013, the number of countries suffering five or more terrorism-related deaths declined by nine, from 52 to 43.
Figure 7: Changes in deaths from terrorism and battle 2000–201314
0
10
100
1,000
2000 2003 2005 2007 2009 2011 2013
6,000
Battle-related
Terrorism-related
Deaths in top 50 defense spenders (ex. Iraq and Pakistan)
Battle-related
Terrorism-related
Deaths in Afghanistan, Iraq, Pakistan, Syria
1212
While the total number of terrorist incidents has increased, rising from 3,204 in 1997 to 11,952 in 2013 (273 percent), the lethality of terrorist incidents has declined by 46 percent, from 3.4 killed per incident in 1997 to 1.8 in 2013.15 Terrorism has become more geographically concentrated and more frequent, but also less lethal.
Battle-related deaths have followed a similar pattern. Between 1997 and 2013, battle-related deaths totaled 538,200 worldwide, of which fewer than three percent were suffered by Higher-Income Top 50 nations.16 In 2013, 87 percent of worldwide battle-related deaths were incurred by seven low-income nations—Syria, Afghanistan, Iraq, Pakistan, Nigeria, Congo, and South Sudan. Since 1997, annual battle-related deaths worldwide have increased by 18 percent, with all of the increase accounted for by low-income nations outside the Top 50.
For the Top 50 defense spenders, terrorism and battle-related deaths are infrequent, and have declined well below their 1997 levels. In the few low-income states where chronic violence has persisted, both terrorist-related and battle-related deaths have increased. In 2015, the global centers of violence remain Afghanistan, Pakistan, Iraq, and Syria.
Widening cyber risk gapWhile the Top 50 face declining risks from terrorism and battle-related deaths, the vulnerability of the Higher-Income Top 50 to cyber-based attacks appears to be increasing.
Estimating the actual number or frequency of “cyberattacks” is challenging, because no consistent definition of cyberattacks is in wide use, and because public data on incidents which might be categorized as cyberattacks is anecdotal and unreliable. While the Top 50 defense spenders acknowledge the existence of cyber-related defense programs, the budgets, objectives, organizations, and operations related to these programs are not fully disclosed.
However, public data on the reliance of national economies on Internet-related communications is widely available. Estimating and comparing the changing reliance of the Top 50 nations on these technologies permits a rough assessment of the vulnerability of the Top 50 to cyber-related attacks. Deloitte used historical data from
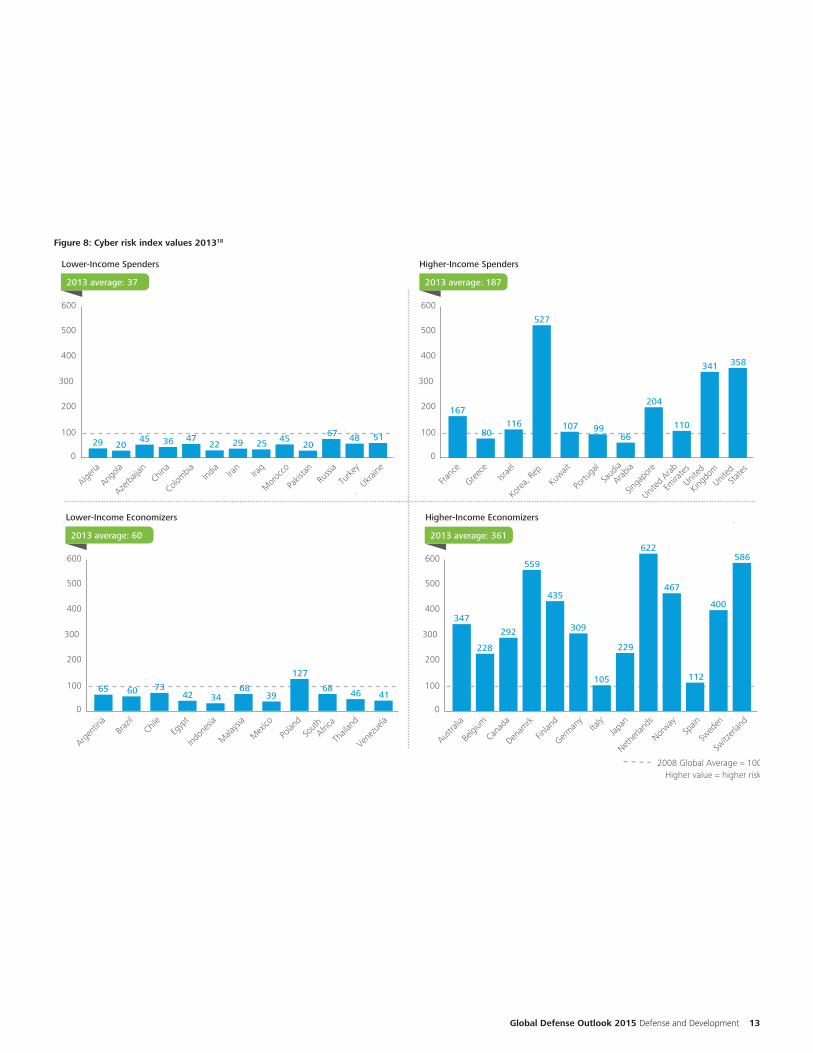
the International Monetary Fund World Development Indicators to develop a Cyber Risk Index using each nation’s rate of mobile cell subscribers, number of secure Internet servers, fixed broadband subscribers, and rate of Internet use.17 While the index does not include key aspects of national vulnerability and risk, including (for example) the level of security and countermeasures in place, the number of military and government systems exposed to the Internet, and many other useful variables, the index provides a straightforward, publicly-verifiable basis for rough comparison of changing national vulnerability over time. The Cyber Risk Index assigns a value of 100 to the 2008 average total score across the entire Top 50 as the baseline for comparison (see Figure 8).
The highest level of cyber-related risk is associated with the Higher-Income Economizers, with Netherlands, Switzerland, and Denmark identified as the three highest-risk nations. The Lower-Income nations within the Top 50 have far lower levels of vulnerability, with scores a full order of magnitude lower than the Higher-Income nations.
The wide gap in vulnerability between Higher-Income nations—where defense budgets are flat or declining—and Lower-Income nations with rapidly-increasing defense budgets may point toward an emerging defense challenge. For example, South Korea (2013 index score 527), the U.S. (358) and the United Kingdom (344) appear to present far higher vulnerability to cyberattack than India (21), China (36), and Russia (67)—and each of these Lower-Income nations has publicly committed to developing cyber capabilities. The Lower-Income nations may be prepared to behave more aggressively in cyberspace, because their economies appear much less vulnerable to cyberattack than their Higher-Income counterparts.
As the Higher-Income Top 50 countries have grown less exposed to battle-related deaths and terrorism, their vulnerability to cyberattack appears far greater than that of the Lower-Income Top 50 and other nations—or nonstate actors—who may be developing offensive cyber capabilities.
Global Defense Outlook 2015 Defense and Development 13
Figure 8: Cyber risk index values 201318
Higher-Income EconomizersLower-Income Economizers
2013 average: 37 2013 average: 187
2013 average: 60
2008 Global Average = 100Higher value = higher risk
2013 average: 361
0
100
200
300
400
600
Austra
lia
347
500
Belgi
um
Canad
a
Finlan
d
German
yJap
an
Netherl
ands
Norway
Spain
Swed
en
Switz
erlan
d
105
229
622
467
112
400
586
435
559
292
228
309
Denam
rkIta
ly
0
100
200
300
400
600
Lower-Income Spenders
Algeria
29
500
Angola
Azerb
aijan
Colombia Ind
iaIra
q
Mor
occo
Pakis
tanRu
ssia
Turke
y
Ukraine
29 25 4520
67 48 5147364520 22
China
Iran
0
100
200
300
400
600
Franc
e
167
500
Greece
Israe
l
Kuwait
Portu
gal
Singa
pore
United
Arab
Emira
tes
United
Kingdo
mUnit
ed
States
66
204
110
341 358
107
527
11680 99
Korea
, Rep
.
Saud
ia
Arabia
Higher-Income Spenders
0
100
200
300
400
600
Argen
tina
65
500
Braz
ilChil
e
Indon
esia
Mala
ysia
Polan
d
Sout
h
Africa
Thail
and
Venez
uela
39
127
68 46 4134427360 68
Egyp
t
Mex
ico
14
Defense policy challenges for government and business
Managing defense relationships in Asia: Institutions versus ad-hocracyViewed in historical perspective, Asia’s share of global defense spending has more than doubled since 1990 (from 10 percent to 26 percent), while Europe’s share has dropped from 44 percent to 24 percent. Rapid economic development continues to drive substantial increases in Asian defense budgets. By 2018, as global defense spending increases by six percent, defense budgets in Asia are projected to grow by over 19 percent to about $612B. In 2018, Asian nations will command more than half of non-US global defense procurement and two-thirds of non-US defense research and development. But these profound shifts in the global quantity and quality of defense resources have not been matched by improvements in the institutions and processes used to manage security challenges, opening the path to misunderstanding, crisis, and conflict.
Unlike the Atlantic community, which has relied on the strong institutional framework of North Atlantic Treaty Organization to coordinate defense policies, manage crises, and set common standards and practices for defense equipment and procedures, Asia lacks broad-based security-management institutions. The Association of Southeast Asian Nations (ASEAN) was not established as a defense community, and its limited ability to coordinate regional defense activities was evident in the response to recent incidents in the South China Sea, the Malaysian Airlines 370 disappearance and Typhoon Haiyan. Japan, China, India, Russia, Pakistan, the U.S., and other key regional players are not full members of ASEAN, further limiting its potential. However, the recently-revitalized ASEAN Defense Minister’s Meeting (ADMM) has begun to work on regional security issues, including potential actions to reduce tensions in the South China Sea, establish direct communications links among defense ministries, and other cooperative measures.19 Competing regional security concepts , including Chinese proposals for regional partnerships and ongoing U.S. efforts to promote bilateral relationships, indicate that broad-based security institutions appear unlikely to emerge in the short term.
In place of regional institutions, Asian nations are pursuing two forms of collaboration—bilateral and issue-specific security agreements to manage the context of defense relationships, and technical collaborations to build national defense-industrial capability. The emerging Sino-Russian
relationship exemplifies the first form of collaboration, while the Japan-Australia relationship exemplifies the second.
The key bilateral collaboration in Asia-Pacific remains the U.S./Japan alliance, which is evolving as Japan re-examines its defense policy and the U.S. retrenches following extended operations in Iraq and Afghanistan. Although the core of the relationship appears sound, policy changes now underway will require years to mature, creating additional uncertainty and security risk across the region.
The emerging Sino-Russian relationship may alter fundamentally the defense landscape in Asia-Pacific, although the scope and depth of this relationship is likely to develop over a long period.
New bilateral collaborations are emerging in response to shifts in US policy and the increasing weight of Chinese defense resources. Australia’s active military diplomacy exemplifies this approach, as Canberra develops new or enhanced relationships with Japan, Indonesia, Myanmar, India, New Zealand, and other defense ministries. Canberra’s efforts are mirrored by other regional powers, such as Bangladesh, which is developing a partnership with Russia focused on submarine technology, and Indonesia, whose bilateral defense relationships now reach to China, Canada, Russia, and Myanmar as well as Australia.
Defense policymakers will need to address the widening gap between Asia’s growing defense resources, and the institutions used to manage the interactions among Asian and other national defense forces.
Responding to the globalizing defense industry: Comparative advantage versus autonomyThe U.S. Defense Secretary has expressed his department’s concern that increased defense budgets in China, India and Russia have eroded the U.S. military-technical advantage, and he therefore requested more funding for advanced research.20 But the worldwide levelling of military technology, as science and engineering capability becomes more diffuse, may have less to do with underfunding in America than with continued economic development. As defense industrial capability develops, government and business leaders will face difficult decisions about which military technologies to produce at home, and which to buy from an increasingly-capable global defense industrial base.
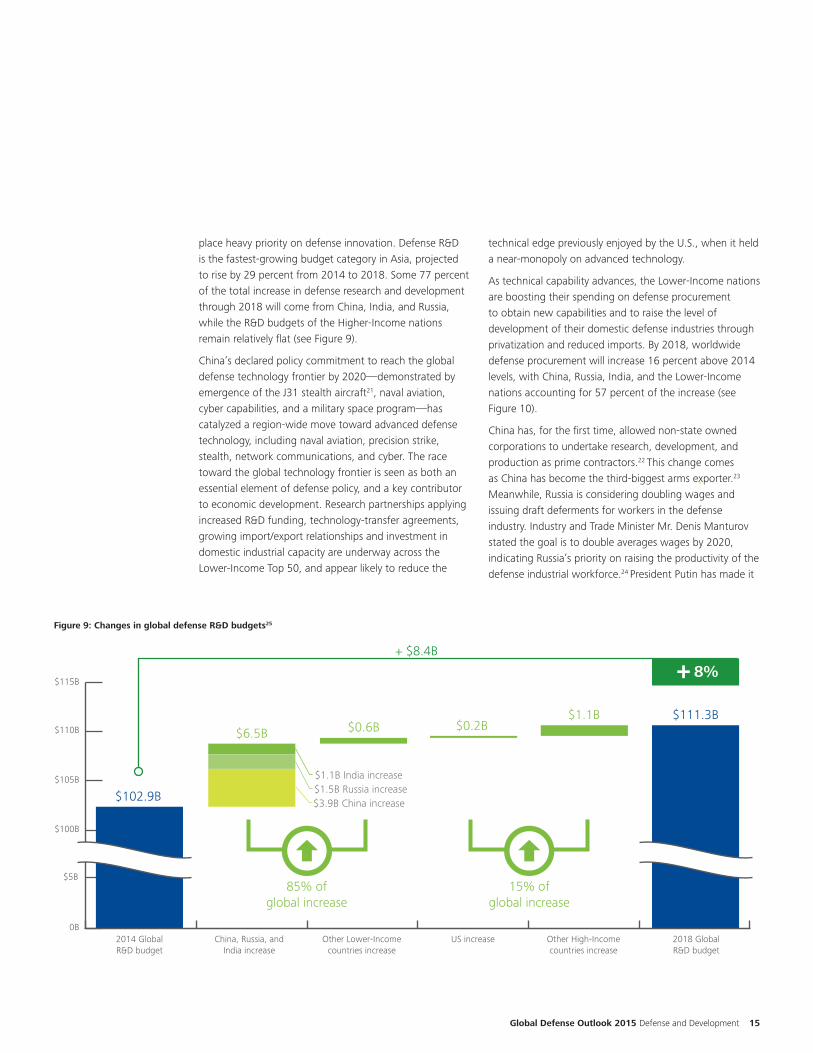
In 2018, the projected U.S. defense R&D budget of $63B will still comprise 58% of the entire global defense R&D budget. However, Asian and other developing nations
Global Defense Outlook 2015 Defense and Development 15
Figure 9: Changes in global defense R&D budgets25
0B
$105B
$5B
$110B
$115B
2014 GlobalR&D budget
China, Russia, andIndia increase
$102.9B
$111.3B$6.5B $0.6B $0.2B
$1.1B
8%+ $8.4B
Other Lower-Incomecountries increase
US increase Other High-Incomecountries increase
2018 GlobalR&D budget
$100B
85% ofglobal increase
15% ofglobal increase
$3.9B China increase$1.5B Russia increase$1.1B India increase
place heavy priority on defense innovation. Defense R&D is the fastest-growing budget category in Asia, projected to rise by 29 percent from 2014 to 2018. Some 77 percent of the total increase in defense research and development through 2018 will come from China, India, and Russia, while the R&D budgets of the Higher-Income nations remain relatively flat (see Figure 9).
China’s declared policy commitment to reach the global defense technology frontier by 2020—demonstrated by emergence of the J31 stealth aircraft21, naval aviation, cyber capabilities, and a military space program—has catalyzed a region-wide move toward advanced defense technology, including naval aviation, precision strike, stealth, network communications, and cyber. The race toward the global technology frontier is seen as both an essential element of defense policy, and a key contributor to economic development. Research partnerships applying increased R&D funding, technology-transfer agreements, growing import/export relationships and investment in domestic industrial capacity are underway across the Lower-Income Top 50, and appear likely to reduce the
technical edge previously enjoyed by the U.S., when it held a near-monopoly on advanced technology.
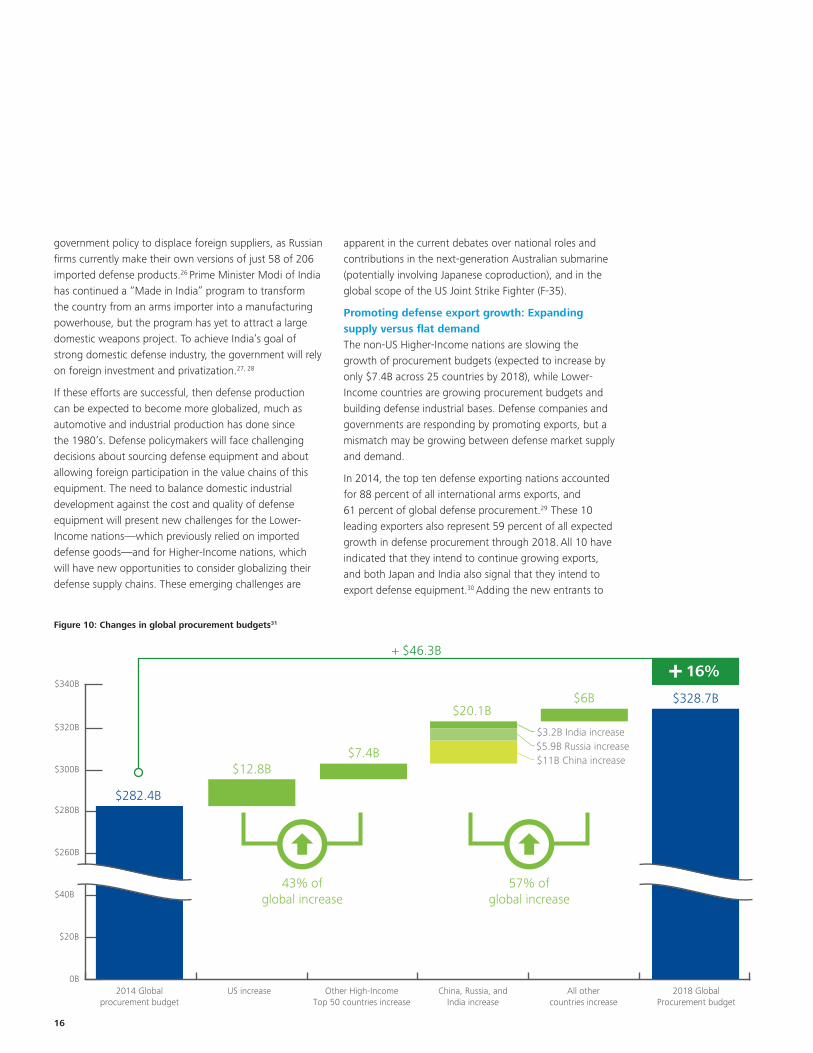
As technical capability advances, the Lower-Income nations are boosting their spending on defense procurement to obtain new capabilities and to raise the level of development of their domestic defense industries through privatization and reduced imports. By 2018, worldwide defense procurement will increase 16 percent above 2014 levels, with China, Russia, India, and the Lower-Income nations accounting for 57 percent of the increase (see Figure 10).
China has, for the first time, allowed non-state owned corporations to undertake research, development, and production as prime contractors.22 This change comes as China has become the third-biggest arms exporter.23 Meanwhile, Russia is considering doubling wages and issuing draft deferments for workers in the defense industry. Industry and Trade Minister Mr. Denis Manturov stated the goal is to double averages wages by 2020, indicating Russia’s priority on raising the productivity of the defense industrial workforce.24 President Putin has made it
16
government policy to displace foreign suppliers, as Russian firms currently make their own versions of just 58 of 206 imported defense products.26 Prime Minister Modi of India has continued a “Made in India” program to transform the country from an arms importer into a manufacturing powerhouse, but the program has yet to attract a large domestic weapons project. To achieve India’s goal of strong domestic defense industry, the government will rely on foreign investment and privatization.27, 28
If these efforts are successful, then defense production can be expected to become more globalized, much as automotive and industrial production has done since the 1980’s. Defense policymakers will face challenging decisions about sourcing defense equipment and about allowing foreign participation in the value chains of this equipment. The need to balance domestic industrial development against the cost and quality of defense equipment will present new challenges for the Lower-Income nations—which previously relied on imported defense goods—and for Higher-Income nations, which will have new opportunities to consider globalizing their defense supply chains. These emerging challenges are
apparent in the current debates over national roles and contributions in the next-generation Australian submarine (potentially involving Japanese coproduction), and in the global scope of the US Joint Strike Fighter (F-35).
Promoting defense export growth: Expanding supply versus flat demandThe non-US Higher-Income nations are slowing the growth of procurement budgets (expected to increase by only $7.4B across 25 countries by 2018), while Lower-Income countries are growing procurement budgets and building defense industrial bases. Defense companies and governments are responding by promoting exports, but a mismatch may be growing between defense market supply and demand.
In 2014, the top ten defense exporting nations accounted for 88 percent of all international arms exports, and 61 percent of global defense procurement.29 These 10 leading exporters also represent 59 percent of all expected growth in defense procurement through 2018. All 10 have indicated that they intend to continue growing exports, and both Japan and India also signal that they intend to export defense equipment.30 Adding the new entrants to
Figure 10: Changes in global procurement budgets31
0B
$280B
$20B
$300B
$320B
$340B
2014 Globalprocurement budget
US increase
$282.4B
$328.7B
$12.8B$7.4B
$20.1B$6B
16%+ $46.3B
Other High-IncomeTop 50 countries increase
China, Russia, andIndia increase
All othercountries increase
2018 GlobalProcurement budget
57% ofglobal increase
43% ofglobal increase
$260B
$40B
$11B China increase$5.9B Russia increase$3.2B India increase
Global Defense Outlook 2015 Defense and Development 17
the established ten export leaders accounts for 70 percent of global defense procurement in 2018.
But the export leaders are unlikely to increase exports by selling to the other top exporting countries. For example, 50 percent of Russian weapons exports currently go to India and China, which have adopted new policies to reduce imports and grow exports of their own products.32 The largest US export customers are Korea, UAE, and Australia, accounting for 25 percent of total U.S. exports, and the U.S. does not export to Russia or China. To expand exports, the leading countries and new entrants will need to sell to countries outside the group of 12 leaders.
After excluding the top 12 leading exporters and new entrants, there remain 79 nations with reported defense procurement budgets.33 Of these, 68 project total procurement budgets of less than $2B in 2018 and only three—South Korea, Saudi Arabia, and Australia—have procurement budgets greater than $5B. Across the set of 79 potential growth markets, total defense procurement is projected to total $93B in 2018, growing by only $7B from 2014 levels. Even if all of this projected growth is captured by export sales from the 12 leaders, total national shares of this procurement growth would average less than $600M per country. But the actual share is likely to be far less, because the three large markets are already heavily influenced by U.S. defense systems, and because the small markets are also aligned with existing export partners, creating high barriers for new entrants.
For defense companies in countries intending to grow exports, this means that realistic demand projections must take into account the relatively small size and limited growth potential of new markets, and the reality of high barriers to entry created by incumbent weapons suppliers and their respective national governments. For defense ministries, the realities of the global export market suggest caution when sizing or budgeting acquisition programs if significant volumes are assumed to come from exports. Flat procurement markets at home will not necessarily be eased by finding new overseas markets for defense equipment.
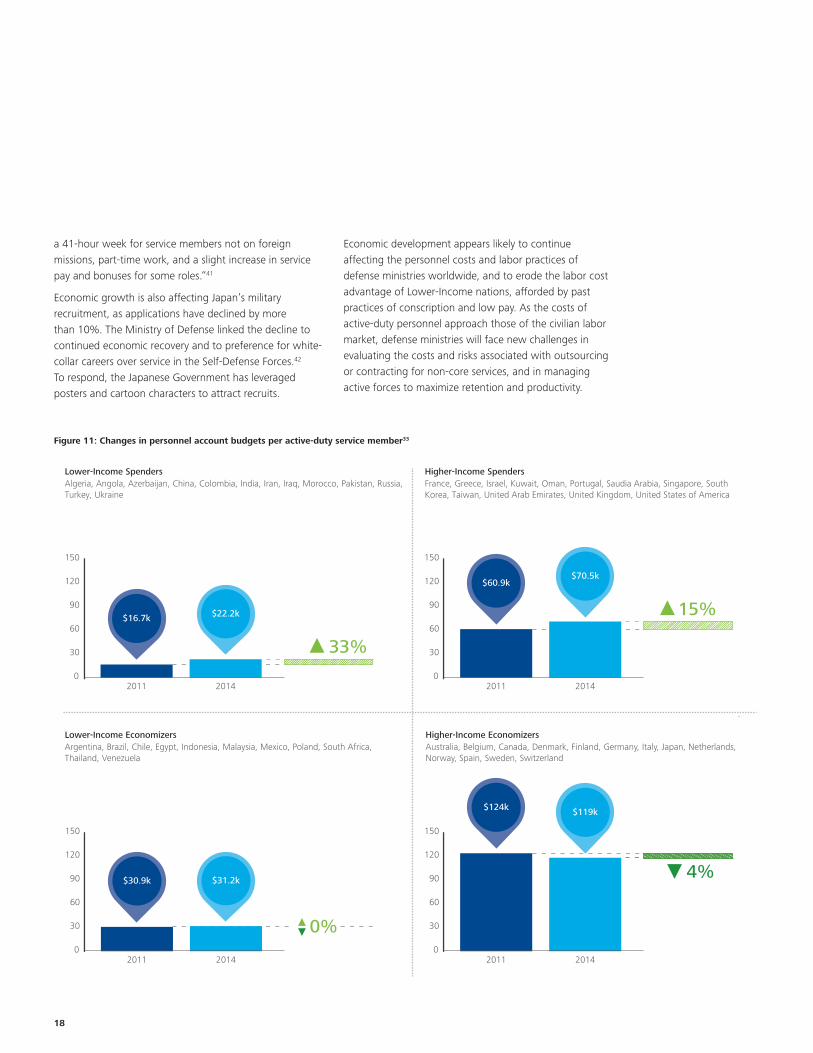
Managing the rising cost of military compensation: Cost versus productivityAccelerating economic development has created new challenges for defense ministries struggling to recruit and retain the quantity and quality of personnel required to operate increasingly-sophisticated defense equipment. Lower- Income countries attempting to professionalize
their forces are considering whether to re-instate conscription or to incentive military service when other, more lucrative options are available in the private sector. Higher-Income nations with established policies of volunteer service are exploring new approaches to incentivize military service—including promises of better working conditions and increased long-term personal financial benefits. Nations in all four budget profiles are addressing the new reality that the skills required for successful military service increasingly mirror skills which are in high demand in more lucrative civilian occupations.
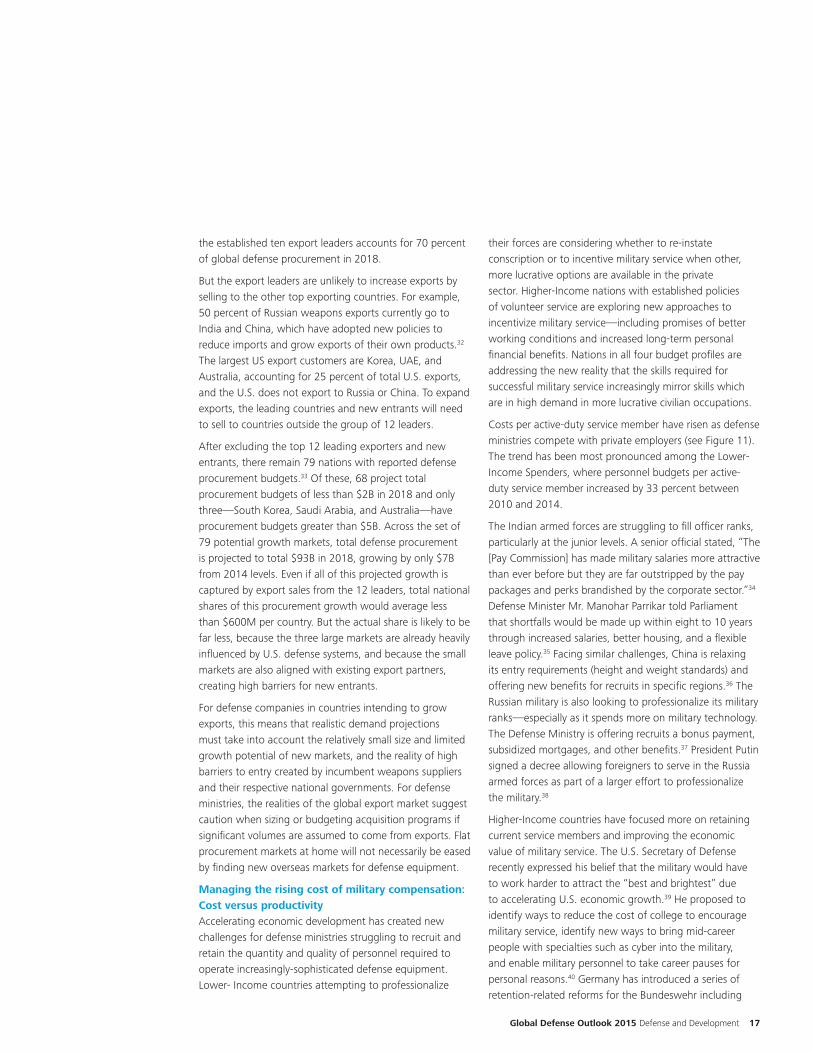
Costs per active-duty service member have risen as defense ministries compete with private employers (see Figure 11). The trend has been most pronounced among the Lower-Income Spenders, where personnel budgets per active-duty service member increased by 33 percent between 2010 and 2014.
The Indian armed forces are struggling to fill officer ranks, particularly at the junior levels. A senior official stated, “The [Pay Commission] has made military salaries more attractive than ever before but they are far outstripped by the pay packages and perks brandished by the corporate sector.”34 Defense Minister Mr. Manohar Parrikar told Parliament that shortfalls would be made up within eight to 10 years through increased salaries, better housing, and a flexible leave policy.35 Facing similar challenges, China is relaxing its entry requirements (height and weight standards) and offering new benefits for recruits in specific regions.36 The Russian military is also looking to professionalize its military ranks—especially as it spends more on military technology. The Defense Ministry is offering recruits a bonus payment, subsidized mortgages, and other benefits.37 President Putin signed a decree allowing foreigners to serve in the Russia armed forces as part of a larger effort to professionalize the military.38
Higher-Income countries have focused more on retaining current service members and improving the economic value of military service. The U.S. Secretary of Defense recently expressed his belief that the military would have to work harder to attract the “best and brightest” due to accelerating U.S. economic growth.39 He proposed to identify ways to reduce the cost of college to encourage military service, identify new ways to bring mid-career people with specialties such as cyber into the military, and enable military personnel to take career pauses for personal reasons.40 Germany has introduced a series of retention-related reforms for the Bundeswehr including
18
a 41-hour week for service members not on foreign missions, part-time work, and a slight increase in service pay and bonuses for some roles.“41
Economic growth is also affecting Japan’s military recruitment, as applications have declined by more than 10%. The Ministry of Defense linked the decline to continued economic recovery and to preference for white-collar careers over service in the Self-Defense Forces.42 To respond, the Japanese Government has leveraged posters and cartoon characters to attract recruits.
Economic development appears likely to continue affecting the personnel costs and labor practices of defense ministries worldwide, and to erode the labor cost advantage of Lower-Income nations, afforded by past practices of conscription and low pay. As the costs of active-duty personnel approach those of the civilian labor market, defense ministries will face new challenges in evaluating the costs and risks associated with outsourcing or contracting for non-core services, and in managing active forces to maximize retention and productivity.
Figure 11: Changes in personnel account budgets per active-duty service member33
0
30
60
90
120
150
2011 2014
33%
4.8%
–2013
Higher-Income EconomizersAustralia, Belgium, Canada, Denmark, Finland, Germany, Italy, Japan, Netherlands, Norway, Spain, Sweden, Switzerland
Lower-Income EconomizersArgentina, Brazil, Chile, Egypt, Indonesia, Malaysia, Mexico, Poland, South Africa, Thailand, Venezuela
Lower-Income SpendersAlgeria, Angola, Azerbaijan, China, Colombia, India, Iran, Iraq, Morocco, Pakistan, Russia, Turkey, Ukraine
Higher-Income SpendersFrance, Greece, Israel, Kuwait, Oman, Portugal, Saudia Arabia, Singapore, South Korea, Taiwan, United Arab Emirates, United Kingdom, United States of America
$22.2k$16.7k
0
30
60
90
120
150
2011 2014
$31.2k$30.9k
0%
0
30
60
90
120
150
2011 2014
$70.5k$60.9k
0
30
60
90
120
150
2011 2014
$119k$124k
15%
4%
Global Defense Outlook 2015 Defense and Development 19
Defense and development
Rapid and extended economic growth in Asia, falling levels of military violence among the largest defense spenders, and increasingly sophisticated military technology—including traditional military systems and emerging cyber capabilities—are transforming the global defense landscape. Development is pushing aside the long-standing U.S. preponderance in defense, and presenting a fundamentally different reality, in which military-technical capabilities, personnel costs and defense industrial bases converge toward global parity.
The emergence of new vulnerability to cyber threats—most pronounced among the Higher-Income nations—and the absence of reliable security-management institutions in Asia, present significant new challenges for defense policymakers and industry leaders. How the world copes with these challenges appears likely to shape the course and outcome of the years ahead.

20
Global Defense Outlook 2015 Defense and Development 21
Contributors
AustraliaPeter Bars+61 3 9671 7201 [email protected]
Andrew Johnstone-Burt+61 2 9322 7525 ajohnstoneburt@ deloitte.com.au
BelgiumChristian Combes + 32 2 749 58 58 [email protected]
Chris Verdonck + 32 2 800 24 20 [email protected]
CanadaPaul Macmillan +1 416 874 4203 [email protected]
Charles Perron +1 613 751 5243 [email protected]
DenmarkGustav Jeppesen+45 22 20 22 08 [email protected]
Thomas Riisom+45 30 93 43 89 [email protected]
FinlandMarkus Kaihoniemi+35 82 0755 5370 [email protected]
FranceJulien Baviera+33 1 55 61 62 76 [email protected]
Joel Elkaim +33 1 55 61 69 45 [email protected]
GermanyThomas Beyer+49 71 116554 7085 [email protected]
Peter Kestner+49 89 29036 8064 [email protected]
ItalyGianluca Di Cicco +39 06 4780 5548 [email protected]
JapanJack Midgley+81 80 9354 4502 [email protected]
Yoshiaki Takahashi+81 80 4367 6841 yotakahashi@ tohmatsu.co.jp
NetherlandsFrank Nan+31 88 288 2002 [email protected]
New ZealandDavid Lovatt+64 4 470 3690 [email protected]
NorwayAnne Cathrin Haueng+47 23 27 93 93 [email protected]
Rune Raknes+47 23 27 97 60 [email protected]
PolandDariusz Kraszewski+48 22 511 0633 dkraszewski@ deloittece.com
RussiaSergey Dubovik +77 17 258 0480 [email protected]
Anastasia Osipova+74 95 787 0600 [email protected]
South AfricaNkululeko Oliphant +27 11 517 4236 [email protected]
SpainFernando Picatoste +34 91 443 2661 [email protected]
United KingdomDuncan Farrow-Smith+44 20 7303 7296 dfarrowsmith@ deloitte.co.uk
Philip Sandford+44 20 7303 7726 [email protected]
United StatesTom Captain+1 206 716 6452 [email protected]
John Powers+1 973 602 5555 [email protected]
Harry Raduege+1 571 882 7300 [email protected]
Chuck Wald+1 571 882 7800 [email protected]
This report was researched and prepared by a global team of Deloitte professionals including Benjamin Braun, Nick Donald, Teri Fleming, Maciej Klimek, Melissa Lewry, Joseph M. Moyer, Jaimik Patel, Sammy Schatz, and Bobby Strauss.
22
Endnotes
1. “World Development Indicators,” World Bank, accessed March 11, 2015, http://data.worldbank.org/indicator/all; Deloitte Analysis.
2. “Jane’s Defense Budgets,” IHS Jane’s, accessed March 11, 2015, https://janes.ihs.com/CustomPages/Janes/Home.aspx; Deloitte Analysis.
3. Id.
4. Id.
5. “World Economic Outlook Database,” International Monetary Fund, accessed March 11, 2015, http://www.imf.org/external/pubs/ft/weo/2014/02/weodata/index.aspx (Nominal GDP data); “Jane’s Defense Budgets,” IHS Jane’s, accessed March 11, 2015, https://janes.ihs.com/CustomPages/Janes/Home.aspx; “World Development Indicators,” World Bank, accessed March 11, 2015, http://data.worldbank.org/indicator/all (Pakistan GDP data unavailable through IMF database); Deloitte Analysis.(Formula: [GDP/capita: nominal GDP / total population]; [GDP growth: 2014 to 2018 nominal GDP CAGR]; [Defense % GDP: 2014 nominal defense topline spending / 2014 nominal GDP in USD]; [Defense budget CAGR: 2014 to 2018 nominal defense topline CAGR])
6. “World Economic Outlook Database,” International Monetary Fund, accessed March 11, 2015, http://www.imf.org/external/pubs/ft/weo/2014/02/weodata/index.aspx; “Jane’s Defense Budgets,” IHS Jane’s, accessed March 11, 2015, https://janes.ihs.com/CustomPages/Janes/Home.aspx; Deloitte Analysis. (Definition: 2014 GDP calculated based on purchasing-power-parity (PPP) valuation of national GDP at current international dollar).
7. Nikolai Novichkov, “Update: Russia to Develop New Defense Plan for 2016 – 2020 by End of the Year,” Jane’s Defence Weekly, January 8, 2015, accessed April 21, 2015, http://www.janes.com/article/47784/update-russia-to-develop-new-defence-plan-for-2016-2020-by-end-of-the-year.
8. “World Economic Outlook Database,” International Monetary Fund, accessed March 11, 2015, http://www.imf.org/external/pubs/ft/weo/2014/02/weodata/index.aspx; “Jane’s Defense Budgets,” IHS Jane’s, accessed March 11, 2015, https://janes.ihs.com/CustomPages/Janes/Home.aspx; “World Development Indicators,” World Bank, accessed March 11, 2015, http://data.worldbank.org/indicator/all; Deloitte Analysis. (Formula: [Defense Share of GDP: 1990 versus 2012 defense percent share of GDP in 2005 USD]; [Defense Share of labor force: 1990 versus 2012 percent of labor force engaged in military activities]; [Defense shares of GGX: Average nominal defense spending in USD / nominal GGX in USD]).
9. “IISS Military Balance,” IISS, accessed March 11, 2015, https://www.iiss.org; Deloitte Analysis. (Formula: Percentage change for each Defense Budget Profile between 2010 and 2014 for Active Forces, Main Battle Tanks, Principal Surface Combatants, and Manned Aircraft).
10. “Jane’s Defense Budgets,” IHS Jane’s, accessed March 11, 2015, https://janes.ihs.com/CustomPages/Janes/Home.aspx; Deloitte Analysis. (Definition: Budget data documented in nominal USD $B).
11. The long-term global trend toward lower levels of violence is explored in Steven Pinker, The Better Angels of Our Nature: Why Violence Has Declined (Penguin Books, 2012).
12. “World Development Indicators,” World Bank, accessed March 11, 2015, http://data.worldbank.org/indicator/SP.POP.TOTL (total population defined as all residents regardless of legal status or citizenship except refugees); “UCDP Battle-Related Deaths Dataset v.5-2014m” Uppsala University, accessed March 11, 2015, http://www.pcr.uu.se/research/ucdp/datasets/ucdp_battle-related_deaths_dataset (Battle-related deaths defined as use of armed force between two forces (state or non-state) resulting in death); “Updated Statistical Analysis of Documentation of Killings in the Syrian Arab Republic,” Office of the United Nations High Commissioner for Human Rights, accessed March 11, 2015, http://www.ohchr.org/Documents/Countries/SY/HRDAGUpdatedReportAug2014.pdf; “UN Decides to
Stop Updating Syria Death Toll,” accessed March 11, 2015, http://www.nytimes.com/aponline/2014/01/07/world/europe/ap-eu-un-syria.html?_r=1 (UN stopped updating Syria death toll on January 7, 2015); “Global Terrorism Database (GTD),” University of Maryland (UMD), accessed March 11, 2015, http://www.start.umd.edu/gtd (Terrorist acts defined as acts aimed at (1) attaining a political, economic, religious, or social goal, (2) evidence of intention to coerce, intimidate, or convey some other message to a larger audience than immediate victims, and (3) outside of the context of legitimate warfare activities); Deloitte Analysis. (Formula: 1997 used as constant denominator; numerator calculated as trailing 3-year average for each index value; 2000 set as base value 100).
13. Id.
14. Id.
15. Id.
16. “UCDP Battle-Related Deaths Dataset v.5-2014m” Uppsala University, accessed March 11, 2015, http://www.pcr.uu.se/research/ucdp/datasets/ucdp_battle-related_deaths_dataset (Battle-related deaths defined as use of armed force between two forces (state or non-state) resulting in death).
17. “World Development Indicators,” World Bank, accessed March 11, 2015, http://data.worldbank.org/indicator/all; Deloitte Analysis. (Formula: Secure Internet Servers, Fixed Broadcast Subscriptions; Mobile Cell Subscriptions, and Internet Users for 2008 and 2013; 2008 global average set at 100).
18. Id.
19. “ASEAN Defence Ministers Chart the Future of Defence Cooperation towards ASEAN Community 2015,” ASEAN Defence Ministers’ Meeting, May 22, 2014, accessed April 21, 2015, https://admm.asean.org/index.php/admm-news/7-news/336-asean-defence-ministers-chart-the-future-of-defence-cooperation-towards-asean-community-2015.html.
20. “Secretary of Defense Ash Carter Submitted Statement to the Senate Armed Services Committee on the FY 2016 Budget Request for the Department of Defense,” Department of Defense, accessed April 21, 2015, http://www.defenseinnovationmarketplace.mil/resources/20150303SenateArmedServicesCommitteeSECDEFBudgetTestimony.pdf.
21. Wendell Minnick, “China Plans to Export J-31 Stealth Fighter,” Defense News, November 10, 2014, accessed April 25, 2015, http://www.defensenews.com/article/20141110/DEFREG03/311100019.
22. Jon Grevatt, “China allows private sector to bid for military training contracts,” Jane’s Defence Industry, November 25, 2014, accessed April 21, 2015, http://www.janes.com/article/46310/china-allows-private-sector-to-bid-for-military-training-contracts.
23. “China now world’s third-biggest arms exporter,” Deutsche Welle, March 3, 2015, accessed April 21, 2015, http://www.dw.de/china-now-worlds-third-biggest-arms-exporter/a-18317829.
24. Matthew Bodner, “Russians Could Be Offered Draft Deferments for Defense Industry Work,” The Moscow Times, March 10, 2015, accessed April 21, 2015, http://www.themoscowtimes.com/business/article/russians-could-be-offered-draft-deferments-for-defense-industry-work/517262.html.
25. “Jane’s Defense Budgets,” IHS Jane’s, accessed March 11, 2015, https://janes.ihs.com/CustomPages/Janes/Home.aspx; Deloitte Analysis. (Definition: Budget data documented in nominal USD $B).
26. Matthew Bodner, “Putin Urges Rapid Switch to Domestic Production in Defense Industry,” The Moscow Times, July 28, 2014, accessed April 21, 2015, http://www.themoscowtimes.com/business/article/putin-urges-rapid-switch-to-domestic-production-in-defense-industry/504174.html.
Global Defense Outlook 2015 Defense and Development 23
27. “India Envisages Arms Exports to 38 Countries,” Sputnik News, March 23, 2015, accessed April 21, 2015, http://sputniknews.com/asia/20150323/1019873689.html.
28. “Government aims for more privatization for defence sector,” Daily News and Analysis, March 22, 2015, accessed April 21, 2015, http://www.dnaindia.com/india/report-government-aims-for-more-privatisation-for-defence-sector-2070914.
29. “SIPRI Recent Trends in Arms Transfers,” SIPRI, accessed April 21, 2015, http://www.sipri.org/research/armaments/transfers/measuring/recent-trends-in-arms-transfers; Deloitte Analysis (The Top 10 weapons exporters in 2010 - 2014 were the United States, Russia, China, Germany, France, United Kingdom, Spain, Ukraine, Italy and Israel).
30. Kyle Mizokami, “Japan’s Emerging Defense Export Industry,” United States Naval Institute, February 23, 2015, accessed April 21, 2015, http://news.usni.org/2015/02/23/japans-emerging-defense-export-industry.
31. “Jane’s Defense Budgets,” IHS Jane’s, accessed March 11, 2015, https://janes.ihs.com/CustomPages/Janes/Home.aspx; Deloitte Analysis. (Definition: Budget data documented in nominal USD $B).
32. “SIPRI Recent Trends in Arms Transfers,” SIPRI, accessed April 21, 2015, http://www.sipri.org/research/armaments/transfers/measuring/recent-trends-in-arms-transfers; Deloitte Analysis.
33. “Jane’s Defense Budgets,” IHS Jane’s, accessed March 11, 2015, https://janes.ihs.com/CustomPages/Janes/Home.aspx; “IISS Military Balance,” IISS, accessed March 11, 2015, https://www.iiss.org; Deloitte Analysis. (Definition: 2011 and 2014 active duty Army, Navy, Air Force, and non-SOF personnel; 2011 and 2014 MILPERS spending in nominal USD) (Formula: average MILPERS spending / Active Duty Personnel for each Defense Budget Profile).
34. Rajat Pandit, “Forces battle shortage of ‘fighting rank’ officers,” Times of India, December 1, 2014, accessed April 21, 2015, http://timesofindia.indiatimes.com/india/Forces-battle-shortage-of-fighting-rank-officers/articleshow/45329628.cms.
35. Rahul Bedi, “India still faces massive recruitment shortfall,” Jane’s Defence Weekly, March 23, 2015, accessed April 21, 2015, http://www.janes.com/article/50146/india-still-faces-massive-recruitment-shortfall.
36. Melissa Hellmann, “China’s Military Reduces Requirements to Allow Shorter, Wider Recruits,” Time, June 17, 2014, accessed April 21, 2015, http://time.com/2889121/chinas-military-reduces-requirements-to-allow-shorter-wider-recruits.
37. Alexander Bratersky, “Emboldened by Crimean Takeover, Russia’s Army Goes On A Recruiting Spree,” International Business Times, May 28, 2014, accessed April 21, 2015, http://www.ibtimes.com/emboldened-crimean-takeover-russias-army-goes-recruiting-spree-1590840.
38. Laurence Peter, “Russia to hire more foreign troops in forces shake-up,” BBC, January 5, 2015, accessed April 21, 2015, http://www.bbc.com/news/world-europe-30682465.
39. “Remarks by Secretary Carter on the Force of the Future,” U.S. Department of Defense, accessed April 21, 2015, http://www.defense.gov/Speeches/Speech.aspx?SpeechID=1927.
40. Id.
41. Nina Werkhäuser, “Bundeswehr seeks makeover as attractive employer,” Deutsche Welle, January 2, 2015, accessed April 21, 2015, http://www.dw.de/bundeswehr-seeks-makeover-as-attractive-employer/a-18228286.
42. Julian Ryall, “Japanese military hit by a fall in recruitment of more than 10 per cent,” South China Morning Post, November 22, 2014, accessed April 21, 2015, http://www.scmp.com/news/asia/article/1645769/japanese-military-hit-fall-recruitment-more-10-cent.
www.deloitte.com/federal
Find us on Facebook at www.facebook.com/DeloitteGov
Follow us on Twitter @DeloitteGov
Deloitte refers to one or more of Deloitte Touche Tohmatsu Limited, a UK private company limited by guarantee (“DTTL”), its network of member firms, and their related entities. DTTL and each of its member firms are legally separate and independent entities. DTTL (also referred to as “Deloitte Global”) does not provide services to clients. Please see www.deloitte.com/about for a detailed description of DTTL and its member firms. Please see www.deloitte.com/us/about for a detailed description of the legal structure of Deloitte LLP and its subsidiaries. Certain services may not be available to attest clients under the rules and regulations of public accounting.
This publication contains general information only and Deloitte is not, by means of this publication, rendering accounting, business, financial, investment, legal, tax, or other professional advice or services. This publication is not a substitute for such professional advice or services, nor should it be used as a basis for any decision or action that may affect your business. Before making any decision or taking any action that may affect your business, you should consult a qualified professional advisor. Deloitte shall not be responsible for any loss sustained by any person who relies on this publication.
Copyright © 2015 Deloitte Development LLC. All rights reserved.


