Policy Research Working Paper 7875 Global Migration of Talent and Tax Incentives Evidence from Malaysia’s Returning Expert Program Ximena V. Del Carpio Caglar Ozden Mauro Testaverde Mathis Wagner Development Research Group Trade and International Integration Team November 2016 WPS7875 Public Disclosure Authorized Public Disclosure Authorized Public Disclosure Authorized Public Disclosure Authorized
Transcript
Policy Research Working Paper 7875
Global Migration of Talent and Tax Incentives
Evidence from Malaysia’s Returning Expert Program
Ximena V. Del CarpioCaglar Ozden
Mauro TestaverdeMathis Wagner
Development Research GroupTrade and International Integration TeamNovember 2016
WPS7875P
ublic
Dis
clos
ure
Aut
horiz
edP
ublic
Dis
clos
ure
Aut
horiz
edP
ublic
Dis
clos
ure
Aut
horiz
edP
ublic
Dis
clos
ure
Aut
horiz
ed
Produced by the Research Support Team
Abstract
The Policy Research Working Paper Series disseminates the findings of work in progress to encourage the exchange of ideas about development issues. An objective of the series is to get the findings out quickly, even if the presentations are less than fully polished. The papers carry the names of the authors and should be cited accordingly. The findings, interpretations, and conclusions expressed in this paper are entirely those of the authors. They do not necessarily represent the views of the International Bank for Reconstruction and Development/World Bank and its affiliated organizations, or those of the Executive Directors of the World Bank or the governments they represent.
Policy Research Working Paper 7875
This paper is a product of the Trade and International Integration Team, Development Research Group. It is part of a larger effort by the World Bank to provide open access to its research and make a contribution to development policy discussions around the world. Policy Research Working Papers are also posted on the Web at http://econ.worldbank.org. The authors may be contacted at [email protected], [email protected], [email protected], and [email protected].
This paper presents the first evidence on the efficacy of a major program designed to encourage the return migra-tion of high-skilled individuals. The Malaysian Returning Expert Program targets high-skilled Malaysians abroad and provides them with tax incentives to return. At several eligibility thresholds, the probability of acceptance into the program increases discontinuously. Using administra-tive data on applicants, the analysis is able to identify the impact of acceptance to the Returning Expert Program on the probability of returning to Malaysia. The fuzzy
regression discontinuity design estimates suggest that program approval increases the return probability by 40 percent for applicants with a preexisting job offer in Malay-sia. There is no significant treatment effect for those who apply without a job offer. The estimated migration elastic-ity with respect to the net-of-tax rate, averaged across all applicants, is 1.2. Fiscal cost-benefit analysis of the Return-ing Expert Program finds a modest net fiscal effect of the program, between minus $6,900 and plus $4,200 per appli-cant, suggesting that the program roughly pays for itself.
Global Migration of Talent and Tax Incentives:
Evidence from Malaysia's Returning Expert Program1
Ximena V. Del Carpio Caglar Ozden Mauro Testaverde Mathis Wagner
World Bank World Bank World Bank Boston College
JEL: F22, J61, J68, O15.
Keywords: High-Skilled Migration, Migration Policies and Jobs, Tax Incentives, Return
Migration, Brain Drain, Brain Circulation
1 This paper was previously circulated under the title “Reversing Brain Drain: Evidence from Malaysia’s Returning Expert Program.” We are grateful to Johan Merican and his team at TalentCorp Malaysia for their support and the Department of Statistics of Malaysia for making labor force data available. We thank Pablo Acosta, Laurent Bouton, Taryn Dinkelman, Kirk Doran, John Gibson, Frederico Gil Sander, David McKenzie, Kevin Lang, Hillel Rapoport and Jan Stuhler for extensive feedback and seminar participants at the ASSA Annual Meetings 2016, Center for Global Development, SGE Annual Conference, Universidad Carlos III de Madrid, University at Buffalo SUNY, World Bank, and 8th Migration and Development Conference. We acknowledge financial support from the Knowledge for Change Program (KCP), the Strategic Research Program (SRP) and the Multidonor Trust Fund for Trade and Development. Contact information: [email protected], [email protected], [email protected], [email protected] (corresponding author).
2
1. Introduction
Highly skilled people are also highly mobile. There were an estimated 45 million tertiary educated
migrants worldwide in 2010, a 75 percent increase over a decade. This is higher than the growth
rate of tertiary educated workers in almost every country in the world. High-income destination
countries depend on foreign talent to sustain their high-tech sectors.2 The other side of the coin is
that the challenge posed by high-skilled migration is particularly acute for poorer sending
countries. The average emigration rate among tertiary educated people is around 15 percent in
middle and low-income countries and the rate reaches 50 percent in many low-income countries.3
High-skilled workers play a critical role for innovation and growth in an economy.4 Hence,
it is unsurprising that the global migration of talent has become a major policy concern, leading to
increased competition among countries to attract and retain them. Central to governments’ efforts
is a proliferation of preferential tax schemes for high-skilled workers.5 High-income OECD
countries couple these tax incentives with generous immigration and citizenship policies. Aware
that it is easier to connect with their existing high-skilled diaspora, lower income countries focus
on ways to entice their return. China, for example, has implemented a range of policy initiatives,
which have arguably been crucial to its progress towards the scientific and technological frontier.6
The prevalence of these tax-based incentive programs raises important questions about
their efficacy. This paper breaks new ground on this issue using quasi-experimental variation
created by the Malaysian Returning Expert Program (REP), which provides tax incentives to
encourage the return of high-skilled Malaysians abroad.
The paper lies at the intersection of two literatures. The first is the growing body of
evidence on how responsive international migration by high-skilled workers is to tax incentives.
2 Arslan et al. (2016). For example, the share of the foreign-born among U.S. STEM workers with PhDs is 54 percent, compared to 16 percent in the total civilian labor force (Hanson and Slaughter 2015). 3 Artuc et al. (2015). 4 Kerr (2013) reviews the evidence and argues, “that immigration has been essential for the United States’ leadership in innovation and entrepreneurship” (p. 23). Peri, Shih and Sparber (2015) find very large positive effects of foreign STEM workers on U.S. wages. The crowding-out effects identified by Borjas and Doran (2012), from an influx of Soviet mathematicians to the US, and Doran, Gelber and Isen (2016), using the H-1B visa lottery, suggest the net gains from high-skilled immigration may be overstated. In contrast, Moser, Voena, and Waldinger (2014) find substantial crowding-in effects from Jewish émigrés from Nazi Germany. 5 A summary of tax incentives is provided by OECD (2011), see also Inland Revenue Service Publication 519, “U.S. Tax Guide for Aliens” and Bertoli et al. (2012) on OECD countries’ immigration rules. Kuptsch and Pang (2006) summarizes evidence from Australia, China, India, Japan, Singapore, UK and US. 6 See The Economist, “Gone but not forgotten” published June 27, 2015. For China see Zweig (2006) and Freeman and Huang (2015). Argentina, Chile, Ghana, Ireland, Israel and Taiwan, China, also have prominent programs.
3
The second centers around the vivid public and academic debate on brain drain, gain and
circulation. Most closely related to this paper is Kleven, Landais, Saez and Schultz (2014) that
evaluates a preferential tax scheme for high-income foreigners and Danish abroad implemented in
Denmark in 1992. Two other papers focus on the impact of taxes in particular markets at the very
top-tail of the talent distribution. Kleven, Landais and Saez (2013) look at the migration of football
players across European clubs, and Akcigit, Baslandze and Stantcheva (2015) at the top 1 percent
of inventors.7 The literature on ‘brain drain’, in contrast, is expansive.8 However, in their
comprehensive review on migration policies that impact development, McKenzie and Yang (2015)
emphasize that there is almost no evidence on the efficacy of potential policies to attract global
talent.
The REP is a particularly interesting program to study that could be readily replicated
elsewhere. Its key features are a 15 percent flat income tax for five years and a tax exemption on
the import of up to two cars.9 The program is successful at attracting applicants from the top-end
of the skill distribution. We estimate that around three-quarters of those who return under REP are
in the top 1 percent of the Malaysian income distribution. It is also a large program. We find that
the annual application rate of high-skilled Malaysian expatriates is around 25 percent of the annual
outflow. Malaysia as a large, developing country that is a major source of high-skilled labor makes
for an excellent case.10 Finally, REP’s focus on expatriates makes it particularly relevant to
countries that hope to benefit from ‘brain circulation’.11
The paper evaluates whether the REP has significant impact on the return decisions of
Malaysians abroad and provides a cost-benefit analysis of the program. To guide our empirical
7 There is also related work on mobility within countries Bakija and Slemrod (2004) and Young and Varner (2011) study the impact of taxes on the mobility of the wealthy in United States, Liebig et al. (2007) looks at Switzerland. Moretti and Wilson (2015) consider the effects of state taxes on the migration of star scientists across US states. 8 Docquier and Rapoport (2011) and Gibson and McKenzie (2011) provide recent literature reviews. Only a handful of high-income countries benefit from a net inflow of highly skilled migrants (notably Australia, Canada, Switzerland, Sweden, the UK and the US) making the loss of relatively scarce human capital a major concern for most countries in the world. 9 The program also offers permanent residency status for a foreign spouse and children of successful applicants. After approval, applicants have a two-year window during which to find a job, return to Malaysia and claim the REP benefits. REP application does not involve a fee but it is time intensive. 10 The fraction of tertiary educated Malaysians abroad was 11.7 percent in 2000, almost exactly at the developing country average (Artuc et al. 2015). 11 Return migrants come back with physical and human capital earned abroad (e.g. Dustmann and Kirchkamp 2002) and may transfer skills and knowledge gained abroad (e.g. Dos Santos and Postel-Vinay 2003), see also Thom (2010). Gibson and McKenzie (2012) provide micro-level evidence on the channels by which high-skilled emigration affects sending countries.
4
analysis, we develop an analytical model that highlights how program design features impact the
selection (on primarily unobserved characteristics) of both REP applicants and eventual returnees,
and have crucial implications for the efficacy of the program. We use administrative data for 2011-
12 provided by TalentCorp Malaysia, the administrator of the REP program, complemented by
labor force data from Malaysia and the foreign countries where the REP applicants were living.
We implement a fuzzy regression discontinuity design to identify the impact of program
approval on the applicant return probability. Identification relies on several thresholds at which
the probability of acceptance to the program increases discontinuously. The key determinant of
eligibility for the REP is whether the applicant has had sufficient employment experience abroad.12
In evaluating applicants TalentCorp uses an (education-dependent) experience abroad threshold at
which the probability of acceptance to the program increases discontinuously by around 50
percentage points. The actual, precise thresholds used by TalentCorp are not public knowledge.
Also, the “holistic’ criteria used by TalentCorp (which are not publicly available either) result in
a large number of applicants being approved despite not strictly meeting the work experience
threshold. We find that these program features generate quasi-experimental variation in the
approval decision process allowing us to use a fuzzy regression discontinuity design to identify
the impact of REP approval on the return decision.
There are two types of applicants for whom we evaluate the program separately. First, there
is a group of applicants that apply after having already received a job offer in Malaysia. TalentCorp
processes applications rapidly, the median decision time is 30 days and 90 percent are processed
in 51 days. As a result, applicants can use REP approval as one factor in deciding whether to accept
their job offer and return to Malaysia. The evidence suggests that the timing of the application
decision is entirely determined by the arrival of a job offer in Malaysia for this group of applicants
(and not by whether they are above or below the eligibility threshold). The number of applicants
is distributed uniformly in a large, several-year window around the threshold. There is also no
evidence of a discontinuity in the observable characteristics of applicants at the threshold. Using
two-stage least squares, we find a local average treatment effect (LATE) of around 40 percentage
12 There are also basic eligibility criteria that have to be met by all applicants. They have to be currently employed abroad, under no legal or financial obligation to return, and have been continuously abroad for the last 3 years.
5
points when we use the full sample without covariates, and the impact is possibly as large as 60 or
70 percentage points.13
A second group of applicants applies to the REP without an existing job offer, even though
benefits are only available if an expatriate returns to Malaysia and finds employment. While there
is no discontinuity in the number of applications at the eligibility threshold, and no sorting on
observable characteristics, the identifying variation is certainly less compelling. The LATE for
this group of applicants is positive but small and never statistically significant.
In order to more broadly compare the magnitude of our treatment effect estimates, we
quantify the benefits provided by the REP expressed as a fraction of income. Our estimate of the
total effective tax subsidy over 5 years is 10.9 percentage points.14 The weighted treatment effect
is an 11-percentage point increase in the return probability for all REP applicants (whether they
have a pre-existing job offer or not). The implied migration elasticity with respect to the net-of-
tax rate is 1.2. This is very similar to the results in Kleven, Landais, Saez and Schultz (2014) who
find a migration elasticity of 1.5 for the Danish tax scheme for foreigners. An important difference
between our findings is that, for Danish expatriates they find an elasticity with respect to the net-
of-tax rate close to zero. This leads them to suggest that top tax rate changes can be used to attract
foreign high-skilled workers without substantially affecting the migration incentives of natives.
Our findings clearly contradict that suggestion.
We conduct a cost-benefit analysis of the fiscal impact of the program. The main fiscal
costs of the REP arise from the foregone tax receipts of a portion of the approved applicants who
would have returned to Malaysia even in the absence of the program, but still take advantage of
the available tax breaks. The fiscal benefits arise from the fact that some additional people now
return to Malaysia due to the REP incentives and pay income and consumption tax. Several
different scenarios are considered and the net fiscal benefit estimates of the REP program are
13 We estimate that the overall annual application rate is around 1.5 percent of the stock of potential applicants. To obtain a treatment effect that is not conditional on application our LATE estimates needs to be scaled by the application rate. Our theoretical framework also allows to infer the fraction of compliers (those applicants who return only if they are accepted to the program) and hence the marginal treatment effect (MTE) of program approval for approval probabilities away from the threshold. At the discontinuity the implied MTE is 64 percentage points, very similar to the LATE estimates. At lower approval probabilities, further away from the discontinuity, the fraction of the compliers is smaller. For example it is only 9 percentage points at an approval probability of 10 percent. The average impact (ATE) of the REP on the return probability, the weighted sum of the marginal effects, is 57 percentage points. 14 The effective average income tax falls by 4 percentage points for the average successful applicant. Note that the maximum marginal tax rate in Malaysia is only 25 percent. We estimate that the value of the tax reduction on the import of cars is worth around 7 percent of income over a 5-year period to the average REP returnee.
6
modest and centered around zero. The two-stage least square estimates suggest a net cost of around
$6,900 per applicant at the lower-end, while net benefits are about $4,200 at the upper-end. The
model-based estimates show small net benefits of around $1,700 per applicant. While the main
motivation for the program is to capture the economy-wide positive externalities generated by the
return of high-skilled expatriates, it is likely that the program roughly pays for itself.
Our theoretical model aims to motivate the empirical analysis. It shows how self-selection
into application to REP results in two very different applicant pools: those with and without an
existing job offer. The incentives of those who apply without a job offer resemble those in
‘immigrant driven’ systems, where an immigrant is admitted into the country without necessarily
having a job offer and is selected on the basis of a set of desirable human capital attributes.15 These
REP applicants tend not to primarily apply for job-related or financial reasons, since they do not
know exactly what job offer they may receive. Instead, they are likely to have strong non-pecuniary
reasons for return. Consequently, this group of applicants does not contain many individuals whose
decision is swayed by a modest change in the financial incentives provided by the REP. In contrast,
applicants who have already received a job offer in Malaysia are applying with full knowledge of
the financial benefits of REP approval. The incentives of these applicants are akin to those who
apply under ‘employer driven’ programs, most prominently the US H-1B program, where it is a
pre-requisite to have an existing job offer. This group contains a significant fraction of REP
applicants who return to Malaysia only if approved by the program.
The model yields several testable empirical predictions for which we find strong support
in the data. Most interesting is how self-selection affects the mean wages of applicants (in
Malaysia) as program approval becomes more stringent, i.e. the probability of REP approval falls.
Among those with an existing job offer, applicants with a lower REP approval probability (based
on their experience abroad) subsequently have higher mean wages in Malaysia. In the data, a 10-
percentage point decrease in approval probability for applicants with job offers increases mean
(approved) applicant wages by 10 percent. This is because at lower approval probabilities only
higher wage individuals find it worthwhile to pay the cost of application. For those applying
without an existing job offer, however, the opposite occurs. As the approval probability falls the
composition of applicants increasingly tilts towards those who will likely return independent of
15 Australia, Canada and New Zealand, and more recently the UK and the EU Blue Card initiative fall in this category. See Bertoli et al. (2012) for a discussion of different types of immigration systems.
7
the wage offer they subsequently receive. Applicants become less selective in terms of expected
wage. Hence, more stringent program approval is actually counterproductive for this group and
decreases the applicants’ eventual mean wage in Malaysia. In the data, a 10-percentage point
decrease in approval probability for applicants without job offer decreases mean (approved)
applicant wages by 14 percent. These findings are related to the work that analyzes the influence
of immigration policies on migrant selection.16
The paper proceeds as follows. Section 2 provides background on the REP and descriptive
statistics. Our conceptual framework is outlined in Section 3. Section 4 provides preliminary
evidence based on our model predictions. Section 5 discusses the fuzzy RD design and presents
results. Section 6 describes the cost-benefit analysis of the fiscal impact of the REP. Section 7
concludes.
2. Institutional Background and Data
2.1. The Returning Expert Program (REP)
The Returning Expert Program (REP) was introduced on January 1, 2011, and is
administered by TalentCorp Malaysia, a government agency. Those who are admitted to the
program can take advantage of four benefits upon their return and start of their employment. First,
they can use an optional 15 percent flat tax rate, instead of the standard progressive tax schedule,
on employment income for the first five years. Second, they enjoy a tax exemption on the import
or purchase of two locally assembled or manufactured completely knocked-down (CKD)
vehicles.17 Third, foreign spouses and children automatically receive permanent residency status.
Fourth, there is a tax exemption for all personal effects brought back to Malaysia.
The value of these benefits depends on the characteristics of the recipient. The top marginal
income tax rate in Malaysia is currently 25 percent. In order to benefit from the 15 percent flat tax,
an applicant would have to earn more than RM 135,000 annually, which was about US$45,000 in
2012. The tax exemption on the import of personal effects is unlikely to have substantial monetary
benefits but reduces the bureaucratic burdens faced at the customs. The tax exemption on cars is
16 From a theoretical perspective see, e.g., Docquier, Faye and Pestieau (2008), Bertoli and Rapoport (2015) and Bertoli, Dequiedt and Zenou (2016) and from an empirical perspective see, e.g., Antecol, Cobb-Clark and Trejo (2003), Jasso and Rosenzweig (2009), Aydemir (2011) and Belot and Hatton (2012). 17 The exact parameters of the tax exemption on vehicles have changed over time. We describe the system in place for nearly all of the main period of analysis (2011-12).
8
potentially very valuable since Malaysia has one of the world’s highest import tax rates on foreign
cars as part of an attempt to support local car manufacturing. Finally, Malaysia has restrictive
citizenship laws as Malaysian citizenship is normally only acquired by birth while permanent
residency is granted mainly to very high-skilled individuals. Thus, the permanent residency for
foreign spouses or for children born abroad is potentially an important benefit of the program.
The basic eligibility for the REP requires that an individual (i) is a Malaysian citizen, (ii)
has been residing outside Malaysia and employed continuously for the past three years and at the
time of the application, (iii) is under no financial or legal obligation to a company or government
agency to return, and (iv) has no outstanding scholarship bonds or loans from the Malaysian
government. The application has to be submitted while the applicant is still residing and employed
abroad. There is no application fee, but application requires extensive documentation and is time
intensive.
Beyond the basic, non-negotiable requirements listed above, the key element of the
eligibility criteria is that the individual needs to have obtained education beyond high school and
completed a sufficient number of years of work experience abroad. The required years abroad vary
by the degree obtained by the individual. For the sample used in this analysis, the applicants in
2011 and 2012, the minimum experience thresholds were two years for those with a PhD, four
years for those with a masters or professional qualification, six years for people with a Bachelor
(or first) degree, and ten years for people with a technical diploma. In practice, TalentCorp
typically grants the applicants about 6 months leeway on these requirements in anticipation of
them continuing to work until they return.
There are several other dimensions considered during the evaluation of the application,
which TalentCorp currently refers to as ‘holistic assessment criteria’. Applicants can also be
approved if their skills are considered vital to the Malaysian economy, such that they are
designated as an expert in a high-value sector or profession. This designation depends on the
applicant’s industry, profession, income, and any other criteria TalentCorp chooses to take into
consideration during the evaluation process. Hence, the education-specific work experience abroad
thresholds are important, but not deterministic for eligibility (conditional on meeting the basic
criteria).
TalentCorp processes applications rapidly. The median decision time is 30 days and 90
percent are processed in 51 days. The idea is that some applicants apply while deciding on an
9
existing job offer in Malaysia, and that REP approval can help sway their decision as they are
trying to choose between competing offers. After approval, applicants have a two-year window
during which to, return to Malaysia, start their job and claim the REP benefits.
2.2. Administrative Data
Administrative data on the applicants to the REP have been provided by TalentCorp
Malaysia. The data contain applicant characteristics that are relevant to the admission process as
well as the application status, and return status (only for approved applicants). Available personal
information on applicants includes their work experience abroad in months, education levels,
income while abroad, industry, profession, job title, marital status, nationality of spouse, number
of children, whether the applicant has an existing job offer in Malaysia, and salary in Malaysia (for
approved applicants who eventually return).
Administrative data on the applicants for the years 2011–2014 are available. However,
there is a sharp fall in the observed return rate of applicants (both approved and not approved) in
2013 and especially in 2014. This and the data on the 2011-12 applicants suggest that many people
approved in these two later years have not fully completed their return process yet. Hence, the
focus of this analysis is on the applications that were processed in 2011 and 2012.
A crucial issue for our analysis is determining whether those who were not approved by
the REP returned to Malaysia or not. Unfortunately, TalentCorp does not officially keep track of
the return status of rejected applicants. We obtained this information by calling every applicant
who was not approved at his or her contact numbers in Malaysia and abroad (provided at the time
of application) up to three times to inquire about their return status. For the remaining applicants
who could not be contacted by telephone, we searched for them on LinkedIn (which is very popular
in South East Asia). If their account appeared active, we verified whether they were currently in
Malaysia or not. In this manner, return status information for 96.2 percent of the entire sample of
applicants and for 85.6 percent of rejected applicants was obtained.18
The final sample of 1,654 individuals includes all 2011 and 2012 applicants (i) who meet
the basic eligibility criteria,19 (ii) for whom we know their return status, and (iii) the administrative
18 The observed characteristics of those whose return status was not determinable are near identical to the overall sample, suggesting that a representative sample was obtained. 19 TalentCorp checks whether an applicant has received income in Malaysia in the past 3 years and whether they are under an obligation to return, thereby excluding 1.8 percent of the sample.
10
data on their level of education, months of experience abroad and other personal characteristics.20
and East Asian countries (39 percent), English-speaking countries (37 percent), and the Arabian
Peninsula (16 percent). The United Kingdom is the single largest source country (17 percent of
applicants), followed by Singapore (15 percent), China (11 percent), Australia and the USA (8
percent each).
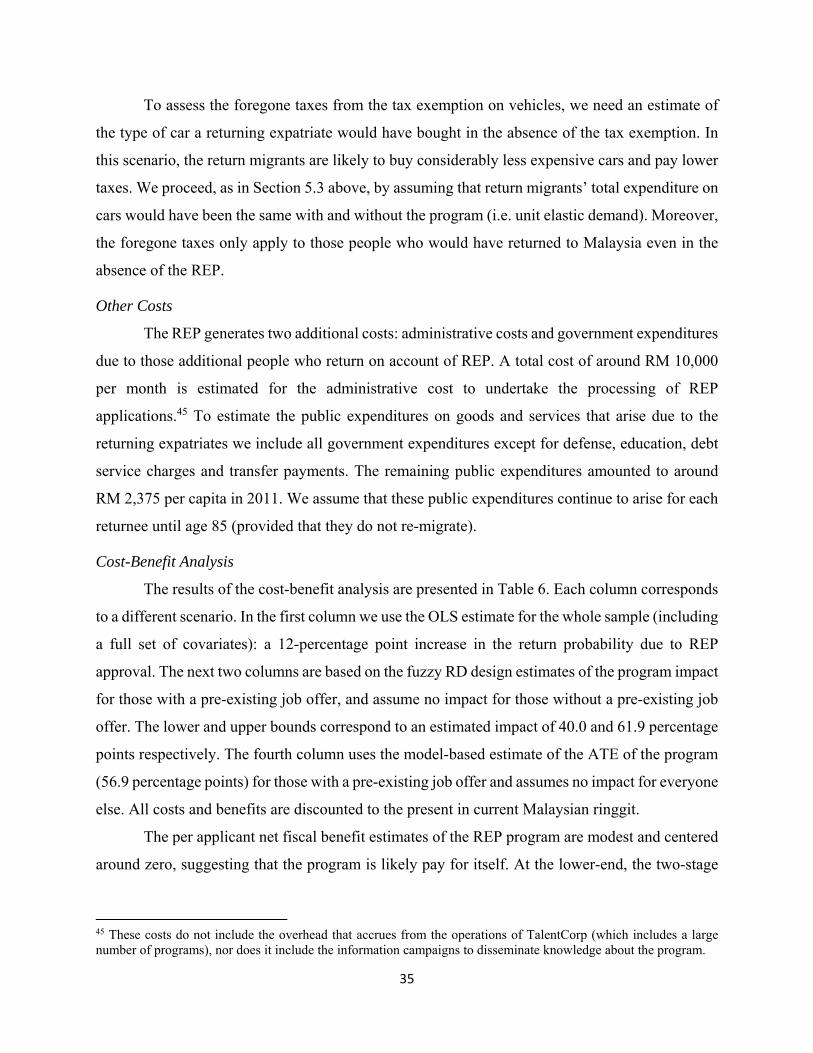
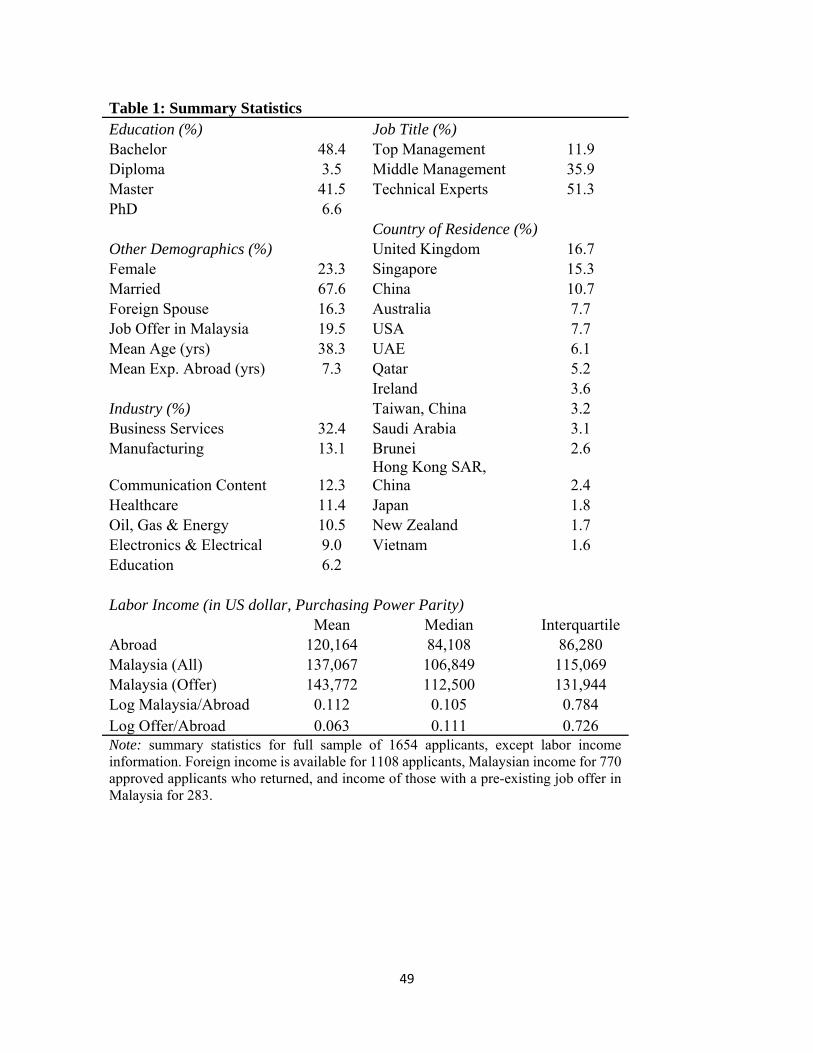
The REP applicants are highly educated; they typically have a Bachelors degree (48
percent) or Masters degree (42 percent), and 7 percent have a PhD. They are predominantly male
(77 percent), middle-aged (38 years on average), and married (68 percent), primarily to other
Malaysians (24 percent of the married have a foreign spouse). Applicants have on average 7.3
years of work experience abroad. They describe their job title as technical experts (51 percent),
middle management (36 percent) or top management (12 percent). Over one-third of the applicants
are employed in business services, and around one-tenth in each manufacturing, ICT, healthcare,
electronics and oil, gas and energy.
Labor income abroad is in the data set for all applicants, while income in Malaysia is
available only for those who were approved and returned. Applicants with an existing job offer
report the income associated with that offer.21 We report income in 2012 US dollars using
purchasing power parity conversion rates.22 The average income abroad of applicants is around
$120,000; the median is considerably lower at about $84,000. Average incomes in Malaysia, for
those who returned, are actually higher with the average and median around $137,000 and
20 The electronic administrative records are missing information for 18 percent of our sample. Note that the electronic records are not used to determine whether an application is accepted, rather TalentCorp prepares a paper file on each applicant. The characteristics of those missing, including their return status, are near identical to the overall sample, suggesting they are missing at random. 21 For 21 percent of the sample income abroad is missing. In addition, to deal with measurement error we exclude outlying income observations. Most importantly, the income abroad question on the REP application is ambiguous in whether annual or monthly income should be reported. The large majority of respondents seem to have reported annual income, but we exclude reported incomes of less than $24,000 (14 percent of observations) since these could plausibly be monthly wages. Our results are robust to varying this cutoff income. We also exclude the top 1 percent of income observations. The characteristics of individuals with income information missing or below the cutoffs are near identical to those of the remainder of the sample, including their return probability. 22 PPP conversion rates are from the World Bank Development Indicators. 2011 numbers are inflated by the change in the US Consumer Price Index.
11
$107,000 respectively.23 Applicants with an existing job offer declared (offered) salaries that are
even somewhat higher. Those applicants who were approved by the REP and returned experienced
average (and median) wage gains of about 11 percent. The interquartile range on these wage gains
is 0.79 log points, and 42 percent of people who returned experienced wage losses (in terms of
PPP).
Using the Malaysian Labor Force Survey (LFS) we can compare expatriates who return
under the REP with the Malaysian workforce as a whole. REP beneficiaries on average earn 8
times the salary of an average Malaysian, and median wages are 11 times higher (since REP
applicants have a smaller left tail of wages). While it is always hard to accurately capture top-
incomes, according to the Malaysian LFS, around 80 percent of REP returnees are in the top 1
percent of the Malaysian income distribution. This is not simply a result of higher education levels
and occupational choices. For comparison we restrict the sample in the LFS to those with at a least
a Bachelor’s degree, between the ages 25-64 and employed in the same occupations as the REP
applicants. In this restricted sample, REP beneficiaries still earn more than 4 times the comparable
Malaysians. Once we control for work experience (abroad and in Malaysia), industry, occupation
and education, the REP returnees on average still make 2.5 times as much as other Malaysians. It
is clear that the program is able to attract applications from very high-skilled and compensated
Malaysians.
2.4. Diaspora and Applicants from the United Kingdom and the United States
We compare the characteristics of applicants from the United Kingdom and the United
States with the stock of Malaysians in those countries to assess how representative REP applicants
are of the Malaysian diaspora. The data come from the American Community Survey (ACS) 2008-
12 and the UK Labour Force Survey (LFS) 2009-12.24
The stock of REP eligible Malaysians in the UK and the US is 9,142 and 10,033
respectively in this period.25 The average annual inflow of REP eligible Malaysians is 611 for the
23 Note that at market exchange rates incomes in Malaysia are considerably lower than abroad. Over this period at market exchange rates one Malaysian Ringgit was worth 0.32 US dollars, at the PPP conversion rate it was worth 0.69 US dollars. 24 The UK and US account for 24 percent of all applicants. They are the only two countries with a substantial number of Malaysian immigrants for whom we were able to obtain information by nationality of the respondent. 25 We consider an individual to be REP eligible if they are between 25-64 years old, have completed at least a Bachelor’s degree, are employed, in the country for at least three years, and are a Malaysian citizen (or in the case of the US, a non-US citizen, since Malaysia does not allow dual citizenship). We report averages over the sample period.
12
UK and 490 for the US. In comparison, the average annual number of REP applicants is 185 from
the UK and 95 from the US. REP attracts a large number of applicants when compared to the flow
of REP eligible Malaysians to the UK and US. Specifically, applicants represent 30 and 19 percent
of the inflow to the UK and US respectively. When compared to the stock of REP eligible
Malaysians abroad, the number of applicants is also substantial: 2 percent for the UK and 0.9
percent for the US. Clearly, REP is large enough to potentially have a significant impact on the
extent of Malaysian “brain drain and circulation.”
Table 2 presents sample statistics for the Malaysian diaspora and applicants from the UK
and US. The characteristics of applicants from the UK and US are quite different. Applicants from
the UK are most likely to have a Masters degree (51 percent), while those from the US most likely
a completed Bachelors (47 percent). We also have a large number of applicants with a PhD (13
percent) from both countries. Applicants from the UK are more likely to be female and married
than their US counterparts. The mean age of applicants from the two countries is very similar
(about 35 years), as is the time they have spent in the country (around 7.5 years). Incomes abroad
are considerably lower for UK applicants, on average $80,000 compared to $106,000 for the US.
3. Analytical Framework
In this section, we outline a simple framework for understanding application and return
decisions of expatriates. We focus on two types of expatriates: those with and without a pre-
existing job offer in Malaysia at the time of their application. The key difference between these
two types of applicants is in whether they know their wage in Malaysia at the time of their
application. We assume that whether an expatriate has a current job offer in Malaysia is due to
reasons that are unrelated to other key determinants of the application and return decisions.
Sections 4 and 5 provide empirical evidence supporting that assumption.
The analytical model generates several contrasting and testable predictions for these two
types of applicants. The model also helps us with the interpretation of the estimates of our fuzzy
RD design (see Section 5 below) and provides a way to estimate the MTE for all observed approval
probabilities.
3.1. Setup
3.1.1. The Return Migration Decision
13
An expatriate’s return migration decision is determined by several key variables. First, we
have the value of the job in Malaysia ( ), the value of the current job abroad ( ) and the tax
benefit of the REP program, , which we assume is proportional to income. Hence, the value
of an existing job offer in Malaysia is 1 for those applicants who are accepted to the REP
program. Finally, there is the utility of living in Malaysia as compared to abroad, denoted by v.
Then, an expatriate’s utility from returning home is given by 1 if he is admitted to
REP and , otherwise (throughout we assume applicants are risk neutral).
We distinguish between three groups of expatriates based on their wage and utility levels.
First group is composed of those with a very high wage offer in Malaysia or a high utility from
returning relative to their wages abroad, i.e. (or expressed as / / 1
in relative terms to income abroad). These people will return irrespective of the approval decision
of REP. We refer to this group as always-returners. Second, there are the expatriates with
intermediate values of wages and non-pecuniary return valuations such that 1 /
/ 1 / / . This group will return only if they are accepted to the REP and we
refer to them as the compliers. Third, there are those expatriates who will not return to Malaysia
even if they are admitted to the REP since their relative wages in Malaysia are too low: 1
1 / / . This is the group of never-returners.
We represent these three groups in Figure 1. On the y-axis is the relative wage in Malaysia
( / ) and on the x-axis is the relative non-pecuniary return utility ( / ). The 45-degree line
1 separates always-returners from the compliers and the line 1 /
/ 1 separates the compliers from the never-returners.
3.1.2. The Application Decision with an Existing Job Offer
The decision to apply to the REP requires individuals to weigh the cost of application
against the probability of acceptance and the size of benefits provided. REP application does not
involve a fee but it is time intensive. Hence, we assume the application cost is proportional to an
applicant’s wage abroad and is given by . The probability of acceptance to the REP is denoted
by (0 1) and is assumed to be independent of a person’s type (given by , , ). For
the purpose of exposition, we assume that applicants know their exact acceptance probability, even
though the qualitative predictions of the model are unaffected by a moderate amount of
14
uncertainty.26
For those expatriates with an existing job offer, REP admission is the only substantial
source of uncertainty. The never-returners, even if they have an offer, never pay to apply to the
REP since the application cost is a waste for them. The compliers will apply only if the
expected benefits of acceptance exceed the costs. This trade-off is expressed as:
1 / / 1 (1)
The benefits of REP for this group, expression on the left in equation (1), are given by the
(probability weighted) difference in utility from returning versus remaining abroad. For the final
group, the always-returners, the trade-off is given by:
/ (2)
In this case, the marginal benefit is since this group will return regardless of the REP
outcome.
Figure 2a presents the application and return decision of the expatriates with existing job
offers. The never-returners are in region R3 and they neither apply nor return. The compliers
(middle group) are split into two sub-groups where the dashed line separating them is given by
equation (1) above. Region A2 include those compliers who will apply and return if approved;
they have higher wage offers in Malaysia ( ) and/or high utility of return (v). The compliers with
low wage offers or return utility (region R2) do not find it worthwhile to apply and do not return.
Finally, the always-returners are also split into two groups where the dashed line is given by
equation (2). Those in region A1 apply to REP but return regardless of its outcome. For those in
R1, the relative cost of application is too high so they do not apply but they return anyway. By
changing the program parameters (s, p and c), the government can move the cutoffs (given by
equations (1) and (2), and the dashed lines in Figure 2a) and therefore, the applicant pool and
returning expatriate numbers. Higher benefits (s), higher acceptance probability (p) and lower
application costs (c) move the lines down, increasing the applicant pool, acceptance numbers and
returning expatriates.
The trade-offs faced by the designers of the incentive program are easily seen in Figure 2a.
The goal of the program is to attract expatriates at a minimum cost. The benefits should ideally be
26 In the previous section, we discussed how applicants face significant residual uncertainty in their acceptance probability. This uncertainty is essential in providing the exogenous variation in acceptance probabilities we use for identification in Section 5 below, but does not impact the qualitative results of the model.
15
granted only to those who would not return without them (compliers), but exclude those who will
return even without the tax incentives (always-returners). However, it is impossible for the policy
makers to perfectly know the individual types of the applicants, especially their v. Making the
program more attractive via higher p, s or lower c, causes region A2 to grow and R2 to shrink
(which is desirable), but it also results in region A1 growing (which is undesirable). In other words,
the tax incentives offered to those always-returners in A1 is the cost of attracting the compliers in
A2.
3.1.3. The Application Decision without an Existing Job Offer
Applicants without a pre-existing job offer in Malaysia are assumed to receive the wage offer ( )
only after their application decision is made. So these expatriates need to base their application
decision on an expected wage, rather than an actual wage, and this distinction leads to significant
differences in how they self-select into the program. For simplicity, we assume that the expected
relative wage in Malaysia, ⁄ , is independent of REP approval.
Figure 2b presents the application and return decision for expatriates without a pre-existing
wage, and a common probability p of acceptance into the REP program. The return decision is
made exactly in the same way as it was the case with expatriates with a pre-existing wage offer
(see section above) since the wage in Malaysia and the REP decision are fully known at that point.
Again, there are always-returners, compliers and never-returners depending on the expatriate’s
type , , and whether they have been accepted to the REP.
The application decision, however, is now based on the applicant’s wage abroad, , the
relative utility derived from living in Malaysia and the expected wage in Malaysia. Since is
not perfectly known at the application stage, the expatriates only know the probability of being a
complier or an always-returner, which we denote by and , respectively. The application
decision, therefore, depends on the ex ante probabilities of being an always-returner,
/ / 1 , or a complier, 1 . This
allows us to define the application cutoff:
| 1
|1
1 1
(3)
16
In this expression, the (probability weighted) expected benefits of applying, which depend
on the probability of being approved and the probability that the applicant is ex post an always-
returner or complier, should be larger than the application cost.
In Figure 2b, the application cutoff is represented by the dashed vertical line and is identical
for everybody since people do not know their type at that point. The location of the dashed line is
determined by the acceptance probability p, the tax benefit s, the expected relative wage
⁄ , and is implicitly defined by equation (3). At a very low acceptance probability, only
those who know they will return to Malaysia, due to a very high , will apply. As the acceptance
probability increases, the dashed line moves to the left and the number of applicants increases.
People in regions A1, A2 and A3 (i.e. high v) apply to REP whereas those in R1, R2 and
R3 (with low v) do not. Once all the uncertainty is resolved, i.e. is revealed and the application
decision is made, those in R1 and A1 will return since they have high . Those in R2, R3 and
A3 will not return (even if admitted to REP). Finally, those in A2 will return only if approved by
the REP. The policy trade-off again is between those individuals in regions A2 and R1; the
government will have “spent” the tax benefits for those in R1 in order to induce those in A2 to
apply and return.
3.2. Model Predictions
The analytical framework provides several testable predictions.27 For the expatriates with
pre-existing job offers, the only uncertainty is whether TalentCorp will approve them for tax
benefits. Only always-returners and compliers will apply to the program. Hence, all of the
approved people will return. Among the rejected, the always-returners return anyway but the
compliers do not (see Figure 2a). In short, the return ratio among the approved is 100 percent,
while the ratio is lower among the rejected.
Expatriates without an existing job offer face an additional source of uncertainty: they do
not know their wage offer in Malaysia at the time of their REP application. So only high v
expatriates apply but some of the approved will not return (region A3 in Figure 2b) as they will
receive very low wage offers. For rejected applicants, only those in R1 will return.
27 In this section we provide intuitive explanations for the empirical predictions provided by the theoretical framework. More formal proofs of these predictions require an assumption about the distributions of expatriates’ characteristics in -space. In particular, individuals have to be reasonably smoothly distributed, for example uniformly distributed (within some bounds).
17
The model does not yield a clear prediction about whether the return rate among rejected
applicants should be higher for those with and without pre-existing job offers. Among those with
a job offer, only rejected compliers stay abroad. For those without pre-existing offers, both rejected
compliers and non-returners stay abroad (regions R2 and R3 in Figure 2b). However, even if the
underlying distribution of expatriates in the , -space is the same for the two groups, the
incentives to apply to the program and the applicant pools are entirely different. Hence, we cannot
theoretically predict which rejected group has a higher return rate. The first set of testable
predictions can be summarized as follows.
Prediction 1:
(i) Accepted applicants are more likely to return than rejected applicants whether they have an
existing job offer or not.
(ii) The return probability for approved applicants will be higher for those with job offers
compared to those without an offer.
(iii) For rejected applicants the model does not predict whether those with or without pre-existing
job offers are more likely to return.
Our next predictions are about the relationship between approvals and return probabilities.
First, we introduce some additional notation. Let , and denote the number of expatriates
who are always-returners, compliers, and never-returners, respectively. Their application rates are
given by , and , respectively. Then the total number of applicants is given by
. The observed return probability of all applicants, is:
(4)
The critical question is how changes in REP approval probability impact application
decisions and return rates. At very low yet positive approval probabilities (p), the dashed lines will
move up in Figure 2a and to the right in Figure 2b. This means only always-returners apply to the
REP at these low levels of p and we will have , 0. Since only always-returners apply, the
return probability is close to one for both approved and rejected applicants. As p increases the
number of applicants increases (as the dashed lines move down in Figure 2a and left in Figure 2b).
But some of the applicants are now compliers (for both groups) and never-returners (for those
without an existing job offer). As a result, the return probability among the applicants starts to
18
decline for both groups. As p increases and approaches 1, the implications are slightly different.
In the case of the people with offers, (nearly) all applicants return since only compliers and always-
returners apply and approval is near certain. However, for those without offers, some of the
applicants were never-returners and that group stays abroad once they observe their low wages in
Malaysia. More specifically, for this group, 1 1 . The predictions can be
summarized as follows.
Prediction 2:
(i) The return probability of all REP applicants is close to 1 at very low approval probabilities
(p).
(ii) The applicant pool increases but the return probability starts to decrease as increases.
(iii) As p continues to increase, eventually increases again and reaches 1 when 1 for
applicants with pre-existing job offers. However, for those without a pre-existing job offer,
always remains below 1.
The final set of predictions is about the wage distribution of the applicants and returnees.
As discussed earlier, the wages in Malaysia and abroad ( ) both influence the
application and return decisions. For those with existing job offers, self-selection occurs in the
application stage and those with low wage offers in Malaysia (region R2 in Figure 2a) do not apply
at all. There is a trade-off between approval probability and cutoff wage for applicants, so
increasing p lowers the cutoff wage, . As a result, the mean relative wage of applicants and
returnees decline as approval probability increases.
Expatriates without a job offer base their application decision on their current wage abroad
( ), the non-pecuniary benefits of returning home and their expected wages. Higher approval
probability p encourages expatriates with low v to apply. Once the REP approval decision is made
and wages in Malaysia are observed, self-selection takes place and only those with higher wages
decide to return to Malaysia. Since at a higher there are more applicants with a low , self-
selection into the return decision results in higher mean wages among the returnees. We can
summarize the predictions as follows.
Prediction 3: As the approval probability (p) increases, applicants’ mean relative wages in
Malaysia :
19
(i) decrease for those with pre-existing wage offers, but
(ii) increase for those without pre-existing wage offers.
3.3. The Treatment Effect and Identification
The goal of the REP is to induce high-skilled expatriates to return to Malaysia. Approval
to the program, however, only has an impact on the return decision of compliers. The total impact
of an exogenous change in , from to , on the return probability ( is given by the
ratio of the change in the return probability, as defined in equation (4), and the change in (as in
the Wald estimator):
,
(5)
where is the total number of expatriates.
An increase in the approval probability (p) increases the return probability through two
channels. The first channel is a direct effect as more compliers are approved and return. It is given
by . This is simply the impact of the program in the absence of self-selection into
application and is the fraction of applying compliers among expatriates (at approval probability
). The second term is an indirect effect as more compliers apply to the program when p increases,
0 (see Figures 2b and 2c). It is given by , and arises due to the
self-selection of applicants based on their knowledge of the approval probability.
If all the model assumptions hold, the observed approval probabilities and return rates are
sufficient for identifying the marginal treatment effect for every observed p for applicants with
pre-existing job offers. The model implies that never-returners (if they have an offer) never apply
to the program. Hence, the observed return rate, from equation (4), can be rewritten as:
1 ,
(6)
where is the share of compliers among applicants and is given by .
Furthermore, and p are observed in the data and thus we can calculate . Since
the total number of applicants, ,is observed we can also find and
20
for every observed . Then, provided we know the total number of expatriates , it is
straightforward to estimate the local average treatment effect using equation (5), as well
the direct and indirect effects, and .28
In practice, of course, the model does not fully capture program application and return
decisions of the expatriates. However, the design of the REP allows us to obtain a fuzzy RD
estimate of at the point of discontinuity. If we are then willing to rely on the model
assumptions, we can also identify the marginal treatment effects at observed p away from the
discontinuity.
4. Empirical Evidence
In this section, we provide suggestive empirical evidence related to the model predictions
as they are outlined in the previous section. In the subsequent Section 5 we provide fuzzy RD
estimates of the impact of REP approval on return probabilities.
4.1. REP Approval and Return Probabilities
Table 3 shows the number (and fraction) of applicants who returned to Malaysia, by
approval status and whether they have a pre-existing job offer. The average program approval
probability is high, 80 percent for those without a pre-existing job offer and 77 percent for those
with a job offer, where the difference is not statistically significant.
The return probability among approved applicants is 93 percent (231 out of 248) for those
with a pre-existing job offer. The fact that it is slightly less than 100 percent suggests that some
applicants, 7 percent in our sample, do not return to Malaysia for reasons not captured by the model
(and possibly arising after the application decision).29 The return probability is only 69 percent
(738 out of 1,070) for the approved without a pre-existing job offer. This suggests that 24 percent
(difference between 93 and 69 percent) of applicants are ex post never-returners (since all of the
always-returners and compliers return if approved).
28 For applicants without pre-existing the observed return probability is: (p)no job = sa(p) + psc(p) where sa(p) is the share of always-returners. The identification problem is that both sa(p) and sc(p) are now unknown since applicants also include a fraction of never-returners, sn(p) and sa(p) + sc(p) + sn(p) =1. Hence, the observed data will not typically provide enough information to derive the MTE. 29 In our interpretation of the evidence we will continue assuming that 7 percent of applicants do not return to Malaysia for idiosyncratic reasons arising after the application and approval decision falling outside the model and hence cannot be categorized as never-returners, always-returners or compliers.
21
The return probability is significantly lower for rejected applicants. It is 76 percent for
those with a pre-existing job offer, suggesting that 17 percent of this group (difference between 93
and 76 percent) are compliers. The return rate is only 60 percent for those rejected applicants
without a pre-existing job offer, which implies that only 9 percent (difference between 69 and 60
percent) of the applicants without job offers are compliers. This pattern of return probabilities is
fully consistent with the predictions of our theoretical framework (see Prediction 1).
The evidence suggests that the program approval probability p is uncorrelated with
individual characteristics that also affect the return probability. Specifically, only three variables
are robust predictors of whether an applicant actually returns to Malaysia: REP approval, whether
they have a job offer in Malaysia before applying, and their age (older applicants are slightly more
likely to return).30 The probability of REP approval is not significantly correlated with the age of
the applicant, and, most importantly, it does not depend on whether an applicant already has a job
offer in Malaysia.
The key determinant of REP approval, once the basic application criteria are fulfilled,31 is
the education-specific years of work experience abroad. Figures 3a-d plot the probability of
approval to the REP against the applicant’s months of work experience abroad, normalized by the
education dependent threshold.32 Consequently, in the figures the threshold for acceptance for all
applicants has been normalized to zero. We plot return probabilities for up to 2 years below the
threshold and 6 years above, capturing 76 percent of our sample (the plots look very similar if we
change the sample frame).
The figures show clear evidence of a considerable discontinuity in the probability of
acceptance at the threshold. Above the threshold, the probability of acceptance is constant at
around 95 percent. Just below the threshold, the probability of acceptance is still very high at about
60 percent and then drops rapidly to around 10 percent for applicants whose work experience
abroad is two years below the threshold. The relationship between work experience and approval
probability below the threshold is close to linear. The inclusion of covariates, as discussed above,
barely affects the approval probability.
Figures 4a-d replicate Figures 3c and 3d, but for those with and without a pre-existing job
30 A large set of available variables including income, industry, occupation, gender, and current region of applicant are not robust predictors of the return decision. 31 Recall that our sample only includes individuals who fulfill these criteria. 32 We also include the six months leeway that TalentCorp informally tends to give applicants.
22
offer in Malaysia. Both samples show a large discontinuity at the threshold, a rising approval
probability below the threshold and broadly constant thereafter. The main difference is the
magnitude of the discontinuity. For those with a pre-existing job offer in Malaysia the discontinuity
is 52 percentage points (from below 44 to 96 percent approval rate) while it is only 32 percentage
points (from 60 to 92 percent) for those without a job offer.
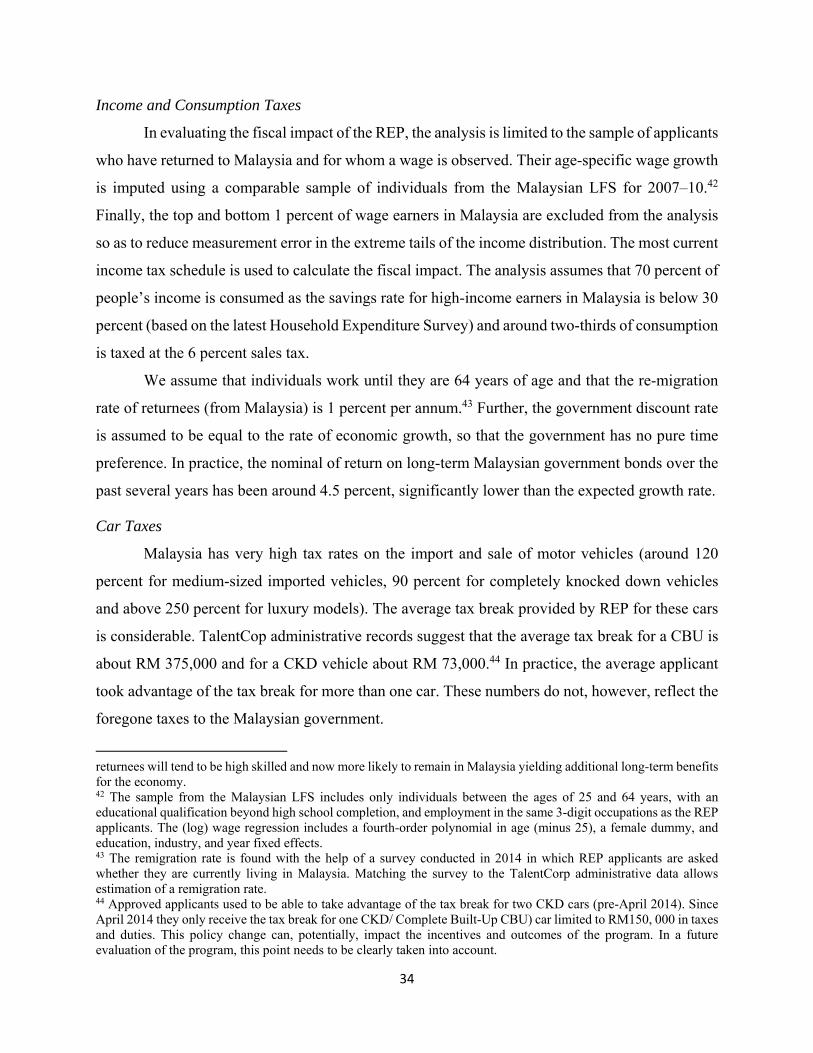
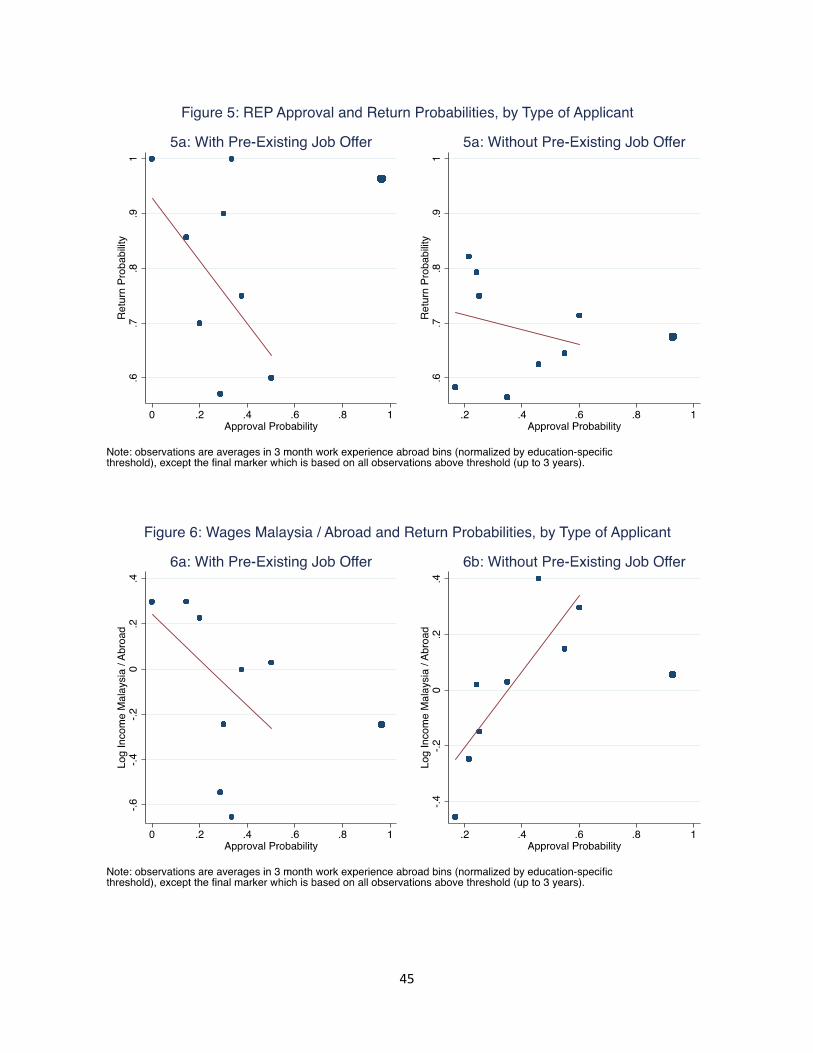
4.2. Return and Approval Probabilities
Figures 5a and b plot applicant return probabilities against their approval probabilities, in
bins based on their work experience, normalized by their education dependent threshold.33 Figure
5a is for the applicants with an existing wage offer. Just as predicted (see Prediction 2), the return
probability is close to one at very low approval probabilities. The return probability then falls as
the approval probability increases. At an approval probability close to one the return probability is
also once again close to one.34 Figure 5b is for applicants without a pre-existing job offer. The
pattern is a lot less pronounced for these applicants (and not statistically significant). As predicted
though, the return probability is still only around 68 percent at an approval probability close to
one, consistent with a large fraction of ex post never-returners applying for the program.
4.3. Wages and Approval Probabilities
Figures 6a and b plot applicants’ relative wage in Malaysia against their approval
probabilities, again in bins based on their work experience. The relative wage measure is the log
of the ratio of the wage in Malaysia to the wage abroad (conditional on returning to Malaysia).
Figure 6a is for the applicants with an existing wage offer. For this group the relative wage in
Malaysia decreases with the approval probability. Figure 6b is for the applicants without an
existing wage offer. For this group the relative wage in Malaysia increases with the approval
probability. Note that the relative wage of applicants is actually lower after the discontinuity than
just before, however, that difference is not statistically significant. These stark contrasting patterns
for the two groups are as predicted by our model, see Prediction 3, and reflect the different
application incentives of the two groups.
5. Treatment Effects: A Fuzzy Regression Discontinuity Design
33 We use 3-month bins below the threshold and a single bin above the threshold (a 3-year bin). 34 Recall that on account of the discontinuity we do not observe individuals with intermediate return probabilities.
23
5.1 Empirical Strategy
The key concern with a causal interpretation of the correlations described in Section 4 is
that there may be unobserved characteristics of applicants that are correlated with both the return
and approval decisions. Most importantly, we do not observe an applicant’s individual desire to
return to Malaysia, which may be correlated with the approval decision. For example, those who
are eager to return may make additional efforts to be approved, resulting in a spurious positive
correlation between approval and the return decision. Alternatively, since applying is costly (with
regard to time and effort) only highly motivated applicants will apply if their probability of
acceptance is low, thus resulting in a spurious negative correlation between approval and return.
In Section 4, we showed that there are large discontinuities in the likelihood of program
acceptance at certain thresholds based on years of work experience abroad. This evidence and the
discussion of the program rules in Section 2.1 suggest that it may be feasible to evaluate the
program using a fuzzy RD design. Formally, the fuzzy RD design can be described as a two
equations system:
Y α τD f X c ε, (7) D γ δT g X c v, (8)
where Y, D, and T are binary variables. In our case, Y is equal to one if the applicant returns to
Malaysia; D is equal to one when the application is approved. X is the months of experience abroad
(i.e. the assignment variable) and T is equal to one when the assignment variable X is greater than
the threshold c (T=1[X ≥ c]). Crucially for identification, the probability of treatment changes
discontinuously at the threshold c.
The probability of treatment jumps by less than one at the threshold as seen in the graphs
in Section 4. Thus the treatment effect can be recovered by dividing the jump in the relationship
between Y and X (at the threshold c) by the increase in the probability of treatment at the threshold
(the discontinuity jump in the relation between D and X). Hahn, Todd and van der Klaauw (2001)
show that the interpretation of this ratio as a causal effect requires the same assumptions identified
by Imbens and Angrist (1994). More specifically, one must assume “monotonicity”, (i.e. approval
of the application cannot decrease the probability any individual returns to Malaysia), and
“excludability” (i.e. X crossing the threshold cannot affect the return probability other than by
impacting the probability of approval). Monotonicity is a very natural assumption in this context,
since it is hard to conceive of a situation in which approval of the application dissuades an
24
individual from returning to Malaysia.35 We present extensive evidence in support of the
excludability assumption in Section 5.2 below.
The next issue is the choice of estimation method. Hahn, Todd and van der Klaauw (2001)
suggest estimating the treatment effect using two-stage least squares, where equation (8) is the first
stage and equation (7) is the outcome equation. This instrumental variables estimate can be
interpreted as the weighted average treatment effect for the subpopulation affected by the
instrument, that is, a weighted local average treatment affect (LATE). The weights reflect the
likelihood that an individual’s X is near the threshold. Local linear regressions are an alternative
nonparametric way to estimate the treatment effect. These two estimation techniques have become
the standards in the literature (for discussion, see Imbens and Lemieux 2008 and Lee and Lemieux
2010). However, our assignment variable is discrete, since it is measured in months, and this makes
it impossible to compare observations ‘just above’ and ‘just below’ the treatment threshold, as Lee
and Card (2008) discuss extensively. This requires us to choose specific functional forms for the
relationship between the treatment variable and the outcome of interest and, hence, constrains us
to using two-stage least squares.
There are two central issues when using two-stage least squares to estimate the treatment
effect. First, we need to decide on the order of the polynomials f(.) and g(.). The regression function
is allowed to differ on both sides of the threshold by including interaction terms between D and X
(Imbens and Lemieux 2008) in every specification. Second, we need to choose the range of X to
include in the estimation, specifically decide on the degree to which we exclude X that are far from
the threshold.
We follow Lee and Lemieux (2010) in choosing the optimal polynomial model. We first
add the month dummies to the polynomial regressions (7) and (8) and then we jointly test the
significance of these bin dummies. We include up to order six polynomials, and the findings are
corroborated by the Akaike Information criterion. Five different samples are considered: a sample
where all the available data are included and samples where the analysis drops 10, 25, 50, or 75
percent of the X at the tails on either side of the threshold, respectively.
The tests provide clear guidance on the order of the polynomial of X to include in the
regressions. A linear first-stage regression, equation (8), fits the data best, as is clear from figures
35 Unless of course Groucho Marx was to apply since he did claim that “I do not care to belong to a club that accepts people like me as members.” Quoted in Look Magazine , March 28, 1950.
25
10a and 10b, with no additional benefit to higher-order polynomials (above the threshold a constant
provides a marginally better fit). Also, in the outcome regression, equation (7), a first-order
polynomial provides the best fit.36 The main problem with higher-order polynomials is that they
‘over fit’ the data. This results in systematically very large treatment effect estimates, frequently
above one. This finding is consistent with Gelman and Imbens (2014) where they recommend the
use of low-order polynomials. Following the recommendation of Imbens and Lemieux (2008), the
same order polynomial as in the first- and second-stage regressions are included on both sides of
the threshold.
It is standard practice in RD designs to use heteroskedasticity-consistent standard errors to
account for the different number of observations for each X. In the case of a discrete assignment
variable, Lee and Card (2008) recommend using cluster-consistent (clustering on the individual
values of X) standard errors to correct for measurement error. However, the cluster-consistent
standard errors obtained are practically always smaller than the heteroskedasticity-consistent
standard errors and consequently only the robust standard errors are reported.
5.2 The Excludability Assumption
We present evidence on the excludability assumption before we report our estimation
results. It is not obvious that this type of program can be evaluated using a fuzzy RD design. If the
eligibility requirements for the REP were public knowledge, precise and rigidly adhered to, the
program could not be evaluated with the data on applicants. Only those eligible would apply and
the acceptance rate would be 100 percent, leaving no control group to test the impact of the
program. There are two main reasons why we can actually evaluate the efficacy of the REP
program with the existing data.
First, the ‘holistic assessment criteria’ (see Section 2.1) leave considerable leeway for the
Talent Corp decision panel to accept candidates who do not strictly meet the main eligibility
requirements. Even though the approval probabilities are lower for these candidates, it may still
be worthwhile to apply. Indeed, 23 percent of applicants do not meet the work experience abroad
criterion in our sample and 33 percent of those are nevertheless approved. Second, TalentCorp
36 Except when 75 percent of the X are dropped in which case there is a marginal improvement with a second-order polynomial.
26
informally gives most applicants some leeway on the employment duration requirement, on the
assumption that they will continue working abroad until they actually relocate to Malaysia. Based
on the data and discussions with TalentCorp, on average applicants receive up to six months
leeway though there is variability in how this is applied. Applicants do not seem to be fully aware
of this.
As a consequence of the features above, REP applicants do not know the precise experience
threshold that TalentCorp will apply to them while, of course, they know their own characteristics.
With reference to equations (7) and (8), applicants have some control over their X but c is not
known with certainty. In effect, this is the opposite case of the typical RD design where the cutoff
c is known. In a standard example on elections with two candidates, people will know that a little
over 50 percent of the votes are required to win, but the actual percentage of the vote a candidate
receives, X in this case, cannot be controlled precisely. However, as Lee (2008) shows formally,
what is important for identification is that individuals cannot precisely control whether they will
be treated (approved by the REP). That depends on uncertainty in X-c, which REP applicants
certainly face.
An advantage of the RD design is that we can actually test our claim that applicants exercise
imperfect control over their admission to the REP. Specifically, if individuals have imprecise
control over their admission, both observed and unobserved characteristics should be continuously
distributed around the threshold.
In sum, we find that there is strong evidence supporting the hypothesis of no sorting around
the threshold (on observables or unobservables) for those with a pre-existing job offer. For this
group of applicants, the timing of the application decision appears to be driven by the availability
of the job offer, making for a valid fuzzy RD design. For those without a pre-existing job offer the
evidence is more mixed, with a mass of applicants a few months after the threshold.
5.2.1 Discontinuities in Covariates
We check for discontinuities in the covariates at the threshold for 22 variables.37 These are
the fraction of applicants with a bachelor’s degree, master’s degree, PhD, female, married, with
children, a Malaysian spouse, a pre-existing job offer in Malaysia, employed as technical experts,
37 We check all variables in the administrative data with at least 100 observations. We use a quadratic fit of the assignment variable on either side of the threshold.
27
middle management, top management, in a particular industry (oil, gas and energy, electronics,
business services, communication content, education, healthcare, manufacturing); and mean
potential experience, tenure abroad, income abroad and income in Malaysia (for those who return).
We find no statistically significant discontinuity at the threshold (with p-values at least above 0.2)
for 21 of these variables. The only variable that changes discontinuously at the threshold is the
fraction female (a statistically significant 18 percentage point drop). Further exploration shows
that the apparent discontinuity in the fraction female is a consequence of the functional form. In
particular, we find no evidence of a discontinuity when we simply compare means, use a linear,
cubic or quartic specification. Figure 7 depicts the distribution of 8 of the 22 observed variables
by experience abroad, using 3-month bins and a quadratic fit on either side of the threshold.
Most importantly, we find no evidence of a discontinuity in the fraction of applicants with
a pre-existing job offer in Malaysia (Figure 7, last panel). We also divide the sample into those
with and without an existing job offers and check for discontinuities at the threshold for the
remaining 21 variables in both samples. In the sample of applicants with pre-existing job offers,
there is no discontinuity at the threshold in any of the observables (with p-values at least above
0.2). In the sample without pre-existing job offers, we find no statistically significant discontinuity
for 19 of the 21 variables. The two exceptions are the fraction female and the fraction of applicants
working in the communication sector. These two discontinuities are specific to the quadratic
functional form and they also disappear when comparing means and using linear, cubic or quartic
specifications.
5.2.2 Manipulation of the Assignment Variable
The next concern is that there might be discontinuities in unobserved characteristics that
affect the return probability. This cannot be tested directly, but an intuitive test suggested by
McCrary (2008) suggests looking for evidence of sorting around the threshold as a test for such
discontinuities. In our case, we check whether the distribution of the number of applicants by
months of experience abroad is discontinuous at the threshold.
Figure 8a depicts the 8-year interval for the number of applicants by months of experience
abroad. There are a substantial number of applicants on either side of the threshold. The number
of applicants increases with months of experience abroad below the threshold and peaks at 4
months above the threshold, with another spike at 17 months. Figure 8b focuses on a 2-year
window around the threshold. There is no discontinuity exactly at the threshold. However,
28
thereafter the number of applicants rises sharply, reaching on average of 23 in each of the next
three months and then averaging around 25.
Figure 8c presents the number of applicants with a pre-existing job offer. Clearly, there is
no discontinuity in the number of applicants around the threshold. Intuitively this seem plausible,
as the REP application of those with a pre-existing job offer is presumably determined by the
arrival of an attractive job offer and thus does not allow for sorting around the threshold. Indeed,
the average number of monthly applicants before and after threshold is not statistically
significantly different. This is true if we use a windows of 3, 6, 12 or 18 months either side of the
threshold. This strongly supports the hypothesis that for applicants with pre-existing job offer there
is no sorting around the threshold. Indeed, there seems to be near to no sorting at all by months of
experience abroad.
Figure 8d presents the same data for applicants without a pre-existing job offer, which
looks very similar to that for the whole sample. There is no discontinuity at the threshold but we
observe a mass of applicants a few months afterwards. In keeping with the rest of the paper we
present a parametric test for a discontinuity around the threshold. The difficulty is that the number
of applicants (without a pre-existing job offer) is clearly non-linear around the threshold. The main
message of the parametric tests is that there is no evidence of a discontinuity in the number of
applicants, provided a sufficiently high-order polynomial of the assignment variable is used. We
always use symmetric windows around the threshold, up to a maximum of two years below the
threshold, and allow the regression function to differ on both sides of the threshold. Starting at a
6-month window (3-months either side), the mean difference, before and after the threshold, in the
number of applicants becomes statistically significant. The discontinuity of course becomes
insignificant once we include the assignment variable linearly. Starting with a 22-month window
the threshold becomes statistically significant even when we include a linear function of the
assignment variable, but is insignificant when we include a quadratic function. With a 4-year
window a cubic polynomial of the assignment variable is required so that the threshold is not
statistically significant. With the 8-year window, used for most of our graphs, a quartic polynomial
of the assignment variable is required so that there is no statistically significant discontinuity at
the threshold.
Finally, it is worth adding that re-application to the program is possible, and in principle a
concern for the validity of our estimates. In practice, repeat application is not an important feature
29
of the REP. Using 2011-14 data we found only 14 repeat applications from the 2011-12 cohort of
applicants. Of these repeat applicants 11 had initially been approved and only 3 not approved.
Those 3 rejected applicants were 3, 9 and 19 months from threshold. There are simply too few
repeat applications to affect our estimates, and they do not seem to result in any sorting around the
threshold.
5.3 The Fuzzy RD Results
5.3.1. Applicants with Pre-Existing Job Offers
In a fuzzy RD design, it is not treatment (the approval decision) that is randomized, but
rather the ‘intent to treat’ (whether an individual is above or below the threshold) that is locally
randomized. Figures 9a and 9b depict the intent-to-treat effect by showing scatter plots of the
probability of return plotted against the assignment variable (months of work experience) using
monthly and quarterly bins, both figures include a linear best-fit line. There appears to be a
discontinuity in the return probability at the threshold, though the data is very noisy, making it
difficult to see whether the discontinuity is statistically significant.
The two-stage least square results are presented in Table 4. We report results without
additional covariates (apart from the assignment variable interacted with the threshold) and with a
full set of covariates,38 and for the five different samples of assignment variable X (where X that
are far from the threshold are excluded). The first stage is highly significant in every specification,
though the first-stage F-statistic decreases as the sample size decreases. The estimated causal
impact of the program on the return probability is large and statistically significant (except for the
smallest sample). The point estimates increase as the sample size reduces, perhaps suggesting that
the return migration decision of applicants close to the threshold is more sensitive to the approval
decision. The inclusion of a large set of covariates does not substantially affect the estimates.
The point estimates suggest that approval to the REP increases the probability of returning
to Malaysia by 40 percentage points for those individuals who have a pre-existing employment
offer in Malaysia (in the full sample without covariates). And the impact is possibly as large as 60
or 70 percentage points. This is clearly a huge impact, though we need to emphasize that it is a
LATE estimate and thus, only applies to applicants around the threshold. Specifically, the model
38 The covariates are polynomials of income abroad, duration in the current job and potential experience, a dummy for marital status, female, year, education and industry fixed effects.
30
suggests that the fuzzy RD is identifying the direct effect of the program (Direct), scaled by the
fraction of applicants among the population of expatriates, over the range of approval probabilities
at the discontinuity. The fuzzy RD is identifying the impact of a higher approval probability for
identical applicants, in particular, with the same expected approval probability. In other words, it
is the LATE for applicants with different p but identical (p). Our theoretical framework also
suggests that the MTE increases with the approval probability (see Figure 2a). Hence, we would
expect the impact of the program to be smaller for those further below the threshold. In Section
5.4, below, we use the model to extrapolate to applicants away from the threshold providing a
marginal treatment effect at different approval probabilities.
5.3.2. Applicants without Pre-Existing Job Offers
Figures 10a and 10b are scatter plots of the probability of return plotted against the
assignment variable. Thus they depict the intent-to-treat effect of the REP for applicants without
pre-existing job offers. There does not appear to be a discontinuity in the return probability for this
group of applicants. The two-stage least squares estimates, presented in Table 5, confirm this
impression. The point estimates are small and positive but not statistically significant, despite
having a highly significant first-stage.
Our theoretical framework, see Figure 2b, suggests why this is likely the case. The REP
changes the financial incentives to returning to Malaysia (broadly proportional to income in
Malaysia). However, applicants without a pre-existing job offer (those on the right side of the
dashed line) are not applying for job-related reasons. In the terminology of the model, they have
high non-pecuniary benefits (v/wa), not high relative wages (wm/wa). Consequently, this group of
applicants does not contain many individuals whose decision is swayed by a (marginal) change in
the financial incentives to return, i.e. there are fewer compliers among the applicants.
5.4 Using the Model to Identify Marginal Treatment Effects
The fuzzy RD design provides a LATE estimate of the impact of REP approval only around
the discontinuity in the approval probability. With the help of our theoretical framework, we can,
however, estimate the MTE for all observed approval probabilities (for those applicants with a pre-
existing job offer). Section 3.3 outlines how to identify the marginal direct, indirect and total
marginal treatment effect from the observed data.
The data show that return probability declines with the approval probability (see Figure
31
5a). Based on that relationship we can identify the share of applicants that are compliers. The fuzzy
RD design estimates suggest that the share of compliers is between 40 and 70 percent of applicants
around the discontinuity. The model estimates fall at the upper-end of that range with 64 percent
of the sample as compliers. As predicted by the theoretical framework, the fraction of compliers
among applicants decreases as the approval probability falls. At an approval probability of 10
percent the share of compliers is only 9 percent.
To go from the fraction of compliers among applicants to estimates of the impact of the
program on the return rate among all expatriates (and not just applicants) we need to know the
fraction of expatriates (at each p) that apply to the REP. The UK Labor Force Survey and the
American Community Survey data suggest that over the relevant range of approval probabilities
(based on years of work experience abroad) the distribution of expatriates is uniform, and for those
above the threshold the application rate (Np/N) is 1.47 percent. The application rate is lower at
lower approval probabilities.
We present the total, direct and indirect treatment effects by approval probability in Figure
11. The x-axis depicts the REP approval probability from 10 percent to 44 percent (which is just
below the discontinuity). The direct MTE of program approval on the expatriate return probability
is simply the fraction of compliers at each p multiplied by the application rate. It is around 0.1
percentage points at p of 10 percent and 1 percentage point at the discontinuity (and presumably
thereafter). This is the MTE that is relevant for evaluating the ATE of the REP as compared to no
program at all. We weight our estimates of the MTE by the share of applicants at each approval
probability (recall that three-quarters of applicants are above the threshold) to obtain the ATE of
the program. We find an ATE of 57 percentage points, somewhat below the estimate at the
discontinuity since the program is less effective at lower approval probabilities.
In addition to the direct effect an increase in the approval probability will also induce more
applications to the REP. We calculate that this indirect impact of changing the approval probability
by 1 percentage point. At the margin this indirect impact tends to be larger than the direct effect,
and it too increases with the approval probability. It is 0.12 percentage points at p equal to 0.1 and
1.9 percentage points just below the threshold. The total MTE is given by the sum of direct and
indirect effects. For example, at a 40 percent approval probability the total effect is 2.2 percentage
points.
5.5 The Migration Elasticity
32
In order to compare the magnitude of these treatment effect estimates more broadly, we
quantify the benefits provided by the REP and express them as a fraction of income. We use
TalentCorp administrative records on the actual expenditure on imported cars by approved and
returned applicants to assess the value of the tax exemption on cars. Combining this information
with the records on applicant wages, and annuitizing the value of the car over ten years, allows us
to calculate these cars’ share in total expenditures. We calculate that share to be 4.9 percent of
income over ten years when the subsidy is in place for an average applicant. The average subsidy
for these cars is nearly exactly 100 percent of the pre-tax price of the car. Assuming Cobb-Douglas
preferences we then calculate the equivalent variation of that subsidy to be 3.44 percent of income
over ten years. For the 15 percent flat income tax offered by the REP, we calculate the effective
average tax rate for approved and returned applicants. The top marginal tax rate is 25 percent in
Malaysia and the average tax rate for the average REP applicant is 19 percent. Hence, the flat tax
is effectively a 4-percentage point income tax reduction over 5 years. 39
The tax cuts offered by the REP are temporary, just like in the Danish scheme, and hence
the estimates of the return migration elasticity crucially depend on the time period under
consideration. We evaluate the policy over the duration of the income tax break, in our case 5
years. Our estimate of the total effective tax subsidy over 5 years is 10.9 percentage points. Hence,
the average net-of-tax rate increases from 74.1 to 85 percent due to the REP.
The weighted treatment effect is an 11-percentage point increase in the return probability,
from a baseline return probability of 64 percent, for all REP applicants whether they have a pre-
existing job offer or not. This implies a migration elasticity of /
/ .1.2.
Our estimate of the migration elasticity is slightly lower than the migration elasticity (with
respect to the net-of-tax rate) of 1.5 found by Kleven, Landais, Saez, and Schultz (2014) for the
Danish tax scheme for foreigners. Of course the two estimates are not directly comparable. First,
the Danish scheme provides benefits for only 3 years while we evaluate the REP benefits over 5
years. Second, the Danish scheme predominantly targets internationally mobile foreigners, who
have a choice between going to Denmark or elsewhere. REP specifically targets Malaysian
39 Throughout these calculations we assume that the income of returned expatriates with REP approval grows over time at the same rate as their discount rate. The evidence on wage growth rates of a comparable sample of individuals in the Malaysian LFS, with annual real wage growth of 4.4 percent over ten years, suggests that this is plausibly correct. We do not attempt to quantify the value of permanent residency status for a foreign spouse and children.
33
expatriates. However, both groups have demonstrated a willingness to move as a result of the tax
benefits so it is not entirely surprising that the net-of-tax migration elasticities are similar.40 What
is perhaps more surprising is that, given the large impact on foreigners, Kleven, Landais, Saez,
and Schultz (2014) find no impact on Danish expatriates’ likelihood to return to Denmark. Our
findings clearly contradict their suggestion that taxes can be used to attract foreign high-skilled
workers without affecting the incentives of those born in a country.
6. The Fiscal Impact of the REP
The REP has a large, positive impact on the probability of an approved applicant returning
to Malaysia for the subset of applicants with a pre-existing job offer. The main motivation of the
government in implementing this program is to realize the economy-wide spillovers that the return
of the highly skilled expatriates may generate. However, these programs create significant political
opposition as they benefit those who are already in high income, typically in the top 1 percent in
Malaysia. The fiscal impact, therefore, becomes an important metric that needs to be calculated.
There are four distinct costs that arise from the REP. First, there are the costs of
administering the program. Second, there is the cost of foregone tax revenues for the expatriates
who would have returned even in the absence of the REP, but still take advantage of the tax break
for five years. Third, there is the tax exemption on cars. Fourth, there are additional public
expenditures (such as education) as the REP attracts additional people back to Malaysia.
The direct fiscal benefits of the REP arise from the fact that it induces additional high-
income people to return to Malaysia. These people pay consumption and income taxes, even if at
a lower rate for five years for the latter one. A growing literature suggests that high-skilled
individuals also generate productivity spillovers for other workers, encouraging innovation and
growth (see Kerr 2013 for an overview). The existence of the REP is entirely motivated by these
possible positive externalities. However, the available data for Malaysia do not allow us to assess
these external benefits.41
40 Also related are Kleven, Landais, and Saez (2013) and Akcigit, Baslandze, and Stantcheva (2015) who find that the migration elasticity of foreign football players in Europe and the number of foreign superstar inventors, respectively, is around 1. 41 We also do not attempt to assess the additional impact high-skilled expatriates’ tied-mover spouses and children might have on the Malaysian economy. The fiscal impact of REP applicant spouses is difficult to determine since we do not have information on these (other than from a non-representative follow-up survey). Though they too tend to be high skilled and so would generate additional fiscal benefits for the Malaysian economy provided they work (and female labor force participation tends to be low in Malaysia, see Peck and Gibson 2013). Similarly, the children of
34
Income and Consumption Taxes
In evaluating the fiscal impact of the REP, the analysis is limited to the sample of applicants
who have returned to Malaysia and for whom a wage is observed. Their age-specific wage growth
is imputed using a comparable sample of individuals from the Malaysian LFS for 2007–10.42
Finally, the top and bottom 1 percent of wage earners in Malaysia are excluded from the analysis
so as to reduce measurement error in the extreme tails of the income distribution. The most current
income tax schedule is used to calculate the fiscal impact. The analysis assumes that 70 percent of
people’s income is consumed as the savings rate for high-income earners in Malaysia is below 30
percent (based on the latest Household Expenditure Survey) and around two-thirds of consumption
is taxed at the 6 percent sales tax.
We assume that individuals work until they are 64 years of age and that the re-migration
rate of returnees (from Malaysia) is 1 percent per annum.43 Further, the government discount rate
is assumed to be equal to the rate of economic growth, so that the government has no pure time
preference. In practice, the nominal of return on long-term Malaysian government bonds over the
past several years has been around 4.5 percent, significantly lower than the expected growth rate.
Car Taxes
Malaysia has very high tax rates on the import and sale of motor vehicles (around 120
percent for medium-sized imported vehicles, 90 percent for completely knocked down vehicles
and above 250 percent for luxury models). The average tax break provided by REP for these cars
is considerable. TalentCop administrative records suggest that the average tax break for a CBU is
about RM 375,000 and for a CKD vehicle about RM 73,000.44 In practice, the average applicant
took advantage of the tax break for more than one car. These numbers do not, however, reflect the
foregone taxes to the Malaysian government.
returnees will tend to be high skilled and now more likely to remain in Malaysia yielding additional long-term benefits for the economy. 42 The sample from the Malaysian LFS includes only individuals between the ages of 25 and 64 years, with an educational qualification beyond high school completion, and employment in the same 3-digit occupations as the REP applicants. The (log) wage regression includes a fourth-order polynomial in age (minus 25), a female dummy, and education, industry, and year fixed effects. 43 The remigration rate is found with the help of a survey conducted in 2014 in which REP applicants are asked whether they are currently living in Malaysia. Matching the survey to the TalentCorp administrative data allows estimation of a remigration rate. 44 Approved applicants used to be able to take advantage of the tax break for two CKD cars (pre-April 2014). Since April 2014 they only receive the tax break for one CKD/ Complete Built-Up CBU) car limited to RM150, 000 in taxes and duties. This policy change can, potentially, impact the incentives and outcomes of the program. In a future evaluation of the program, this point needs to be clearly taken into account.
35
To assess the foregone taxes from the tax exemption on vehicles, we need an estimate of
the type of car a returning expatriate would have bought in the absence of the tax exemption. In
this scenario, the return migrants are likely to buy considerably less expensive cars and pay lower
taxes. We proceed, as in Section 5.3 above, by assuming that return migrants’ total expenditure on
cars would have been the same with and without the program (i.e. unit elastic demand). Moreover,
the foregone taxes only apply to those people who would have returned to Malaysia even in the
absence of the REP.
Other Costs
The REP generates two additional costs: administrative costs and government expenditures
due to those additional people who return on account of REP. A total cost of around RM 10,000
per month is estimated for the administrative cost to undertake the processing of REP
applications.45 To estimate the public expenditures on goods and services that arise due to the
returning expatriates we include all government expenditures except for defense, education, debt
service charges and transfer payments. The remaining public expenditures amounted to around
RM 2,375 per capita in 2011. We assume that these public expenditures continue to arise for each
returnee until age 85 (provided that they do not re-migrate).
Cost-Benefit Analysis
The results of the cost-benefit analysis are presented in Table 6. Each column corresponds
to a different scenario. In the first column we use the OLS estimate for the whole sample (including
a full set of covariates): a 12-percentage point increase in the return probability due to REP
approval. The next two columns are based on the fuzzy RD design estimates of the program impact
for those with a pre-existing job offer, and assume no impact for those without a pre-existing job
offer. The lower and upper bounds correspond to an estimated impact of 40.0 and 61.9 percentage
points respectively. The fourth column uses the model-based estimate of the ATE of the program
(56.9 percentage points) for those with a pre-existing job offer and assumes no impact for everyone
else. All costs and benefits are discounted to the present in current Malaysian ringgit.
The per applicant net fiscal benefit estimates of the REP program are modest and centered
around zero, suggesting that the program is likely pay for itself. At the lower-end, the two-stage
45 These costs do not include the overhead that accrues from the operations of TalentCorp (which includes a large number of programs), nor does it include the information campaigns to disseminate knowledge about the program.
36
least square estimates suggest a net cost of RM 20,576 (around $6,900) per applicant, while we
find net benefits of RM 12,683 (around $4,200) at the upper-end. We obtain these estimates despite
the assumption that there is no treatment effect for three-quarters of all applicants. The OLS
estimates are very close to the upper-bound of the RD estimates, and the model-based estimates
show smaller net benefits (RM 5,090 or around $1,700 per applicant). Recall that these are the net
present discounted value of benefits, accruing on average around 30 years, and hence these costs
or benefits are modest.
Gross benefits and costs are much more substantial, around RM 80-95,000 per applicant.
Most of the benefits accrue due to higher income taxes as additional expatriates return to Malaysia,
with consumption taxes a lot less important. Foregone income and vehicle taxes are equally
important as all approved expatriates (including those who would have returned in the absence of
the REP) can take advantage of the tax breaks. The estimated additional public expenditures are
less important and are effectively covered by the consumption taxes collected. While fiscal costs
and benefits are broadly balanced, the costs tend to arise during the first five years (the foregone
vehicle and income taxes), while the benefits (additional income and consumption taxes) accrue
throughout the working-life of a return migrant.
7. Conclusions
High-skilled expatriates returning to their home countries can generate significant
economic, social and cultural benefits. Implementing policies to encourage these flows can be an
important way in which a country can gain from integration of global labor markets for the highly
skilled. This paper provides the first evidence on a major program incentivizing high-skilled
expatriates to return. The program is highly successful for a subset of applicants: those who already
have a job offer in Malaysia. Our fuzzy RD estimates suggest that REP approval leads to a 40 –
70 percentage point increase in their return probability. These applicants would not have returned
to Malaysia without the incentives provided by the REP. The fiscal cost-benefit analysis implies
that the REP roughly pays for itself, even without taking into account potentially significant
external benefits, which motivate the implementation of the program in the first place. The
Malaysian REP is a program that other countries may want to replicate. The focus on the high-
skilled diaspora also limits the risks of tax competition between countries, reducing the negative
spillovers across countries.
37
The REP is a new program, beginning in 2011, and new issues may arise as it continues to
operate. It is conceivable that – if effective in encouraging return migration – it may also encourage
outward migration of high-skilled Malaysians. In particular, it may reduce the perceived risks
associated with a failed migration experience by subsidizing return. The design of the program
mitigates this problem as it requires three years of continued employment abroad, and has recently
introduced income requirements for eligibility. Hence, the REP does not provide a safety net
against failed migration experiences, and is also unlikely to attract an adversely selected applicant
pool. Indeed, if it encourages outward migration by encouraging return, then the end result might
be a further increase in brain circulation, and possibly greater gains.
38
References Akcigit, Ufuk, Salome Baslandze and Stefanie Stantcheva (2015). “Taxation and the International
Mobility of Inventors,” mimeo. Antecol, H., Cobb-Clark, D.A., Trejo, S.J (2003). “Immigration policy and the skills of immigrants
to Australia, Canada, and the United States,” Journal of Human Resources, XXXVIII (1), 192–218.
Arslan, C., J-C Dumont, Z. Kone, Y. Moullan, C. Parsons, Ç. Özden and T. Xenogiani (2015), “A New Profile of Migrants in the Aftermath of the Recent Economic Crisis”, OECD Social, Employment and Migration Working Papers, No. 160, OECD.
Artuç, E., Docquier, F., Özden, Ç., Parsons, C. (2015). “A global assessment of human capital mobility: the role of non-OECD destinations,” World Development, 65, 6–26.
Aydemir, A. (2011). “Immigrant selection and short-term labor market outcomes by visa category,” Journal of Population Economics, 24 (2), 451–475.
Bakija, Jonathan, and Joel B. Slemrod (2004). ‘‘Do the Rich Flee from High State Taxes? Evidence from Federal Estate Tax Returns,’’ NBER Working Paper, No. 10645.
Belot, M. and Hatton, T. (2012). “Skill selection and immigration in OECD countries,” Scandinavian Journal of Economics, 114 (4), 1105–1128.
Bertoli, Simone, Herbert Brücker, Giovanni Facchini, Anna Maria Mayda, and Giovanni Peri (2012). “Understanding Highly Skilled Migration in Developed Countries: The Upcoming Battle for Brains.” In Brain Drain and Brain Gain: The Global Competition to Attract High-Skilled Migrants, edited by Tito Boeri, Herbert Brucker, Frederic Doquier, and Hillel Rapoport, Oxford University Press.
Docquier, F., Faye, O. and Pestieau, P. (2008). “Is migration a good substitute for education subsidies?” J. Dev. Econ. 86, 263–276.
Docquier, Frédéric and Hillel Rapoport (2012). “Globalization, brain drain and development”, Journal of Economic Literature, 50, 3, 681-730.
Doran, Kirk, Alexander Gelber and Adam Isen (2016). “The Effects of High-Skill Immigration Policy on Firms: Evidence from Visa Lotteries,” mimeo.
Doran, Kirk and George Borjas (2012). “The Collapse of the Soviet Union and the Productivity of American Mathematicians,” Quarterly Journal of Economics, Volume 127, Issue 3, pp. 1143-1203.
Dos Santos, Domingues and Fabien Postel-Vinay (2003). “Migration as a Source of Growth: The Perspective of a Developing Country”, Journal of Population Economics, 16(1), 161-75.
Dustmann and Kirchkamp (2002). “The Optimal Migration Duration and Economic Activities after Re-Migration,” Journal of Development Economics, 67, 351-372.
Freeman, Richard and Wei Hung (2015). “Freeman RB, Huang W. “China’s ‘Great Leap Forward’ in Science and Engineering.” In Aldo Geuna (editor), Global Mobility of Research Scientists: The Economics of Who Goes Where and Why, Elsevier.
Gibson, John and David McKenzie (2011). “Eight questions about Brain Drain,” Journal of Economic Perspectives, 25(3): 107-28.
39
Gibson, John and David McKenzie (2012). “The Economic Consequences of “Brain Drain” of the Best and Brightest: Evidence from Five Countries”, Economic Journal, 122: 339-75.
Hahn, Jinyong, Petra Todd, and Wilbert van der Klaauw (2001). “Identification and Estimation of Treatment Effects with a Regression-Discontinuity Design.” Econometrica, 69(1): 201–09.
Imbens, Guido W., and Thomas Lemieux (2008). “Regression Discontinuity Designs: A Guide to Practice.” Journal of Econometrics, 142(2): 615–35.
Imbens, G. and J. Angrist (1994), “Identification and Estimation of Local Average Treatment Effects,” Econometrica, Vol. 61, No. 2, 467-476.
Jasso, G. and Rosenzweig, M.R. (2009). “Selection criteria and the skill composition of immigrants: a comparative analysis of Australian and U.S. employment immigration.” In: Bhagwati, J., Hanson, G. (Eds.), Skilled Migration Today: Phenomenon, Prospects, Problems, Policies. Oxford University Press, pp. 153–183.
Kerr, William (2013). “U.S. High-Skilled Immigration, Innovation, and Entrepreneurship: Empirical Approaches and Evidence.” In Innovation, Intellectual Property, and Economic Development, edited by Carsten Fink and Ernest Miguelez. Cambridge, UK: Cambridge University Press.
Kirchgassner, Gebhard, and Werner Pommerehne (1996).‘‘Tax Harmonization and Tax Competition in the European Union: Lessons from Switzerland,’’ Journal of Public Economics, 60, 351–371.
Kleven, Henrik, Camille Landais, and Emmanuel Saez (2013). ‘‘Taxation and International Migration of Superstars: Evidence from the European Football Market,’’ American Economic Review, 103, 1892–1924.
Kleven, Henrik, Camille Landais, Emmanuel Saez, and Esben Schultz (2014). “Migration and Wage Effects of Taxing Top Earners: Evidence from the Foreigners' Tax Scheme in Denmark”, Quarterly Journal of Economics, 129(1), 333-378.
Lee, David and David Card (2008). “Regression Discontinuity Inference with Specification Error,” Journal of Econometrics, 142(2): 655–74.
Lee, David and Thomas Lemieux (2010). “Regression Discontinuity Designs in Economics,” with, Journal of Economic Literature, 48(2), 281-355.
Liebig, Thomas, Patrick A. Puhani, and Alfonso Sousa-Poza (2007). ‘‘Taxation and Internal Migration: Evidence from the Swiss Census using Community-Level Variation in Income Tax Rates,’’ Journal of Regional Science, 47, 807–836.
McCrary, Justin (2008). “Manipulation of the Running Variable in the Regression Discontinuity Design: A Density Test,” Journal of Econometrics, 142(2): 698–714.
McKenzie, David and Dean Yang (2015). “Evidence on policies to increase the development impacts of international migration,” World Bank Research Observer.
Moretti, Enrico and Daniel Wilson (2015). “The Effect of State Taxes on the Geographical Location of Top Earners: Evidence from Star Scientists,” mimeo.
40
Moser, Petra, Alessandra Voena and Fabian Waldinger (2014). “German Jewish Émigrés and US Invention,” American Economic Review, Volume 104(10), pp. 3222-55.
OECD (Organisation for Economic Co-operation and Development) (2011), ‘‘The Taxation of Mobile High-Skilled Workers,’’ chapter 4 in OECD Tax Policy Study No. 21: Taxation and Employment.
Peri, Giovanni, Chad Sparber and Kevin Shih (2015). “STEM Workers, H-1B Visas, and Productivity in US Cities,” Journal of Labor Economics, Vol. 33 (No. S1, US High-Skilled Immigration in the Global Economy): S225-S255.
Tan, Peck and John Gibson (2013). “Impact of foreign maids on female labor force participation in Malaysia,” Asian Economic Journal, 27, 2, 163-183.
Thom, Kevin (2010). “Repeated Circular Migration: Theory and Evidence from Undocumented Migrants,” mimeo.
Young, Cristobal and Charles Varner (2011), ‘‘Millionaire Migration and State Taxation of Top Incomes: Evidence from a Natural Experiment,’’ National Tax Journal, 64 (2011), 255–284.
Zweig, J. (2006). “Learning to compete: China’s efforts to encourage a “ reverse brain drain.” In Competing for Global Talent, edited by Christiane Kuptsch and Eng Fong Pang, International Labour Organization (International Institute for Labour Studies).
41
Figure 1: The Return Migration Decision for Expatriates
Notes: We scale all variables by an expatriates wage abroad . The non-wage utility associated
with returning, relative to remaining abroad, / , is on the x-axis. The relative wage in Malaysia,
/ is depicted on the y-axis. There are three types of people and the solid lines depict the
relevant cutoffs. The 45-degree line 1 separates always-returners from the compliers
and the line 1 / / 1 separates the compliers from the never-returners.
42
Figure 2a: Application and Return Decision for Expatriates With a Pre-Existing Job Offer
Notes: We scale all variables by an expatriates wage abroad . The non-wage utility associated
with returning, relative to remaining abroad, / , is on the x-axis. The relative wage in Malaysia,
/ is depicted on the y-axis. The solid lines depict the relevant cutoffs for the return decision,
the dotted lines the cutoffs for the application decision. The never-returners are in region R3 and
they do not apply or return. The compliers are split into two sub-groups. Region A2 include those
compliers who will apply and return if approved. The compliers in region R2 do not find it
worthwhile to apply and do not return. The always-returners are also split into two groups. Those
in region A1 apply to REP but return regardless of the outcome of the application. Those in R1 do
not apply but return nevertheless.
43
Figure 2b: Application and Return Decision for Expatriates Without a Pre-Existing Job
Offer
Notes: We scale all variables by an expatriates wage abroad . The non-wage utility associated
with returning, relative to remaining abroad, / , is on the x-axis. The relative wage in Malaysia,
/ is depicted on the y-axis. The solid lines depict the relevant cutoffs for the return decision,
the dotted line the relevant cutoff for the application decision. The application decision is made
before applicants know their type (always-returners, compliers and never-returners) and hence
there are applicants of all types (in regions A1, A2, A3). Only always-returners (regions R1 and
A1) and REP approved compliers (those approved in region A2) actually return.
44
45
46
47
48
0
0.005
0.01
0.015
0.02
0.025
0.03
0.1 0.15 0.2 0.25 0.3 0.35 0.4
Treatment Effects (in Percentage
Points)
Approval Probability (p)
Figure 11: Impact of Changes in the Approval Probability on the Return Probability (Model-Based)
Direct Effect (δ‐Direct) Indirect Effect (δ‐Indirect) Total Effect (δ‐Total)
49
Table 1: Summary Statistics Education (%) Job Title (%) Bachelor 48.4 Top Management 11.9 Diploma 3.5 Middle Management 35.9 Master 41.5 Technical Experts 51.3 PhD 6.6 Country of Residence (%) Other Demographics (%) United Kingdom 16.7 Female 23.3 Singapore 15.3 Married 67.6 China 10.7 Foreign Spouse 16.3 Australia 7.7 Job Offer in Malaysia 19.5 USA 7.7 Mean Age (yrs) 38.3 UAE 6.1 Mean Exp. Abroad (yrs) 7.3 Qatar 5.2 Ireland 3.6 Industry (%) Taiwan, China 3.2 Business Services 32.4 Saudi Arabia 3.1 Manufacturing 13.1 Brunei 2.6
Communication Content 12.3 Hong Kong SAR, China 2.4
Healthcare 11.4 Japan 1.8 Oil, Gas & Energy 10.5 New Zealand 1.7 Electronics & Electrical 9.0 Vietnam 1.6 Education 6.2 Labor Income (in US dollar, Purchasing Power Parity) Mean Median Interquartile Abroad 120,164 84,108 86,280 Malaysia (All) 137,067 106,849 115,069 Malaysia (Offer) 143,772 112,500 131,944 Log Malaysia/Abroad 0.112 0.105 0.784 Log Offer/Abroad 0.063 0.111 0.726 Note: summary statistics for full sample of 1654 applicants, except labor income information. Foreign income is available for 1108 applicants, Malaysian income for 770 approved applicants who returned, and income of those with a pre-existing job offer in Malaysia for 283.
50
Table 2: Summary Statistics for UK and US Diaspora and Applicants United Kingdom United States Applicants Diaspora Applicants Diaspora Stock 9,142 10,033 Inflow 185 611 95 490 Education (%) Bachelor 34 58 47 54 Master 51 31 37 37 PhD 13 11 13 8 Other Demographics Female (%) 38 61 28 45 Married (%) 58 61 44 64 Mean Age (years) 35 36 36 38 Years in Country 7 15 8 15 Labor Income (in 2012 US dollars, Purchasing Power Parity) Income (mean) 79,666 58,672 105,815 90,642 Income (median) 64,635 53,504 83,130 75,959 Observations 276 214 127 488 Note: summary statistics for the UK and US diaspora are from UK Labour Force Survey (2009-12) and the American Community Survey (2008-12) respectively. The applicant flow and the diaspora inflow and stock are annual averages.
Table 3: Return Probabilities of REP Applicants With Job Offer Without Job Offer
Approved Not Approved Approved Not
Approved Returned 231 56 738 158 93% 76% 69% 60% Not Returned 17 18 332 104 7% 24% 31% 40% Total 248 74 1,070 262
51
Table 4: Impact of REP Approval on Return Probability, Applicants With Pre-Existing Job Offer, 2SLS Estimates
Note: sub-samples are based on excluding values of the assignment variable that are far from the threshold. The covariates are polynomials of income abroad, duration in the current job and potential experience, a dummy for marital status, female, year, and education and industry fixed effects. *, **, and *** denote significance at the 10, 5 and 1 percent significance levels respectively.
Table 5: Impact of REP Approval on Return Probability, Applicants Without Pre-Existing Job Offer, 2SLS Estimates
Full
Sample 90%
Sample 75%
Sample 50%
Sample 25%
Sample No Additional Covariates REP Approval 0.032 0.028 0.025 0.044 0.208 0.118 0.158 0.205 0.311 0.464 First-Stage F-Statistic 79 42 25 11 4.7 Full Set of Covariates REP Approval 0.017 0.035 0.047 0.077 0.220 (0.118) (0.158) (0.205) (0.311) (0.464) First-Stage F-Statistic 76 41 24 10 5.7 Observations 1332 1205 1013 674 341 Note: sub-samples are based on excluding values of the assignment variable that are far from the threshold. The covariates are polynomials of income abroad, duration in the current job and potential experience, a dummy for marital status, female, year, and education and industry fixed effects. None of the estimates are statistically significant.
52
Table 6: Fiscal Costs and Benefits of REP per Applicant (in current RM) Scenarios OLS 2SLS - Lower 2SLS - Upper Model-Based Additional Taxes Due to REP (in present discounted value) Income Taxes 82,958 53,922 83,445 76,705 Consumption Taxes 11,484 7,464 11,551 10,618 Total Benefits 94,441 61,387 94,996 87,323 Additional Costs Due to REP (in present discounted value) Processing Costs 114 114 114 114 Foregone Income Taxes 35,352 37,040 35,324 35,716 Foregone Vehicle Taxes 36,111 37,835 36,082 36,482 Public Expenditures 10,729 6,974 10,792 9,921 Total Costs 82,307 81,962 82,313 82,233 Net Benefits 12,134 -20,576 12,683 5,090
Note: estimated magnitude of treatment effects: OLS = 0.120, 2SLS-Lower = 0.400, 2SLS-Upper = 0.619, Model-Based (weighted sum of estimated MTE) = 0.569. OLS effect is for whole sample, 2SLS and Model-Based is only for those with pre-existing job offer, 19.5% of sample, for everyone else the treatment effect is assumed to be equal to zero. 1 Malaysian Ringitt (RM) is around 1/3 US$.