64
Global Warming 011
| Date post: | 20-Dec-2015 |
| Category: |
Documents |
| View: | 214 times |
| Download: | 0 times |
Global Warming
011
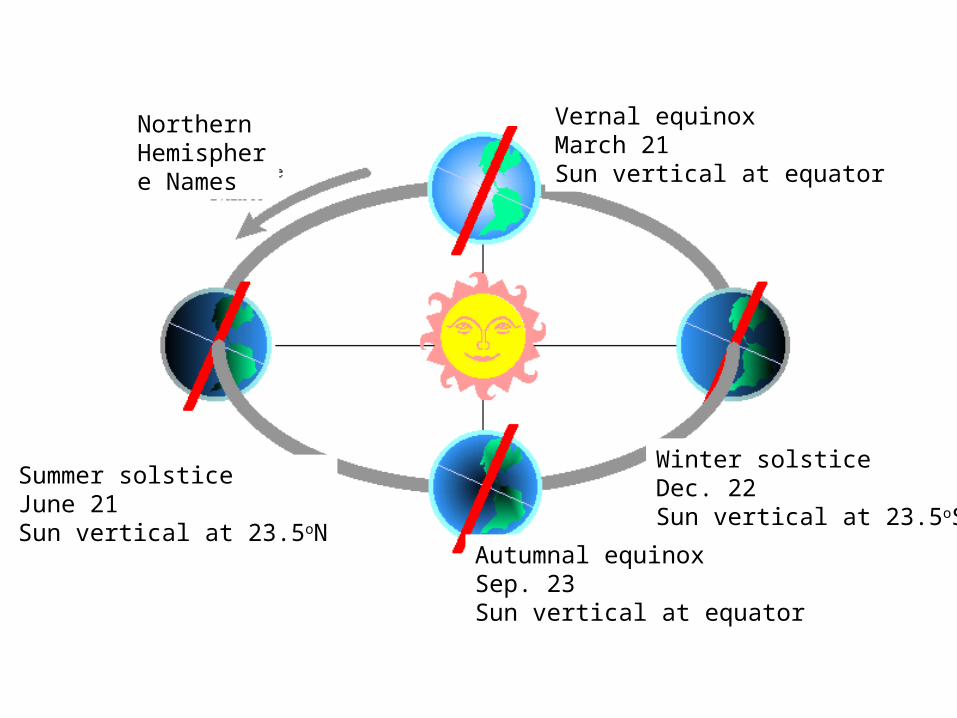
Winter solsticeDec. 22Sun vertical at 23.5oS
Winter solsticeDec. 22Sun vertical at 23.5oS
Autumnal equinoxSep. 23Sun vertical at equator
Summer solsticeJune 21Sun vertical at 23.5oN
Vernal equinoxMarch 21Sun vertical at equator
Northern Hemisphere Names
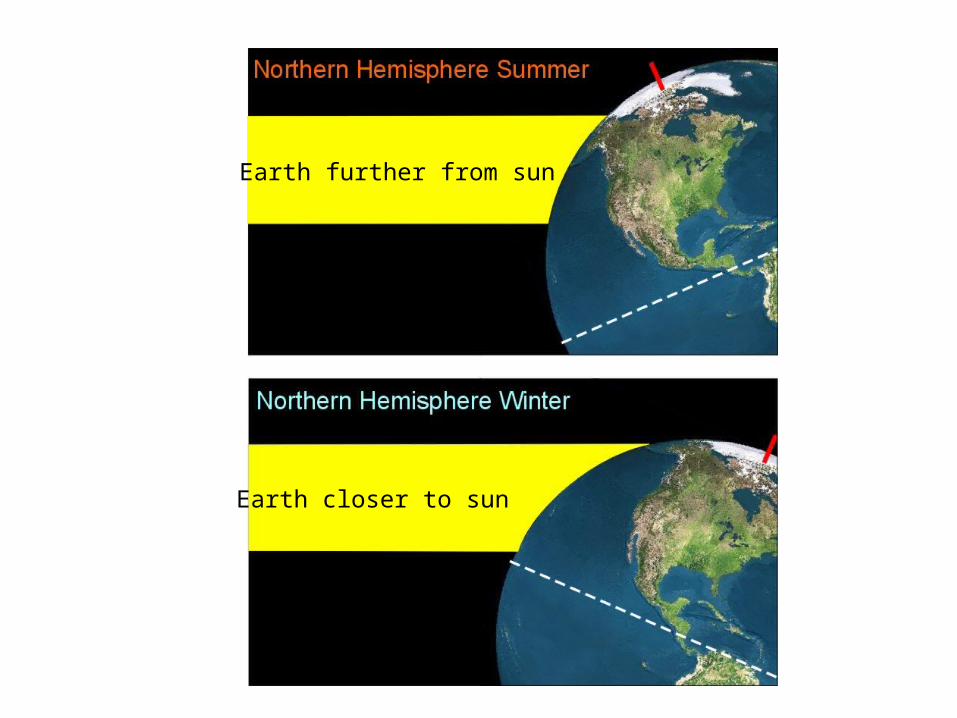
Earth further from sun
Earth closer to sun
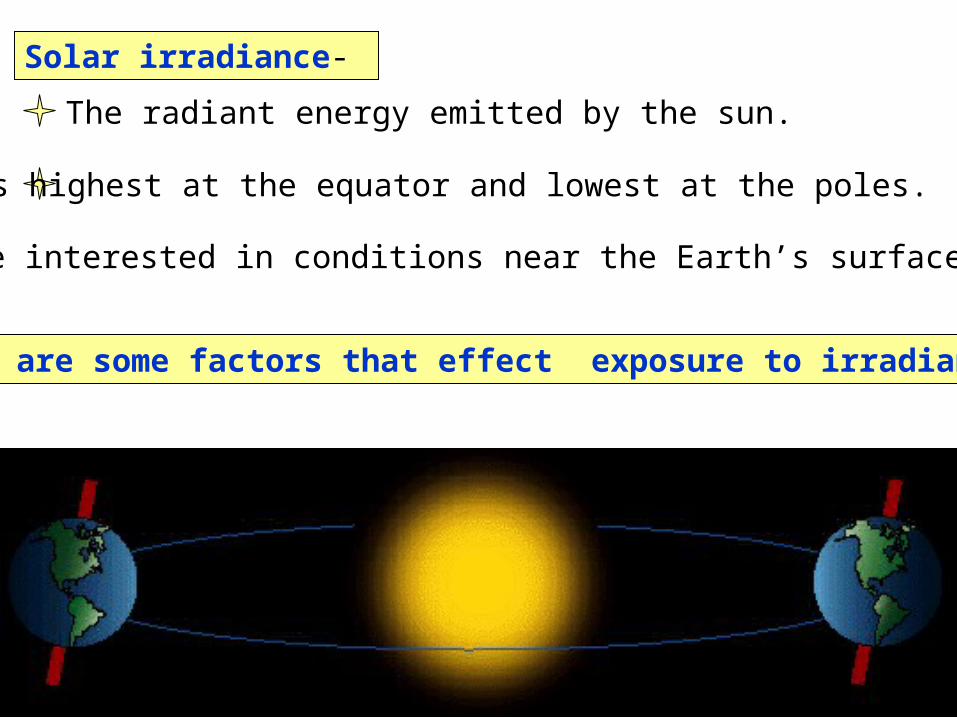
Solar irradiance-
What are some factors that effect exposure to irradiance?
The radiant energy emitted by the sun.
It is highest at the equator and lowest at the poles.
We are interested in conditions near the Earth’s surface

Convection cell model
Non-rotating Earth
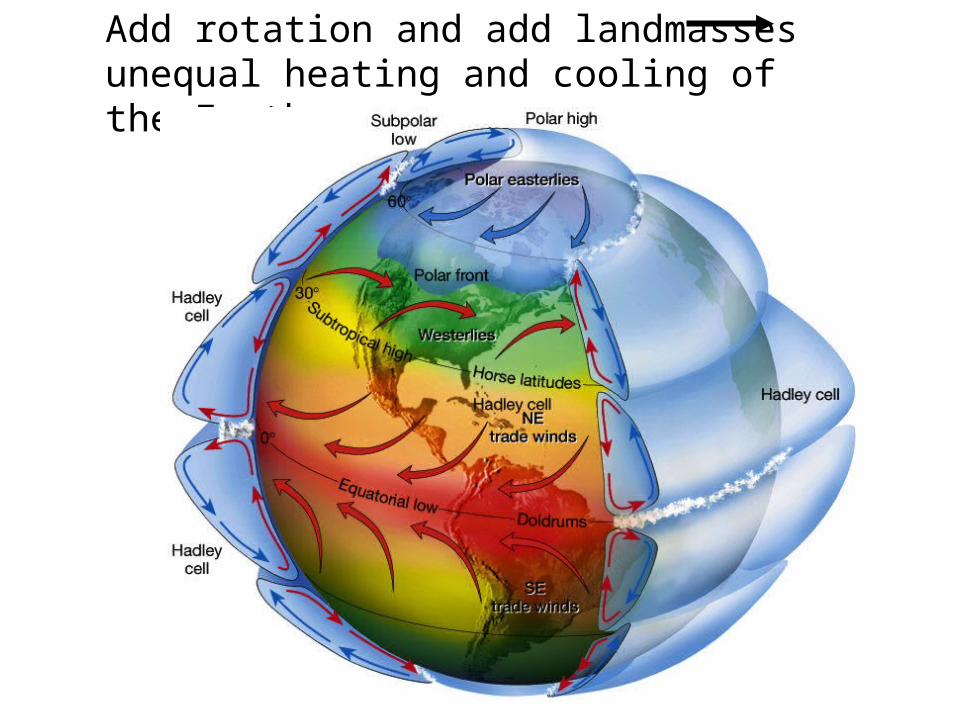
Add rotation and add landmasses unequal heating and cooling of the Earth
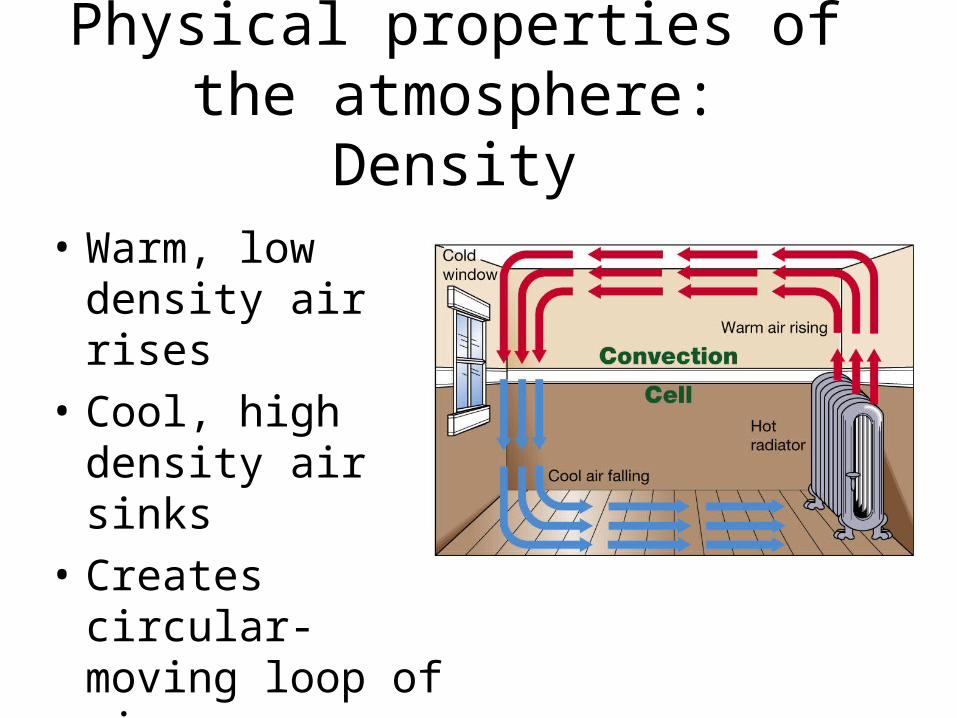
Physical properties of the atmosphere: Density
• Warm, low density air rises
• Cool, high density air sinks
• Creates circular- moving loop of air (convection cell)
Physical properties of the atmosphere: Water vapor
• Cool air cannot hold much water vapor, so is typically dry
• Warm air can hold more water vapor, so is typically moist
• Water vapor decreases the density of air
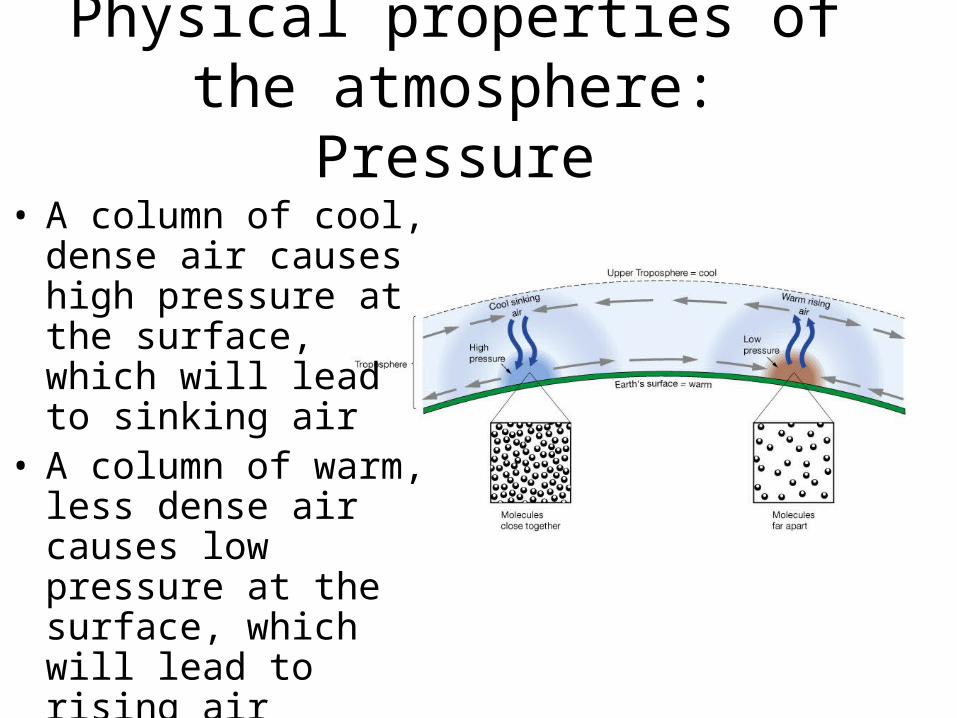
Physical properties of the atmosphere: Pressure
• A column of cool, dense air causes high pressure at the surface, which will lead to sinking air
• A column of warm, less dense air causes low pressure at the surface, which will lead to rising air
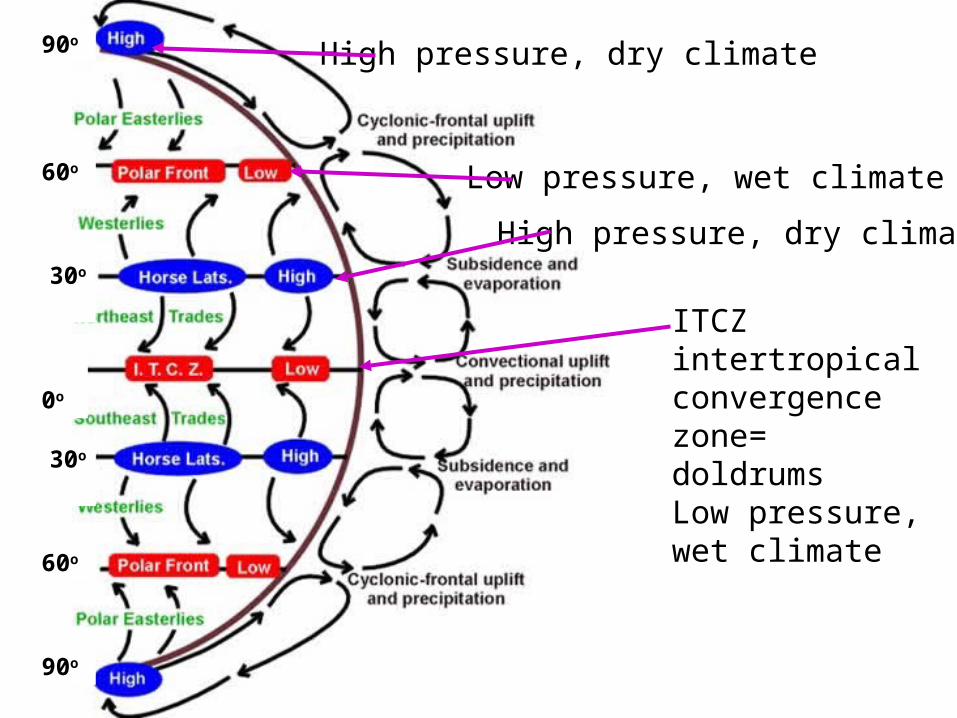
ITCZ intertropical convergence zone= doldrumsLow pressure, wet climate
High pressure, dry climate
Low pressure, wet climate
30o
30o
60o
60o
90o
90o
0o
High pressure, dry climate
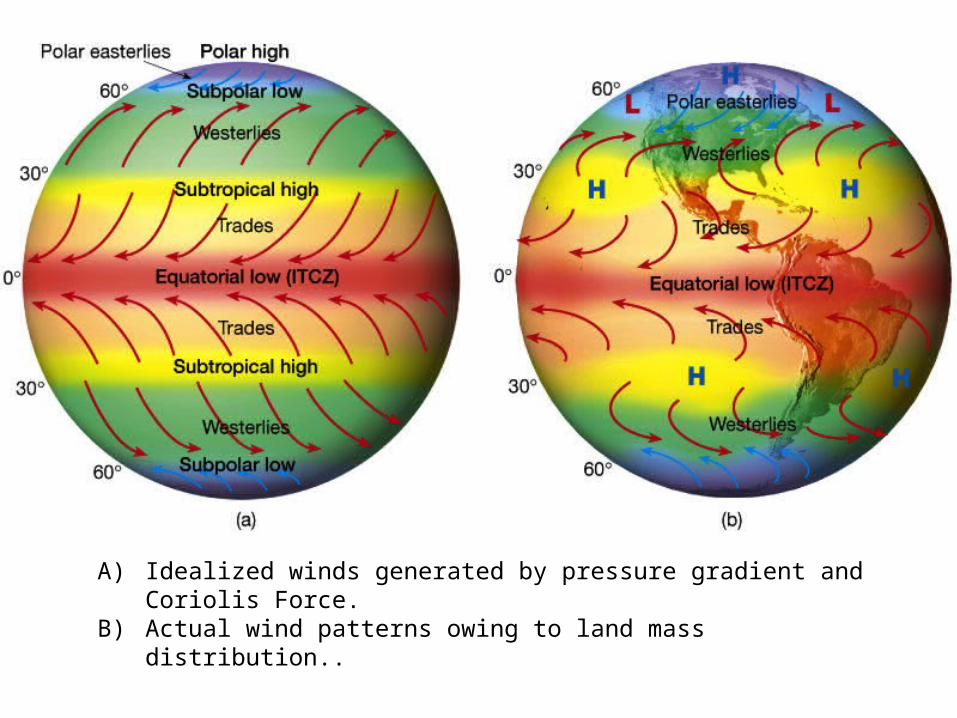
A) Idealized winds generated by pressure gradient and Coriolis Force. B) Actual wind patterns owing to land mass distribution..
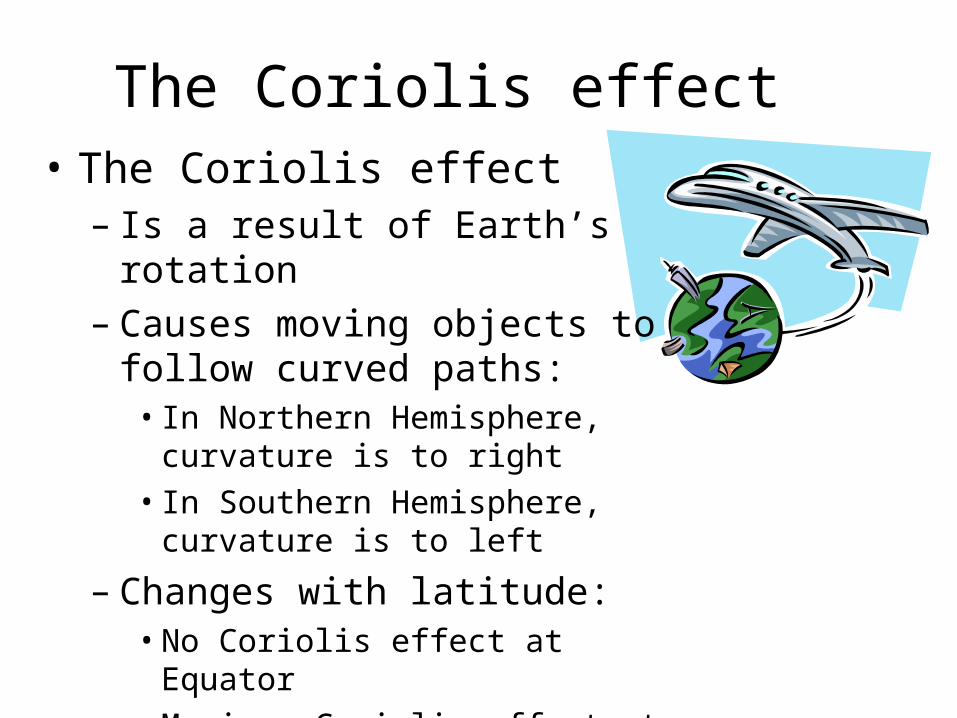
The Coriolis effect• The Coriolis effect
– Is a result of Earth’s rotation– Causes moving objects to follow
curved paths:• In Northern Hemisphere, curvature
is to right• In Southern Hemisphere, curvature
is to left
– Changes with latitude:• No Coriolis effect at Equator• Maximum Coriolis effect at poles
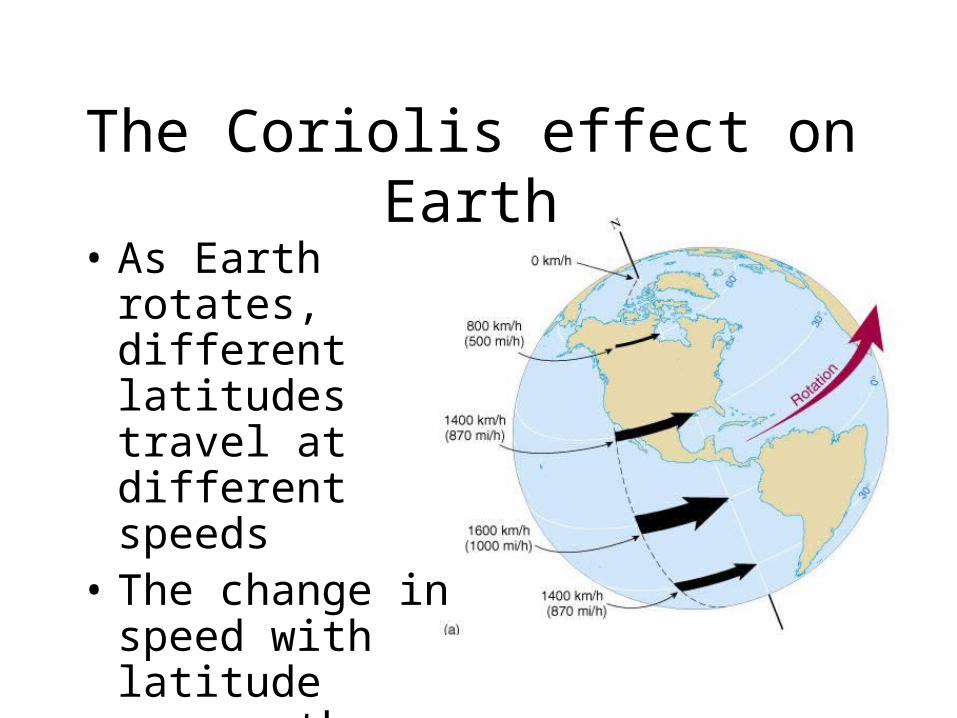
The Coriolis effect on Earth
• As Earth rotates, different latitudes travel at different speeds
• The change in speed with latitude causes the Coriolis effect
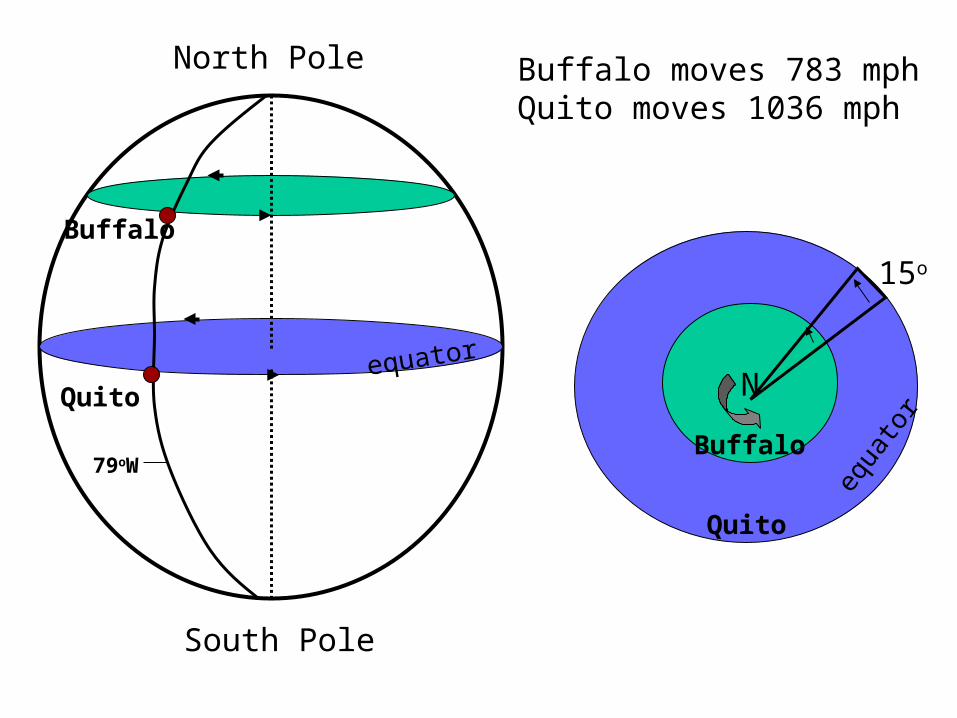
equator
Quito
Buffalo
79oW
North Pole
South Pole
N
Quito
Buffalo
equa
tor
Buffalo moves 783 mphQuito moves 1036 mph
15o
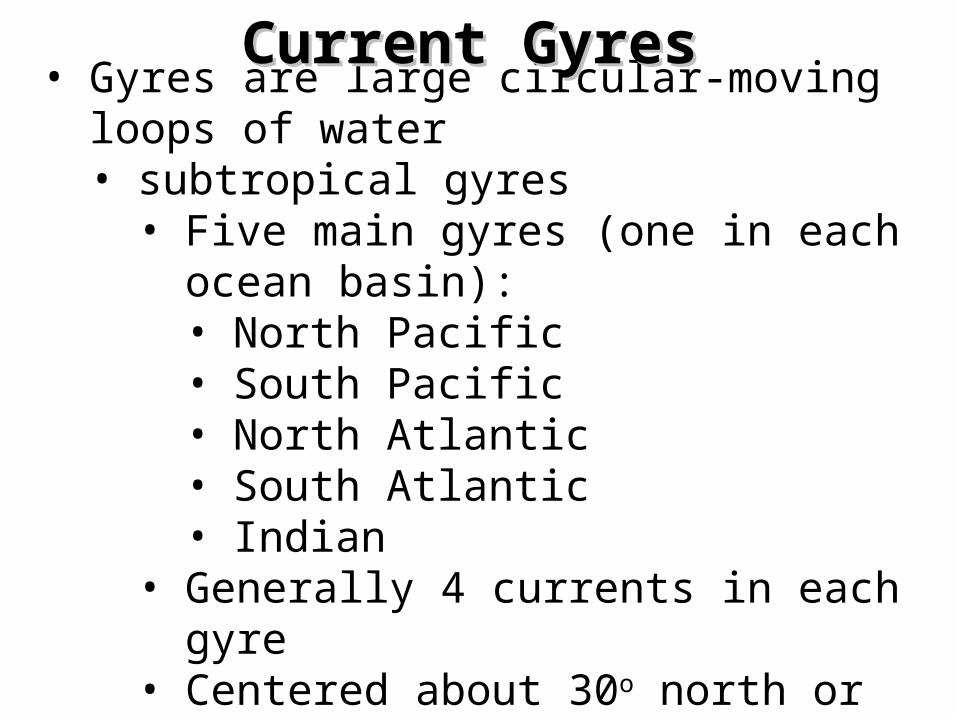
• Gyres are large circular-moving loops of water• subtropical gyres
• Five main gyres (one in each ocean basin):• North Pacific• South Pacific• North Atlantic• South Atlantic• Indian
• Generally 4 currents in each gyre• Centered about 30o north or south
latitude
Current GyresCurrent Gyres

Geostrophic flow and western intensification
• Geostrophic flow causes a hill to form in subtropical gyres
• The center of the gyre is shifted to the west because of Earth’s rotation
• Western boundary currents are intensified
Figure 7-7

Wind-driven surface currents
Global Warming
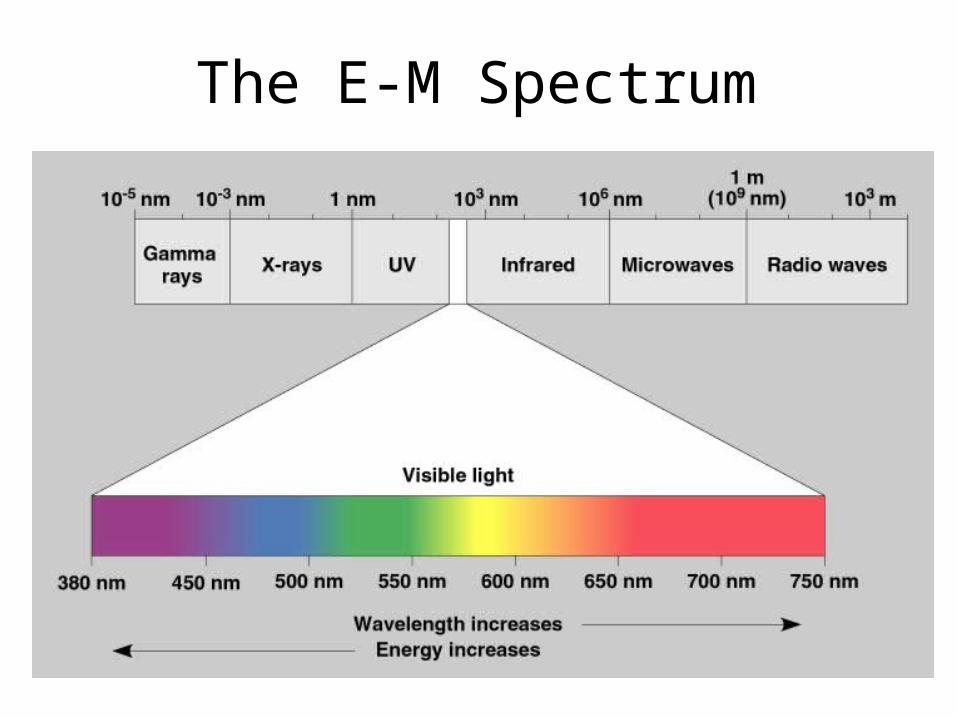
The E-M Spectrum
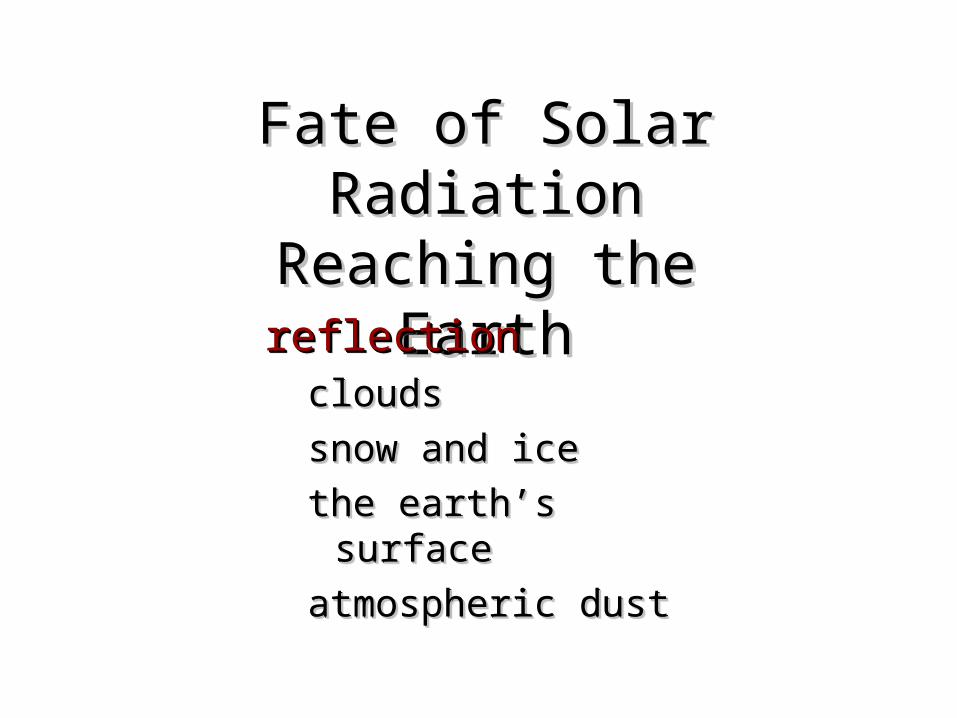
Fate of Solar Radiation Fate of Solar Radiation Reaching the EarthReaching the Earth
reflectionreflectioncloudsclouds
snow and icesnow and ice
the earth’s surfacethe earth’s surface
atmospheric dustatmospheric dust
reflectionreflectioncloudsclouds
snow and icesnow and ice
the earth’s surfacethe earth’s surface
atmospheric dustatmospheric dust
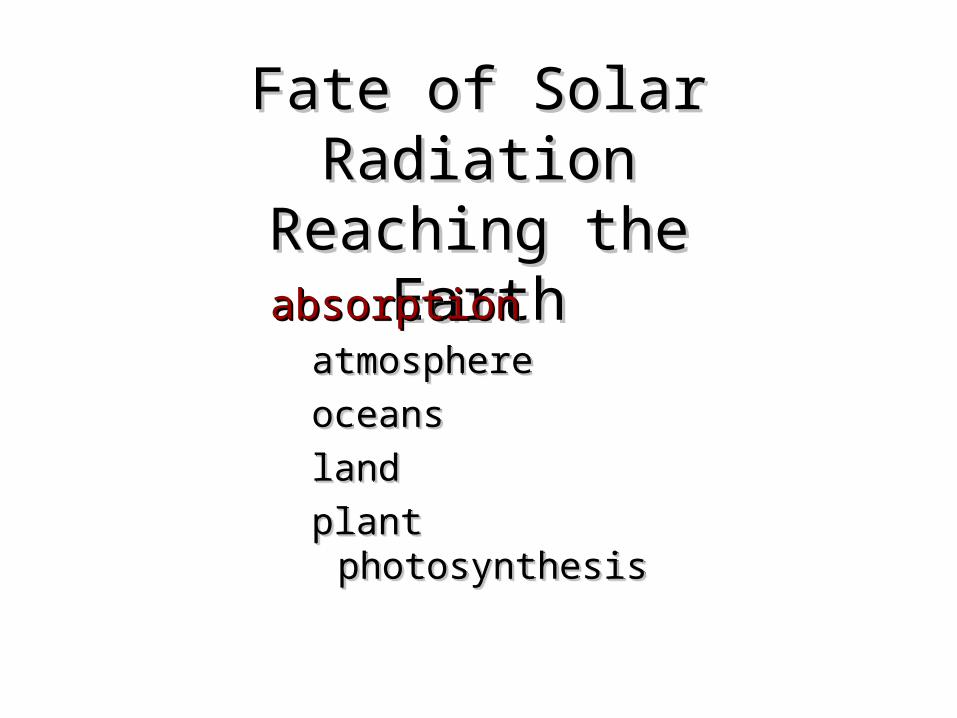
Fate of Solar Radiation Fate of Solar Radiation Reaching the EarthReaching the Earth
absorptionabsorptionatmosphereatmosphere
oceansoceans
landland
plant photosynthesisplant photosynthesis
absorptionabsorptionatmosphereatmosphere
oceansoceans
landland
plant photosynthesisplant photosynthesis

Fate of Solar Radiation Fate of Solar Radiation Reaching the EarthReaching the Earth
radiationradiationradiationradiation

The Greenhouse Effect
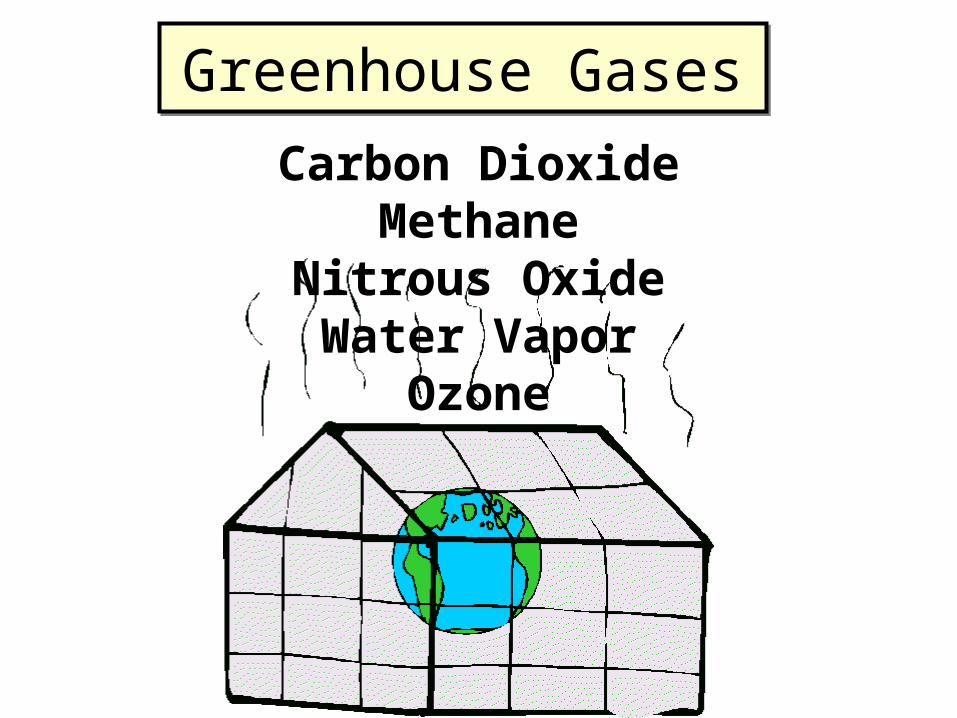
Greenhouse GasesGreenhouse Gases
Carbon DioxideMethane
Nitrous OxideWater Vapor
Ozone
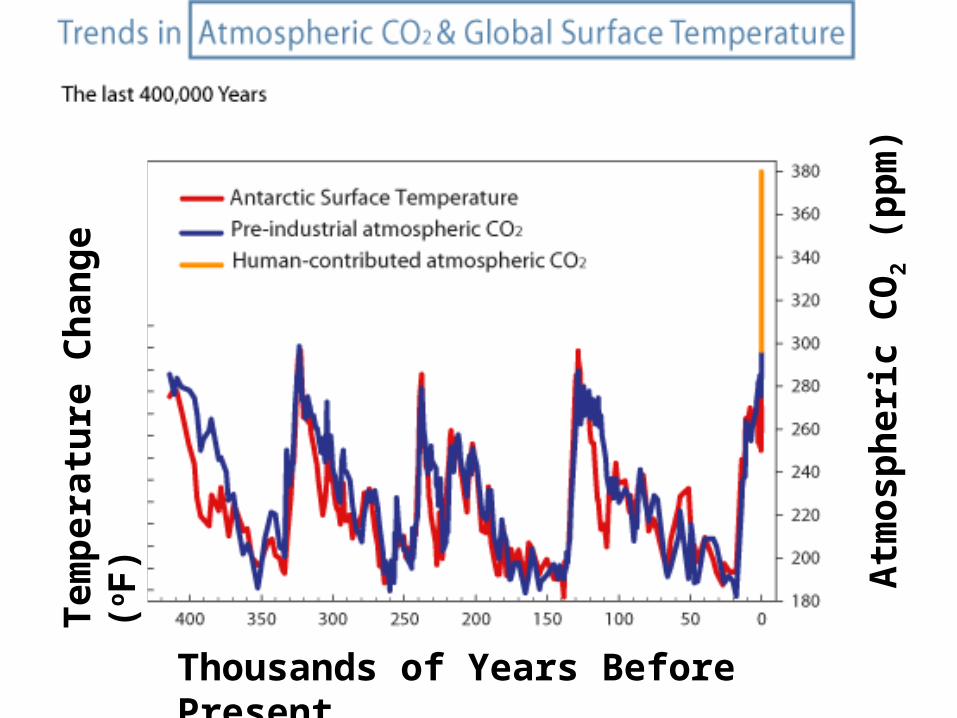
Thousands of Years Before Present
Tem
per
atu
re C
han
ge
(oF
)
Atm
osp
her
ic C
O2
(pp
m)
Year
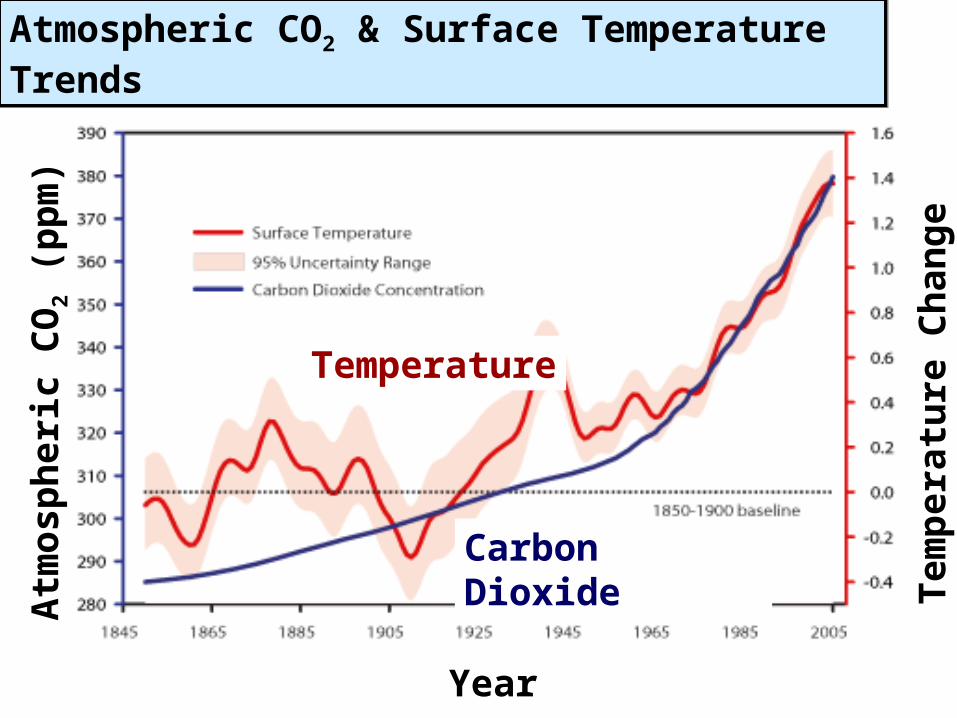
Temperature
Carbon Dioxide
Tem
per
atu
re C
han
ge
(oF
)
Atm
osp
her
ic C
O2
(pp
m)
Atmospheric CO2 & Surface Temperature TrendsAtmospheric CO2 & Surface Temperature Trends
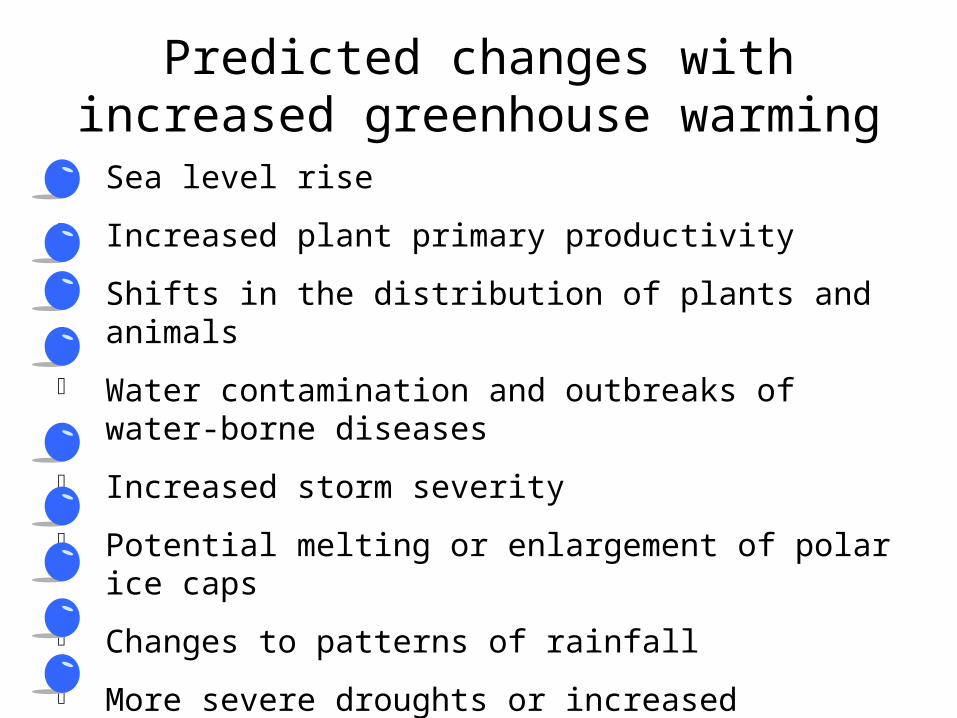
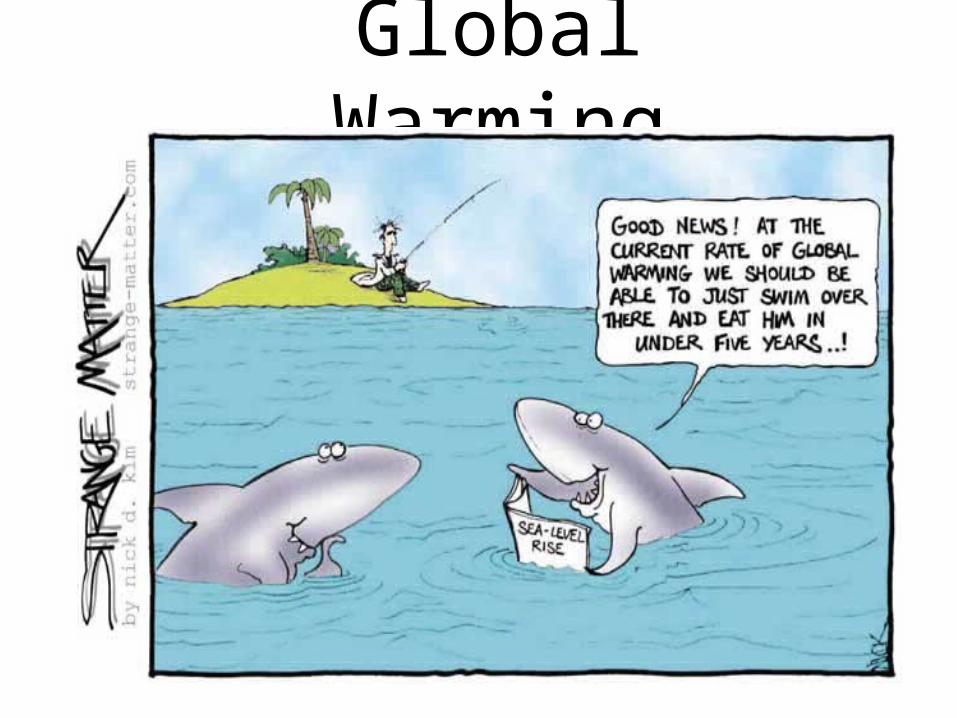
Sea level rise
Increased plant primary productivity
Shifts in the distribution of plants and animals
Water contamination and outbreaks of water-borne diseases
Increased storm severity
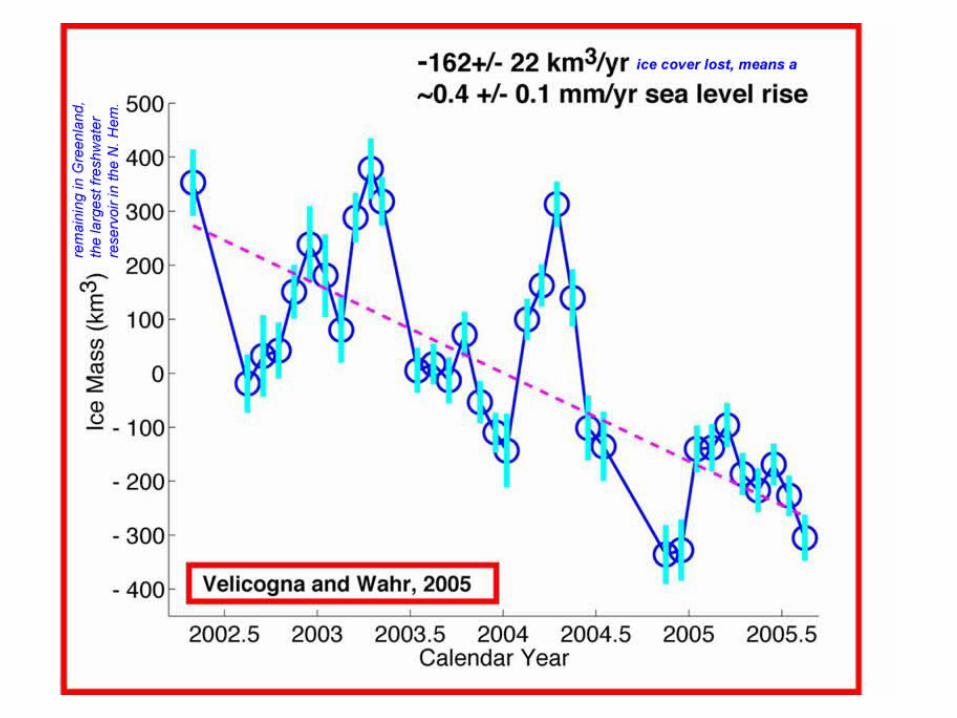
Potential melting or enlargement of polar ice caps
Changes to patterns of rainfall
More severe droughts or increased precipitation
changes to ocean circulation patterns
Predicted changes with increased greenhouse warming
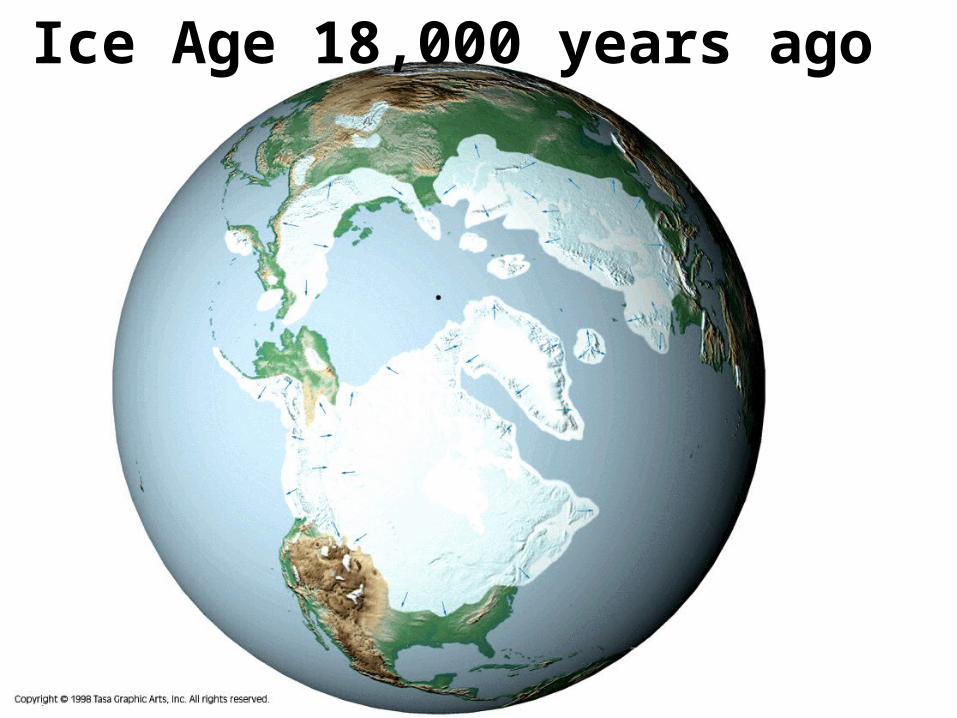
Ice Age 18,000 years ago
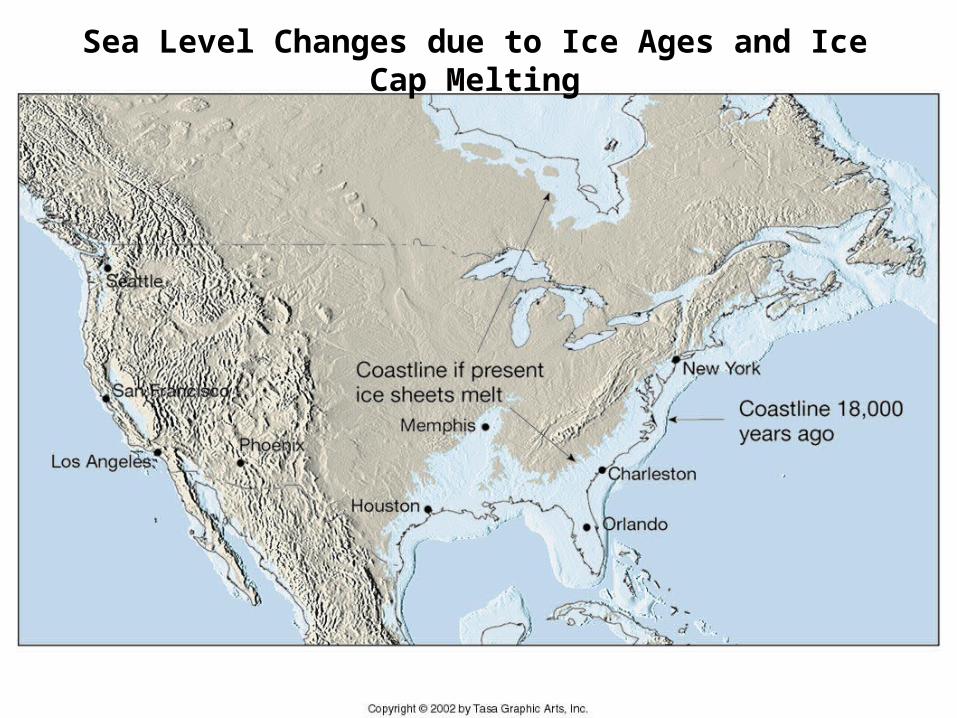
Sea Level Changes due to Ice Ages and Ice Cap Melting
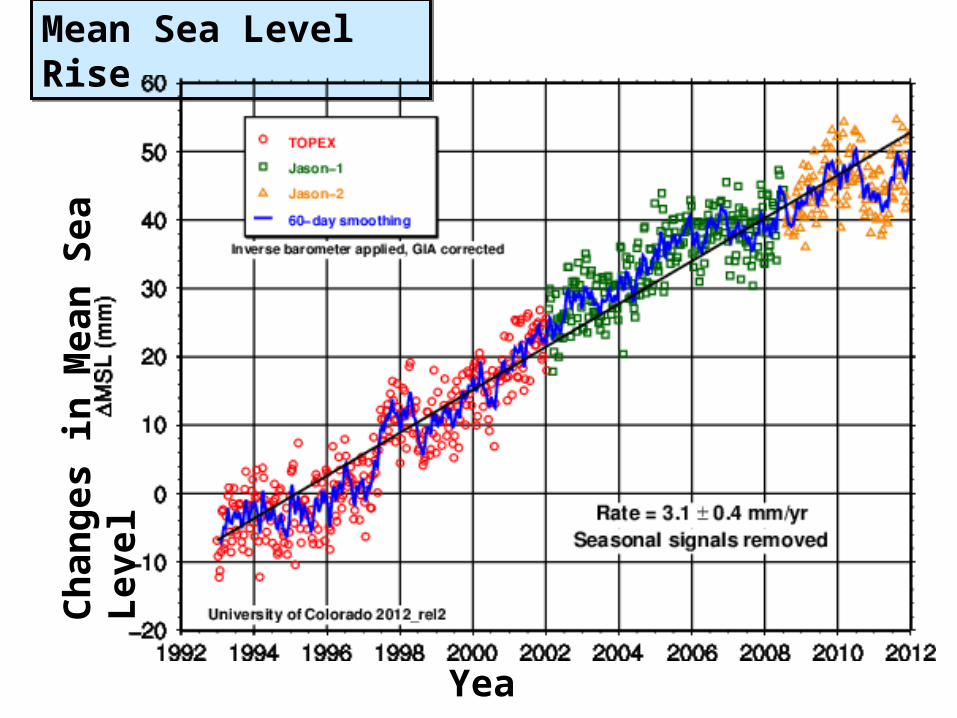
Year
Ch
ang
es in
Mea
n S
ea L
evel
Mean Sea Level RiseMean Sea Level Rise

Summer Arctic Sea Ice Decline Comparison between 1979 & 2005Summer Arctic Sea Ice Decline Comparison between 1979 & 2005
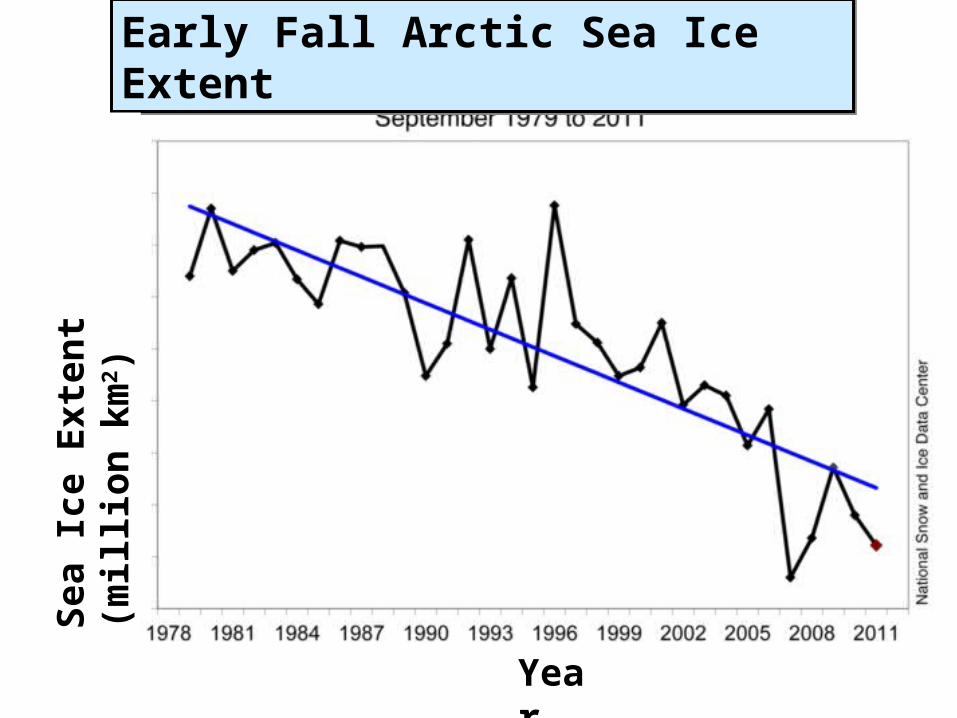
Early Fall Arctic Sea Ice ExtentEarly Fall Arctic Sea Ice ExtentS
ea Ic
e E
xten
t (m
illio
n k
m2 )
Year
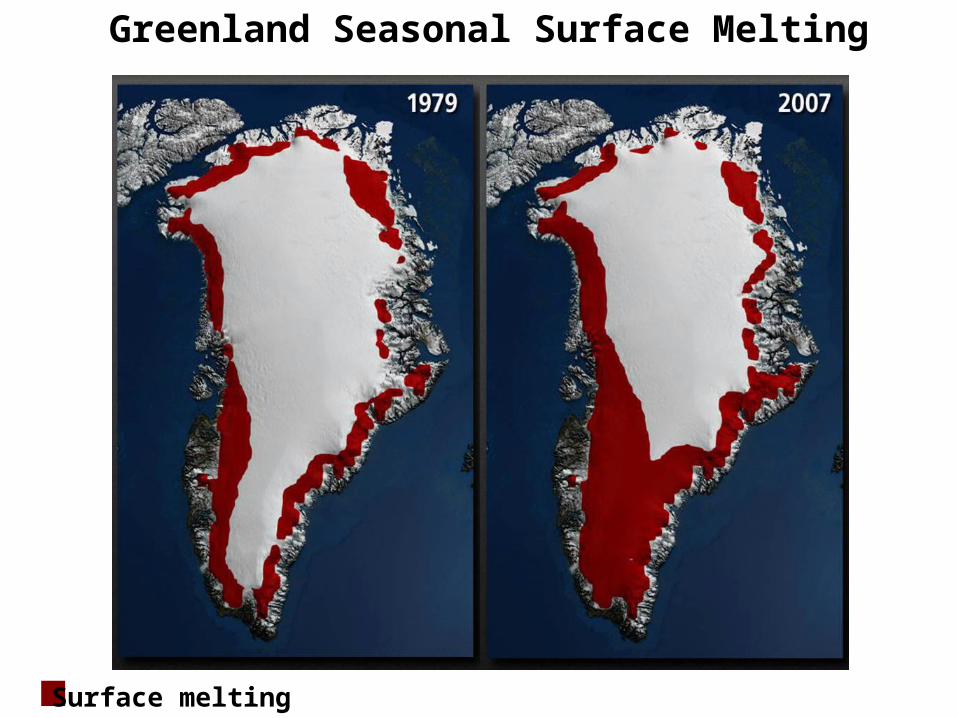
Greenland Seasonal Surface Melting
Surface melting
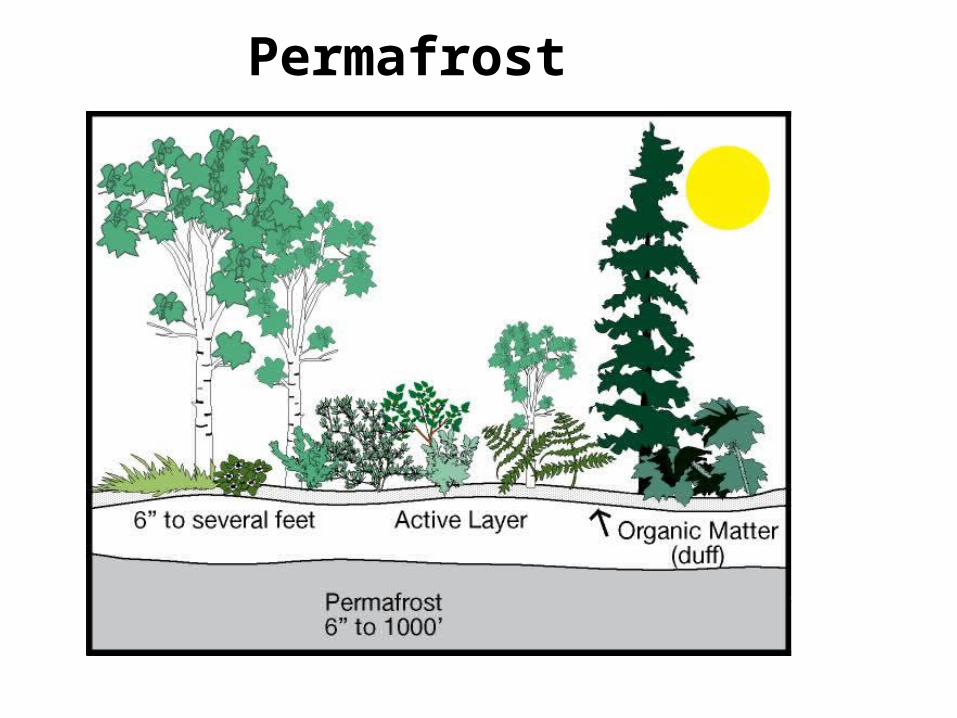
Permafrost
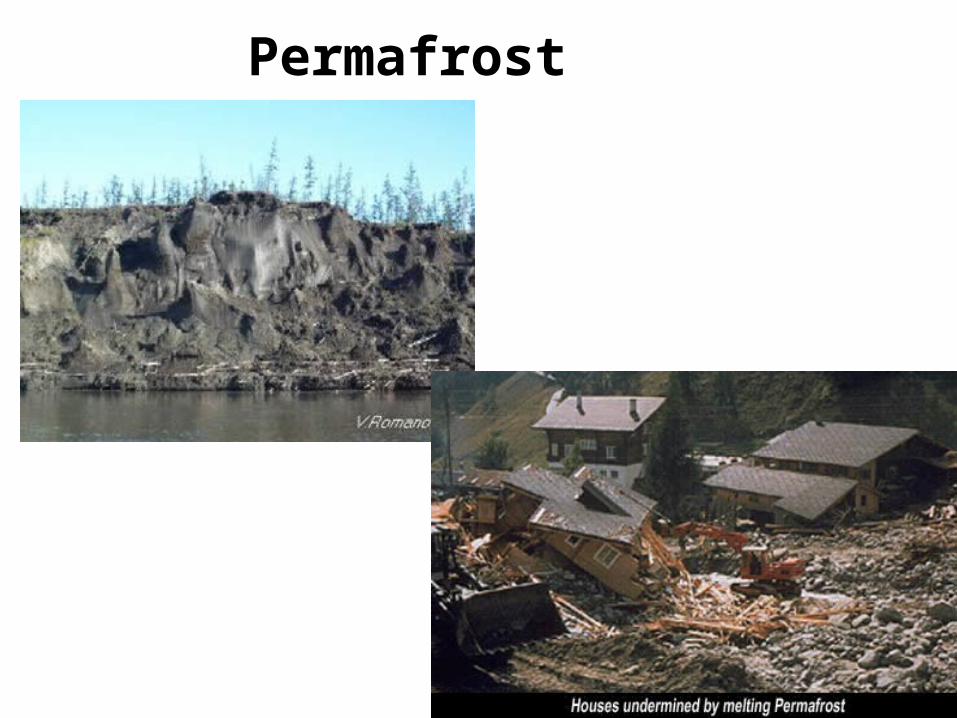
Permafrost
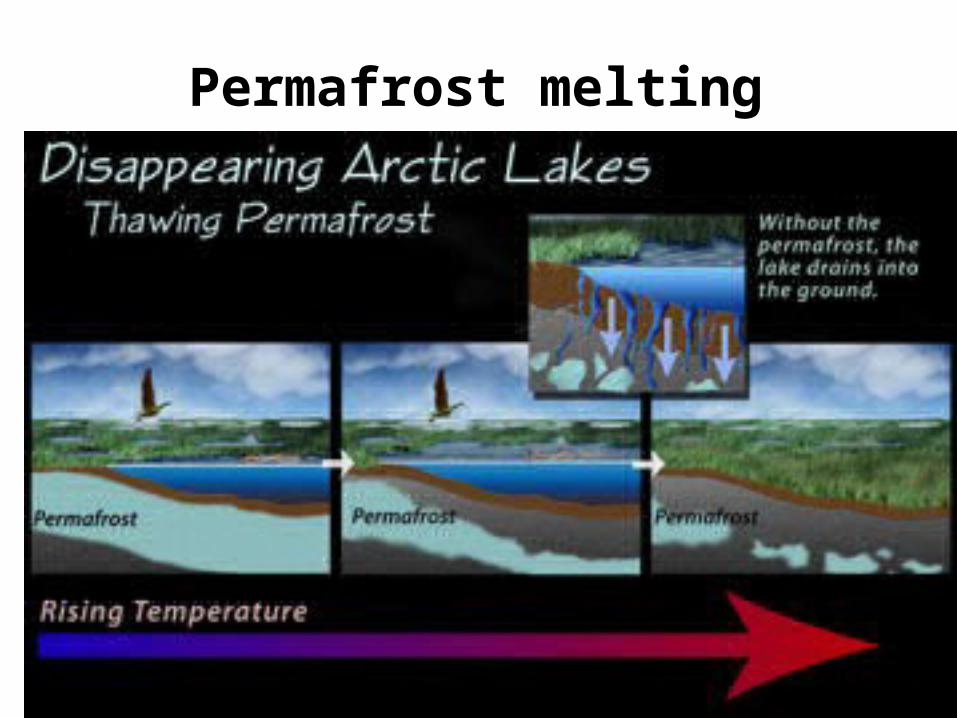
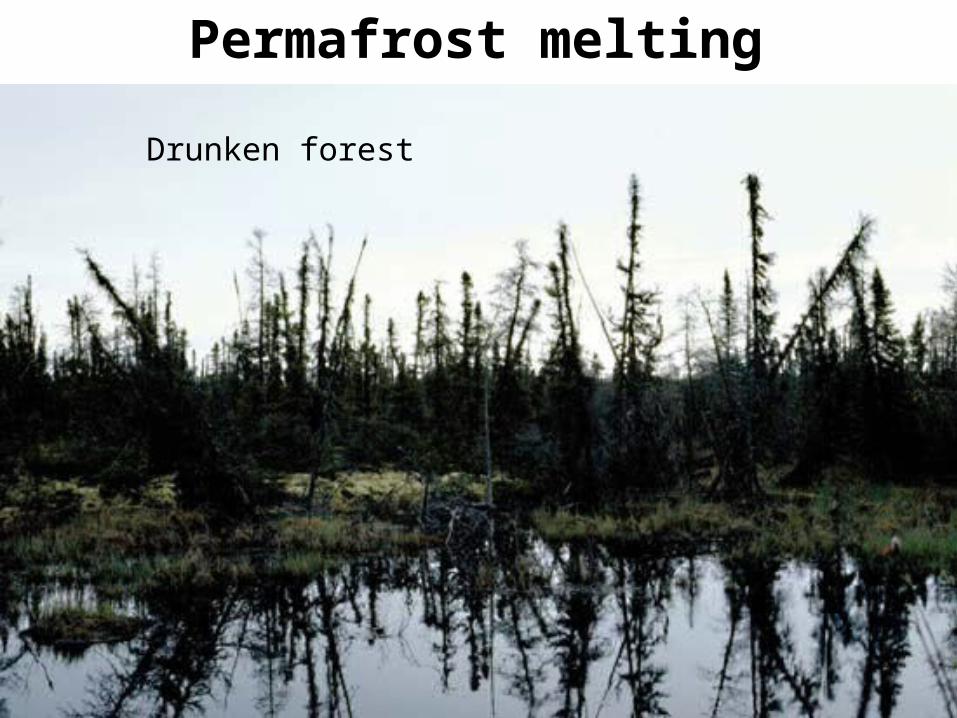
Permafrost melting
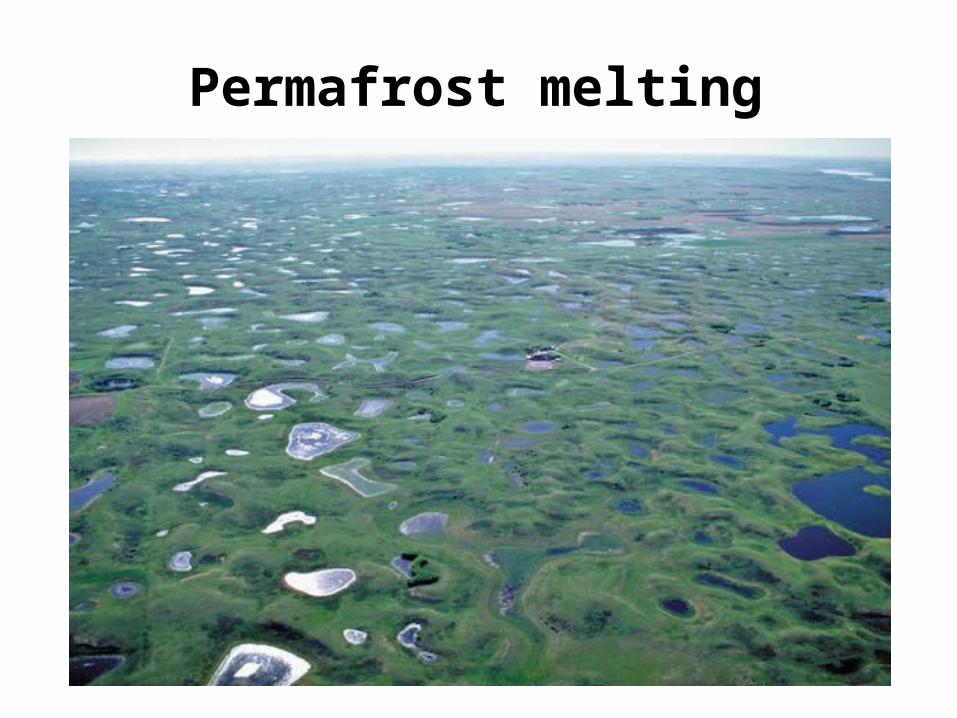
Permafrost melting
Permafrost melting
Drunken forest
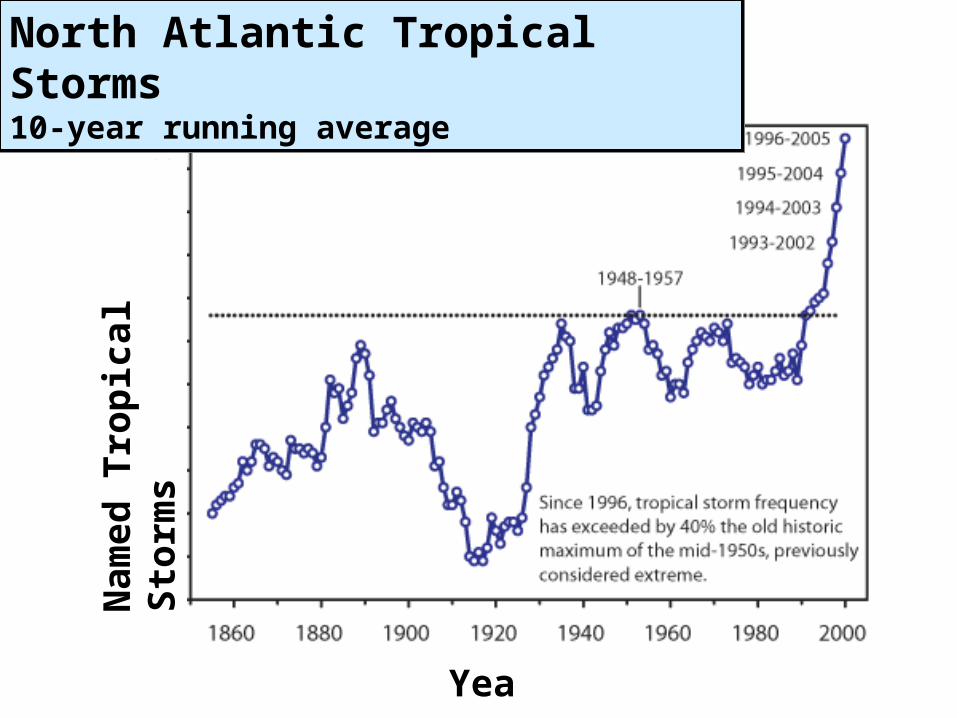
Year
North Atlantic Tropical Storms10-year running averageNorth Atlantic Tropical Storms10-year running average
Nam
ed T
rop
ical
Sto
rms

1 Meter Sea Level Rise Waikiki1 Meter Sea Level Rise Waikiki
http://www.soest.hawaii.edu/HMRG/FloodingOahu/index.phphttp://www.soest.hawaii.edu/coasts/sealevel/waikiki.html
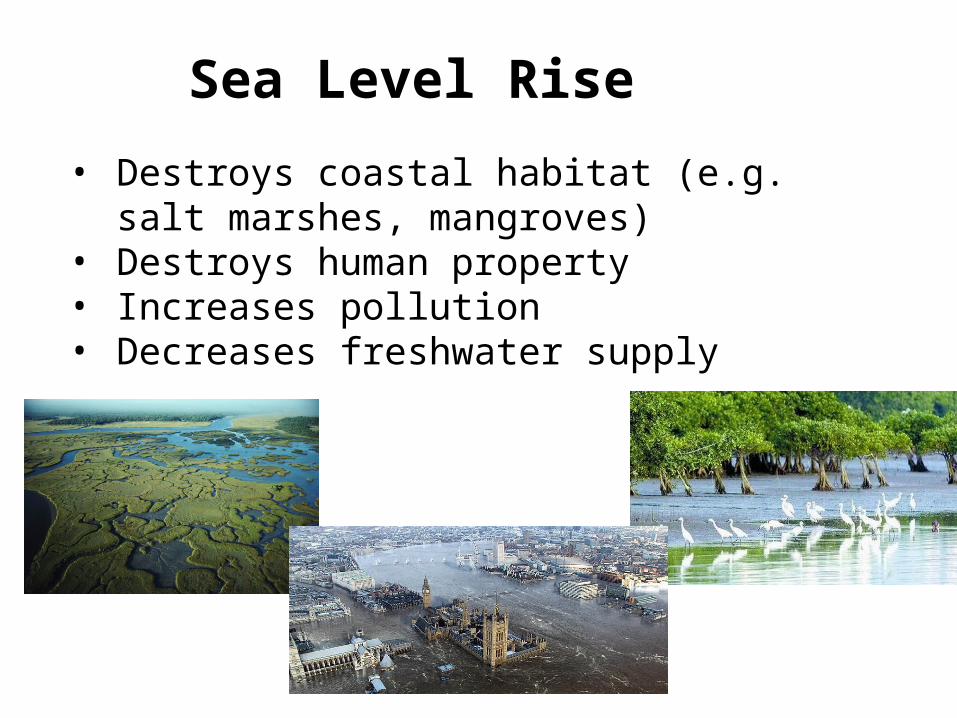
Sea Level Rise
• Destroys coastal habitat (e.g. salt marshes, mangroves)
• Destroys human property• Increases pollution• Decreases freshwater supply
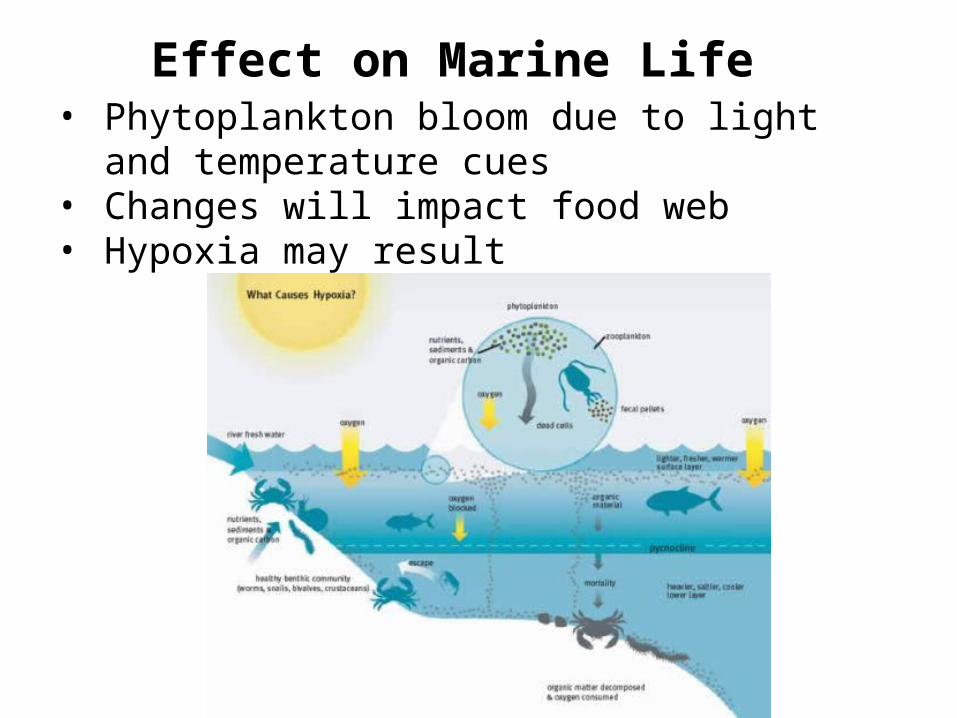
Effect on Marine Life• Phytoplankton bloom due to light and
temperature cues• Changes will impact food web• Hypoxia may result

Effect on Fisheries
• Migrations are in response to temperature• May impact fisheries
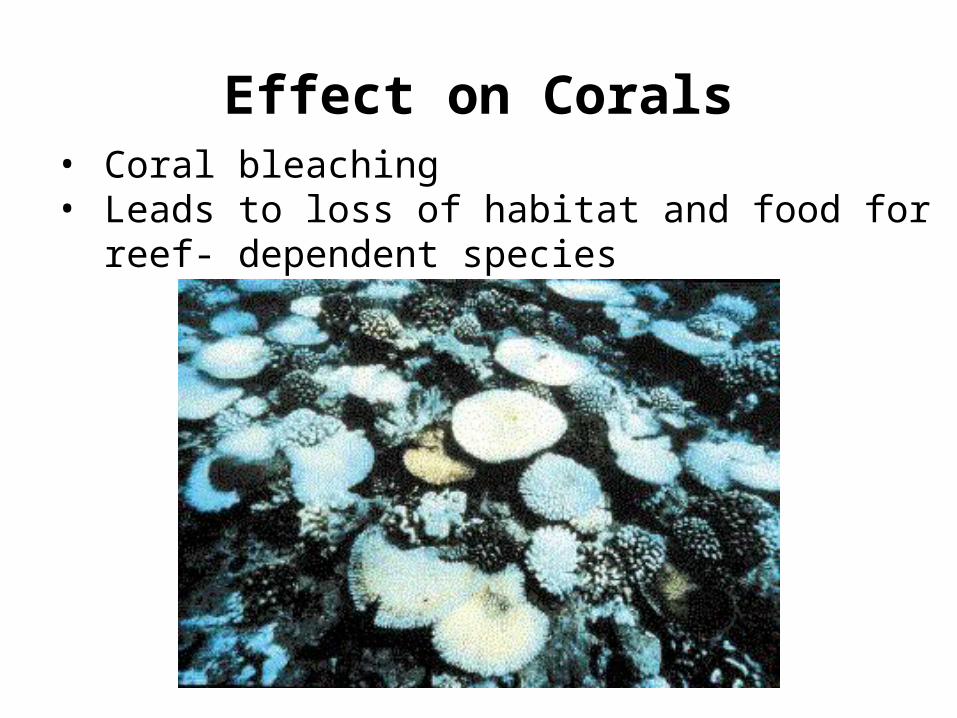
Effect on Corals• Coral bleaching • Leads to loss of habitat and food for reef-
dependent species

CurrentsOceanic conveyor belt may change ocean currents • Currents carry plankton• Bring food and oxygen• Distribute eggs and larvae• Remove wastes and pollutants
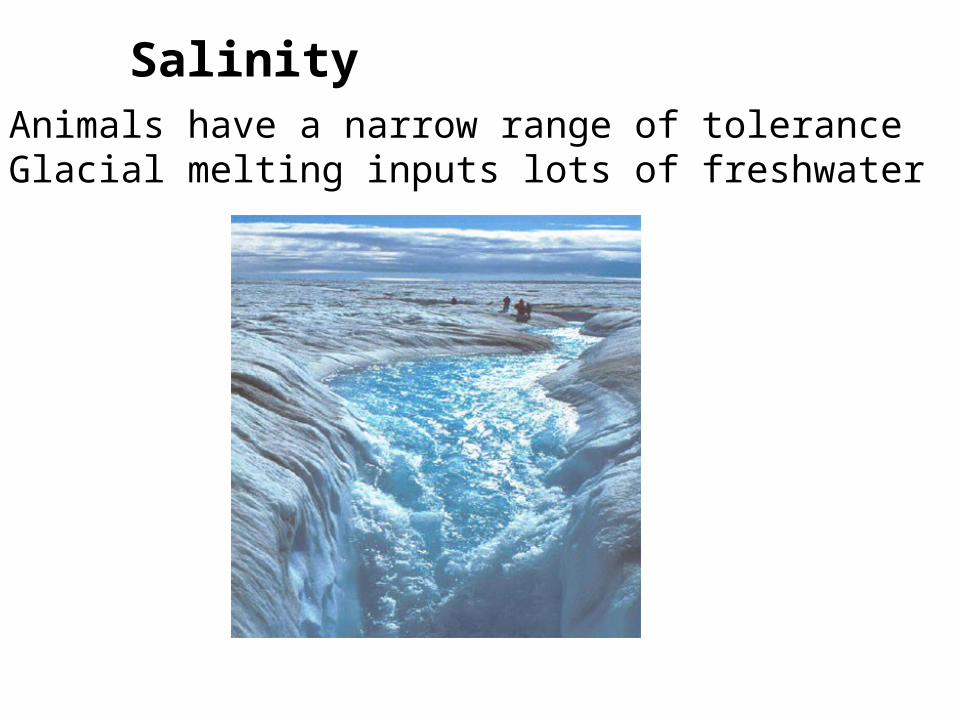
Salinity• Animals have a narrow range of tolerance• Glacial melting inputs lots of freshwater

Acidity• CO2 makes water acidic• Corals and other calcium carbonate species
can’t make skeleton• Impact on plankton development impacts food
web

Temperature• Higher temperature results in less O2
- Results in hypoxia• Ice melting leaves no resting/hunting areas for
polar bears• Antarctic Krill impacts food web
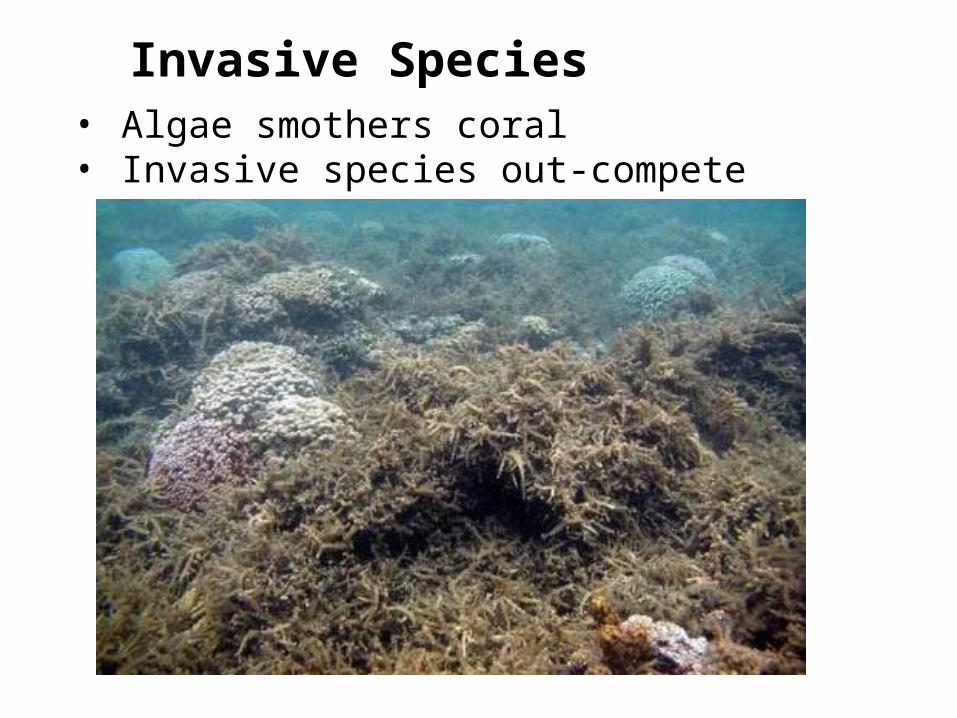
Invasive Species• Algae smothers coral• Invasive species out-compete natives

Weather Events
More severe weather patterns• El Niño• Hurricanes • Mudslides• Forest Fires• Drought
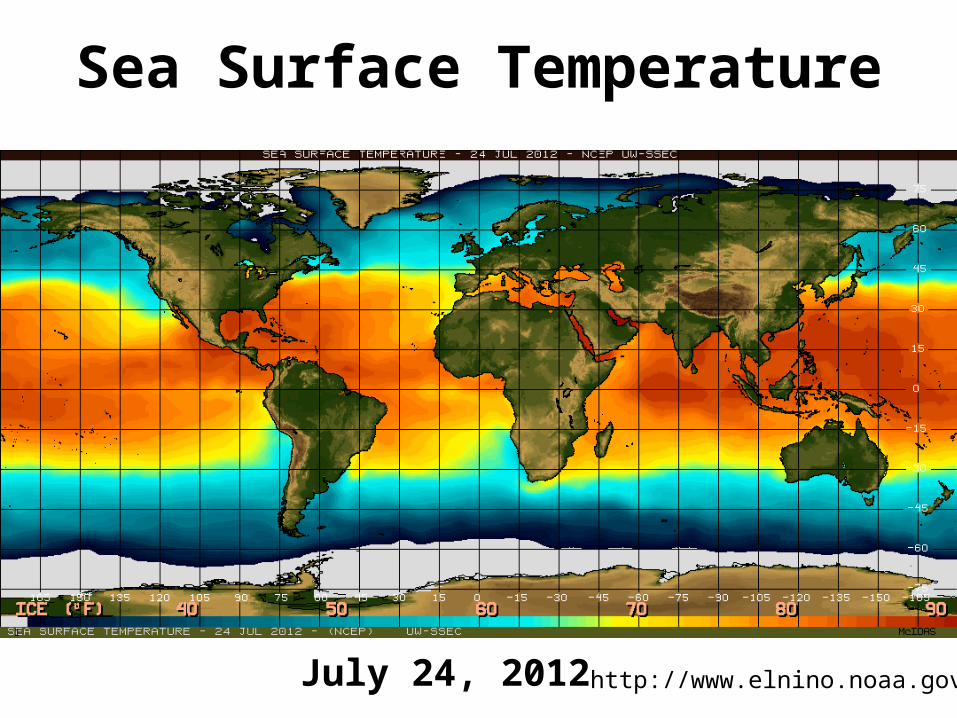
Sea Surface Temperature
July 24, 2012 http://www.elnino.noaa.gov/
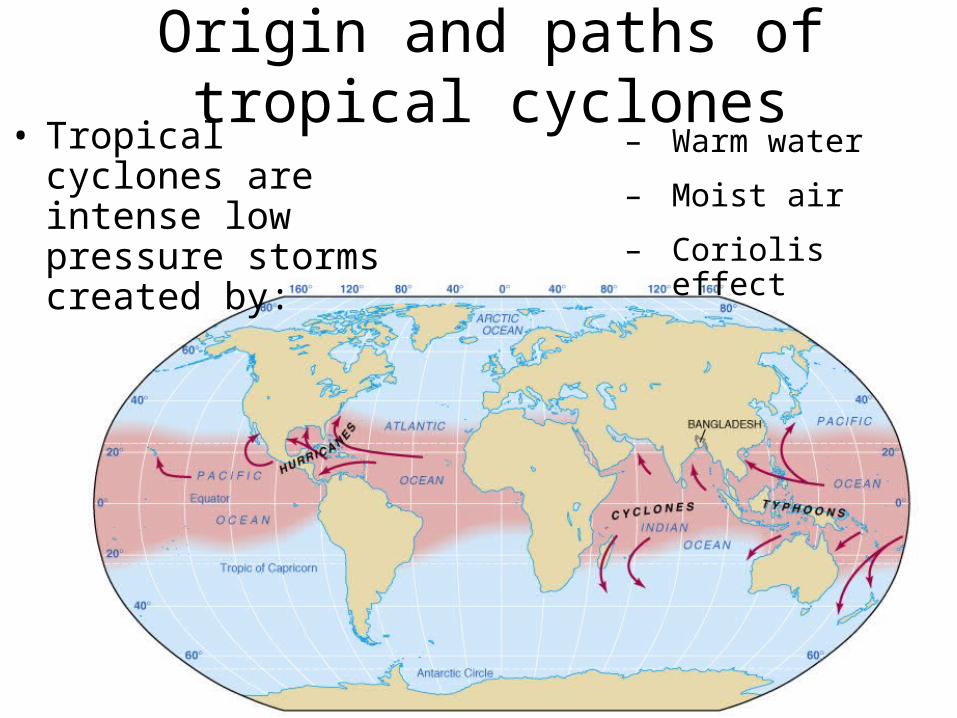
Origin and paths of tropical cyclones
• Tropical cyclones are intense low pressure storms created by:
– Warm water
– Moist air
– Coriolis effect

El Niño-Southern Oscillation (ENSO)
• El Niño = warm surface current in equatorial eastern Pacific that occurs periodically around Christmastime
• Southern Oscillation = change in atmospheric pressure over Pacific Ocean accompanying El Niño
• ENSO describes a combined oceanic-atmospheric disturbance

El Niño
• Oceanic and atmospheric phenomenon in the Pacific Ocean
• Occurs during December• 2 to 7 year cycle
Sea Surface Temperature
Atmospheric Winds
Upwelling
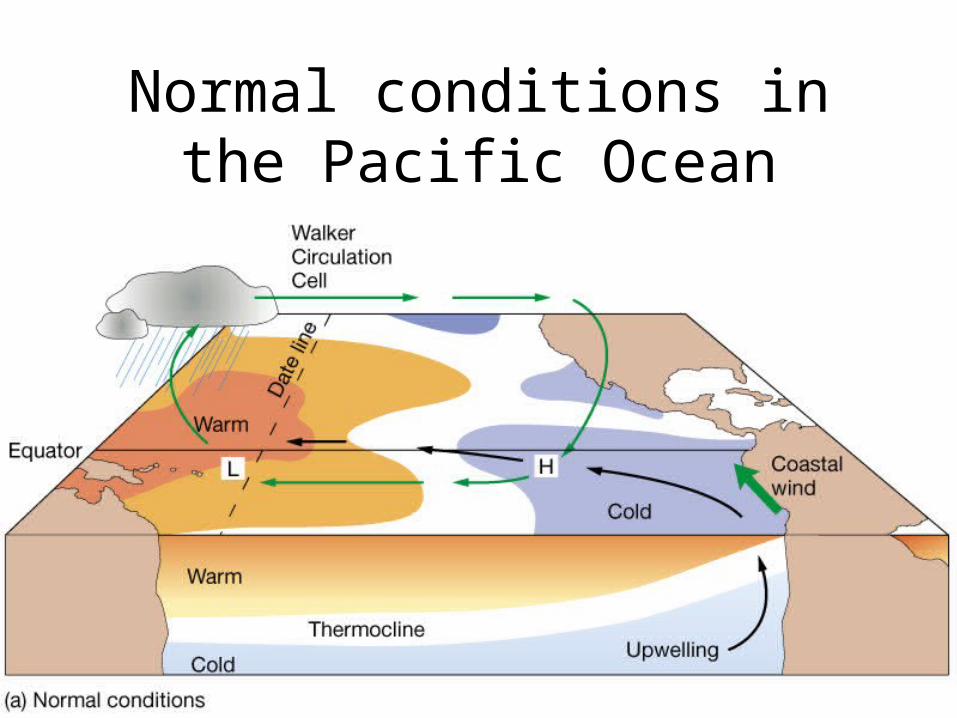
Normal conditions in the Pacific Ocean
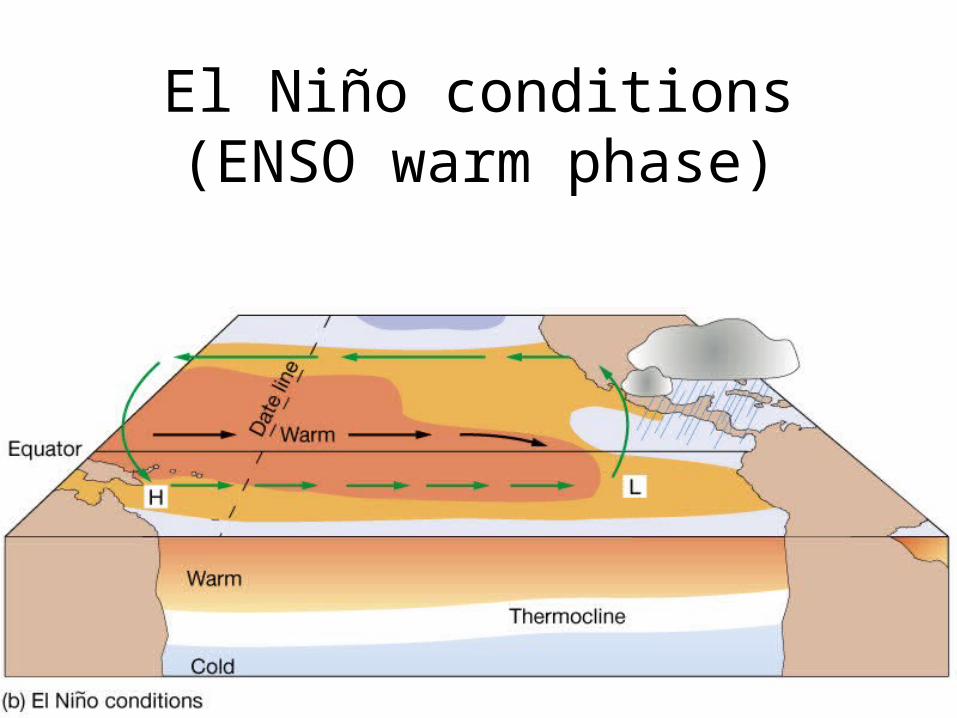
El Niño conditions (ENSO warm phase)

La Niña conditions (ENSO cool phase; opposite of El
Niño)
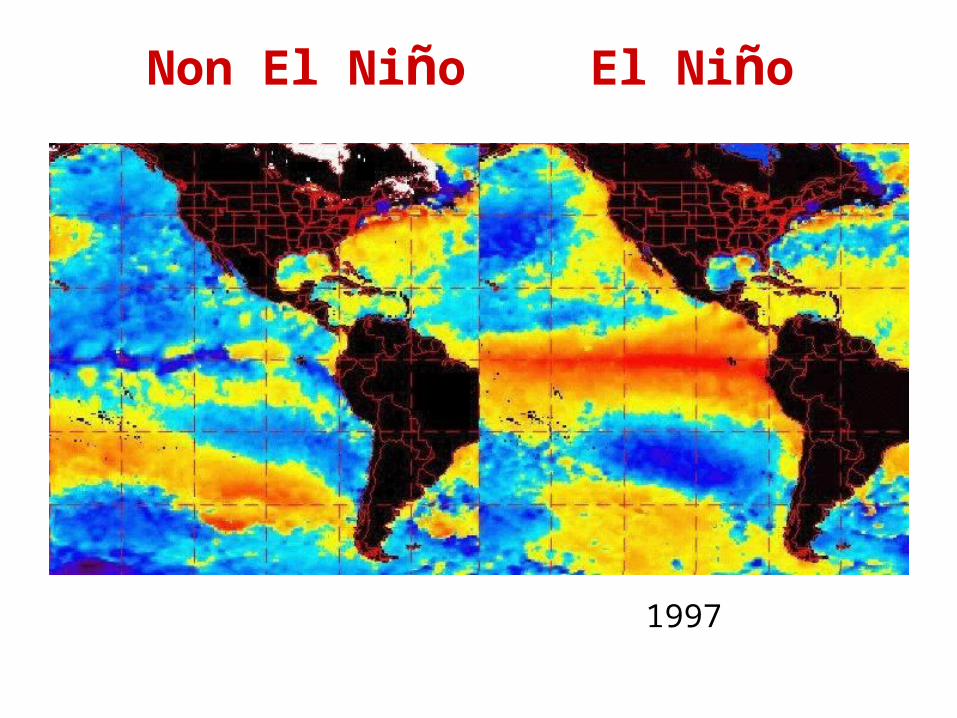
El NiñoNon El Niño
1997
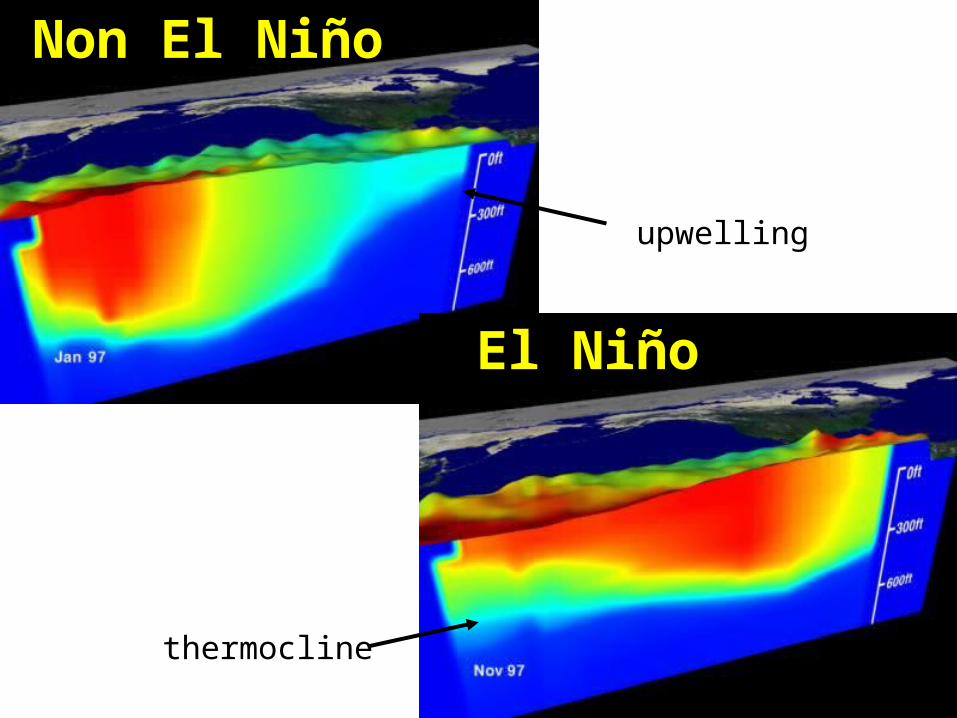
Non El Niño
El Niño
thermocline
upwelling

El Niño events over the last 62 years
82-83
65-6672-73
57-5886-87 91-92
94-95
97-98
02-0309-10
Red - Strong El NinoBlue- Strong La NinaBlack – moderate (either)
50-5155-56
64-65
70-71
73-74
75-7688-89
98-9999-00
07-08 10-11
11-12
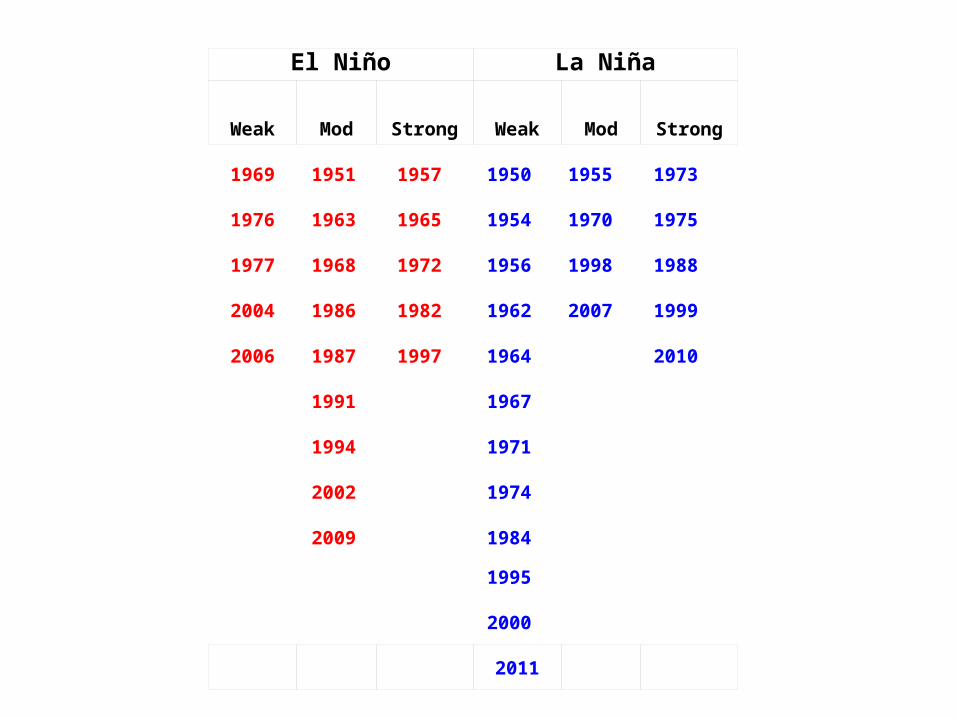
1969 1951 1957 1950 1955 1973
1976 1963 1965 1954 1970 1975
1977 1968 1972 1956 1998 1988
2004 1986 1982 1962 2007 1999
2006 1987 1997 1964 2010
1991 1967
1994 1971
2002 1974
2009 1984
1995
2000
El Niño La Niña
Weak Mod Strong Weak Mod Strong
2011
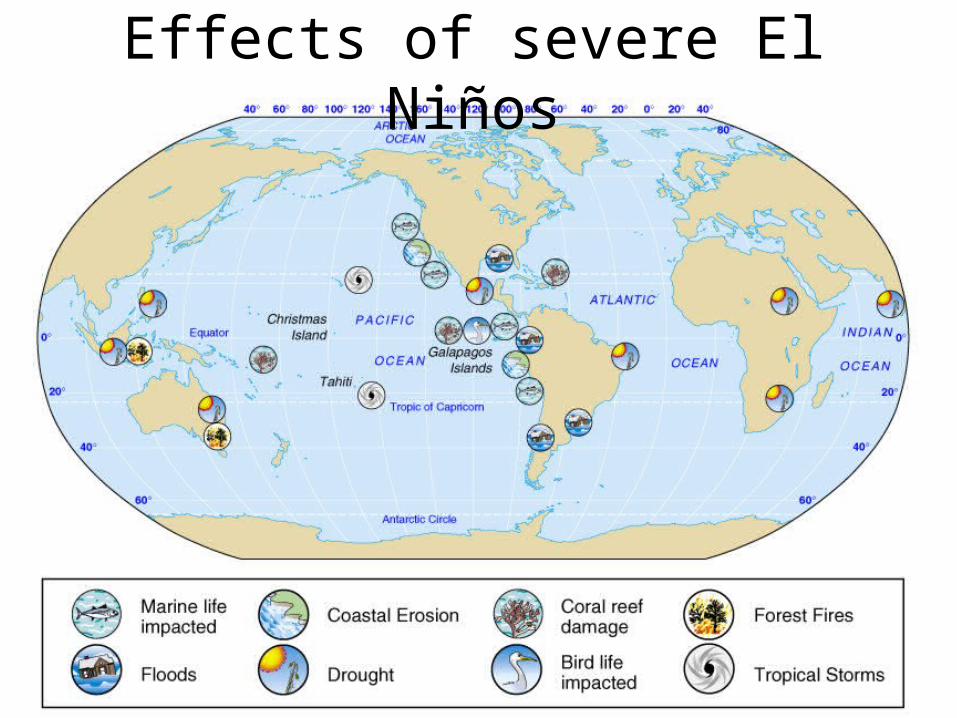
Effects of severe El Niños
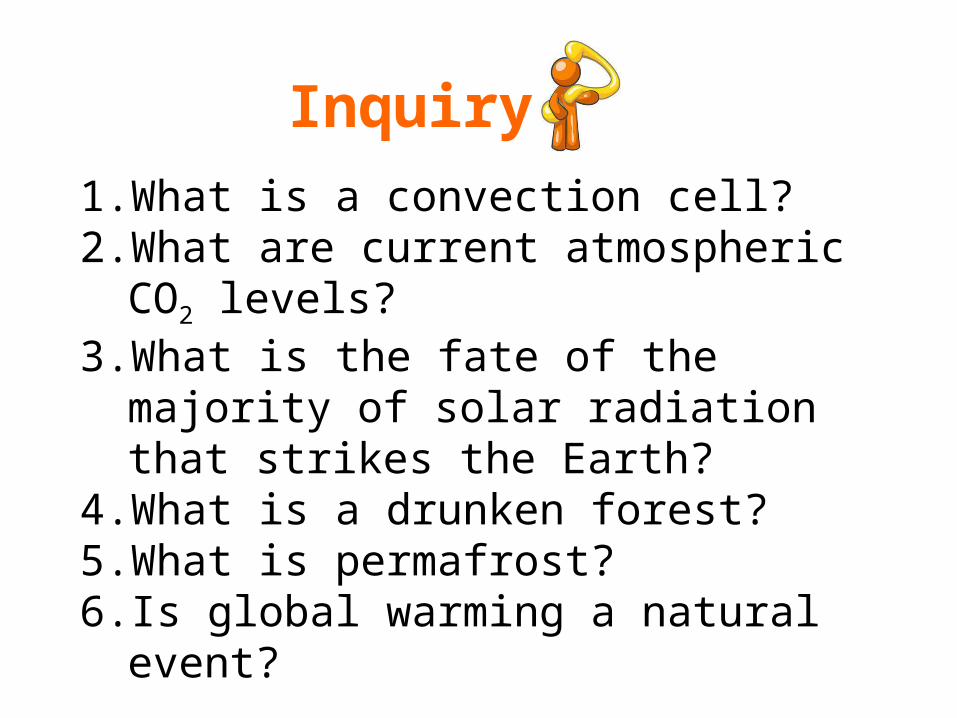
1. What is a convection cell?2. What are current atmospheric CO2
levels?3. What is the fate of the majority of solar
radiation that strikes the Earth?4. What is a drunken forest?5. What is permafrost?6. Is global warming a natural event?
Inquiry


![Solstice - University of Iowa...Solstice @ The University of Iowa Solstice is wireless collaboration software [via a Solstice device] for meeting and learning environments that enables](https://static.documents.pub/doc/80x56/5f4eda1f004f1f10117c1550/solstice-university-of-iowa-solstice-the-university-of-iowa-solstice-is.jpg)


