Page 1
This Provisional PDF corresponds to the article as it appeared upon acceptance. Thefully-formatted PDF version will become available shortly after the date of publication, from the
URL listed below.
Antibiotic resistance as a global threat: Evidence from China, Kuwait and theUnited States
Globalization and Health 2006, 2:6 doi:10.1186/1744-8603-2-6
Ruifang Zhang ([email protected] )Karen Eggleston ([email protected] )
Vincent Rotimi ([email protected] )Richard J Zeckhauser ([email protected] )
ISSN 1744-8603
Article type Research
Submission date 4 September 2005
Acceptance date 7 April 2006
Publication date 7 April 2006
Article URL http://www.globalizationandhealth.com/content/2/1/6
This peer-reviewed article was published immediately upon acceptance. It can be downloaded,printed and distributed freely for any purposes (see copyright notice below).
Articles in Globalization and Health are listed in PubMed and archived at PubMed Central.
For information about publishing your research in Globalization and Health or any BioMed Centraljournal, go to
http://www.globalizationandhealth.com/info/instructions/
For information about other BioMed Central publications go to
http://www.biomedcentral.com/
Globalization and Health
© 2006 Zhang et al., licensee BioMed Central Ltd.This is an Open Access article distributed under the terms of the Creative Commons Attribution License (http://creativecommons.org/licenses/by/2.0),
which permits unrestricted use, distribution, and reproduction in any medium, provided the original work is properly cited.
Page 2
1
Antibiotic resistance as a global threat:
Evidence from China, Kuwait and the United States
Ruifang Zhang 1
, Karen Eggleston 2§
, Vincent Rotimi 3, Richard J. Zeckhauser
4
1Goldman Sachs International, Global Investment Research, London, UK
2Tufts University Economics Department, Medford, MA 02155, USA
3Department of Microbiology, Faculty of Medicine, Kuwait University, Kuwait
4Harvard University Kennedy School of Government, Cambridge, MA, USA
§Corresponding author
Email addresses:
RFZ: [email protected]
KE: [email protected]
VR: [email protected]
RJZ: [email protected]
Page 3
2
Abstract
Background
Antimicrobial resistance is an under-appreciated threat to public health in nations
around the globe. With globalization booming, it is important to understand
international patterns of resistance. If countries already experience similar patterns of
resistance, it may be too late to worry about international spread. If large countries or
groups of countries that are likely to leap ahead in their integration with the rest of the
world – China being the standout case – have high and distinctive patterns of
resistance, then a coordinated response could substantially help to control the spread
of resistance. The literature to date provides only limited evidence on these issues.
Methods
We study the recent patterns of antibiotic resistance in three geographically separated,
and culturally and economically distinct countries -- China, Kuwait and the United
States -- to gauge the range and depth of this global health threat, and its potential for
growth as globalization expands. Our primary measures are the prevalence of
resistance of specific bacteria to specific antibiotics. We also propose and illustrate
methods for aggregating specific “bug-drug” data. We use these aggregate measures
to summarize the resistance pattern for each country and to study the extent of
correlation between countries’ patterns of drug resistance.
Results
We find that China has the highest level of antibiotic resistance, followed by Kuwait
and the U.S. In a study of resistance patterns of several most common bacteria in
China in 1999 and 2001, the mean prevalence of resistance among hospital-acquired
infections was as high as 41% (with a range from 23% to 77%) and that among
community- acquired infections was 26% (with a range from 15% to 39%). China
also has the most rapid growth rate of resistance (22% average growth in a study
spanning 1994 to 2000). Kuwait is second (17% average growth in a period from
1999 to 2003), and the U.S. the lowest (6% from 1999 to 2002). Patterns of resistance
across the three countries are not high correlated; the most correlated were China and
Kuwait, followed by Kuwait and the U.S., and the least correlated pair was China and
the U.S.
Conclusions
Antimicrobial resistance is a serious and growing problem in all three countries. To
date, there is not strong international convergence in the countries’ resistance patterns.
This finding may change with the greater international travel that will accompany
globalization. Future research on the determinants of drug resistance patterns, and
their international convergence or divergence, should be a priority.
Page 4
3
In 1942, the first U.S. patient with streptococcal infection was miraculously
cured with a small dose of penicillin. Sixty years later, penicillin-resistant
Streptococcus is widespread. Such antimicrobial resistance threatens the health of
many throughout the world, since both old and new infectious diseases remain a
formidable public health threat.
Among the issues that merit further scrutiny for understanding the possible
spread of antimicrobial resistance, few are as salient as the impact of globalization.
Clearly the movement of people and goods around the globe contributes to
transmission of disease [1, 2]. To what extent drug resistance and globalization are
similarly related remains unclear. The breakout of Severe Acute Respiratory
Syndrome (SARS) in the spring of 2003 illustrates how an infectious disease with
limited therapeutic options can spread rapidly across national borders. With
globalization booming, it is important to understand international patterns of
resistance. If countries already experience similar patterns of resistance, it may be too
late to worry about international spread. If large countries or groups of countries that
are likely to leap ahead in their integration with the rest of the world – China being
the standout case – have high and distinctive patterns of resistance, then a coordinated
response could help substantially to control the spread of resistance. The literature to
date provides only limited evidence on these issues.
We study the pattern of antibiotic resistance in specific countries to gauge the
range and depth of this global health threat. China and the U.S. stand out as good
choices for study. Both are world economic powerhouses increasingly responding to
the forces of economic globalization. In addition, both are major consumers of
antibiotics, with the U.S. also being a leading source of new antibiotics. On the other
hand, it would also be interesting to compare patterns of antibiotic resistance in
smaller countries that stand relatively distant from these two. Accordingly, we
compare the experiences of the U.S. and China with new data on the resistance
experience of Kuwait.
The first section gives brief background on antibiotic resistance and its costs.
We then turn to a detailed comparison of surveillance data from China, Kuwait, and
the U.S. We conclude with a plea for more research and attention on this critical issue
for health and globalization.
Page 5
4
Background: The Challenge of Antimicrobial Resistance
According to laws of Darwinian evolution, antimicrobial use creates a
selection pressure on microorganisms: weak ones are killed, but stronger ones might
adapt and survive. When pathogenic microorganisms can multiply beyond some
critical mass in the face of invading antimicrobials, treatment outcome is
compromised; this phenomenon is referred as antimicrobial resistance (AMR) [3-9].
This paper focuses on antibiotic resistance, a major form of AMR.
Resistance mechanisms may develop over months or years [6]. Once
established, a single resistance mechanism can often allow a bacterium to resist
multiple drugs. It remains unclear whether resistance is reversible, and thus whether
drug effectiveness is a renewable or non-renewable resource [10-15]. Drug resistance
raises the cost of treatment for infectious diseases, sometimes manifold, as well as
increasing morbidity and mortality from such diseases [16-23].
The greatest long-term threat of AMR is that resistant strains erode drug
efficacy over time. The development of drug-resistant Staphylococci aureus (SAU)
well illustrates the see-saw battle between pathogens and drugs. SAU is a bacterium
that harmlessly lives in the human body but can cause infections on wounds or
lesions. After the clinical application of penicillin in the 1940s, SAU soon adapted to
the treatment mechanism of penicillin, and by the 1950s, almost half of SAU strains
had become resistant to penicillin. A new antibiotic, methicillin, was developed in the
1960s. Yet by the late 1970s, methicillin-resistant SAU, i.e. MRSA, again became
widespread. Today MRSA has become a major infectious culprit that can only be
effectively treated with vancomycin, one of the few last killers of superbugs.
Unfortunately, in 1996, a Japanese hospital reported the first case of vancomycin-
resistant SAU (VRSA) during surgery on a four-month-old boy. The U.S., France and
Hong Kong subsequently all reported VRSA incidents. A few years later in 2000,
linezolid was launched as a new antibiotic to combat both MRSA and VRSA. But
only one year later, Boston researchers reported the first case of linezolid-resistant
MRSA in an 85-year-old man undergoing peritoneal dialysis. After failing to contain
his MRSA by linezolid, researchers tried five antibiotics (ampicillin, azithromycin,
gentamicin, levofloxacin, and quinupristin-dalfopristin) but the unlucky man
eventually died from the uncontrollable infection [24].
Page 6
5
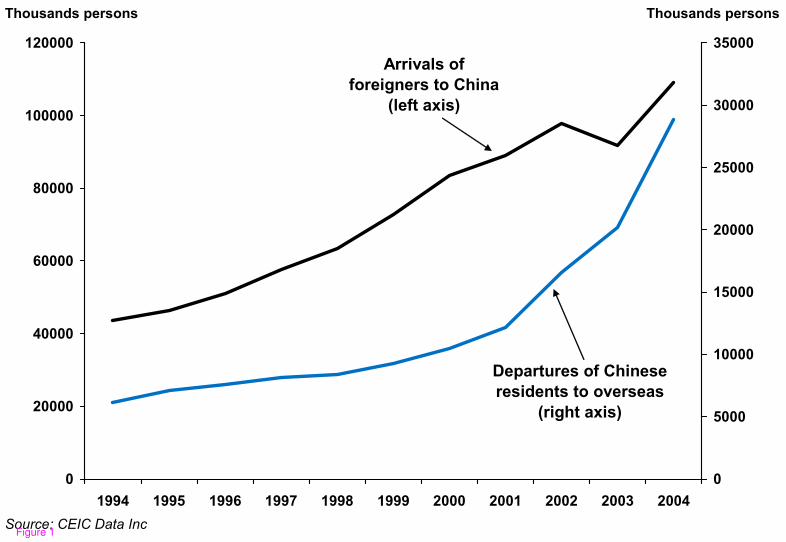
Resistant pathogens within a hospital or specific community can spread to a
nation at large or across national boundaries. Thus, for example, rapidly increasing
travel and migration within China probably contributes to the growth of that nation’s
resistance problem. It may also spur the spread of China’s resistance problems
overseas as globalization greatly increases travel from and to that nation (see Figure
1).
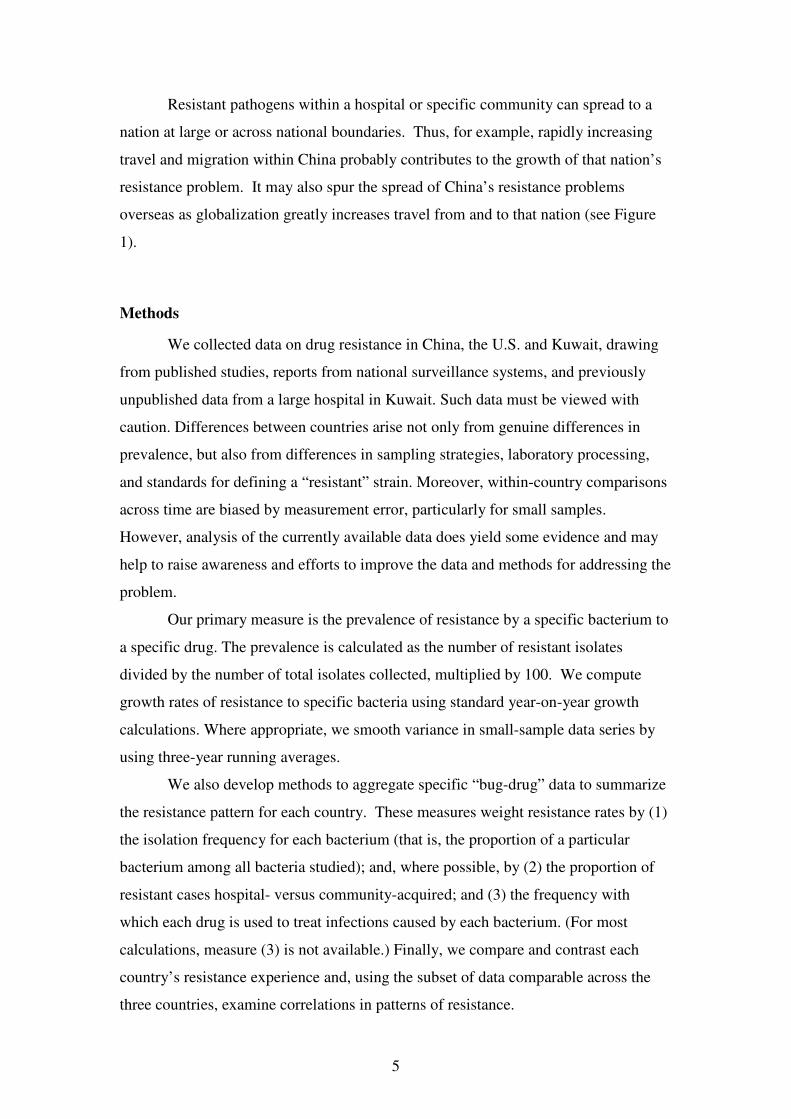
Methods
We collected data on drug resistance in China, the U.S. and Kuwait, drawing
from published studies, reports from national surveillance systems, and previously
unpublished data from a large hospital in Kuwait. Such data must be viewed with
caution. Differences between countries arise not only from genuine differences in
prevalence, but also from differences in sampling strategies, laboratory processing,
and standards for defining a “resistant” strain. Moreover, within-country comparisons
across time are biased by measurement error, particularly for small samples.
However, analysis of the currently available data does yield some evidence and may
help to raise awareness and efforts to improve the data and methods for addressing the
problem.
Our primary measure is the prevalence of resistance by a specific bacterium to
a specific drug. The prevalence is calculated as the number of resistant isolates
divided by the number of total isolates collected, multiplied by 100. We compute
growth rates of resistance to specific bacteria using standard year-on-year growth
calculations. Where appropriate, we smooth variance in small-sample data series by
using three-year running averages.
We also develop methods to aggregate specific “bug-drug” data to summarize
the resistance pattern for each country. These measures weight resistance rates by (1)
the isolation frequency for each bacterium (that is, the proportion of a particular
bacterium among all bacteria studied); and, where possible, by (2) the proportion of
resistant cases hospital- versus community-acquired; and (3) the frequency with
which each drug is used to treat infections caused by each bacterium. (For most
calculations, measure (3) is not available.) Finally, we compare and contrast each
country’s resistance experience and, using the subset of data comparable across the
three countries, examine correlations in patterns of resistance.
Page 7
6
These methods represent preliminary steps to gauge whether patterns of
antibiotic resistance converge over time amongst countries that currently have little
population interchange. Future research would benefit from better surveillance of
resistance, more comparable data reporting, data on antibiotic utilization, and further
methodological advances in clinically- and policy-relevant aggregation of “bug-drug”
data.
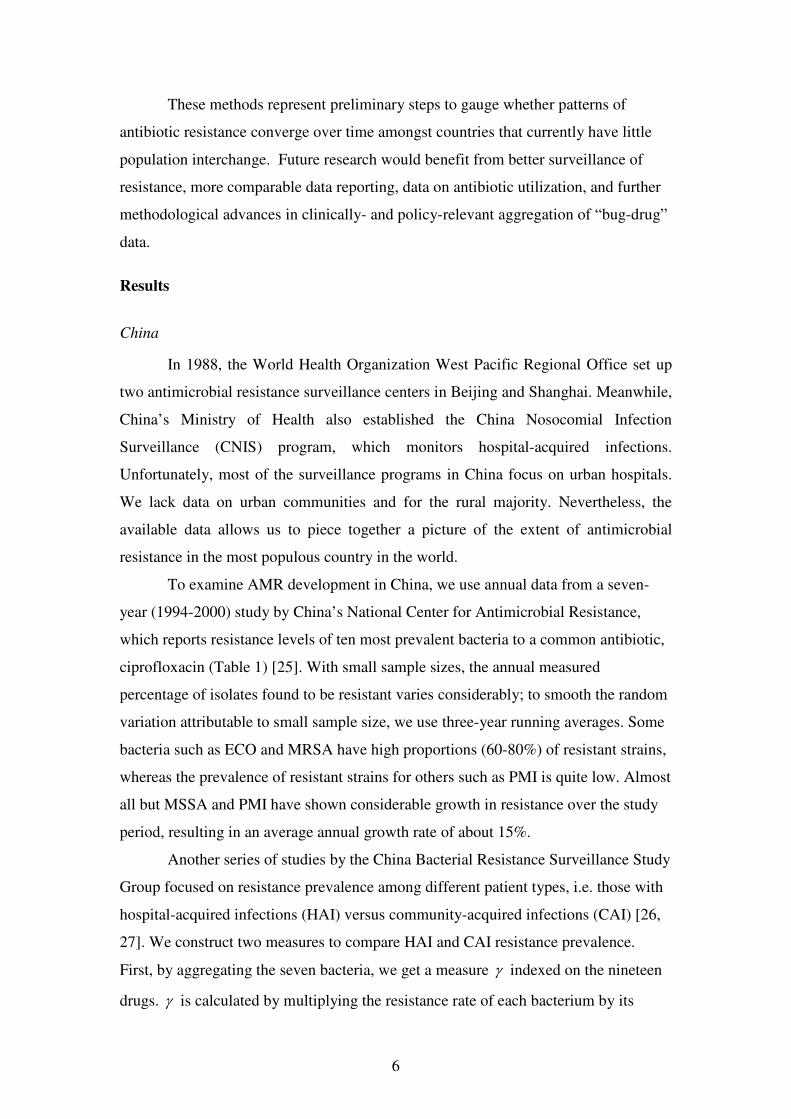
Results
China
In 1988, the World Health Organization West Pacific Regional Office set up
two antimicrobial resistance surveillance centers in Beijing and Shanghai. Meanwhile,
China’s Ministry of Health also established the China Nosocomial Infection
Surveillance (CNIS) program, which monitors hospital-acquired infections.
Unfortunately, most of the surveillance programs in China focus on urban hospitals.
We lack data on urban communities and for the rural majority. Nevertheless, the
available data allows us to piece together a picture of the extent of antimicrobial
resistance in the most populous country in the world.
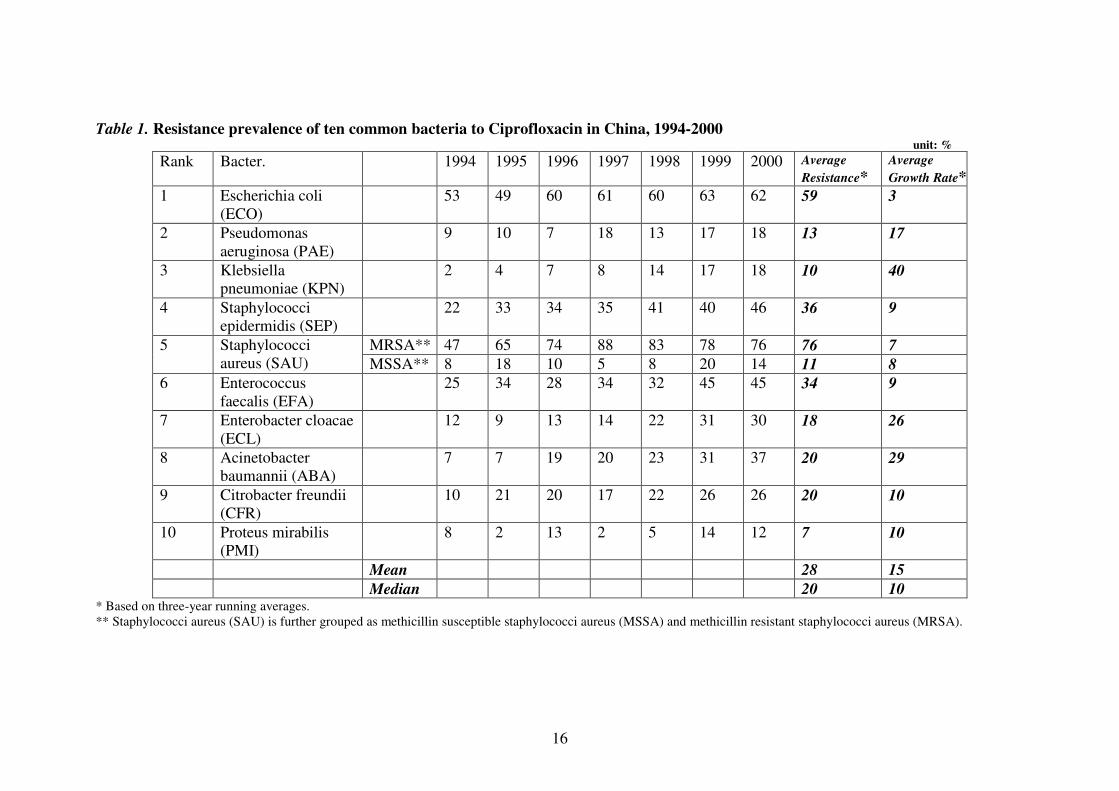
To examine AMR development in China, we use annual data from a seven-
year (1994-2000) study by China’s National Center for Antimicrobial Resistance,
which reports resistance levels of ten most prevalent bacteria to a common antibiotic,
ciprofloxacin (Table 1) [25]. With small sample sizes, the annual measured
percentage of isolates found to be resistant varies considerably; to smooth the random
variation attributable to small sample size, we use three-year running averages. Some
bacteria such as ECO and MRSA have high proportions (60-80%) of resistant strains,
whereas the prevalence of resistant strains for others such as PMI is quite low. Almost
all but MSSA and PMI have shown considerable growth in resistance over the study
period, resulting in an average annual growth rate of about 15%.
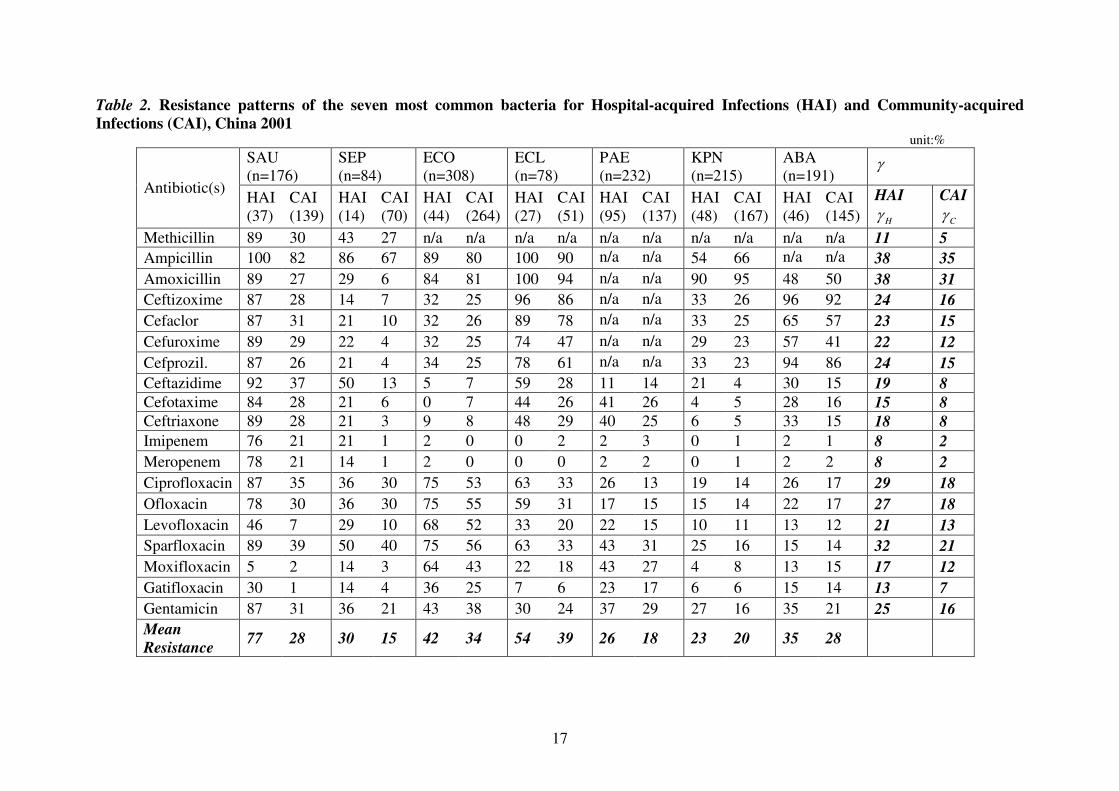
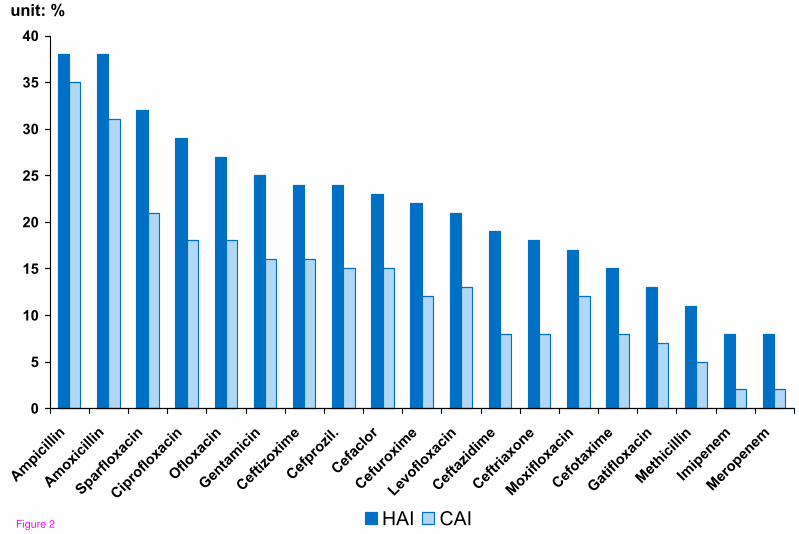
Another series of studies by the China Bacterial Resistance Surveillance Study
Group focused on resistance prevalence among different patient types, i.e. those with
hospital-acquired infections (HAI) versus community-acquired infections (CAI) [26,
27]. We construct two measures to compare HAI and CAI resistance prevalence.
First, by aggregating the seven bacteria, we get a measure γ indexed on the nineteen
drugs. γ is calculated by multiplying the resistance rate of each bacterium by its
Page 8
7
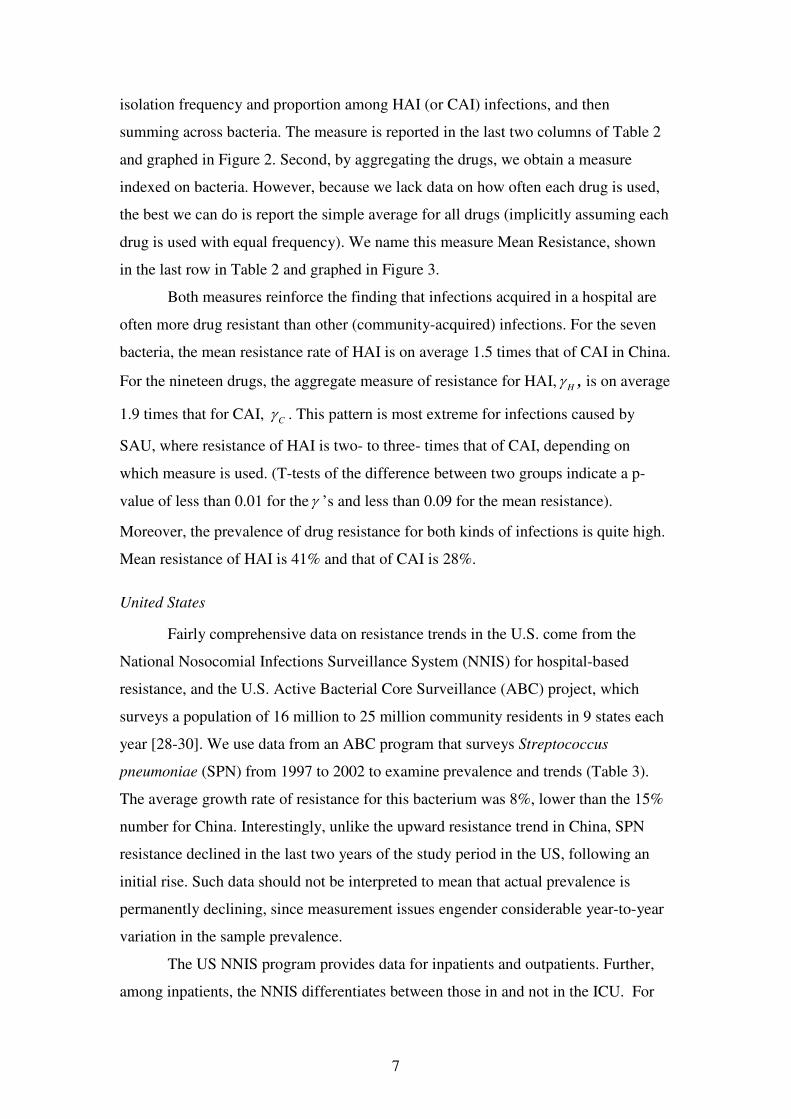
isolation frequency and proportion among HAI (or CAI) infections, and then
summing across bacteria. The measure is reported in the last two columns of Table 2
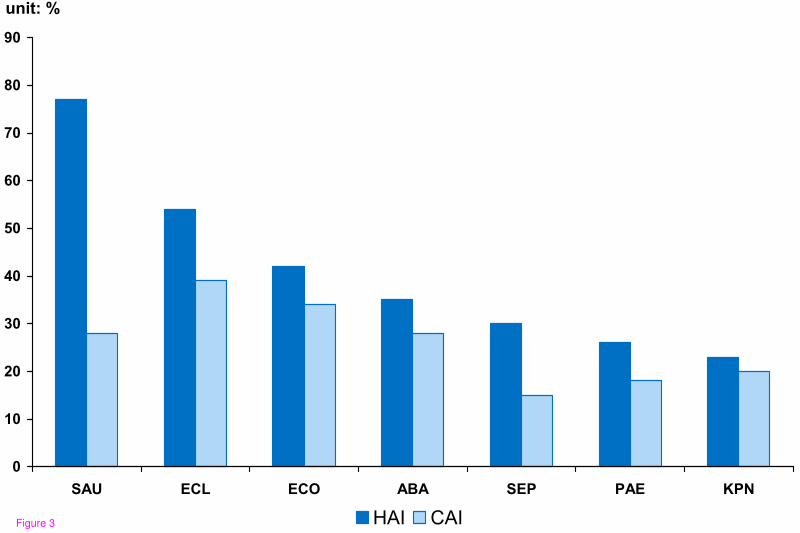
and graphed in Figure 2. Second, by aggregating the drugs, we obtain a measure
indexed on bacteria. However, because we lack data on how often each drug is used,
the best we can do is report the simple average for all drugs (implicitly assuming each
drug is used with equal frequency). We name this measure Mean Resistance, shown
in the last row in Table 2 and graphed in Figure 3.
Both measures reinforce the finding that infections acquired in a hospital are
often more drug resistant than other (community-acquired) infections. For the seven
bacteria, the mean resistance rate of HAI is on average 1.5 times that of CAI in China.
For the nineteen drugs, the aggregate measure of resistance for HAI,H
γ , is on average
1.9 times that for CAI, C
γ . This pattern is most extreme for infections caused by
SAU, where resistance of HAI is two- to three- times that of CAI, depending on
which measure is used. (T-tests of the difference between two groups indicate a p-
value of less than 0.01 for theγ ’s and less than 0.09 for the mean resistance).
Moreover, the prevalence of drug resistance for both kinds of infections is quite high.
Mean resistance of HAI is 41% and that of CAI is 28%.
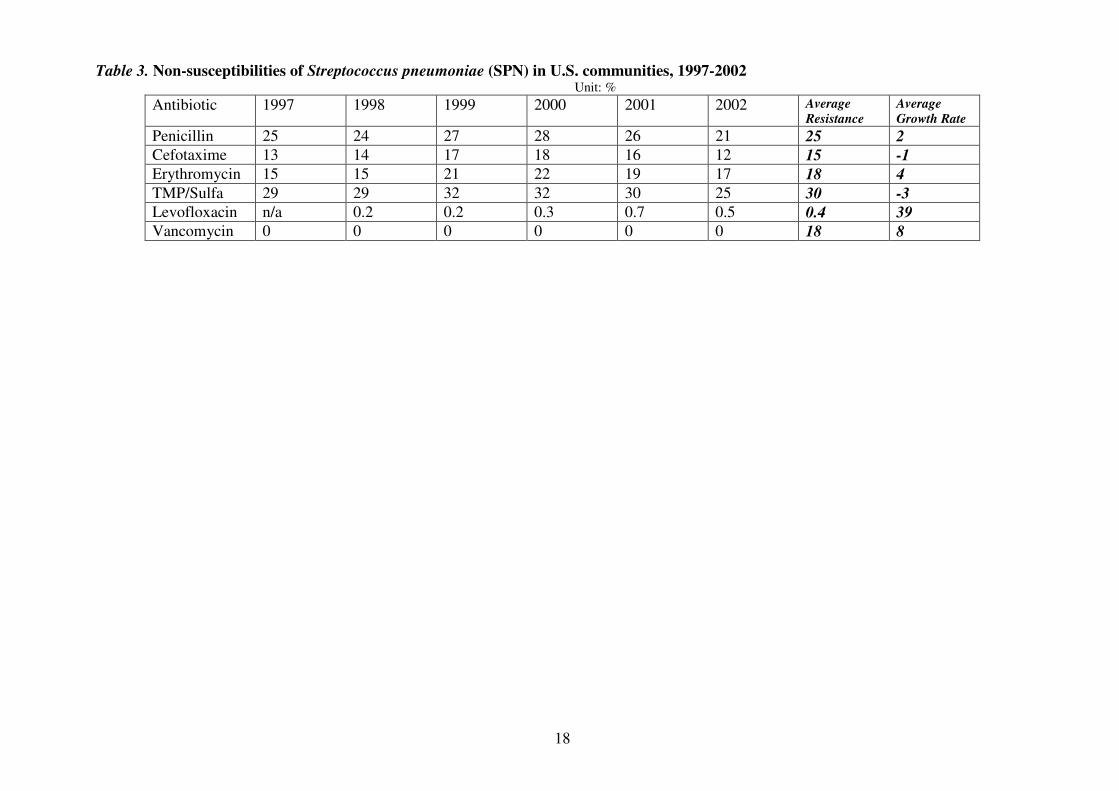
United States
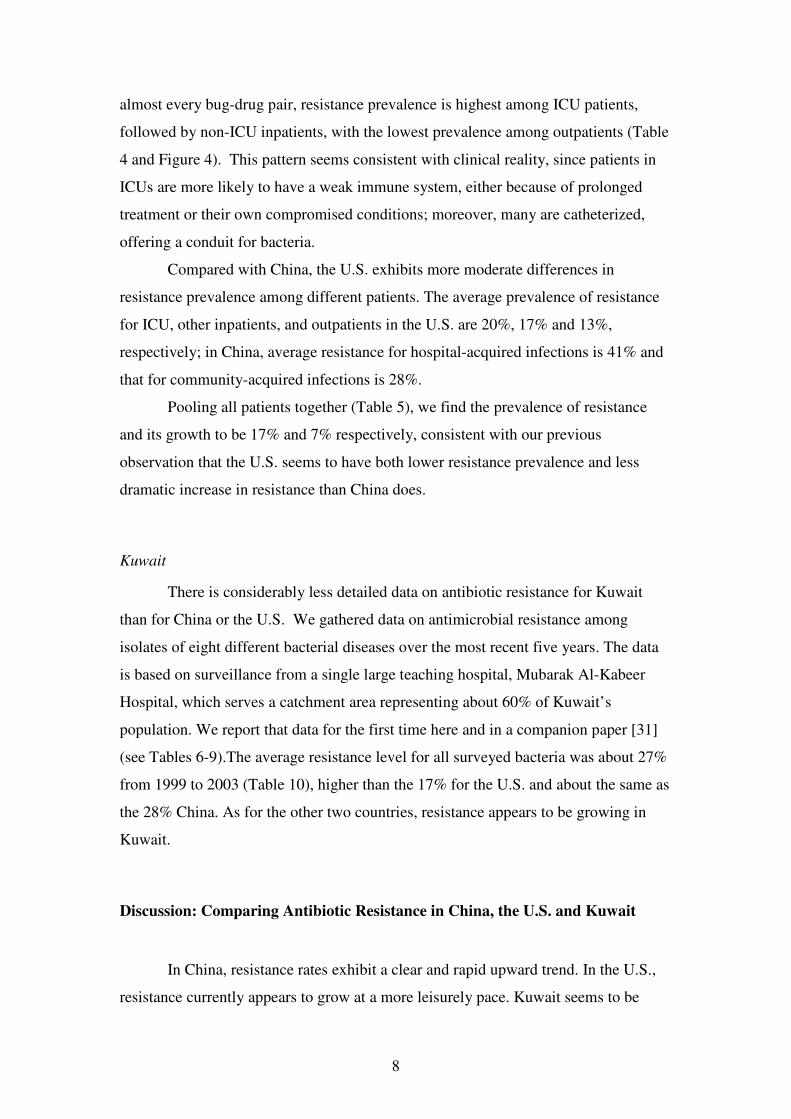
Fairly comprehensive data on resistance trends in the U.S. come from the
National Nosocomial Infections Surveillance System (NNIS) for hospital-based
resistance, and the U.S. Active Bacterial Core Surveillance (ABC) project, which
surveys a population of 16 million to 25 million community residents in 9 states each
year [28-30]. We use data from an ABC program that surveys Streptococcus
pneumoniae (SPN) from 1997 to 2002 to examine prevalence and trends (Table 3).
The average growth rate of resistance for this bacterium was 8%, lower than the 15%
number for China. Interestingly, unlike the upward resistance trend in China, SPN
resistance declined in the last two years of the study period in the US, following an
initial rise. Such data should not be interpreted to mean that actual prevalence is
permanently declining, since measurement issues engender considerable year-to-year
variation in the sample prevalence.
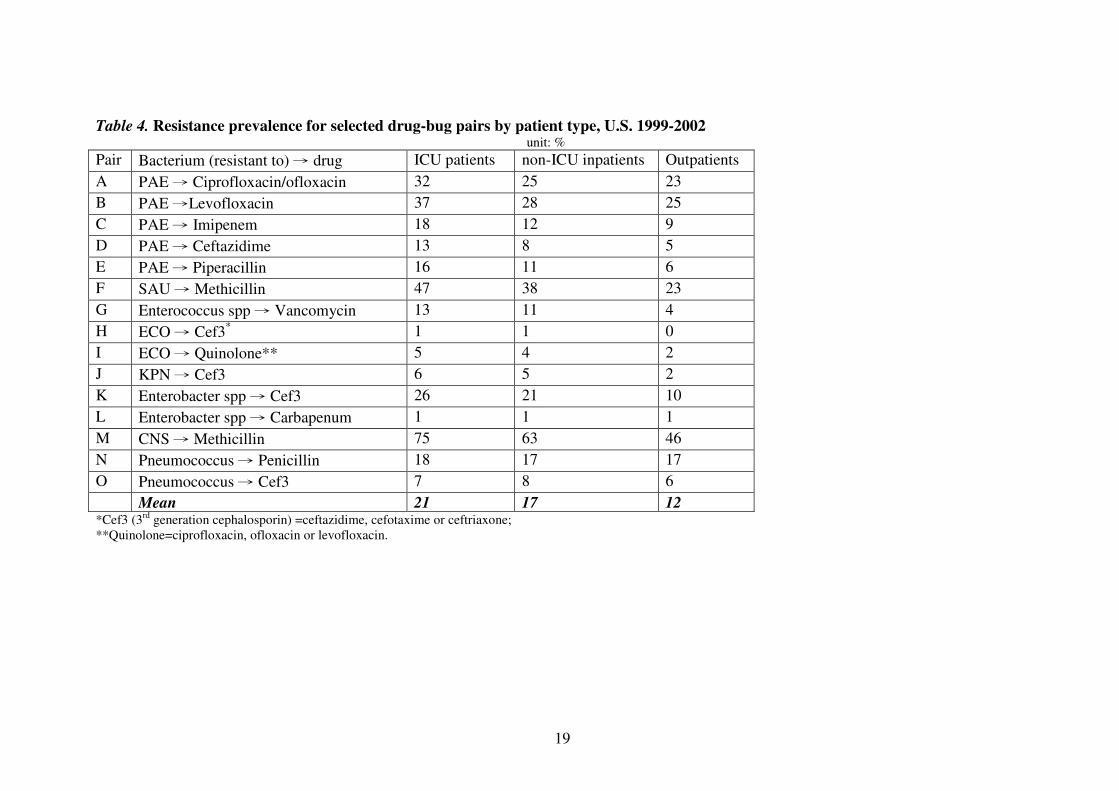
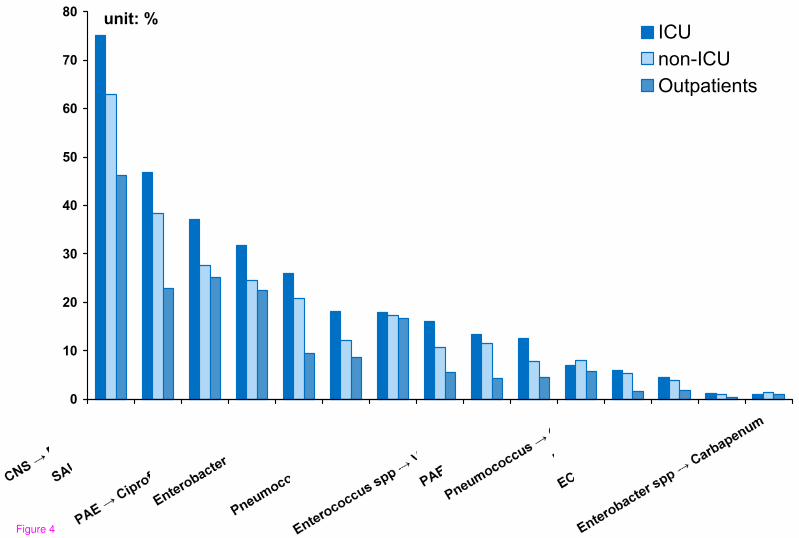
The US NNIS program provides data for inpatients and outpatients. Further,
among inpatients, the NNIS differentiates between those in and not in the ICU. For
Page 9
8
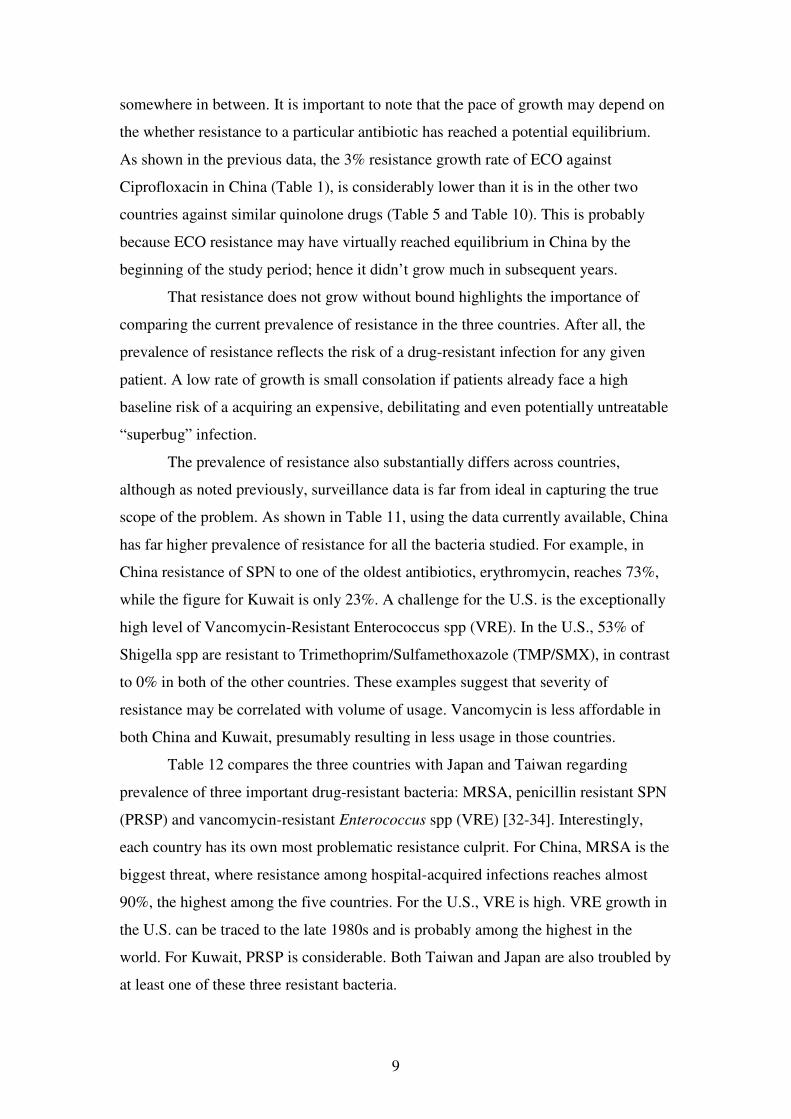
almost every bug-drug pair, resistance prevalence is highest among ICU patients,
followed by non-ICU inpatients, with the lowest prevalence among outpatients (Table
4 and Figure 4). This pattern seems consistent with clinical reality, since patients in
ICUs are more likely to have a weak immune system, either because of prolonged
treatment or their own compromised conditions; moreover, many are catheterized,
offering a conduit for bacteria.
Compared with China, the U.S. exhibits more moderate differences in
resistance prevalence among different patients. The average prevalence of resistance
for ICU, other inpatients, and outpatients in the U.S. are 20%, 17% and 13%,
respectively; in China, average resistance for hospital-acquired infections is 41% and
that for community-acquired infections is 28%.
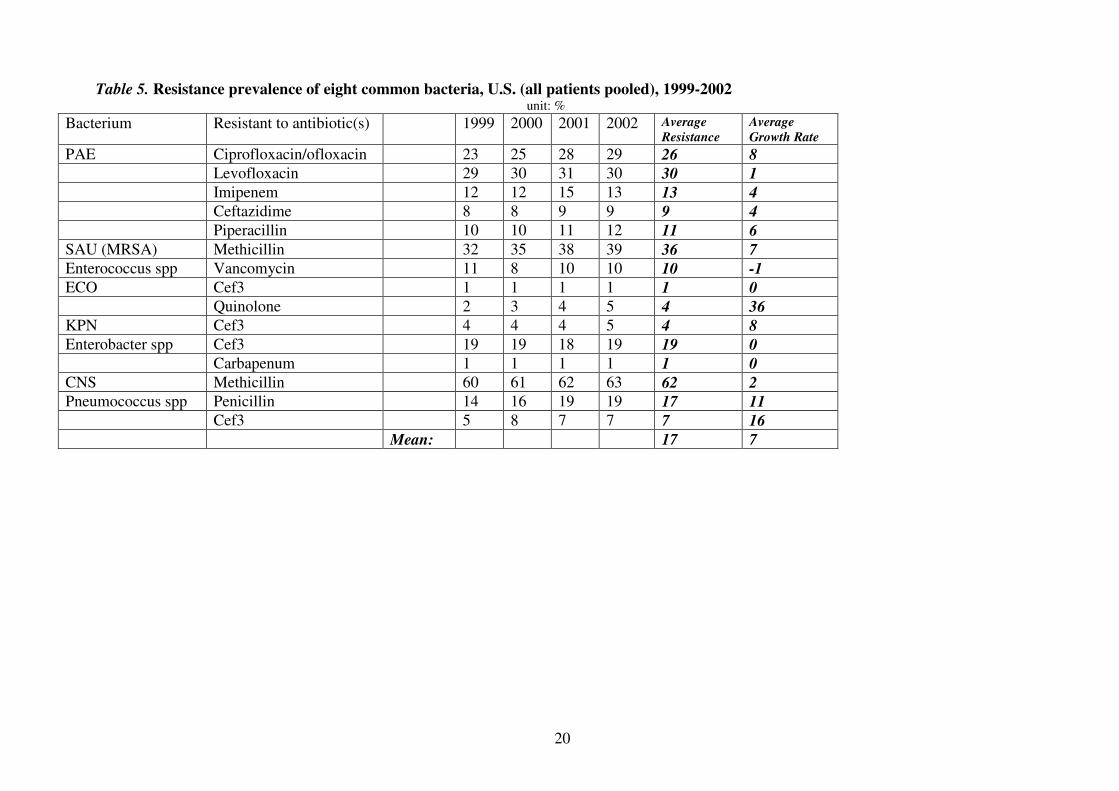
Pooling all patients together (Table 5), we find the prevalence of resistance
and its growth to be 17% and 7% respectively, consistent with our previous
observation that the U.S. seems to have both lower resistance prevalence and less
dramatic increase in resistance than China does.
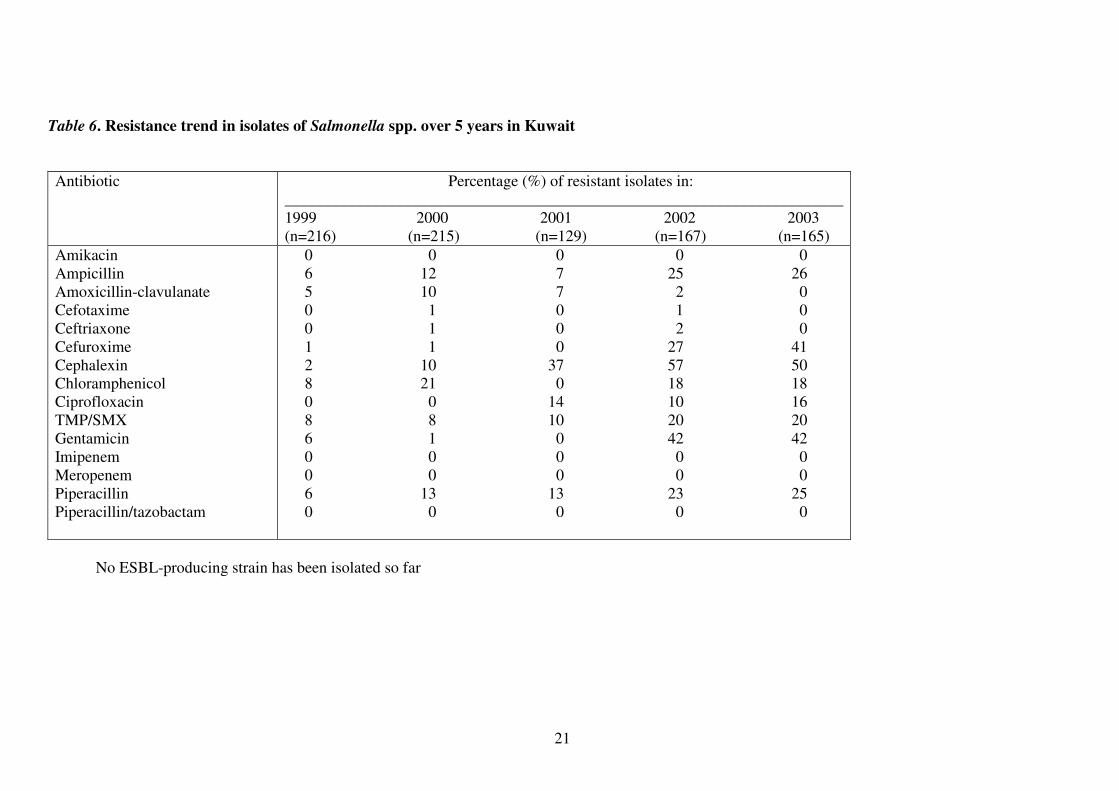
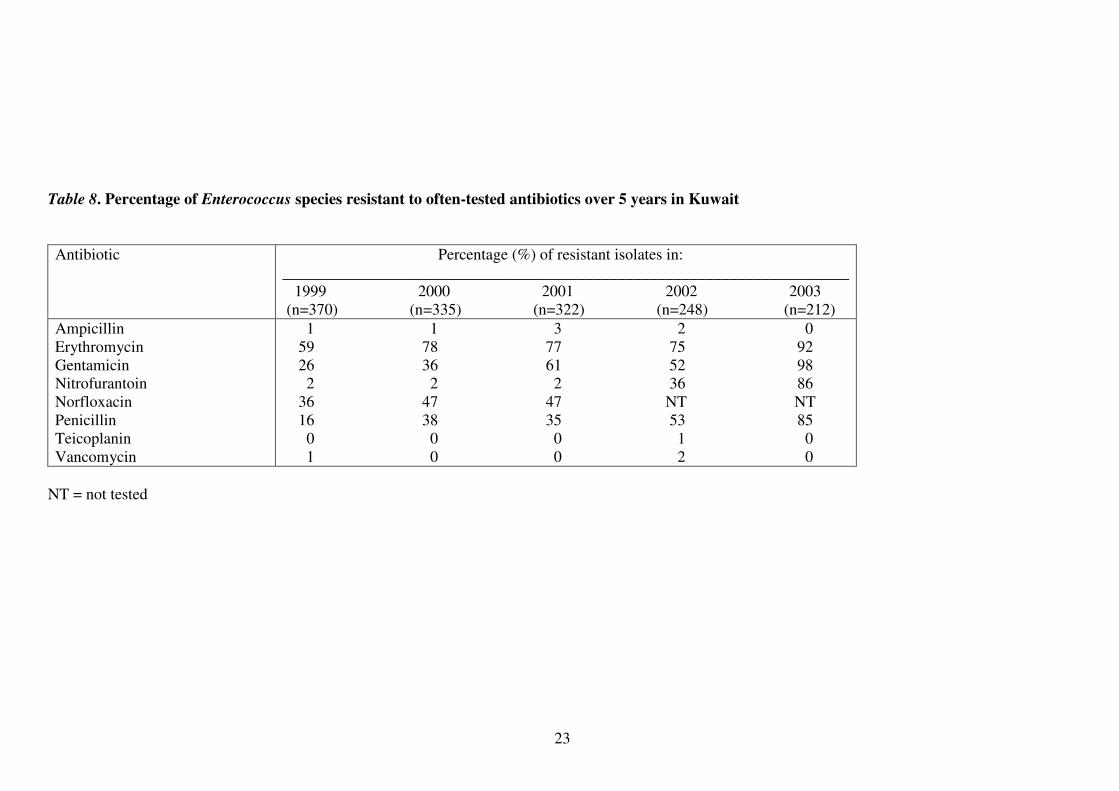
Kuwait
There is considerably less detailed data on antibiotic resistance for Kuwait
than for China or the U.S. We gathered data on antimicrobial resistance among
isolates of eight different bacterial diseases over the most recent five years. The data
is based on surveillance from a single large teaching hospital, Mubarak Al-Kabeer
Hospital, which serves a catchment area representing about 60% of Kuwait’s
population. We report that data for the first time here and in a companion paper [31]
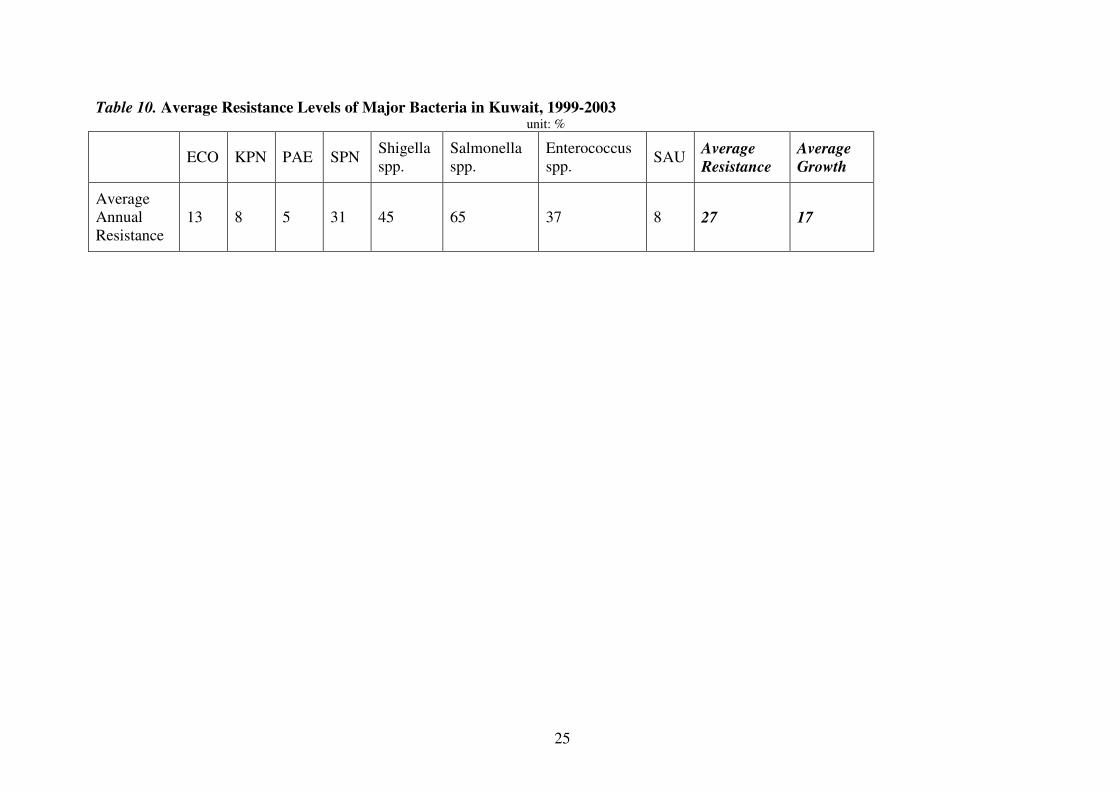
(see Tables 6-9).The average resistance level for all surveyed bacteria was about 27%
from 1999 to 2003 (Table 10), higher than the 17% for the U.S. and about the same as
the 28% China. As for the other two countries, resistance appears to be growing in
Kuwait.
Discussion: Comparing Antibiotic Resistance in China, the U.S. and Kuwait
In China, resistance rates exhibit a clear and rapid upward trend. In the U.S.,
resistance currently appears to grow at a more leisurely pace. Kuwait seems to be
Page 10
9
somewhere in between. It is important to note that the pace of growth may depend on
the whether resistance to a particular antibiotic has reached a potential equilibrium.
As shown in the previous data, the 3% resistance growth rate of ECO against
Ciprofloxacin in China (Table 1), is considerably lower than it is in the other two
countries against similar quinolone drugs (Table 5 and Table 10). This is probably
because ECO resistance may have virtually reached equilibrium in China by the
beginning of the study period; hence it didn’t grow much in subsequent years.
That resistance does not grow without bound highlights the importance of
comparing the current prevalence of resistance in the three countries. After all, the
prevalence of resistance reflects the risk of a drug-resistant infection for any given
patient. A low rate of growth is small consolation if patients already face a high
baseline risk of a acquiring an expensive, debilitating and even potentially untreatable
“superbug” infection.
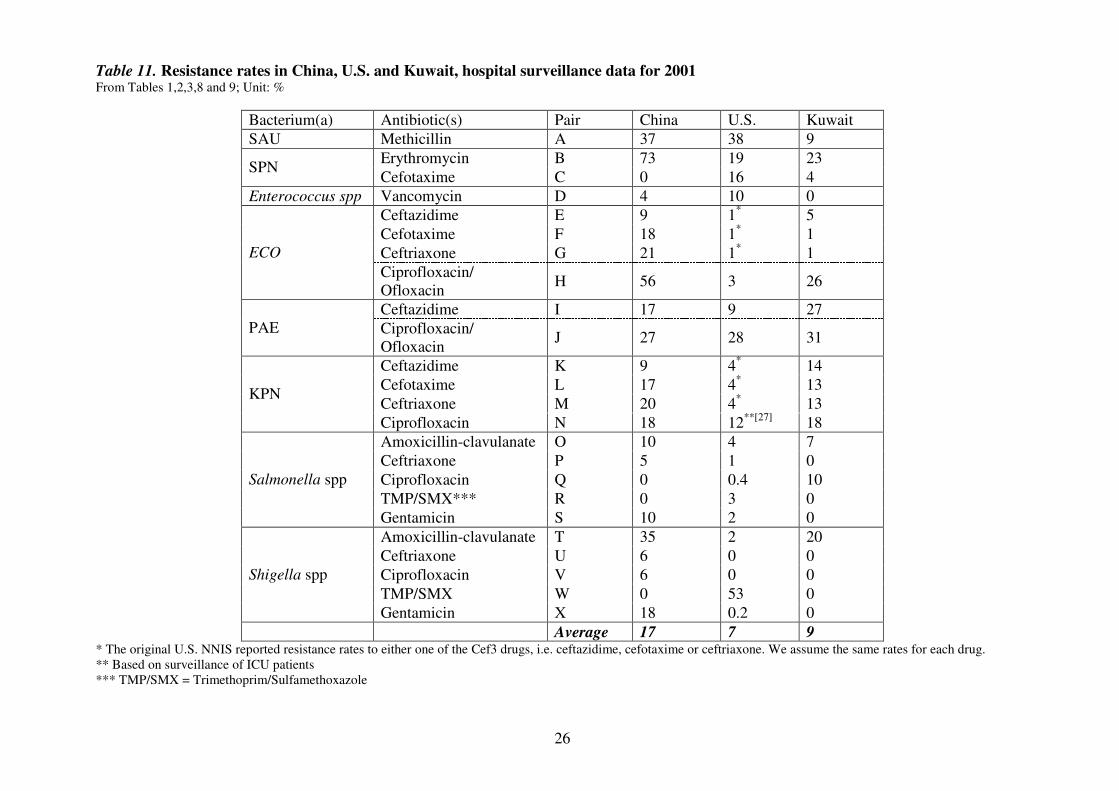
The prevalence of resistance also substantially differs across countries,
although as noted previously, surveillance data is far from ideal in capturing the true
scope of the problem. As shown in Table 11, using the data currently available, China
has far higher prevalence of resistance for all the bacteria studied. For example, in
China resistance of SPN to one of the oldest antibiotics, erythromycin, reaches 73%,
while the figure for Kuwait is only 23%. A challenge for the U.S. is the exceptionally
high level of Vancomycin-Resistant Enterococcus spp (VRE). In the U.S., 53% of
Shigella spp are resistant to Trimethoprim/Sulfamethoxazole (TMP/SMX), in contrast
to 0% in both of the other countries. These examples suggest that severity of
resistance may be correlated with volume of usage. Vancomycin is less affordable in
both China and Kuwait, presumably resulting in less usage in those countries.
Table 12 compares the three countries with Japan and Taiwan regarding
prevalence of three important drug-resistant bacteria: MRSA, penicillin resistant SPN
(PRSP) and vancomycin-resistant Enterococcus spp (VRE) [32-34]. Interestingly,
each country has its own most problematic resistance culprit. For China, MRSA is the
biggest threat, where resistance among hospital-acquired infections reaches almost
90%, the highest among the five countries. For the U.S., VRE is high. VRE growth in
the U.S. can be traced to the late 1980s and is probably among the highest in the
world. For Kuwait, PRSP is considerable. Both Taiwan and Japan are also troubled by
at least one of these three resistant bacteria.
Page 11
10
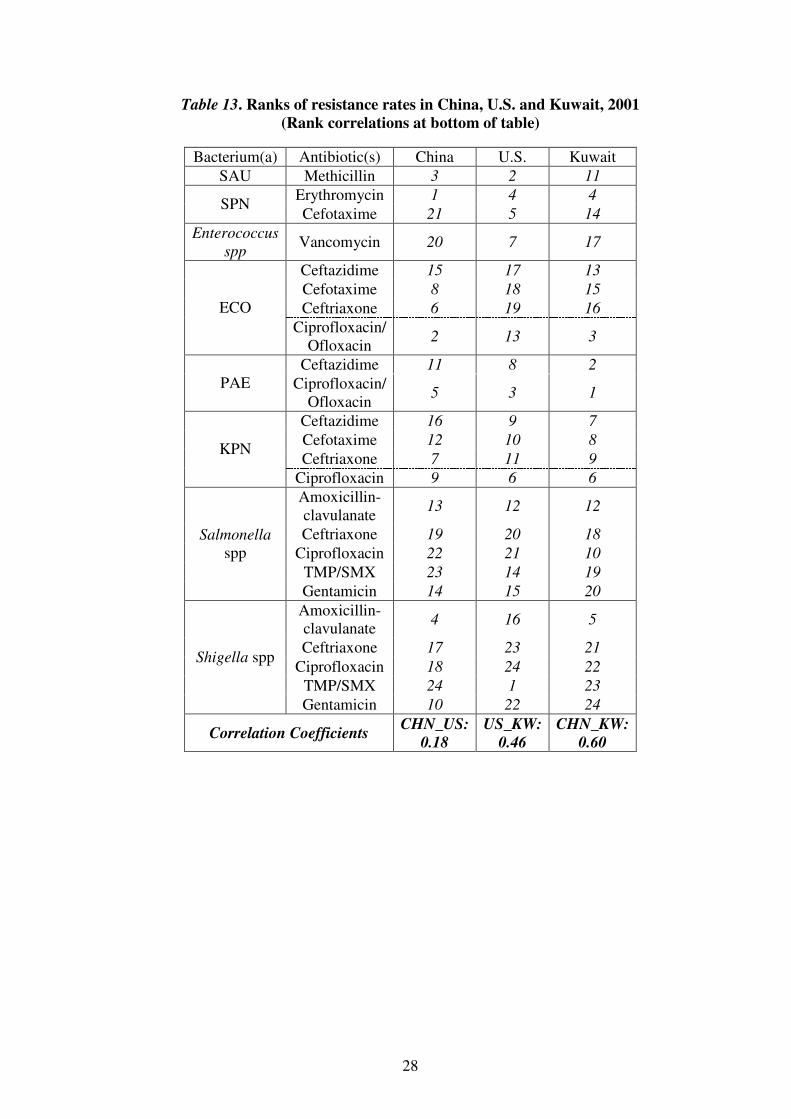
Resistance Correlations
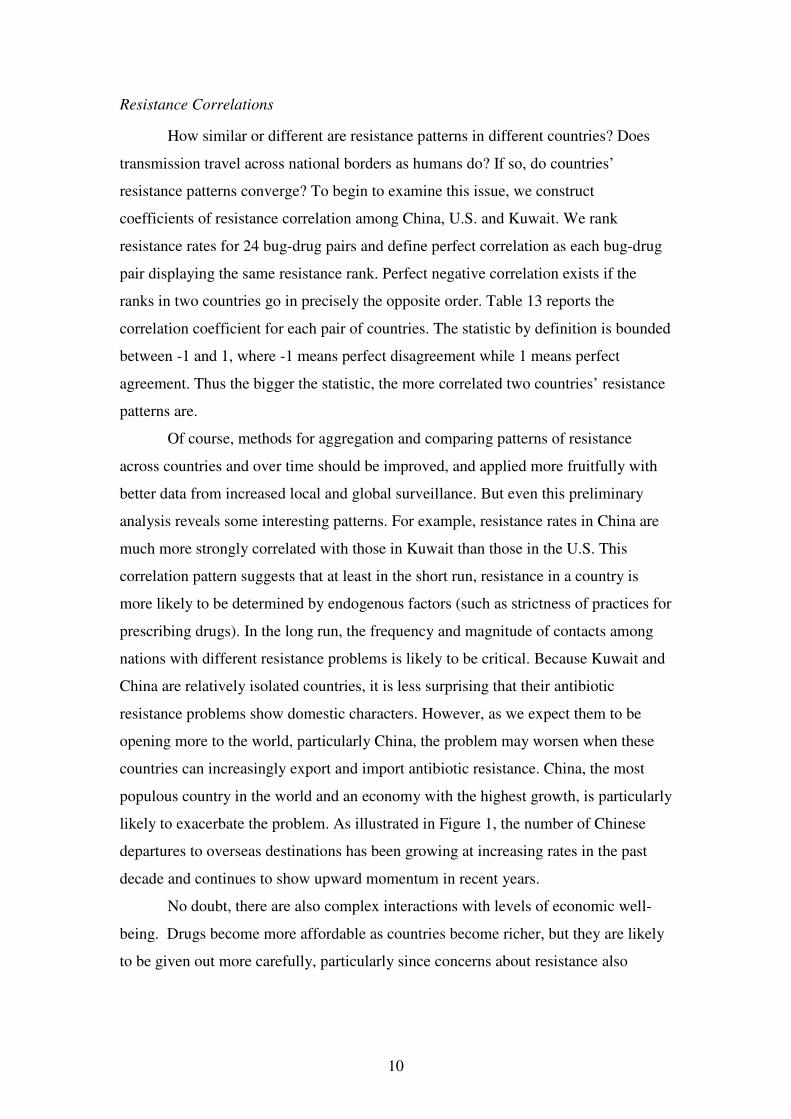
How similar or different are resistance patterns in different countries? Does
transmission travel across national borders as humans do? If so, do countries’
resistance patterns converge? To begin to examine this issue, we construct
coefficients of resistance correlation among China, U.S. and Kuwait. We rank
resistance rates for 24 bug-drug pairs and define perfect correlation as each bug-drug
pair displaying the same resistance rank. Perfect negative correlation exists if the
ranks in two countries go in precisely the opposite order. Table 13 reports the
correlation coefficient for each pair of countries. The statistic by definition is bounded
between -1 and 1, where -1 means perfect disagreement while 1 means perfect
agreement. Thus the bigger the statistic, the more correlated two countries’ resistance
patterns are.
� Of course, methods for aggregation and comparing patterns of resistance
across countries and over time should be improved, and applied more fruitfully with
better data from increased local and global surveillance. But even this preliminary
analysis reveals some interesting patterns. For example, resistance rates in China are
much more strongly correlated with those in Kuwait than those in the U.S. This
correlation pattern suggests that at least in the short run, resistance in a country is
more likely to be determined by endogenous factors (such as strictness of practices for
prescribing drugs). In the long run, the frequency and magnitude of contacts among
nations with different resistance problems is likely to be critical. Because Kuwait and
China are relatively isolated countries, it is less surprising that their antibiotic
resistance problems show domestic characters. However, as we expect them to be
opening more to the world, particularly China, the problem may worsen when these
countries can increasingly export and import antibiotic resistance. China, the most
populous country in the world and an economy with the highest growth, is particularly
likely to exacerbate the problem. As illustrated in Figure 1, the number of Chinese
departures to overseas destinations has been growing at increasing rates in the past
decade and continues to show upward momentum in recent years.
No doubt, there are also complex interactions with levels of economic well-
being. Drugs become more affordable as countries become richer, but they are likely
to be given out more carefully, particularly since concerns about resistance also
Page 12
11
increase. The critical question for policy is whether countries can control their own
resistance problems, and also avoid importing the problem from abroad.
Conclusions
We have outlined the nature of the antimicrobial resistance problem as an
important health and cost issue for three quite disparate nations, and by inference for a
broad swath of the world’s population. Surprisingly, this issue virtually never
receives prominent attention at the national or international level, despite its scope
and potentially devastating impact on global public health in the coming decades.
We examined antimicrobial resistance data for China, Kuwait, and the United
States. In each country, we looked at specific infectious agents and their resistance to
particular antibiotics or other antimicrobials. Though an upward trend of resistance
is found broadly, the patterns of correlation between countries’ resistance rates
suggest predominantly independent profiles. But we would expect greater
convergence as globalization increases contacts between different nations’
populations, raising questions about how to coordinate an effective international
response [35].
Future research should develop better methods of data aggregation, explore
the patterns of drug resistance across more countries, analyze the determinants of
transmission of drug resistance across national boundaries, and assess how those
determinants are progressing. Individuals everywhere would benefit if far greater
attention were paid to the problem of antimicrobial resistance.
Competing interests The authors declare that they have no competing interests.
Authors' contributions
RFZ assembled the data, carried out the analysis and drafted the manuscript.
KE and RJZ conceived of the study, participated in its design and coordination, and
helped to draft the manuscript. VR provided the Kuwait data and helped to draft the
manuscript. All authors read and approved the manuscript.
Page 13
12
Acknowledgements
The authors gratefully acknowledge financial support from the Kuwait
Foundation for the Advancement of Sciences through the John F. Kennedy School of
Government at Harvard University.�
References 1. Kimball AM, Arima Y, Hodges RH: Trade related infections: farther,
faster, quieter. Globalization and Health 2005, 1:3.
2. Hodges RH, Kimball AM: The global diet: trade and novel infections.
Globalization and Health 2005, 1:4.
3. Wilson KH, Blitchington RB: Human colonic biota studied by ribosomal
DNA sequence analysis. Appl Environ Microbiol; 62, 7: 2273-2278.
4. Institute of Medicine: Emerging infections: microbial threats to health in
the United States. National Academy Press, 1994.
5. Wilson KH, Blitchington RB: Human colonic biota studied by ribosomal
DNA sequence analysis. Appl Environ Microbiol; 62, 7: 2273-8
6. Davies J: Bacteria on the rampage. Nature 1996, 383:219-220.
7. Field HJ, Coen DM: Pathogenicity of herpes simplex virus mutants
containing drug resistance mutations in the viral DNA polymerase gene. J
Virol 1986, 60(1): 286-289.
8. Muder RR, Brennen C, Wagener MM et al: Temporal shifts in traits of
Vibrio cholerae strains isolated from hospitalized patients in Calcutta: a
3-year (1993-1995) analysis. J Clin Microbiol 1996, 34: 2537-2543.
9. Bisognano C et al: Increased expression of fibronectin-binding proteins by
fluoroquinolone-resistant Staphylococcus aureus exposed to subinhibitory
levels of ciprofloxacin. Antimicrob Agents Chemother 1997, 41(5): 906-913.
10. World Health Organization: WHO Global Strategy for Containment of
Antimicrobial Resistance. Geneva 2001.
11. Arason VA and Kristinsson KG et al: Do antimicrobials increase the
carriage rate of penicillin resistant pneumococci in children? Cross
sectional prevalence study. BMJ 1996, 313:387-91.
12. Seppala H and Klaukka T et al: The effect of changes in the consumption of
macrolide antibiotics on erythromycin resistance in group A streptococci
in Finland. Finnish Study Group for Antimicrobial Resistance. N Engl J
Med 1997, 337:441-6.
13. Levy SB, Fitzgerald GB, Macone AB: Spread of Antibiotic-Resistant
Plasmids from Chicken to Chicken and from Chicken to Man. Nature
1976, 260(5546): 40-42.
14. Levy SB, Fitzgerald GB, Macone AB: Changes in Intestinal Flora of Farm
Personnel after Introduction of a Tetracycline-Supplemented Feed on a
Farm. N Engl J Med 1976, 295: 583-588.
15. Witte W: Selective pressure by antibiotic use in livestock. Int J Antimicrob
Agents 2000 16 Suppl 1:S19-24. Review.
16. Breathnach AS, de Ruiter A, Holdsworth GM et al: An outbreak of multi-
drug-resistant tuberculosis in a London teaching hospital. J Hosp Infect
1998, 39(2): 111-117.
Page 14
13
17. Hannan MM, Azadian BS, Gazzard BG et al: Hospital infection control in
an era of HIV infection and multi-drug resistant tuberculosis. J Hosp
Infect 2000, 44(1): 5-11.
18. Martin MA: Methicillin-resistant Staphylococcus aureus: the persistent
resistant nosocomial pathogen. Curr Clin Top Infect Dis 1994, 14: 170-191.
19. Wang F, Zhu D et al: Surveillance of bacterial resistance in Shanghai. Chin
J. Infect. Chemother 2002, 2(1): 1-9.
20. Cox RA, Conquest C, Malaghan C et al: A major outbreak of methicillin-
resistant Staphylococcus aureus caused by new phage-type (EMRSA-16).
J Hosp Infect 1995, 29: 87-106.
21. Astagneau P et al: Cost of antimicrobial treatment for nosocomial
infections based on a French prevalence survey. J Hosp Infect 1999, 42:
303-312.
22. Haley RW, Morgan WM, Culver DH et al: Update from the SENIC project.
Hospital infection control: Recent progress and opportunities under
prospective payment. Am J Infect Control 1985, 13: 97–108.
23. Duckworth GJ: Diagnosis and management of methicillin-resistant
Staphylococcus aureus infection. British Medical Journal 1993, 307: 1049-
1052.
24. Tsiodras S, Gold H, et al: Linezolid resistance in a clinical isolate of
Staphylococcus aureus. Lancet 2001, 358: 207-208.
25. Chen H, Ma Y, et al (National Antimicrobial Resistance Surveillance Center):
The Changing Patterns of Ciprofloxacin Resistant Bacteria Strains
Isolated from Fifty Hospitals in China from 1994 to 2000, Chin J Infect
Chemotherapy 2002, 2(4): 43-45.
26. Li J, Li G, Wang J: Surveillance on gram-positive bacteria isolated from
patients with hospital acquired infections or community acquired
infections (in Chinese). Natl Med J China 2003, 83(5): 365-374.
27. Li J, Li G, Wang J: Surveillance on gram-positive bacteria isolated from
patients with hospital acquired infections or community acquired
infections (in Chinese). Natl Med J China 2003, 83(12): 1035-1045.
28. National Nosocomial Infections Surveillance System Aug. 2001 report,
available at http://www.cdc.gov/ncidod/hip/SURVEILL/NNIS.HTM.
29. National Antimicrobial Resistance Monitoring System for Enteric Bacteria
2002 report available at http://www.cdc.gov/narms/.
30. Active Bacterial Core Surveillance 2001 report available at
http://www.cdc.gov/ncidod/dbmd/abcs/survreports.htm.
31. Eggleston KE, Rotimi V, Ghayda A, Zhang R, Zeckhauser RJ: An economic
analysis of antimicrobial resistance in Kuwait. Forthcoming, J
Antimicrobial Chemotherapy.
32. Neuhauser MM: Antibiotic resistance among Gram-negative bacilli in US
intensive care units: implications for fluoroquinolone use. JAMA 2003,
289(7): 885–888.
33. Sun Z: Antimicrobial resistance and clinical interventions. Adverse Drug
Reaction J 2003, 3: 151-155.
34. McDonald LC, Lauderdale T, et al: The status of antimicrobial resistance in
Taiwan among Gram-positive pathogens: the Taiwan Surveillance of
Antimicrobial Resistance (TSAR) programme 2000. Int J Antimicrob
Agents. 2004, 23(4): 362-370.
Page 15
14
35. Fidler DP: Globalization, international law, and emerging infectious
diseases. Emerg Infect Dis. 1996, 2(2): 77-84.
Page 16
15
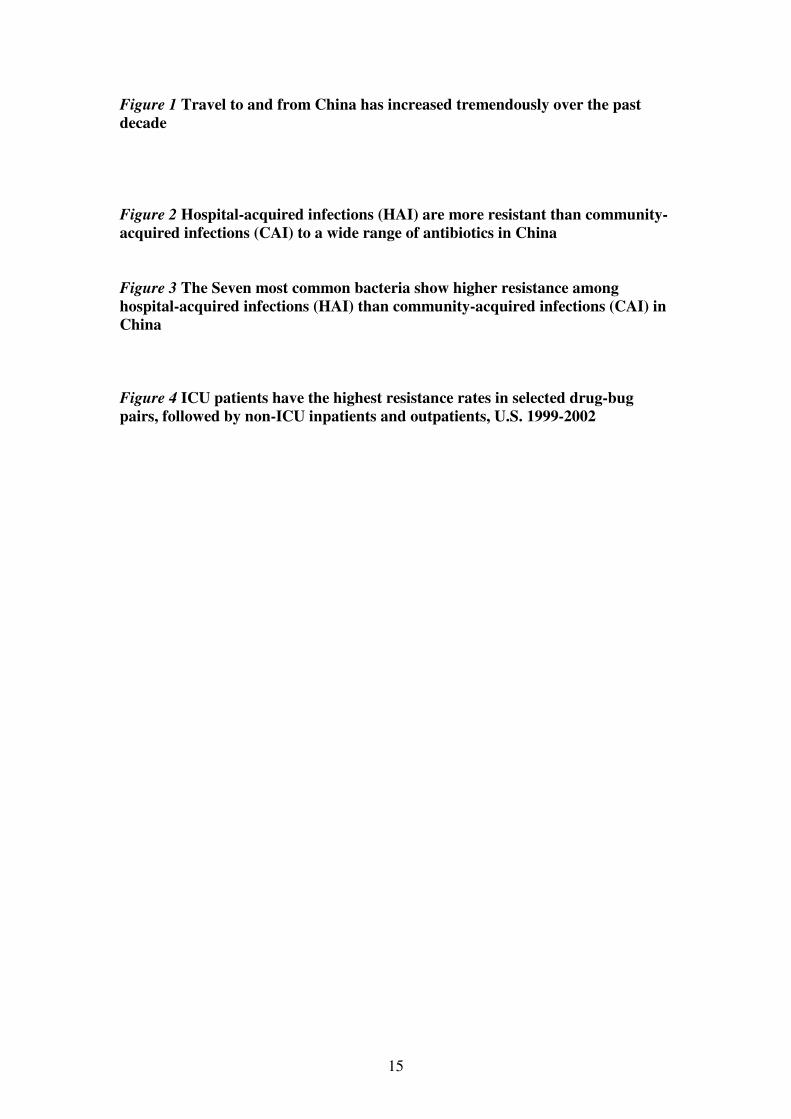
Figure 1 Travel to and from China has increased tremendously over the past
decade
Figure 2 Hospital-acquired infections (HAI) are more resistant than community-
acquired infections (CAI) to a wide range of antibiotics in China
Figure 3 The Seven most common bacteria show higher resistance among
hospital-acquired infections (HAI) than community-acquired infections (CAI) in
China
Figure 4 ICU patients have the highest resistance rates in selected drug-bug
pairs, followed by non-ICU inpatients and outpatients, U.S. 1999-2002
Page 17
16
Table 1. Resistance prevalence of ten common bacteria to Ciprofloxacin in China, 1994-2000 unit: %
Rank Bacter. 1994 1995 1996 1997 1998 1999 2000 Average
Resistance*
Average
Growth Rate*
1 Escherichia coli
(ECO)
53 49 60 61 60 63 62 59 3
2 Pseudomonas
aeruginosa (PAE)
9 10 7 18 13 17 18 13 17
3 Klebsiella
pneumoniae (KPN)
2 4 7 8 14 17 18 10 40
4 Staphylococci
epidermidis (SEP)
22 33 34 35 41 40 46 36 9
MRSA** 47 65 74 88 83 78 76 76 7 5 Staphylococci
aureus (SAU) MSSA** 8 18 10 5 8 20 14 11 8
6 Enterococcus
faecalis (EFA)
25 34 28 34 32 45 45 34 9
7 Enterobacter cloacae
(ECL)
12 9 13 14 22 31 30 18 26
8 Acinetobacter
baumannii (ABA)
7 7 19 20 23 31 37 20 29
9 Citrobacter freundii
(CFR)
10 21 20 17 22 26 26 20 10
10 Proteus mirabilis
(PMI)
8 2 13 2 5 14 12 7 10
Mean 28 15
Median 20 10 * Based on three-year running averages.
** Staphylococci aureus (SAU) is further grouped as methicillin susceptible staphylococci aureus (MSSA) and methicillin resistant staphylococci aureus (MRSA).
Page 18
17
Table 2. Resistance patterns of the seven most common bacteria for Hospital-acquired Infections (HAI) and Community-acquired
Infections (CAI), China 2001 unit:%
SAU
(n=176)
SEP
(n=84)
ECO
(n=308)
ECL
(n=78)
PAE
(n=232)
KPN
(n=215)
ABA
(n=191) γ
Antibiotic(s) HAI
(37)
CAI
(139)
HAI
(14)
CAI
(70)
HAI
(44)
CAI
(264)
HAI
(27)
CAI
(51)
HAI
(95)
CAI
(137)
HAI
(48)
CAI
(167)
HAI
(46)
CAI
(145)
HAI
Hγ
CAI
Cγ
Methicillin 89 30 43 27 n/a n/a n/a n/a n/a n/a n/a n/a n/a n/a 11 5
Ampicillin 100 82 86 67 89 80 100 90 n/a n/a 54 66 n/a n/a 38 35
Amoxicillin 89 27 29 6 84 81 100 94 n/a n/a 90 95 48 50 38 31
Ceftizoxime 87 28 14 7 32 25 96 86 n/a n/a 33 26 96 92 24 16
Cefaclor 87 31 21 10 32 26 89 78 n/a n/a 33 25 65 57 23 15
Cefuroxime 89 29 22 4 32 25 74 47 n/a n/a 29 23 57 41 22 12
Cefprozil. 87 26 21 4 34 25 78 61 n/a n/a 33 23 94 86 24 15
Ceftazidime 92 37 50 13 5 7 59 28 11 14 21 4 30 15 19 8
Cefotaxime 84 28 21 6 0 7 44 26 41 26 4 5 28 16 15 8
Ceftriaxone 89 28 21 3 9 8 48 29 40 25 6 5 33 15 18 8
Imipenem 76 21 21 1 2 0 0 2 2 3 0 1 2 1 8 2
Meropenem 78 21 14 1 2 0 0 0 2 2 0 1 2 2 8 2
Ciprofloxacin 87 35 36 30 75 53 63 33 26 13 19 14 26 17 29 18
Ofloxacin 78 30 36 30 75 55 59 31 17 15 15 14 22 17 27 18
Levofloxacin 46 7 29 10 68 52 33 20 22 15 10 11 13 12 21 13
Sparfloxacin 89 39 50 40 75 56 63 33 43 31 25 16 15 14 32 21
Moxifloxacin 5 2 14 3 64 43 22 18 43 27 4 8 13 15 17 12
Gatifloxacin 30 1 14 4 36 25 7 6 23 17 6 6 15 14 13 7
Gentamicin 87 31 36 21 43 38 30 24 37 29 27 16 35 21 25 16
Mean
Resistance 77 28 30 15 42 34 54 39 26 18 23 20 35 28
Page 19
18
Table 3. Non-susceptibilities of Streptococcus pneumoniae (SPN) in U.S. communities, 1997-2002 Unit: %
Antibiotic 1997 1998 1999 2000 2001 2002 Average
Resistance Average
Growth Rate Penicillin 25 24 27 28 26 21 25 2
Cefotaxime 13 14 17 18 16 12 15 -1
Erythromycin 15 15 21 22 19 17 18 4
TMP/Sulfa 29 29 32 32 30 25 30 -3
Levofloxacin n/a 0.2 0.2 0.3 0.7 0.5 0.4 39
Vancomycin 0 0 0 0 0 0 18 8
Page 20
19
Table 4. Resistance prevalence for selected drug-bug pairs by patient type, U.S. 1999-2002 unit: %
Pair Bacterium (resistant to) ��drug ICU patients non-ICU inpatients Outpatients
A PAE ��Ciprofloxacin/ofloxacin 32 25 23
B PAE �Levofloxacin 37 28 25
C PAE ��Imipenem 18 12 9
D PAE ��Ceftazidime 13 8 5
E PAE ��Piperacillin 16 11 6
F SAU ��Methicillin 47 38 23
G Enterococcus spp ��Vancomycin 13 11 4
H ECO ��Cef3* 1 1 0
I ECO ��Quinolone** 5 4 2
J KPN ��Cef3 6 5 2
K Enterobacter spp ��Cef3 26 21 10
L Enterobacter spp ��Carbapenum 1 1 1
M CNS ��Methicillin 75 63 46
N Pneumococcus ��Penicillin 18 17 17
O Pneumococcus ��Cef3 7 8 6
Mean 21 17 12 *Cef3 (3
rd generation cephalosporin) =ceftazidime, cefotaxime or ceftriaxone;
**Quinolone=ciprofloxacin, ofloxacin or levofloxacin.
Page 21
20
Table 5. Resistance prevalence of eight common bacteria, U.S. (all patients pooled), 1999-2002 unit: %
Bacterium Resistant to antibiotic(s) 1999
2000 2001 2002 Average
Resistance
Average
Growth Rate
PAE Ciprofloxacin/ofloxacin 23 25 28 29 26 8
Levofloxacin 29 30 31 30 30 1
Imipenem 12 12 15 13 13 4
Ceftazidime 8 8 9 9 9 4
Piperacillin 10 10 11 12 11 6
SAU (MRSA) Methicillin 32 35 38 39 36 7
Enterococcus spp Vancomycin 11 8 10 10 10 -1
ECO Cef3 1 1 1 1 1 0
Quinolone 2 3 4 5 4 36
KPN Cef3 4 4 4 5 4 8
Enterobacter spp Cef3 19 19 18 19 19 0
Carbapenum 1 1 1 1 1 0
CNS Methicillin 60 61 62 63 62 2
Pneumococcus spp Penicillin 14 16 19 19 17 11
Cef3 5 8 7 7 7 16
Mean: 17 7
Page 22
21
Table 6. Resistance trend in isolates of Salmonella spp. over 5 years in Kuwait
Antibiotic
Percentage (%) of resistant isolates in:
______________________________________________________________________
1999 2000 2001 2002 2003
(n=216) (n=215) (n=129) (n=167) (n=165)
Amikacin
Ampicillin
Amoxicillin-clavulanate
Cefotaxime
Ceftriaxone
Cefuroxime
Cephalexin
Chloramphenicol
Ciprofloxacin
TMP/SMX
Gentamicin
Imipenem
Meropenem
Piperacillin
Piperacillin/tazobactam
0 0 0 0 0
6 12 7 25 26
5 10 7 2 0
0 1 0 1 0
0 1 0 2 0
1 1 0 27 41
2 10 37 57 50
8 21 0 18 18
0 0 14 10 16
8 8 10 20 20
6 1 0 42 42
0 0 0 0 0
0 0 0 0 0
6 13 13 23 25
0 0 0 0 0
No ESBL-producing strain has been isolated so far
Page 23
22
Table 7. Resistance trend in isolates of Streptococcus pneumoniae over a 5-year period in Kuwait
Antibiotics
Percentage (%) of resistant isolates in:
_______________________________________________________________________
1999 2000 2001 2002 2003
(n=78) (n=61) (n=73) (n=66) (n=90)
Cefotaxime
Ceftriaxone
Cefuroxime
Cephalexin
Chloramphenicol
Erythromycin
Imipenem
Penicillin
Teicoplanin
Vancomycin
0 0 4 5 6
0 0 3 5 4
0 0 8 9 41
0 0 NT NT NT
3 5 25 5 0
16 20 23 26 30
0 0 0 0 0
32 38 46 52 54
0 0 0 0 0
0 0 0 0 0
NT= not tested
Page 24
23
Table 8. Percentage of Enterococcus species resistant to often-tested antibiotics over 5 years in Kuwait
Antibiotic
Percentage (%) of resistant isolates in:
_______________________________________________________________________
1999 2000 2001 2002 2003
(n=370) (n=335) (n=322) (n=248) (n=212)
Ampicillin
Erythromycin
Gentamicin
Nitrofurantoin
Norfloxacin
Penicillin
Teicoplanin
Vancomycin
1 1 3 2 0
59 78 77 75 92
26 36 61 52 98
2 2 2 36 86
36 47 47 NT NT
16 38 35 53 85
0 0 0 1 0
1 0 0 2 0
NT = not tested
Page 25
24
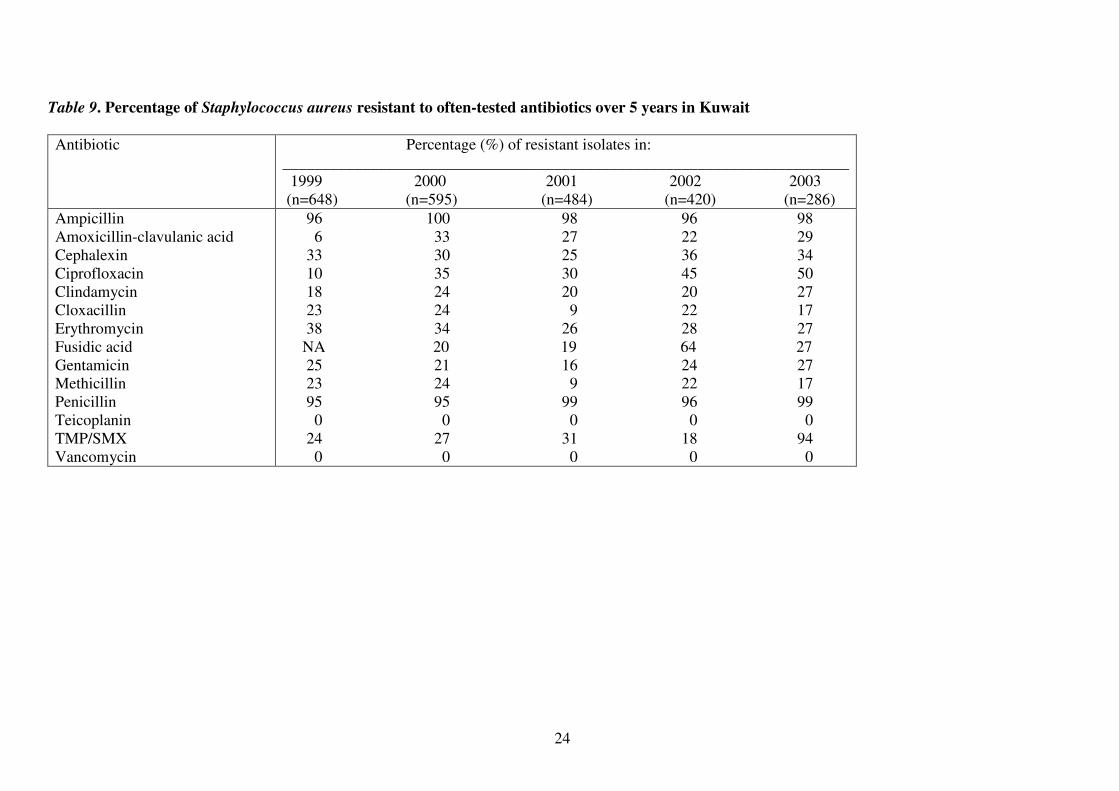
Table 9. Percentage of Staphylococcus aureus resistant to often-tested antibiotics over 5 years in Kuwait
Antibiotic Percentage (%) of resistant isolates in:
_______________________________________________________________________
1999 2000 2001 2002 2003
(n=648) (n=595) (n=484) (n=420) (n=286)
Ampicillin
Amoxicillin-clavulanic acid
Cephalexin
Ciprofloxacin
Clindamycin
Cloxacillin
Erythromycin
Fusidic acid
Gentamicin
Methicillin
Penicillin
Teicoplanin
TMP/SMX
Vancomycin
96 100 98 96 98
6 33 27 22 29
33 30 25 36 34
10 35 30 45 50
18 24 20 20 27
23 24 9 22 17
38 34 26 28 27
NA 20 19 64 27
25 21 16 24 27
23 24 9 22 17
95 95 99 96 99
0 0 0 0 0
24 27 31 18 94
0 0 0 0 0
Page 26
25
Table 10. Average Resistance Levels of Major Bacteria in Kuwait, 1999-2003 unit: %
ECO KPN PAE SPN Shigella
spp.
Salmonella
spp.
Enterococcus
spp. SAU
Average
Resistance
Average
Growth
Average
Annual
Resistance
13 8 5 31 45 65 37 8 27 17
Page 27
26
Table 11. Resistance rates in China, U.S. and Kuwait, hospital surveillance data for 2001 From Tables 1,2,3,8 and 9; Unit: %
Bacterium(a) Antibiotic(s) Pair China
U.S. Kuwait
SAU Methicillin A 37 38 9
Erythromycin B 73 19 23 SPN
Cefotaxime C 0 16 4
Enterococcus spp Vancomycin D 4 10 0
Ceftazidime E 9 1* 5
Cefotaxime F 18 1* 1
Ceftriaxone G 21 1* 1 ECO
Ciprofloxacin/
Ofloxacin H 56 3 26
Ceftazidime I 17 9 27
PAE Ciprofloxacin/
Ofloxacin J 27 28 31
Ceftazidime K 9 4* 14
Cefotaxime L 17 4* 13
Ceftriaxone M 20 4* 13
KPN
Ciprofloxacin N 18 12**[27]
18
Amoxicillin-clavulanate O 10 4 7
Ceftriaxone P 5 1 0
Ciprofloxacin Q 0 0.4 10
TMP/SMX*** R 0 3 0
Salmonella spp
Gentamicin S 10 2 0
Amoxicillin-clavulanate T 35 2 20
Ceftriaxone U 6 0 0
Ciprofloxacin V 6 0 0
TMP/SMX W 0 53 0
Shigella spp
Gentamicin X 18 0.2 0
Average 17 7 9 * The original U.S. NNIS reported resistance rates to either one of the Cef3 drugs, i.e. ceftazidime, cefotaxime or ceftriaxone. We assume the same rates for each drug.
** Based on surveillance of ICU patients
*** TMP/SMX = Trimethoprim/Sulfamethoxazole
Page 28
27
Table 12. MRSA, PRSP & VRE in Selected Countries Unit: %
MRSA (HAI only) PRSP VRE
China 89 (2001) 27 (2001) 0 (2001)
U.S. 16 (2001) 26 (2001) 0.3 (1989), 8 (1993), 12.8
(2001) in ICU
Kuwait 9 (2001) 46 (2001) 0 (2001)
Japan [33] 60-80% (1999) 11-40 (1999) n/a
Taiwan [34] n/a 69 (2000) 2 (2000)
Page 29
28
Table 13. Ranks of resistance rates in China, U.S. and Kuwait, 2001
(Rank correlations at bottom of table)
Bacterium(a) Antibiotic(s) China
U.S. Kuwait
SAU Methicillin 3 2 11
Erythromycin 1 4 4 SPN
Cefotaxime 21 5 14
Enterococcus
spp Vancomycin 20 7 17
Ceftazidime 15 17 13
Cefotaxime 8 18 15
Ceftriaxone 6 19 16 ECO
Ciprofloxacin/
Ofloxacin 2 13 3
Ceftazidime 11 8 2
PAE Ciprofloxacin/
Ofloxacin 5 3 1
Ceftazidime 16 9 7
Cefotaxime 12 10 8
Ceftriaxone 7 11 9 KPN
Ciprofloxacin 9 6 6
Amoxicillin-
clavulanate 13 12 12
Ceftriaxone 19 20 18
Ciprofloxacin 22 21 10
TMP/SMX 23 14 19
Salmonella
spp
Gentamicin 14 15 20
Amoxicillin-
clavulanate 4 16 5
Ceftriaxone 17 23 21
Ciprofloxacin 18 24 22
TMP/SMX 24 1 23
Shigella spp
Gentamicin 10 22 24
Correlation Coefficients CHN_US:
0.18
US_KW:
0.46
CHN_KW:
0.60
Page 30
0
20000
40000
60000
80000
100000
120000
1994 1995 1996 1997 1998 1999 2000 2001 2002 2003 2004
0
5000
10000
15000
20000
25000
30000
35000
Thousands persons Thousands persons
Arrivals of
foreigners to China
(left axis)
Departures of Chinese
residents to overseas
(right axis)
Source: CEIC Data Inc Figure 1
Page 31
0
5
10
15
20
25
30
35
40
Am
picill
in
Am
oxici
llin
Spar
floxa
cin
Cip
roflo
xaci
n
Oflo
xaci
n
Gen
tam
icin
Cef
tizoxi
me
Cef
prozil.
Cef
aclo
r
Cef
uroxi
me
Levoflo
xaci
n
Cef
tazidim
e
Cef
tria
xone
Moxi
floxa
cin
Cef
otaxi
me
Gat
ifloxa
cin
Met
hicill
in
Imip
enem
Mer
openem
HAI CAI
unit: %
Figure 2
Page 32
0
10
20
30
40
50
60
70
80
90
SAU ECL ECO ABA SEP PAE KPN
HAI CAI
unit: %
Figure 3
Page 33
0
10
20
30
40
50
60
70
80
ICU
non-ICU
Outpatients
unit: %
Figure 4