J. Fluid Mech. (2005), vol. 538, pp. 399–428. c 2005 Cambridge University Press doi:10.1017/S0022112005005537 Printed in the United Kingdom 399 Granular collapse in two dimensions By N. J. BALMFORTH 1 AND R. R. KERSWELL 2 1 Departments of Mathematics and Earth and Ocean Science, UBC, Vancouver 2 Department of Mathematics, University of Bristol, UK (Received 22 November 2004 and in revised form 8 March 2005) An experimental investigation is conducted into the collapse of granular columns inside rectangular channels. The final shape is documented for slumps inside relatively wide channels, and for collapses inside much narrower slots. In both cases, the collapse is initiated by withdrawing a swinging gate or sliding door, and the flow remains fairly two-dimensional. Four different granular media are used; the properties of the materials vary significantly, notably in their angles of friction for basal sliding and internal deformation. If H is the initial height of the column, h ∞ the maximum final height of the column and a the initial aspect ratio, then the data suggest that H/h ∞ ∼ a 0.6 in wide channels and H/h ∞ ∼ a 0.5 for narrow slots. For the runout, we find that (l ∞ − L)/L ∼ a 0.9±0.1 for wide channels, and (l ∞ − L)/L ∼ a 0.65±0.05 or l ∞ /L ∼ a 0.55±0.05 for narrow slots, where l ∞ is the maximum runout of the material and L the initial length of the column along the channel (a := H/L). In all cases, the numerical constant of proportionality in these scaling relations shows clear material dependence. In wide slots, there is no obvious universal scaling behaviour of the final profile, but such a behaviour is evident in narrow slots. The experimental results are compared with theoretical results based on a shallow granular-flow model. The qualitative behaviour of the slump in the wide slot is reproduced by the theoretical model. However, there is qualitative disagreement between theory and the experiments in the narrow slot because of the occurrence of secondary surface avalanching. 1. Introduction The collapse and slump of a granular medium play a key role in a variety of physical settings in engineering and geophysics. Indeed, it is hard to overstate the significance in many costly industrial processes and environmental hazards. Yet, despite the importance, our understanding of the simplest kinds of granular flow remains incomplete. From the theoretical perspective, this is largely due to the lack of an acceptable continuum model for a granular material under the relevant physical conditions. However, until fairly recently it has also been the case that there have been relatively few experiments conducted to observe the slump of a suddenly released granular pile on a horizontal surface. For these reasons, we explore one of the simplest kinds of flow configuration in this kind of medium: the granular ‘dam-break’ problem. This configuration has deve- loped into a classical problem in fluid mechanics owing to its intrinsic interest, repro- ducibility in the laboratory and, at least in the two-dimensional case, accessibility on the theoretical side (e.g. Whitham 1974). The purpose of the current paper and a com- panion paper (Kerswell 2005) is to follow a parallel path for the granular dam breaks; we perform some experiments and compare the results with a simple theoretical
doi:10.1017/S0022112005005537 Printed in the United Kingdom
399
Granular collapse in two dimensions
By N. J. BALMFORTH1 AND R. R. KERSWELL2
1Departments of Mathematics and Earth and Ocean Science, UBC, Vancouver2Department of Mathematics, University of Bristol, UK
(Received 22 November 2004 and in revised form 8 March 2005)
An experimental investigation is conducted into the collapse of granular columnsinside rectangular channels. The final shape is documented for slumps inside relativelywide channels, and for collapses inside much narrower slots. In both cases, the collapseis initiated by withdrawing a swinging gate or sliding door, and the flow remainsfairly two-dimensional. Four different granular media are used; the properties of thematerials vary significantly, notably in their angles of friction for basal sliding andinternal deformation. If H is the initial height of the column, h∞ the maximum finalheight of the column and a the initial aspect ratio, then the data suggest that H/h∞ ∼a0.6 in wide channels and H/h∞ ∼ a0.5 for narrow slots. For the runout, we find that(l∞ − L)/L ∼ a0.9±0.1 for wide channels, and (l∞ − L)/L ∼ a0.65±0.05 or l∞/L ∼ a0.55±0.05
for narrow slots, where l∞ is the maximum runout of the material and L the initiallength of the column along the channel (a := H/L). In all cases, the numerical constantof proportionality in these scaling relations shows clear material dependence. In wideslots, there is no obvious universal scaling behaviour of the final profile, but sucha behaviour is evident in narrow slots. The experimental results are compared withtheoretical results based on a shallow granular-flow model. The qualitative behaviourof the slump in the wide slot is reproduced by the theoretical model. However, thereis qualitative disagreement between theory and the experiments in the narrow slotbecause of the occurrence of secondary surface avalanching.
1. IntroductionThe collapse and slump of a granular medium play a key role in a variety of
physical settings in engineering and geophysics. Indeed, it is hard to overstate thesignificance in many costly industrial processes and environmental hazards. Yet,despite the importance, our understanding of the simplest kinds of granular flowremains incomplete. From the theoretical perspective, this is largely due to thelack of an acceptable continuum model for a granular material under the relevantphysical conditions. However, until fairly recently it has also been the case that therehave been relatively few experiments conducted to observe the slump of a suddenlyreleased granular pile on a horizontal surface.
For these reasons, we explore one of the simplest kinds of flow configuration inthis kind of medium: the granular ‘dam-break’ problem. This configuration has deve-loped into a classical problem in fluid mechanics owing to its intrinsic interest, repro-ducibility in the laboratory and, at least in the two-dimensional case, accessibility onthe theoretical side (e.g. Whitham 1974). The purpose of the current paper and a com-panion paper (Kerswell 2005) is to follow a parallel path for the granular dam breaks;we perform some experiments and compare the results with a simple theoretical
400 N. J. Balmforth and R. R. Kerswell
model. The current article focuses on the laboratory experiments and comparison;Kerswell (2005) describes in more detail the solution of the theoretical model.
Previous experimental work on related problems includes the releases of cylindricalpiles by Lajeunesse, Mangeney-Castelnau & Vilotte (2004) and Lube et al. (2004).Neither work attempts a detailed comparison with a theoretical model. Instead, theyopt for qualitative discussion of the observed dynamics and the construction of scalinglaws for how the final shape depends on the initial height of the cylindrical column.Despite the complicated flow dynamics, both groups report simple scaling laws forthe final maximum height and radius of the deposit. The question of whether suchlaws carry over in some straightfoward fashion to planar slumps in channels has alsomotivated the current work. In fact, we report some similar findings. A comparisonof these existing experimental results with the axisymmetric version of the theory isgiven by Kerswell (2005).
The theoretical model we use treats the granular medium as a two-dimensionalshallow fluid layer that slides over the plane beneath with relatively little internalshear. Basal friction then plays a key role in the dynamics. The model has much incommon with that proposed by Savage & Hutter (1989 and elaborated on further bySavage & Hutter 1991; Hutter & Koch 1991; Hutter et al. 1995; Pouliquen & Forterre2002), who explored the acceleration of granular layers on inclined surfaces, and hasthe same philosophical foundation as the St Venant model of fluid mechanics. The StVenant model is derived adopting a crude closure for the stresses in a turbulent watercourse, and has a mainly empirical justification. By contrast, the granular model usedhere can be formally derived by asymptotic means from the governing equations if themedium is assumed to be a fluid with a certain constitutive law for the internal stressesand sliding law at its base (we give this derivation in Appendix A). Unfortunately, thiscannot be taken as a formal justification of the model because the original governingequations are in question in this instance. Nevertheless, we regard the derivation asa useful addition to the literature since it offers a means to generalize the theory todifferent physical situations (such as a sliding mass in a narrow slot, as describedin Appendix B), connects the model with related theories used elsewhere (as in iceflow dynamics and viscoplastic fluid mechanics), and allows us to assess the physicalconditions under which the model should remain valid (see Appendix A).
Experiments on approximately two-dimensional slumps have also been performedby Siavoshi & Kudrolli (2005), Lube et al. (2005) and Lajeunesse, Monnier & Homsy(2005), and further theoretical discussion has been offered by Staron & Hinch (2005)and Larrieu, Staron & Hinch (2005). Siavoshi & Kudrolli (2005) make a careful studyof magnetically released granular steps over rough surfaces, thereby eliminating anyinfluence of the detailed initiation of the slump. They focus on relatively shallow initialsteps and present results on the internal dynamics, making a comparison with thephenomenological ‘BCRE’ model (Bouchaud et al. 1994) which crudely accounts for asuperficial layer of avalanching grains. Our own experiments span a much wider rangeof the initial aspect ratio (height of the column divided by initial length along thechannel), and we observe fast sliding granular gravity currents when the initial columnis relatively high. These currents look plausibly as if largely plug-like flows, and sowe have elected to compare the experiments with a shallow-fluid model of a slidinggranular mass. Larrieu et al. (2005) expand further on such a description, althoughit is clearly limited for lower initial aspect ratios where superficial flow is certainlypresent. A rather different, but complementary, approach is taken by Staron & Hinch(2005) who evolve slumps via particle mechanics, assuming frictional rigid collisionsbetween grains.
Granular collapse in two dimensions 401
L
(a)
Lifting gate
(b)
(Other dimension: width, W )
Granular medium
L
H H
Swinging gate
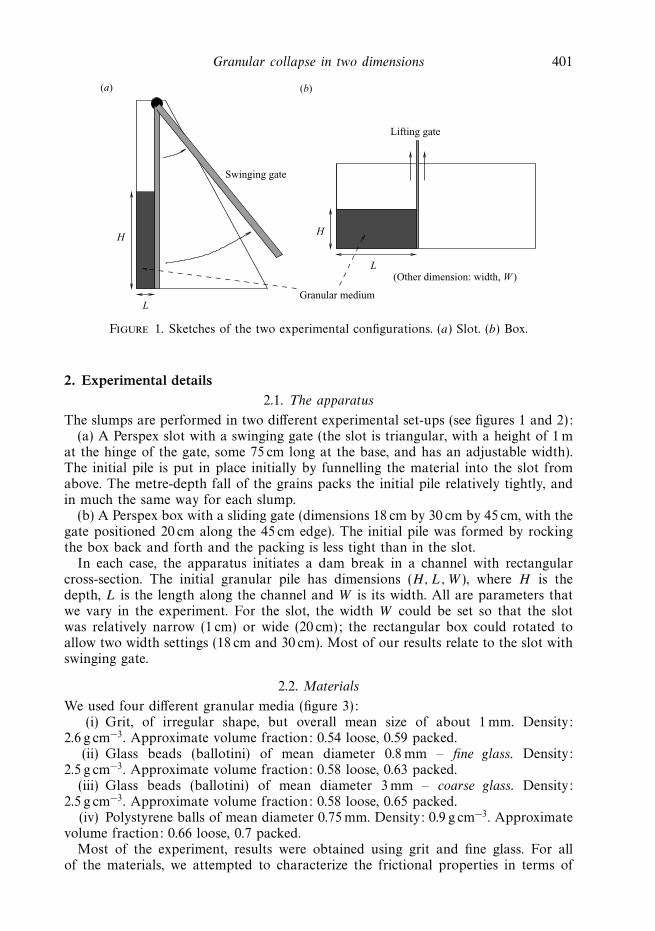
Figure 1. Sketches of the two experimental configurations. (a) Slot. (b) Box.
2. Experimental details2.1. The apparatus
The slumps are performed in two different experimental set-ups (see figures 1 and 2):(a) A Perspex slot with a swinging gate (the slot is triangular, with a height of 1 m
at the hinge of the gate, some 75 cm long at the base, and has an adjustable width).The initial pile is put in place initially by funnelling the material into the slot fromabove. The metre-depth fall of the grains packs the initial pile relatively tightly, andin much the same way for each slump.
(b) A Perspex box with a sliding gate (dimensions 18 cm by 30 cm by 45 cm, with thegate positioned 20 cm along the 45 cm edge). The initial pile was formed by rockingthe box back and forth and the packing is less tight than in the slot.
In each case, the apparatus initiates a dam break in a channel with rectangularcross-section. The initial granular pile has dimensions (H, L, W ), where H is thedepth, L is the length along the channel and W is its width. All are parameters thatwe vary in the experiment. For the slot, the width W could be set so that the slotwas relatively narrow (1 cm) or wide (20 cm); the rectangular box could rotated toallow two width settings (18 cm and 30 cm). Most of our results relate to the slot withswinging gate.
2.2. Materials
We used four different granular media (figure 3):(i) Grit, of irregular shape, but overall mean size of about 1 mm. Density:
2.6 g cm−3. Approximate volume fraction: 0.54 loose, 0.59 packed.(ii) Glass beads (ballotini) of mean diameter 0.8 mm – fine glass. Density:
2.5 g cm−3. Approximate volume fraction: 0.58 loose, 0.63 packed.(iii) Glass beads (ballotini) of mean diameter 3 mm – coarse glass. Density:
2.5 g cm−3. Approximate volume fraction: 0.58 loose, 0.65 packed.(iv) Polystyrene balls of mean diameter 0.75 mm. Density: 0.9 g cm−3. Approximate
volume fraction: 0.66 loose, 0.7 packed.Most of the experiment, results were obtained using grit and fine glass. For all
of the materials, we attempted to characterize the frictional properties in terms of
402 N. J. Balmforth and R. R. Kerswell
(a)
(b)
(c)
(d)
(e)
( f )
Figure 2. Photographs of collapses of columns of grit. Slumps in the wide slot (W =20 cm):(a) ‘fractured’ slump with L =6 cm and H = 4 cm. (b) L = 6 cm and H =10 cm. (c) L = 5 andH =24 cm. (d) Relatively rapid collapse with L = 2 cm and H = 30 cm. Each image is 2/25 sapart. Note that the line of sight of the camera is slightly inclined so that the brightly lit topsurface of the deposit is also visible (and illustrates how the slump is largely two-dimensional).(e) Slump in the narrow slot: L = 4 cm, H = 40 cm and W = 1 cm. Each image is 4/25 s apart,save for the last three, which are separated by 8/25 s (and in which the majority of motion isin the form of an avalanching superficial flow). The grid shows squares of length 5 cm drawnon the outside of the slot which assist the measurement of depth (performed directly throughthe sidewall). (f ) Slump in the box: two images, before and after, with L =20 cm, H =10 cmand W = 18 cm. Again, the inclined camera illustrates the two-dimensionality of the deposit.
Granular collapse in two dimensions 403
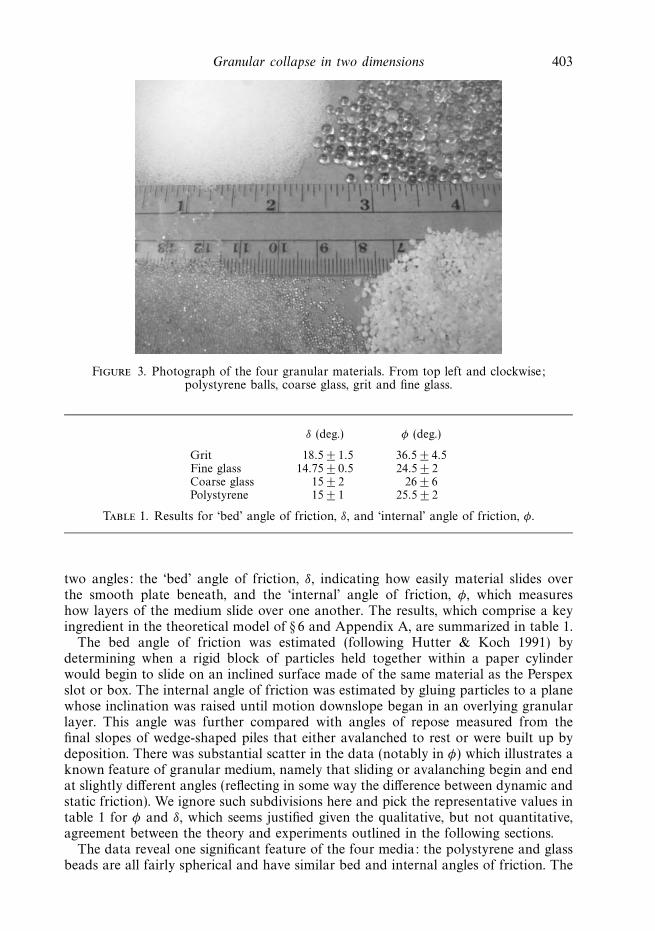
Figure 3. Photograph of the four granular materials. From top left and clockwise;polystyrene balls, coarse glass, grit and fine glass.
Table 1. Results for ‘bed’ angle of friction, δ, and ‘internal’ angle of friction, φ.
two angles: the ‘bed’ angle of friction, δ, indicating how easily material slides overthe smooth plate beneath, and the ‘internal’ angle of friction, φ, which measureshow layers of the medium slide over one another. The results, which comprise a keyingredient in the theoretical model of § 6 and Appendix A, are summarized in table 1.
The bed angle of friction was estimated (following Hutter & Koch 1991) bydetermining when a rigid block of particles held together within a paper cylinderwould begin to slide on an inclined surface made of the same material as the Perspexslot or box. The internal angle of friction was estimated by gluing particles to a planewhose inclination was raised until motion downslope began in an overlying granularlayer. This angle was further compared with angles of repose measured from thefinal slopes of wedge-shaped piles that either avalanched to rest or were built up bydeposition. There was substantial scatter in the data (notably in φ) which illustrates aknown feature of granular medium, namely that sliding or avalanching begin and endat slightly different angles (reflecting in some way the difference between dynamic andstatic friction). We ignore such subdivisions here and pick the representative values intable 1 for φ and δ, which seems justified given the qualitative, but not quantitative,agreement between the theory and experiments outlined in the following sections.
The data reveal one significant feature of the four media: the polystyrene and glassbeads are all fairly spherical and have similar bed and internal angles of friction. The
404 N. J. Balmforth and R. R. Kerswell
grit, on the other hand, is composed of angular rough particles and the correspondingfriction angles are significantly higher.
Finally, we note that the slumps were performed in an air-conditioned laboratorymaintained at 21 ◦C with humidity controlled at 46%. The granular materials werekept dry in this environment; moistening the materials or the sides of the channeleven a small amount leads to markedly different results.
3. Phenomenology of the collapseThe phenomenology of the slumping process depends strongly on the initial aspect
ratio a (a := H/L; see figure 1) of the column, as found for axisymmetric collapsesby Lajeunesse et al. (2004) and Lube et al. (2004), and in the particle mechanicscomputations of Staron & Hinch (2005). There is a gradual transition from relativelyslow fracturing avalanches of shallow columns to violent cascading collapses of tallcolumns (see figure 2). The shallowest initial piles develop fracture planes along whichmaterial slides down, and below which grains barely participate in the collapse, if atall (see the first row of images in figure 2). This flow structure was evident in videoimages taken through the sidewalls, and is explored in more detail in the experimentsof Siavoshi & Kudrolli (2005). As the aspect ratio of the initial pile increases, less ofthe material resides in place, and eventually the whole pile participates in the collapse(second and subsequent experiments in figure 2). When a becomes large, the initialphases of collapse become fast, with the entire column appearing to expand sidewayswhilst collapsing downwards ballistically. On impacting the base and re-compacting,the material forms a denser mass that adjusts more slowly into a final equilibriumshape near the end of the slot. Simultaneously, a sliding current forms at the nose ofthe deposit that determines the run-out.
We use the final slumped profiles of the deposits as the main descriptor of thecollapse. In all the geometries, variations in the direction across the channel were rela-tively slight (e.g. see figure 1). Thus, the deposit could be characterized by thethickness or depth h as a function of distance x down the slot. Before describingthe experimental results in detail, we first compare the final profiles of a number ofequivalent collapses to judge the reproducibility of the experiments (figure 4). Thecomparisons show profiles in the swinging slot; the profiles from the box were typicallymore reproducible (compared to the wide slot), at least for the initial configurationswe used. In certain of the comparisons shown in figure 4, exactly the same materialwas tested in sequential experiments. In other cases, different batches of material wereused at different points during the entire experimental sequence.
The final shapes are fairly reproducible, but not perfectly so. Some of the disagree-ment arises because the experiments did not have exactly the same amount of material(it is difficult to fill the slot with exactly the same amount of material because theparticles can be packed differently, the gate does not fit exactly back in the same posi-tion after each release and the Perspex walls can deform outwards slightly). However,in the wider slot, there was also some effect of differences in the gate release, espe-cially for the lighter particles (with the polystyrene balls, a vortex in the air trailingthe gate can interact with the particles), and because the slump was not perfectlytwo-dimensional. To try to eliminate the peculiarities of particular releases, whenwe present data in the following sections, we combine multiple final profiles intoaverages whenever available. For the slumps in the wider slot, we also attemptedto minimize any three-dimensional effects by combining measurements from bothwalls. Nevertheless, the comparisons in figure 4 illustrate one important aspect of the
Granular collapse in two dimensions 405
0 5 10 15 20 25 30 35 40 45
2
4
6
8
10
x (cm)
h (c
m)
L = 4 cm, H = 30 cm
L = 4 cm, H = 15 cm
L = 2 cm, H = 25 cm
0 10 20 30 40 50
2
4
6
8(b)
10 20 30 400
5
10
15h
(cm
)(a)
20 400
10
20
l∞
h∞
(c)
Figure 4. Reproducibility of the final profiles. (a) Grit, L = 4 cm, narrow: four sets of experi-mental slumps in the narrow slot with H = 50 cm (2 slumps), H = 30 cm (3 slumps), H = 10 cm(2 slumps) and H = 7.5 cm (3 slumps). (b) Grit: four sets of slumps in the wide slot withH = 40 cm (4 slumps), H = 30 cm (4 slumps), H =20 cm (4 slumps) and H = 10 cm (4 slumps).(c) Fine glass: three sets of slumps with H = 30 cm (narrow slot, 3 slumps), H = 15 cm (narrowslot, 2 slumps) and H = 25 cm (wide slot, 2 slumps).
experiments: errors in measuring the final depths were insignificant in comparisonto the variations in profile between experiments. Consequently, because we did notperform a large number of experiments for each initial configuration, it is difficult toassess the overall errors which originate mainly from those variations. A conservativeestimate of the error in depth is up to half a centimetre, whereas the correspondingerror in horizontal length at fixed depth could be up to a couple of centimetresbecause of the tapering of the final deposit.
Figure 4(a) also illustrates the measurement of the final maximum height, h∞ (whichis invariably at the wall), and the maximum runout, l∞, both of which we use later asconvenient characterizations of the deposits. While the final maximum height of thedeposit is clearly defined, the final runout is much more ambiguous. This is becausethe layer tapers to depths comparable to the particle diameter at its nose and a smallnumber of particles actually become detached from the main deposit and scatteredfurther ahead. The maximum range reached by these detached granules was veryvariable, whereas the range of the contiguous deposit was much more reproducible.Given this and the fact that the experiments were motivated by a desire to assessthe continuum-like properties of the granular material, we took the runout to be therange of the contiguous deposit where the height had decreased below 2 mm. Thiswas essentially two particle diameters for the materials (grit and fine glass) used tocompile the runout data and hence seemed a reasonable point at which to assumethe granules were no longer moving in contact with each other.
406 N. J. Balmforth and R. R. Kerswell
0 0.1 0.2 0.3 0.4 0.5 0.6 0.7
10
20
30
40
50
Time (s)
Runout: H = 25 cm
Runout: H = 50 cm
Height: H = 25 cm
Height: H = 50 cm
Figure 5. Time series showing the instantaneous maximum heights and runouts for twoslumps of the grit in the wide slot with L = 2 cm (H = 25 cm and 50 cm). The dotted lines showthe ballistic curve, H − gt2/2.
Although we focus attention on the final profile as the descriptor of the collapse,figure 5 shows the dynamic evolution of h∞ and l∞ as a function of t for the grit in thewide slot. Two experiments are shown; the initial ballistic collapse is evident in thisdata, as is the more gradual deceleration. A more complete discussion of the evolu-tionary dynamics for fractured slumps is offered by Siavoshi & Kudrolli (2005).Collapses in the narrow slot show similar behaviour, although the ballistic fallappears to be distinctly delayed beyond the initial release of the gate, and the finaladjustment to the ultimate deposit is noticeably different. More specifically, the widerslumps come to rest only when the sliding current at the nose of the deposit finallybrakes to a halt. On the other hand, when the narrow slumps come to rest at the nose,material further back up the slot continues to adjust by the continual avalanching ofsuperficial layers that decrease the surface slope until an equilibrium is reached.
4. Wide collapses4.1. Taller initial piles
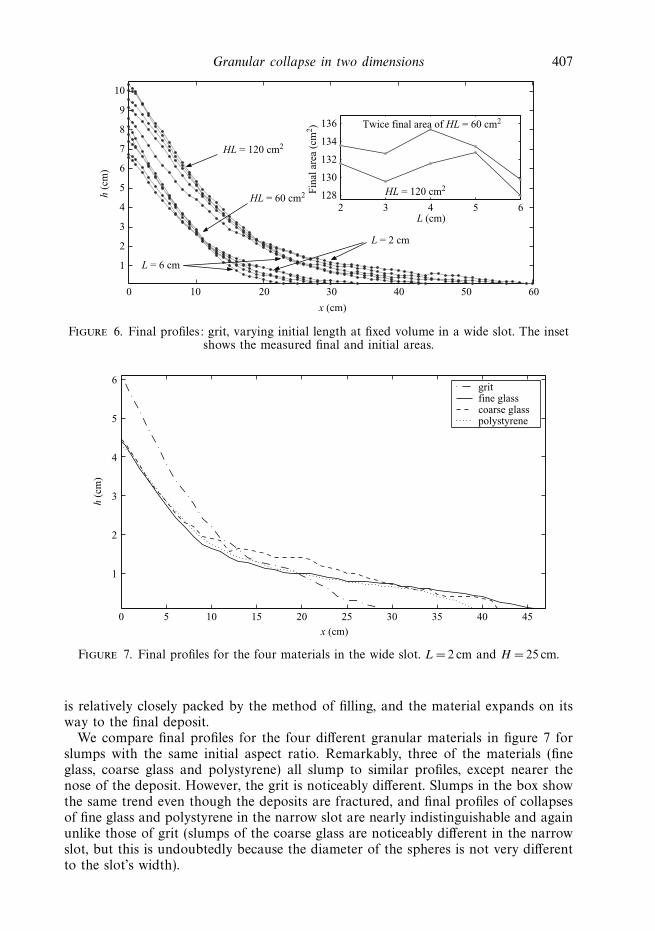
Experiments varying the initial length L and height H such that the overall volumeof the initial column remained fixed are shown in figure 6 for the grit in the wideslot. The variance in the final shape illustrates how the slumped deposit is influencedby the initial aspect ratio in this geometry: the higher and narrower initial columnsspread further and fall lower. A comparison of the initial and final areas indicatesthat there is also a change in packing: the initial area is systematically smaller thanthe final area (by what appears to be as much as 10% on occasions).† This change inpacking is typical of slumps in the slot, and presumably reflects how the initial pile
† Note that the final depths and areas displayed in the figures are slightly overestimated: theslumps are not perfectly two-dimensional, and the final deposit is invariably slightly depressed inthe middle of the channel compared to the walls, especially for the wide slot. Because measurementswere taken directly through the sidewalls, the actual depths and areas, averaged across the slot, aretherefore a little lower than those recorded.
Granular collapse in two dimensions 407
0 10 20 30 40 50 60
1
2
3
4
5
6
7
8
9
10
x (cm)
h (c
m)
L = 6 cm
L = 2 cm
HL = 60 cm2
HL = 120 cm2
2 3 4 5 6128
130
132
134
136
L (cm)
Fin
al a
rea
(cm
2 ) Twice final area of HL = 60 cm2
HL = 120 cm2
Figure 6. Final profiles: grit, varying initial length at fixed volume in a wide slot. The insetshows the measured final and initial areas.
0 5 10 15 20 25 30 35 40 45
1
2
3
4
5
6
x (cm)
h (c
m)
gritfine glasscoarse glasspolystyrene
Figure 7. Final profiles for the four materials in the wide slot. L = 2 cm and H = 25 cm.
is relatively closely packed by the method of filling, and the material expands on itsway to the final deposit.
We compare final profiles for the four different granular materials in figure 7 forslumps with the same initial aspect ratio. Remarkably, three of the materials (fineglass, coarse glass and polystyrene) all slump to similar profiles, except nearer thenose of the deposit. However, the grit is noticeably different. Slumps in the box showthe same trend even though the deposits are fractured, and final profiles of collapsesof fine glass and polystyrene in the narrow slot are nearly indistinguishable and againunlike those of grit (slumps of the coarse glass are noticeably different in the narrowslot, but this is undoubtedly because the diameter of the spheres is not very differentto the slot’s width).
408 N. J. Balmforth and R. R. Kerswell
0 10 20 30 40 50 60
2
4
6
8
(a)
0 20 40 60
50
100
150
H (cm)
Are
a (c
m2 )
x (cm)
h (c
m)
0 1 2 3 4 5 6 7
0.2
0.4
0.6
0.8
1.0(b) 36.5°
18.5°
0 0.5
0.8
0.9
1.0
x/h∞
h/h ∞
Figure 8. Final profiles for grit in the wide slot. (a) The ‘raw’ measurements of depth againstdistance from the end of the slot. The inset panel shows the recorded initial (�) and final (�)areas of the piles. (b) The profiles after lengths have been scaled by the maximum height ofthe final deposit (h∞). The inset shows a magnification near the end of the slot.
0 10 20 30 40 50 60 70
1
2
3
4
5
x (cm)
h (c
m)
(a)
10 20 30 40
20
40
60
80
H (cm)
Are
a (c
m2 )
0 2 4 6 8 10 12
0.2
0.4
0.6
0.8
1.0
x/h∞
h/h ∞
24.5°14.75°
0 0.5 1.00.7
0.8
0.9
1.0(b)
Figure 9. Similar to figure 8, but showing final profiles for fine glass in the wide slot.
A glance at the physical properties listed in § 2 indicates that, although the densitiesand particle diameters are quite different, the fine glass, coarse glass and polystyreneall have similar angles of friction; the corresponding angles for grit are distinctlyhigher. We conclude that friction plays a key role in determining the precise finalshape of the deposit, which disagrees with the claims of Lube et al. (2004), butagrees with the results of Lajeunesse et al. (2004). The polystyrene balls also interactelectrostatically with the Perspex walls of the slot: a small number of individual grainsremain sticking to the walls of the channel above the main deposit at the end of thecollapse. Nevertheless, the deposit remains fairly two-dimensional, and the slump asa whole appears to continue regardless of the additional electrostatic interaction withthe walls. However, the polystyrene data were not used to extract scaling behaviour.
Figures 8 and 9 show a compendium of profiles from a series of experiments inwhich the initial length L of the pile was fixed, and the initial height H graduallyincreased. Although it does not seem possible to scale the profiles in such a way tocollapse them all completely onto a common curve, there is some suggestion that a
Granular collapse in two dimensions 409
0.5 1 2 3 4 5 6 8 10 20 30 40 50
1
2
3
4
5
6
7
89
10
a
H/h
∞
Figure 10. The initial to final height ratio H/h∞ plotted against a for grit (�, L > 2; �,L = 2) and fine glass (+, all with L = 2 cm) in the wide slot. The dotted lines represent best fitsthrough the data with gradients of 0.58 (grit) and 0.60 (fine glass).
scaling by the final, maximum height (i.e. h∞) leads to a fairly compact descriptionof the deposit. The rescaled profiles also indicate that the final deposits tend todecline from their maximum at the wall with nearly the same slope, and this slopeis invariably the steepest over the whole deposit. The angle of the maximum slopelies between the internal and bed angles of friction, suggesting it is determined by acombination of both. Such combinations are, in fact, expected on theoretical grounds(§ 6). For grit, the maximum angle is about 23◦, and for the fine glass it is about 18◦.
Figure 10 illustrates our efforts to fit the ratio of initial to final heights, H/h∞, bya simple power law in initial aspect ratio, a:
H
h∞∼ λaα, (4.1)
where α ≈ 0.6 for a � 2. Although the best-fit power-laws in figure 10 for grit and fineglass do not coincide, they do seem to have the same exponent α. In other words,the numerical coefficient λ is a function, λ(δ, φ), of the material properties, but theexponent α is not. This result again contradicts the conclusions of Lube et al. (2004)who claim to see no such dependence. However, they used materials with similarinternal angles of friction (and presumably also basal friction angles) whereas wehave considered materials with very different frictional properties. Indeed, had weadded data for coarse glass and polystyrene to the figure, they would have overlainpoints for fine glass.
Figure 10 also hints that the sand data depend on more than just the aspect ratioa: the results for L =2 behave slightly differently to the rest (L > 2). This is moreapparent in a plot of the scaled runout measured from the gate, (l∞ − L)/L, against
410 N. J. Balmforth and R. R. Kerswell
1 2 3 4 5 6 8 10 15 20 30 40 502
3
4
5
678
10
15
20
30
40
50
a
(l∞
– L
)/L
Figure 11. The scaled runout from the gate (l∞ − L)/L plotted against a for grit (�, L > 2;�, L = 2) and fine glass (+, all with L = 2 cm) in the wide slot. The dotted lines represent bestfits through the data with gradients of 0.88 (grit L =2 and L > 2) and 0.92 (fine glass). Thedashed lines are guide lines with gradients of 0.8 and 1 to indicate that the gradient of thedata is approximately 0.9 ± 0.1.
a (see figure 11). The data is not so clean here and
(l∞ − L)
L∼ λaα, (4.2)
where α = 0.9 with an error of ±0.1. Again the numerical coefficient is materialdependent, λ= λ(δ, φ), but there is also a noticeable dependence on L, or rather onthe second length scale ratio, b := W/L, in the problem after a := H/L.
4.2. Fractured profiles
Smaller initial columns develop a slip surface along which the medium initially frac-tures. This leaves a portion of the mass near the wall that does not move in theslump (these are the leftmost data points in figure 10). In figure 12, we show resultsfor grit dam breaks in the box with lifting gate; the geometry of the box ensuresfractured deposits in these experiments. The profiles can be scaled to remove muchof the difference between the individual slumps by using the initial height to scaledepths, and the final runout measured from the original position of the gate (xg), toscale horizontal lengths, i.e. by plotting h/h∞ against (x − xg)/(l∞ − xg). This scalingis suggested by the theoretical results of § 6, and indicates that the fractured depositshave a nearly universal shape. Indeed, by performing the same reduction on the datafrom experiments in the wide slot (figure 13), we recover practically the same curve.Because the initial placement in the box is much looser than in the slot, the agreementfurther suggests that the initial packing does not play a significant role in determiningthe final shape, unlike in the experiments by Daerr & Douady (1999). What differences
Granular collapse in two dimensions 411
10 15 20 25 30 35 400
2
4
6
8
10
12
x (cm)
h (c
m)
Gate
36.5°
18.5°
–0.5 0 0.5 1.00
0.2
0.4
0.6
0.8
1.0
(x – 20)/(l∞ – 20)
h/H
Figure 12. Final profiles of slumps of grit in the box (with W = 18 cm). The inset shows theresults when the profiles are scaled such that depths are normalized by the initial height andhorizontal lengths so that the runout from the gate is unity.
2 4 6 8 10 12 14 16 18 200
1
2
3
4
5
6
7
8
x (cm)
h (c
m)
Gate
36.5°
18.5°
–0.5 0 0.5 1.00
0.2
0.4
0.6
0.8
1.0
(x – 6)/(l∞ – 6)
h/H
Figure 13. Final profiles of slumps of grit in the wide slot; similar plot to figure 12.
remain between the insets of figures 12 and 13 might be attributable to initial packingeffects, but could also reflect the influence of the channel width (b = W/L),
5. Collapses in the narrow slotExperiments varying the initial length L and height H , but fixing the volume of
the initial column are shown in figures 14 and 15. The final deposit has a shape thatis roughly independent of the initial aspect ratio, except near the nose of the depositwhere depth systematically decreases as L increases. We interpret this to indicate thatthe higher thinner initial columns gained more kinetic energy as they fell, thus running
412 N. J. Balmforth and R. R. Kerswell
0 5 10 15 20 25 30 35
1
2
3
4
5
6
7
8
9
10
11
24.5°
x (cm)
h (c
m)
L = 6 cmL = 2 cm
2 3 4 5 6
132
134
136
L (cm)
Fin
al a
rea
(cm
2 ) Twice final area of HL = 60 cm2
HL = 120 cm2
HL = 120 cm2
HL = 60 cm2
Figure 14. Final profiles: fine glass beads, varying initial length at fixed volume ina narrow slot (1 cm).
0 5 10 15 20 25 30
2
4
6
8
10
12
36.5°
x (cm)
h (c
m)
L = 6 cmL = 2 cm
HL = 60 cm2
HL = 120 cm2
2 3 4 5 6
130
135
140
145
L (cm)
Fin
al a
rea
(cm
2 ) Twice final area of HL = 60 cm2
HL = 120 cm2
Figure 15. Final profiles: grit, varying initial length at fixed volume in a narrow slot (1 cm).
out further and becoming less packed at their noses. The reduction in packing is alsoseen in the comparison of final areas.
A compendium of profiles for fine glass and grit with fixed initial length L andincreasing initial height H is shown in figures 16 and 17. Once these profiles arescaled by final maximum height, h∞, all the profiles collapse fairly well onto a singlecurve, suggesting that there is an underlying universal profile characterizing thesecollapses. As also illustrated in the figures, the slopes near the end of the slot nowmatch closely with the internal angle of friction: the bed angle seems to characterizelittle of the final deposit. Given that sidewall friction (which is measured by the basalfriction angle δ since the wall and base are both Perspex) ought now to be a dominantinfluence, this is surprising. We return to the issue in § 6 after an evaluation of thetheoretical model.
Granular collapse in two dimensions 413
0 10 20 30 40 50
5
10
15
20
25
x (cm)
h (c
m)
(a)
0 0.5 1.0 1.5 2.0
0.1
0.2
0.3
0.4
0.5
0.6
0.7
0.8
0.9
1.0
x/h∞
h/h ∞
(b)
36.5°18.5°
0 50 100
100
200
300
400
H (cm)A
rea
(cm
2 )
Figure 16. Final profiles for grit in the narrow slot. (a) The raw data, and (b) the data withlength scaled by h∞. The inset in (a) compares the initial (�) and final (�) areas. The extralines in (b) illustrate the internal and bed friction angles.
0 1 2 3
0.1
0.2
0.3
0.4
0.5
0.6
0.7
0.8
0.9
1.0
x/h∞
h/h ∞
(b)
24.5°14.75°
10 20 30 40 50 600
4
8
12
16
x (cm)
h (c
m)
(a)
0 50 100
100
200
300
400
H (cm)
Are
a (c
m2 )
Figure 17. Final profiles for fine glass in the narrow slot; similar plottingscheme to figure 16.
Figure 18 indicates that the initial to final height ratio H/h∞ is well fitted by thepower law,
H
h∞∼ λa0.5. (5.1)
As in the wide slot (see figure 10), the best fits for grit and fine glass have the sameexponent, but a material-dependent numerical pre-factor. Also as before, the runoutdata ((l∞ − L)/L plotted against a in figure 19) is less clean. Adopting a power-lawrelationship,
(l∞ − L)
L∼ λaα, (5.2)
implies α = 0.65 ± 0.05, with a material-dependent numerical coefficient. Given thesuccess of renormalizing the final profiles with the final height (see figures 16 and 17),l∞/L was also plotted against a (not shown). The plot looks very similar to figure 19,but now the best fits have exponents much closer to the scaling exponent for H/h∞.
414 N. J. Balmforth and R. R. Kerswell
0.5 1 2 3 4 5 6 8 10 20 30 40
1
2
3
4
5
6
a
H/h
∞
Figure 18. The initial to final height ratio H/h∞ plotted against a for grit (�) and fine glass(+) in the narrow slot. The dotted lines are fits through the data with gradients of 0.5.
3 4 5 6 8 10 15 20 303
4
5
6
7
8
9
10
12
15
20
a
(l∞
– L
)/L
Figure 19. The scaled runout from the gate (l∞ − L)/L plotted against a for grit (�) andfine glass (+) in the narrow slot. The dotted lines represent best fits through the data withgradients of 0.67 (sand) and 0.62 (fine glass). The dashed lines are guide lines with gradientsof 0.6 and 0.7 to indicate that the gradient of the data is approximately 0.65 ± 0.05.
Granular collapse in two dimensions 415
Specifically, we find the best fit power laws,
l∞
L∼ λa0.55±0.05. (5.3)
Hence, h∞l∞/(HL) has, at best, a very weak dependence on a which is consistent withfigures 16 and 17.
6. Comparison with a simple theory6.1. A two-dimensional model
We now compare the experimental results with a simple theory idealizing the granularmaterial as a shallow fluid layer in which frictional sliding along the base provides akey resistance to flow. Some details of how such a model can be derived asymptoticallyfrom the governing fluid equations with a suitable constitutive law for the internaland frictional stresses are given in the Appendix. We arrive at a model that is similarto that proposed by Savage & Hutter (1989).
The model can be conveniently written in terms of the fluid depth, h(x, t), andhorizontal speed, u(x, t), and takes the form,
ht + (hu)x = 0 (6.1)
and
ut + uux = −g sgn(u) tan δ − gKhx, (6.2)
where the fluid density is ρ, g is gravity, and, as above, δ is the bed angle of friction.Also, K is a constant coefficient whose value depends on the basal and internal anglesof friction and whether the flow is converging or diverging (active or passive; seeAppendix). In the Appendix, we derive the expression
K = Kg =1 − σ sinφ
1 + σ sinφ, (6.3)
where σ := sgn(ux) = ux/|ux |, based upon one particular choice of constitutive modelfor the granular medium. An alternative form is suggested by the Mohr–Coulombmodel of Savage & Hutter:
K = Ks =2
cos2 φ
(1 − σ
√1 − cos2 φ
cos2 δ
)− 1. (6.4)
Note that (6.4) can be reduced to (6.3) in the limit δ � 1, which is a key conditionunder which the model is derived in Appendix A.
The equations have a special ‘balanced’ equilibrium profile with a constant slope inwhich the bed friction exactly counters the gravitational stress: tan δ = −Khx . Shouldthe inclination of the surface of a granular mass be larger than this slope, the fluidaccelerates; where the slope is less, the fluid speed decelerates. However, after a dambreak, the balanced profile is not the final realized deposit. Instead, the gravitationaldriving pushes material sideways, forcing the surface inclination to decline towards thecritical slope, but then inertia carries the material beyond that critical slope to formshallower deposits. The importance of inertia can therefore be judged by the departurefrom the balanced slope. This is likely to be most important at the leading edge of thedeposit, and least important near the back wall of the slot. However, a detailed under-standing of the final shape requires us to solve the model as an initial-value problem,starting at the instant of release and ending when the material finally comes to rest.
416 N. J. Balmforth and R. R. Kerswell
–1 –0.5 0 0.5 1.0 1.5 2.00
0.2
0.4
0.6
0.8
0.1
x
Figure 20. Theoretical slump with A = 1. The main panel shows snapshots of the collapsingthickness field, spaced by 0.2 time units. The points show the final profle.
Provided that u > 0 and ux remains one-signed, a scaling of lengths, speed and time(h = Hh, x = HKx cot δ, u = u
√gHK and t = t
√HK/g cot δ, plus dropping the hat
decoration after the rescaling) can be used to place (6.1)–(6.2) into the form,
ht + (hu)x = 0 (6.5)
and
ut + uux + hx = −1, (6.6)
with initial and boundary conditions,
h(x, 0) =
{1 −1/A � x � 0,
0 x > 0,u(0, t) = 0, (6.7)
where the slot occupies the region −1/A � x, the gate lies at x = 0 and
A :=aK
tan δ(6.8)
is the renormalized initial aspect ratio (the only remaining parameter). This systemcan be attacked effectively (and semi-analytically) using the method of characteristics;further details are provided by Kerswell (2005). The initial assumptions on u and ux
are realized in the solutions for all time (sgn(u) = sgn(ux) = +1), and so the calculationsare self-consistent, despite the discontinuous coefficients of the original equations.
Depending on the initial aspect ratio, two possible situations arise, as illustrated infigures 20 and 21. For both, the release of the pile spawns a characteristic from x = 0that propagates to the right and marks the leading edge of the fluid. The space–timecurve of this front is given by xf = t(2 − t/2). After a time t =2, the leading edgecomes to a stop at x = 2, at which point the slump as a whole is at rest. The initialrelease also spawns a more slowly moving, back-propagating characteristic whichcomes to rest before the leading edge. If the backwards characteristic does not reachthe end of the slot (x = −1/A), the deposit forms a fractured type of profile and themaximum final height remains equal to the initial height (figure 20). However, if thecharacteristic reaches the slot’s end, it reflects back from the rear wall at x = −1/A
and the entire layer participates in the slump (figure 21). The reflected characteristiceventually halts somewhere between the nose and the back wall, where it scars thefinal deposit with an abrupt change in surface slope.
Granular collapse in two dimensions 417
–0.2 0 0.2 0.4 0.60
0.2
0.4
0.6
0.8
1.0(a) (b)
x0 0.5 1.0 1.5 2.0
0
0.1
0.2
0.3
0.4
0.5
Figure 21. Theoretical slump with A = 5. Snapshots of the collapsing thickness field; in (a),the snapshots are 0.048 time units apart, and in (b), they are twice that. The points in (b) showthe final profle.
0 2 4 6 8 10 12 14
0.5
1.0
1.5
2.0
1 + Ax
Ah
(a)(a)
–0.5 0 0.5 1.0 1.5 2.00
0.2
0.4
0.6
0.8
0 1 2 3 4 5 6
0.1
0.2
0.3
0.4
0.5
0.6
0.7
0.8
0.9
1.0h/
h max
(1 + Ax)/Ahmax
(b)
slope –1
Figure 22. Final profiles of theoretical computations for various initial aspect ratios in casesin which the entire initial column slumped. A = 2, 3, 4, 5, 6, 7 and 8. The length and depths arerescaled to show the results in a similar fashion to the raw experimental data with fixed initiallength L, as figures 8(a) and 9(a). The inset shows the unscaled profiles. In (b), the lengths anddepths are scaled by the final maximum thickness, as in figure 8(b) and 9(b). In both panels,as aspect ratio decreases, the profiles extend further to the right.
Figure 22 shows a compendium of final profiles for varying initial aspect ratio,and figure 23 displays the evolution of maximum height and runout. Because of thescaling reducing (6.1)–(6.2) to (6.5)–(6.6), the initial column in the solutions has unitheight and the position along the slot has its origin at the gate. To present the resultsin a similar fashion to the experimental data, we rescale the profiles and shift x in fig-ure 22(a) (h → Ah and x → 1 + Ax; the inset shows the original solutions). Figure 22(b)shows how the profiles can then be scaled by the final maximum height, much as wedealt with the experimental data.
6.2. Comparison with the wide slot
The evolutionary trends displayed in figures 20 and 21 reproduce aspects of thebehaviour seen in the experiments in the wide slot and box (i.e. the fracturing of
418 N. J. Balmforth and R. R. Kerswell
0 0.5 1.0 1.5 2.00.2
0.4
0.6
0.8
1.0
Time, t
h(–A
–1,t)
(a)
0 1 2
0.5
1.0
1.5
2.0
Time, t
x max
(t)
(b)
Figure 23. Time series of (a) maximum height and (b) instantaneous runout for the computa-tions of figure 22. (A =2, 3, 4, 5, 6, 7 and 8, with the largest A slumping furthest.) In (b), allthe data collapse on to the curve x = xf (t) = t(2 − t/2).
lower initial piles or complete slumping of higher initial columns). The final profilesshown in figure 22 also compare well with the experimental results displayed infigures 8 and 9. This agreement is remarkable given that the theory is based on ashallow-layer expansion, yet the initial experimental columns are much taller thanthey are wide and far from a shallow limit (more possible errors are mentioned inAppendix A). In actual fact, there are quantitative disagreements between theory andexperiment that can be seen on a closer examination of the results.
From figure 22(b), we see that the slope at the end of the slot for completely slumpedcolumns approaches −1 when h and x are scaled by the final maximum height. Interms of the original variables of (6.1)–(6.2), that limiting value corresponds to anactual slope of K−1 tan δ. In other words, near the end of the channel, the final profileslimit to the ‘balanced equilibrium profile’ whose slope is determined by a combinationof both angles of friction. We may easily calculate the balanced angle given the datain table 1 for our granular media. According to (6.3), derived in the Appendix, thelimiting angle should be 52◦ for the grit and 32◦ for the fine glass (given that σ = +1).Alternatively, for the Savage–Hutter model, from (6.4), these two angles are predictedto be 36◦ and 24◦, respectively, and are close to the values expected for K =1 whichhas also been advocated in the past (e.g. Pouliquen & Forterre 2002). None of theseestimates compare well with the experimental observations, which lie somewherebetween the bed and internal angles of friction for both materials (and are about 23◦
and 18◦, respectively), although the values expected from the Savage–Hutter model arecertainly closer. However, in view of the crudeness of the theory, it seems unwarrantedto make a definite choice for this special angle, based on a particular theoretical model.
Instead, we opt for an empirical choice for K , or, equivalently, of K−1 tan δ.Unfortunately, even this choice is ambiguous since there are various ways to make theselection, and the different choices are not in agreement. The choices ultimately reflectdifferent dominating errors in the theory. For example, one obvious choice is givenby the limiting final slope at the end of the slot. In this case, the theoretical estimatesmay suffer because of a poor representation of the constitutive and sliding behaviourof the material, or because the shallow-layer approximation fails to represent thelimiting stress distributions of the final deposit sufficiently accurately (indeed, the‘small’ parameter ε, the aspect ratio, used in the reduction is not particularly small).
A second choice can be based on the aspect ratio that divides initial piles whichcompletely slump from those that fracture and H = h∞ (that is, the aspect ratiofor which the maximum final height is no longer the initial height). Theoretically,this happens for a specific choice of A, the rescaled aspect ratio. Experimentally,
Granular collapse in two dimensions 419
0.5 1 2 3 4 5 6 8 10 20 30 40
1
2
3
4
5
6
7
89
10
A
H/h
∞
Figure 24. The theoretical prediction for H/h∞ as a function of A (solid line; from Kerswell2005) in the wide slot plotted with grit data (�, L > 2; �, L =2) and fine glass data (+). Toobtain A from a for the data, the best choice for tan δ/K was made: tan 45◦ for grit andtan 35◦ for fine glass (these choices shift the data as a whole across the plot so they align atthe bifurcation point where H/h∞ leaves the value 1).
we measure the actual aspect ratio, a, for which this division occurs for each ofthe granular materials. By using (6.8), we then find that tan δ/K ≈ tan 45◦ for grit,whereas tan δ/K ≈ tan 35◦ for fine glass. These compare poorly with the previousestimates. The theoretical error, in this instance, surely lies in the fact that the initialphases of the collapse are governed by physics not captured in the shallow-layermodel (such as vertical acceleration) because the initial aspect ratio is not at all small(in fact it exceeds unity). At best, it is only after an initial transient that the theorycaptures the dynamics, and A should then be redefined in some manner to reflect theaspect ratio when the theory becomes valid (Larrieu et al. 2005, in fact, extend theshallow-layer model in such directions).
Guided by this, we use the second choice for K to compare the predicted finalheights and runouts with the experimental scaling laws uncovered earlier. In terms ofA, the model predicts the scaling laws,
H
h∞∼ Aα, (6.9)
where α ≈ 0.69 at A= 5 decreasing down to α ≈ 0.67 at A= 50 (and ultimately 2/3 asA → ∞), together with
(l∞ − L)
L= 2 A (6.10)
(see Kerswell 2005 for details). These results are compared with the experimentaldata in figures 24 and 25. Agreement for the initial and final height ratio is onlypartial because the data show a weaker dependence on a (H/h∞ ∼ a0.6 rather than
420 N. J. Balmforth and R. R. Kerswell
0.50.5
1 2 3 4 5 6 8 10 20 30 40
1
2
3
45
10
20
30
405060
A
(l∞
– L
)/L
Figure 25. The theoretical prediction, (l∞ −L)/L =2A, (solid line; from Kerswell 2005) in thewide slot plotted with grit data (�, L > 2; �, L = 2) and fine glass data (+). To be consistentwith figure 24, the same values for tan δ/K (tan 45◦ for grit and tan 35◦ for fine glass) wereused to convert the data over a to that over A.
H/h∞ ∼ a0.67). The runout comparison shown in figure 25 confirms that the modelperforms fairly well there too, but again the scaling exponent is not quite captured(data ∼ a0.9±0.1 rather than ∼ a).
Another useful measure of slumped fractured profiles is suggested by thecharacteristics solution. For a fractured deposit, the material falls at the gate to adepth, hf ≈ 0.4229H , and the slump propagates back a (scaled) distance, lf ≈ 0.7216.These predictions do not depend on the empirical choice of K and so offer anindependent test of the theory. Experimental measurements of depth at the gate (asseen in figures 12 and 13) suggest
hf
H=
0.44 − 0.50 grit, box,0.45 − 0.49 grit, wide slot,0.44 − 0.49 polystyrene, fine and coarse glass, box,0.40 − 0.43 fine glass, wide slot,
which are a little high, but not uncomfortably so. The theoretical ratio of lf to theforward runout from the gate (2 in scaled units) is 0.3608, which can also be comparedwith the data shown in figures 12 and 13. The experimental ratio is clearly much closerto 0.5. However, as remarked earlier, the runout is probably our worst experimentalmeasurement. Moreover, our actual measurement of the runout is based on wherethe medium has a finite thickness (of 2 mm or so), which clearly underestimates therunout, and so the experimental values of lf /(l∞ − L) should be larger than expectedtheoretically.
Although the comparison of the theoretical and experimental final profiles describedso far is not too discomforting, there are more significant disagreements in theevolutionary dynamics. First, the evolving profiles of figures 20 and 21 do not
Granular collapse in two dimensions 421
compare favourably with the more complicated shapes photographed in figure 2.Secondly, as seen in the time series of figure 23, when the entire pile slumps, the initialfall of material at the wall is always relatively sharp. By contrast, in the experimentswith higher initial columns, there is a clear ballistic behaviour at the outset (seefigure 5) and the collapse proceeds more smoothly. Much of these discrepancies couldagain result from the absence of vertical accelerations in the shallow-fluid model,although some of the other possible flaws in the theory mentioned in Appendix Amay contribute.
6.3. The narrow slot
When the granular medium slides in a slot, the walls introduce an additional sourceof friction. By proceeding as in Appendix B, we generalize the shallow-layer model(6.1)–(6.2) as follows:
ht + (hu)x = 0, (6.11a)
ut + uux = −g(1 + Λh) sgn(u) tan δ − gKhx, (6.11b)
where Λ is a friction coefficient which, for the particular constitutive law used, takesthe value,
Λ = [W (1 + σ sinφ)]−1 (6.12)
(cf. Hutter & Koch 1991). Evidently, the higher the deposit, the more contact withthe walls of the slot and the greater the friction.
Computations with the model in (6.11b) suggest a similar dynamics to that presentedabove without sidewalls. In particular, when the whole initial column slumps, the finalshape at the end of the slot approaches the balanced equilibrium profile, which isdictated by
Khx = −(1 + Λh) tan δ or h =1
Λ
[(1 + Λh0)e
−x(Λ/K) tan δ − 1]. (6.13)
At the wall, the balanced slope, −(1 + Λh0) tan δ/K, increases with depth, illustratingthe enhancement of surface slopes by sidewall friction.
At this stage, we observe a striking disagreement between experiment and thetheoretical prediction. In contrast to (6.13), the observed final profiles in the narrowslot show no significant dependence on height (e.g. see figures 16 and 17). At the heartof this discrepancy is the fact that the theoretical model is based on the assumptionsthat tan δ � 1 and |hx | � 1, but φ remains order one. The balanced profile, on the otherhand, predicts that hx ∼ − Λh tan δ for Λ 1. That is, the slope grows exponentiallyfor large sidewall friction, which ultimately will violate the condition, |hx | � 1. Indeed,the experiments show a slope of − tanφ near the end of the slot, which is of orderunity and therefore already out of the range of validity of the theory. To model theslump for O(1) surface slopes, we must return to a more general form of the fluidequations (see Appendix B). The solution of these ‘slot equations’ is out of the scopeof the present paper, and so we close the theoretical discussion by mentioning asimple fix for the theory when the surface slopes become too large.
A key feature of the sidewall friction is its dependence on ambient pressure: for anarrow slot with Coulomb-type slip conditions, the (x, z)-components of friction aregiven by
2
Wp tan δ
(u, w)√u2 + w2
, (6.14)
422 N. J. Balmforth and R. R. Kerswell
where w is the vertical velocity. In the fluid interior, these frictional terms maybecome sufficiently large to hold the material in place and prevent basal sliding, evenif the surface slopes are relatively steep. By contrast, since the pressure vanishes onthe surface, the superficial layers experience little sidewall friction. As a result, theirstability is determined by the angle of repose: should the inclination of the free surfaceexceed the internal angle of friction, the surface layers fail by avalanching over thelayers beneath to form a shallower deposit. This kind of failure produces a surface-confined current with a static interior, a flow configuration that cannot be capturedby the plug-like structure of velocity field in the thin-layer model. Furthermore, thisdynamics matches precisely the phenomenology of the narrow-gap experiments, wheresecondary surface avalanching was often seen.
Assuming that surface failure occurs whenever |hx | > tan φ, we arrive at a simpleprescription for limiting surface slopes:
hx = −min[K−1(1 + Λh) tan δ, tanφ]. (6.15)
This formula bridges between slopes at the angle of repose for deeper deposits,and slopes for thinner layers nearer the balanced profile expected for two-dimensional slumps. The cross-over between the two limits occurs for depths oforder [K tan(φ)/ tan(δ) − 1]/Λ. For our narrow slot, this depth is about a centimetrefor both grit and sand, and so most of the profile would fall along the angle of repose,as observed. Conservation of mass then leads to
l∞/L ≈√
2a/ tan φ ≈ H/h∞, (6.16)
which captures the observed final maximum height scaling and marginallyunderestimates the observed runout scaling.
7. DiscussionWe have performed two-dimensional dam-break experiments for granular materials
in a channel, characterizing the slumps largely by the final deposit. We have alsooffered a theoretical model that appears to capture several (but not all) aspects of thedynamics. As with axisymmetric collapses (Lajeunesse et al. 2004; Lube et al. 2004),there is some evidence that the final height and runout of the slumped deposit canbe represented by power-law dependences on the initial aspect ratio, a. The data areparticularly clean for the final height and argue for
H
h∞∼ a0.6 (wide slot),
H
h∞∼ a0.5 (narrow slot), (7.1)
whereas the runout data show more scatter and suggest that
l∞ − L
L∼ a0.9±0.1 (wide slot),
l∞ − L
L∼ a0.65±0.05 (narrow slot). (7.2)
Another characterization of the runout data in the narrow slot,
l∞
L∼ a0.55±0.05, (7.3)
backs up the finding that the narrow-slot final profile seems to display a universalshape (h∞l∞/HL is essentially independent of a). Surprisingly, the final heightexponents do not depend on the material used (this finding probably carries over tothe runout scalings, but the data are not good enough to support this conclusion).
Granular collapse in two dimensions 423
The numerical constants of proportionality, however, show clear material dependence.This corroborates the conclusion of Lajeunesse et al. (2004) and softens that of Lubeet al. (2004).
By way of comparison, the shallow-layer model used here predicts
H
h∞∼ a0.67,
l∞ − L
L∼ a (7.4)
for the wide-slot experiments. The narrow-slot version of the theory produces steepfinal deposits which we conclude undergo secondary avalanching until the slopecorresponds to the angle of repose. This predicts that
H
h∞∼ a0.5,
l∞
L∼ a0.5, (7.5)
which is in fair agreement with observations.The distinction between what constitutes a ‘wide’ or a ‘narrow’ slot requires some
discussion. For axisymmetric releases, there are only three, dimensional quantitieswhich enter the problem (ignoring the internal properties of the granular materialsuch as the particle diameter†): the height H and radius R of the initial cylinder andg, the acceleration due to gravity. Once the problem has been non-dimensionalizedby choosing a length and time scale, this leaves just one non-dimensional parameter,a := H/R the aspect ratio, upon which the solution can depend. As a result, thefinal height h∞, for example, can be written as h∞ = H f (a) for some unknownfunction, f (a). Lajeunesse et al. (2004) and Lube et al. (2004) suggest that f (a) is apower law, λaα . The channel problem studied in this paper, however, has an extralengthscale, the width W , and hence a second non-dimensional parameter, b := W/L,upon which the solution can depend. Following the same line of thinking, we canexpect h∞ = H f (a, b) where f is a new unknown function. The original motivationbehind our narrow- and wide-slot experiments was to examine the large and small b
behaviour of f with the idea of seeing if these limits also had a simple power-lawstructure. That is, whether
f (a, b) ≈{λ1a
α1 ; b → ∞; wide slot,λ2a
α2 ; b → 0; narrow slot,(7.6)
which is, indeed, suggested by our results. The scaling of the runouts are less impressivebut, in truth, it is unclear whether the problem lies with the actual data measurementsor in the power-law assumption. What undoubtedly emerges, however, is that slumpingexperiments in two-dimensional channels depend on the channel width. Assuming thatthe scaling exponents for the final height and runout are simple monotonic functionsof b, we can (minimally) expect the exponent of the power laws for H/h∞ and(l∞ − L)/L to vary across the ranges [0.5, 0.6] and [0.6, 1], respectively.
It is clear that there is much still to be learnt from this experimental set-up. Thefact that power laws can be used to describe the final deposit has been confirmedfor two-dimensional slumping. However, these laws are influenced by the presence ofsidewalls and depend (albeit only in the numerical coefficent of proportionality) onthe frictional properties of the granular material. The theoretical model also exhibitsscaling-law dependencies, but not quite those observed. Moreover, the model fails to
† Collapses of coarse glass beads, with diameters of about 3 mm, in the narrow slot, of width1 cm, give an example in which we do not seem able to ignore effects of particle size.
424 N. J. Balmforth and R. R. Kerswell
capture the initial collapse phase and cannot be compared in detail to the observedflow dynamics.
The work was performed at the Geophysical Fluid Dynamics Summer StudyProgram, 2002 and 2004, Woods Hole Oceanographic Institution, which is supportedby N. S. F. and O.N.R. We thank Jack Whitehead for space and equipment in hisLab, Keith Bradley for building the apparatus, and Karl Helfrich for allowing us tomake a mess on his laser table.
Appendix A. Shallow-fluid theoryConsider a two-dimensional incompressible fluid described by the momentum
equations,
ρ(ut + uux + wuz) = −px + ∂xτxx + ∂zτxz,
ρ(wt + uwx + wwz) = −pz − ρg + ∂xτxz + ∂zτzz,
}(A 1)
where τ is the deviatoric stress tensor, p the pressure, ρ the density, g the accelerationdue to gravity and (u, w) the velocity components in the (x, z) directions (subscriptsdenote partial derivatives, except in the case of the stress components). The surface,z = h(x, t), is stress free, whilst at the base z = 0, there is no normal flow, w = 0, andwe impose a Coulomb slip condition (e.g. Nedderman 1992),
τxz = −(τzz − p) tan δ sgn(u), (A 2)
provided the fluid is stressed sufficiently to slide. We adopt a Herschel–Bulkley-typeconstitutive model borrowed from viscoplastic fluid mechanics (e.g. Oldroyd 1947),
τjk = γ −1(τp + Cγ n)γjk if τ � τy,(A 3)
γjk = 0 if τ < τy,
where
γjk =∂uj
∂xk
+∂uk
∂xj
, τ =√
12
∑j,k
τjkτkj , γ =√
12
∑j,k
γjkγkj , (A 4)
n and C are constants, and τy is the yield stress. Notably, we allow the yield stressto depend on local pressure, τy = τy(p), but otherwise the yield condition is the usualvon Mises criterion†. Thus formulated, the model is a viscous generalization of aperfectly plastic Druckner–Prager material (e.g. Davis & Salvadurai 2002), and hascommon features to the rate-dependent plasticity models considered by Savage andothers (see Savage 1984). A particular, useful choice is τy = τ0 + p sinφ, where τ0 andφ are constants that are equivalent to the cohesion and internal angle of friction ofthe Mohr–Coulomb law (Nedderman 1992).
We remove dimensions as follows:
(x, z) =(x
ε, z
)H, t =
t
ε
√H
g, (u, w) = (u, εw)
√gH, (p, τjk) = (p, τjk)ρgH,
(A 5)
† In soil mechanics, the Mohr–Coulomb law with the Tresca yield condition is normally adopted.We choose a different formulation here, although in the shallow limit that we consider, both Trescaand von Mises reduce to the same yield condition. The constitutive model also makes contact withJenike’s materials with ‘conical yield functions’ (see Nedderman 1992).
Granular collapse in two dimensions 425
where the ratio of vertical and horizontal length scales, ε, is assumed small to reacha simplified shallow-layer theory. On dropping the tilde, the momentum equationsbecome
ut + uux + wuz = −px + ∂xτxx + ε−1∂zτxz,
ε2(wt + uwx + wwz) = −pz − 1 + ε∂xτxz + ∂zτzz.
}(A 6)
The dimensionless constitutive equation is:(τxx τxz
τxz τzz
)=
1
γ
(B +
γ n
Re
) (2ux ε−1uz + εwx
ε−1uz + εwx −2ux
), (A 7)
for τ � B , or γjk =0 otherwise, with
γ =√
4u2x + ε−2(uz + ε2wx)2, Re =
ρgH
C(ε√
g/H )n(A 8)
and
B(p) =τy(p)
ρgH→ τ0
ρgH+ p sinφ ≡ B0 + p sinφ. (A 9)
In the problem at hand, the fluid slips over the base at lower stresses than ityields internally (the base is smooth). However, the scaling leading to (A 6)–(A 9),if unchecked, implies that the shear stress, τxz, dominates, as is typical in thin-layertheories. The predominance of sliding can be built into the shallow-fluid model byrequiring the basal friction angle to be small: tan δ ∼ ε. The dimensionless version ofthe Coulomb sliding law (A 2) can then be written in the form,
τxz = −(τzz − p)tan δ
εsgn(u). (A 10)
Now we may take the shear stress to scale as O(ε) and set τxz → ετxz. In other words,the fluid slides so easily that the base provides little traction; the shear stress issignificantly reduced and the longitudinal stresses emerge in the dominant balance offorces:
ut + uux + wuz = −px + ∂xτxx + ∂zτxz, 0 = −pz − 1 + ∂zτzz, (A 11)
to leading order in ε, on which we impose the surface stress conditions,
p = τzz, and τxz = 2hxτxx on z = h(x, t). (A 12)
A further consequence is that the velocity field must become largely plug-like,u = u(x, t) + O(ε2), furnishing the constitutive law,
τxx =
(B +
|2ux |nRe
)σ, (A 13)
and yield condition, |ux | > 0, where σ = sgn(ux).The vertical momentum balance equation integrates to give
p − τzz = h − z, (A 14)
which leads to an implicit relation for the extensional stress from (A 13). Because ourmodel yield stress has a linear dependence on pressure, this equation may be solved:
τxx =σ
1 + σ sinφ
[B0 + (h − z) sinφ +
|2ux |nRe
]. (A 15)
426 N. J. Balmforth and R. R. Kerswell
The vertical integral of the horizontal momentum equation over the fluid depth,together with the boundary conditions, now gives
ut + uux = −hx +2
h∂x(hτxx) − tan δ
εsgn(u), (A 16)
where
τxx =1
h
∫ h
0
τxx dz → σ
1 + σ sinφ
[B0 + 1
2h sinφ +
|2ux |nRe
]. (A 17)
Finally, the integral of continuity and the kinematic surface condition provide themass conservation relation, ht +(hu)x =0, and we arrive at a model comprised of twopartial differential equations dictating h(x, t) and u(x, t). For constant yield stress,B = B0, this reduced model is the inertial sliding generalization of the lubricationtheories of Liu & Mei (1989) and Balmforth & Craster (1999) used to describemud and lava flow. Without inertia and any yield stress, the model corresponds toMacAyeal’s (1987) ice-stream model with a particular sliding law.
On setting B0 = 0 and taking the limit Re → ∞, we emerge with
ut + uux = −(
1 − σ sinφ
1 + σ sinφ
)hx − tan δ
εsgn(u), (A 18)
which is considered more fully in the main text, where we also return to the originaldimensional variables. Thus stated, the reduced system corresponds to the Savage–Hutter model, but with a slightly simpler ‘active–passive earth-pressure coefficient’(the coefficient of hx in the first term on the right-hand side of (A 18); the Savage–Hutter version is quoted in (6.4) of the main text). In fact, with δ � 1, the Savage–Hutter coefficient reduces precisely to that contained in (A 18), reflecting a commonlimit in the yield conditions of the two theories. We could argue that the Savage–Hutter coefficient, being derived using Mohr stress circles for non-shallow layers, ispotentially more accurate than that in (A 18) (and corresponds precisely to, somewhatarbitrarily, replacing the coefficient of hx in (A 18) by that expected for the equilibriumof a wedge-shaped pile). Though appealing, the actual accuracy of this ‘improvement’is not clear.
In summary, although we began with a different constitutive model for the granularfluid than those normally considered, we have reduced the governing equations toa Savage–Hutter-type model. Moreover, we performed the reduction asymptotically,which highlights that the theory should be accurate, provided ε � 1 and the bedbe relatively slippery, δ � φ. Unfortunately, neither condition is well satisfied inthe experiments, and so cannot expect the theory to be particularly accurate, evenif the constitutive behaviour were well represented by (A 4)–(A 4). When ε is notsmall, the model is likely to represent the stresses, and therefore the final shape of thedeposit, inaccurately. If δ is not much smaller than φ, there is no reason to expecta sliding plug-flow, and internal failure could even occur, allowing avalanching ofsuperficial layers, as observed.
Appendix B. Sliding in a narrow slotWhen the granular fluid slides within a narrow slot (with cross-slot coordinate, y),
we incorporate the additional friction from the sidewalls, located at y = ±W/2, using
Granular collapse in two dimensions 427
the same Coulomb law. The momentum equations take the dimensionless form,
which can be found on scaling (x, z) and (u, w) by the vertical lengthscale H andvelocity scale U =
√gH , y by the slot width, W , and the cross-slot velocity, v, by �U ,
where � := W/H . Pressure and deviatoric stress components have the scale ρgH ,except for τxz and τyz, which receive an additional factor of � (warranting theiracquisition of a hat). The Coulomb slip conditions on the sidewalls are
(τxy, τyz) = ±(p − τyy)�−1 tan δ
(u, w)√u2 + w2
at y = ± 12, (B 2)
which force us to assume that tan δ is now of order �. So far, the procedure is muchas before, and the main result is that p − τyy is independent of y in the limit � → 0.
In fact, the constitutive law is more demanding: Because γxy = �vx + �−1uy andγxy = �vz + �−1wy , in terms of the unit U/H , the shear stresses across the slot (τxy
and τzy) can only be made of order � smaller than the remaining stress components(as demanded by the scaling above) if the flow down the slot is plug-like:
u = u(x, z, t) + O(�2), w = w(x, z, t) + O(�2).
Furthermore, the continuity equation, coupled with the impermeable condition of thesidewalls, then implies that ux + wz = O(�2) and v = O(�2), which leads us to takeτyy =O(�) and γ =
√4u2
x + (uz + wx)2 + O(�). A straightforward averaging acrossthe slot now leads to the dynamical equations for our granular ‘slot flow’:
Though we do not explore these equations here, we do mention that the opportunityfor the surface of a wedge-shaped deposit to fail by sliding in the direction parallel tothe surface can be extracted from them, provided the slope exceeds the internal angleof friction (as introduced to limit surface slopes in § 6.3).
When the flow in the slot is relatively shallow, we may approximate the slotequations still further. We introduce the further scalings x = x/ε, t = t/ε, w = εw,τxz = ετxz, and Υ = εΥ , then fix u = u(x, t)+O(ε2). To leading order in ε (and droppingthe tilde decoration), we then recover (A 11), but with an extra term, −Υp sgn(u), inthe horizontal momentum equation. After an integral over depth, we derive (A 16),but supplemented with the sidewall friction term, −(Υ/2)(h − 2τxx) sgn(u). As before,setting B0 = 0 and taking the limit Re → ∞, leads to (6.11b).
428 N. J. Balmforth and R. R. Kerswell
REFERENCES
Balmforth, N. J. & Craster, R. V. 1999 A consistent thin-layer theory for Bingham fluids.J. Non-Newtonian Fluid Mech. 84, 65–81.
Bouchaud, J.-P., Cates, M. E., Prakash, J. R. & Edwards, S. F. 1994 A model for the dynamicsof sandpile surfaces. J. Phys. I 4, 1383–1410.
Daerr, A. & Douady, S. 1999 Sensitivity of granular surface flows to preparation. Europhys. Lett.47, 324–330.
Davis, R. O. & Salvadurai, A. P. S. 2002 Plasticity and Geomechanics. Cambridge University Press.
Hutter, K. & Koch, T. 1991 Motion of a granular avalanche in an exponentially curved chute:experiments and theoretical predictions. Phil Trans. R. Soc. Lond. A 334, 91–138.
Hutter, K., Koch, T., Pluss, C. & Savage, S. B. 1995 The dynamics of avalanches from initiationto runout. Part II: Experiments. Acta Mech. 109, 127–165.
Lajeunesse, E., Mangeney-Castelnau, A. & Vilotte, J. P. 2004 Spreading of a granular mass ona horizontal plane. Phys. Fluids 16, 2371–2381.
Lajeunesse, E., Monnier, J. B. & Homsy, G. M. 2005 Granular slumping on a horizontal surface.Phys. Fluids (submitted).
Larrieu, E., Staron, L. & Hinch, E. J. 2005 Raining into shallow water as a description of thecollapse of a column of grains. J. Fluid Mech. (submitted).
Liu, F. K. & Mei, C. C. 1989 Slow spreading of Bingham fluid on an inclined plane. J. Fluid Mech.207, 505–529.
Lube, G., Huppert, H. E., Sparks, R. S. J. & Hallworth, M. A. 2004 Axisymmetric collapses ofgranular columns. J. Fluid Mech. 508, 175–199.
Lube, G., Huppert, H. E., Sparks, R. S. J. & Hallworth, M. A. 2005 Collapses of granularcolumns. Phys. Rev. E (submitted).
Kerswell, R. R. 2005 Dam break with Coulomb friction: a model for granular slumping? Phys.Fluids 17, 057101.
MacAyeal, D. R. 1987 Large-scale ice flow over a viscous basal sediment: theory and applicationsto ice stream B, Antarctica. J. Geophys. Res. 94, 4071–4087.
Nedderman, R. M. 1992 Static and Kinematics of Granular Materials. Cambridge University Press.
Oldroyd, J. G. 1947 A rational formulation of the equations of plastic flow for a Bingham solid.Proc. Camb. Phil. Soc. 43, 100–105.
Pouliquen, O. & Forterre, Y. 2002 Friction law for dense granular flows: application to themotion of a mass down a rough inclined plane. J. Fluid Mech. 453, 133–151.
Savage, S. B. 1984. The mechanics of rapid granular flows. Adv. Appl. Mech. 24, 289–366.
Savage, S. B. & Hutter, K. 1989. The motion of a finite mass of granular material down a roughincline. J. Fluid Mech. 199, 177–215.
Savage, S. B. & Hutter, K. 1991 The dynamics of avalanches from initiation to runout. Part I:Analysis. Acta Mech. 86, 201–223.
Siavoshi, S. & Kudrolli, A. 2005 Failure of a granular step. Phys. Rev. E 71, 051302.
Staron, L. & Hinch, E. J. 2005 Study of the collapse of granular columns using DEM numericalsimulation. J. Fluid Mech. (in press).
Whitham, G. B. 1974 Linear and Nonlinear Waves. Wiley.