Page 1
Greenwich Academic Literature Archive (GALA)– the University of Greenwich open access repository
http://gala.gre.ac.uk
__________________________________________________________________________________________
Citation for published version:
Botta, Alberto, Godin, Antoine and Missaglia, Marco Finance, foreign (direct) investment, and the Dutch disease: The case of Colombia. Economia Politica. ISSN 1120-2890 (Print), 1973-820X (Online) (In Press) (doi:10.1007/s40888-016-0030-6)
Publisher’s version available at:
http://dx.doi.org/10.1007/s40888-016-0030-6
__________________________________________________________________________________________
Please note that where the full text version provided on GALA is not the final published
version, the version made available will be the most up-to-date full-text (post-print) version as
provided by the author(s). Where possible, or if citing, it is recommended that the publisher’s
(definitive) version be consulted to ensure any subsequent changes to the text are noted.
Citation for this version held on GALA:
Botta, Alberto, Godin, Antoine and Missaglia, Marco () Finance, foreign (direct) investment, and the Dutch disease: The case of Colombia. London: Greenwich Academic Literature Archive.Available at: http://gala.gre.ac.uk/15546/
__________________________________________________________________________________________
Contact: [email protected]
Page 2
1
Finance, Foreign (Direct) Investment and Dutch Disease: the Case of
Colombia
Alberto Botta1, Antoine Godin2 and Marco Missaglia3
Acknowledgments
We thank Diego Guevara, Miguel Uribe, Stephen Kinsella for their valuable comments.
All errors remaining are ours. The authors gratefully acknowledge funding support of
the Institute for New Economic Thinking.
Abstract
In recent years Colombia has grown relatively rapidly, but it has been a biased growth.
The energy sector (the locomotora minero-energetica, to use the rhetorical expression of
President Juan Manuel Santos) grew much faster than the rest of the economy, while the
manufacturing sector registered a negative rate of growth. These are classic symptoms of
the well-known ‘Dutch disease’, but our purpose here is not to establish whether the
Dutch disease exists or not, but rather to shed some light on the financial viability of
several, simultaneous dynamics:
(i) the existence of a traditional Dutch Disease being due to a large increase in mining
exports and a significant exchange rate appreciation,
(ii) a massive increase in foreign direct investment (FDI), particularly in the mining
sector,
(iii) a rather passive monetary policy, aimed at increasing purchasing power via
exchange rate appreciation,
(iv) more recently, a large distribution of dividends from Colombia to the rest of the
world and the accumulation of mounting financial liabilities.
The paper will show that these dynamics constitute a potential danger for the stability of
the Colombian economy. Some policy recommendations are also discussed.
Keywords: Colombia; Dutch disease; balance of payments
Subject classification codes: F40, F21, F32
1 Greenwich Political Economy Research Center, Department of International Business and
Economics, Business School, University of Greenwich 2 Kingston University, [email protected]
3 Departamento de Desarrollo, Ambiente y Territorio, FLACSO (Facultad Latinoamericana de
Ciencias Sociales), Ecuador: [email protected]
Page 3
2
1. Colombia: a bonanza for international investors?
Since 2011, CIVETS has stood out as the new buzz word circulating among financial
operators and possibly as a form of dogma in the near future. In the jargon of financial
markets, this term is nothing but the acronym of six developing countries1 on which
international investors should speculate, in search of high (and safe?) returns.
Most observers believe that recent macroeconomic data fully confirm optimistic
perspectives on Colombia. In 2013, The Economist Intelligence Unit (EIU) portrayed
Colombia as a ‘ […] success story [which] is now one of the most open and most
business-friendly countries in Latin America [...and in which] new opportunities are
opening up for foreign investors, particularly in hydrocarbons and mining, construction,
and electricity, and there is free-trade access to the US market’ (2013, p. 8).
Park Madison Partners (PMP), a New York based business leader in the real
estate sector, acknowledges Colombian achievements as being due to “sound”
macroeconomic management of the economy. According to PMP, fiscal discipline and a
successful inflation-targeting monetary policy have contributed towards creating a
stable macroeconomic environment together with persistently positive growth rates,
even in the wake of the most recent worldwide financial crisis,2 see figure 1 (left-hand
side). PMP further notes that Colombian monetary authorities have wisely decided not
to obstruct any market-driven appreciation of the Colombian peso, in order to reassure
foreign investors regarding the political commitment to avoid market distortions and
policy-induced exchange rate risks.3 Thanks to such policies Colombia is now
characterized by ‘a vibrant and developing capital market [...and the above] attractive
fundamentals also create significant opportunities in the real estate (PMP, 2013, p. 12).’
The increasing net inflow of capital observed in the Balance of Payment (figure 1, right-
hand side) would seem to confirm Colombia’s bright future.
Page 4
3
Figure 1 ‐ Annual real GDP growth (left), Balance of Payments surplus (right). Source: DANE.
The above reports and recent analyses by the Colombian government4 create the
impression of a perfectly sound economy enjoying high and stable growth. In this paper,
we argue that this apparent situation has a much broader aspect and such seemingly
good performances hide more disturbing processes. On the one hand, past and
prospected macroeconomic records have largely depended on – and indeed will
continue to hinge upon – the increasing exploitation of Colombian natural resources, as
well as high commodity prices on international markets. On the other hand, and perhaps
more fundamentally, a dangerous process is currently unfolding within the Colombian
economy, i.e. a dependence on foreign capital inflow to support a surprisingly high
current account deficit.5 We believe these facts may pose serious challenges to
Colombian development in the near future.
International and domestic institutions have shared some of the above concerns.
OECD (2013), for instance, explicitly points out the relative, and at times absolute,
contraction of the non-resource-based tradable good sector with respect to the energy
and mining industry. In a working paper published by the Central Bank, Ojeda et al.
(2014) elaborate on a DSGE model to assess the effects of a natural resource boom in
the context of a three-sector small open economy. Both analyses share the description of
structural (sectorial) changes in the Colombian economy, which follow the lines of a
standard Dutch disease phenomenon. In a nutshell, the expansion of the energy sector
Page 5
4
and the ensuing foreign revenue windfall first raise domestic expenditures and lead to a
real exchange rate appreciation. This, in turn, makes domestic manufacture less
profitable and less attractive for investment, thus downsizing it. The two papers
conclude with similar policy implications. For example, they advise for counter-cyclical
fiscal policies in order to cut expenditures and soften real exchange rate appreciation.
The focus of this paper is different. We do not want to establish whether there is Dutch
disease in Columbia or not. Rather, we claim that, on top of the long-run dynamics
traditionally associated with a Dutch disease (i.e. de-industrialization, exchange rate
appreciation etc.), Colombia is experimenting unsustainable medium to long run
financial dynamics related to the Dutch disease impacts on the balance of payments. For
this reason, we will concentrate our analysis on the dynamics observed in the balance of
payments components, namely the trade balance, the net factor payments and the
Foreign Direct Investment (FDI) flows.
The astonishing expansion of the energy and mining industry in Colombia
mostly relies on FDI targeting the sector. The object of this paper is to check whether
such a boom might give rise to financial fragility (boom-and-bust cycles) and a
deterioration of growth prospects. The fundamental mechanics of what we are
suggesting are as follows. Mounting FDI inflow leads to net positive inflow of (foreign)
capital and, in a flexible exchange rate regime, to nominal (and real) appreciation of the
domestic currency. At first, such an appreciation jeopardizes Colombian manufacture’s
competitiveness and exports, thus inducing considerable manufactured goods trade
deficits and some de-industrialization.6 On top of this, the exchange rate nominal
appreciation attracts short-term portfolio investments, thus further appreciation, further
de-industrialization and mounting foreign debt. Eventually, the repatriation of profits
accruing to foreign investors in the energy sector (as well as the growing manufacturing
Page 6
5
trade deficit) leads to a deterioration in the current account such that the overall balance
of payments may turn negative. The ‘boom’ turns into a ‘bust’ and, without central
bank’s interventions, the exchange rate depreciates. Such medium run cyclical dynamics
may be detrimental to long-run growth because it is likely to reduce (both directly and
indirectly) the share of manufacture in total GDP and manufacturing constitutes, à la
Kaldor, the ultimate source of labor productivity growth and long-run development. Our
purpose, and let us assert this point, is thus to establish whether this Colombian pattern
of growth is macroeconomically viable and sustainable in the medium to long run.
Section 2 briefly outlines the abundant literature on Dutch disease, to make it
clearer what we are (and what we are not) discussing. Section 3 provides evidence
supporting the idea that Colombia is currently experiencing a de-industrialization
process. Section 4 continues the analysis by observing some interesting macroeconomic
features of the current Colombian pattern of growth. In particular, we look at changes in
the sectorial destination of Foreign Direct Investments and at the decoupling in the
dynamics of the current account and trade balance. Section 5 recapitulates our findings
and describes briefly the risks associated with such a pattern. To emphasize these risks
and make them more evident, we provide a scenario analysis, assessing the financial
stability of the processes currently unfolding in the Colombian economy. We conclude
discussing some policy options.
2. Dutch disease in a nutshell
Dutch disease is a well-known issue in the field of development economics. According
to the original contribution by Corden and Neary (1982), it refers to the structural
consequences of a change in the sectorial composition of an economy, i.e. the relative
and absolute reduction in the manufacturing sector’s participation to GDP, due to a
Page 7
6
boom in the use of domestic natural resources. The traditional literature on this topic
describes the Dutch disease as a real-side phenomenon, taking place through real-side
mechanisms. In particular, a shock such as a sudden technological innovation in the
energy sector,7 the discovery of new natural resource endowments, and/or rising
international prices of primary commodities, tends to raise domestic expenditures and
alter domestic relative prices against the non-traditional tradable sector. Such a real
exchange rate appreciation in turn reduces the viability and profitability of the
manufacturing sector. In a general equilibrium framework, while both the energy and
services sectors may expand, the manufacturing sector producing non-traditional
tradable goods will shrink.
While it is worth studying such structural changes on their own, they are even
more important if they entail consequences on the long-run growth potential of the
economy. Indeed, several studies interpret the Dutch disease as the main source of a
natural resource curse, i.e. the general disappointing economic performance of natural
resource-rich countries compared to natural resource-poor economies (see Sachs and
Warner, 1995, 2001). In this regard, the core point of the Dutch disease-natural resource
curse nexus lies in the growth-enhancing properties generally attributed to
manufacturing, with respect to the energy sector and services (see Sachs and Warner,
1995 and 1999; Ros, 2001; Ha-Joon Chang, 2010), so that the real wage, the profit rate
and labor productivity growth may be simultaneously higher in a sufficiently large
manufacturing-based economy with respect to countries specializing in non-
manufacturing and non-tradable sectors (Ros, 2001; Botta, 2010).8
Regardless of the specific mechanisms at work and their theoretical or empirical
character, all these analyses share the common aspect of being real side studies without
a well-defined macroeconomic framework based on national accounting. In a way, they
Page 8
7
follow the original contribution of Corden and Neary (1982, p.825) by ‘ignoring the
monetary implications’ of natural resource booms and the ensuing structural changes,
i.e. the effects such events may trigger on the external balance and financial solidity of
the economies under observation. Sachs and Warner (1995, 1999), for instance, assume
the current account of the balance of payments to be always in equilibrium thanks to
natural resource ‘manna’ counterbalancing trade deficits arising from increased imports
of tradable goods. Gylfason, Herbertsson, and Zoega (1999) assume an exogenous trade
surplus in order to meet interest payments on a given and constant stock of foreign debt.
When capital movements and financial transactions are considered (see Mansoorian,
1991), they are formalized in a perfect foresight infinite horizon framework, in which
international borrowing and accumulating foreign debt today are repaid through
expanding manufacturing productions, increasing domestic savings and rising current
account surpluses tomorrow.9 Accordingly, in these models, boom-and-bust cycles
linked to mounting foreign debts are ignored by assumption, even though they may
represent relevant ways in which natural resource booms may influence long-run
economic dynamics (Manzano and Rigobon, 2001).
Our contribution aims to fill this gap. In this sense, it draws illumination and
insight from two previous works by Dutt (1997) and Taylor (2004). Dutt (1997)
emphasizes that incoming FDI may induce detrimental effects on the catching up
process of developing economies, depending on the productive sector targeted by FDI.
Taylor (2004, chapter 12) describes the cyclical boom-and-bust dynamics, which are
possibly set in motion by temporary capital inflows in developing economies. Our paper
represents an attempt to put these two perspectives together in order to assess the
macroeconomic instability and external vulnerability possibly originating from the FDI-
induced Colombian Dutch disease.10
Page 9
8
3. Structural Change and Sectorial dynamics in Colombia
Colombia has already gone through various episodes of de-industrialization.11 On top of
the current sharp decline in manufacturing sector’ share in real value added, a similar
trend also emerged from 1990 to 1999. The Colombian de-industrialization episode of
the 1990s was most likely due to the radical switch in economic policy that Colombia
went through during that period. The reform process, centered on trade liberalization, is
deemed to have harshly hit Colombian industry, manufacturing in particular, which had
been traditionally supported by a protectionist trade regime (Ocampo, 1994).
Colombian manufacturing output share eventually reached a minimum in 1999. The
deep economic downturn which affected Colombia in that year was as a result of the
fall-out from financial crises in other emerging countries contributing to this dynamic.
The Colombian manufacturing sector partially recovered at the beginning of the
2000s. However since 2007, the share of the manufacturing sector has been shrinking
again in a remarkable and consistent way. The current episode of de-industrialization
(or, better, de-manufacturing) does not comprise a general or proportional decline in all
the several components of the industrial sector. Indeed, the contraction of
manufacturing sector is accompanied by an increase in the energy sector’s real GDP
share. By the first quarter in 2014, Colombian manufacturing accounted for less than
11% of real GDP, while the energy sector share has been constantly expanding.
Figure 2 shows the quarterly growth rate differential for the mining and
manufacturing sectors with respect to GDP. We observe, first, that the volatility of the
mining sector growth rate is much higher than the manufacturing one. Aside from this
high volatility, there seem to be no distinct trend until mid-2007, when the mining
sector starts enjoying a growth rate mostly above GDP while the opposite is true for the
manufacturing sector.
Page 10
9
Figure 2 ‐ Sectorial quarterly growth rates differential. Source: Central Bank of Colombia.
We use the standard Chow test to validate the structural break that seem to
emerge from the data. The data set consists of 53 quarterly observations from 2001 Q1
to 2014 Q1. Unfortunately, due to a change in the methodology used by the Colombian
statistical office (DANE), we cannot include previous data. Table 1 and Table 2 show
the estimation results for the mining and manufacturing sectors. The tests indicate that
there seems to be a structural break for both series in 2007Q3. There is no clear trend
before 2007Q3. The mining sector seems to grow less than GDP (1.07% below GDP,
not statistically significant), while the manufacturing one is growing at a par with GDP
(0.13% above GDP, not statistically significant). After 2007Q3, however, the trend is by
contrast very clear. The mining sector experienced an above-than-GDP growth rate
(+1.15%) while the manufacturing one is growing at a rate lower than GDP (-0.99%).
Variable Full sample 2001Q1-2007Q3 2007Q4-2012Q4
Constant 0.02 (0.45) −1.07(0.75) 1.15**(0.37)
Chow Test
(2007Q3)
6.79 (0.01)
Table 1 ‐ Estimation of Mining sector to GDP growth rate differential. Source Central Bank of
Colombia and Authors’ computation.
Page 11
10
Variable Full sample 2001Q1-2007Q3 2007Q4-2012Q4
Constant -0.42 (0.22) 0.13(0.29) −0.99**(0.28)
Chow Test
(2007Q3)
7.23* (0.01)
Table 2 ‐ Estimation of Manufacture sector to GDP growth rate differential. Source Central Bank of
Colombia and Authors’ computation.
All the above-mentioned de-industrialization episodes are consistent with the
worst de-industrialization case stressed by Tregenna (2011).12 From 1985 to 1995,
Colombia is the only developing economy in which the contraction of the
manufacturing sector outweighed the increase in labor-intensity (a decreasing labor
productivity). Sadly, these findings are confirmed for the 2007-2013 period.13 Data
reported in table 3 show that a negative variation in the manufacturing employment
share in the order of 1,8 percentage points is due to the significant contraction of
manufacturing participation to GDP. Such a contraction outweighs the reduction in
manufacturing labor productivity. These puzzling and worrisome dynamics in
Colombian manufacturing labor productivity can be partially explained by
manufacturing sub-sectors’ dynamics. Since 2000, more disaggregated data (see DANE,
2014) reveal that production of basic metallic and non-metallic goods have expanded
their participation in manufacturing value added. By contrast, the manufacturing value
added share attributed to the chemical industry, has decreased. The same story applies
to the capital goods sector. While the former are usually classified as labor-intensive
and low-skill sectors, with little scope for innovation and productivity growth, the latter
are medium and high-skill technology-intensive sectors characterized by stronger
(productivity) growth opportunities.14 Overall, it seems that Colombian manufacturing
is not only shrinking in relative and absolute terms, but it is concentrated in labor-
intensive low-skill industries. Hence, it might be a reasonable concern that the ongoing
Page 12
11
de-industrialization process might seriously impinge on Colombian long run
development, provided that the non-traditional sophisticated tradable goods sectors still
represent a fundamental source of labor productivity dynamics (Rodrik, 2007; Szirmai,
2012).
Labor share
variation
Labor-intensity
variation
Sector share
variation
Overall labor productivity
variation
-1,8 0,8 -3,0 0,4
Table 3 ‐ Decomposition of the manufacturing employment share’s variation, 2007‐2013. Source
Central Bank of Colombia, ILO (Labor Force Survey) and Authors’ computation.
4. Real exchange rate dynamics, Foreign Direct Investments, and the
Colombian external account.
The macroeconomic dynamics briefly sketched in the first sections of this paper depend
on a wide range of endogenous and exogenous factors of both long- and short-run
nature. In 2008 and 2009, there is no doubt that temporary circumstances linked to the
worldwide ‘Great Recession’ have negatively affected Colombian GDP growth. At a
more profound level, Colombian performances are likely to be affected by some radical
changes in the Colombian domestic policy framework. Since the end of the 80s,
Colombia is experiencing a long-lasting and deep reform process. At the beginning of
the 90s, the so-called ‘apertura hacia adentro’ was launched, aiming to move
Colombia, and the Colombian industrial sector in particular, from a fairly protected
trade regime to an open and liberalized setting. More recently, this process has
continued through a long series of free trade agreements.15 Further, since the mid-2000s
the regulation of the mining and energy sectors has been subject to important
modifications. In 2004, the government lifted the restrictions to foreign companies’
exploitation of domestic oil resources (UNCTAD, 2006). Accordingly, the monopolistic
control of the oil sector by domestic firms has been removed and the national company
Page 13
12
Ecopetrol partially privatized. Such a regime shift, together with significant natural
resource discoveries and high prices of primary commodities, have steered massive
foreign direct investment towards Colombia.
4.1. The FDI-exchange rate nexus
Most economists would interpret the recent appreciation of the Colombian peso as the
main factor curtailing the profitability and viability of Colombian manufacturing. Such
an appreciation would in turn be attributed to a natural resource boom raising domestic
expenditures and lifting inflation, in particular non-tradable sector inflation.
From 2003 to 2013, the Colombian real exchange rate has appreciated by 6.6%
yearly on average (see figure 3).16 However, contrary to what might be expected, most
of this trend comes from nominal appreciation, in the order of 6.4% yearly, rather than
strong inflationary pressures. Data from international economic organizations confirm
that Colombian inflation has been under control and has decreased remarkably since
2008. Since 2003 Colombia has experienced the lowest inflation rates among CIVETS
countries.17 Colombian inflation has often been lower than that registered in many of its
most relevant trading partners, Latin American ones in particular. According to IMF
(2014), it was below 3% in 2013 and it is expected to be around 1.9% in 2014.18
Page 14
13
Figure 3 ‐ Colombian effective real and nominal exchange rate (index number). Source: UNCTAD
Datastat.
Of course, it could be said that nominal and real appreciation of the Colombian
peso might come from Colombian trade and current account surpluses. But data relating
to Colombian external accounts show that this is not the case. Since 2001, Colombia has
experienced a persistent although modest trade deficit only replaced by a mild surplus in
2011. Yet, the Colombian current account has remained in deficit, and it has
surprisingly worsened and diverged from an improving trade account. It is now in the
order of more than 3% of GDP.
In order to understand why despite a growing current account deficit the
Colombian peso revaluated so heavily over the last ten years until mid 2014, it is
instructive to have a look to all the different components of the Colombian balance of
payments. It is crucial to emphasize that the financial account surplus (i.e. an
increasingly negative Colombian net international investment position) more than
compensated for the current account deficit. In the period 2002-2013 the cumulated
current account deficit amounted to US$ 67 billion, whereas the financial account
surplus reached more than US$ 97 billion. These numbers seem to indicate that the
Page 15
14
origin of the Colombian Dutch disease is perhaps to be found in the macro sphere, in the
financial one in particular.
In the case of Colombia, Foreign Direct Investment has shown some degree of
volatility and instability due to exogenous economic factors (i.e. the worldwide ‘Great
Recession’), and their links to one-shot investment opportunities. SABMiller
Company’s acquisition of the local beer brand Bavaria lies behind the erratic jump in
Colombian FDI in 2005, for instance. This fact notwithstanding, Colombia has
experienced a significant and apparently structural increase in incoming FDI since 2005.
Indeed, before 2005 and throughout the 1990s, overall Foreign Direct Investments in
Colombia have rarely been higher than 3% of GDP (according to UNCTAD, they stood
out at 4,37% of GDP only in 1997). However, they peaked up to almost 7% of
Colombian GDP in 2005, and have remained systematically and remarkably above 3%
of GDP since then (the only exception being in 2010). In absolute terms, from 1990 to
2004, net FDI were equal to US$ 1.6 billion on a yearly average. Since 2005, they
averaged US$ 6.5 billion. In 2012, net FDI represented almost 100% of the positive net
Colombian financial account, these same figures being far higher than 50% in 2007 and
2008.
Incoming Foreign Direct Investment, in particular those targeting the domestic
energy sector, have greatly contributed to the surplus in the Colombian financial
account since 2004. Furthermore, in the last five years, increasing net foreign portfolio
investment has further reinforced the macroeconomic implications, read Colombian
peso’s nominal and real exchange rate appreciation, of the above mentioned FDI flows.
Indeed, in the first part of the 2000s, net foreign portfolio investment in Colombia was
low or even negative. A remarkable change has apparently taken place since 2007. With
only the exception of 2008 (which was likely due to the worldwide consequences of the
Page 16
15
subprime financial turmoil), net foreign portfolio investment has been always positive
and increasing since that year. In 2007, it amounted to 1.3 billion dollars, i.e. 0.64% of
Colombian GDP. From 2011 to 2013 it surged to far more than 5.5 billion dollars
yearly, i.e. more than 1.5% of Colombian GDP. According to data provided by the
Central Bank of Colombia, it amounted to 2.5 billion dollars in the first quarter of 2014.
A type of self-reinforcing process between FDI flows, portfolio investment, and
exchange rate appreciation seems thus to characterize the more recent evolution of the
Colombian external account. Mounting FDI flows have provided the first move for the
Colombian peso’s ongoing appreciation. International investors’ enthusiasm for
Colombian growth opportunities and, say, exchange-rate induced capital gains, have
then led to increasing net foreign short-term portfolio investment. In the light of the
structural (sectorial) consequences of such macroeconomic trends and of the current
account imbalances reported in next section, it would seem a straightforward
progression to wonder whether such a self-feeding process may turn out to be
unsustainable in the near future.
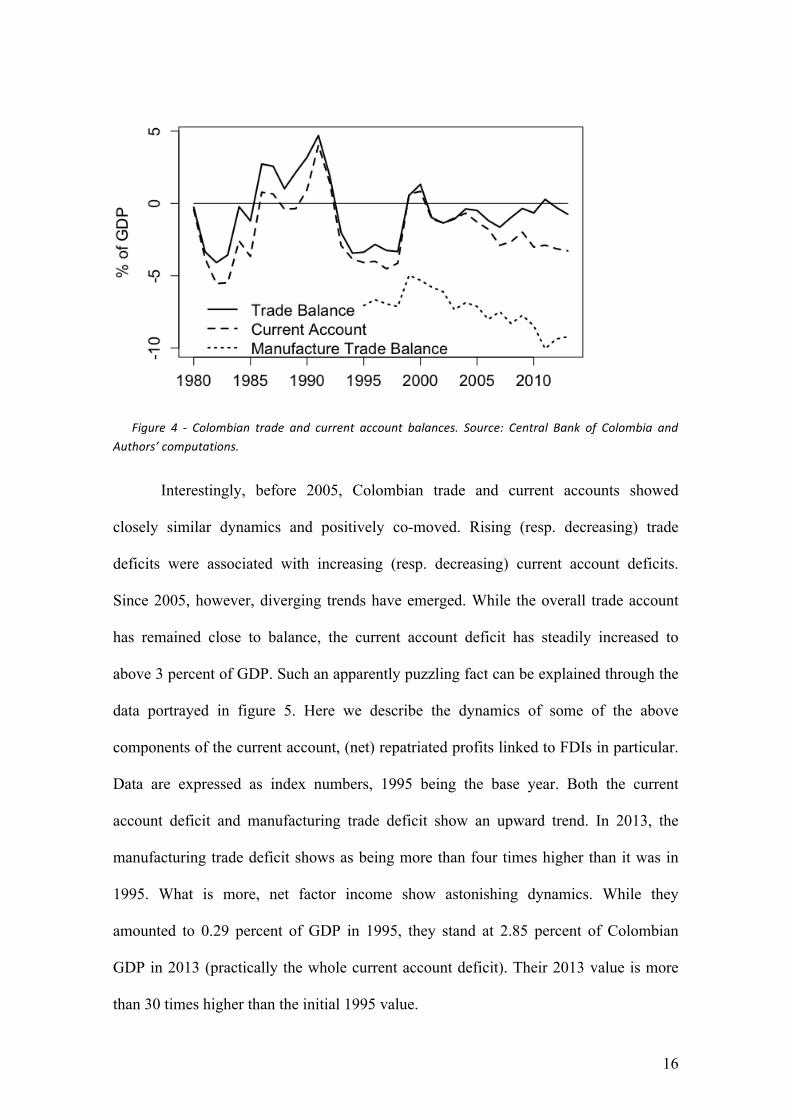
4.2. Colombian trade and its current account
Figure 4 provides a closer look at the evolution of the Colombian current account and of
its sub-components. Colombian structural dependence on imports of manufactured
goods emerges strikingly. Despite fluctuations linked to economic cycles, the trade
deficit in manufactured goods has been increasing since the beginning of the 2000s. It is
now close to 10% of GDP. Obviously, these figures change radically when trade flows
linked to the energy and mining sectors are taken into account. Since 2001, the overall
trade account in goods and services has registered deficits no higher than 2% of GDP.
Over the last four years, it has been close to balance, even though not yet positive (with
the exception of 2009), thanks to the high prices of primary commodities.
Page 17
16
Figure 4 ‐ Colombian trade and current account balances. Source: Central Bank of Colombia and
Authors’ computations.
Interestingly, before 2005, Colombian trade and current accounts showed
closely similar dynamics and positively co-moved. Rising (resp. decreasing) trade
deficits were associated with increasing (resp. decreasing) current account deficits.
Since 2005, however, diverging trends have emerged. While the overall trade account
has remained close to balance, the current account deficit has steadily increased to
above 3 percent of GDP. Such an apparently puzzling fact can be explained through the
data portrayed in figure 5. Here we describe the dynamics of some of the above
components of the current account, (net) repatriated profits linked to FDIs in particular.
Data are expressed as index numbers, 1995 being the base year. Both the current
account deficit and manufacturing trade deficit show an upward trend. In 2013, the
manufacturing trade deficit shows as being more than four times higher than it was in
1995. What is more, net factor income show astonishing dynamics. While they
amounted to 0.29 percent of GDP in 1995, they stand at 2.85 percent of Colombian
GDP in 2013 (practically the whole current account deficit). Their 2013 value is more
than 30 times higher than the initial 1995 value.
Page 18
17
Figure 5 ‐ Overall current account and selected components’ dynamics. Source: from Central Bank of
Colombia and Author’s computation.
5. The Macroeconomics of the Financial Dutch Disease: a scenario analysis
According to the literature reviewed in section 2 and to the empirical evidence
presented in sections 3 and 4, the picture we have described so far seems to suggest the
existence of a strange sort of Dutch disease in Colombia. Its peculiar ingredients and the
main mechanisms at work can be summarized in a few points.
First, the Colombian peso significantly revaluated in the last decade until mid
2014, both in nominal and real terms. The excess world demand for Colombian pesos,
however, does not come from the need to finance a rest-of-the-world current account
deficit vis-à-vis Colombia. The world is not swamped by Colombian exports. On the
contrary, Colombia continues to experience a structural and increasing manufacturing
trade deficit. High international prices of primary commodities and an expanding
energy sector have helped to bring the overall Colombian trade account back to
equilibrium. Yet, the Colombian current account is negative and worsening.
Second, Colombian peso revaluation can be explained by the dynamics of
capital inflows, and among them FDI are overwhelmingly important. In the more recent
Page 19
18
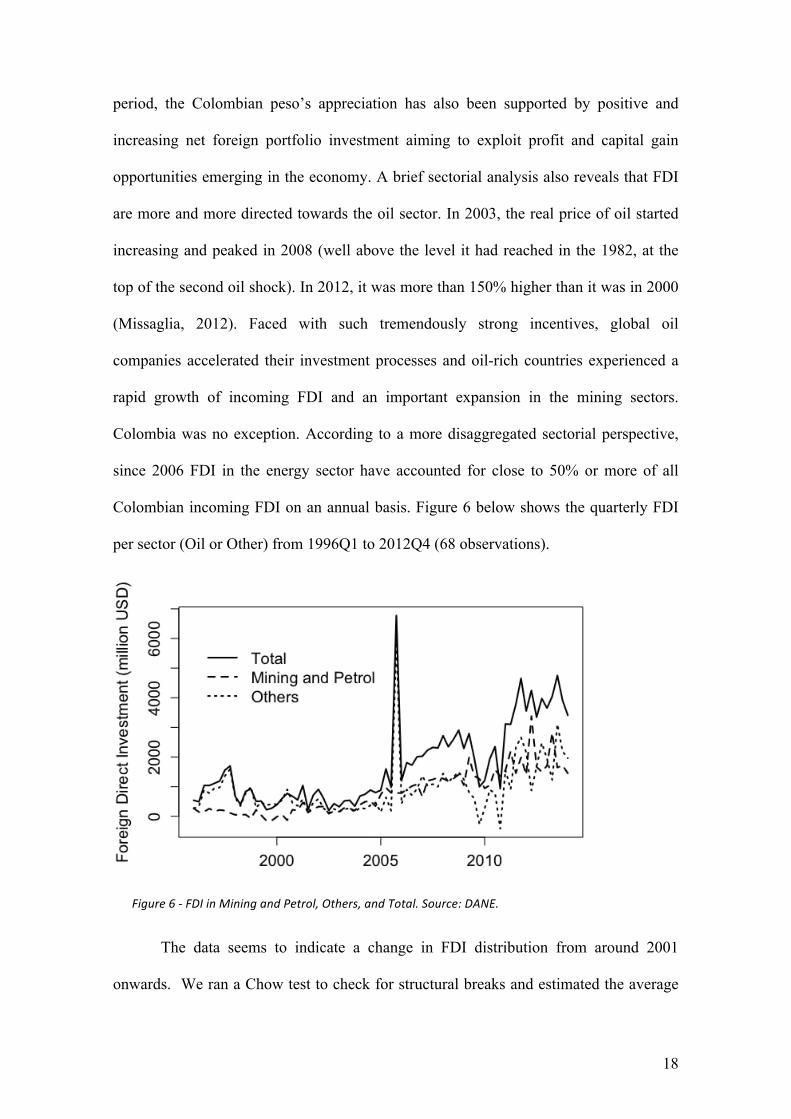
period, the Colombian peso’s appreciation has also been supported by positive and
increasing net foreign portfolio investment aiming to exploit profit and capital gain
opportunities emerging in the economy. A brief sectorial analysis also reveals that FDI
are more and more directed towards the oil sector. In 2003, the real price of oil started
increasing and peaked in 2008 (well above the level it had reached in the 1982, at the
top of the second oil shock). In 2012, it was more than 150% higher than it was in 2000
(Missaglia, 2012). Faced with such tremendously strong incentives, global oil
companies accelerated their investment processes and oil-rich countries experienced a
rapid growth of incoming FDI and an important expansion in the mining sectors.
Colombia was no exception. According to a more disaggregated sectorial perspective,
since 2006 FDI in the energy sector have accounted for close to 50% or more of all
Colombian incoming FDI on an annual basis. Figure 6 below shows the quarterly FDI
per sector (Oil or Other) from 1996Q1 to 2012Q4 (68 observations).
Figure 6 ‐ FDI in Mining and Petrol, Others, and Total. Source: DANE.
The data seems to indicate a change in FDI distribution from around 2001
onwards. We ran a Chow test to check for structural breaks and estimated the average
Page 20
19
shares for different samples. Table 4 presents the results. There is a structural break in
2001Q2 where the share of FDI accruing to Oil and Other sector has substantially
changed. Indeed, the Oil (resp. Other) sector has observed an increase (resp. decrease)
in the FDI share.
Variable Full sample 1996Q1-2001Q2 2001Q3-2012Q4
Petrol and Mining share 0.42***(0.04) 0.12 (0.06) 0.56***(0.03)
Chow Test (2007Q3) 52.08*** (0)
Table 4 ‐ Estimation of FDI share accruing to Oil and Other sectors. Source Central Bank of Colombia
and Authors’ computation.
Both facts (the exchange rate revaluation and massive energy sector-oriented
FDI) contribute to shift the Colombian productive structure away from manufacturing
and to make it increasingly dependent on the exploitation of domestic natural resources.
Third, this kind of FDI generates high returns, but profits are typically
expatriated. Indeed, between 2009 and 2012, the incoming flows of FDI (39,306 US$
millions) have been lower than the outgoing flow of profits (42,469 US$ millions), see
Cabrera Galvis (2013). This fact is disturbing on a twofold level. First, before being
expatriated, these profits are not taxed. Following Ocampo,
this reflects Colombia’s inability to take advantage of commodities’ prices boom
through taxation […] this was done in the past during the coffee price boom. This
contrast is even more striking when thinking that coffee profits were captured by
someone in the country. On the contrary, today’s oil profits are essentially going to
foreign enterprises (Ocampo 2013, p.15).
Second, huge profits repatriation by foreign investment in the Colombian oil
sector emerges as the leading force behind Colombian current account imbalances.
Whilst these imbalances may easily turn out to be structural and permanent, we cannot
say the same for the FDIs that have so far financed the existing external gap.
Page 21
20
The kind of productive changes and external imbalances currently underway in
Colombia cast serious doubts on its long-run growth potential and financial stability.
5.1 Possible future scenarios
We have already emphasized our concern about a negative link between de-
industrialization and productivity dynamics. This concern will be even stronger if we
consider the current reduction in manufacturing participation to the GDP to be linked to
a decreasing manufacturing labor productivity. Clearly, such facts are at odds with those
historically observed in developed and successful East Asian ‘catching-up’ countries.
The relative concentration of Colombian manufacturing in labor-intensive low-skill
productions may significantly downsize Colombia opportunities as to the accumulation
of human capital and generation of innovation and technological spillovers on the rest
of the economy. This is likely to weaken productivity dynamics and harm economic
development. However, these dynamics, linked to a more traditional vision of the Dutch
Disease are likely to develop at a rather slower pace since it involves a structural change
of the composition of the economy which typically is measured in decades rather than
years.
We are concerned about the dynamics unfolding in a much shorter time frame.
Persistent and large current account imbalances have often been perceived as
destabilizing factors, potentially leading to exchange rate crises and financial turmoil in
developing countries. Colombia is no exception and the data presented in section 4
leads one to ask whether the current Colombian development pattern is financially
sustainable. In order to address this issue, we propose a scenario analysis19 on the
possible evolution of the various components of the Colombian Balance of Payments.
Our analysis relies on the data provided by the Colombian government in 2014 as to the
expected long-run dynamics of oil prices (expected to remain close to 100 dollars per
Page 22
21
barrel since 2014 on), oil production and exports, GDP and imports growth rates
(Ministry of Finance and Public Credit, 2014a).20 Further, the Colombian government
also published its expectations as for current account dynamics, net capital inflows and
variation in foreign reserves. We do not have available additional information
concerning net factor payments, profit repatriation in particular, and non-oil exports.
The expected trends realised by the Colombian government are based on the assumption
of a economy growing close to full potential (i.e. a real GDP growth rate around 4,8%)
from 2014 to 2024, as it did, on average, from 2003 to 2013, and in which
macroeconomic variables evolve consistently with a sort of steady state long-run
equilibrium. In elaborating its estimations, the Colombian government also takes into
account a stable inflation rate, which is under control and at historically low levels in
2013; the implementation of a fiscal rule that reduces the public debt, and brings the
effective and structural public deficit close to 1% of GDP thanks to the achievement a
persistently positive public primary balance; the progressive recovery of developed
countries’ economies from the ‘Great Recession’ but the slowdown of emerging
countries’ growth rates such as China. The aim of our analysis is twofold. First, we
compute the required evolutions in our ‘unknown’ variables, net factor payments or
non-oil exports alternatively, in order to meet government’s expectations. Second, we
simulate future possible dynamics of some relevant components of Colombian Balance
of Payments according to past-observed trends. We are interested in the implications of
such trends, should they persist in the upcoming years, in terms of current account,
financial account, foreign reserve accumulation. In this sense, we want to test the
consistency of these emerging figures with government expectations.
The right-hand side of figure 7 reproduces government’s expectations in terms
of foreign capital inflows and current account. The left-hand side of figure 7 in turn
Page 23
22
portrays government projections as to oil exports and overall imports of goods and
services. The government’s expectations are such that a persistent current account
deficit should slightly decrease from 3,6% of GDP in 2014 to around 3% of GDP in
2024. Financial account and net FDI inflows are expected to remain, on average, in the
order of 4% and 3.7% of GDP, respectively (in 2014, Colombian government expects a
financial account surplus close to 5% of GDP). The financial account surplus is thus
expected to fully cover current account deficits and allow Colombian foreign reserves to
pile up even further.
Figure 7 ‐ Government trade flow forecasts and expectations on current and capital account, and net
FDI. Source: Ministry of Finance and Public Credit (2014b), Central Bank of Colombia and Authors’
computation.
5.1. Current account dynamics
In the left-hand side of figure 8, we show the current dynamics of Colombian net
factor payments. Consistently with figure 6, it has become astonishingly negative in the
last decade mainly due to an enormous increase in FDI’ profit repatriation. We assume
three possible scenarios as to future net factor payments evolution. First, we assume it
maintains a constant nominal value, equal to its 2013 level, throughout the next ten
years (dashed line). Second, we assume NFP to move at the same pace as the
Colombian nominal GDP, i.e. the NFP/GDP ratio is constant (dotted line). Finally, we
project possible increases in NFP Colombian outflows using an HP-filter trend (dashed-
dotted line). On the right-hand side of figure 8, we plot the required increase in
Colombian non-oil export in order to meet government’s current account expectations,
Page 24
23
following equation (1), where CA is the current account, XOil and XNonOil are exports of
Oil and Non-Oil respectively, M is imports and NFP is net factor payments.
�� = �!"# + �!"#$%& −� + ��� (1)
As shown by equation (1), once CA, XOil and M are known, either XNonOil or NFP
still need to be fixed in order to determine all variables. In this first exercise, we define
three different dynamics for NFP and determine the consistent dynamics for the non-oil
exports required, such as those shown in equation (1). What emerges clearly is the
enormous increase of non-oil export (as a percentage of GDP) that should take place
since 2020 on in order to bring the trade balance under control and maintain the overall
current account deficit around 3% of GDP by the end of 2024.
Figure 8 ‐ NFP (different scenarios) and required non‐oil exports to meet government’s CA target.
Source: Ministry of Finance and Public Credit (2014b), Central Bank of Colombia and Authors’
computation.
Figure 9 presents the results of the contrasting exercise. Here we make two
different hypotheses on possible future evolution of Colombian non-oil exports and
determine the value for Net Factor Payments. First, we assume them to grow on a par
with GDP (dashed line in figure 9, left-hand side). Alternatively, we assume non-oil
exports to grow according to its trend, as calculated through the HP filter applied to
annual data from 1995 to 2013 (dotted line). On the right-hand side of figure 9, we
show the implications of the aforementioned scenarios on NFP dynamics in order to
Page 25
24
meet the government current account target. What emerges is that NFP will remain
reasonably negative for some years ahead. Nonetheless from 2020 onwards, the
increasing gap between total imports and oil exports, and the ensuing widening overall
trade deficit (in goods and services), together with an expected reduction in the current
account deficit, implies that NFP will switch from negative to positive values. Needless
to say, such a scenario appears at the very least unrealistic. This is even more so if it is
linked to the government’s expectations regarding persistently positive net FDI over the
next ten years. Indeed, in presence of persistently positive net FDI inflows, and of an
increasing stock of foreign direct investment in Colombia, it seems reasonable to expect
a further rise in the flow of profits repatriation and, hence, an even more negative NFP.
In the end, there are no credible reasons this could turn into positive in a foreseeable
future.
Figure 9 ‐ Non‐oil exports (different scenarios) and required NFP to meet government’s CA target,
Source: from Ministry of Finance and Public Credit (2014b), Central Bank of Colombia and Authors’
computation.
Figures 8 and 9 describe ‘implicit’ dynamics in non-oil Colombian exports or,
alternatively, in NFP consistent with governmental targets on the overall current
account balance. Let us now modify our perspective and assume that the Colombian
current account is endogenous and determined by the prevailing trends in their several
components. According to the different scenarios we assume, the Colombian current
account may actually assume values quite separate from government expectations.
Page 26
25
5.2 Financial Account and Current account reconciliation
Given the doubts shed on the government-forecasted value of the current account, we
pursue our analysis by computing our own forecasts for the current account. We follow
equation (1) and keep the government-forecasted values for oil exports and imports but
use two different hypothesis for the value of non-oil exports and net factor payments.
The left-hand side of figure 10 below portrays the dynamics of the current account for
these three scenarios. Government expected current account dynamics (dashed line)
remains in stark contrast to alternative records that would emerge in the case where non-
oil exports and NFP grow at the same pace as Colombian GDP (dotted line) or, even
worse, if they grew according to past trends (dash-dotted line). In these two cases, it
emerges strikingly clearly that effective Colombian current account deficit may
eventually turn out to be much deeper than expected. The right-hand side of figure 10
determines the needed dynamics of the financial account in order to maintain the
Colombian foreign reserve as constant (keeping the current exchange rate constant),
according to the various scenarios for the current account dynamics. Should the
government’s expectation be confirmed, decreasing net positive capital inflows (as a
ratio of GDP) would be more than enough to match the current account deficit and
ensure stable Colombian foreign reserves (small dashed line). In the last decade,
Colombia has experienced a remarkable surge in net capital inflows. Things change
radically if we assume that the Colombian current account will be the result of non-oil
exports and net factor payments moving on a par with GDP (dash-dotted line) or, even
worse, following past HP trends (long dash line). In both scenarios, Colombia would
need constantly growing and indeed mounting financial account surpluses (i.e. an
increasingly negative net international investment position) in order to cover the huge
current account imbalances.
Page 27
26
Figure 10 ‐ Current account and capital account under different scenarios. Source: from Ministry of
Finance and Public Credit (2014b), Central Bank of Colombia and Authors’ computation.
5.3 Foreign reserves dynamics
The last exercise we ran is to determine the impact of the various scenarios at hand on
the accumulation of foreign reserves, assuming a constant exchange rate. We assume
two trends for each account of the balance of payment accounts, thus implying four
different scenarios, on top of the governmental forecasts. Table 5 summarizes the
various hypothesis made for each scenario.
Scenario Current Account Hypothesis Capital Account Hypothesis
1 NFP and XNonOil GDP-based. Government forecasts.
2 NFP and XNonOil HP-filter trend.
Government forecasts.
3 NFP and XNonOil GDP-based. HP-filter trend.
4 NFP and XNonOil HP-filter trend.
HP-filter trend. Table 5 ‐ Scenario description
The possible increase, or stabilization, of Colombian foreign reserves basically
requires foreign net capital inflows to move accordingly to observed dynamics in the
current account. If the Colombian current account deficit effectively follows the
expected trajectory, decreasing net capital inflows (as a percentage of GDP), in line
with government expectations (3,4% of GDP yearly from 2014 to 2015), will ensure a
slight increase in foreign reserves (small dashed line). Things improve when foreign
capital inflows follow their HP-filter trend (scenario 3 and 4). In such a case, a large
Page 28
27
financial account surplus will materialize and allow Colombian foreign reserves to
increase at the outset, even in the event that non-oil exports and, above all, NFP move at
par with GDP (scenario 3). However, in this scenario, the sum of the current account
deficit and the financial account surplus (i.e the change in official reserves) turns
negative from 2018 onwards. Accordingly, the reserve stock starts decreasing and
reaches 0 in 2023. In the case of the HP-filter trend of the current account (scenario 4)
foreign reserves will actually increase until 2020, where they reach almost $ 83 billion.
However, things may change dramatically in the case of the financial account
meeting government forecasts (scenario 1 and 2). If non-oil exports and NFP grow
according to GDP growth trends (scenario 1), foreign reserves start decreasing
immediately and would turn negative by 2022 (dash-dotted line). Clearly, such a
reduction will be even faster should NFP and non-oil exports follow their HP-filter
trends (scenario 2).21 In such a scenario, Colombian foreign reserves will be driven
close to zero by the end of 2019.
Figure 11 ‐ Expected dynamics in Colombian foreign reserves stock (different scenarios). Source: from
Ministry of Finance and Public Credit (2014b), Central Bank of Colombia and Authors’ computation.
Page 29
28
6 Policy Options
What are the policy implications of these scenarios and expected dynamics in
Colombian foreign reserves? In the last decade, the Colombian economy has become far
more dependent on the exploitation and exports of its own natural resources in order to
pay for increasing imports of capital goods. The exports of oil and related products
represent (in 2012) much more than 50% of Colombian exports. According to data
provided by DANE (2014), by the end of 2012, foreign imports represent more than
60% of the total supply (domestic production plus imports) of capital goods. This ratio
was less than 47% in 2000. Such a deep structural change in the Colombian economy
implies that the nominal exchange rate appreciation is a fundamental macroeconomic
variable affecting Colombian capability to invest, accumulate capital stock and support
economic growth. A depreciation of the exchange rate, by making imported capital
goods more expensive, could easily curtail investments and growth. In order to avoid
such an event taking place, available foreign reserves play a fundamental role – they are
the weapon in the hands of the Central Bank to defend the domestic currency. A
shortage of foreign reserves might start a financial crisis.
Our analysis shows that there is no risk of such events taking place in the near
future in Colombia. The right-hand side of figure 8, for instance, reveals that slightly
increasing non-oil exports, as a share of GDP, will be enough to compensate for
negative NFP and guarantee the Colombian current account to reach the government’s
target in the next 2-3 years. Similarly, negative NFP do not need to be immediately
reduced in order to ensure an easy management of the Colombian external account and
the Colombian peso. Yet, our analysis also shows that some trends characterizing
Colombia since the mid 2000s are unsustainable in the medium to long run. Should
huge profit repatriation continue in the upcoming years according to the astonishing
Page 30
29
dynamics registered so far, net positive capital inflows will not suffice, even in the best
possible scenario, to preserve Colombian foreign reserves or to avoid a possible
exchange rate crisis.22
Furthermore, government optimistic forecasts rely upon a type of ‘financial
account-current account counter-balancing’ mechanism that might be suitable in terms
of addressing short-term problems, but is likely to give rise to viciously unstable
dynamics in the long run. In the end, this may turn out to be the main source of
Colombia possible financial instability. According to Singh,
FDI investment creates foreign exchange liabilities not only now but also into the
future. This characteristic leads to the danger that unfettered FDI may create a time
profile of foreign exchange outflows (in the form of dividends payments or profit
repatriation) and inflows (i.e. fresh FDI) which may be time inconsistent (Singh,
2003, p. 209).
Thus, important current foreign capital inflows, FDI in particular, provide the
country with foreign currency flows covering current account deficits and, possibly,
stabilizing the exchange rate (or creating room for an exchange rate stabilization).
However, they also create the basis for even higher foreign currency outlays in the
upcoming years, hence the need for even stronger financial account inflow. The
beneficial impact of FDI has a weak basis and may easily break down. Should capital
inflow decrease due to a reduction in natural resource sector’s profitability, for example,
the fundamental source of foreign currency inflow will dry up while the foreign
currency outflow still exists. This is the kind of risk Singh puts forward and which
Colombia may face in the medium/long-run.
Interestingly, recent economic facts reinforce our doubts as to the medium-to-
long run “structural” solidity of the Colombian external account, and the Colombian
capability to manage and stabilize the exchange rate. We refer to the huge drop in the
Page 31
30
international price of primary commodities, oil in particular, taking place at the end of
2014. Due to the overreliance of Colombian exports on oil exports, this shock has first
widened even further the Colombian current account deficit. According to the IMF
(2015), the Colombian current account deficit is expected to be around 5.9% of GDP in
2015, i.e. a level considerably higher than that foreseen by the Colombian government
just one year before. On top of this, the Colombian peso started to depreciate in the
beginning of 2015 On the one hand, according to the IMF (2015), these signs of
depreciation, together with rising uncertainty on international financial markets, “could
lead to sharp re-pricing of Colombian assets and exchange rate (IMF, 2015, p.7)”, hence
to capital reversals and, possibly, financial turbulences. On the other hand, the IMF
(2015) also shares our doubts as to the adequacy of Colombian foreign reserves to avoid
likely contractionary exchange rate collapses. In fact, even though the level of
Colombian official reserves “appears adequate for precautionary purposes, [it] may be
insufficient for tail risks […and] reserves measured relative to short-term external debt
plus the current account deficit are still below pre-crisis ratios (IMF, 2015, p.15)”.
More generally, the most recent dynamics in the Colombian exchange rate and
external account seem to tell us that the domestic central bank should promptly
intervene and accumulate large foreign reserves in order to tame excessive and perhaps
unsustainable (at least in the long run) exchange rate appreciations when appreciation
pressures do materialize on financial markets (due, first, to booming FDI and then
portfolio investment). In a way, the domestic central bank should move from a rigorous,
perhaps stricter, inflation targeting monetary policy (current inflation rate is below the
2% – 4% range originally targeted by the Colombian central bank), and integrate it with
a competitive real exchange rate (CRER) target. This kind of alternative monetary
policy strategy could first help to preserve the competitiveness of domestic
Page 32
31
manufacturing and maintain the current account balance sound. Second, accumulated
reserves could be subsequently deployed to stabilize the exchange rate and avoid
contractionary devaluations that could be possibly triggered off by sudden stops and
capital reversals. The Colombian central bank did intervene in the first half of 2014 in
presence of mounting foreign portfolio investment. However, there are now good
reasons to believe it acted too late and too mildly. It should have done so much before
and much more actively.
In order to be able to tackle such possible undesirable outcomes in advance and
in a more structural way, two additional policy measures come to mind. They are
strictly linked to each other. First, Colombia should reduce its dependence on foreign
direct investment as both a source of foreign currency inflow and productive
investment. To clarify this point, this does not imply that Colombia should discourage
FDI from taking place, in particular those which may lead to a diversification of its
productive and export pattern. We are simply suggesting that FDI should represent only
part, and perhaps not the most relevant one, of Colombian capital accumulation and
development processes, together with productive initiatives undertaken by domestic
participants. Second, and in accordance with the previous point, the Colombian
government should implement policies that significantly diversify the export base. The
Colombian government foresees a reduction in the production of oil since 2017
onwards. There is no guarantee that the dynamics of non-oil exports (including other
primary commodities) will be sustainable enough to avoid a widening current account
deficit from taking place, nor to pay for increased repatriation of foreign companies’
profits. The expansion of Colombian product and export space may provide the required
dynamics. In the end, such a strategy would be absolutely in line with the most recent
evidence on successful episodes of long-run economic development. It is the kind of
Page 33
32
goods exported that matters for growth (Haussmann et al. 2007), and product
diversification characterizes a relevant part of the development process (Imbs and
Wacziarg, 2003; Rodrik, 2007). This is even more relevant to the present case since,
according to Hernandez Jimenez and Razmi (2014), Colombia is among those Latin
American economies in which an improvement in the trade account, perhaps via export
diversification, provides a fundamental spur to economic growth. Apparently Colombia
has followed a radically different development pattern from that outlined above, which
has put too much emphasis on the exploitation of domestic natural resources as its main
source of economic growth (the so called ‘locomotora minera-energetica’).
It might be wise for Colombia to use natural resource revenues to support a clear
diversification strategy that might, at least partially, rebalance the development strategy
it has followed so far. “Product and export diversification” means, inevitably, industrial
policy. Which kind of industrial policy? There are essentially two issues at stake. First,
the articulation between trade and industrial policy. Second, the “horizontal” vs.
“vertical’ orientation of the same industrial policy. Talking about the first issue means
understanding a big mistake made by Colombian policy-makers in terms of the
appropriate sequencing of the policy-mix. What we have learnt from the extraordinary
development experiences of several Asian economies is that a good formula to promote
product and export diversification is “trade liberalization cum export promotion and
vertical industrial policy based on the scheme privilege-incentive-threat” (e.g.: a sector
is protected only for a limited and pre-established period of time and provided that some
performance criteria are respected – say, x percent of your production is to be exported
after 3 years of protection, otherwise protection is withdrawn). Colombian policy-mix,
on the contrary, has been based on the formula “trade liberalisation cum progressively
weaker export promotion and horizontal industrial policy without incentives and
Page 34
33
threats”. As to trade liberalization, this is, in Colombia, a fact of life: over the last 20-25
five years the country has signed so many Free Trade Agreements (FTAs), including
with richer and larger partners (European Union and United States). As to the
progressively weaker export promotion, here it suffices to remind that starting from
1967 (when the agency ProExpo was created), the average, implicit export subsidy has
been continuously falling (Missaglia, 2014). Finally, insisting on “horizontal” industrial
policies – reducing the cost of opening a business, protecting investors, improving
contract enforcements and the rule of law, etc. – is a mistake: in this respect, Colombia
has already improved a lot and the only country in the region with a better position in
the World Bank ranking Doing Business is Peru.23 Still, this has not been a great
achievement since, as we already saw, over the last years the degree of export
diversification has lowered. So, moving toward what we called the Asian formula, even
within the restrictions imposed by World Trade Organization regulations, is the route to
be pursued. The only kind of “horizontal” industrial policy that has not been
implemented is related to infrastructural development. Even the casual visitor
understands that in Colombia the infrastructural backwardness is impressive. Some
figures may help: the World Bank is maybe exaggerating when claiming that Latin
American countries should invest 4-6% of GDP in infrastructure in order to catch up
with fast growing Asian economies24, but it is certainly not enough to invest less than
1% for two decades (Missaglia, 2014).
Page 35
34
Notes
1. CIVETS stands for Colombia, Indonesia, Vietnam, Egypt, Turkey and South Africa.
2. In the last decade, Colombian per capita income grew at rates that are certainly not
comparable to the fastest-growing Asian economies. Still, despite an inevitable
slowdown from 2007 to 2009, Colombian per capita GNI grew annually at an
average of 5.3% between 2004 and 2013.
3. Following Coelho and Gallagher (2013), Colombia temporary introduced some
capital controls in order to tame booming capital inflows and reduce pressures on
real exchange rate appreciation from May 2007 to October 2008. These measures,
however, have proved to be too mild to reach their targets and thus have been lifted
since then.
4. See Ministry of Finance and Public Credit (2014a), ‘An Outlook of the Colombian
Economy’, freely available for download at
http://www.minhacienda.gov.co/HomeMinhacienda/saladeprensa/Presentaciones.
5. Increasing exploitation of domestic natural resources and high commodity prices are
usually associated to long-lasting current account surpluses, see Ojeda et al. (2014)
for example.
6. Goda and Torres (2013) perform an econometric analysis in order to test the
existence of any effects of FDI on Colombian real exchange rate and, in turn, on
manufacturing development. Their sample coverage runs from 1996 (first quarter) to
2012 (first quarter). On the one hand, they conclude that ‘net FDI and net other
inflows are the main drivers of the post-2003 capital inflow appreciation effect in
Colombia (Goda and Torres, 2013, p. 16)’. On the other hand, they find that real
exchange rate appreciation explains most of the de-industrialization episode
currently underway in Colombia.
7. Corden and Neary (1982) assume a Hicks-neutral technological progress to take
place in the energy sector, raising both labor and capital productivity in that sector.
Similar results could also be obtained if an increase of primary commodities’ prices
is assumed and the country under consideration is a net exporter of primary energy
commodities, or if there is an increase in the endowment of the natural resource
input specific to the energy sector.
Page 36
35
8. Torvik (2001) allows for different results by allowing for learning-by-doing to take
place in the non-tradable sector as well, and technological spill-over running both
ways (from manufacturing to services and vice versa).
9. Different conclusions with respect to the standard ‘Dutch disease’ literature can be
obtained when inter-temporal optimization and consumption smoothing is allowed
through financial market mechanisms. Mansoorian (1991), for instance, finds that a
real depreciation and an expanding manufacturing sector could emerge in the long
run as the optimal response to over-borrowing, real exchange rate appreciation and
de-industrialization in the short run. These conclusions reinforce those provided by
Bruno and Sachs, who stress that ‘optimizing far-sight households (and government)
will not consume all current oil revenues, but will rather save in anticipation of the
future decline […] to the extent that the current revenues overstate the ‘perpetuity
equivalent’ of oil earnings, a focus on current production levels overstates the
resource allocation consequences of the oil sector (Bruno and Sachs,1982, p. 858).’
10. Considering the interplay between financial and real factors in the analysis of Dutch
disease is not completely new. See, for instance, Blecker and Seccareccia (2008).
11. The debate on Colombian deindustrialization dates back to at least 1986, see Kamas
(1986).
12. Tregenna (2011) identifies three possible processes leading to de-industrialization as
measured by a reduction of the manufacturing employment share. First, a reduction
in labor-intensity (increase in labor productivity) coupled with a contraction of that
sector output; second, a reduction in labor-intensity that outweighs the expansion of
sector production; finally, the contraction of sectorial activity that outweighs the
increase in labor-intensity (decline in labor productivity). Such processes, all giving
rise to a lower manufacturing employment share, are likely to prompt different and
perhaps opposite effects on overall economic records. This is also the reason why
analogous trends in manufacturing employment in Asian and Latin American
economies, Colombia among them, have been often associated to diverging
economic performances. Whilst the former registered increasing manufacturing
value added shares and even stronger improvements in manufacturing labor
productivity, most Latin American economies experienced worrisome premature
reductions in manufacturing GDP shares, and dismal increases in labor productivity
by international standards. Indeed, ‘if a decrease in manufacturing employment
share is primarily accounted for by falling labor-intensity of manufacturing, this
Page 37
36
calls into question the extent to which ‘de-industrialization’ is an appropriate
characterization. The point is that a fall in the share of manufacturing employment
that is mostly accounted for by falling labor intensity (i.e. increasing labor
productivity) would not necessary have a negative impact on growth. This is
different from the case where the fall in the share of manufacturing employment is
associated primarily with a decline of the manufacturing sector as a share of GDP.
In such a scenario, an economy would be particularly at risk of losing out on the
growth-pulling effects of manufacturing (Tregenna, 2011, p.15).’
13. Variations in the sectorial employment share can be decomposed into three
elements: variations in the labor-intensity characterizing sector’s production (i.e. the
labor-intensity effect); variations in the sectorial GDP share (i.e. the sector share
effect); variations of overall labor productivity, which obviously affect overall
employment dynamics (i.e. the above labor-productivity effects). We can represent
the sectorial employment share (hence its variation) according to this formula:
!!"
!!
=!!"
!!"
∗!!"
!!
∗!!
!!
, Lit being employment level in sector i at time t, Yit sectorial
production at time t, Lt and Yt overall employment and production levels. It is worth
noting that the sectorial labor intensity (or the inverse of the labor productivity) is a
output-weighted average of each sub-sector labor intensities. Thus, a decrease in
labor productivity does not necessarily imply using a less efficient technology but
can be the result of a change of the output shares in favor of a more labor-intensive
sub-sector.
14. See UNCTAD (2014), ‘Manufactured goods by degree of manufacturing’, freely
available for download from http://unctadstat.unctad.org/EN/Classifications.html.
15. United States of America (22/11/2006), Chile (27/11/2006), Northern Triangle (El
Salvador, Guatemala and Honduras, 09/08/2007), Canada (21/11/2008), European
Free Trade Association (25/11/2011) and European Union (26/06/2012), source:
Organization of American State’s Foreign Trade Information System,
http://www.sice.oas.org.
16. In Figure 3, according to UNCTAD data, upward trends in the nominal and real
effective exchange rate indexes stand for appreciations. Depreciations are
represented by downward sloping sections in exchange rates dynamics.
17. According to data provided by the IMF (2014), from 2003 to 2012, Colombia has
experienced average inflation rates significantly lower than those observed in other
Page 38
37
emerging economies such as Brazil (1,6 percentage point less), India (2,6), South
Africa (0,8) and Turkey (5,7).
18. See IMF World Economic Outlook (April 2014). Data freely available from
http://www.imf.org.
19. The R source code and the datasets used to generate all graphs and econometric
results of this paper can be found on the website of one of the authors.
20. Unfortunately, we do not have detailed yearly values for the financial account and
Foreign Direct Investment but only averages over the time period.
21. It must be emphasized that, due to the mining-sector boom, the evolution of non-
primary exports over the last decade has been particularly disappointing. The share
of primary export (oil, coffee, flowers, bananas, etc.) in total exports rose from 74%
in 2001 to 81% in 2012 (Consejo Privado de Competitividad, 2013).
22. See Ocampo (2009) on the disruptive effects on the Colombian external account of a
possible reduction in the price of primary commodities.
23. Available at
http://www.doingbusiness.org/data/exploreeconomies/~/media/giawb/doing%20business/do
cuments/profiles/country/COL.pdf?ver=2
24. See
http://siteresources.worldbank.org/INTLAC/Resources/LAC_Infrastructure_execsu
mm_eng.pdf
References
Blecker, R.A. and M. Seccareccia (2008) – Would a North American monetary union
protect Canada and Mexico against the ravages of “Dutch disease”? A post-
financial crisis perspective - Paper prepared for “The Political Economy of
Monetary Policy and Financial Regulation: A Conference in Honor of Jane
D'Arista,” May 2-3, 2008, Political Economy Research Institute (PERI),
University of Massachusetts, Amherst, USA
Botta A. (2010) – Economic Development, Structural Change and Natural resource
Booms: A Structuralist Perspective, Metroeconomica, vol. 61 (3), pp. 510 – 539.
Bruno M. and Sachs J.D. (1982) – Energy and Resource Allocation: A Dynamic Model
of the “Dutch Disease”, Review of Economic Studies, vol. 49 (5), pp. 845 – 859.
Cabrera Galvis M.C. (2013) – Diez Años de Revaluación, Bogotà: Editorial Oveja
Negra.
Page 39
38
Claveijo C., Vera A. and Fandino R. (2014) – De-industrialization in Colombia:
Quantitative Analysis of the Determinants, ANIF Estudios Especiales 2014,
freely available for download from http://anif.co/node/10697.
Coelho B. and Gallagher K.P. (2013) – The effectiveness of capital controls: evidence
from Colombia and Thailand, International Review of Applied Economics,
vol.27 (3), pp. 386 – 403.
Chang H.J. (2010) – 23 Things They Don’t Tell You About Capitalism, London:
Penguin Books.
Consejo Privado de Competitividad (2013) – Informe Nacional de Competitividad
2013-2014, Bogotá, Colombia.
Corden W.M. and Neary J.P. (1982) – Booming Sector and De-industrialization in a
small open economy, The Economic Journal, vol. 92 (368), pp. 825 – 848.
DANE (2014) – DANE Supply and Uses Matrix Table, freely available for download
from https://www.dane.gov.co/index.php/cuentas-economicas/cuentas-anuales.
Dutt A.K. (1997) – The Pattern of Direct Foreign Investment and Economic Growth,
World Development, vol. 25 (11), pp. 1925 – 1936.
The Economist Intelligence Unit (2013) – Latin America as an FDI Hotspot:
Opportunities and Risks.
Gylfason T., Herbertsson T.T. and Zoega G. (1999) – A Mixed Blessing: Natural
Resources and Economic Growth, Macroeconomic Dynamics, vol. 3 (2), pp. 204
– 225.
Gylfason T. and Zoega G. (2006) – Natural Resources and Economic Growth: The Role
of Investment, The World Economy, vol. 29 (8), pp. 1091 – 1115.
Goda T. and Torres A. (2013) – Overvaluation of the Real Exchange rate and the Dutch
Disease: The Colombian Case, CIEF Working Paper n. 28-13.
Hausmman R. Hwang J. and Rodrik D. (2007) – What you export matters, Journal of
Economic Growth, vol. 12 (1), pp. 1 – 25.
Hernandez Jimenez G. and Razmi A. (2014) – Latin America after the global crisis: the
role of export-led and tradable-led growth regimes, International Review of
Applied Economics, vol.28 (6), pp. 713 – 741.
Kamas L. (1986) – Dutch Disease Economics and the Colombian Export Boom, World
Development, vol. 14 (9), pp. 1177 – 1198.
Imbs J. and Wacziarg R. (2003) - Stages of Diversification, American Economic
Review, vol. 93 (1), pp. 63-86.
Page 40
39
IMF (2014) – World Economic Outlook April 2014.
IMF (2015) – IMF Country Report on Colombia n. 15/142.
Mansoorian A. (1991) – Resource Discoveries and Excessive External Borrowing, The
Economic Journal, vol. 101 (409), pp. 1497-1509.
Manzano O. and Rigobon R. (2001) – Resource Curse or Debt Overhang, NBER
Working Paper n. 8390.
Missaglia M. (2012) - Finanza, Povertà e Tensioni Internazionali, in Strazzari F. (ed.),
Mercati di Guerra, il Mulino.
Missaglia, M. (2014) – Impacto de los TLC en los departamentos colombianos.
Consideraciones de Política Económica, Final Report, CID (Centro de
Investigaciones para el Desarrollo), Universidad Nacional de Colombia.
Ministry of Finance and Public Credit (2014a) – An Outlook of the Colombian
Economy, freely available for download at http://www.minhacienda.gov.co.
Ministero of Finance and Public Credit (2014b) – Marco Fiscal de Mediano Plazo, June
2014.
Ocampo, J. A. (1994) – Trade Policy and Industrialization in Colombia, 1967 – 91, in
Helleiner G.K. (ed.) – Trade Policy and Industrialization in Turbulent Times,
London and New York: Routhledge, pp. 132 – 169.
Ocampo J. A. (2009) – Performance and Challenges of the Colombian Economy, freely
available for download from http://policydialogue.org/publications.
Ocampo J. A. (2013) – Prologo, in Cabrera Galvis M.C. - Diez Años de Revaluación,
Bogotà: Editorial Oveja Negra.
OECD (2013) – OECD Economic Assessment of Colombia 2013, available from
www.oecd.org/Colombia.
Ojeda J.N., Parra-Polonia A. and Vargas C.O. (2014) – Natural-Resource Booms,
Fiscal Rules and Welfare in a Small Open Economy, Banco de la Republica
Colombiana Borradores de Economia n. 807.
Park Madison Partners (2013) – Colombia’s Rise: A Primer for International Investors,
freely available for download from http://www.parkmadisonpartners.com/cgi-
bin/news.pl.
Rodrik D. (2007) – Industrial Development: Some Stylised Facts and Policy
Directions”, in UN-DESA (ed.), Industrial Development for the 21st Century:
Sustainable Development Perspectives, New York: UN Publishing.
Page 41
40
Ros J. (2001) – Industrial Policy, Comparative Advantages and Growth, CEPAL
Review, vol. 73, pp. 127 – 145.
Sachs J.D. and Warner A.M. (1995) – Natural Resource Abundance and Economic
Growth, NBER Working Paper n. 5398.
Sachs J.D. and Warner A.M. (1999) – The Big Push, Natural resource Booms and
Growth, Journal of Development Economics, vol. 59 (1), pp. 43-76.
Sachs J.D., and Warner A.M. (2001) – The Curse of natural resources, European
Economic Review, vol. 45 (4), pp. 827-838.
Singh A. (2003) – Capital Account Liberalization, Free long-term Capital Flows,
Financial Crises and Economic Development, Eastern Economic Journal, vol.
29 (2), pp. 191 – 216.
Szirmai (2012) – Industrialization as an Engine of Growth in Developing Countries,
1950 – 2005, Structural Change and Economic Dynamics, vol. 23 (4), pp. 406 –
420.
Taylor L. (2004) – Reconstructing Macroeocnomics: Structuralist Proposals and
Critiques to the Mainstream, Harvard University Press.
Torvik R. (2001) – Learning by Doing and the Dutch Disease, European Economic
Review, vol. 45 (2), pp. 285-306.
Tregenna F. (2011) - Manufacturing Productivity, Deindustrialisation and
Reindustrialisation, UNU-WIDER, Working Paper No. 2011/57.
UNCTAD (2006) – Investment Policy Review: Colombia. Geneva: United Nations
Press.
UNCTAD (2014) – Manufactured goods by degree of manufacturing, freely available
for download from http://unctadstat.unctad.org/EN/Classifications.html.