Greenwich Academic Literature Archive (GALA) – the University of Greenwich open access repository http://gala.gre.ac.uk __________________________________________________________________________________________ Citation for published version: Qin, Wenjie, Tang, Sanyi and Cheke, Robert A. (2013) Nonlinear pulse vaccination in an SIR epidemic model with resource limitation. Abstract and Applied Analysis, 2013:670263. ISSN 1085-3375 (Print), 1687-0409 (Online) (doi:10.1155/2013/670263) Publisher’s version available at: http://dx.doi.org/10.1155/2013/670263 __________________________________________________________________________________________ Please note that where the full text version provided on GALA is not the final published version, the version made available will be the most up-to-date full-text (post-print) version as provided by the author(s). Where possible, or if citing, it is recommended that the publisher’s (definitive) version be consulted to ensure any subsequent changes to the text are noted. Citation for this version held on GALA: Qin, Wenjie, Tang, Sanyi and Cheke, Robert A. (2013) Nonlinear pulse vaccination in an SIR epidemic model with resource limitation. London: Greenwich Academic Literature Archive. Available at: http://gala.gre.ac.uk/10874/ __________________________________________________________________________________________ Contact: [email protected]
Transcript
Greenwich Academic Literature Archive (GALA)– the University of Greenwich open access repository
Qin, Wenjie, Tang, Sanyi and Cheke, Robert A. (2013) Nonlinear pulse vaccination in an SIR epidemic model with resource limitation. Abstract and Applied Analysis, 2013:670263. ISSN 1085-3375 (Print), 1687-0409 (Online) (doi:10.1155/2013/670263)
Please note that where the full text version provided on GALA is not the final published
version, the version made available will be the most up-to-date full-text (post-print) version as
provided by the author(s). Where possible, or if citing, it is recommended that the publisher’s
(definitive) version be consulted to ensure any subsequent changes to the text are noted.
Citation for this version held on GALA:
Qin, Wenjie, Tang, Sanyi and Cheke, Robert A. (2013) Nonlinear pulse vaccination in an SIR epidemic model with resource limitation. London: Greenwich Academic Literature Archive.Available at: http://gala.gre.ac.uk/10874/
Hindawi Publishing CorporationAbstract and Applied AnalysisVolume 2013, Article ID 670263, 13 pageshttp://dx.doi.org/10.1155/2013/670263
Research Article
Nonlinear Pulse Vaccination in an SIR Epidemic Modelwith Resource Limitation
Wenjie Qin,1 Sanyi Tang,1 and Robert A. Cheke2
1 College of Mathematics and Information Science, Shaanxi Normal University, Xi’an 710062, China2Natural Resources Institute, University of Greenwich at Medway, Central Avenue, ChathamMaritime, Chatham, Kent ME4 4TB, UK
Mathematical models can assist in the design and understanding of vaccination strategies when resources are limited. Here wepropose and analyse an SIR epidemicmodelwith a nonlinear pulse vaccination to examine how a limited vaccine resource afects thetransmission and control of infectious diseases, in particular emerging infectious diseases.he threshold condition for the stabilityof the disease free steady state is given. Latin Hypercube Sampling/Partial Rank Correlation Coeicient uncertainty and sensitivityanalysis techniques were employed to determine the key factors which are most signiicantly related to the threshold value.Comparing this threshold value with that without resource limitation, our results indicate that if resources become limited pulsevaccination should be carried out more frequently than when suicient resources are available to eradicate an infectious disease.Once the threshold value exceeds a critical level, both susceptible and infected populations can oscillate periodically. Furthermore,when the pulse vaccination period is chosen as a bifurcation parameter, the SIR model with nonlinear pulse vaccination revealscomplex dynamics including period doubling, chaotic solutions, and coexistence of multiple attractors. he implications of ourindings with respect to disease control are discussed.
1. Introduction
Epidemiology is the study of the spread of diseases withthe objective of tracing factors that are responsible for orcontribute to their occurrence and serves as the foundationand logic of interventionsmade in the interest of public healthand preventive medicine. Mathematical models describingthe population dynamics of infectious diseases have playedan important role in better understanding epidemiologicalpatterns and disease control for a long time. Various epidemicmodels have been proposed and explored extensively andconsiderable progress has been achieved in the studies ofdisease control and prevention (see [1–3] and the referencestherein).
Outbreaks of infectious diseases have not only causedthe loss of billions of lives but have oten also rapidly dam-aged social economic systems, bringing about much humanmisery. Consequently, the focus of our research has beenon how to prevent and cure infectious diseases efectively.It is well known that one of the most important concerns
in the analysis of epidemic logical models is the eicacy ofvaccination programmes. his subject gained prominence asa result of highly successful application of vaccinations forthe worldwide eradication of smallpox and the restriction ofdiseases such as poliomyelitis, measles, tetanus, diphtheria,pertussis, and tuberculosis. Vaccination is one of the mostcost efective of health investments as it can prevent orameliorate morbidity due to infections. he efectiveness ofvaccination has been widely studied and veriied for theinluenza vaccine [4], the HPV vaccine [5], the chicken poxvaccine [6], and others.
In particular, Agur et al. [7] irst proposed a pulse vaccina-tion strategy (PVS),which consists of periodical repetitions ofimpulsive vaccinations of all the age cohorts in a population,which has been conirmed as an important and efectivestrategy for the elimination of infectious diseases. At eachvaccination time a constant fraction � of susceptible people isvaccinated. his kind of vaccination is called impulsive sinceall the vaccine doses are applied within a very short time,with respect to the dynamics of the target disease. PVS allows
2 Abstract and Applied Analysis
the eradication of a disease with some practical advantages,as discussed in [7–9]. Recently, epidemic models with pulsevaccination have been the subject of intense theoreticalanalysis. For example, the dynamical behaviors of variousepidemic models with PVS are studied in [8, 10–13]. hetheoretical results show that PVS can be distinguished fromthe conventional strategies in leading to disease eradicationat relatively low values of vaccination (see [7]).
Traditional epidemic models with PVS of populationdynamics have assumed that the pulse vaccination propor-tion � is constant, which implies that medical resourcessuch as drugs, vaccines, hospital beds, and isolation unitsare suicient for the infectious disease in question. However,in reality, every community or country has an appropriateor limited capacity for treatment, especially for emerginginfectious diseases, and so understanding resource limitationis critical to efective management.
During the last decade, the outbreaks of SARS in 2003and avian inluenza among humans (H5N1 in 2003, H1N1 in2009, andH7N9 in 2013) emphasized the need to enhance thecapacity to ight emerging infectious diseases, which remainsa challenge for public health. Several diferent vaccines havebeen developed speciically targeting avian inluenza amonghumans, but limited production has exposed weaknesses[14–16]. A lack of suicient vaccine at the outset of a newpandemic is to be expected, given the crucial lag betweenthe timing of the emergence of a new strain and when avaccine has been developed and is ready for distribution.Although most vaccination programmes aim to vaccinate asmany susceptible individuals as possible, this is not always thecase for emerging infectious diseases due to limited vaccineavailability, particularly in developing countries.
However, resource limitation is diicult to quantify partlybecause it is a dynamic process (see [17]). Recently, continu-ous SIR models concerning limited medical resources havebeen developed and investigated (see [18, 19]). Chow et al.[18] explored the dynamics of an SIR epidemic model tounderstand how limited medical resources and their supplyeiciency afect the transmission of infectious diseases. Zhouand Fan [19] studied a multigroup SIR epidemiologicalmodel to explore the efects of limited medical resourcesand group-targeted vaccination strategies on disease controland prevention. To the best of our knowledge, no workhas been done for the efects of resource limitation on anSIR model with PVS. In order to investigate the efect oflimited vaccine availability on the spread of infectious disease,a saturation phenomenon of limited medical resources isconsidered.hat is, we will study the dynamic behavior of anSIR epidemic model with nonlinear pulse vaccination. Suchmathematical models are suitable for simulating processeswith short duration perturbations during their development(see [20]).
In this paper, the dynamical behavior of an SIR epidemicmodel with nonlinear pulse vaccination is proposed and ana-lyzed. he main purpose is to address and understand how alimited vaccine resource afects the transmission and controlof infectious diseases. he rest of this paper is organized asfollows. In the next section, an SIR epidemic model withnonlinear PVS is introduced. In Section 3, we investigate the
existence and stability of the disease-free periodic solutionby using the method of diferential inequality, qualitativeanalysis, a discrete dynamical system determined by the stro-boscopic map, and comparison theorem. Meanwhile, LatinHypercube Sampling (LHS)/Partial Rank Correlation Coef-icients (PRCCs) uncertainty and sensitivity analysis tech-niques are employed to investigate the key control parameterswhich are most signiicantly related to threshold values (see[21–23]). Section 4 focuses on inding the suicient conditionunderwhich the endemic periodic solution exists by using thebifurcation theorem. he paper ends with some interestingbiological conclusions and numerical bifurcation analyses,which complement the theoretical indings.
2. Model Formulation
In the classical epidemiological model (see [24–26]), the totalpopulation � is composed of three groups of individuals:susceptible (�), infective (�), and recovered (�). Let �(�)denote the number ofmembers of a population susceptible tothe disease at time �; �(�) represents the number of infectivemembers; and �(�) denotes the number of members whohave been removed from the population. his leads to thefollowing SIR model:
d� (�)d� = � − �� (�) � (�) − �� (�) ,
d� (�)d� = �� (�) � (�) − �� (�) − �� (�) ,
d� (�)d� = �� (�) − �� (�) .
(1)
In model (1), we assume that the three classes of subpop-ulations have the same constant birth and death rates �(i.e., the total population has a constant size), which can benormalized to unity; that is,�(�) = �(�)+ �(�)+�(�) = 1, andthe infectious individuals recover at a rate � > 0, so that 1/�is the mean infectious period. Susceptibles become infectedat a rate ��, where � > 0 is the transmission rate. In practice,the equation for d�(�)/d� is redundant because �(�) can beobtained from�(�) = 1. A detailed description of model (1)and its dynamics may be found in [9, 27, 28].
Let � > 0 be the time between two consecutive pulsevaccinations and let �(�) (0 ≤ �(�) < 1) be the fraction ofsusceptible subjects who are inoculated with vaccine, whichdepends on the number of susceptibles in the population attime �. his yields the following model with PVS [8, 9]:
Table 1: Parameter deinitions, values and source for model (4).
Parameter Deinition Value Source� Rate of natural birth or death rate of the population (year−1) 0.02 [33]� Probability of transmission per contact (year−1) 1800 [33]� Natural recovery rate of the infective individuals (year−1) 100 [33]�max
hemaximal vaccination proportion (year−1) [0, 1) [8, 9]� he half saturation constant [0, 1] Assumption� Period of pulse vaccination (year) [0, 20] [8, 9]
he formula for �(�) plays a key role in investigating theefect of the limited capacity for treatment on the spread ofinfectious disease. To do this we assume, without loss of gen-erality, that the PVS is implemented in a developing countrybut one in which vaccines are relatively abundant. Note thatthere are oten major shortages of medical personnel in ruralareas and in certain specialities such as surgery, paediatrics,and obstetrics [14]. Let vaccination pulses occur every � timeunits. When a pulse day occurs, the medical personnel haveto go out into the rural population and vaccinate as manysusceptibles as they can ind on that particular day. If thereare very few susceptibles, then it will be hard to ind them, sothe vaccination coverage will be low. he more susceptiblesthere are, the easier it is to ind them, so the coverage per pulsewill be greater. But there is a limit to how fast the medicalteam can ind and handle each susceptible, and this causesthe vaccination rate �(�) to saturate, that is, a saturationphenomenon of limited medical resources. By employingthe Holling type II functional response for a predator-preymodel, we can deine �(�) as follows:
� (�) = �max� (�)� (�) + � , 0 ≤ �max < 1, (3)
where �max denotes the maximal vaccination proportion and� is the half saturation constant. Note that the vaccinationcoverage is less than 100% and in practice a vaccine eicacyis also less than 100%, which lead to the parameter �max < 1.Furthermore generalized formulae such as the Hill function[29] can be employed to characterize the saturation phe-nomenon of the limited medical resources.
Taking into account the resource limitation and satura-tion efects, for convenience and simpliication, then model(2) can be rewritten as
where the parameters �, �, �, and �max, � are deined in mod-els (1) and (3), respectively. Note that model (4) is reduced tothe classical SIRmodel with constant pulse vaccination when� = 0, which was investigated by Agur et al. [7], Stone et al.
[8], and Shulgin et al. [9].he parameter deinitions of model(4) are summarized in Table 1.
3. Existence of the Disease-FreePeriodic Solution
We irst demonstrate the existence of a disease-free periodicsolution of model (4), in which infectious individuals areentirely absent from the population permanently; that is,�(�) = 0 for a suiciently long time. Under some thresholdconditions, we show below that the susceptible populationoscillates with period � in synchronization with the periodicpulse vaccination and the infectious class will die out eventu-ally.hus, in this section, we focus on determining the globalattraction of this disease-free periodic solution. To addressthis, we irst consider the following submodel over the timeinterval �� < � ≤ (� + 1)�:
which is the so-called stroboscopic map of model (5), and itdescribes the relations of the number of susceptibles in thepopulation between any two successive pulse vaccinations.Consequently, the existence of the positive steady state ofmodel (9) implies the existence of a positive periodic solutionof model (5). herefore, we irst discuss the conditions whichguarantee the existence of a positive steady state of (9). Takingthe derivative of �(��) with respect to �� yields�� (��) = {(1 − �max) + �max�2[(�� − 1) e−�� + 1 + �]2} e−��,
(10)
and it is easy to see that 0 < ��(��) < 1 holds true.For convenience, we denote the positive ixed point of
the stroboscopic map (9) by �, which satisies the followingequation:
Obviously, (11) has a unique positive root; that is,
� = −�1 + √�21 − 4�1�12�1 , (13)
which is stable due to 0 < ��(�) < 1.According to the above discussion on the relations
between a ixed point of the stroboscopic map (9) and theperiodic solution of model (5), we conclude that the sub-model (5) has a unique nontrivial positive periodic solutiondenoted by �∗(�), and�∗ (�) = (� − 1) e−�(�−��) + 1, for �� < � ≤ (� + 1) � (14)
and it follows from 0 < ��(��) < 1 and [30] that we have thefollowing lemma.
Lemma 1. Model (5) has a positive periodic solution �∗(�), andfor any solution �(�) of (5), we have |�(�) − �∗(�)| → 0 as� → +∞.
0 2 4 6 8 100
1
2
3
4
5
6
T
T0max
� = 0.4
� = 0.2
� = 0.3
� = 0.1
� = 0
R1 0
Figure 1: he efects of resource limitation parameter � and pulsevaccination period � on the threshold value �10 with �max
= 0.75.All other parameter values are given in Table 1.
By using Lemma 1, we have thus shown that the unique
ixed point � of (9) is globally stable.In the following, we will present the suicient condition
for the global attraction of the disease-free periodic solution(�∗(�), 0) of model (4).
heorem 2. he disease-free periodic solution (�∗(�), 0) ofmodel (4) is globally asymptotically stable in the irst quadrant
Note that although the threshold value �10 depends onall parameters of model (4), the most interesting parametershere are pulse vaccination period �, maximum proportion ofpulse vaccination �max, and the parameter related to resourcelimitation, that is, �. In order to address how those factors (�and �) afect the threshold value �10, we irst note that
lim�→0
�10 = lim�→0
� [(� − 1) (1 − e−��) + ��]�� (� + �) = 0, (16)
which indicates the importance of the frequency of vaccina-tion in eradicating an infectious disease.hen letting � and �vary and ixing all other parameters as those in Figure 1, we
see that the threshold value �10 is a monotonically increasingfunction of � for ixed �, and it is a monotonically increasingfunction of � for ixed period �. Moreover, there are somecritical values of � and � such that �10 = 1, which indicatethat there exists one maximum allowable period of pulse
vaccination ��max
such that �10 < 1 for all � < ��max. Moreover,
the larger � the smaller the value that��max
has. Unfortunately,
Abstract and Applied Analysis 5
we cannot get its analytical expression due to the complexity
of �10. So we turn to ind some approximations for ��max
in thefollowing.
If the PVS is applied frequently enough such thatd�(�)/d� ≤ 0 for all � > 0 in model (4), then the numberof infectious individuals is a decreasing function of time. Itis possible to satisfy this condition if pulsing ensures that�(�) ≤ �� ≐ (� + �)/� for all �; that is, pulse vaccinationis applied every time once the �(�) approaches the thresholdvalue �� (see [7, 27] and the references therein).
It follows from the irst equation of model (4) that
is amonotonically decreasing function with respect to �, whichgives that ��
max< �0
max. his theoretical result indicates that if
we aim to eradicate an infectious disease, then it is necessaryto carry out pulse vaccination programs more frequentlyunder resource limitation than when necessary resourcesare available. When various nonlinear factors including�max, � are seriously considered, our results show that it isgetting more and more diicult to eliminate the endemicdiseases. It also conirms that getting vaccinated is by farthe most efective action that susceptibles can take to protect
themselves and their family from infectious disease. Otheroptions available to health practitioners in response to limitedmedical resources include the release of prescriptive healtheducation, training vaccinators, and promoting the use ofvaccine-delivery patchwith dissolvingmicroneedles (see [14–16] for details).
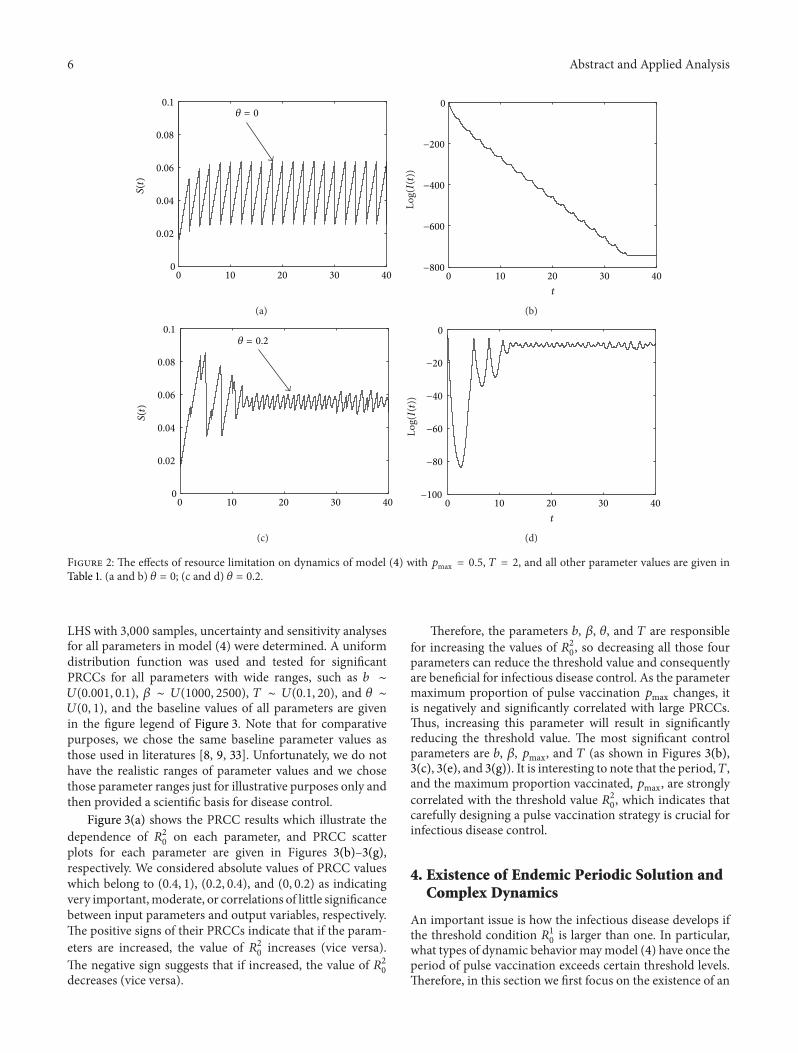
A typical solution of the SIR model with a nonlinearpulse vaccination strategy is shown in Figure 2, where weobserve how the variable �(�) oscillates in a stable cycle(as shown in Figure 2(a)). In contrast, the infection �(�)rapidly decreases to zero (Figure 2(b)) if we set � = 0.hat is, without resource limitation the infectious diseaseis eventually eradicated (Figure 2(b)). However, if there isresource limitation, that is, the parameter � is larger thanzero, then both susceptible and infected populations oscillateperiodically, as shown in Figures 2(c) and 2(d) with � = 0.2.
herefore, if we have enough vaccine and vaccinators tocombat the infectious disease, then it is reasonable that thesusceptible population vaccinated each time is assumed to beproportional to the number of susceptible individuals (here�max). However, this approximation cannot relect the realcase if we aim to mitigate the emerging infectious disease.Usually, the number of susceptible individuals needing tobe vaccinated may exceed the capacity of local medicalconditions due to shortages of vaccine and doctors, especiallyin rural areas in many developing countries, where reachingall of the target population may be diicult. For instancein 2010 in Lesotho, diphtheria, tetanus toxoid and, pertussis(DTP3) immunization coverage among 1-year-olds was only83% (but an improvement on 78% in 2001, see [31]) and boththe measles and tuberculosis (BCG) vaccination programswere hampered by supplies of vaccine running out in someparts of the country and then allowing vaccinations only forchildren born in hospitals and not for those born elsewherein the communities. hus, it is important to design pulsevaccination campaigns carefully. For example, how frequentlyshould the vaccination strategy be applied? And how can thesize of the susceptible population be evaluated?hose are keyissues for evaluating vaccination coverages and the distribu-tion of vaccines. herefore, with the help of mathematicalmodels the vaccination strategy can be properly designed.
It is well known that in order to eradicate an infectiousdisease, the vaccination strategy must be designed such that
the threshold value �10 is less than 1, which is equivalent to�20 < 0, where�20 = � (� − 1) (1 − e−��)� + (� − � − �) �. (23)
In the following we employ the formula �20 to investigatethe important factors which afect the threshold values mostsigniicantly by using uncertainty and sensitivity analysis(see [21, 22, 32]). Sensitivity analysis of the most signiicantparameters including the birth or death rate (�), the contactrate (�), the maximum proportion vaccinated (�max), and thepulse vaccination period (�) was performed by evaluatingthe PRCCs for various input parameters against the threshold
condition �20 with the LHS method [21, 22, 32]. By using
6 Abstract and Applied Analysis
0 10 20 30 400
0.02
0.04
0.06
0.08
0.1
S(t)
� = 0
(a)
0 10 20 30 40−800
−600
−400
−200
0
t
Log(I(t))
(b)
0 10 20 30 400
0.02
0.04
0.06
0.08
0.1
S(t)
� = 0.2
(c)
0 10 20 30 40−100
−80
−60
−40
−20
0
t
Log(I(t))
(d)
Figure 2: he efects of resource limitation on dynamics of model (4) with �max
= 0.5, � = 2, and all other parameter values are given inTable 1. (a and b) � = 0; (c and d) � = 0.2.
LHS with 3,000 samples, uncertainty and sensitivity analysesfor all parameters in model (4) were determined. A uniformdistribution function was used and tested for signiicantPRCCs for all parameters with wide ranges, such as � ∼�(0.001, 0.1), � ∼ �(1000, 2500), � ∼ �(0.1, 20), and � ∼�(0, 1), and the baseline values of all parameters are givenin the igure legend of Figure 3. Note that for comparativepurposes, we chose the same baseline parameter values asthose used in literatures [8, 9, 33]. Unfortunately, we do nothave the realistic ranges of parameter values and we chosethose parameter ranges just for illustrative purposes only andthen provided a scientiic basis for disease control.
Figure 3(a) shows the PRCC results which illustrate the
dependence of �20 on each parameter, and PRCC scatterplots for each parameter are given in Figures 3(b)–3(g),respectively. We considered absolute values of PRCC valueswhich belong to (0.4, 1), (0.2, 0.4), and (0, 0.2) as indicatingvery important,moderate, or correlations of little signiicancebetween input parameters and output variables, respectively.he positive signs of their PRCCs indicate that if the param-
eters are increased, the value of �20 increases (vice versa).
he negative sign suggests that if increased, the value of �20decreases (vice versa).
herefore, the parameters �, �, �, and � are responsible
for increasing the values of �20, so decreasing all those fourparameters can reduce the threshold value and consequentlyare beneicial for infectious disease control. As the parametermaximum proportion of pulse vaccination �max changes, itis negatively and signiicantly correlated with large PRCCs.hus, increasing this parameter will result in signiicantlyreducing the threshold value. he most signiicant controlparameters are �, �, �max, and � (as shown in Figures 3(b),3(c), 3(e), and 3(g)). It is interesting to note that the period,�,and the maximum proportion vaccinated, �max, are strongly
correlated with the threshold value �20, which indicates thatcarefully designing a pulse vaccination strategy is crucial forinfectious disease control.
4. Existence of Endemic Periodic Solution andComplex Dynamics
An important issue is how the infectious disease develops ifthe threshold condition �10 is larger than one. In particular,what types of dynamic behavior maymodel (4) have once theperiod of pulse vaccination exceeds certain threshold levels.herefore, in this section we irst focus on the existence of an
Abstract and Applied Analysis 7
−1
−0.5
0
0.5
1
b � � � T
PRCCs
pmax
(a)
−2000 −1000 0 1000−2000
−1000
0
1000
2000 [0.72346, 0]
b
R2 0
(b)
−2000 −1000 0 1000−2000
−1000
0
1000
2000 [0.5492, 0]
�
R2 0
(c)
−2000 −1000 0 1000−2000
−1000
0
1000
2000
�
R2 0
[−0.12283, 1.4766e − 011]
(d)
−2000 0 2000−2000
−1000
0
1000
2000 [−0.71273, 0]
R2 0
pmax
(e)
−2000 −1000 0 1000−2000
−1000
0
1000
2000 [0.04117, 0.024135]
R2 0
�
(f)
−2000 0 2000−2000
−1000
0
1000
2000 [0.91801, 0]
T
R2 0
(g)
Figure 3: PRCC results and PRCC scatter plots of the baseline parameters as those shown in Table 1. Here we ix �max
= 0.75, � = 0.2, � = 5.(a) PRCC results. (b–g) PRCC scatter plots. he title of each plot represents the PRCC value with the corresponding P value.
endemic periodic solution, that is, to investigate under whatconditions will the infected population oscillate periodicallywith small amplitude, and then we choose the period ofpulse vaccination as a bifurcation parameter to investigate thecomplex patterns of the infectious disease dynamics.
Next, we analyze the existence of an endemic periodicsolution of model (4) near the disease-free periodic solution(�∗(�), 0) using bifurcation theory [34] and set the impulsiveperiod � as bifurcation parameter. For ease of narrative, werewrite the model (4) as
where �3 = 1 − �max + ((�2�max)/(� + �∗(�0))2), then thereexists a supercritical branch at the point �0.
8 Abstract and Applied Analysis
5 10 15 200.02
0.04
0.06
0.08
0.1
T
S(t)
(a)
2 4 6 8 100.04
0.05
0.06
0.07
0.08
T
S(t)
(b)
5 6 7 8 9 100.05
0.055
0.06
0.065
0.07
T
S(t)
(c)
7 7.5 80.05
0.055
0.06
0.065
0.07
T
S(t)
(d)
Figure 4: Bifurcation diagrams of model (4) with respect to bifurcation parameter �. Here �max
= 0.75 and all other parameter values aregiven in Table 1. (a) � = 0 which are reproduced from [9]; (b) � = 0.2; (c and d) a magniied part of Figure 4(b).
he existence of �0 has been indicated in Figure 1 and theproof ofheorem 3 is given in Appendix B.heorem 3 showsthat there exists an endemic periodic solution under someconditions, providing that the disease-free periodic solutionbecomes unstable. It follows from heorem 3 that if � > �0and is close to �0, the endemic periodic solution of model (4)is stable.
To investigate the complex dynamics that model (4) canhave, we chose the pulse period � as a bifurcation parameterand ixed all other parameters as those in Figure 4 for twodiferent � values. Figure 4(a) is a bifurcation diagram with-out resource limitation; that is, � = 0, which was obtainedby Shulgin et al. [9]. Figure 4(b) is a bifurcation diagramwith resource limitation; that is, � = 0.2. Comparing thosetwo bifurcation diagrams we conclude that the nonlinearpulse vaccination can produce more complex dynamics thanthose for the model with linear pulse vaccination. Once the
pulse period � exceeds ��max
deined in (22), both susceptibleand infected populations can oscillate periodically with alarge amplitude that corresponds to periodic outbreaks ofepidemics. As the pulse period is further increased, a series ofcomplex and interesting bifurcation phenomena are observed(see Figures 4(a) and 4(b)). Figures 4(b)–4(d) indicate thatthe dynamical behavior of model (4) is very complex,including period doubling bifurcation, chaotic attractors,
multistability, periodic-adding, chaos crisis, and periodicwindows.Meanwhile, bifurcation analyses (i.e., Figures 4(b)–4(d)) also indicate that the model (4) has several diferentattractors which can coexist for a wide range of parameters.For example, Figure 5 provides an example of two attractorcoexistence when � = 7.8. Multiple attractor coexistenceindicates that the infectious outbreak patterns depend onthe initial values, which may cause diiculties for infectiousdisease control.
5. Discussion and Biological Conclusions
In order to understand the efect of resource limitation, inparticular lack of vaccine, on the transmission of infectiousdisease, we deliberately investigated the dynamical behaviorof an SIR epidemic model which incorporates a nonlinearpulse vaccination strategy. To this end, we introduced anonlinear form �(�) = (�max�(�))/(�(�) + �) as vaccinationproportion.his resulted in interesting and dramatic changesin the dynamical behavior of solutions and they becamemoreand more complicated, which means that it is a very diiculttask to control infectious diseases, in particular emerginginfectious diseases, under resource limitation. We discussedthe control strategy based on the threshold value in moredetail through theoretical analysis, numerical studies, and
Abstract and Applied Analysis 9
100 110 120 130 140 1500.04
0.045
0.05
0.055
0.06
0.065
t
S(t)
(a)
100 110 120 130 140 150−13
−12
−11
−10
−9
−8
−7
t
Lo
g(I(t)
)
(b)
100 110 120 130 140 1500.04
0.045
0.05
0.055
0.06
0.065
t
S(t)
(c)
100 110 120 130 140 150−16
−14
−12
−10
−8
−6
t
Lo
g(I(t)
)
(d)
Figure 5: Coexistence of two stable attractors of model (4). Here �max
= 0.75, � = 0.2, � = 7.8, and all other parameter values are given inTable 1. (a and b) he initial value (�0, �0) = (0.12, 0.05); (c and d) the initial value (�0, �0) = (0.1, 0.02).sensitivity analysis. As pointed out byAgur et al. [7], the costs,risks, and the eicacy of the pulse vaccinations are key factorsin eliminating transmission of the measles virus. In orderto depict those factors, the nonlinear resource limitationsshould be taken into account [9], and the main purpose ofthe present work is to formulate the disease model to addressthe efects of resource limitations on disease control.
he results indicate that vaccination as an approach tocontrolling epidemics must be committed to a long-termstrategy, especially when resources arelimited. To understandthe interactions amongst �(�) and �(�) which are importantfor successful control of the spread of infectious disease,we have proposed detailed modeling methods involvingvaccination on �(�) and determining the most signiicant
parameters for the basic reproductive number �20 by usingLHS/PRCC uncertainty and sensitivity analysis techniques(see Figure 3). Our results indicate that we should paymore attention to the vaccination period and vaccinationproportion which reduce the threshold value �20 or �10 toprevent the outbreak of disease. Our results clarify that itis more signiicant to improve immunization programs (i.e.,vaccinations as mentioned in [15, 16]) under conditions ofresource limitation.
he results also indicate that the dynamic behavior ofmodel (4) may be dramatically afected by small changes in
the value of initial densities of susceptible and infected withresource limitation. Bifurcation diagrams shown in Figure 4indicate that there are many forms of complexities in model(4), which are related to chaotic bands with periodic win-dows and attractor crises, and Figure 5 reveals that theoccurrence of multiple attractors is a common property ofthe SIR model with resource limitation, which can help usto further understand the application of a nonlinear pulsevaccination strategy in an SIR model (for more informationabout bifurcation diagrams of impulsive control strategies,see [35, 36]). Some complexities are related to the long-termbehavior of population dynamics, characterized either bywell behaving relatively simple or very complicated strangeattractors. We also found that the routes to chaos are verycomplicated. For instance, with resource limitation there areseveral hidden factors that can adversely afect the controlstrategy. he increasing number of potential complexitiespredicted by the theory does not seem to make this taskany easier. Nevertheless, identifying complicated, possiblychaotic, dynamics in population data has remained a majorchallenge in epidemiology studies. In particular, the sug-gestion that the dynamics of measles are chaotic has beenmuch debated (e.g., see [37]) and, when seeking to establishwhether measles dynamics in New York City were chaoticor not, Sugihara and May [38] omitted data from ater 1963when vaccinations were introduced, as the immunisations
10 Abstract and Applied Analysis
had altered the intrinsic dynamics. However, our resultsimply that even with immunisations, disease dynamics couldbe chaotic under some circumstances and so a reanalysis ofthe New York data including the vaccination period might beworthwhile.
In the present paper, we have focused on studyingthe efects of dynamical behaviors on the SIR model withnonlinear pulse vaccination. For our simple model, we haveassumed that the maximal vaccination proportion �max isa constant and the pulse period � can be varied. However,due to limited vaccine availability, the maximal vaccinationproportion �max should depend on the vaccine obtained ineach pulse period. hus, to describe the impact of a limitedvaccine stockpile, a separate diferential equation for theamount of vaccine, denoted by �(�), could be included inthe model, and then �(�) should be a function of �(�) and�(�). Meanwhile, it is essential to link the costs of developingand implementing controls to population dynamic modelingof disease epidemics in order to consider other resourcelimitations such as quantities of drugs, availability of isolationunits, numbers of hospital beds, and equipment.hese topicswill be considered in further work in the future.
Appendices
A. Proof of Theorem 2
Firstly, we prove the local stability of a periodic solution(�∗(�), 0), which may be determined by considering thebehavior of small amplitude perturbations of the solution.
Deine
� (�) = � (�) + �∗ (�) , � (�) = � (�) , (A.1)
here�(�), �(�) are small perturbations, whichmay be writtenas
It is obvious that 0 < �1 < 1. hus, the stability of (�∗(�), 0)is decided by whether �2 < 1 or not. So we conclude thatthe disease-free periodic solution (�∗(�), 0) is locally stable if∫�0 (��∗(�) − � − �)d� < 0; that is,1� ∫�
From Lemma 1 and the comparison theorem on impul-sive diferential equations, we have �(�) ≤ �(�) and �(�) →�∗(�) as � → +∞. Hence, there exists a �1 > 0 such that
� (�) ≤ � (�) < �∗ (�) + �1, (A.13)
for all � ≥ �1; here �1 > 0 is small enough.From the second equation of model (4) and (A.13) we get
where �1(0) = �1(0+) > 0, we obtain lim�→∞�1(��) =0 according to (A.10). On the other hand, integrating andsolving the irst equation of model (A.15) between pulses, itgives
due to �10 < 1, we have lim�→∞�1(�) = 0.Let (�(�), �(�)) be any solution of model (4) with initial
value (�0, �0), and �0 = �(0+) > 0, �0 = �(0+) =�1(0) > 0, according to the comparison theorem we havelim�→∞ sup �(�) ≤ lim�→∞ sup�1(�) = 0. Incorporating intothe positivity of �(�), we know that lim�→∞�(�) = 0.
Consequently, there exists a �2 > �1 such that 0 < �(�) ≤ �2for � ≥ �2, and �2 is small enough. Further, we have
By employing the same methods as used for the proof ofLemma 1 we get that the model (A.20) has a positive periodicsolution �∗2 (�), which is globally attractive, where
It follows from the comparison theorem on impulsive difer-ential equations that �2(�) ≤ �(�) ≤ �(�). Moreover, �2(�) →�∗2 (�) and �(�) → �∗(�) as � → +∞. Consequently, thereexists a �3 for �3 small enough such that �3 ≥ �2 and�∗2 (�) − �3 < � (�) < �∗ (�) + �3 (A.22)
for � ≥ �3. Let �2 → 0. hen
�∗ (�) − �3 < � (�) < �∗ (�) + �3. (A.23)
herefore, �(�) → �∗(�) as � → +∞. hus, wehave proved the global stability of the disease-free periodicsolution (�∗(�), 0) of model (4). his completes the proof.
B. Proof of Theorem 3
In order to apply the bifurcation theory of [34] in the maintext, we make the following calculations:
��0 = 1 − e∫�00 (��
∗(�)−�−�)d�. (B.1)
If ��0 = 0, then �0 satisies the following equation:� [(� − 1) (1 − e−��0) + ��0]� (� + �) �0 = 1, (B.2)
12 Abstract and Applied Analysis
which indicates that there exists a�0 such that �10 = 1 and thedisease-free periodic solution � = (�∗(�), 0) loses its stability.
It follows that �� < 0 and we get the condition, that is, if theparameters satisfy condition � < 0, then the model (4) has asupercritical branch at �0.
Obviously, � < 0 due to (25). he proof is completed.
Conflict of Interests
he authors declare that there is no conlict of interestsregarding the publication of this paper.
Acknowledgments
hiswork is supported by theNational Natural Science Foun-dation of China (NSFCs, 11171199, 11371030, 11301320) andthe Fundamental Research Funds for the Central Universities(GK201305010). he authors would like to thank the editorand the referees for their careful reading of the original paperand many valuable comments and suggestions that greatlyimproved the presentation of this paper.
References
[1] R. M. Anderson and R. M. May, “Population biology of infec-tious diseases: part I,” Nature, vol. 280, no. 5721, pp. 361–367,1979.
[2] E. Hanert, E. Schumacher, and E. Deleersnijder, “Front dynam-ics in fractional-order epidemic models,” Journal of heoreticalBiology, vol. 279, no. 1, pp. 9–16, 2011.
[3] H. W. Hethcote, “Mathematics of infectious diseases,” SIAMReview, vol. 42, no. 4, pp. 599–653, 2000.
[4] A. E. Fiore, C. B. Bridges, and N. J. Cox, “Seasonal inluenzavaccines,” Current Topics in Microbiology and Immunology, vol.333, no. 1, pp. 43–82, 2009.
[5] Y. Chang, N. T. Brewer, A. C. Rinas, K. Schmitt, and J. S. Smith,“Evaluating the impact of human papillomavirus vaccines,”Vaccine, vol. 27, no. 32, pp. 4355–4362, 2009.
[6] T. J. Liesegang, “Varicella zoster virus vaccines: efective, butconcerns linger,” Canadian Journal of Ophthalmology, vol. 44,no. 4, pp. 379–384, 2009.
[7] Z. Agur, L. Cojocaru, G. Mazor, R. M. Anderson, and Y. L.Danon, “Pulse mass measles vaccination across age cohorts,”Proceedings of the National Academy of Sciences of the UnitedStates of America, vol. 90, no. 24, pp. 11698–11702, 1993.
[8] L. Stone, B. Shulgin, and Z. Agur, “heoretical examinationof the pulse vaccination policy in the SIR epidemic model,”Mathematical and ComputerModelling, vol. 31, no. 4-5, pp. 207–215, 2000.
[9] B. Shulgin, L. Stone, and Z. Agur, “Pulse vaccination strategy inthe SIR epidemic model,” Bulletin of Mathematical Biology, vol.60, no. 6, pp. 1123–1148, 1998.
[10] A. D’Onofrio, “Stability properties of pulse vaccination strategyin SEIR epidemicmodel,”Mathematical Biosciences, vol. 179, no.1, pp. 57–72, 2002.
[11] A. Franceschetti and A. Pugliese, “hreshold behaviour of a SIRepidemicmodel with age structure and immigration,” Journal ofMathematical Biology, vol. 57, no. 1, pp. 1–27, 2008.
Abstract and Applied Analysis 13
[12] A. J. Terry, “Pulse vaccination strategies in a metapopulationSIR model,” Mathematical Biosciences and Engineering, vol. 7,no. 2, pp. 455–477, 2010.
[13] S. J. Gao, L. S. Chen, J. J. Nieto, and A. Torres, “Analysis of adelayed epidemic model with pulse vaccination and saturationincidence,” Vaccine, vol. 24, no. 35-36, pp. 6037–6045, 2006.
[14] L. Matrajt, M. E. Halloran, and I. M. Longini Jr., “Optimal vac-cine allocation for the early mitigation of pandemic inluenza,”PLoS Computational Biology, vol. 9, no. 3, Article ID e1002964,2013.
[15] S. P. Sullivan, D. G. Koutsonanos, M. D. P. Martin et al.,“Dissolving polymer microneedle patches for inluenza vacci-nation,” Nature Medicine, vol. 16, no. 8, pp. 915–920, 2010.
[17] M. J. Reynolds-Hogland, J. S. Hogland, and M. S. Mitchell,“Evaluating intercepts fromdemographicmodels to understandresource limitation and resource thresholds,” Ecological Mod-elling, vol. 211, no. 3-4, pp. 424–432, 2008.
[18] L. Chow, M. Fan, and Z. L. Feng, “Dynamics of a multigroupepidemiological model with group-targeted vaccination strate-gies,” Journal of heoretical Biology, vol. 291, no. 1, pp. 56–64,2011.
[19] L. H. Zhou and M. Fan, “Dynamics of an SIR epidemic modelwith limited medical resources revisited,” Nonlinear Analysis:Real World Applications, vol. 13, no. 1, pp. 312–324, 2012.
[20] V. Lakshmikantham, D. D. Bainov, and P. S. Simeonov, heoryof Impulsive Diferential Equations, World Scientiic, Singapore,1989.
[21] S. M. Blower and H. Dowlatabadi, “Sensitivity and uncertaintyanalysis of complex-models of disease transmission? An HIVmodel, as an example,” International Statistical Review, vol. 62,no. 2, pp. 229–243, 1994.
[22] S. Marino, I. B. Hogue, C. J. Ray, and D. E. Kirschner, “A meth-odology for performing global uncertainty and sensitivityanalysis in systems biology,” Journal of heoretical Biology, vol.254, no. 1, pp. 178–196, 2008.
[23] S. Y. Tang, J. H. Liang, Y. S. Tan, and R. A. Cheke, “hresholdconditions for integrated pest management models with pesti-cides that have residual efects,” Journal ofMathematical Biology,vol. 66, no. 1-2, pp. 1–35, 2013.
[24] F. Brauer and C. Castillo-Chavez,Mathematical Models in Pop-ulation Biology and Epidemiology, Springer, New York, NY,USA, 2000.
[25] O. Diekmann and J. A. P. Heesterbeek, Mathematical Epidemi-ology of Infectious Diseases, JohnWiley & Sons, Chichester, UK,2000.
[26] J. D. Murray,Mathematical Biology, Springer, Berlin, Germany,1989.
[27] R. Anderson and R. May, Infectious Diseases of Humans,Dynamics and Control, Oxford University Press, Oxford, UK,1995.
[28] M. Hethcote, “hree basic epidemiological models,” in AppliedMathematical Ecology, L. Gross, T. G. Hallam, and S. A. Levin,Eds., pp. 119–144, Springer, Berlin, Germany, 1989.
[29] A. V. Hill, “he possible efects of the aggregation of themolecules of haemoglobin on its dissociation curves,” heJournal of Physiology, vol. 40, no. 4, pp. 4–7, 1910.
[30] P. Cull, “Local and global stability for population models,”Biological Cybernetics, vol. 54, no. 3, pp. 141–149, 1986.
[31] W.H.O.Web, “Global health observatory data repository,” 2001,http://apps.who.int/gho/data/?theme=country.
[32] M. D. McKay, R. J. Beckman, and W. J. Conover, “Comparisonof three methods for selecting values of input variables in theanalysis of output from a computer code,” Technometrics, vol.21, no. 2, pp. 239–245, 1979.
[33] W. M. Schafer, L. F. Olsen, G. L. Truty, S. L. Fulmer, andD. J. Graser, “Periodic and chaotic dynamics in childhoodepidemics,” in From Chemical to Biological Organization, M.Markus, S. Muller, and G. Nicolis, Eds., Springer, Berlin,Germany, 1988.
[34] A. Lakmeche and O. Arino, “Bifurcation of non trivial periodicsolutions of impulsive diferential equations arising chemother-apeutic treatment,” Dynamics of Continuous, Discrete andImpulsive Systems B, vol. 7, no. 2, pp. 265–287, 2000.
[35] S. Y. Tang and L. S. Chen, “Multiple attractors in stage-structured population models with birth pulses,” Bulletin ofMathematical Biology, vol. 65, no. 3, pp. 479–495, 2003.
[36] S. Y. Tang, Y. N. Xiao, and R. A. Cheke, “Multiple attractorsof host-parasitoid models with integrated pest managementstrategies: eradication, persistence and outbreak,” heoreticalPopulation Biology, vol. 73, no. 2, pp. 181–197, 2008.
[37] L. F. Olsen andW.M. Schafer, “Chaos versus noisy periodicity:alternative hypotheses for childhood epidemics,” Science, vol.249, no. 4968, pp. 499–504, 1990.
[38] G. Sugihara and R. M. May, “Nonlinear forecasting as a way ofdistinguishing chaos from measurement error in time series,”Nature, vol. 344, no. 6268, pp. 734–741, 1990.