28
Steven De Proost, CEO September 28, 2021 ANALYST PRESENTATION H1 2021 Results & Annual Outlook

Steven De Proost, CEO
September 28, 2021
ANALYST PRESENTATION
H1 2021 Results & Annual Outlook

DISCLAIMER
This presentation is for information purposes only and does not constitute an invitation to purchase any securities of 7C SOLARPARKEN AG. All
information contained herein has been carefully prepared. Nevertheless, we do not guarantee its accuracy or completeness. Certain statements
contained in this presentation may be statements of future expectations that are based on the company's current views and assumptions and
involve known and unknown risks. Investments in capital markets are fundamentally associated with risks and a complete loss of the invested
capital cannot be ruled out. Copies of the content of this presentation will only be authorized by written consent from 7C SOLARPARKEN AG.
2DISCLAIMER

H1 RESULTSMARKET CHARTS
3AGENDA
AGENDA
ANNUAL OUTLOOKCOMPANY OVERVIEW

316 MWP
BUSINESS MODEL Pure PV Owner & Operator with Focus on Germany and Belgium
4COMPANY OVERVIEW
ASSET MANAGEMENTIPP PORTFOLIO PV ESTATE
CASH FLOW GENERATOR
Acquisition of running parks
New-build development
Optimise & operate
71 MWP
SYNERGIES
Recurring fees
Economies of scale
M&A possibilities
173 HA
LONG-TERM VALUE
Internalising lease cost
Repowering potential
Development potential

Capacity % FIT Production Yield Revenues EBITDA
MWp EUR/MWh GWh kWh/kWp EUR Mio EUR Mio
I Freefield 199 63% 168 199 1,001 33.3 28.7
III Rooftop 111 35% 210 98 881 20.5 17.4
Germany 96 30% 225 74 769 16.7 14.0
Belgium 15 5% 162 24 1,603 3.9 3.4
III Wind 6 2% 87 14 2,350 1.2 0.9
Portfolio 316 100% 177 310 984 55.0 47.0
IPP PORTFOLIO Existing Assets 316 MWp, EBITDA ca. EUR 47 Mio
5
▪ German PV assets concentrated in Bavaria, Eastern Germany, and Rhineland-Palatinate
▪ Belgium accounts for 5% of portfolio
▪ Average plant size: 2.1 MWp
▪ Average year of commissioning: 2015 (weighted capacity), 2011 (weighted revenues)
▪ Average feed-in-tariff: EUR 177/MWh.
▪ Tariffs are state-guaranteed and fixed for 20 years + year of commissioning
▪ Rooftop and land lease contracts usually running 20 years + at least 5 years extension option
▪ Small diversification into onshore wind
COMPANY OVERVIEW
LOCATION OF GERMAN PARKS > 2 MWP

FINANCIAL PROFILE Steady EBITDA Growth and Equity Ratio > 35%
6COMPANY OVERVIEW
EBITDA AND EBITDA RETURN (EBITDA/TOTAL ASSETS) EQUITY RATIO AND CASH FLOW PER SHARE
24.9 27.9 29.9 35.1
38.142.9
7.6%
8.9%9.6%
10.2%9.5% 9.4%
2.0%
3.0%
4.0%
5.0%
6.0%
7.0%
8.0%
9.0%
10.0%
11.0%
0
5
10
15
20
25
30
35
40
45
50
2015 2016 2017 2018 2019 2020
EBITDA Mio EUR EBITDA Return
0.41
0.450.49
0.60 0.55 0.5723%
25%
29% 30%
32%
35%
0.20
0.25
0.30
0.35
0.40
0.45
0.50
0.55
0.60
0.65
0%
5%
10%
15%
20%
25%
30%
35%
40%
2015 2016 2017 2018 2019 2020
CFPS Equity Ratio
Dividend flat
at EUR 0.11

-
50
100
150
200
250
300
350
1/01/15 1/01/16 1/01/17 1/01/18 1/01/19 1/01/20 1/01/21
Capacity in MWp Market cap in EUR Mio
VALUATION Market Cap versus Installed Capacity
7COMPANY OVERVIEW
KEY EVENTS SINCE REVERSE IPO LATE 2014
Listing of the new group 7C Solarparken after business
combination with Colexon Energy AG (26 MWp)
Business combination with Miskina (14 MWp)
Entry in Project Development financed by issue of
Schuldschein EUR 25 Mio.
Acquisition of Asset Management business
Strategic entry in Belgium as second core market
1
2
2
33
4
4
5
5
1

SHAREHOLDERS Free float has further increased to 76%
8COMPANY OVERVIEW
OWNERSHIP STRUCTURE 31 08 2021
76%
7%
6%
5%3% 3%
Free float
Rodolphe de Spoelberch
Vlaamse Energieholding
Distri Beheer 21
Sufina
Management
EQUITY ANALYSTS OVERVIEW
Latest Research / Rating / Target Price
MM Warburg 06.09.2021 / BUY / EUR 5.20
Hauck & Aufhauser 01.02.2021 / BUY 5.20
Stifel Europe Bank 14.08.2021 / BUY / EUR 5.50
Kempen Securities 15.06.2021 / NEUTRAL / EUR 4.30
H1 RESULTSMARKET CHARTS
9AGENDA
AGENDA
ANNUAL OUTLOOKPROFILE

NEW-BUILD MARKET PV remains dominant Source of Growth
10MARKET CHARTS
ANNUAL NET ADDITIONS IN CAPACITY GERMANY (GW), JAN-JULY FOR 2021
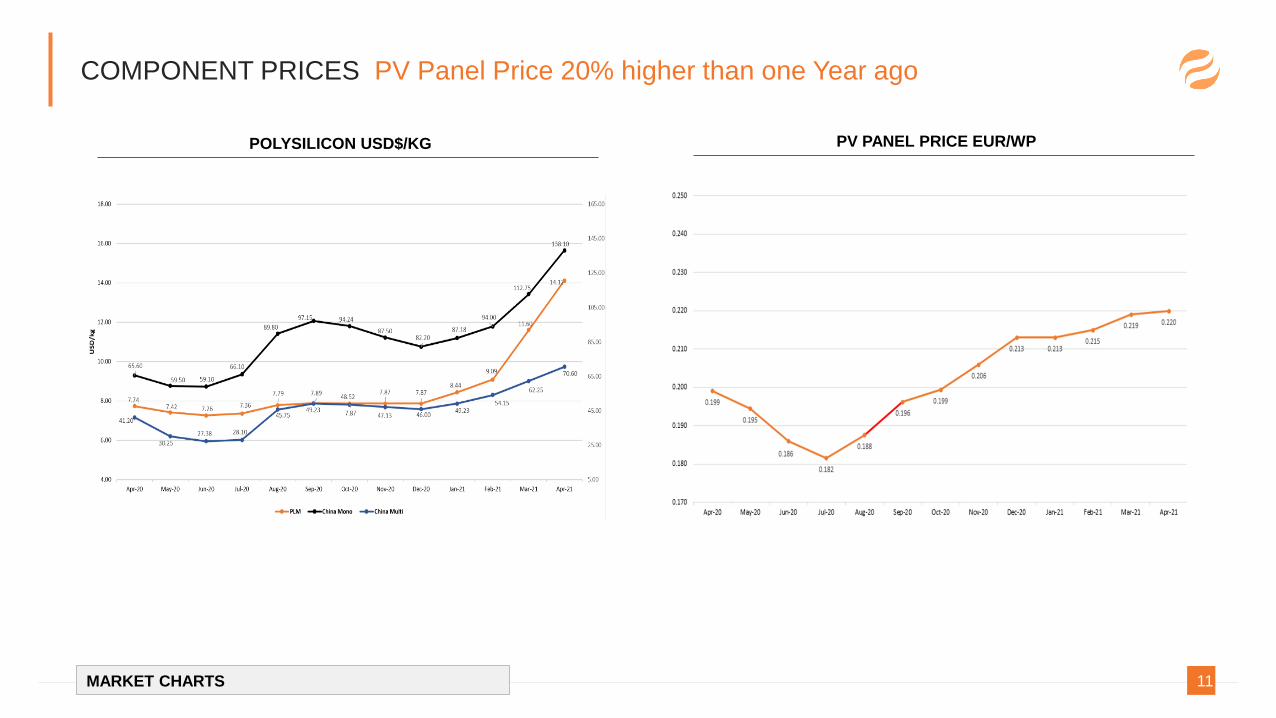
COMPONENT PRICES PV Panel Price 20% higher than one Year ago
11MARKET CHARTS
POLYSILICON USD$/KG PV PANEL PRICE EUR/WP

TARIFFS Regulated Tariffs down by 1.5% per month, FFAV stable, Market Price up
12MARKET CHARTS
REMUNERATION CATEGORIES IN EUR/MWH
-
20
40
60
80
100
120
Se
p-1
4
Nov-1
4
Jan
-15
Mar-
15
Ma
y-1
5
Jul-1
5
Se
p-1
5
Nov-1
5
Jan
-16
Ma
r-16
May-1
6
Jul-1
6
Se
p-1
6
Nov-1
6
Jan
-17
Ma
r-17
Ma
y-1
7
Jul-1
7
Se
p-1
7
Nov-1
7
Jan
-18
Ma
r-18
Ma
y-1
8
Jul-1
8
Se
p-1
8
Nov-1
8
Jan
-19
Mar-
19
Ma
y-1
9
Jul-1
9
Se
p-1
9
Nov-1
9
Jan
-20
Ma
r-20
Ma
y-2
0
Jul-2
0
Se
p-2
0
Nov-2
0
Jan
-21
Ma
r-21
Ma
y-2
1
Jul-2
1
Se
p-2
1
Freefield < 750 kWp Large roofs < 750 kWp FFAV > 750 kWp Free market

WEATHER Adverse Sunshine Conditions, particularly in Q3’21
13MARKET CHARTS
SUNSHINE HOURS GERMANY

PV PRODUCTION 10% less relative Output vs H1’20, abnormally weak in Q3’21
14MARKET CHARTS
NATIONWIDE KWH/KWP
Jan Feb Mar Apr May Jun Jul Aug Sep Oct Nov Dec H1 Jan-Aug YEAR
2011 21 41 101 132 147 122 112 116 100 75 41 15 564 792 1,023
2012 26 47 93 100 138 118 125 130 96 62 27 15 522 777 977
2013 12 25 74 98 103 125 148 124 82 59 26 24 437 709 900
2014 25 49 102 107 119 137 126 111 85 58 30 12 539 776 961
2015 18 44 86 127 124 129 136 126 87 55 34 28 528 790 994
2016 22 38 72 105 127 119 127 125 106 49 30 25 483 735 945
2017 28 43 90 104 130 134 122 114 81 58 23 13 529 765 940
2018 20 53 74 121 143 128 147 126 104 74 34 15 539 812 1,039
2019 21 61 77 119 117 146 132 122 93 58 26 24 541 795 996
2020 28 42 97 144 138 120 132 116 101 46 37 16 569 817 1,017
2021 15 48 88 111 114 134 117 102 510 729
2011-20 22 44 87 116 129 128 131 121 94 59 31 19 525 777 979
StDev 23% 21% 13% 13% 11% 7% 9% 7% 10% 16% 18% 31% 7% 4% 4%
2021 vs average -32% 8% 2% -4% -11% 5% -10% -16% -3% -6%
2021 vs 2020 -46% 14% -9% -23% -17% 12% -11% -12% -10% -11%

H1 RESULTSMARKET CHARTS
15AGENDA
AGENDA
ANNUAL OUTLOOKPROFILE

OPERATIONAL GROWTH Capacity Growth + 45 MWp in H1’21
16H1 21 RESULTS
ANNUAL/QUARTERLY ADDITIONS IN MWP
15 14 18
36 36
66
19
26
14
-
10
20
30
40
50
60
70
2015 2016 2017 2018 2019 2020 Q1 2021 Q2 2021 Q3 2021
71 86
101
118
154
190
256
301
2014 2015 2016 2017 2018 2019 2020 H1 2021
295 MWP IPP TARGET 2021 EXCEEDED
295 MWp

KPI’S Relative Output Yield in line with irradiation-driven Market Average
17H1 21 RESULTS
ANNUAL/QUARTERLY ADDITIONS IN MWP
2021 H1 2020 H1 % COMMENT
Solar + Wind in GWh 144,7 117,5 23,2 %
Solar kWh/kWp 509,6 568,8 -10,4 % Poor irradiation conditions
Wind (kWh/kW operating hours) 1.054,9 1.455,1 -27,5 % Poor wind conditions
Weighted operational capacity in MWp 274,5 194,6 41,0 % Reflects growth
Average Feed-in Tariff EUR/MWh 195,3 218,3 -10,5 % New-build entitled to lower tariffs

P&L EBITDA +8.5% boosted by increased operational Capacity
18H1 21 RESULTS
In Mio EUR 2021 H1 2020 H1 % COMMENT
Revenues 28.8 26.7 7.9%
o/w power sales 28.3 25.6 Driven by capacity growth to 301 MWp including full consolidation of 2 PV funds
Other income 1.0 1.0 Special items incl. compensation for outages and reversal of provisions
Opex 4.2 4.2 Increase in personnel expenses due to development subsidiary in Belgium
EBITDA 25.5 23.5 8.5%
D&A -15.1 -12.8 Increased capacity, higher carrying amount of fixed assets
EBIT 10.5 10.8
Financial result -3.0 -3.0
o/w financial income 0.3 0.8 Less equity method income as 2 PV funds are fully-consolidated
o/w financial expenses -3.3 -3.7
Pre-tax profit 7.4 7.8
Tax -0.7 -1.3
Consolidated profit 6.7 6.6
Net profit, group 6.0 6.5 -7.7%
Minorities 0.7 0.1 Reflects full consolidation of 2 PV Funds

BALANCE SHEET Equity Ratio rises to 36.7%
19H1 21 RESULTS
In Mio EUR 2021 H1 2020 COMMENT
ASSETS 478.4 458.5
Land & Property 11.9 11.9 PV Estate
Right of use assets 31.4 22.0 IFRS 16
Solar and windparks 349.1 337.3 Reflects expansion of IPP portfolio
Financial Investments 1.0 1.6 Stakes in non-consolidated PV funds
Inventory 2.7 2.7
Cash & cash equivalents 56.2 62.2 EUR 18.4 Mio reserve accounts
LIABILITIES 478.4 458.5
Shareholders Equity 164.3 150.4
Minority interest 11.5 11.4
Financial debt 231.8 236.8
LT Provisions 19.3 17.2
Lease liabilities 25.6 17.2 Of which EUR 5.2 Mio relates to the financing of solar assets through leasing
FINANCIAL RATIOS
Net debt 181.0 174.7 Includes EUR 5.2 Mio lease financing
Equity Ratio 36.7% 35.3% Excludes dividend -EUR 7.6 Mio and capital increase + EUR 25.8 Mio during summer

CASH FLOW PER SHARE Drops to EUR 0.30/share
20H1 21 RESULTS
In Mio EUR 2021 H1 2020 H1 COMMENT
EBITDA 25.5 23.5
- Lease expenses (IFRS 16) -0.7 -0.4
- Cash Interest paid -3.2 -2.7
- Cash tax paid -0.7 +0.2 2020: Includes effect from tax audit (reimbursement EUR 0.6 Mio)
= Net Cash Flow 20.9 20.6
Number of shares in Mio. 69.3 61.4
CFPS 0.30 0.34

ANALYST (*) CONSENSUS KPI’s above Expectations
21H1 21 RESULTS
In Mio EUR 2021 H1 CONSENSUS
Revenues 28.8 27.5
EBITDA 25.5 22.7
CFPS (per share) 0.30 0.27
(*) Following investment banks delivered their H1’21 estimates: MM Warburg, Hauck & Aufhauser, Stifel Europe

H1 RESULTSMARKET CHARTS
22AGENDA
AGENDA
ANNUAL OUTLOOKPROFILE

DRIVERS FOR H2’21 Growth towards 335 MWp at year-end
23ANNUAL OUTLOOK
256
275
301
316
335
295
2020 Q1'21 Q2'21 Q3'21Forecast
Q4'21Forecast
Guidancecapacityyear-end
IPP PORTFOLIO TREND 2021
MANAGEMENT COMMENT
▪ Plan to add another ca. 20 MWp to the existing portfolio throughout Q4’21
▪ There will be 20 MWp more operating capacity than planned (guidance included: 275
MWp weighted operational capacity) during H2’21 resulting into EUR 0.4 Mio higher
EBITDA
Calculation of EBITDA effect
20 MWp Above guidance
x 450 kWh/kWp H2 yield
x 55 EUR/MWh FIT new-build latest transactions
x 80% EBITDA margin
= 0,4 EUR Mio EBITDA effect

DRIVERS FOR H2’21 Average Power Price for H2’21 to exceed EUR 75/MWh
24ANNUAL OUTLOOK
5 DAY-AVERAGE POWER PRICE 2021 EUR/MWH
MANAGEMENT COMMENT
▪ 7C Solarparken owns ca 70 MWp operating capacity that is entitled to a feed-in
tariff below EUR 75/MWh. This package of 70 MWp enjoys an average tariff of
EUR 60/MWh. The German EEG mechanism foresees that the fixed tariff is paid
out as the sum of the market price (by the utilities companies) and a resulting
market premium (by the grid operator). As such, every installation receives at
least the market price.
▪ EBITDA impact for H2’21: 70 MWp x 450 kWh/kWp x (EUR 75/MWh minus
EUR 60/MWh) = EUR 0.5 Mio
-
10
20
30
40
50
60
70
80
90
100
04.0
1.2
02
11
1.0
1.2
02
11
7.0
1.2
02
12
4.0
1.2
02
13
0.0
1.2
02
10
6.0
2.2
02
11
3.0
2.2
02
11
9.0
2.2
02
12
6.0
2.2
02
10
4.0
3.2
02
11
1.0
3.2
02
11
8.0
3.2
02
12
4.0
3.2
02
13
1.0
3.2
02
10
7.0
4.2
02
11
3.0
4.2
02
12
0.0
4.2
02
12
6.0
4.2
02
10
3.0
5.2
02
11
0.0
5.2
02
11
6.0
5.2
02
12
3.0
5.2
02
13
0.0
5.2
02
10
5.0
6.2
02
11
2.0
6.2
02
11
8.0
6.2
02
12
5.0
6.2
02
10
2.0
7.2
02
10
8.0
7.2
02
11
5.0
7.2
02
12
1.0
7.2
02
12
8.0
7.2
02
10
4.0
8.2
02
11
0.0
8.2
02
11
7.0
8.2
02
1

DRIVERS FOR H2’21 Irradiation during Jul-Aug 13% below long-term value
25ANNUAL OUTLOOK
NATIONWIDE KWH/KWP JULY + AUGUST
150
170
190
210
230
250
270
290
2011 2012 2013 2014 2015 2016 2017 2018 2019 2020 2021
AVERAGE
MANAGEMENT COMMENT
▪ Operating Portfolio of at least 295 MWp will be generating 30 kWh/kWp less
than under a normal period of July and August
▪ EBITDA Impact: 295 MWp x 30 kWh/kWp x EUR 185/MWh (average tariff for
the 295 MWp portfolio) = - EUR 1.6 Mio

GUIDANCE Revision EBITDA forecast raised to EUR 44.4 Mio, CFPS unchanged
26ANNUAL OUTLOOK
INITIAL
Guidance
NEW
Forecast
In Mio EUR 2020 2021 2021 COMMENT
EBITDA 42.9 42.5 44.4 Above Plan in H1’21
Lease paid -0.9 -1.1 -1.5 In line with growth
Cash interest paid -5.5 -5.3 -5.8 In line with growth
Cash taxes paid -1.2 -1.4 -1.4
Net Cash Flow 35.3 34.7 35.7
Number of shares, weighted Mio 62.3 69.4 71.6 Includes capital increase
CFPS 0.57 0.50 0.50
OUTLOOK 2021
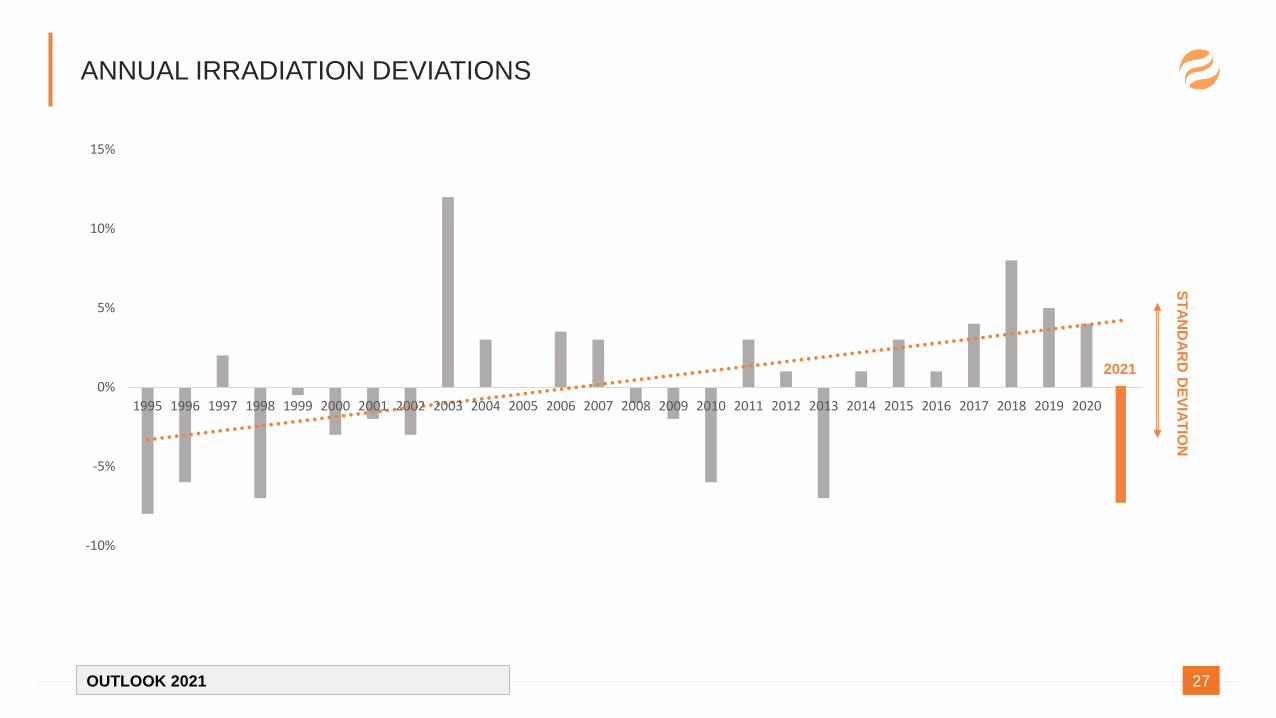
ANNUAL IRRADIATION DEVIATIONS
27OUTLOOK 2021
-10%
-5%
0%
5%
10%
15%
1995 1996 1997 1998 1999 2000 2001 2002 2003 2004 2005 2006 2007 2008 2009 2010 2011 2012 2013 2014 2015 2016 2017 2018 2019 2020
ST
AN
DA
RD
DE
VIA
TIO
N
2021

CONTACT
28CONTACT
CONTACT
7C SOLARPARKEN AG
An der Feuerwache 15
95445 Bayreuth / Germany
+49 (0) 921 23 05 57 77
www.solarparken.com


