Hardin Jones Biostatistical Analysis of Mortality Data for Cohorts of Cancer Patients with a Large Fraction Surviving at the Termination of the Study and a Comparison of Survival Times of Cancer Patients Receiving Large Regular Oral Doses of Vitamin C and Other Nutrients with Similar Patients Not Receiving Those Doses A. Hoffer, M.D., Ph.D. 1 and Linus Pauling, Ph.D. 2 Abstract The recently developed method of bio- statistical analysis of mortality data for cohorts of cancer patients based on the Hardin Jones principle of constancy of the death rate for a homogeneous cohort (Pauling, 1989) is applied to the problem of evaluating the mean survival time for a cohort with a few survivors at the termination of the study and also for a cohort with many survivors at the termination of the study. Use of the method is illustrated by its application to three cohorts: a cohort of 40 patients with cancer of the breast, ovary, uterus, or cervix who continuously received large daily doses of ascorbic acid and other vitamins; a cohort of 61 patients with other kinds of cancer who followed the regimen; and a cohort of 31 similar patients who did not follow the regimen. Mean survival time for the 31 patients who did not follow the regimen is 5.7 mo. Of the others, who did follow the regimen, 20% were poor responders, with mean survival time 10 mo., and 80% were good responders, with mean survival time 122 mo. for 32 patients with cancer of the breast, ovary, cervix, and uterus and 72 mo. for 47 patients with other kinds of cancer. 1. 3A - 2727 Quadra Street, Victoria, B.C., Canada V8T 4E5. 2. Linus Pauling Institute of Science and Medicine, 440 Page Mill Road, Palo Alto, CA 94306 One of us has recently pointed out (Pauling, 1989) that the biostatistical analysis of mortality data for a cohort of cancer patients is made more powerful by the use of the principle discovered by Hardin Jones in 1956, and this principle has been applied in the formulation of a set of criteria for the validity of a clinical test of a treatment of cancer patients (Pauling & Herman, 1989). An important reason for carrying out such a test is the determination of the mean survival times of the homogeneous subcohorts that compose the cohort being tested. The problem of separating the cohort into homogeneous subcohorts and evaluating their mean survival times for a test in which most of the patients have died by the termination date has been discussed (Pauling, 1989); we now attack the problem for the case of survival of a large fraction of the patients. Analysis of Mortality Date for a Homogeneous Cohort Hardin Jones reported (1956) that published mortality data for cohorts of similar cancer patients indicate the death rate to be constant: 143
Transcript
Hardin Jones Biostatistical Analysis of Mortality Data for Cohorts of Cancer Patients
with a Large Fraction Surviving at the
Termination of the Study and a Comparison of
Survival Times of Cancer Patients Receiving
Large Regular Oral Doses of Vitamin C and
Other Nutrients with Similar Patients Not
Receiving Those Doses
A. Hoffer, M.D., Ph.D.1 and Linus Pauling, Ph.D.2
Abstract The recently developed method of bio-
statistical analysis of mortality data for cohorts of cancer patients based on the Hardin Jones principle of constancy of the death rate for a homogeneous cohort (Pauling, 1989) is applied to the problem of evaluating the mean survival time for a cohort with a few survivors at the termination of the study and also for a cohort with many survivors at the termination of the study. Use of the method is illustrated by its application to three cohorts: a cohort of 40 patients with cancer of the breast, ovary, uterus, or cervix who continuously received large daily doses of ascorbic acid and other vitamins; a cohort of 61 patients with other kinds of cancer who followed the regimen; and a cohort of 31 similar patients who did not follow the regimen. Mean survival time for the 31 patients who did not follow the regimen is 5.7 mo. Of the others, who did follow the regimen, 20% were poor responders, with mean survival time 10 mo., and 80% were good responders, with mean survival time 122 mo. for 32 patients with cancer of the breast, ovary, cervix, and uterus and 72 mo. for 47 patients with other kinds of cancer.
1. 3A - 2727 Quadra Street, Victoria, B.C., Canada V8T 4E5. 2. Linus Pauling Institute of Science and Medicine, 440 Page Mill Road, Palo Alto, CA 94306
One of us has recently pointed out (Pauling, 1989) that the biostatistical analysis of mortality data for a cohort of cancer patients is made more powerful by the use of the principle discovered by Hardin Jones in 1956, and this principle has been applied in the formulation of a set of criteria for the validity of a clinical test of a treatment of cancer patients (Pauling & Herman, 1989). An important reason for carrying out such a test is the determination of the mean survival times of the homogeneous subcohorts that compose the cohort being tested. The problem of separating the cohort into homogeneous subcohorts and evaluating their mean survival times for a test in which most of the patients have died by the termination date has been discussed (Pauling, 1989); we now attack the problem for the case of survival of a large fraction of the patients.
Analysis of Mortality Date for a Homogeneous Cohort
Hardin Jones reported (1956) that published mortality data for cohorts of similar cancer patients indicate the death rate to be constant:
143
Journal of Orthomolecular Medicine Vol. 5, No. 3, 1990
Here NO is the number of patients entering the study at time t = 0, N is the number surviving at time t, and a is the death rate
The fraction surviving at time t, S, is given by the equation
S = N/NO = e-at (3) The plot of ln S vs t is a straight line with slope -a. The value of the mean survival time r is or1. One of us (L.P.) has pointed out that there are many ways to calculate T for a homogeneous cohort. The approximate equality of the values of T obtained in several ways is a useful test of homogeneity, supplementing inspection of the Hardin Jones plot to check for upward curvature of the In S line.
For a homogeneous cohort the value of T for N survivors is a'1 (Equation 3). Another way of evaluating T results from the fact that the mean survival time of all N0 patients is r and the mean additional survival time of the N survivors is also T. Let (T) be the survival time of the N0 - N patients who have died and (T +) be that of the N survivors (who may have entered the study at any time). The sum of the total survival times can be written in two ways, which must be equal: N0T = (N0 - N)(t) + N(t +) + NT (4) The last term expresses the fact that the N survivors have remaining mean survival time T. From this equation we obtain another expression for T. T = (St + Et + ) / (N0 - N)(5) This equation is unreliable when N0 - N is small.
Motivation for the Formulation of the Method of Biostatistical Analysis Based on the Hardin Jones Principle
One of us (A.H.) is a biochemist and psychiatrist who, about 40 years ago (in collaboration with Humphry Osmond) began treating schizophrenic patients with very large daily intakes of vitamin B3 (nicotinic acid or nicotinamide) and other vitamins, including ascorbic acid. He and his collaborators in 1957 reported the results of the first randomized double-blind study made in the field of psychiatry (Hoffer et al, 1957). He also observed that a few
mentally ill patients who also suffered from cancer seemed to gain some control over this disease while being given psychiatric treatment by him. He began a controlled study in July 1978 (patient No. 84, cancer of the pancreas). Between that date and April 15, 1988, 134 patients with cancer were accepted by him (column A in Tables 1, 2, 4 and 5). Survival times are given to the termination date of the study, January 1, 1990.
About 25% of the patients rejected the ascorbic acid and also the other vitamins. The others received from 3 to 40 g of vitamin C per day, taken by mouth, mostly 12 g per day. It soon became evident that the vitamin C patients survived much longer than the others, and an effort was made to evaluate the mean survival times by the conventional methods of biostatis-tical analysis. This effort was not very successful, in that these methods do not give proper consideration to the survivors, those patients still alive at the termination of the study, who comprise about 50% of the vitamin C patients. It was then recognized that the acceptance of the Hardin Jones principle permitted the formulation of a more powerful method of biostatistical analysis of mortality data for cohorts of cancer patients. Some results of applying this method have been reported (Pauling, 1989; Pauling & Herman, 1989). We now report on its application to cohorts with a large number of survivors at the termination of a study, with the 134 patients as an example. To decrease the effect of statistical fluctuations we have combined female patients with cancer of the breast, ovary, uterus, cervix and Fallopian tube into two cohorts (receiving vitamins and not receiving vitamins) and the remaining patients, both male and female, with cancer of the colon, lung, prostate, pancreas, and others, into another two cohorts.
Analysis of Survival Times Listed in Tables 1 and 2
Separate analyses of the mean survival times for Table 1 and Table 2 show that they are nearly equal; hence they can be combined, to give somewhat increased reliability to the average value of the mean survival time r. Moreover, the analysis indicates some heterogeneity, as might
144
Analysis of Mortality Data for Cancer Patients Receiving Vitamin C and Other Nutrients
be expected from the many different kinds of cancer represented. It is found, however, that the only resolution into subcohorts that can be achieved is to a large subcohort of 31 patients, with T = 5.7 ± 0.4 mo (Table 3), and a small subcohort of 2 patients, with r about 48 mo. The small subcohort consists of No. 14, with t = 45 mo (cancer of the testis), and No. 31, with t + = 49 + mo (cancer of the Fallopian tube). The probability that either of these is a member of the main subcohort is less than 1 %.
In this equation 25j2 has been replaced by 2r2, because the values of 8[ have the distribution given by Equation 2. Moreover, since the values of 5[ are not correlated with those of t~i, Si can be moved to the left of the summation sign and replaced by its mean value T, giving the equation
Neither of these two kinds of cancer is represented in Tables 4 and 5.
Biostatistical Treatment of Cohorts with Many Survivors
The analysis of mortality data for a cohort with many survivors is more difficult than that for a cohort with few survivors, especially if the cohort is heterogeneous; it is, however, possible to carry out such an analysis by application of the Hardin Jones principle. For a homogeneous cohort the value of T given by Equation 5 is reliable if a good number of patients have died. Another equation can be obtained by discussing the values of the square of the survival time. For a homogeneous cohort the following equation is valid (Pauling, 1989):
With t-1" the survival time of the ith patient at the termination date of the study, we write for the predicted total survival time t- the relation
Other ways of evaluating T for a homogeneous cohort with no survivors might be adapted to the case of a homogeneous cohort with many survivors by changing t"[to t[, Equation 8, but we have not found any good analytical way of doing this.
Resolving a Cohort into Two Homogeneous Subcohorts Let fl, be the fraction of the first subcohort, with mean survival time T\, and f2 (equal to 1 - fi) that of the second subcohort, with mean survival time T2 larger than T\ . The mean values (T) from Equation 5 and (T2) '2 from Equation 12 permit two of die three unknowns to be evaluated if the diird is known. We have the relations
The evaluation of T2 might be made by studying the additional survival of those members of the cohort who had survived after a time much longer than T\ . and for NO members of the cohort with N
survivors Equation 7 becomes
Conversion of t j2 to t j For a homogeneous cohort with T known
145
Journal of Orthomolecular Medicine Vol. 5, No. 3, 1990
the set of values oft i+can be converted to a set ofvalues oft [ by use of Equation 8. The mean value of 8[ is T, but r is not to be added to each of value of ti+; instead, a set ofvalues of 5j is calculated by use of Equation 2 with t given the N values corresponding to the midpoints of the risers on the staircase function S, and these values are assigned to the N values of t f1" by a random process. There are N! ways of making this random assignment, and there may be some advantage in using more than one (but not taking the averages, which would cause all values of h\ to approach T).
An extension of this procedure may be used for a heterogeneous cohort.
Analysis of Survival Times of Two Cohorts
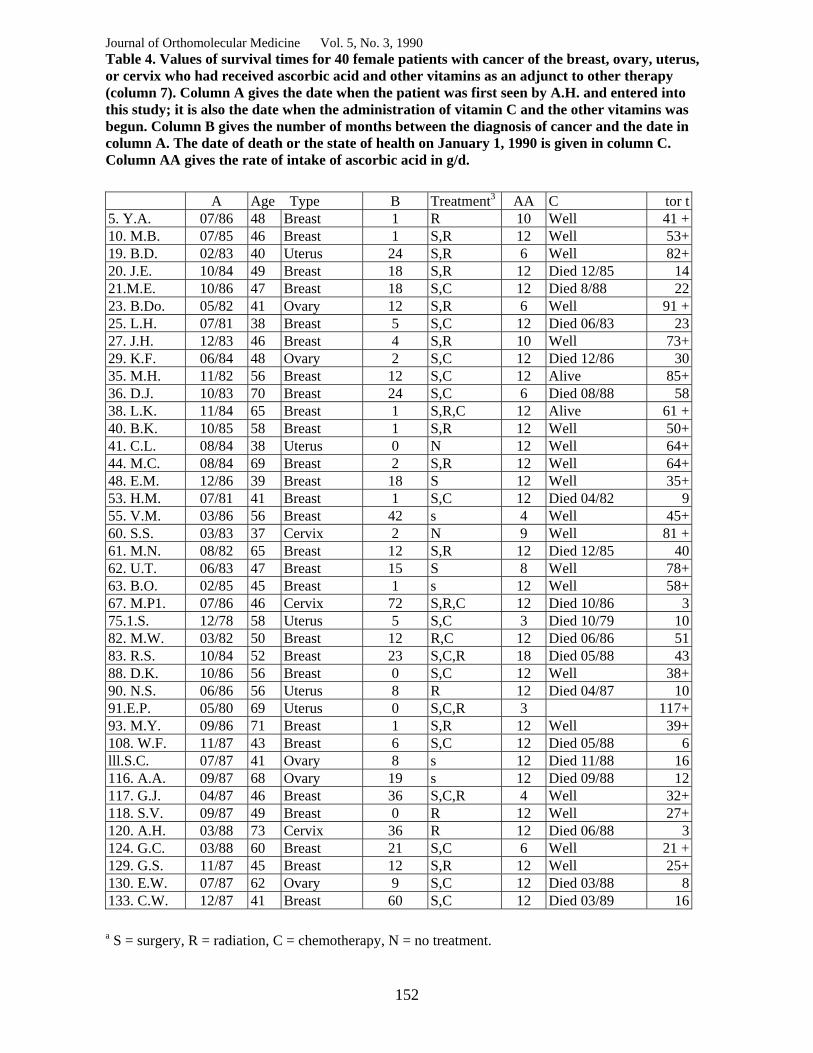
As an example we discuss first a cohort of 40 patients with 22 survivors at the termination of the study (Table 4). The values of St (374 mo) and Zt+ (1258 mo) lead by Equation 5 to (T) = 91 mo. Similarly, the values of St2 and 2(t+)2 lead by Equation 12 to (T2) /2 = 109 mo. A third value is 97 mo, given by the value S = 22/40 at the time (t"*} = 57.2 mo, and the mean of the three values of T is 99 mo.
A second example is that of 61 patients with 29 survivors and with other kinds of cancer (Table 5). A similar analysis leads to (r) = 62 mo, (T2)1'2 = 72 mo, and r(S) = 68 mo, mean 67 mo.
Indication of heterogeneity of each of these two cohorts is provided by the analysis of the corresponding subcohorts consisting of those members alive at any time during one year, taken as 1986, leaving 3.5 years during which the additional survival times were observed. These 1986 cohorts would be depleted in the short-lived subcohorts, so that the values of r would tend toward the values for the long-lived subcohorts. For the 1986 cohort of Table 4, 25 patients with 18 survivors on Jan. 1, 1990, the values (T) = 120 mo, (T2) h = 123 mo, and T(S) = 124 mo, mean 122 mo, are found, and for the 1986 cohort of Table 5, 32 patients with 18 survivors, the values are (T) = 70 mo, (T2)V2 = 72 mo, and T(S) = 73 mo, mean 72 mo.
This analysis of the 1986 cohort permits the resolution of each of the cohorts of Table 4 and 5 into two subcohorts, one consisting of the poor responders to the nutrients and the other of the excellent responders.
We assume that the survival times T = 122 mo and 72 mo for the 1986 patients apply to the longer-living subcohorts of the two cohorts. Comparison of the number of patients in the 1986 cohort and the full cohorts and their mean values of r indicates that in each case the subcohort with longer survival constitutes about 80% of the cohort. Analysis of the smaller values oft then leads to the conclusion that the mean survival time of the 20 poor responders is about 10 mo; that is, only about twice that for the patients who did not follow the regimen. There is no statistical correlation of allocation to the two subcohorts and sex, age, or type of cancer.
Discussion Some questions about the validity of the results
presented in this paper have been raised by statisticians and oncologists who have read it or heard it discussed in seminars. We now respond to these questions by providing some additional information.
First, it has not been contended by the critics that the new biostatistical equations based on the Hardin Jones principle contain errors. It was pointed out, especially in the discussion of a presentation of this paper by one of the authors at a seminar in the statistics department of a leading university, that some of the results are not new. The Hardin Jones principle has been discussed briefly in several books and papers during the last thirty years, but never, except by Jones (1957) and Burch (1976), with any significant discussion of its general validity for homogeneous cohorts of cancer patients. It has also been pointed out to us that several methods of handling cohorts with survivors at the end of a study have been developed, usually without any assumption about the nature of the survival curve. These methods are recognized, however, as being less powerful than the method that we have used, which is based on the acceptance of the Hardin Jones
146
Analysis of Mortality Data for Cancer Patients Receiving Vitamin C and Other Nutrients
principle. We believe that the existing epidemiological evidence provides strong support of this principle, and that it should be used in all biostatistical studies of mortality data for cohorts of cancer patients, in order to increase the accuracy and reliability of the conclusions drawn from the studies.
Dr. James Enstrom suggested to us that there might be a contradiction between the Hardin Jones principle and the Gompertz principle. In 1820, 1825 and 1862 Gompertz pointed out that the logarithm of the total death rate and the death rates for some individual diseases are linear functions of the chronological age, usually doubling about every 8 years. No such great dependence on chronological age is seen in our tables. The explanation of this fact is, we suggest, that the Gompertz principle applies to cancer morbidity, and thus indirectly, by way of the Hardin Jones principle, also to cancer mortality. The study in this paper relates to the time between morbidity and mortality; that is, it is a discussion of the survival times of patients who have developed the disease and have progressed to essentially the same stage, that of untreatability by conventional therapies.
It has been suggested to us that, instead of this retrospective study, we should have carried out a prospective randomized double-blind study of cancer patients, some of whom would receive 12 g of vitamin C each day and also several tablets containing vitamin E and other nutrients, with the controls receiving many tablets or capsules containing corresponding placebos. One of us has for 17 years been urging that such studies be carried out, but with little success. The two Mayo Clinic studies (Creagan et al, 1979; Moertel et al, 1985), usually referred to as having shown vita-min C to have no value in the control of cancer, are so flawed as to be themselves of no value (Pauling and Herman, 1989).
The study reported in this paper was not planned. The clinician member of this team of authors, a psychiatrist, recognized that of the patients with cancer who were registered with him (sent to him by a family physician or oncologist) before 15 April 1988, those who followed his regimen were surviving much longer
than those who were not following the regimen. After he had carried out a preliminary analysis of the mortality data, he suggested to the other author that the collaboration be begun that has resulted in this paper.
A principal reason for our decision to publish this analysis is that so little interest has in the past been shown by granting agencies such as the National Cancer Institute and the American Cancer Society, and by medical researchers in carrying out studies of the value of vitamin C and other nutrients in the prevention and treatment of cancer, in spite of the impressive results of the work of Cameron and his associates (see below). We are convinced that at the present time the publication of the results of the careful analysis of observations made on all of the members of a group of cancer patients, some of whom followed the Orthomolecular regimen whereas others did not, will have value in calling to the attention of both physicians and patients the possibility that this regimen, as an adjunct to appropriate conventional therapy, may have great value.
One critic of an earlier draft of this paper made the statement that it has no value because the clinician author had recruited 101 volunteers for his project from patients in hospitals, with 33 others (used by us in Tables 1 and 2) having refused to enter the study. This complete misunderstanding by the critic necessitates that we present the history of the study in some detail.
First, the critic is completely unfamiliar with the situation in Canada with respect to medical practice between general practitioners and specialists. Abram Hoffer is a specialist psychiatrist, and therefore cannot see any patient whatever until the patient has first been referred to him by a general practitioner. This is the way in which all of the cancer patients listed in the tables were enrolled. For each patient the date of enrollment is given in the tables.
Dr. Hoffer had nothing to do with the selection of any of these patients. For the most part, he first saw or heard of them when they first appeared in his office, and he had the patient's file before him. The patients had cancer in an advanced stage, mainly untreatable (with little hope by the physician that any conventional treatment would
147
Journal of Orthomolecular Medicine Vol. 5, No. 3, 1990
have more than a palliative effect) but they were ambulatory at the time of registration with him, whereas Cameron's patients were hospitalized at the beginning of their vitamin C regimen (Cameron and Campbell, 1974; Cameron, Campbell and Jack, 1975; Cameron and Pauling, 1974, 1976, 1978, 1979).
The first few patients in this study had been referred to the psychiatrist because of having shown severe depression, and the later ones, who usually suffered from anxiety, because the physicians in the area were beginning to think that the Hoffer regimen, in addition to appropriate conventional therapy, might have significant value for patients with advanced cancer. Dr. Hoffer discussed with each patient the nature of the regimen and expressed the hope that their probable future would be improved by this treatment. It was his intention that every patient would follow the same regimen. There were, however, 33 of the 134 patients who did not follow the regimen. In no case did this occur through action by Dr. Hoffer. Some patients were discouraged from following it by the practitioner after Dr. Hoffer had sent him his findings and treatment recommendations. Also, some were in the middle of a course of chemo-therapy and were so sick with nausea and vomiting that they could not ingest the vitamins, and some of the patients for themselves decided not to follow the regimen. There is no evidence that the controls (Tables 1 and 2) were significantly different from the patients who followed the regimen (Tables 4 and 5). For example, the fractions of controls who had received conventional therapy (surgery, radiation, chemotherapy) before registration was 85% for the 33 controls and also 85% for the 101 other patients, and the mean age at registration was 53.1, 52.8, 51.9 and 55.3 years for the four cohorts of Tables, 1,2,4 and 5. Our conclusion is that 80% of the patients who followed the regimen have a probable survival time 21 times that of the controls (Table 4) or 13 times that of the controls (Table 5), or, for all 81 patients, 16 times that of the 31 controls. The mean survival time of the main subgroup of 31 controls, 5.7 mo, is about what is observed for ambulatory patients
who have reached or are close to the terminal stage of cancer, with 85% having received potentially curative or palliative conventional therapy. The much longer mean survival time of 81 of the similar patients who followed the regimen, 92 mo, must surely be attributed to this regimen.
These results may be compared with those found in other studies. In 1976 Cameron and Pauling published values of t and tf, starting from the date of untreatability for 198 patients with cancer of the breast, ovary or uterus in Vale of Leven Hospital, Lochlomondside, Scotland, of whom 18 had received continuously 10 g of sodium ascorbate per day, beginning on the date of untreatability, and 180 had not received this vitamin. The value of T for the latter, equal toEt/180 (no t+), was 2.2 mo, and the corresponding value for the vitamin C cohort (which had some survivors), evaluated by Equations 5 and 12 and the survival fraction, was 13 mo, 6 times as great. For the patients with other kinds of cancer the ratio was also 6 (9 mo vs 1.5 mo). All of the survival times are smaller than those for the present study because the patients in Scotland were at a more advanced stage when they entered the study, that of untreatability and hospitalization, after which no further potentially curative or palliative treatment (except vitamin C) was administered. The larger ratios in the present study might have resulted from several differences, such as the somewhat larger amounts of vitamin C (12 g/d rathber than 10 g/d) and the administration also of other vitamins and minerals in large amounts (somewhat variable, usually niacin or niacinamide 1.5 or 3 g/d, Pyridoxine 250 mg/d, other B vitamins in variable amounts, vitamin E 800 I.U./d, 0-carotene 30,000 I.U./d, selenium 200 to 500 Mg/d, other minerals); the patients were also given advice about the selection of foods.
On the basis of these results and of those reported by Cameron and his collaborators we strongly recommend that patients with cancer follow the regimen described in this paper, as an adjunct to appropriate conventional therapy.
We also join Ewan Cameron (Cameron, 1974) in recommeding that physicians consider
148
Analysis of Mortality Data for Cancer Patients Receiving Vitamin C and Other Nutrients
administering large amounts of sodium ascorbate by intravenous infusion to patients with advanced cancer. Cameron himselfgave intravenous ascorbate, usually 10 g/d for about 10 days, as well as oral ascorbate continued indefinitely, to each of his patients, and other physicians have reported the successful use of intravenous ascorbate (Riordan et al, 1990).
References Burch PRJ: The Biology of Cancer, A New Approach. University Park Press, Baltimore, 1976. Cameron E and Campbell A: The Orthomolecular treatment of cancer. II. Clinical trial of high-dose ascorbic supplements in advanced human cancer. Chemical-Biological Interactions 9:285-315, 1974. Cameron E, Campbell A and Jack T: The Orthomolecular treatment of cancer. III. Reticulum cell sarcoma: double complete regression induced by high-dose ascorbic acid therapy. Chemical-Biological Interactions 11:387-393, 1975. Cameron E and Pauling L: Ascorbic acid and the glycosaminoglycans: An Orthomolecular approach to cancer and other diseases. Oncology 27:181-192, 1973. Cameron E and Pauling L: The Orthomolecular treatment of cancer. I. The role of ascorbic acid in host resistance. Chemical-Biological Interactions 9: 273-283, 1974. Cameron E and Pauling L: Supplemental ascorbate in the supportive treatment of cancer: Prolongation of survival times in terminal human cancer. Proceedings of the National Academy of Sciences USA 73:3685-3689, 1976. Cameron E and Pauling L: Supplemental ascorbate in the supportive treatment of cancer: Reevaluation of prolongation of survival times in terminal human cancer. Proceedings of the National Academy of Sciences USA 75:4538-4542, 1978. Cameron E and Pauling L: Experimental studies designed to evaluate the management of patients with incurable cancer. Proceedings of the National Academy of Sciences USA 75:6252, 1978.
Cameron E and Pauling L: Cancer and Vitamin C. Linus Pauling Institute of Science and Medicine, Palo Alto, CA, 1979. Creagan ET, Moertel CG, O'Fallon JR, Schutt AJ, O'Connell MJ, Rubin J and Frytak S: Failure of high-dose vitamin C (ascorbic acid) therapy to benefit patients with advanced cancer: A controlled trial. New England Journal of Medicine 301:687-690, 1979. Gompertz B: A sketch of an analysis and notation applicable to the estimation of the value of life contingencies. Phil. Trans. Roy. Soc. London 110:214-294, 1820. Gompertz B: On the nature of the function expressive of the law of human mortality, and on a new mode of determining the value of life contingencies. In a letter to Francis Baily, Esq. F.R.S. etc. Phil. Trans. Soc. London 115:513-585, 1825. Gompertz B: A supplement to the two papers of 1820 and 1825. Phil. Trans. Soc. London 152:511-559, 1862. Hoffer A, Osmond H, Callbeck MJ and Kahan I: Treatment of schizophrenics with nicotinic acid and nicotinamide. /. Clin. Exper. Psychopath. 18:131-149, 1957. Jones HB: Demographic consideration of the cancer problem. Trans. N.Y. Acad. Sci. 18:298-333, 1956.
Moertel CG, Fleming TR, Creagan ET, Rubin J, O'Connell MJ and Ames MM: High-dose vitamin C versus placebo in the treatment of patients with advanced cancer who had no prior chemotherapy. New England Journal of Medicine 312:137-141, 1985. Pauling L: Biostatistical analysis of mortality data for cohorts of cancer patients. Proc. Nat. Acad. Sci. USA 86:3466-3488, 1989. Pauling L and Herman ZS: Criteria for the validity of clinical trials of treatments of cohorts of cancer patients based on the Hardin Jones principle. Proc. Nat. Acad. Sci. USA 86:6835-6837, 1989. Riordan HD, Jackson JA and Schulz, Mavis Case Study: High-dose intravenous vitamin C in the treatment of a patient with adenocarcinoma of the kidney. /. Orthomol. Med. 5:5-7, 1990.
149
Journal of Orthomolecular Medicine Vol. 5, No. 3, 1990
Table 1. Values of survival times for 11 female patients with cancer of the breast, ovary, uterus, or Fallopian tube who had not received ascorbic acid or other vitamins as an adjunct to other therapy (column 7). Column A gives the date when the patient was first seen by A.H. and entered into this study. Column B gives the number of months between the diagnosis of cancer and the date in column A. The date of death or the state of health on January 1, 1990 is given in column C.
A Age Type B Treat-ment3 c Survival
(mo) 4. M.B. 09/81 37 Ovary 9 R,C Died 01/82 2.6 7. J.C. 01/80 57 Breast 3 S,C Died 04/80 3.7 9. A.A. 07/84 38 Ovary 3 S,C Died 07/85 12 31.E.H. 11/85 50 Fallopian tube 2 S 111 49+ 59. J.M. 10/86 30 Breast 21 S,R, C Died 03/87 6 65. D.P. 06/85 64 Ovary 12 S,C Died 09/85 3.2 76. M.S. 12/81 56 Uterus 32 S,C Died 03/82 4.0 79. N.T. 11/80 65 Breast 36 s Died 01/81 1.8
81.S.W. 08/82 53 Breast 48 s,c Died 10/82 2.2
113. J.G. 07/87 77 Ovary 7 s,c Died 11/87 4.0
115. S.A. 06/86 57 Breast 12 S,C,R Died 10/86 4.2
S = surgery, R = radiation, C = chemotherapy.
Table 3. Values of the mean survival time T calculated by 4 methods for the cohort of 31 patients in Tables 1 and 2 (No. 14 and No. 31 not included, see text)
150
Analysis of Mortality Data for Cancer Patients Receiving Vitamin C and Other Nutrients
Table 2. Values of survival times for 22 patients with cancer of several kinds who had not received ascorbic acid or other vitamins as an adjunct to other therapy (column 8). Column A gives the date when the patient was first seen and entered into this study. Column B gives the number of months between the diagnosis of cancer and the date in column A. The date of death or the state of health on January 1,1990 is given in column C.
Treat- Survival A Age Sex Type B ment8 C (mo)
8. B.C. 07/86 63 F Carcinoid 24 S,R Died 09/86 1.512. J.C. 11/86 60 M Colon 11 S,R Died 12/86 0.413. E.C. 09/85 68 F Abdominal, no
primary 2 N Died 10/85 1.1
14. R.C. 11/83 47 M Testes, 10 C Died 08/87 4516. J.D. 01/86 59 F liver
Multiple myeloma
4 C Died 10/86 8
26. H.F. 07/86 59 M Lymphoma 14 R,C Died 01/88 1830. R.V. 10/85 35 M Colon 36 s Died 05/87 19
32. P.J. 04/86 37 M Lung 3 c Died 06/86 2
47. E.L. 04/79 76 F Lung 7 N Died 11/79 750. M.M. 06/82 62 F Kidney, lung 1 N Died 08/82 1.556. D.M. 07/82 75 M Stomach,
duodenum 0 s Died 11/82 4
57. A.M. 08/77 23 F Melanoma, brain
4 S,R Died 09/77 1.9
78. R.T. 06/83 53 M Colon 7 S Died 08/83 299. K.B. 02/87 46 F Lung 22 S,R,C Died 03/87 1.0102. CA. 07/86 60 M Liver 2 N Died 09/86 1.6103. C.B. 02/88 33 F Liver 1 N Died 03/88 2109. U.G. 03/88 53 F Pancreas 3 C Died 05/88 2.4110. D.G. 10/87 54 M Prostate 24 s,c Died 11/87 1
112. R.F. 06/87 54 M Prostate 60 S,C,R 111 30+114. E.G. 07/87 68 F Bowel 2 s Died 11/87 4
127. K.R. 11/87 58 F Stomach 8 s Died 10/88 11
131. M.Y. 06/87 18 M Rhabdomyo -sarcoma
18 S,R,C Died 07/87 1
a S = surgery, R = radiation, C = chemotherapy, N =no treatment.
151
Journal of Orthomolecular Medicine Vol. 5, No. 3, 1990 Table 4. Values of survival times for 40 female patients with cancer of the breast, ovary, uterus, or cervix who had received ascorbic acid and other vitamins as an adjunct to other therapy (column 7). Column A gives the date when the patient was first seen by A.H. and entered into this study; it is also the date when the administration of vitamin C and the other vitamins was begun. Column B gives the number of months between the diagnosis of cancer and the date in column A. The date of death or the state of health on January 1, 1990 is given in column C. Column AA gives the rate of intake of ascorbic acid in g/d.
A Age Type B Treatment3 AA C tor t5. Y.A. 07/86 48 Breast 1 R 10 Well 41 +10. M.B. 07/85 46 Breast 1 S,R 12 Well 53+19. B.D. 02/83 40 Uterus 24 S,R 6 Well 82+20. J.E. 10/84 49 Breast 18 S,R 12 Died 12/85 1421.M.E. 10/86 47 Breast 18 S,C 12 Died 8/88 2223. B.Do. 05/82 41 Ovary 12 S,R 6 Well 91 +25. L.H. 07/81 38 Breast 5 S,C 12 Died 06/83 2327. J.H. 12/83 46 Breast 4 S,R 10 Well 73+29. K.F. 06/84 48 Ovary 2 S,C 12 Died 12/86 3035. M.H. 11/82 56 Breast 12 S,C 12 Alive 85+36. D.J. 10/83 70 Breast 24 S,C 6 Died 08/88 5838. L.K. 11/84 65 Breast 1 S,R,C 12 Alive 61 +40. B.K. 10/85 58 Breast 1 S,R 12 Well 50+41. C.L. 08/84 38 Uterus 0 N 12 Well 64+44. M.C. 08/84 69 Breast 2 S,R 12 Well 64+48. E.M. 12/86 39 Breast 18 S 12 Well 35+53. H.M. 07/81 41 Breast 1 S,C 12 Died 04/82 955. V.M. 03/86 56 Breast 42 s 4 Well 45+60. S.S. 03/83 37 Cervix 2 N 9 Well 81 +61. M.N. 08/82 65 Breast 12 S,R 12 Died 12/85 4062. U.T. 06/83 47 Breast 15 S 8 Well 78+63. B.O. 02/85 45 Breast 1 s 12 Well 58+67. M.P1. 07/86 46 Cervix 72 S,R,C 12 Died 10/86 375.1.S. 12/78 58 Uterus 5 S,C 3 Died 10/79 1082. M.W. 03/82 50 Breast 12 R,C 12 Died 06/86 5183. R.S. 10/84 52 Breast 23 S,C,R 18 Died 05/88 4388. D.K. 10/86 56 Breast 0 S,C 12 Well 38+90. N.S. 06/86 56 Uterus 8 R 12 Died 04/87 1091.E.P. 05/80 69 Uterus 0 S,C,R 3 117+93. M.Y. 09/86 71 Breast 1 S,R 12 Well 39+108. W.F. 11/87 43 Breast 6 S,C 12 Died 05/88 6lll.S.C. 07/87 41 Ovary 8 s 12 Died 11/88 16116. A.A. 09/87 68 Ovary 19 s 12 Died 09/88 12117. G.J. 04/87 46 Breast 36 S,C,R 4 Well 32+118. S.V. 09/87 49 Breast 0 R 12 Well 27+120. A.H. 03/88 73 Cervix 36 R 12 Died 06/88 3124. G.C. 03/88 60 Breast 21 S,C 6 Well 21 +129. G.S. 11/87 45 Breast 12 S,R 12 Well 25+130. E.W. 07/87 62 Ovary 9 S,C 12 Died 03/88 8133. C.W. 12/87 41 Breast 60 S,C 12 Died 03/89 16
a S = surgery, R = radiation, C = chemotherapy, N = no treatment.
152
Analysis of Mortality Data for Cancer Patients Receiving Vitamin C and Other Nutrients
Table 5. Values of survival times for 61 patients with several kinds of cancer who had received ascorbic acid and other vitamins as an adjunct to other therapy (column 8). Column A gives the date when the patient was first seen by A.H. and entered into this study; it is also the date when the administration of vitamin C and the other vitamins was begun. Column B gives the number of months betwen the diagnosis of cancer and the date in column A. The date of death or the state of health on January 1,1990 is given in column C. Column AA gives the rate of intake of ascorbic acid in g/d.
Treat- A Age Sex Type B ment3 AA C t or t+
l.E.R. 04/84 64 F Lung 4 R 12 Well 68+2. E.B. 03/86 63 M Lung 1 N 20 Died 02/87 143. R.B. 07/82 68 M Mesothelioma 12 R 18 Died 12/82 56. C.B. 01/80 72 M Sarcoma 24 R 12 Died 08/89 115ll.R.M. 03/84 25 M Lymphoma 16 R,C 12 Well 69+15. S.B. 04/86 59 M Colon 5 S 12 Well 44+17. R.D. 04/79 60 M Glioblastoma 8 S 16 Died 07/80 1518. B.D. 06/80 63 M Vocal cord 72 S,R 12 Well 114+22. L.E. 08/81 16 F Ewing's sarcoma 22 R,C 12 Well 100+24. M.G. 04/83 62 F Bladder 6 S,R 12 Died 08/88 6428. N.H. 09/82 58 M Pancreas 17 S 10 Died 11/82 233. C.H. 09/80 53 F Lung 2 s 12 Died 04/81 734. G.I. 11/86 71 M Prostate 12 s 12 Died 05/87 637. C.K. 03/81 54 F Lung 4 R,C 12 Well 105+39. F.K. 06/85 56 M Lung 24 R,C 12 Died 11/86 1742. J.L. 11/84 52 M Lung 3 R 12 Died 05/85 643. A.L. 11/86 56 M Prostate 1 R 12 Well 37+45.1.L. 07/80 73 F Colon 29 S,R 5 Died 05/81 1046. L.L. 12/83 63 F Abdominal 2 S,C 12 Died 02/85 1549. D.M. 05/84 39 F Abdominal 3 S 15 Well 66+51.T.M. 01/83 35 F Lung 12 c 12 Died 07/83 652.J.M. 05/86 71 M Leukemia 1 N 40 Died 02/87 954. T.L. 07/81 67 M Lung 12 R 4 Died 05/82 658. H.M. 11/86 64 F Pancreas 24 S 12 Well 37+64. R.D. 11/85 40 M Kidney-lung 12 S 12 Died 03/88 2866. M.P. 02/84 14 M Lymphoma 48 S,C 3 Well 70+68. K.P. 04/86 56 M Stomach 6 N 12 Died 07/86 369. M.R. 11/86 8 M Brain 22 S,R,C 6 Died 05/87 670. M.Q. 12/86 47 F Intestine 19 s 12 Well 36+71. D.R. 03/85 66 M Jaw 9 S,R 12 Died 09/85 672. D. Ro. 10/85 48 M Brain 60 S,R,C 12 Died 02/88 2873. S.R. 06/86 67 M Prostate 7 S,R 12 Well 42+74. A.Do. 06/83 36 M Lymphoma 2 S,C,R 12 Well 78+77. H.S. 09/85 50 M Leukemia 1 N 6 Died 10/87 2580. J.W. 11/83 54 F Colon 60 S 24 Died 12/84 1384. A.S. 07/78 59 F Pancreas 2 N 14-40 Well 137+85. B.S. 08/86 61 M Liver 12 N 7 Died 12/87 1686. D.T. 03/81 40 M Throat 6 R 12 Well 105+87. I.T. 04/82 30 M Colon 18 S 12 Well 92+89. J.G. 02/82 56 F Lung 9 R,C 12 Died 03/84 2592. J.D. 04/84 61 F Colon 120 S,R 12 Died 09/85 1794. S.W. 08/83 63 F Leukemia 0 N 3 Died 12/89 75
153
Journal of Orthomolecular Medicine Vol. 5, No. 3, 1990
Table 5 (cont'd.)
Treat- A Age Sex Type B ment3 AA C t or t+
95. M.M. 09/86 59 F Colon 0 S 12 Well 39+96. W.B. 06/87 58 F Kidney 6 S,C 12 Died 11/88 1797. D.Bo. 09/87 54 F Lung 0 s 12 Well 27+98. K.A. 06/86 61 M Prostate 12 R 12 Well 42+100. J.Bu. 06/87 62 F Bronchus 4 R 12 Died 04/88 10101. J.B. 11/86 56 F Bowel 5 R 12 Died 03/88 16104. F.C. 11/87 63 M Leukemia 18 C 12 Well 25+105. G.C. 05/87 77 M Prostate 24 S,R,C 12 Well 31 +106. Ge.C. 08/87 71 M Lung 8 N 12 Died 11/88 17107. R.G. 06/87 70 M Prostate 11 S,C 12 Died 12/87 6119. K.A. 08/87 63 M Pancreas 2 s 12 Died 05/88 9121. K.L. 03/88 41 M Lymphoma 36 c 12 Alive 21 +122. F.L. 07/87 64 F Colon 48 S,R 12 Well 29+123. CM. 03/88 56 M Prostate 6 N 12 Died 01/89 10125. F.M.L 03/87 73 M Multiple
myeloma 2 R,C 12 Well 27+
126. L.N. 09/87 42 F Kidney 6 S,R 12 Well 26+128. E.S. 07/87 79 M Abdomen 24 S,R 3-6 Died 06/88 11132. G.P. 04/87 36 M Spinal cord Long S 12 Well 32+134. J.P. 06/87 69 M Prostate 36 R 12 Died 12/89 30
a S = surgery, R = radiation, C = chemotherapy, N = no treatment.