HEAVY METALS IN CLAMS AND SEDIMENTS FROM MORRO BAY Masters Thesis Presented to the faculty of California Polytechnic State University, San Luis Obispo In partial fulfillment Of the requirements for the degree of Masters of Science in Civil and Environmental Engineering By Jennifer Pehaim June 2004
Transcript
HEAVY METALS IN CLAMS AND SEDIMENTS FROM MORRO BAY
Masters Thesis Presented to the faculty of
California Polytechnic State University, San Luis Obispo
In partial fulfillment Of the requirements for the degree of
Masters of Science in Civil and Environmental Engineering
Title: Heavy Metals in Clams and Sediments from Morro Bay
Author: Jennifer Pehaim
Date Submitted: June 2004
Dr. Yarrow Nelson, Advisor
Dr. Samuel A. Vigil, Committee Member
Dr. Tom Ruehr, Committee Member
iv
ABSTRACT Heavy Metals in Clams and Sediments from Morro Bay
Morro Bay on the Central Coast of California is an impacted estuary, currently listed by
the State Water Resources Control Board under the Clean Water Act as a 303(d) – Impaired Water Body for metals, pathogens, and sedimentation and siltation (SWRCB 2002 Staff Report). Although the sediment concentrations of some metals are elevated in the Morro Bay estuary, the bioavailability of these metals to aquatic organisms living in the estuary is unknown.
A study of metal contamination of clams and the surrounding sediments collected from the estuary was conducted to evaluate the potential impacts and bioavailability of these metals. An additional purpose of this study was to determine if sediment metal concentrations could be used as a reliable predictor of metal concentrations in clams. From the metal concentrations measured, acceptable consumption levels for five metals (As, Cd, Cr, Pb, and Ni) were calculated from the Food and Drug Administration (USFDA) Guidance Documents for Metals in Shellfish.
The two clam species found in the bay were Macoma secta and Macoma suda. The clams and surrounding sediments were collected in the bay over three days at five different sites and were analyzed for nine different elements (As, Cd, Cr, Cu, Pb, Ni, V, Zn, and Fe) using inductively coupled plasma (ICP) analysis (EPA Method 6010).
Of the metals tested, total chromium and nickel are of greatest concern. Total chromium sediment concentrations (average 62.8 mg/kg) exceeded the NOAA Threshold Effects Level (TEL) of 52.3 mg/kg, and clam concentrations (average 37.0 mg/kg) greatly exceeded the Median International Standards (MIS) of 1.0 mg/kg. No correlation was found between total chromium concentrations in clams and total chromium concentrations in sediments. For some of the sampling sites, the total chromium concentrations were higher in the clams than in the sediments, and at other sites the opposite was true. Nickel sediment (average 79.9 mg/kg) and clam concentrations (average 25.6 mg/kg) exceeded NOAA benchmark values for sediments, but no tissue benchmark value could be found for nickel. Nickel did not bioaccumulate in the clams as evidenced by considerably lower concentrations in the clams compared to the sediments.
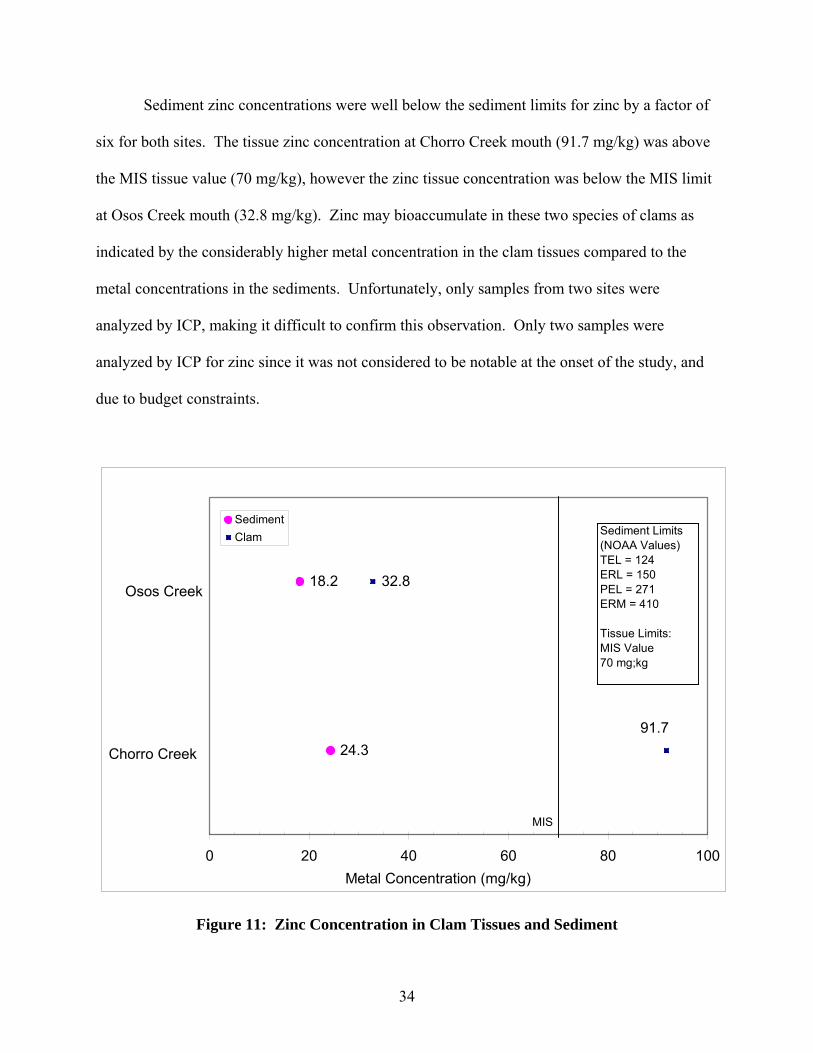
Clam tissue concentrations of total arsenic exceeded both the USFWS limit of 0.25 mg/kg and the OEHHA 1.0 mg/kg benchmark. However, measured total arsenic concentrations were very close to the detection limit, therefore arsenic is probably not a concern in Morro Bay. The concentration of zinc in clams was higher than the MIS (70 mg/kg) at the mouth of Chorro Creek site (Site 2). However, sediment and tissue zinc concentrations were below the TEL and MIS values for zinc at all other sites. Higher zinc concentrations were observed in the clam tissues compared to the zinc concentrations in the sediments, indicating zinc might bioaccumulate in these two species of clams.
Tissue metal concentrations for clams collected near the mouth of Chorro Creek (Site 2) were high for cadmium, total chromium, nickel, and zinc. Clam tissue metal concentrations for South Middle Bay (Site 5) appear to be unusually high for total chromium, nickel and vanadium. Sediment and clam metal concentrations were low at all sites for total arsenic, copper, lead, and
v
vanadium. Metal concentrations were lower in clams than in sediments at all sites for total arsenic, cadmium, copper, nickel, lead, and vanadium.
Consumption of clams from Morro Bay at normal consumption rates should be safe with regards to total arsenic, cadmium, lead, and nickel concentrations. However, total chromium measured in the clam tissue may not be safe to eat at the USFDA Levels of Concern if clams from Morro Bay are consumed at normal shellfish consumption levels. Consumption of more than 25 g per week of clams in Morro Bay could place a 60 kg person over the USFDA Level of Concern for chromium consumption.
vi
ACKNOWLEDGMENTS
I would like to express my deepest gratitude to my thesis advisor and professor Dr.
Yarrow Nelson in the Environmental Engineering Department for his expertise and immense
patience with me through the course of this project. His hard work and diligence made this
project possible. A special thanks to Dr. Tom Ruehr in the Soil Science Department for his
insightful discussions and for his different approach to my project. Thank you to my professor
and thesis board advisor, Dr. Sam Vigil, for his work in this project.
A special thanks to the Morro Bay National Estuary Program (NEP) for their generous
mini-grant, which made this project possible.
Thank you to the staff at Department of Fish and Game, Moss Landing, especially Gary
Ichikawa for answering my relentless questions and opening their facilities for my use.
I would also like to express my deepest gratitude to my parents and husband for their
vigilance, guidance, and support. All of you are my rock in the turbulent seas of life and you all
played an important role in my achievements and success in life. Thank you.
vii
TABLE OF CONTENTS
List of Tables ................................................................................................................................ ix
List of Figures ..................................................................................................................................x
List of Abbreviations ..................................................................................................................... xi
Figure 1. Map of Moro Bay Sampling Sites .........................................................................11
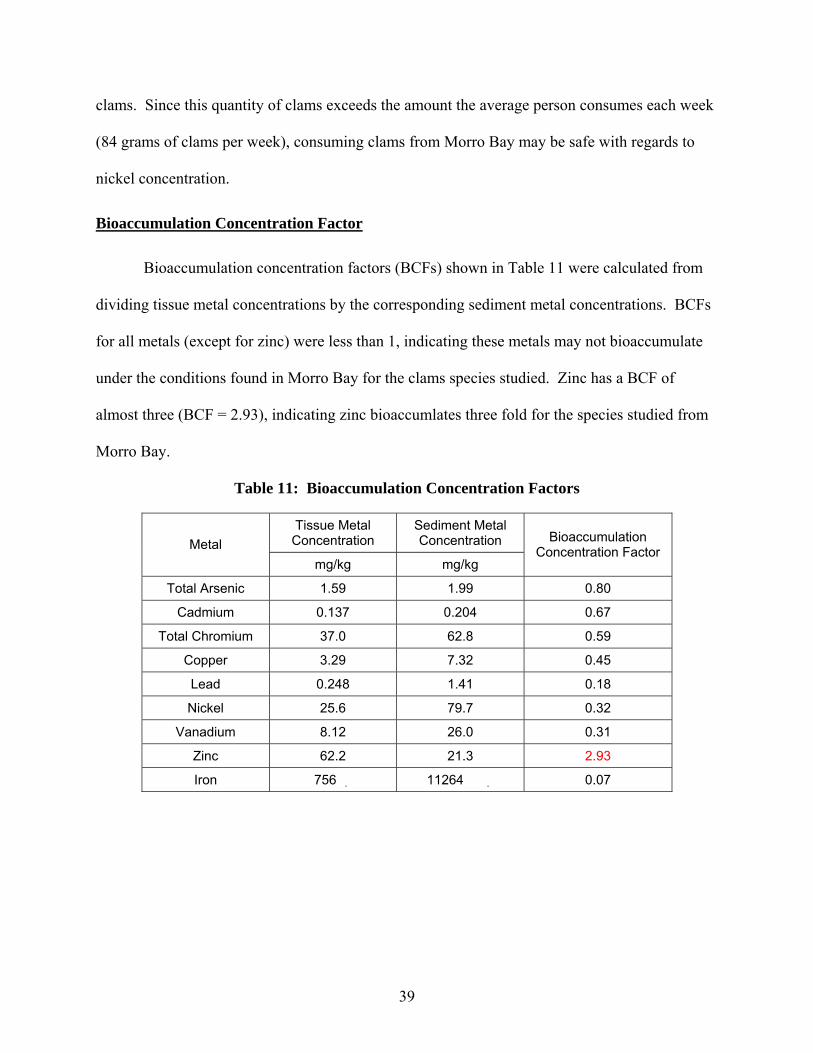
Figure 2. Metal Concentrations Averaged by Metal Over All Sites .....................................22
Figure 3. Total Arsenic Concentration in Clam Tissues and Sediment ................................25
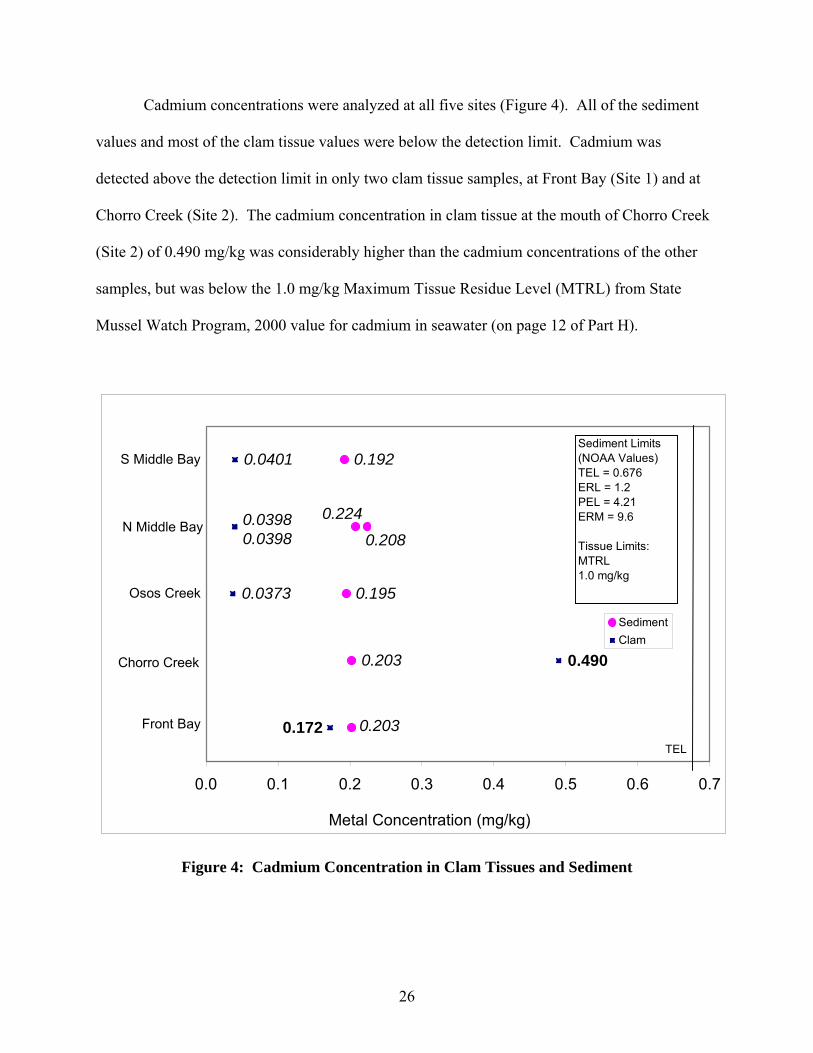
Figure 4. Cadmium Concentration in Clam Tissues and Sediment ......................................26
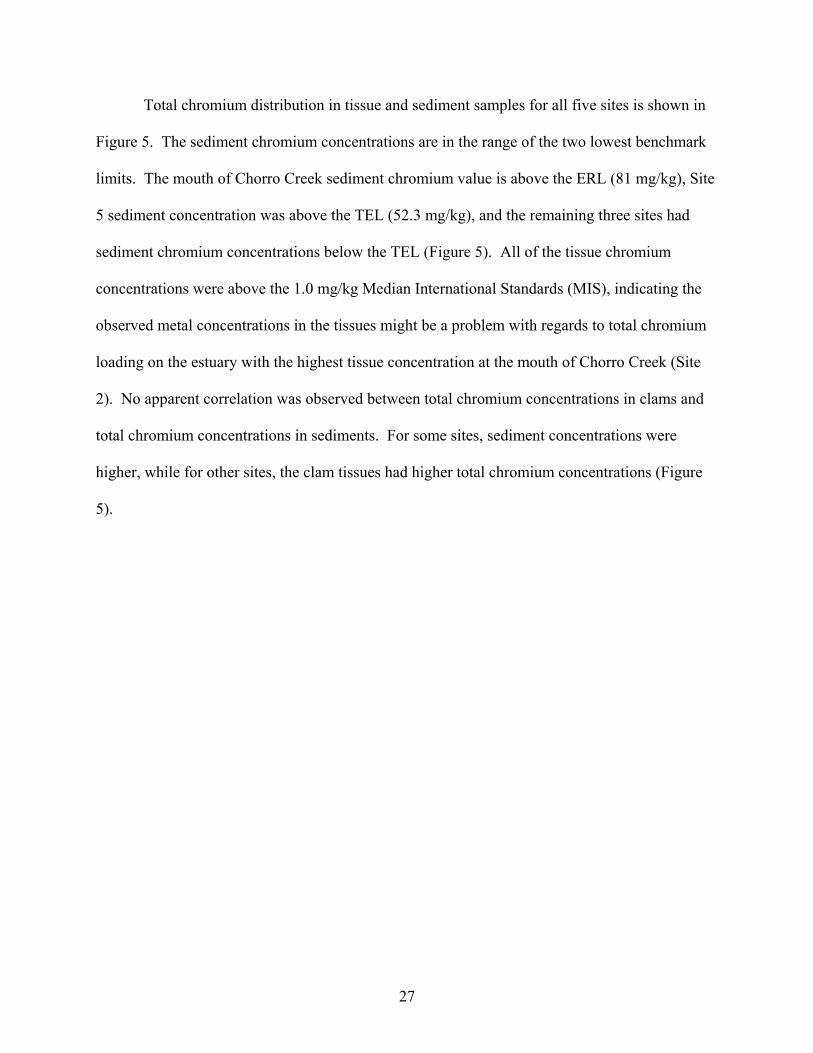
Figure 5. Total Chromium Concentration in Clam Tissues and Sediment ...........................28
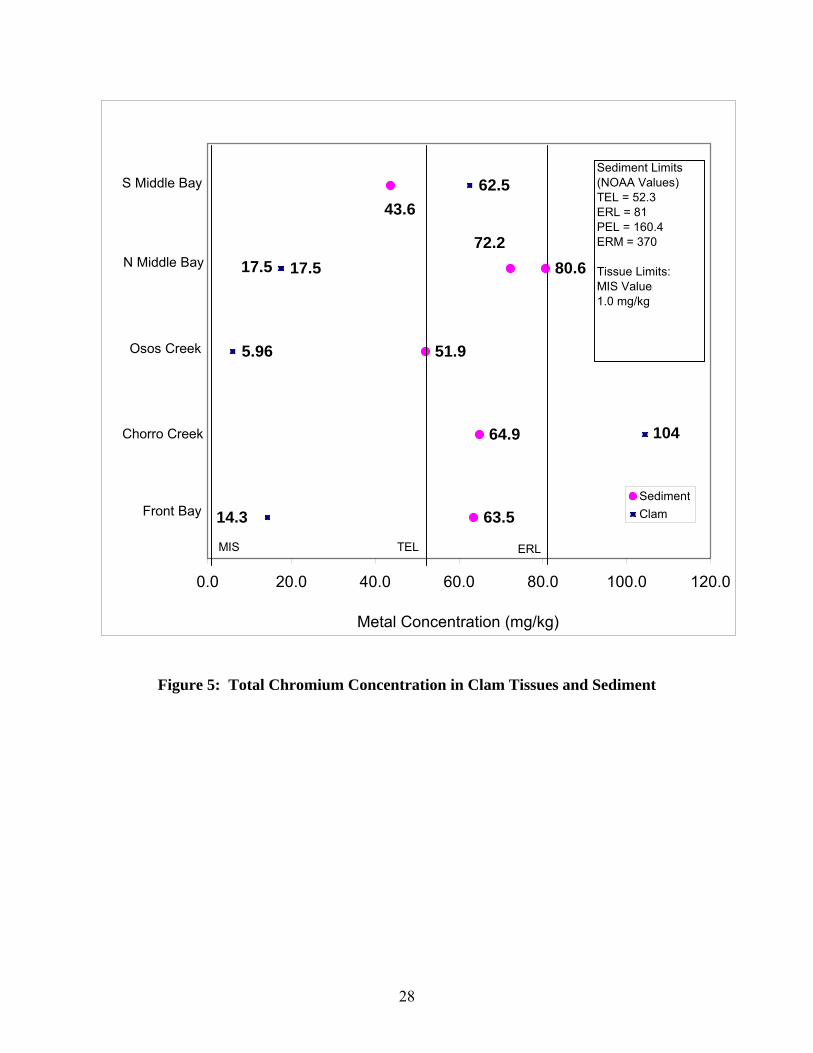
Figure 6. Copper Concentration in Clam Tissues and Sediments.........................................29
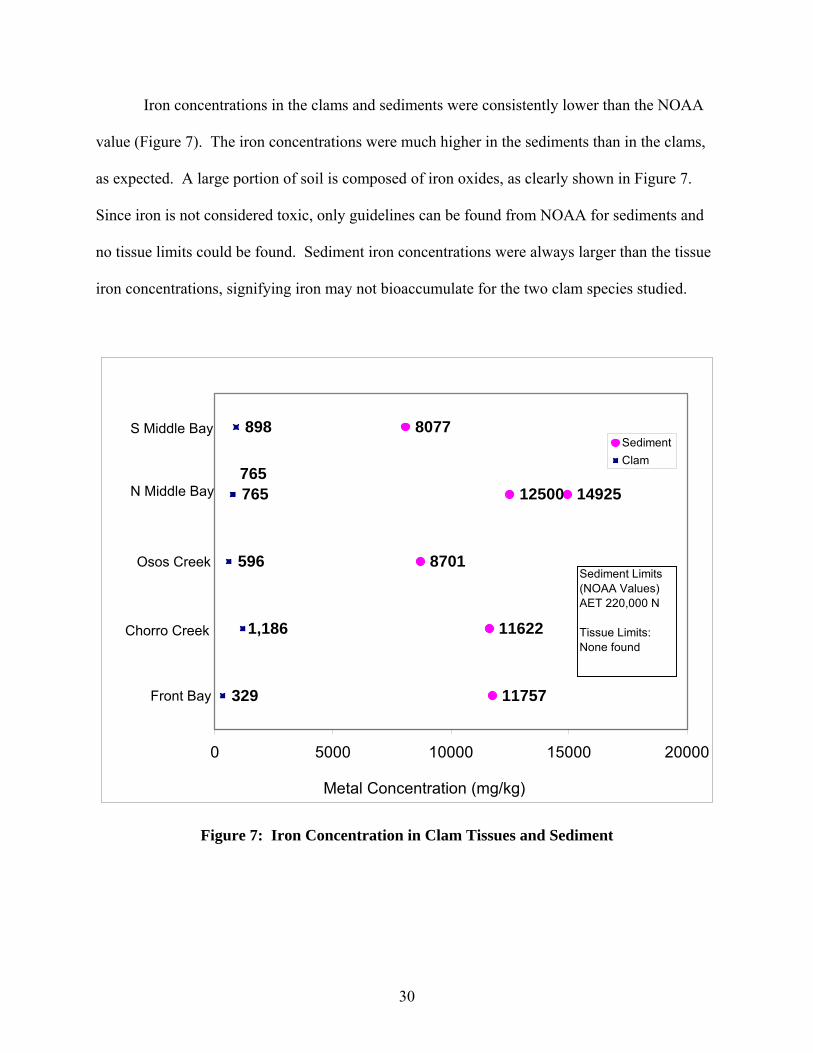
Figure 7. Iron Concentration in Clam Tissues and Sediments ..............................................30
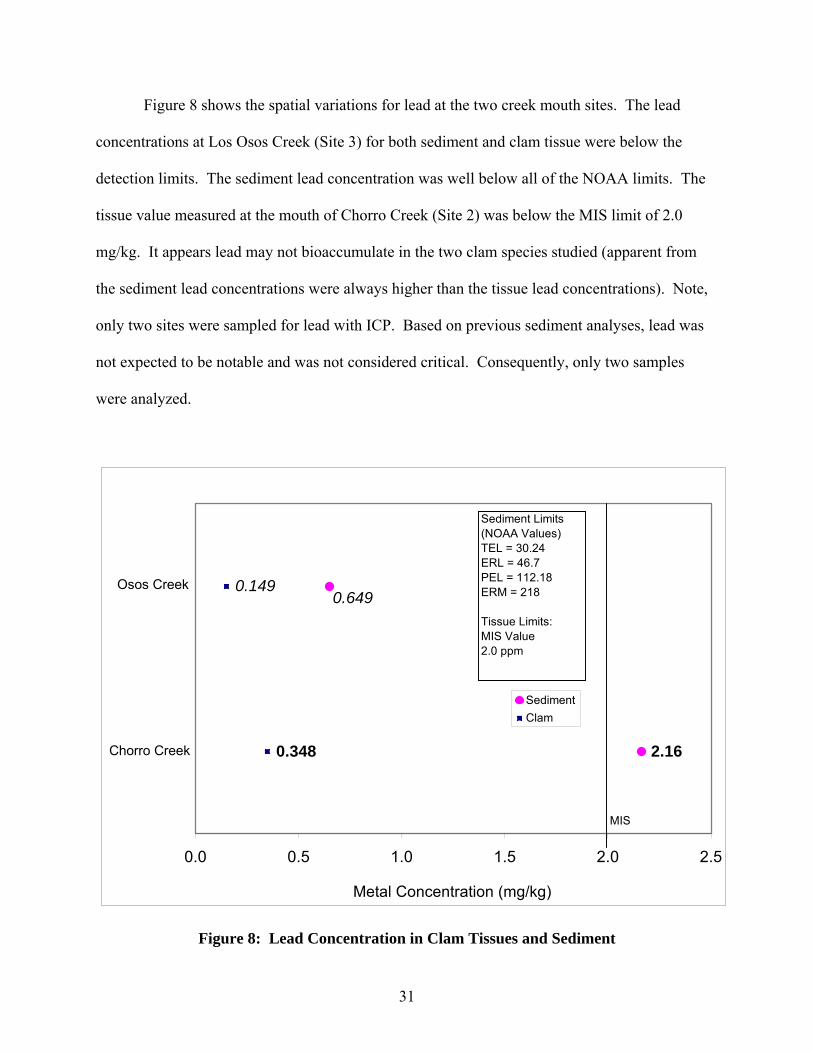
Figure 8. Lead Concentration in Clam Tissues and Sediments.............................................31
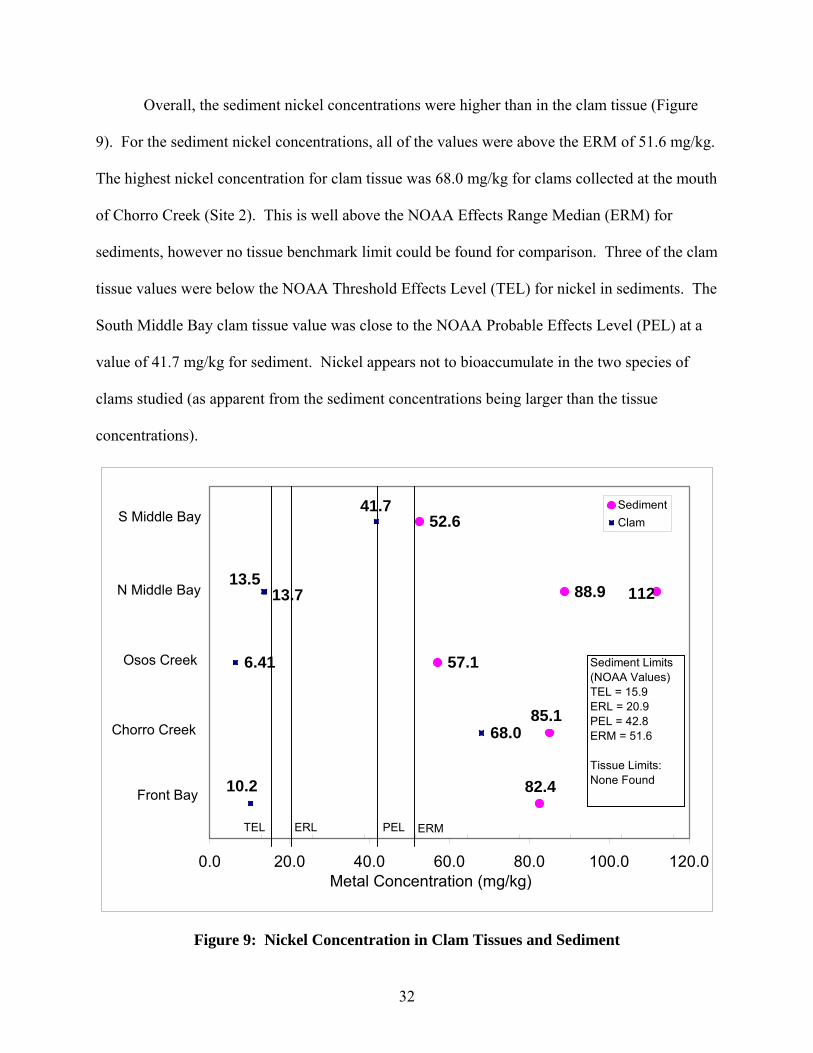
Figure 9. Nickel Concentration in Clam Tissues and Sediments ..........................................32
Figure 10. Vanadium Concentration in Clam Tissues and Sediments ....................................33
Figure 11. Zinc Concentration in Clam Tissues and Sediments .............................................34
xi
LIST OF ABBREVIATIONS
AET Apparent Effects Threshold (NOAA)
DDWQA Decision Document of Water Quality Assessment
CADFG California Department of Fish and Game
ERL Effects Range – Low (NOAA)
ERM Effects Range Median (NOAA)
USFDA Food and Drug Administration
ICP Inductively Coupled Plasma
MIS Median International Standards
MRCA Market Research Corporation of America
MTRL Maximum Tissue Residue Level(s) (State Mussel Watch Program, 2000)
NOAA National Oceanic Atmospheric Administration
OEHHA California Office of Environmental Health Hazard Assessment
PEL Probable Effects Level (NOAA)
RWQCB Regional Water Quality Control Board
SQuIRT Screening Quick Reference Tables
SWRCB State Water Resources Control Board
TEL Threshold Effects Level (NOAA)
USFW U.S. Fish and Wildlife
1
CHAPTER 1 INTRODUCTION
Morro Bay on the Central Coast of California is an impacted estuary, currently listed by
the State Water Resources Control Board (SWRCB) under the Clean Water Act as a 303(d) –
Impaired Water Body for metals, pathogens, and sedimentation and siltation (SWRCB 2002
Staff Report). Recent analyses by the Regional Water Quality Control Board (RWQCB) indicate
concentrations of several toxic metals in Morro Bay sediments are considerably higher than the
National Oceanic and Atmospheric Administration (NOAA) Apparent Effects Threshold (AET)
(Duffield, 2001, personal communication). The sediment concentrations of nickel (Ni), total
chromium (Cr) and aluminum (Al) are up to six times higher than the AET values for these
metals.
Although the sediment concentrations are elevated, the bioavailability of these metals to
aquatic organisms living in the estuary is unknown. Since clams are benthic filter feeders, they
are a meaningful indicator of the bioavailability of toxic metal contamination in the estuary
(Luoma et al., 1983). These animals ingest metal-enriched particles directly (Luoma et al.,
1983), thereby giving an indication of the bioaccumulation ability of metals. Therefore, a study
of metal contamination of clams and the surrounding sediments collected from the estuary was
conducted as an appropriate means of evaluating potential impacts of metal loadings from the
watershed plus residual metal contaminants in sediments. An additional purpose of this study
was to determine if sediment metal concentrations could be used as a reliable predictor of metal
concentrations in clams. Clams and surrounding sediments collected in the bay over three days
at five different sites were analyzed for nine different elements (As, Cd, Cr, Cu, Pb, Ni, V, Zn,
and Fe) using Inductively Coupled Plasma (ICP) analysis (EPA Method 6010). The clam and
2
sediment results were compared to NOAA metal standards. From the metal concentrations
measured in clams, an acceptable consumption levels for five metals (As, Cd, Cr, Pb, and Ni)
were calculated from the Food and Drug Administration (FDA) Guidance Documents for Metals
in Shellfish.
Oysters were originally considered for this study due to their ease in collection.
However, because the only oysters in the bay are located in an oyster farm, their spatial
distribution in Morro Bay is limited. Since a spatial relationship of metals was desired in this
study, it was decided native clams found in the bay would satisfy the necessary components for
this study. The two species found in the bay and used in the analyses were Macoma secta and
Macoma suda.
3
CHAPTER 2 BACKGROUND
Marine sediments of the world are increasingly contaminated with heavy metals and
other contaminants due to a history of industrial discharges and urban runoff. Marine sediments
are an important environmental component when considering the fate and transport of metals
within a watershed. The behavior and distribution of metals in marine sediments is influenced
by hydrodynamics, anthropogenic discharges, and biogeochemical processes (Zwolsman et al.,
1997). Marine bivalves (clams and mussels) have long been employed as pollution biomonitors
in coastal environments. This is due to their intimate contact with the contaminated sediments
and exceedingly high pumping activity and their responses are often proportional to ambient
pollutant concentrations (Wang and Guo., 2000).
Numerous factors need to be considered in marine environments when assessing
bioaccumulation of metals in bivalve animals. Various conditions (organic content, pH, and
presence of sulfide) are considered potential metal sinks. An important sink of metals are
hydrous iron oxides (a large part of oxidized sediments) acting by binding heavy metals to the
surface of sediments (Luoma and Bryan, 1978). The strength of metal binding to the particulates
contributes to the availability of the metal. Strongly bound metals are less available, and weakly
bounded metals are more available (Luoma, 1983). However, bound metals may be bioavailable
depending on the feeding and biogeochemical characteristic of the organism. No universal way
to assess the bioconcentration factors to benthic organisms exists for several reasons. The two
most important factors include differences between organisms and inconsistent chemistry
between metals and metal interactions. Redox cycles, such as those caused by tidal action
4
increased the metal availability to organisms by interfering with the metal species equilibrium
(Simpson et al., 2002).
Bioaccumulation Factors
Several studies have developed mathematical relationships to predict bioaccumulation of
metals in benthic organisms. In one recent experiment, the influences of metal bioavailability of
natural colloids to marine bivalves were studied using artificially contaminated sediments radio-
labeled metals (Wang and Guo, 2000). Their accumulation index was defined as the
radioactivity of metals in whole individual bivalve (dpm) divided by radioactivity of metals in
the water column (dpm/L). This index includes shell uptake by adsorption or absorption and
cannot be used to indicate the absolute uptake of metals to the tissues. Assimilation efficiencies
were calculated by Griscom et al. 2000, but were not clearly defined. Assimilation efficiencies
differed more widely between metals than among geochemical conditions for a single metal.
The maximum differences in metal assimilation efficiencies were approximately two-fold from
high organic content and low organic content. In addition, the direction (positive or negative) of
influence total organic content had on bioavailability assimilation efficiencies was not consistent
among metals or among species tested (Griscom et al., 2000).
Competitive Metal Sorption
Competitive sorption between different metals was observed in several studies. In one
recent study, zinc limited the uptake of cadmium in plants and animals (Brown et al., 2002a,
Brown et al., 2002b). This was due to the excessive amounts of zinc compared to cadmium
found at mine waste sites in ratios greater than 100 to 1 (Brown et al., 2002a). These high levels
of zinc created iron deficiencies in plants, causing yellowing of young leaves. Similar levels of
5
zinc created copper deficiencies in ruminant animals (cow, goat, deer, elk), but the deficiencies
were easily reversed during the span of the study with no apparent injury to the animal (Brown et
al., 2002b). Copper and chromium uptake from wastewaters by biomass consisting of the algae
from C. vulgaris were mutually inhibited by the presence of the other metals (Aksu and Açikel,
1998). Uptake inhibition was a function of pH; removal of copper was maximized at higher pH
(pH = 4) for copper and maximized at lower pH (pH = 2) for chromium (Aksu and Açikel,
1998). Such competitive sorption is likely to occur in marine sediments. The presence of one
metal in excess over the other metals will influence to some degree the uptake of each metal in
benthic organisms. For instance, the presence of iron may compete with lead in binding or
transport sites, thus decreasing the uptake of lead (Luoma and Bryan, 1978). Therefore,
comparing the concentration between all metals will yield an additional component needing to be
included in any bioaccumulation model.
Colloid Influences on Metal Transport
Metals are generally considered to be immobile in most soils due to various metal
binding processes (Luoma, 1983). However, the presence of colloid-bound metals as
resuspended soil particles is related to the soil metal concentrations and is an important factor for
metal transport. The presence of colloids enhances metal transport between 50 and 90 %, mainly
due to colloid-metal binding, and secondly due to cotransportation mechanisms (Karathanasis,
1999). Metal cotransport is dependent on the colloidal composition and the characteristics of the
metal (Karathanasis, 1999). An inverse relationship exists between sorption energy and surface
coverage (Karathanasis, 1999). Given this relationship, sorption affinities can be higher for the
colloids than for the soil matrix. Therefore, increased metal transport by preferentially sorbing
or desorbing metals from colloids is expected. Another study supported this relationship by
6
reporting the colloidal desorption was the primary process responsible for metal concentration
increase (Cantwell et al., 2002).
Several geochemical factors need to be considered when addressing the influence of
colloids on metal transfer. Factors include soil characteristics, colloid characteristics, pH,
organic carbon (OC), redox potential (Eh), tidal action, the presence of organisms in the
sediments, acid volatile sulfides (AVS), and dissolved oxygen (DO) (Karathanasis, 1999; Wang
and Guo, 2000; Simpson et al., 2002; Griscom et al., 2000; and Cantwell et al., 2002). Increased
colloidal surface area and charge, pH, and OC generally increase metal transport (Karathanasis,
1999 and Wang and Guo, 2000). In contrast, large colloid size and Fe- and Al-oxyhydroxides
present in the sediment were generally inhibiting for metal transport (Karathanasis, 1999). Grain
size regulated the amount of sediment resuspended to the water column, with the finer particles
(silt and clay fraction) increasing metal transport (Cantwell et al., 2002). Anaerobic and aerobic
cycles under simulated tidal action increased the flux of zinc to the overlying water due to
increased colloidal concentrations (Simpson et al., 2002). In addition, disturbances from benthic
organisms increased the colloidal concentration, thus increasing the zinc flux (Simpson et al.,
2002). Bioturbation of sediments can remove surface bacterial coatings and expose new surface
sites for adsorption of metals (Griscom et al., 2000). Acid volatile sulfides (AVS) react strongly
with metals to form insoluble metal sulfides, thus removing them from the water column (Lee et
al., 2000). Colloids with a high AVS concentration will increase metal transport due to the
increased mobility of the colloids. Dissolved oxygen and redox potential generally limit metal
transport. Various properties are influenced by dissolved oxygen concentrations, such as AVS
and redox potential. Therefore, DO is an important component to consider when determining
metal transport.
7
Colloid Influences on Bioavailability
The presence of colloids can increase the bioavailability of the metals to organisms
through two possible mechanisms. The first involves direct ingestion of the colloids. Colloidal
particles represent an important food source for deposit and suspension feeding benthic
organisms (Griscom et al., 2000). Uptake of metals from these particles is a function of the
particle metal concentration, feeding rates, and biogeochemical factors (Griscom et al., 2000).
The geochemical composition of the colloid amplifies the bioavailability of silver to deposit-
feeding clams. Manganese oxides increased the accumulation of silver 100 times more rapidly
than amorphous iron oxides (Luoma and Jenne, 1977). In addition to direct metal ingestion of
metal-bound colloids, colloids have the potential to release metals into the dissolved phase.
Uptake of metals from the dissolved phase is the second possible method. Aquatic colloids were
operationally defined as particles in the size fraction between 1 nm and 0.2 µm by Wang and
Guo, (2000) but Cantwell et al. (2002) defined colloids as particles retained on a one-micron
filter (≥ 1 µm). As illustrated by the differing definition of colloids, inaccurate recognition of
colloidal phase could be credited with the observed increase in bioavailability, the dissolved
metal phase or the colloid-bound metal phase.
Benthic organisms bioaccumulated substantial amounts of Cd, Ni, and Zn from sediments
when simultaneous extracted metals (SEM) were only a fraction of AVS, most notably for
cadmium (Lee et al., 2000). Although sulfide binds with metals to form insoluble metal sulfides,
feeding characteristics of the organism can increase the bioaccumulation from direct ingestion of
the colloids. Bioavailability of metals to benthic organisms followed changes in particulate
metal concentrations. However, metal concentration will not always predict bioavailability in
nature, as cautioned by Lee et al (2000). In addition, acid solubility alone was an inadequate
8
predictor of the bioavailability of metals in the gut of bivalves (Griscom et al., 2000; Luoma,
1983). In contrast to the study by Lee et al. (2000), cadmium uptake was not significantly
increased by colloidal concentration (Wang and Guo, 2000), because most Cd was partitioned
into the dissolved phase. In contrast to conventional thinking, anoxic conditions did not
significantly reduce metal uptake. Metals were bioavailable to benthic organisms under anoxic
conditions (Wang and Guo. 2000). The differences may be due to the different feeding methods
of the bivalves studied. Therefore, simple SEM/AVS correlations are not likely to be adequate
for predicting metal uptake by different species of benthic organisms in different environments.
Soil Amendments and Chelating Agents
Soil amendments (in-situ) and chelating agents (ex-situ) influence the availability of
metals for uptake by organisms. Biosolid amendments (municipal wastewater sludge) with
added alkaline byproducts significantly reduced metal availability and toxicity to organisms
(Brown et al., 2002a, Brown et al., 2002b). Metal availability in the soils decreased sufficiently
to be safe for plant and animal habitation (Brown et al., 2002a, Brown et al., 2002b). The
addition of capping materials over marine sediments reduced the zinc flux compared to no
application (control) samples (Simpson et al., 2002). The clean native sediment cap was the
most effective in reducing zinc flux. Capping materials were recommended to control metals
due to metal sulfide formation (Simpson et al., 2002). Four ex-situ extraction agents were
investigated for their ability to remove metals from contaminated sites (Steele and Pichtel, 1998).
Using EDTA (ethylenediaminetetraacetic acid) as an extraction species yielded better lead
removal rates than did ADA (N-2(acetamido)-iminodiacetic acid), PDA (pyridine-2,6-
dicarboxylic acid), and HCl for lead. However, HCl was a more efficient extractant for cadmium
(Simpson et al., 2002). Chelating agents have the added bonus of allowing recovery of the
9
metals for reuse or sale and the chelating reagent can be recovered for reuse in the process. In
addition, bioavailability was independent of the concentration of metals complexed with EDTA
or NTA compared to uptake from free metal ion concentrations. Depending on the extent and
characteristics of contamination in marine sediments, these and other methods may be a feasible
method for remediation of contaminated sediments by decreasing bioavailability of metals.
10
CHAPTER 3 PROCEDURES
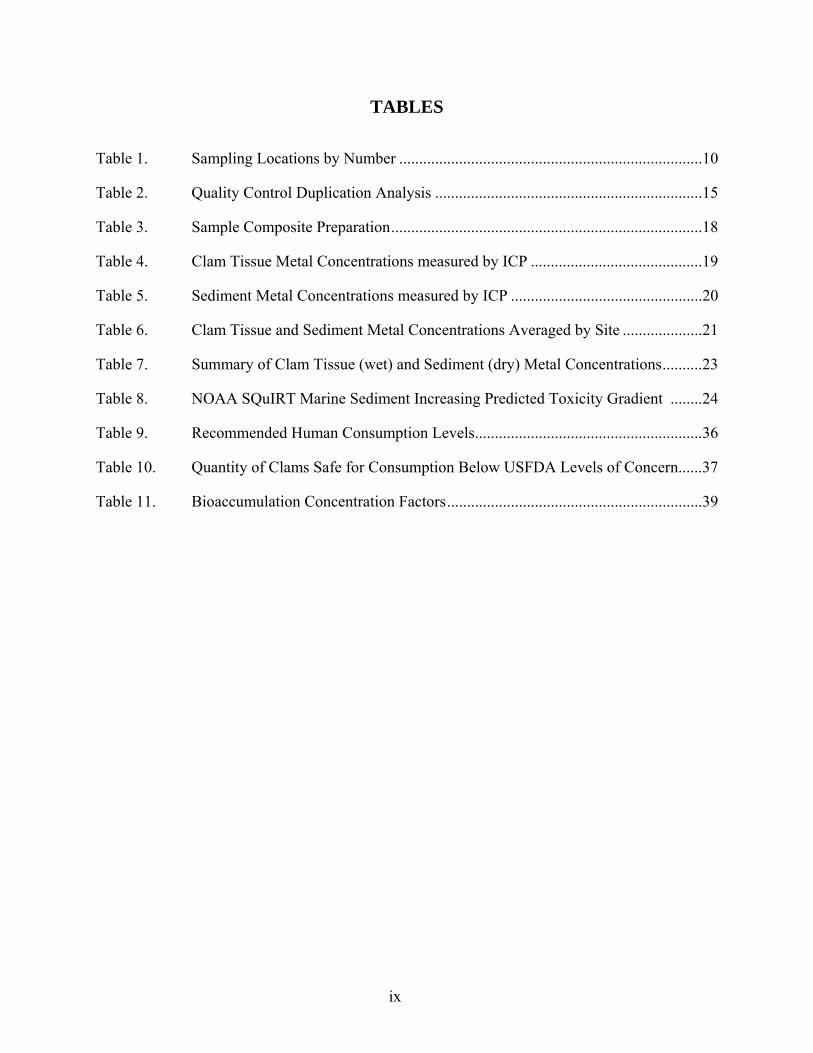
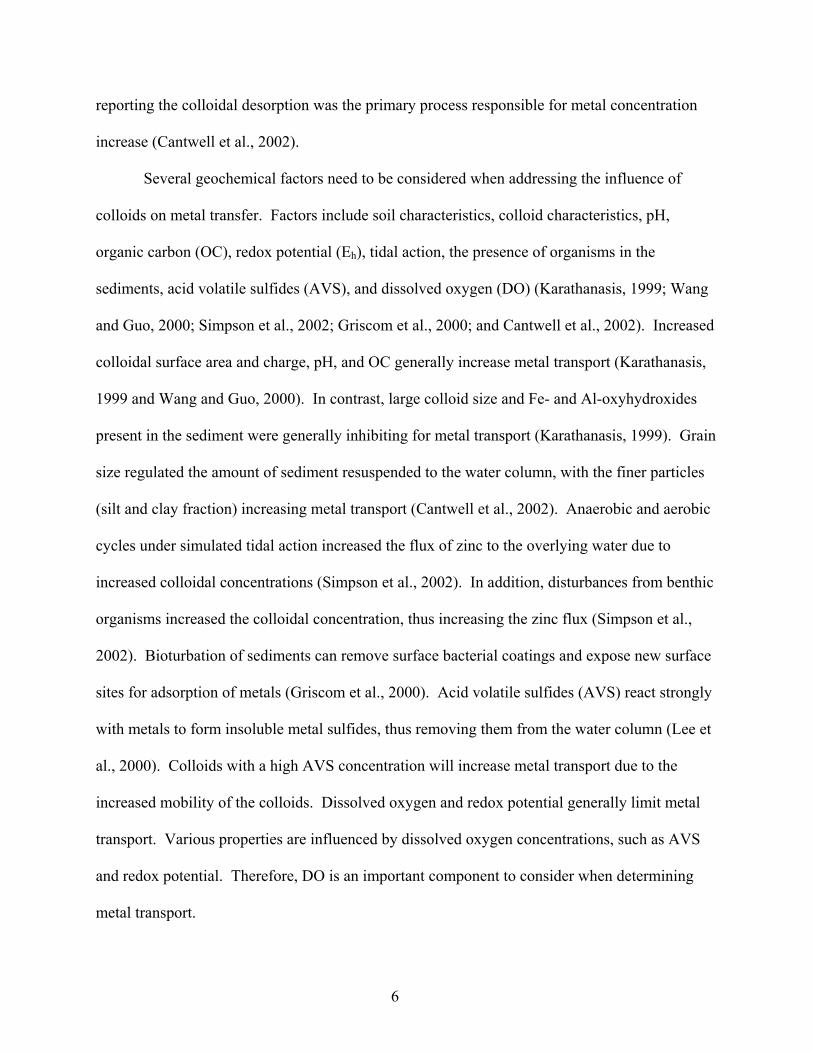
The sampling locations were in Morro Bay estuary in Central California. Five sampling
sites were chosen for clam and sediment collection to correspond to the same sites of previous
sediment sampling by Shanta Duffield at the RWQCB (Figure 1). The original sites included
Site 1 - Front Bay, Site 2 - Chorro Creek Mouth, Site 3 - Los Osos Creek Mouth, Site 4 - Back
Bay, and Site 5 - South Middle Bay. During collection, the Back Bay was determined to be
unsafe for collection because of deep mud, resulting in its abandonment as a collection site. A
second site in the middle of the bay (Site 4 - North Middle Bay) was chosen to maintain the
number of sites to five. The site numbers and locations are noted in Table 1 below. The days
chosen for sampling were April 29, May 4, and May 5, 2002, to take advantage of the negative
tides during daylight hours. Kayaks were used for transportation across the main channel and up
tributaries in the bay.
Table 1: Sampling Locations by Number
Site Number Site Location
1 Front Bay
2 Chorro Creek Mouth
3 Los Osos Creek Mouth
4 North Middle Bay
5 South Middle Bay
11
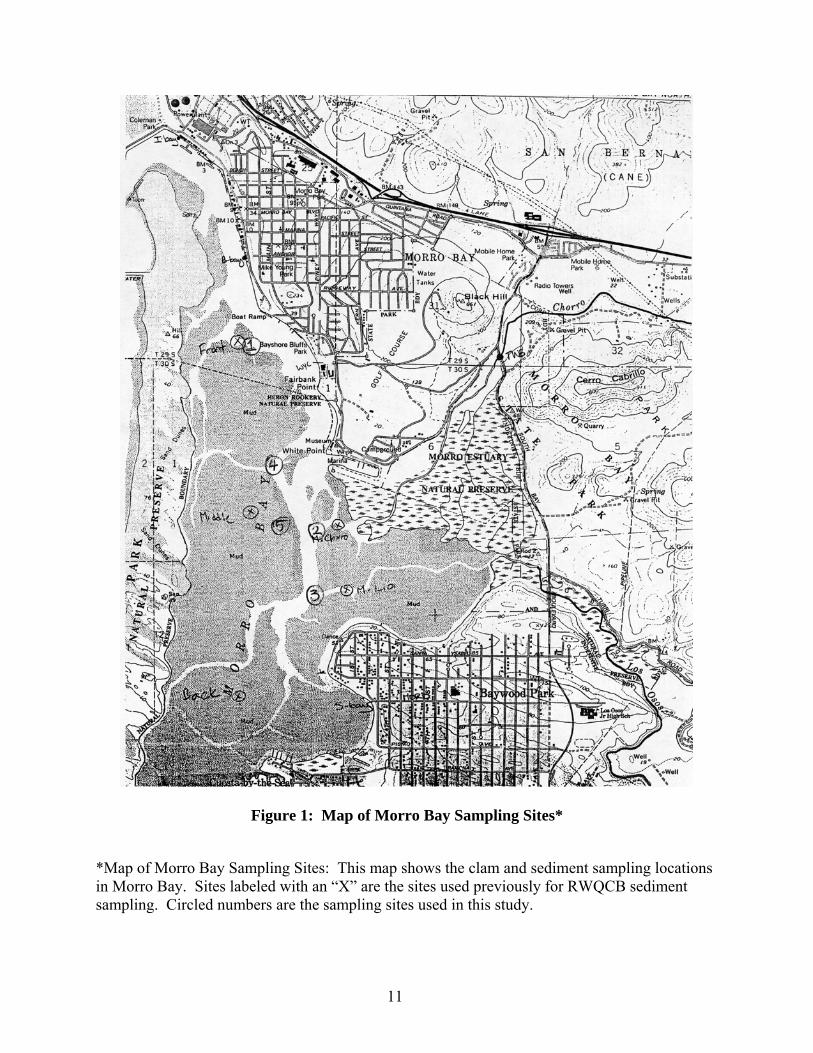
Figure 1: Map of Morro Bay Sampling Sites*
*Map of Morro Bay Sampling Sites: This map shows the clam and sediment sampling locations in Morro Bay. Sites labeled with an “X” are the sites used previously for RWQCB sediment sampling. Circled numbers are the sampling sites used in this study.
12
Sample Collection
The clams analyzed were collected using hand methods (gloved hands, plastic spades,
and digging). Approximately 50 grams of surrounding sediment was collected from the same
depth the clams were collected. The sediment and clams were double-bagged separately in
gallon-sized Ziploc™ bags and labeled with site name and the date of collection. Contamination
sources were minimized as much as possible through the practice of cleaning the collection
equipment with 10% nitric acid, detergent, and deionized water between sampling sites. After
collection, the samples were transported to the laboratory in coolers with ice. After collection
and initial rinsing of the clams, the clam and the sediment samples were frozen until digested and
analyzed. Refer to Appendix A1 for the complete Sample Collection Method as amended from
the California Department of Fish and Game’s (CADFG) procedure Sample Collection and
Preparation Procedure, Appendix A2.
Sample Preparation
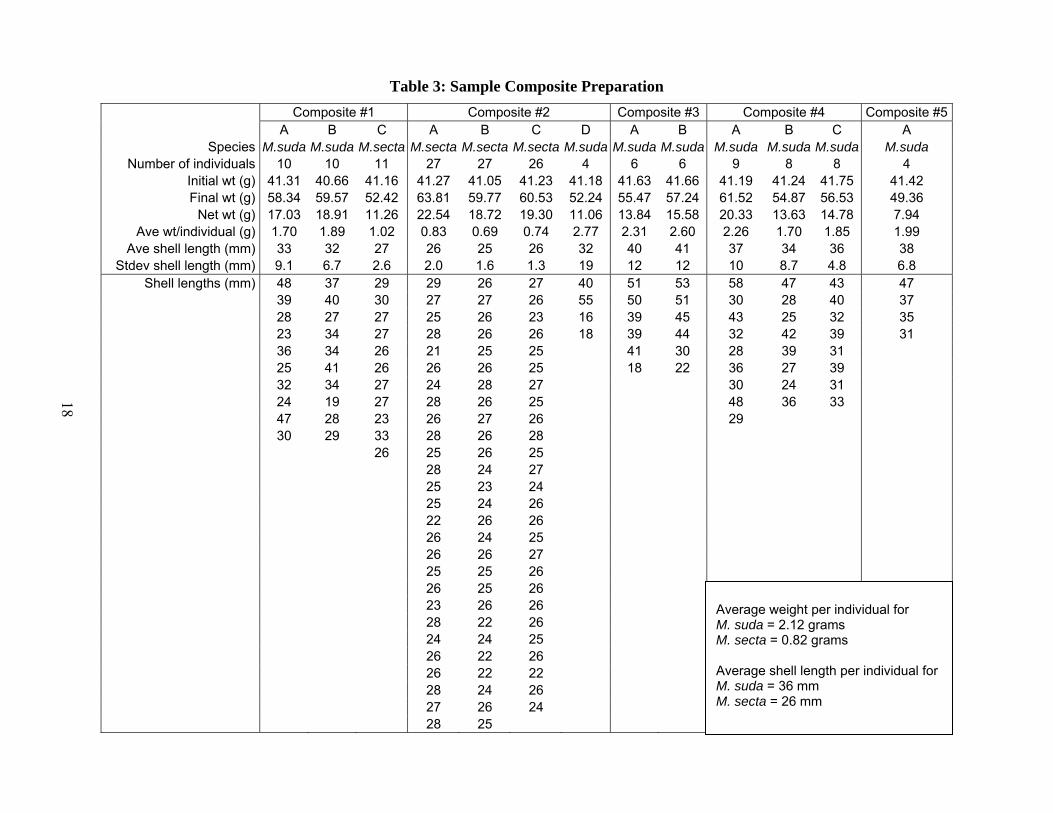
Inside the clean room laboratory at Moss Landing, CADFG, individual clams were
separated into three groups by species for each sampling site, as the sample allowed. Due to the
variations in the collection of individuals, the number and weight of each of the composites
differed. The total tissue weight collected in each composite was not critical because an equal
amount of homogenized tissue was used in the digestion step. The objective was to collect
sufficient tissue to obtain a representative sample for each population. The clams were rinsed
with deionized water to remove any remaining sediment outside or inside the shell. All of the
soft tissue was scraped out of the shell with a scalpel and placed into pre-weighed labeled jars.
Each shell length was measured by closing the clamshell around a ruler and recording the widest
length. The equipment was washed between each group with soap, tap water rinse, and a
13
deionized water rinse. The clams were frozen until the homogenization step. The shells from
the individuals used and any remaining individuals were bagged, labeled, and frozen.
Sample Homogenization and Digestion
The frozen clams were homogenized using a hand-held Tissue TearorTM homogenizer
Model 398 (Biospec Products, Inc.) to a smooth consistency with no chunks. Between each
sample, the hand-held homogenizer was washed using a six-step process (Appendix B).
Approximately equal amounts of homogenized clam paste were digested in concentrated nitric
acid in a microwave digester. The digestion program consisted of a 15 minute controlled warm
up to 195 ºC, 20 minutes at this temperature, and with a 20 minute cool down process at the end.
Once the microwave digested samples cooled and returned to surrounding pressure, each sample
was placed into pre-weighed, labeled, and acid-cleaned plastic bottles. Care was taken to entrain
droplets on the walls of the digestion vessels to ensure complete recovery of the sample. Each
bottle was diluted with MiliQ water to a volume of approximately 20 mL. Refer to Appendix B1
for the complete Sample Preparation and Digestion Methods as amended from the CADFG at
Moss Landing Methods, Appendix B2.
Any remaining samples not digested or used were kept frozen and saved for future
reference. The digested clam solutions produced from the week spent in Moss Landing were
stored in the refrigerator until analyzed.
Sample Analysis
A selected number of these clam digestion solutions, along with the corresponding
sediment sample, were sent to Creek Environmental Laboratory (Creek) in San Luis Obispo in
June 2002, for Inductively Coupled Plasma (ICP) analysis using EPA Method 6010. Both the
clam and sediment results were reported on a wet basis from Creek Environmental Laboratory.
14
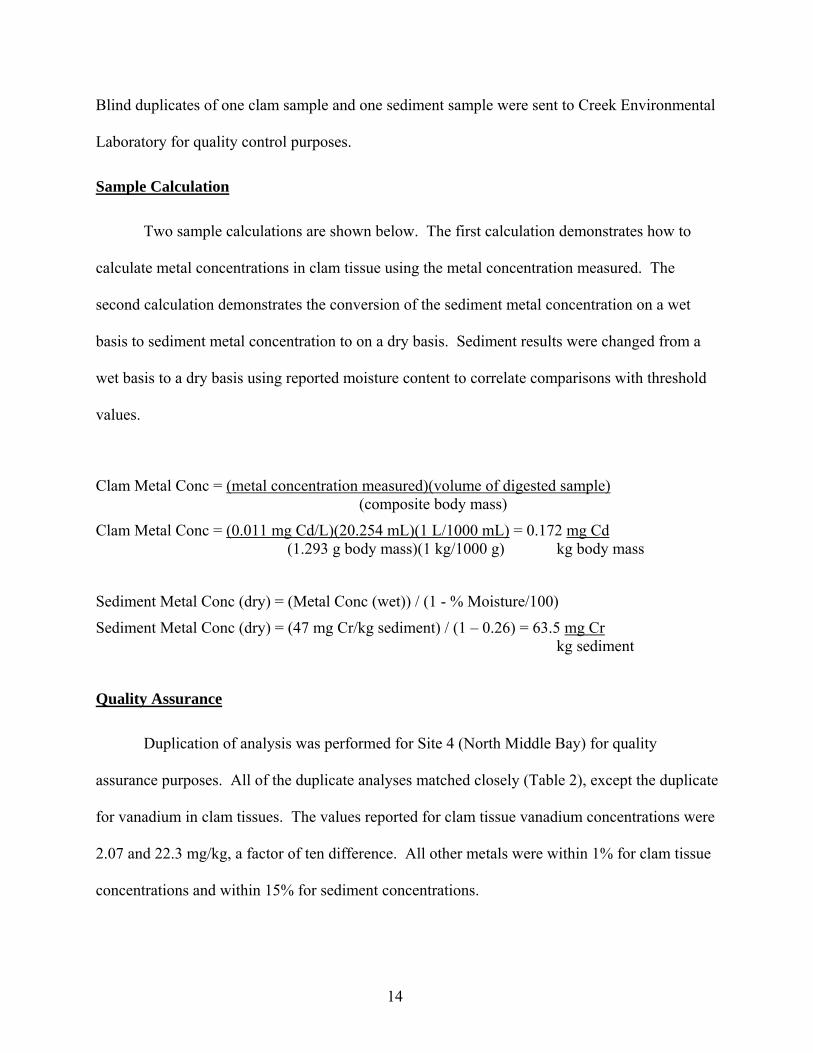
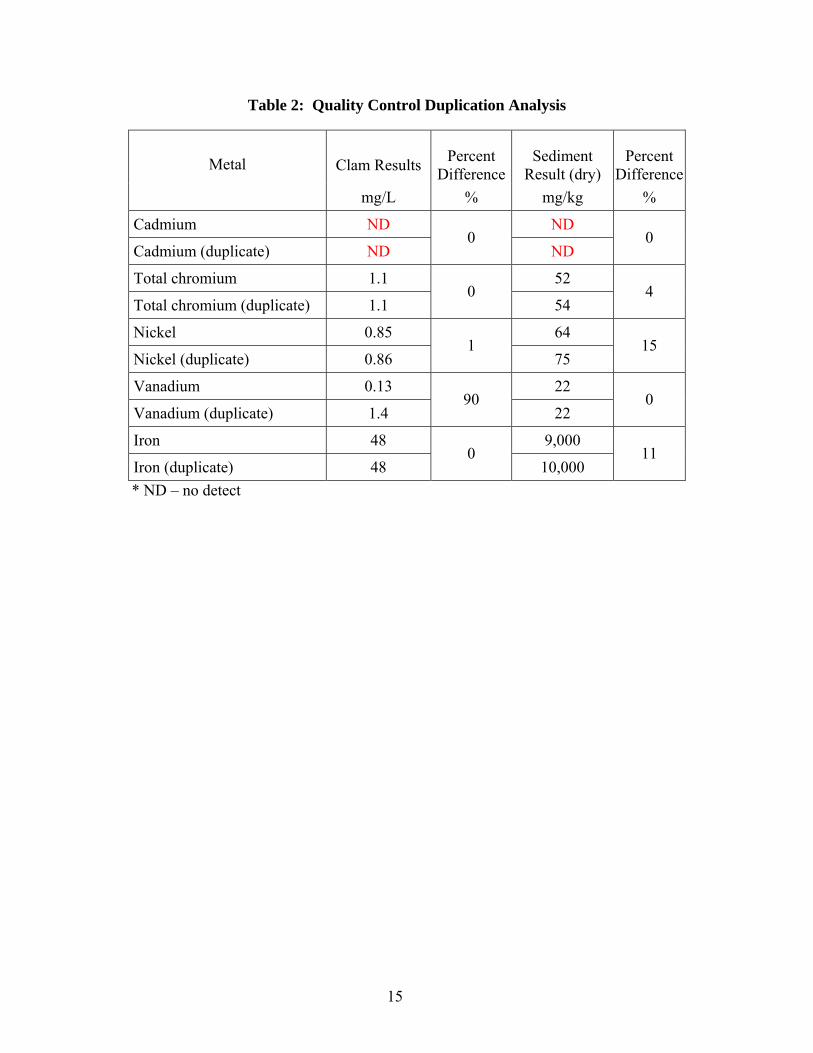
Blind duplicates of one clam sample and one sediment sample were sent to Creek Environmental
Laboratory for quality control purposes.
Sample Calculation
Two sample calculations are shown below. The first calculation demonstrates how to
calculate metal concentrations in clam tissue using the metal concentration measured. The
second calculation demonstrates the conversion of the sediment metal concentration on a wet
basis to sediment metal concentration to on a dry basis. Sediment results were changed from a
wet basis to a dry basis using reported moisture content to correlate comparisons with threshold
values.
Clam Metal Conc = (metal concentration measured)(volume of digested sample) (composite body mass)
Clam Metal Conc = (0.011 mg Cd/L)(20.254 mL)(1 L/1000 mL) = 0.172 mg Cd (1.293 g body mass)(1 kg/1000 g) kg body mass
Average weight per individual for M. suda = 2.12 grams M. secta = 0.82 grams Average shell length per individual for M. suda = 36 mm M. secta = 26 mm
18
19
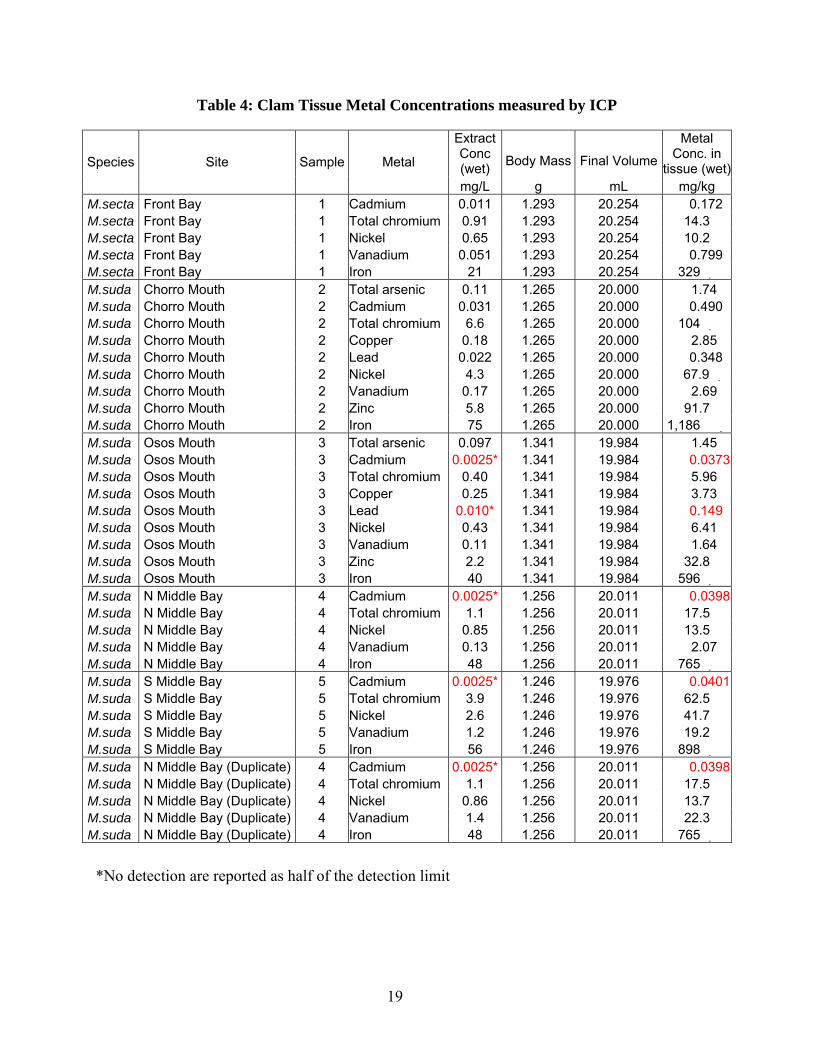
Table 4: Clam Tissue Metal Concentrations measured by ICP
Extract Conc (wet) Body Mass Final Volume
Metal Conc. in
tissue (wet)Species Site Sample Metal
mg/L g mL mg/kg M.secta Front Bay 1 Cadmium 0.011 1.293 20.254 0.172 M.secta Front Bay 1 Total chromium 0.91 1.293 20.254 14.3 M.secta Front Bay 1 Nickel 0.65 1.293 20.254 10.2 M.secta Front Bay 1 Vanadium 0.051 1.293 20.254 0.799 M.secta Front Bay 1 Iron 21 1.293 20.254 329 ִ M.suda Chorro Mouth 2 Total arsenic 0.11 1.265 20.000 1.74 M.suda Chorro Mouth 2 Cadmium 0.031 1.265 20.000 0.490 M.suda Chorro Mouth 2 Total chromium 6.6 1.265 20.000 104 ִ M.suda Chorro Mouth 2 Copper 0.18 1.265 20.000 2.85 M.suda Chorro Mouth 2 Lead 0.022 1.265 20.000 0.348 M.suda Chorro Mouth 2 Nickel 4.3 1.265 20.000 67.9 ִ M.suda Chorro Mouth 2 Vanadium 0.17 1.265 20.000 2.69 M.suda Chorro Mouth 2 Zinc 5.8 1.265 20.000 91.7 M.suda Chorro Mouth 2 Iron 75 1.265 20.000 1,186 ִ M.suda Osos Mouth 3 Total arsenic 0.097 1.341 19.984 1.45 M.suda Osos Mouth 3 Cadmium 0.0025* 1.341 19.984 0.0373M.suda Osos Mouth 3 Total chromium 0.40 1.341 19.984 5.96 M.suda Osos Mouth 3 Copper 0.25 1.341 19.984 3.73 M.suda Osos Mouth 3 Lead 0.010* 1.341 19.984 0.149 M.suda Osos Mouth 3 Nickel 0.43 1.341 19.984 6.41 M.suda Osos Mouth 3 Vanadium 0.11 1.341 19.984 1.64 M.suda Osos Mouth 3 Zinc 2.2 1.341 19.984 32.8 M.suda Osos Mouth 3 Iron 40 1.341 19.984 596 ִ M.suda N Middle Bay 4 Cadmium 0.0025* 1.256 20.011 0.0398M.suda N Middle Bay 4 Total chromium 1.1 1.256 20.011 17.5 M.suda N Middle Bay 4 Nickel 0.85 1.256 20.011 13.5 M.suda N Middle Bay 4 Vanadium 0.13 1.256 20.011 2.07 M.suda N Middle Bay 4 Iron 48 1.256 20.011 765 ִ M.suda S Middle Bay 5 Cadmium 0.0025* 1.246 19.976 0.0401M.suda S Middle Bay 5 Total chromium 3.9 1.246 19.976 62.5 M.suda S Middle Bay 5 Nickel 2.6 1.246 19.976 41.7 M.suda S Middle Bay 5 Vanadium 1.2 1.246 19.976 19.2 M.suda S Middle Bay 5 Iron 56 1.246 19.976 898 ִ M.suda N Middle Bay (Duplicate) 4 Cadmium 0.0025* 1.256 20.011 0.0398M.suda N Middle Bay (Duplicate) 4 Total chromium 1.1 1.256 20.011 17.5 M.suda N Middle Bay (Duplicate) 4 Nickel 0.86 1.256 20.011 13.7 M.suda N Middle Bay (Duplicate) 4 Vanadium 1.4 1.256 20.011 22.3 M.suda N Middle Bay (Duplicate) 4 Iron 48 1.256 20.011 765 ִ
*No detection are reported as half of the detection limit
20
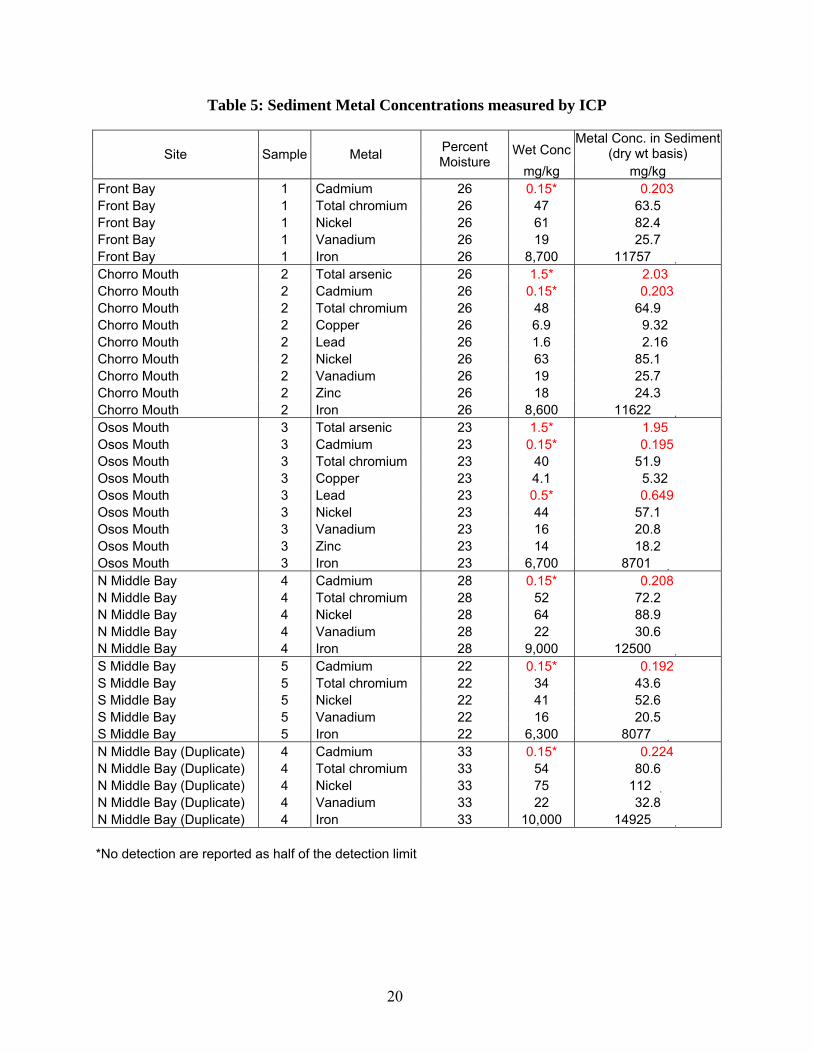
Table 5: Sediment Metal Concentrations measured by ICP
Wet Conc Metal Conc. in Sediment
(dry wt basis) Site Sample Metal Percent Moisture
mg/kg mg/kg Front Bay 1 Cadmium 26 0.15* 0.203 Front Bay 1 Total chromium 26 47 63.5 Front Bay 1 Nickel 26 61 82.4 Front Bay 1 Vanadium 26 19 25.7 Front Bay 1 Iron 26 8,700 11757 ִ Chorro Mouth 2 Total arsenic 26 1.5* 2.03 Chorro Mouth 2 Cadmium 26 0.15* 0.203 Chorro Mouth 2 Total chromium 26 48 64.9 Chorro Mouth 2 Copper 26 6.9 9.32 Chorro Mouth 2 Lead 26 1.6 2.16 Chorro Mouth 2 Nickel 26 63 85.1 Chorro Mouth 2 Vanadium 26 19 25.7 Chorro Mouth 2 Zinc 26 18 24.3 Chorro Mouth 2 Iron 26 8,600 11622 ִ Osos Mouth 3 Total arsenic 23 1.5* 1.95 Osos Mouth 3 Cadmium 23 0.15* 0.195 Osos Mouth 3 Total chromium 23 40 51.9 Osos Mouth 3 Copper 23 4.1 5.32 Osos Mouth 3 Lead 23 0.5* 0.649 Osos Mouth 3 Nickel 23 44 57.1 Osos Mouth 3 Vanadium 23 16 20.8 Osos Mouth 3 Zinc 23 14 18.2 Osos Mouth 3 Iron 23 6,700 8701 ִ N Middle Bay 4 Cadmium 28 0.15* 0.208 N Middle Bay 4 Total chromium 28 52 72.2 N Middle Bay 4 Nickel 28 64 88.9 N Middle Bay 4 Vanadium 28 22 30.6 N Middle Bay 4 Iron 28 9,000 12500 ִ S Middle Bay 5 Cadmium 22 0.15* 0.192 S Middle Bay 5 Total chromium 22 34 43.6 S Middle Bay 5 Nickel 22 41 52.6 S Middle Bay 5 Vanadium 22 16 20.5 S Middle Bay 5 Iron 22 6,300 8077 ִ N Middle Bay (Duplicate) 4 Cadmium 33 0.15* 0.224 N Middle Bay (Duplicate) 4 Total chromium 33 54 80.6 N Middle Bay (Duplicate) 4 Nickel 33 75 112 ִ N Middle Bay (Duplicate) 4 Vanadium 33 22 32.8 N Middle Bay (Duplicate) 4 Iron 33 10,000 14925 ִ *No detection are reported as half of the detection limit
21
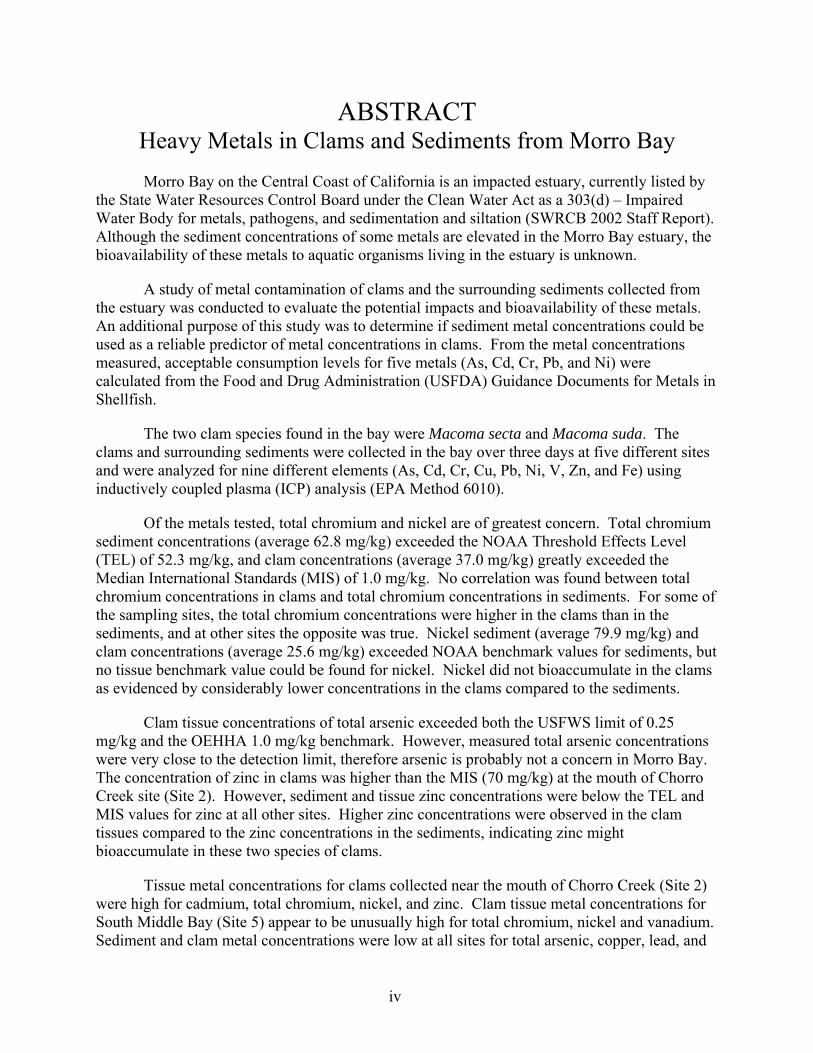
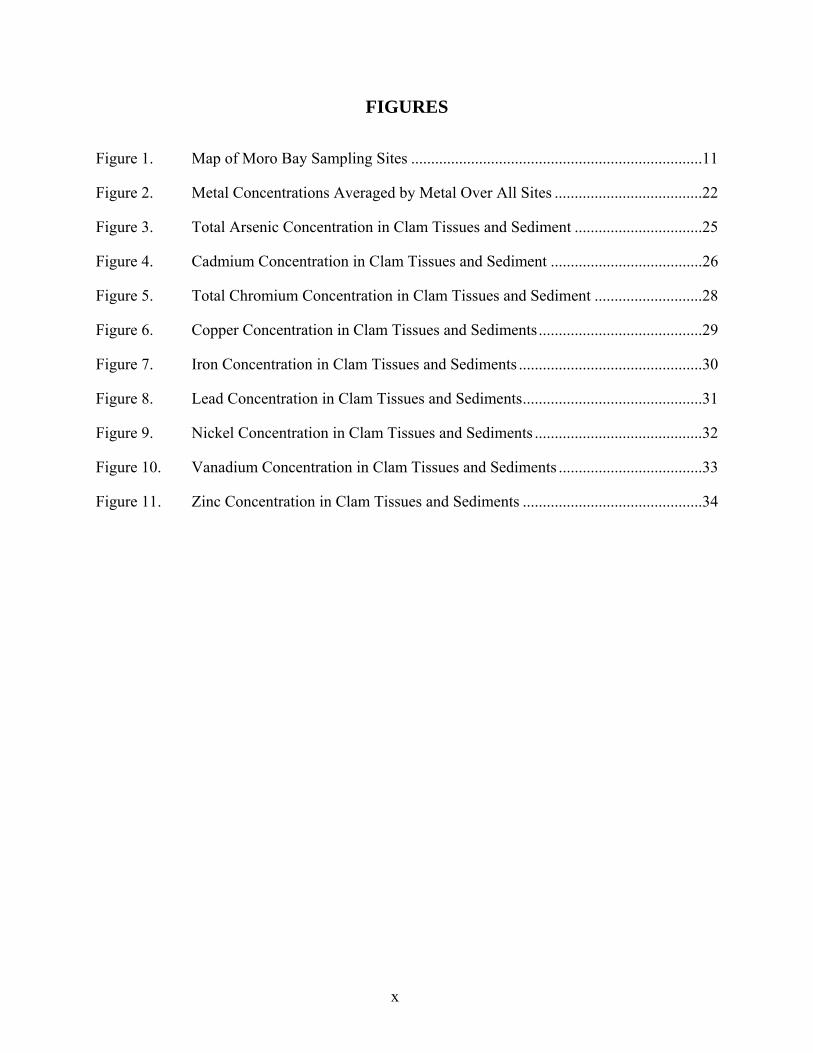
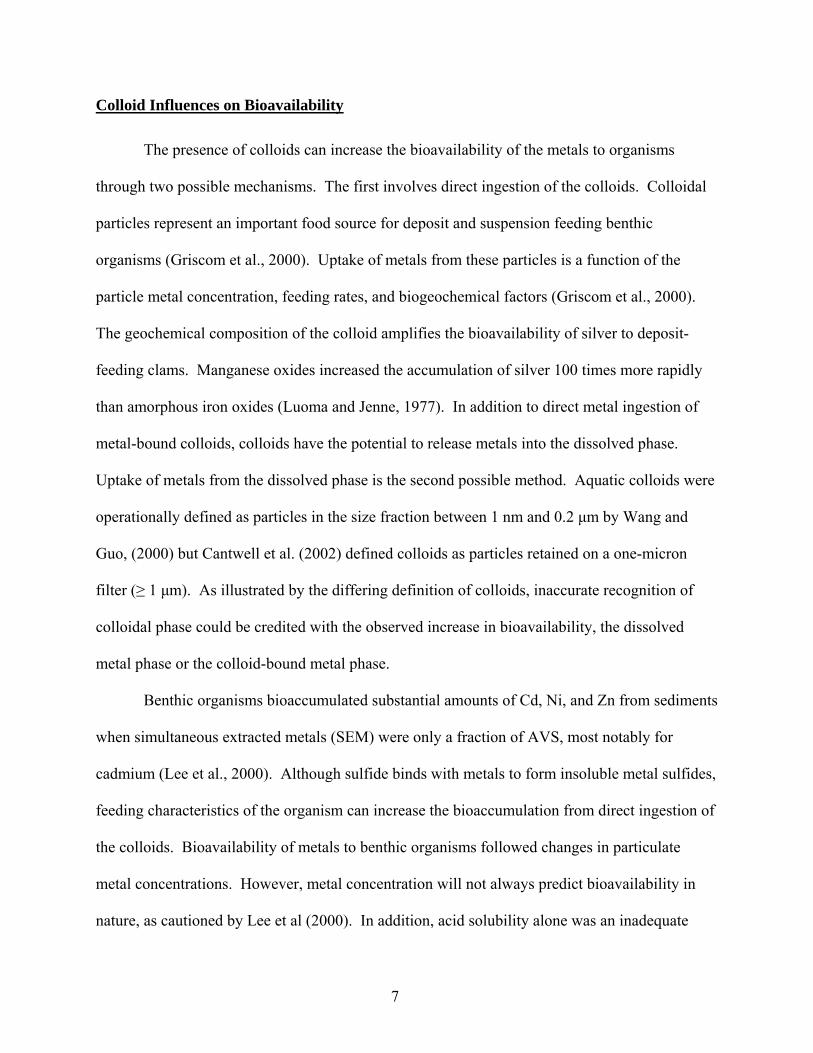
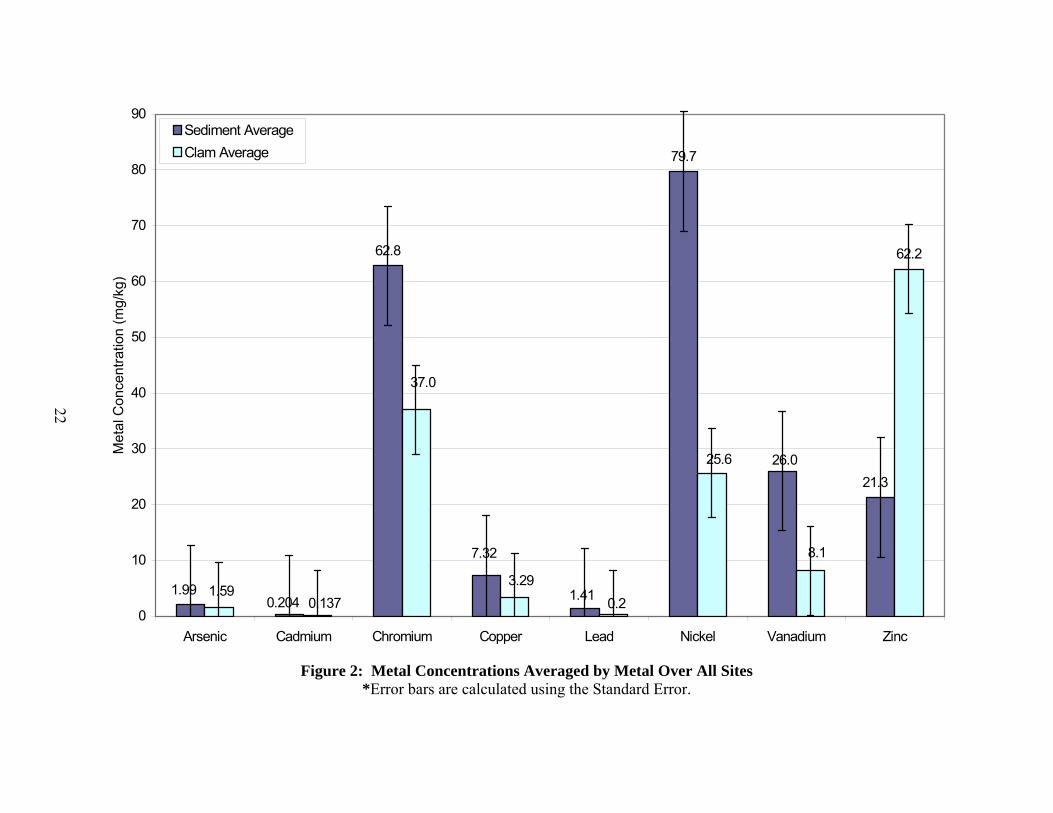
Metal concentrations for clam tissues and sediment, averaged over all sites are
summarized in Table 6 and shown in Figure 2. The highest metal concentrations in both
sediment and clams were observed for total chromium, nickel, vanadium, and zinc, excluding
iron. Total arsenic and cadmium concentrations were similar in clam tissue and sediment, all at
low concentrations. In contrast, total chromium, copper, lead, nickel, and vanadium exhibited
over twice the metal concentrations in the sediment compared to the clam tissue. In the reverse,
zinc had three times higher metal concentrations in the clam tissue compared to the sediment.
To achieve a useful representation of the relationships between averaged metal concentrations,
iron was not included in this figure due to the high values measured. The results as presented in
Figure 2 are averaged over all of the sites by metal, however the bar graph does not properly
address spatial variations or whether the measured concentrations are detrimental. The metal
concentrations for clams tissue and sediments are described in more detail in Table 7.
Table 6: Clam Tissue and Sediment Metal Concentrations Averaged by Site
Metal Clam Ave (mg/kg)
Clam Standard Deviation
Sediment Ave (mg/kg)
Sediment Standard Deviation
Total Arsenic 1.59 0.208 1.99 0.0558
Cadmium 0.137 0.181 0.204 0.0113
Total Chromium 37.0 38.5 62.8 13.4
Copper 3.29 0.622 7.32 2.83
Lead 0.248 0.141 1.41 1.07
Nickel 25.6 24.3 79.7 21.9
Vanadium 8.12 9.86 26.0 5.00
Zinc 62.2 41.7 21.3 4.34
Iron 756 ִ 287 ִ 11264 ִ 2531 ִ
62.8
79.7
62.2
21.326.0
1.41
7.32
0.2041.99
37.0
0.2
8.1
25.6
3.290.137
1.59
0
10
20
30
40
50
60
70
80
90
Arsenic Cadmium Chromium Copper Lead Nickel Vanadium Zinc
Met
al C
once
ntra
tion
(mg/
kg)
Sediment AverageClam Average
Figure 2: Metal Concentrations Averaged by Metal Over All Sites *Error bars are calculated using the Standard Error.
22
23
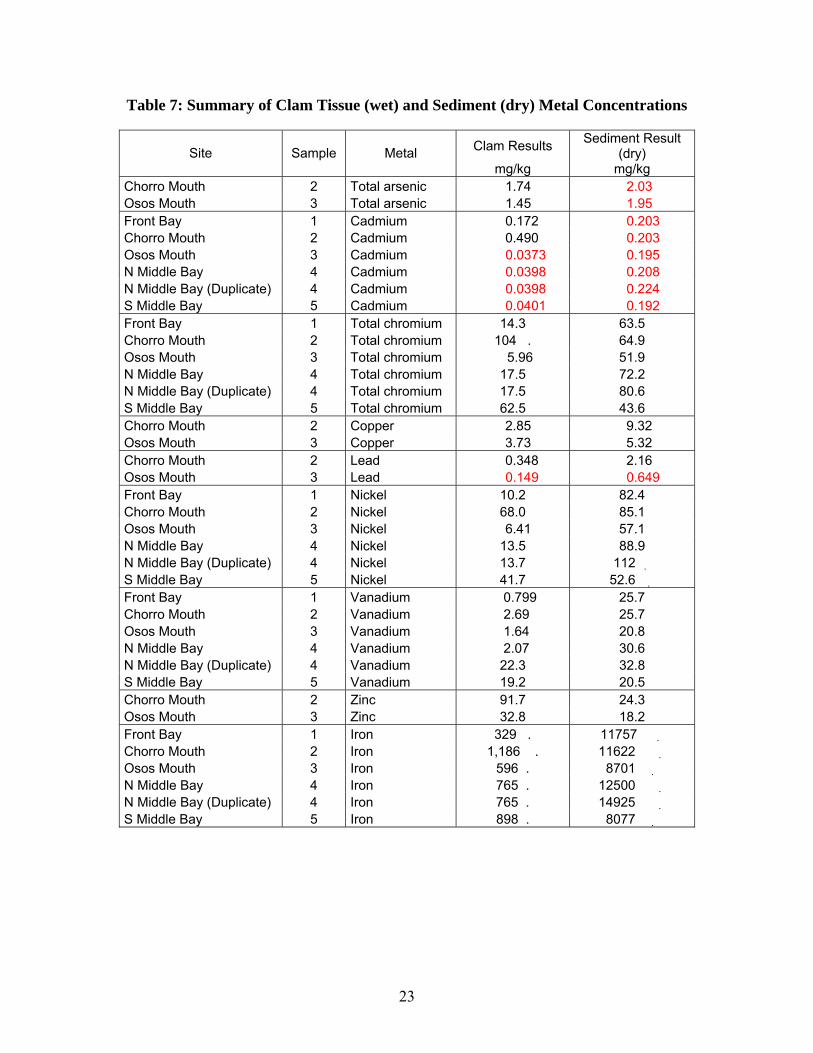
Table 7: Summary of Clam Tissue (wet) and Sediment (dry) Metal Concentrations
Clam Results Sediment Result (dry) Site Sample Metal
mg/kg mg/kg Chorro Mouth 2 Total arsenic 1.74 2.03 Osos Mouth 3 Total arsenic 1.45 1.95 Front Bay 1 Cadmium 0.172 0.203 Chorro Mouth 2 Cadmium 0.490 0.203 Osos Mouth 3 Cadmium 0.0373 0.195 N Middle Bay 4 Cadmium 0.0398 0.208 N Middle Bay (Duplicate) 4 Cadmium 0.0398 0.224 S Middle Bay 5 Cadmium 0.0401 0.192 Front Bay 1 Total chromium 14.3 63.5 Chorro Mouth 2 Total chromium 104 . 64.9 Osos Mouth 3 Total chromium 5.96 51.9 N Middle Bay 4 Total chromium 17.5 72.2 N Middle Bay (Duplicate) 4 Total chromium 17.5 80.6 S Middle Bay 5 Total chromium 62.5 43.6 Chorro Mouth 2 Copper 2.85 9.32 Osos Mouth 3 Copper 3.73 5.32 Chorro Mouth 2 Lead 0.348 2.16 Osos Mouth 3 Lead 0.149 0.649 Front Bay 1 Nickel 10.2 82.4 Chorro Mouth 2 Nickel 68.0 85.1 Osos Mouth 3 Nickel 6.41 57.1 N Middle Bay 4 Nickel 13.5 88.9 N Middle Bay (Duplicate) 4 Nickel 13.7 112 ִ S Middle Bay 5 Nickel 41.7 52.6 ִ Front Bay 1 Vanadium 0.799 25.7 Chorro Mouth 2 Vanadium 2.69 25.7 Osos Mouth 3 Vanadium 1.64 20.8 N Middle Bay 4 Vanadium 2.07 30.6 N Middle Bay (Duplicate) 4 Vanadium 22.3 32.8 S Middle Bay 5 Vanadium 19.2 20.5 Chorro Mouth 2 Zinc 91.7 24.3 Osos Mouth 3 Zinc 32.8 18.2 Front Bay 1 Iron 329 . 11757 ִ Chorro Mouth 2 Iron 1,186 . 11622 ִ Osos Mouth 3 Iron 596 . 8701 ִ N Middle Bay 4 Iron 765 . 12500 ִ N Middle Bay (Duplicate) 4 Iron 765 . 14925 ִ S Middle Bay 5 Iron 898 . 8077 ִ
24
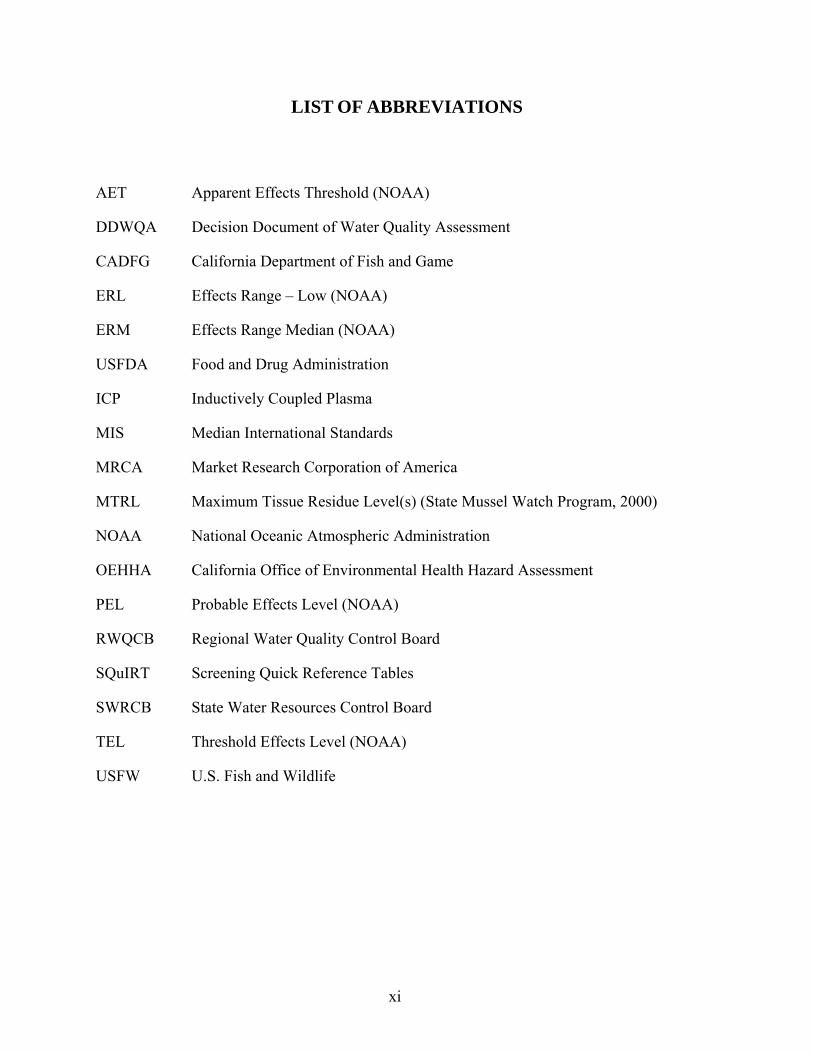
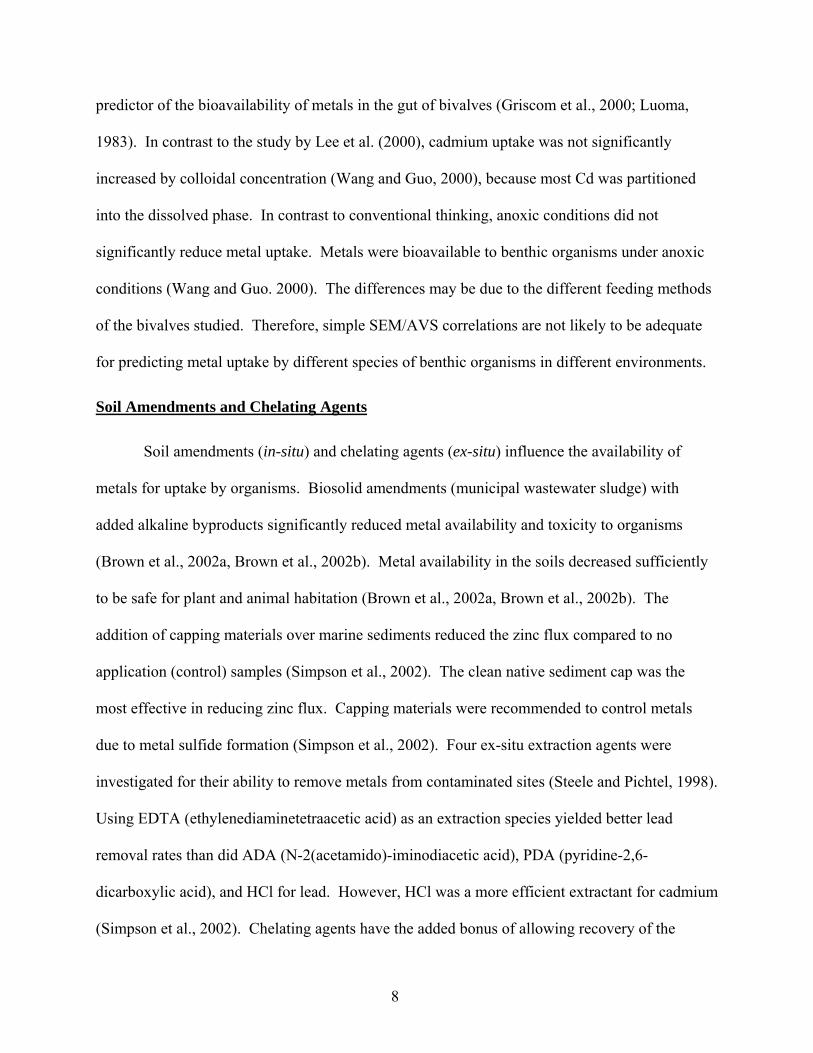
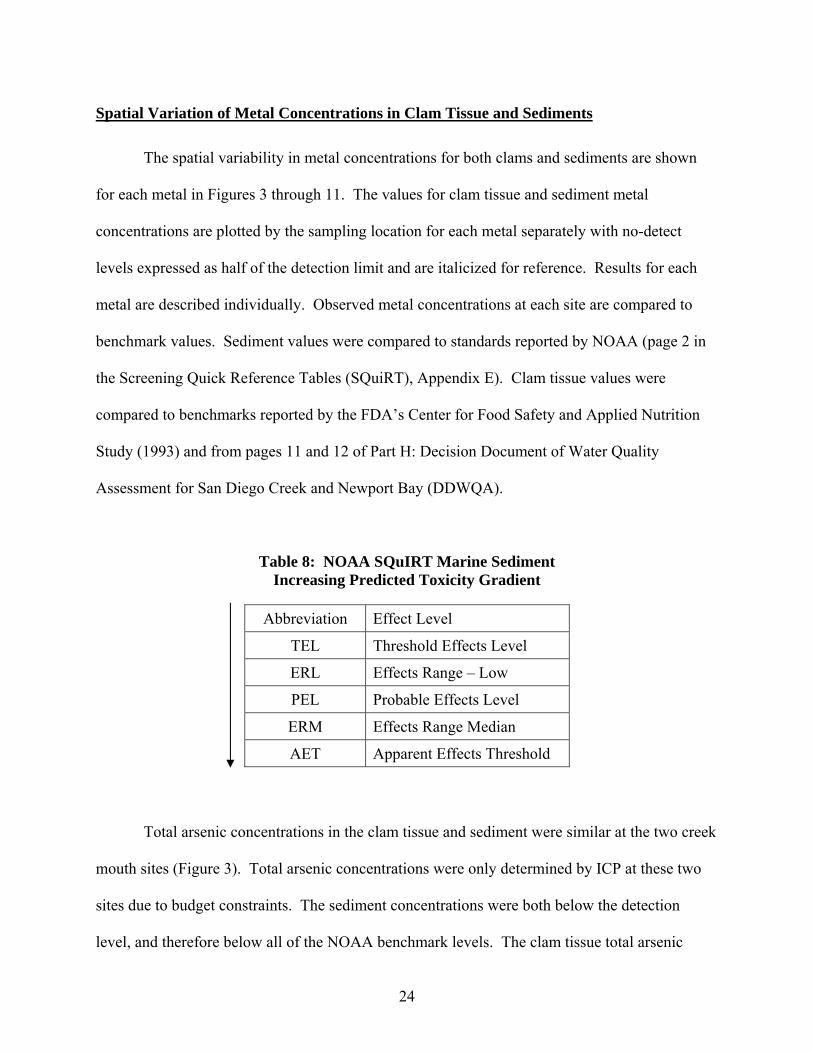
Spatial Variation of Metal Concentrations in Clam Tissue and Sediments
The spatial variability in metal concentrations for both clams and sediments are shown
for each metal in Figures 3 through 11. The values for clam tissue and sediment metal
concentrations are plotted by the sampling location for each metal separately with no-detect
levels expressed as half of the detection limit and are italicized for reference. Results for each
metal are described individually. Observed metal concentrations at each site are compared to
benchmark values. Sediment values were compared to standards reported by NOAA (page 2 in
the Screening Quick Reference Tables (SQuiRT), Appendix E). Clam tissue values were
compared to benchmarks reported by the FDA’s Center for Food Safety and Applied Nutrition
Study (1993) and from pages 11 and 12 of Part H: Decision Document of Water Quality
Assessment for San Diego Creek and Newport Bay (DDWQA).
Figure 11: Zinc Concentration in Clam Tissues and Sediment
35
The mouth of Chorro Creek (Site 2) tissue metal concentrations was high for cadmium,
total chromium, nickel, and zinc. These high metal concentrations could be caused by
discharges into the watershed upstream of the estuary. Runoff from Camp San Luis Obispo, the
state penitentiary, or other anthropologic activities are possible sources of the metals observed
(Duffield, 2000). The SWRCB cites the sources of metal contamination to be surface mining,
nonpoint sources, boat discharge, and vessel wastes.
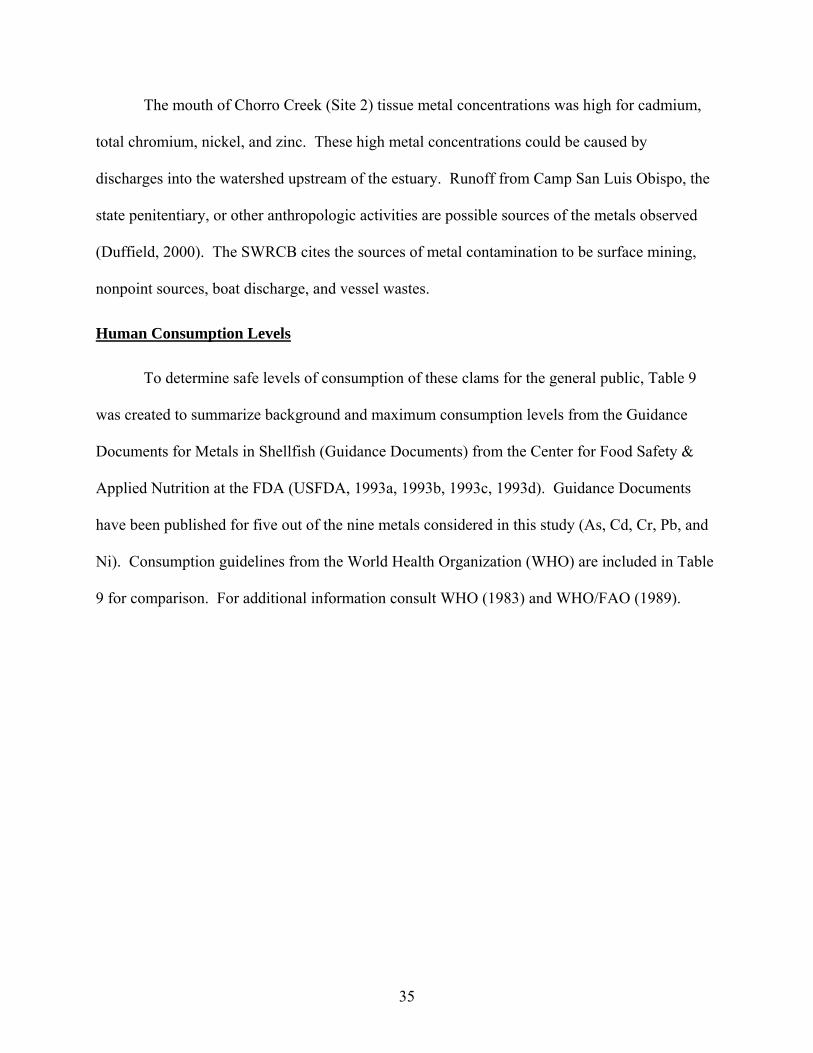
Human Consumption Levels
To determine safe levels of consumption of these clams for the general public, Table 9
was created to summarize background and maximum consumption levels from the Guidance
Documents for Metals in Shellfish (Guidance Documents) from the Center for Food Safety &
Applied Nutrition at the FDA (USFDA, 1993a, 1993b, 1993c, 1993d). Guidance Documents
have been published for five out of the nine metals considered in this study (As, Cd, Cr, Pb, and
Ni). Consumption guidelines from the World Health Organization (WHO) are included in Table
9 for comparison. For additional information consult WHO (1983) and WHO/FAO (1989).
36
Table 9: Recommended Human Consumption Levels
Background Consumption
Level
WHO/FAO 1989
WHO tolerable daily
intake
USFDA Levels of Concern Metal
µg/person/day* µg/kg/week mg µg/person/day*
Other Entity Recommendations
As 30 15 130 130 WHO 1983 Tolerable Daily Intake = 0.05 mg/kg
Cd 10 7 55 55
Cr 30 -100 ? ? 200 National Academy of Science Cr(III) = 50 - 200 µg/person/d
Pb 5 - 10 ? ? 6, 15, 25, 75**
Ni 120 no set limit no set limit 1200 EPA Oral Dose of 20 µg/kg/d and NOAEL of 5 mg/kg/d
* for a 60 kg person ** depending on population 6 µg/person/d ages 0 - 6 15 µg/person/d children over 7 25 µg/person/d pregnant women 75 µg/person/d adults
The frequency of shellfish consumption was characterized by the Market Research
Corporation of America (MRCA) 14-Day Survey (5 Year Menu Census, 1982-87) (MCRA,
1988). The MRCA reported 4.8% of the surveyed population consumed molluscan bivalves.
Calculated within the Guidance Documents, the average intake of molluscan bivalves is
estimated to be 12 grams/day for adults (male and female) between 18 and 44 years of age. This
equals approximately 84 grams/week for an average adult who eats shellfish. For the average
clam size in this study, this was approximately 40 M. suda clams and 102 M. secta clams per
week.
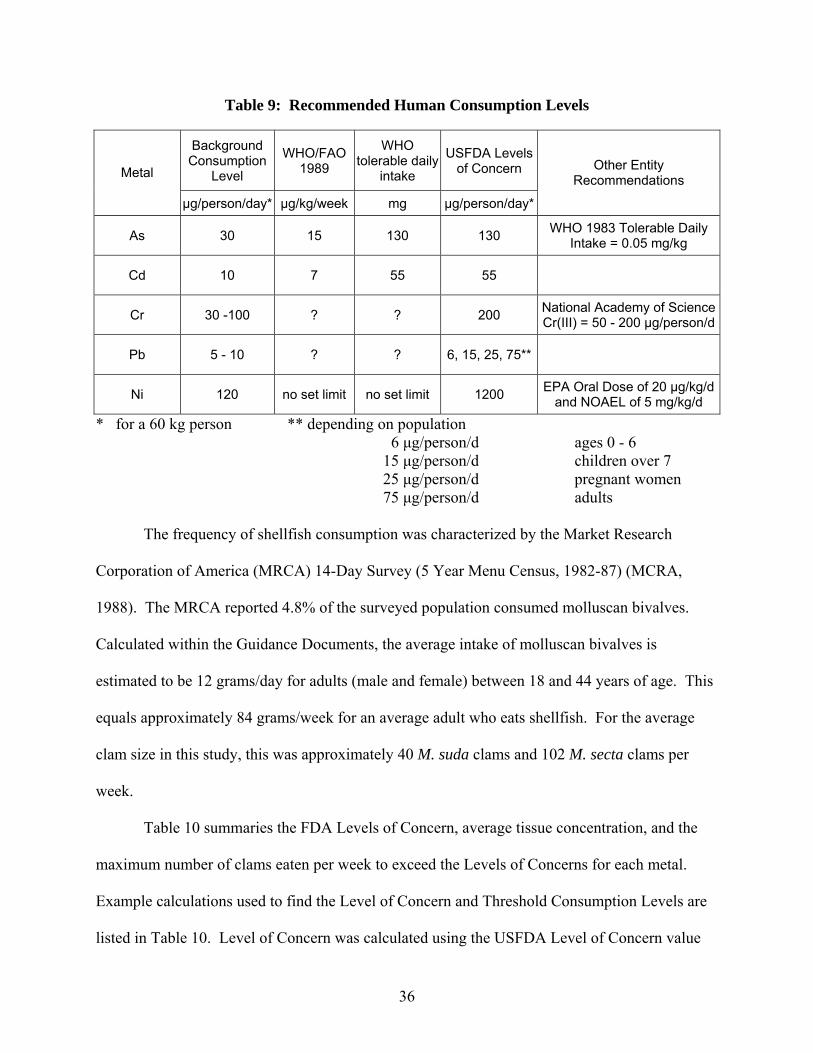
Table 10 summaries the FDA Levels of Concern, average tissue concentration, and the
maximum number of clams eaten per week to exceed the Levels of Concerns for each metal.
Example calculations used to find the Level of Concern and Threshold Consumption Levels are
listed in Table 10. Level of Concern was calculated using the USFDA Level of Concern value
37
and subtracting the USFAD Background Level to obtain a metal concentration value accounting
for the metal exposure not from food sources. This value was then used to calculate a Threshold
Consumption Level appropriate for the metal concentrations measured in the clams from Morro
Bay.
Level of Concern = [(130 µg As/person/day) – (30 µg As/person/d)](7 d/wk) = 700 µg As person/wk


![Ecological Risk Assessment of Heavy Metals in Coastal ...the highest concentrations of toxic heavy metals in marine environment are found in sediments [1,6,7]. Coastal sediments are](https://static.documents.pub/doc/80x56/60777613a46f6a043806f637/ecological-risk-assessment-of-heavy-metals-in-coastal-the-highest-concentrations.jpg)


