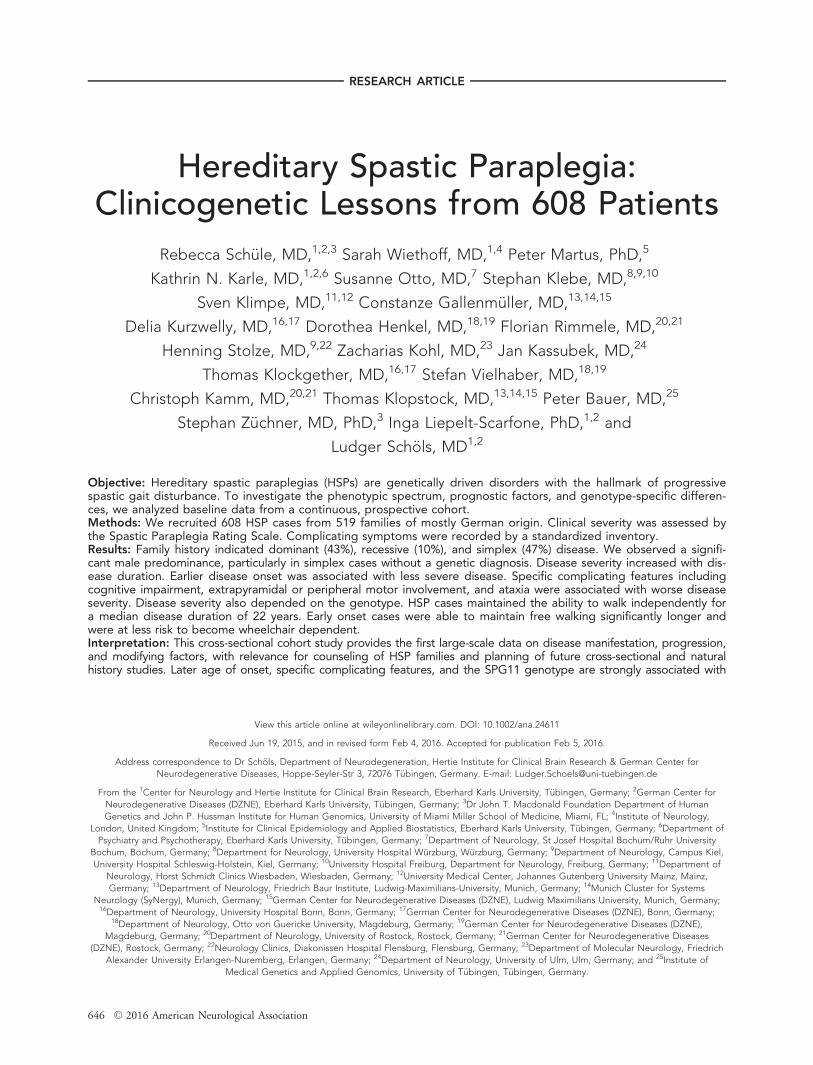
RESEARCH ARTICLE Hereditary Spastic Paraplegia: Clinicogenetic Lessons from 608 Patients Rebecca Sch€ ule, MD, 1,2,3 Sarah Wiethoff, MD, 1,4 Peter Martus, PhD, 5 Kathrin N. Karle, MD, 1,2,6 Susanne Otto, MD, 7 Stephan Klebe, MD, 8,9,10 Sven Klimpe, MD, 11,12 Constanze Gallenm€ uller, MD, 13,14,15 Delia Kurzwelly, MD, 16,17 Dorothea Henkel, MD, 18,19 Florian Rimmele, MD, 20,21 Henning Stolze, MD, 9,22 Zacharias Kohl, MD, 23 Jan Kassubek, MD, 24 Thomas Klockgether, MD, 16,17 Stefan Vielhaber, MD, 18,19 Christoph Kamm, MD, 20,21 Thomas Klopstock, MD, 13,14,15 Peter Bauer, MD, 25 Stephan Z€ uchner, MD, PhD, 3 Inga Liepelt-Scarfone, PhD, 1,2 and Ludger Sch € ols, MD 1,2 Objective: Hereditary spastic paraplegias (HSPs) are genetically driven disorders with the hallmark of progressive spastic gait disturbance. To investigate the phenotypic spectrum, prognostic factors, and genotype-specific differen- ces, we analyzed baseline data from a continuous, prospective cohort. Methods: We recruited 608 HSP cases from 519 families of mostly German origin. Clinical severity was assessed by the Spastic Paraplegia Rating Scale. Complicating symptoms were recorded by a standardized inventory. Results: Family history indicated dominant (43%), recessive (10%), and simplex (47%) disease. We observed a signifi- cant male predominance, particularly in simplex cases without a genetic diagnosis. Disease severity increased with dis- ease duration. Earlier disease onset was associated with less severe disease. Specific complicating features including cognitive impairment, extrapyramidal or peripheral motor involvement, and ataxia were associated with worse disease severity. Disease severity also depended on the genotype. HSP cases maintained the ability to walk independently for a median disease duration of 22 years. Early onset cases were able to maintain free walking significantly longer and were at less risk to become wheelchair dependent. Interpretation: This cross-sectional cohort study provides the first large-scale data on disease manifestation, progression, and modifying factors, with relevance for counseling of HSP families and planning of future cross-sectional and natural history studies. Later age of onset, specific complicating features, and the SPG11 genotype are strongly associated with View this article online at wileyonlinelibrary.com. DOI: 10.1002/ana.24611 Received Jun 19, 2015, and in revised form Feb 4, 2016. Accepted for publication Feb 5, 2016. Address correspondence to Dr Sch€ ols, Department of Neurodegeneration, Hertie Institute for Clinical Brain Research & German Center for Neurodegenerative Diseases, Hoppe-Seyler-Str 3, 72076 T€ ubingen, Germany. E-mail: [email protected]From the 1 Center for Neurology and Hertie Institute for Clinical Brain Research, Eberhard Karls University, T€ ubingen, Germany; 2 German Center for Neurodegenerative Diseases (DZNE), Eberhard Karls University, T€ ubingen, Germany; 3 Dr John T. Macdonald Foundation Department of Human Genetics and John P. Hussman Institute for Human Genomics, University of Miami Miller School of Medicine, Miami, FL; 4 Institute of Neurology, London, United Kingdom; 5 Institute for Clinical Epidemiology and Applied Biostatistics, Eberhard Karls University, T€ ubingen, Germany; 6 Department of Psychiatry and Psychotherapy, Eberhard Karls University, T€ ubingen, Germany; 7 Department of Neurology, St Josef Hospital Bochum/Ruhr University Bochum, Bochum, Germany; 8 Department for Neurology, University Hospital W€ urzburg, W€ urzburg, Germany; 9 Department of Neurology, Campus Kiel, University Hospital Schleswig-Holstein, Kiel, Germany; 10 University Hospital Freiburg, Department for Neurology, Freiburg, Germany; 11 Department of Neurology, Horst Schmidt Clinics Wiesbaden, Wiesbaden, Germany; 12 University Medical Center, Johannes Gutenberg University Mainz, Mainz, Germany; 13 Department of Neurology, Friedrich Baur Institute, Ludwig-Maximilians-University, Munich, Germany; 14 Munich Cluster for Systems Neurology (SyNergy), Munich, Germany; 15 German Center for Neurodegenerative Diseases (DZNE), Ludwig Maximilians University, Munich, Germany; 16 Department of Neurology, University Hospital Bonn, Bonn, Germany; 17 German Center for Neurodegenerative Diseases (DZNE), Bonn, Germany; 18 Department of Neurology, Otto von Guericke University, Magdeburg, Germany; 19 German Center for Neurodegenerative Diseases (DZNE), Magdeburg, Germany; 20 Department of Neurology, University of Rostock, Rostock, Germany; 21 German Center for Neurodegenerative Diseases (DZNE), Rostock, Germany; 22 Neurology Clinics, Diakonissen Hospital Flensburg, Flensburg, Germany; 23 Department of Molecular Neurology, Friedrich Alexander University Erlangen-Nuremberg, Erlangen, Germany; 24 Department of Neurology, University of Ulm, Ulm, Germany; and 25 Institute of Medical Genetics and Applied Genomics, University of T€ ubingen, T€ ubingen, Germany. 646 V C 2016 American Neurological Association
Transcript
RESEARCH ARTICLE
Hereditary Spastic Paraplegia:Clinicogenetic Lessons from 608 Patients
Rebecca Sch€ule, MD,1,2,3 Sarah Wiethoff, MD,1,4 Peter Martus, PhD,5
Kathrin N. Karle, MD,1,2,6 Susanne Otto, MD,7 Stephan Klebe, MD,8,9,10
Sven Klimpe, MD,11,12 Constanze Gallenm€uller, MD,13,14,15
Henning Stolze, MD,9,22 Zacharias Kohl, MD,23 Jan Kassubek, MD,24
Thomas Klockgether, MD,16,17 Stefan Vielhaber, MD,18,19
Christoph Kamm, MD,20,21 Thomas Klopstock, MD,13,14,15 Peter Bauer, MD,25
Stephan Z€uchner, MD, PhD,3 Inga Liepelt-Scarfone, PhD,1,2 and
Ludger Sch€ols, MD1,2
Objective: Hereditary spastic paraplegias (HSPs) are genetically driven disorders with the hallmark of progressivespastic gait disturbance. To investigate the phenotypic spectrum, prognostic factors, and genotype-specific differen-ces, we analyzed baseline data from a continuous, prospective cohort.Methods: We recruited 608 HSP cases from 519 families of mostly German origin. Clinical severity was assessed bythe Spastic Paraplegia Rating Scale. Complicating symptoms were recorded by a standardized inventory.Results: Family history indicated dominant (43%), recessive (10%), and simplex (47%) disease. We observed a signifi-cant male predominance, particularly in simplex cases without a genetic diagnosis. Disease severity increased with dis-ease duration. Earlier disease onset was associated with less severe disease. Specific complicating features includingcognitive impairment, extrapyramidal or peripheral motor involvement, and ataxia were associated with worse diseaseseverity. Disease severity also depended on the genotype. HSP cases maintained the ability to walk independently fora median disease duration of 22 years. Early onset cases were able to maintain free walking significantly longer andwere at less risk to become wheelchair dependent.Interpretation: This cross-sectional cohort study provides the first large-scale data on disease manifestation, progression,and modifying factors, with relevance for counseling of HSP families and planning of future cross-sectional and naturalhistory studies. Later age of onset, specific complicating features, and the SPG11 genotype are strongly associated with
View this article online at wileyonlinelibrary.com. DOI: 10.1002/ana.24611
Received Jun 19, 2015, and in revised form Feb 4, 2016. Accepted for publication Feb 5, 2016.
Address correspondence to Dr Sch€ols, Department of Neurodegeneration, Hertie Institute for Clinical Brain Research & German Center for
From the 1Center for Neurology and Hertie Institute for Clinical Brain Research, Eberhard Karls University, T€ubingen, Germany; 2German Center for
Neurodegenerative Diseases (DZNE), Eberhard Karls University, T€ubingen, Germany; 3Dr John T. Macdonald Foundation Department of Human
Genetics and John P. Hussman Institute for Human Genomics, University of Miami Miller School of Medicine, Miami, FL; 4Institute of Neurology,
London, United Kingdom; 5Institute for Clinical Epidemiology and Applied Biostatistics, Eberhard Karls University, T€ubingen, Germany; 6Department of
Psychiatry and Psychotherapy, Eberhard Karls University, T€ubingen, Germany; 7Department of Neurology, St Josef Hospital Bochum/Ruhr University
Bochum, Bochum, Germany; 8Department for Neurology, University Hospital W€urzburg, W€urzburg, Germany; 9Department of Neurology, Campus Kiel,
University Hospital Schleswig-Holstein, Kiel, Germany; 10University Hospital Freiburg, Department for Neurology, Freiburg, Germany; 11Department of
Neurology, Horst Schmidt Clinics Wiesbaden, Wiesbaden, Germany; 12University Medical Center, Johannes Gutenberg University Mainz, Mainz,
Germany; 13Department of Neurology, Friedrich Baur Institute, Ludwig-Maximilians-University, Munich, Germany; 14Munich Cluster for Systems
Neurology (SyNergy), Munich, Germany; 15German Center for Neurodegenerative Diseases (DZNE), Ludwig Maximilians University, Munich, Germany;16Department of Neurology, University Hospital Bonn, Bonn, Germany; 17German Center for Neurodegenerative Diseases (DZNE), Bonn, Germany;
18Department of Neurology, Otto von Guericke University, Magdeburg, Germany; 19German Center for Neurodegenerative Diseases (DZNE),
Magdeburg, Germany; 20Department of Neurology, University of Rostock, Rostock, Germany; 21German Center for Neurodegenerative Diseases
(DZNE), Rostock, Germany; 22Neurology Clinics, Diakonissen Hospital Flensburg, Flensburg, Germany; 23Department of Molecular Neurology, Friedrich
Alexander University Erlangen-Nuremberg, Erlangen, Germany; 24Department of Neurology, University of Ulm, Ulm, Germany; and 25Institute of
Medical Genetics and Applied Genomics, University of T€ubingen, T€ubingen, Germany.
646 VC 2016 American Neurological Association
more severe disease. Future interventional studies will require stratification for modifiers of disease progression identifiedin this study. Prospective longitudinal studies will verify progression rates calculated in this baseline analysis.
ANN NEUROL 2016;79:646–658
Hereditary spastic paraplegias (HSPs) are genetically
driven disorders with the clinical hallmark of progres-
sive spastic paraparesis. They can be inherited in an
autosomal-dominant, autosomal-recessive, or X-linked
manner with> 80 published genes or loci.1,2 Since Anita
Harding’s classification, HSPs have been divided into pure
or complicated forms. An isolated pyramidal syndrome
characterizes “pure” HSP, although neurogenic bladder dis-
turbances and impairment of vibration sense may occur.
Additional system involvement (cognitive impairment,
ataxia, basal ganglia symptoms, visual or auditory distur-
bances, symptoms of peripheral nerve involvement) defines
“complicated” forms of HSP and is assumed to be associ-
ated with a more severe disease course.3,4
Because HSPs are orphan diseases with a collective
prevalence of 2 to 10 per 100,000,5–7 systematic clinico-
genetic studies in large cohorts are missing. However,
smaller genotype-specific clinical series have given impor-
tant insights into phenotypic presentation, frequency, and
mutational spectrum.8–18
Here we present an in-depth clinical and genetic
characterization of a continuous, unselected cohort of 608
HSP patients. Conclusions drawn from this cohort can
guide diagnostic testing strategies and improve counseling
of HSP patients and their families. Major determinants of
disease severity revealed in the current study are of impor-
tance for stratification of study cohorts in clinical trials.
Patients and Methods
Cohort and Genetic WorkupA total of 608 HSP patients from 519 families were consecu-
tively enrolled in a continuous series by the GeNeMove and
German Center for Neurodegenerative Diseases (DZNE) cen-
ters in Bonn, Bochum, Magdeburg, Mainz, Munich, Regens-
burg, Rostock, T€ubingen, and Ulm (Table 1). The vast
majority of cases were German and had a nonconsanguineous
family background. Patients fulfilling the clinical diagnostic cri-
teria19 for HSP were included irrespective of their genetic diag-
nosis. In simplex cases, we excluded structural lesions and
inflammatory central nervous system disease by magnetic reso-
nance imaging of brain/spinal cord and cerebrospinal fluid anal-
ysis, and examined vitamin B12 levels and human T-cell
lymphotropic virus type 1/2 serology.
To delineate the specific HSP syndrome, we performed
biochemical and genetic tests. We systematically screened for
deficiency of lysosomal enzymes (arylsulfatase A, b-
Probability values are adjusted for possible clustering effects as detailed in Patients and Methods. To preserve readability of thetable, percentage values were not clustered but reflect the actually observed numbers.aPure versus complicated phenotypes were defined according to the Harding classification.3
D 5 dominant; IQR 5 interquartile range; n.s. 5 not significant; OR 5 odds ratio; R 5 recessive; S 5 simplex; SD 5 standard devi-ation; SPRS 5 Spastic Paraplegia Rating Scale.
ANNALS of Neurology
648 Volume 79, No. 4
Gender DistributionGender distribution was unequal, with a significantly
larger proportion of males than females in the total
cohort (odds ratio [OR] 5 1.2, male/female 5 0.55/0.45,
p 5 0.015; see Table 1). However, when considering only
families with confirmed mutations in autosomal HSP
genes, no significant differences in gender distribution
were noted. In contrast, males were strongly overrepre-
sented in simplex HSP cases without a genetic diagnosis
(OR 5 1.5, male/female 5 0.60/0.40, p 5 0.009).
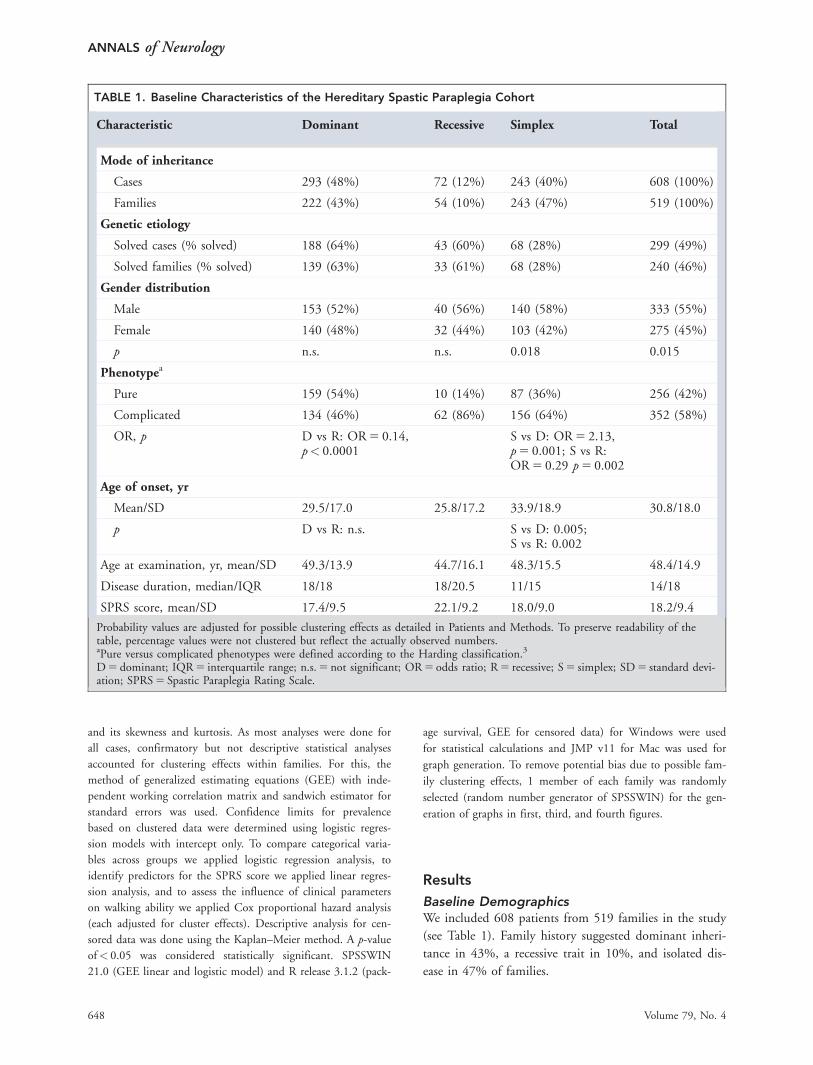
Age of OnsetAge of onset ranged from 0 to 73 years, with a mean of
30.8 years (standard deviation 5 18.0). The distribution
was bimodal, with a first peak in early childhood (<5
years in 11%) and a second peak around age 40 years
(Fig 1A). Gender did not significantly influence the age
of onset. Onset in simplex cases was later than in domi-
nant or recessive cases (see Fig 1B, see Table 1).
To determine the influence of the genotype on age
of onset, we performed a subgroup analysis for the 5
most frequent genotypes in our cohort (SPG3, SPG4,
SPG5, SPG7, SPG11; Fig 2). All genotypes, even those
typically considered to be early onset forms of HSP,
showed a wide age of onset spectrum ranging from child-
hood well into adulthood. SPG7 manifested later than
all other 4 genotypes. SPG4, although manifesting about
7 years earlier than SPG7, had a significantly later onset
than the early onset genotypes SPG3, SPG5, and SPG11
(see Fig 1C). All age of onset comparisons were corrected
for possible cluster effects within families using GEE.
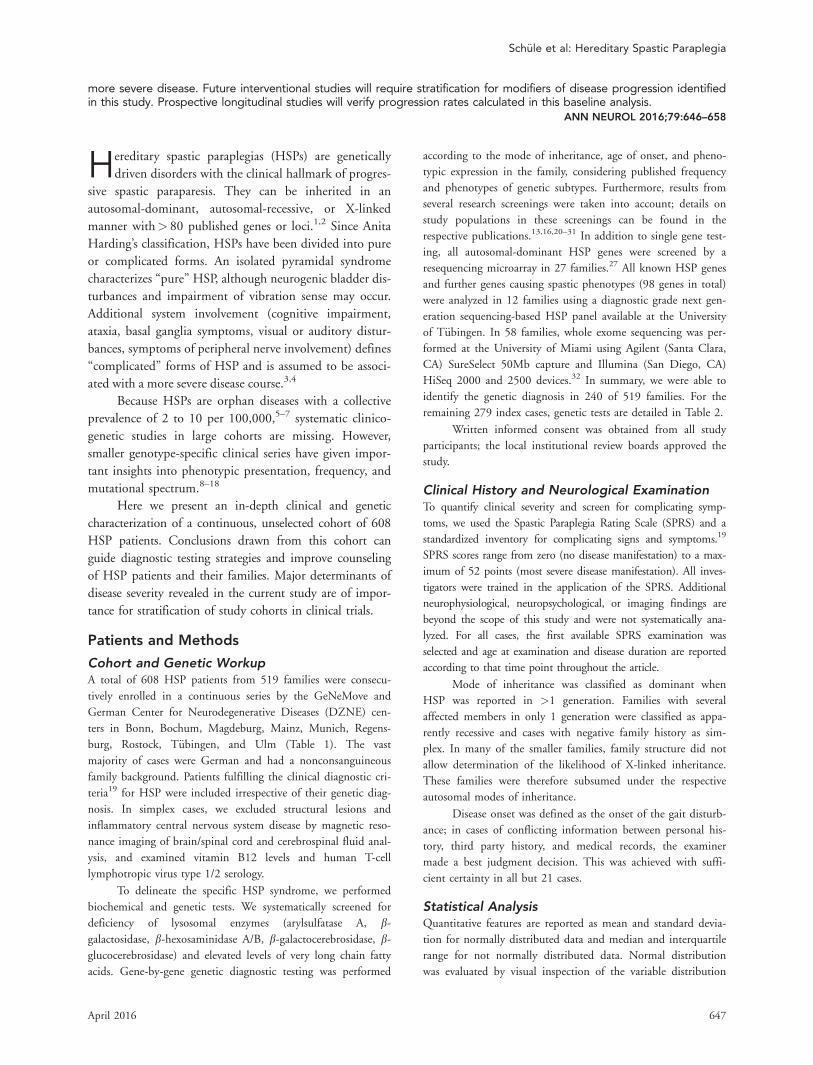
TABLE 2. Genetic Testing in Unsolved Cases
Mode of Inheritances
GeneticTest
Dominant,n 5 83
Recessive,n 5 21
Simplex,n 5 175
SPG3 54 (65%) 6 (29%) 74 (42%)
SPG4 62 (75%) 9 (43%) 114 (65%)
SPG10 38 (46%) 1 (5%) 41 (23%)
SPG31 42 (51%) 4 (19%) 61 (35%)
SPG5 N/A 5 (24%) 66 (38%)
SPG7 N/A 6 (29%) 73 (42%)
SPG11 N/A 4 (19%) 40 (23%)
SPG15 N/A 4 (19%) 41 (23%)
Number and proportion of index cases tested negatively forthe listed genes are given by mode of inheritance. Onlyindex cases for which no genetic diagnosis could be estab-lished (n 5 279) are included in the analysis.N/A 5 not applicable.
FIGURE 1: Age of onset distribution in hereditary spastic para-plegia (HSP). (A) Age of onset distribution in HSP patients fol-lowed a bimodal distribution with a first peak in earlychildhood (<5 years in 11%) and a second peak around age 40years. The horizontal boxplot on top illustrates the age ofonset distribution, with minimum, first quartile, median, thirdquartile, and maximum. The mean diamond indicates the mean(30.8 years) and the upper and lower 95% confidence intervalof the mean. (B) Age of onset varied in dependence on modeof inheritance, with later onset in simplex cases than in domi-nant or recessive cases. The Y-extent of the irregular shapesindicates the proportion of cases with a particular mode ofinheritance. The frequency of dominant and recessive inheri-tance decreases with increasing age of onset (right). In con-trast, negative family history is more frequent with later age ofonset. All modes of inheritance, however, can be observedacross the whole age of onset spectrum. (C) Age of onset isinfluenced by the genotype. Age of onset varies in depend-ence on the genotype. Median age of onset in years and theinterquartile range are given on the right. One affected familymember from each family was randomly selected for prepara-tion of this figure to avoid potential bias due to family cluster-ing effects. [Color figure can be viewed in the online issue,which is available at www.annalsofneurology.org.]
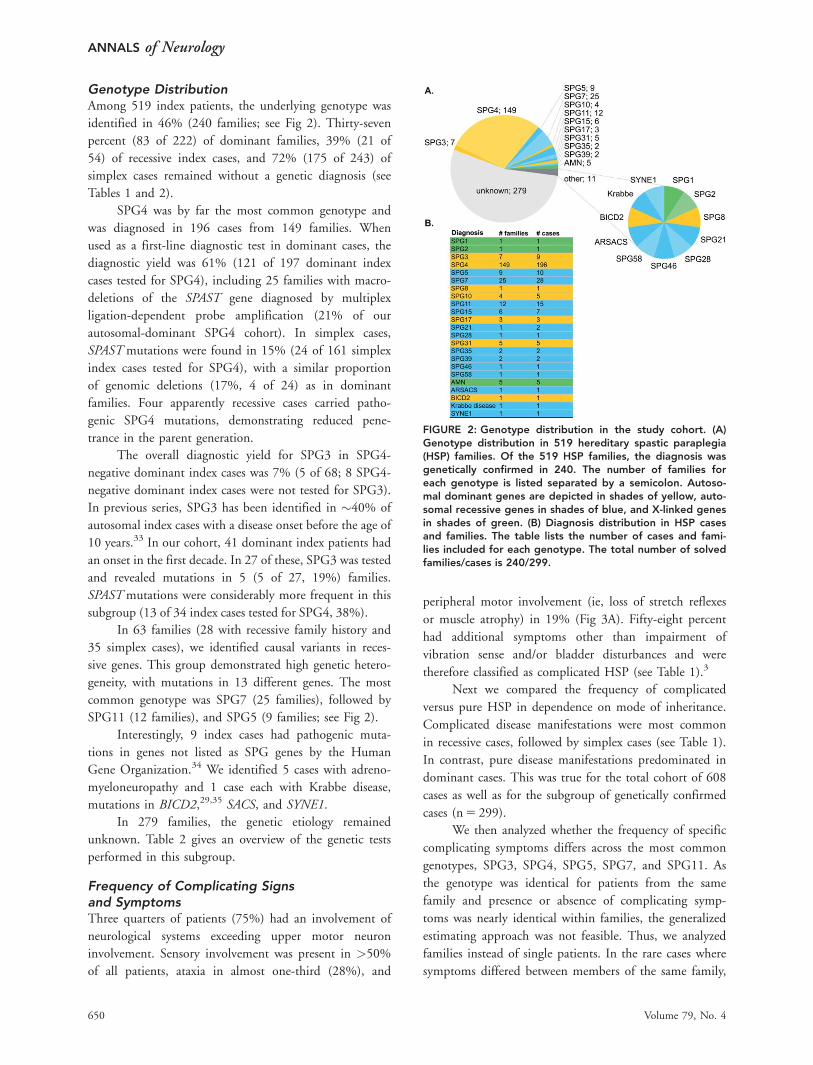
Genotype DistributionAmong 519 index patients, the underlying genotype was
identified in 46% (240 families; see Fig 2). Thirty-seven
percent (83 of 222) of dominant families, 39% (21 of
54) of recessive index cases, and 72% (175 of 243) of
simplex cases remained without a genetic diagnosis (see
Tables 1 and 2).
SPG4 was by far the most common genotype and
was diagnosed in 196 cases from 149 families. When
used as a first-line diagnostic test in dominant cases, the
diagnostic yield was 61% (121 of 197 dominant index
cases tested for SPG4), including 25 families with macro-
deletions of the SPAST gene diagnosed by multiplex
ligation-dependent probe amplification (21% of our
autosomal-dominant SPG4 cohort). In simplex cases,
SPAST mutations were found in 15% (24 of 161 simplex
index cases tested for SPG4), with a similar proportion
of genomic deletions (17%, 4 of 24) as in dominant
families. Four apparently recessive cases carried patho-
genic SPG4 mutations, demonstrating reduced pene-
trance in the parent generation.
The overall diagnostic yield for SPG3 in SPG4-
negative dominant index cases was 7% (5 of 68; 8 SPG4-
negative dominant index cases were not tested for SPG3).
In previous series, SPG3 has been identified in �40% of
autosomal index cases with a disease onset before the age of
10 years.33 In our cohort, 41 dominant index patients had
an onset in the first decade. In 27 of these, SPG3 was tested
and revealed mutations in 5 (5 of 27, 19%) families.
SPAST mutations were considerably more frequent in this
subgroup (13 of 34 index cases tested for SPG4, 38%).
In 63 families (28 with recessive family history and
35 simplex cases), we identified causal variants in reces-
sive genes. This group demonstrated high genetic hetero-
geneity, with mutations in 13 different genes. The most
common genotype was SPG7 (25 families), followed by
SPG11 (12 families), and SPG5 (9 families; see Fig 2).
Interestingly, 9 index cases had pathogenic muta-
tions in genes not listed as SPG genes by the Human
Gene Organization.34 We identified 5 cases with adreno-
myeloneuropathy and 1 case each with Krabbe disease,
mutations in BICD2,29,35 SACS, and SYNE1.
In 279 families, the genetic etiology remained
unknown. Table 2 gives an overview of the genetic tests
performed in this subgroup.
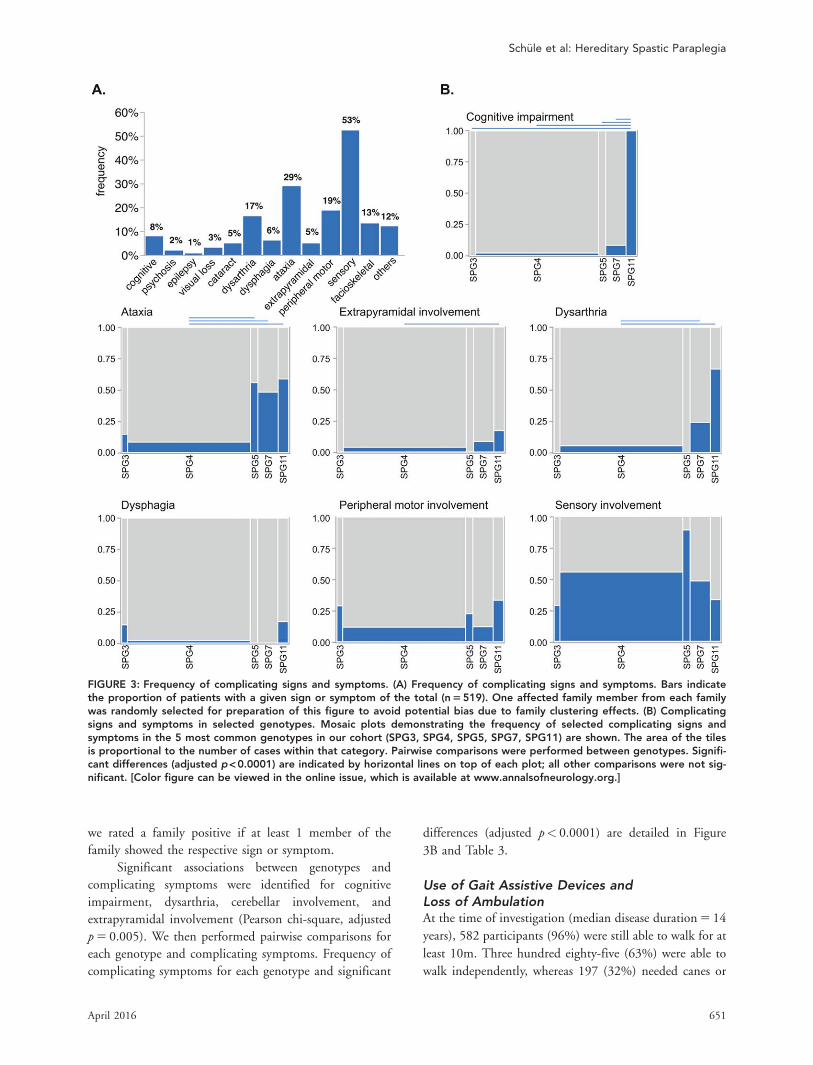
Frequency of Complicating Signsand SymptomsThree quarters of patients (75%) had an involvement of
neurological systems exceeding upper motor neuron
involvement. Sensory involvement was present in >50%
of all patients, ataxia in almost one-third (28%), and
peripheral motor involvement (ie, loss of stretch reflexes
or muscle atrophy) in 19% (Fig 3A). Fifty-eight percent
had additional symptoms other than impairment of
vibration sense and/or bladder disturbances and were
therefore classified as complicated HSP (see Table 1).3
Next we compared the frequency of complicated
versus pure HSP in dependence on mode of inheritance.
Complicated disease manifestations were most common
in recessive cases, followed by simplex cases (see Table 1).
In contrast, pure disease manifestations predominated in
dominant cases. This was true for the total cohort of 608
cases as well as for the subgroup of genetically confirmed
cases (n 5 299).
We then analyzed whether the frequency of specific
complicating symptoms differs across the most common
genotypes, SPG3, SPG4, SPG5, SPG7, and SPG11. As
the genotype was identical for patients from the same
family and presence or absence of complicating symp-
toms was nearly identical within families, the generalized
estimating approach was not feasible. Thus, we analyzed
families instead of single patients. In the rare cases where
symptoms differed between members of the same family,
FIGURE 2: Genotype distribution in the study cohort. (A)Genotype distribution in 519 hereditary spastic paraplegia(HSP) families. Of the 519 HSP families, the diagnosis wasgenetically confirmed in 240. The number of families foreach genotype is listed separated by a semicolon. Autoso-mal dominant genes are depicted in shades of yellow, auto-somal recessive genes in shades of blue, and X-linked genesin shades of green. (B) Diagnosis distribution in HSP casesand families. The table lists the number of cases and fami-lies included for each genotype. The total number of solvedfamilies/cases is 240/299.
ANNALS of Neurology
650 Volume 79, No. 4
we rated a family positive if at least 1 member of the
family showed the respective sign or symptom.
Significant associations between genotypes and
complicating symptoms were identified for cognitive
impairment, dysarthria, cerebellar involvement, and
p 5 0.005). We then performed pairwise comparisons for
each genotype and complicating symptoms. Frequency of
complicating symptoms for each genotype and significant
differences (adjusted p< 0.0001) are detailed in Figure
3B and Table 3.
Use of Gait Assistive Devices andLoss of AmbulationAt the time of investigation (median disease duration 5 14
years), 582 participants (96%) were still able to walk for at
least 10m. Three hundred eighty-five (63%) were able to
walk independently, whereas 197 (32%) needed canes or
FIGURE 3: Frequency of complicating signs and symptoms. (A) Frequency of complicating signs and symptoms. Bars indicatethe proportion of patients with a given sign or symptom of the total (n 5 519). One affected family member from each familywas randomly selected for preparation of this figure to avoid potential bias due to family clustering effects. (B) Complicatingsigns and symptoms in selected genotypes. Mosaic plots demonstrating the frequency of selected complicating signs andsymptoms in the 5 most common genotypes in our cohort (SPG3, SPG4, SPG5, SPG7, SPG11) are shown. The area of the tilesis proportional to the number of cases within that category. Pairwise comparisons were performed between genotypes. Signifi-cant differences (adjusted p < 0.0001) are indicated by horizontal lines on top of each plot; all other comparisons were not sig-nificant. [Color figure can be viewed in the online issue, which is available at www.annalsofneurology.org.]
walkers; only 26 participants (4%) had completely lost
their ability to walk. Seventy participants (12%) reported
use of a wheelchair on a regular basis.
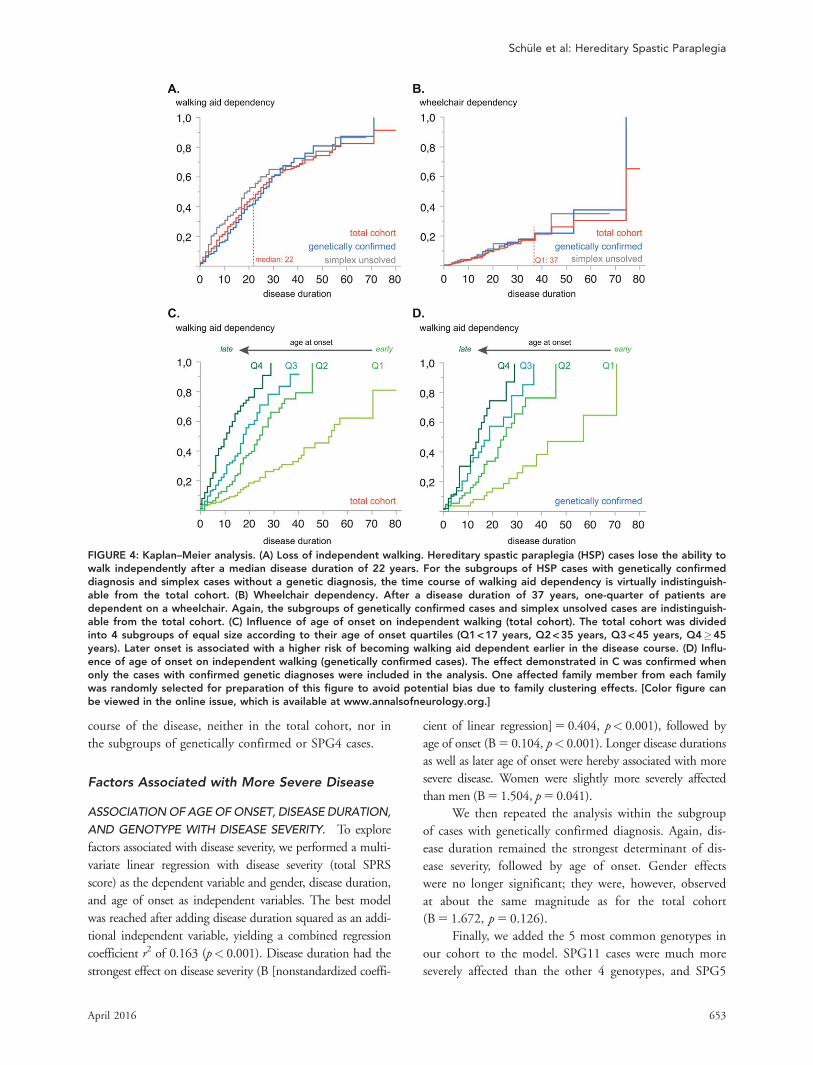
To assess the risk of becoming dependent on a
walking aid or wheelchair, we performed a Kaplan–Meier
analysis. After disease durations of 10/20/30/40 years,
respectively, 25/48/64/72% of patients regularly used a
walking aid. The median disease duration until loss of
independent walking was 22 years (Fig 4A).
The proportion of patients using a wheelchair was
much smaller, that is, at 10/20/30/40 years into the dis-
ease, 5/12/18/29% of patients depended on a wheelchair
in daily life. After a disease duration of 37 years, only
one-quarter of patients regularly used a wheelchair (see Fig
4B). Of patients using a walking aid, the median time
until they moved on to use a wheelchair was 16 years.
Factors Associated with Earlier Lossof Independent WalkingWe analyzed whether age of onset or gender are associ-
ated with the risk of becoming walking aid or wheelchair
dependent. Later age of onset was strongly associated
with loss of independent walking earlier in the disease
course (hazard ratio [HR]10years 5 1.676, confidence
interval [CI] 5 1.538–1.842, p< 0.001). To rule out that
this effect was driven by the possible presence of alterna-
tive diagnoses especially in cases without genetically con-
firmed HSP, we repeated the analysis in the subgroup of
cases with confirmed mutations in HSP genes. The same
association between late disease onset and earlier loss of
independent walking ability was observed in this sub-
group (HR10years 5 1.583, CI 5 1.397–1.774], p< 0.001;
see Fig 4A, middle gray line). Finally, we considered
whether the underlying genotype rather than the age of
onset per se contributes to this effect. As SPG4 is the
only genotype frequent enough in our cohort for a
genotype-specific subgroup analysis, we performed a clus-
tered survival analysis in the SPG4 subcohort (n 5 196),
whereof 96 patients became walking aid dependent dur-
ing the observation timeframe. Even in this genotype-
specific subgroup, later disease onset was associated with
earlier walking aid dependency (HR10years 5 1.583,
CI 5 1.357–1.842, p< 0.001).
Similarly, cases with a later age of onset became wheel-
chair dependent earlier in the disease course; this association
was significant in the total cohort (HR10years 5 1.195,
CI 5 1.020–1.411, p 5 0.029) as well as in the subgroups of
genetically confirmed cases (HR10years 5 1.243, CI 5
1.000–1.538, p 5 0.047) and SPG4 cases (HR10years 5
1.452, CI 5 1.072–1.967, p 5 0.016), despite the small
sample sizes in these subcohorts (eg, 39 of 22 events in
genetically confirmed/SPG4 cases).
Gender was not associated with the risk of becom-
ing walking aid or wheelchair dependent during the
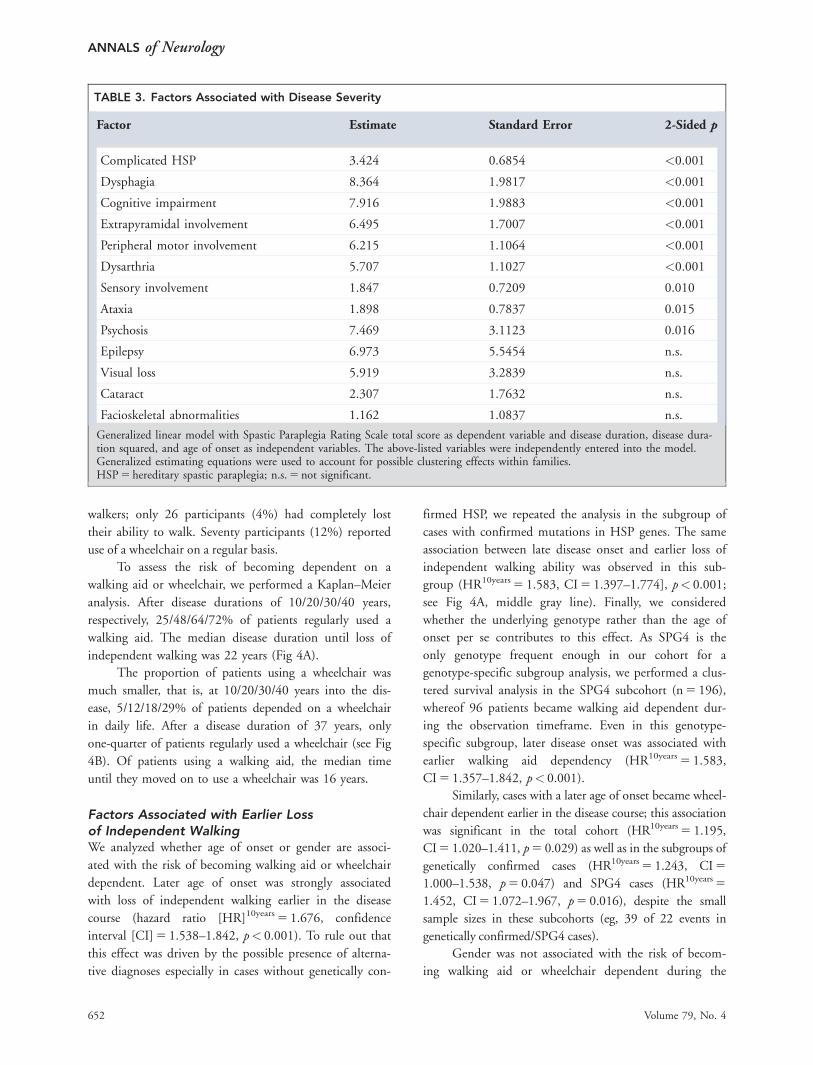
TABLE 3. Factors Associated with Disease Severity
Factor Estimate Standard Error 2-Sided p
Complicated HSP 3.424 0.6854 <0.001
Dysphagia 8.364 1.9817 <0.001
Cognitive impairment 7.916 1.9883 <0.001
Extrapyramidal involvement 6.495 1.7007 <0.001
Peripheral motor involvement 6.215 1.1064 <0.001
Dysarthria 5.707 1.1027 <0.001
Sensory involvement 1.847 0.7209 0.010
Ataxia 1.898 0.7837 0.015
Psychosis 7.469 3.1123 0.016
Epilepsy 6.973 5.5454 n.s.
Visual loss 5.919 3.2839 n.s.
Cataract 2.307 1.7632 n.s.
Facioskeletal abnormalities 1.162 1.0837 n.s.
Generalized linear model with Spastic Paraplegia Rating Scale total score as dependent variable and disease duration, disease dura-tion squared, and age of onset as independent variables. The above-listed variables were independently entered into the model.Generalized estimating equations were used to account for possible clustering effects within families.HSP 5 hereditary spastic paraplegia; n.s. 5 not significant.
ANNALS of Neurology
652 Volume 79, No. 4
course of the disease, neither in the total cohort, nor in
the subgroups of genetically confirmed or SPG4 cases.
Factors Associated with More Severe Disease
ASSOCIATION OF AGE OF ONSET, DISEASE DURATION,
AND GENOTYPE WITH DISEASE SEVERITY. To explore
factors associated with disease severity, we performed a multi-
variate linear regression with disease severity (total SPRS
score) as the dependent variable and gender, disease duration,
and age of onset as independent variables. The best model
was reached after adding disease duration squared as an addi-
tional independent variable, yielding a combined regression
coefficient r2 of 0.163 (p< 0.001). Disease duration had the
strongest effect on disease severity (B [nonstandardized coeffi-
cient of linear regression] 5 0.404, p< 0.001), followed by
age of onset (B 5 0.104, p< 0.001). Longer disease durations
as well as later age of onset were hereby associated with more
severe disease. Women were slightly more severely affected
than men (B 5 1.504, p 5 0.041).
We then repeated the analysis within the subgroup
of cases with genetically confirmed diagnosis. Again, dis-
ease duration remained the strongest determinant of dis-
ease severity, followed by age of onset. Gender effects
were no longer significant; they were, however, observed
at about the same magnitude as for the total cohort
(B 5 1.672, p 5 0.126).
Finally, we added the 5 most common genotypes in
our cohort to the model. SPG11 cases were much more
severely affected than the other 4 genotypes, and SPG5
FIGURE 4: Kaplan–Meier analysis. (A) Loss of independent walking. Hereditary spastic paraplegia (HSP) cases lose the ability towalk independently after a median disease duration of 22 years. For the subgroups of HSP cases with genetically confirmeddiagnosis and simplex cases without a genetic diagnosis, the time course of walking aid dependency is virtually indistinguish-able from the total cohort. (B) Wheelchair dependency. After a disease duration of 37 years, one-quarter of patients aredependent on a wheelchair. Again, the subgroups of genetically confirmed cases and simplex unsolved cases are indistinguish-able from the total cohort. (C) Influence of age of onset on independent walking (total cohort). The total cohort was dividedinto 4 subgroups of equal size according to their age of onset quartiles (Q1 < 17 years, Q2 < 35 years, Q3 < 45 years, Q4�45years). Later onset is associated with a higher risk of becoming walking aid dependent earlier in the disease course. (D) Influ-ence of age of onset on independent walking (genetically confirmed cases). The effect demonstrated in C was confirmed whenonly the cases with confirmed genetic diagnoses were included in the analysis. One affected family member from each familywas randomly selected for preparation of this figure to avoid potential bias due to family clustering effects. [Color figure canbe viewed in the online issue, which is available at www.annalsofneurology.org.]
the Center for Clinical Research T€ubingen (1970-0-0,
R.S.), the German HSP-Selbsthilfegruppe (R.S., L.S.)
and the Spastic Paraplegia Foundation (R.S.).
We thank the HSP patients and their families for
participation; and Dr. A. Dudesek, Dr. A.-D. Sperfeld, Dr.
J. Winkler, and Dr. B. Winner for the contribution of
patients to this study.
Author Contributions
R.S., S.W., P.M., S.Z., and L.S. were responsible for the
concept and design of the study. All authors contributed
to data acquisition, data analysis, and drafting the manu-
script. R.S., S.W., and L.S. drafted the figures. R.S. and
S.W. contributed equally to the work.
Potential Conflicts of Interest
Nothing to report.
References1. Schule R, Schols L. Genetics of hereditary spastic paraplegias.
Semin Neurol 2011;31:484–493.
2. Novarino G, Fenstermaker AG, Zaki MS, et al. Exome sequencinglinks corticospinal motor neuron disease to common neurodege-nerative disorders. Science 2014;343:506–511.
3. Harding AE. Classification of the hereditary ataxias and paraple-gias. Lancet 1983;1:1151–1155.
4. Salinas S, Proukakis C, Crosby A, Warner TT. Hereditary spasticparaplegia: clinical features and pathogenetic mechanisms. LancetNeurol 2008;7:1127–1138.
5. Braschinsky M, Luus SM, Gross-Paju K, Haldre S. The prevalenceof hereditary spastic paraplegia and the occurrence of SPG4mutations in Estonia. Neuroepidemiology 2009;32:89–93.
ANNALS of Neurology
656 Volume 79, No. 4
6. Erichsen AK, Koht J, Stray-Pedersen A, et al. Prevalence of heredi-tary ataxia and spastic paraplegia in southeast Norway: apopulation-based study. Brain 2009;132(pt 6):1577–1588.
7. Ruano L, Melo C, Silva MC, Coutinho P. The global epidemiologyof hereditary ataxia and spastic paraplegia: a systematic review ofprevalence studies. Neuroepidemiology 2014;42:174–183.
11. van Gassen KL, van der Heijden CD, de Bot ST, et al. Genotype-phenotype correlations in spastic paraplegia type 7: a study in alarge Dutch cohort. Brain 2012;135(pt 10):2994–3004.
12. Goizet C, Boukhris A, Maltete D, et al. SPG15 is the second mostcommon cause of hereditary spastic paraplegia with thin corpuscallosum. Neurology 2009;73:1111–1119.
13. Beetz C, Schule R, Deconinck T, et al. REEP1 mutation spectrumand genotype/phenotype correlation in hereditary spastic paraple-gia type 31. Brain 2008;131(pt 4):1078–1086.
14. Goizet C, Boukhris A, Durr A, et al. CYP7B1 mutations in pureand complex forms of hereditary spastic paraplegia type 5. Brain2009;132(pt 6):1589–1600.
15. Stevanin G, Azzedine H, Denora P, et al. Mutations in SPG11 arefrequent in autosomal recessive spastic paraplegia with thin cor-pus callosum, cognitive decline and lower motor neuron degener-ation. Brain 2008;131(pt 3):772–784.
16. Hehr U, Bauer P, Winner B, et al. Long-term course and muta-tional spectrum of spatacsin-linked spastic paraplegia. Ann Neurol2007;62:656–665.
17. Namekawa M, Ribai P, Nelson I, et al. SPG3A is the most frequentcause of hereditary spastic paraplegia with onset before age 10years. Neurology 2006;66:112–114.
18. Durr A, Davoine CS, Paternotte C, et al. Phenotype of autosomaldominant spastic paraplegia linked to chromosome 2. Brain 1996;119(pt 5):1487–1496.
19. Schule R, Holland-Letz T, Klimpe S, et al. The Spastic ParaplegiaRating Scale (SPRS): a reliable and valid measure of disease sever-ity. Neurology 2006;67:430–434.
20. Beetz C, Nygren AO, Schickel J, et al. High frequency of partialSPAST deletions in autosomal dominant hereditary spastic para-plegia. Neurology 2006;67:1926–1930.
21. Beetz C, Schule R, Klebe S, et al. Screening of hereditary spasticparaplegia patients for alterations at NIPA1 mutational hotspots.J Neurol Sci 2008;268:131–135.
22. Schule R, Kremer BP, Kassubek J, et al. SPG10 is a rare cause ofspastic paraplegia in European families. J Neurol Neurosurg Psy-chiatry 2008;79:584–587.
23. Schule R, Brandt E, Karle KN, et al. Analysis of CYP7B1 in non-consanguineous cases of hereditary spastic paraplegia. Neuroge-netics 2009;10:97–104.
24. Schule R, Schlipf N, Synofzik M, et al. Frequency and phenotypeof SPG11 and SPG15 in complicated hereditary spastic paraple-gia. J Neurol Neurosurg Psychiatry 2009;80:1402–1404.
25. Schlipf NA, Beetz C, Schule R, et al. A total of 220 patients withautosomal dominant spastic paraplegia do not display mutations inthe SLC33A1 gene (SPG42). Eur J Hum Genet 2010;18:1065–1067.
26. Schlipf NA, Schule R, Klimpe S, et al. Amplicon-based high-throughput pooled sequencing identifies mutations in CYP7B1
and SPG7 in sporadic spastic paraplegia patients. Clin Genet2011;80:148–160.
27. Dufke C, Schlipf N, Schule R, et al. A high-throughput resequenc-ing microarray for autosomal dominant spastic paraplegia genes.Neurogenetics 2012;13:215–227.
28. Gonzalez M, Nampoothiri S, Kornblum C, et al. Mutations inphospholipase DDHD2 cause autosomal recessive hereditaryspastic paraplegia (SPG54). Eur J Hum Genet 2013;21:1214–1218.
29. Oates EC, Rossor AM, Hafezparast M, et al. Mutations in BICD2cause dominant congenital spinal muscular atrophy and hereditaryspastic paraplegia. Am J Hum Genet 2013;92:965–973.
30. Caballero Oteyza A, Battaloglu E, Ocek L, et al. Motor proteinmutations cause a new form of hereditary spastic paraplegia.Neurology 2014;82:2007–2016.
31. Synofzik M, Gonzalez MA, Lourenco CM, et al. PNPLA6 mutationscause Boucher-Neuhauser and Gordon Holmes syndromes as part ofa broad neurodegenerative spectrum. Brain 2014;137(pt 1):69–77.
32. Gonzalez MA, Lebrigio RF, Van Booven D, et al. GEnomes Manage-ment Application (GEM.app): a new software tool for large-scalecollaborative genome analysis. Hum Mutat 2013;34:842–846.
33. Durr A, Camuzat A, Colin E, et al. Atlastin1 mutations are frequentin young-onset autosomal dominant spastic paraplegia. Arch Neu-rol 2004;61:1867–1872.
34. Gray KA, Yates B, Seal RL, et al. Genenames.org: the HGNCresources in 2015. Nucleic Acids Res 2015;43(Database issue):D1079–D1085.
35. Rossor AM, Oates EC, Salter HK, et al. Phenotypic and molecularinsights into spinal muscular atrophy due to mutations in BICD2.Brain 2015;138(pt 2):293–310.
36. Depienne C, Tallaksen C, Lephay JY, et al. Spastin mutations arefrequent in sporadic spastic paraparesis and their spectrum is dif-ferent from that observed in familial cases. J Med Genet 2006;43:259–265.
37. Brugman F, Scheffer H, Wokke JH, et al. Paraplegin mutations insporadic adult-onset upper motor neuron syndromes. Neurology2008;71:1500–1505.
38. Margolin DH, Kousi M, Chan YM, et al. Ataxia, dementia, andhypogonadotropism caused by disordered ubiquitination. N EnglJ Med 2013;368:1992–2003.
39. Bonifert T, Karle KN, Tonagel F, et al. Pure and syndromic opticatrophy explained by deep intronic OPA1 mutations and an intra-locus modifier. Brain 2014;137(pt 8):2164–2177.
40. Mencarelli MA, Heidet L, Storey H, et al. Evidence of digenicinheritance in Alport syndrome. J Med Genet 2015;52:163–174.
41. Lupski JR. Digenic inheritance and Mendelian disease. Nat Genet2012;44:1291–1292.
42. Anheim M, Tranchant C, Koenig M. The autosomal recessive cere-bellar ataxias. N Engl J Med 2012;366:636–646.
43. Proukakis C, Moore D, Labrum R, et al. Detection of novel muta-tions and review of published data suggests that hereditary spas-tic paraplegia caused by spastin (SPAST) mutations is found moreoften in males. J Neurol Sci 2011;306:62–65.
44. Varga RE, Schule R, Fadel H, et al. Do not trust the pedigree:reduced and sex-dependent penetrance at a novel mutation hot-spot in ATL1 blurs autosomal dominant inheritance of spastic par-aplegia. Hum Mutat 2013;34:860–863.
45. Fonknechten N, Mavel D, Byrne P, et al. Spectrum of SPG4 muta-tions in autosomal dominant spastic paraplegia. Hum Mol Genet2000;9:637–644.
46. Sauter S, Miterski B, Klimpe S, et al. Mutation analysis of thespastin gene (SPG4) in patients in Germany with autosomaldominant hereditary spastic paraplegia. Hum Mutat 2002;20:127–132.
Sch€ule et al: Hereditary Spastic Paraplegia
April 2016 657
47. Depienne C, Fedirko E, Forlani S, et al. Exon deletions of SPG4are a frequent cause of hereditary spastic paraplegia. J MedGenet 2007;44:281–284.
48. Hazan J, Fonknechten N, Mavel D, et al. Spastin, a new AAA pro-tein, is altered in the most frequent form of autosomal dominantspastic paraplegia. Nat Genet 1999;23:296–303.
49. Vermeer S, Meijer RP, Pijl BJ, et al. ARSACS in the Dutch popula-tion: a frequent cause of early-onset cerebellar ataxia. Neuroge-netics 2008;9:207–214.
50. Ragno M, De Michele G, Cavalcanti F, et al. Broadened Frie-dreich’s ataxia phenotype after gene cloning. Minimal GAAexpansion causes late-onset spastic ataxia. Neurology 1997;49:1617–1620.
51. Bhidayasiri R, Perlman SL, Pulst SM, Geschwind DH. Late-onsetFriedreich ataxia: phenotypic analysis, magnetic resonance imag-ing findings, and review of the literature. Arch Neurol 2005;62:1865–1869.
52. Schols L, Bauer P, Schmidt T, et al. Autosomal dominant cerebel-lar ataxias: clinical features, genetics, and pathogenesis. LancetNeurol 2004;3:291–304.
53. Muller vom Hagen J, Karle KN, Schule R, et al. Leukodystrophiesunderlying cryptic spastic paraparesis: frequency and phenotypein 76 patients. Eur J Neurol 2014;21:983–988.
54. Tezenas du Montcel S, Charles P, Goizet C, et al. Factors influenc-ing disease progression in autosomal dominant cerebellar ataxiaand spastic paraplegia. Arch Neurol 2012;69:500–508.
55. Jacobi H, Bauer P, Giunti P, et al. The natural history of spinocere-bellar ataxia type 1, 2, 3, and 6: a 2-year follow-up study. Neurol-ogy 2011;77:1035–1041.
56. Metz G, Coppard N, Cooper JM, et al. Rating disease progression ofFriedreich’s ataxia by the International Cooperative Ataxia Rating Scale:analysis of a 603-patient database. Brain 2013;136(pt 1):259–268.
57. Reetz K, Dogan I, Costa AS, et al. Biological and clinical charac-teristics of the European Friedreich’s Ataxia Consortium for Trans-lational Studies (EFACTS) cohort: a cross-sectional analysis ofbaseline data. Lancet Neurol 2015;14:174–182.
58. Tabrizi SJ, Scahill RI, Owen G, et al. Predictors of phenotypic pro-gression and disease onset in premanifest and early-stage Hun-tington’s disease in the TRACK-HD study: analysis of 36-monthobservational data. Lancet Neurol 2013;12:637–649.