Hermes Microvision, Inc. Annual Report 2014 Annual report is available at http://newmops.tse.com.tw HMI annual report is available at http://www.hermes-microvision.com Published on March 9 th , 2015 Ticker: 3658TT
Transcript
Hermes Microvision, Inc.
Annual Report 2014
Annual report is available at http://newmops.tse.com.tw HMI annual report is available at http://www.hermes-microvision.com Published on March 9th, 2015
Ticker: 3658TT
Contact Information Spokesperson:
Name: Leo Shen
Title: Vice President of Finance, Chief Financial Officer
VIII.Other Special Notes ....................................................................................... 66 1. HMI Affiliates ............................................................................................... 66
2. Private placement of securities .................................................................... 68
3. Holding or Disposition of HMI Stocks by Subsidiaries ................................... 68
4. Any Events that Had Significant Impacts on Shareholders’ Rights or Security Prices as Stated in Item 2 Paragraph 2 of Article 36 of Securities and Exchange Law of Taiwan. .............................................................................. 68
5. Other Necessary Supplement ....................................................................... 68
IX. Financial Information ..................................................................................... 69
5. Key performance indicators for the businesses equipped with special characteristics .............................................................................................. 76
The macro economy recovery in the United States results in strong demand for mobile devices and
automotive electronics and furthermore boosted growth for the semiconductor industry 2014. As the
mobile devices, such as smart phones and tablet PCs, etc. have risen in popularity, semiconductor advanced
technology has therefore further evolved into finer geometry nodes. As a result, the demand for
high-resolution E-beam inspection tools from semiconductor manufacturers has increased by degrees.
Therefore, we achieved another record-breaking operating revenue and net income in 2014. The fruitful
results have come from every stockholder who gives their full support to the Company and the entire body
of employees who make every effort to create the success, and we hereby send our sincere appreciation to
all of you.
Along with the geometry migration to advanced process technology nodes, the increasing architectural,
manufacturing and material complexities will result in more inspection layers and more killer defects in the
semiconductor manufacturing process. Under such circumstances, wafer inspection has become more
important for fabs in terms of yield management. While conventional optimal wafer inspection technology
has run into a bottleneck due to its limited resolution, e-beam inspection or EBI tools are considered as a
more supportive technology at the leading edge technology nodes, given their superior technical
performance in resolution and sensitivity. As such, the Company’s annual operating revenue and profit
have stably grown. The Company’s 2014 operating revenue again hit a record high of NT$7.21 billion,
representing an annual growth rate of 35% compared with NT$5.34 billion generated in 2013. With the
breakthrough, the Company’s 2014 net income became NT$3.24 billion whereas its EPS topped NT$45.60.
HMI has specialized in development and production of E-beam inspection equipments. With our
proprietary inspection technology, we had successfully promoted our products to the international market.
Currently, HMI has already had a sturdy competition niche in the E-beam inspection market. Other than
further profoundly developing its E-beam inspection technology, HMI has also taken customer
requirements into account and aggressively diversified our applications of E-beam technology, in the hope
of enriching its product offering. We successfully launched our new hot-spot monitoring model of eP4 at
the end of 2014. With the launch of the new model, HMI is ahead of its peers to provide our clients with the
optimal way for E-beam inspection, and further optimize the value for our clients.
In 2014, we obtained the CG6009 certification from Corporate Governance Association. HMI is
committed to establish profound corporate governance system. By nurturing sustainability business
practices, we also create values to our employees, our customers, and our shareholders.
Looking ahead to 2015, following the launch of new generation of E-beam inspection products and the
continuing growth of the semiconductor business, customer demand for high-end process control
equipment technology will gradually increase, and our competitors will keep investing in E-beam
technology related fields. Hence, HMI will continue to enhance our product quality and upgrade our
~2~
customer service, so as to take on the market’s keen challenge and create a new peak of business
performance. On the other hand, the construction of HMI’s new manufacturing plant at the Tainan Science
Park is expected to be completed in early 2015. By then, our production capacity is expected to be notably
elevated and meet the demand of the advanced semiconductor process for the E-beam inspection
equipment. Other than devoting our efforts to persistently innovate its advanced semiconductor process so
as to provide leading-edge inspection technology to help semiconductor manufacturers enhance their
process yield rates, HMI has put more focus developoing new applications and commitment to carrying out
its sustainable corporate operations and becoming a qualified global corporate citizen. We will participate
in corporate governance appraisal, and reinforce our corporate social responsibility to solidify its strength
for further development in respective fields and head for the goal of sustainable corporate development
and becoming a prominent corporate citizen.
Finally, we would like again to thank every of you for your continuing support and dedication to the
Company. We more hope that your support and dedication will continue in the future.
We wish you health and happiness.
Chairman Hsu, Chin-Yung
~3~
II. Company Profile 1. Hermes Microvision Company Profile
Hermes Microvision, Inc. (HMI) was incorporated on May 19th, 2003 and listed on GreTai Security Stock Exchange in 2012. The company is headquartered in Taiwan, with sales and research subsidiaries in US, China, Korea, and Japan. Since established, HMI has been committed to the research and development of the most advanced E-beam Inspection (EBI) tools and solutions for the leading semiconductor manufacturing fabs. Today, HMI is the leading supplier of EBI tools for both foundry and memory fabs worldwide. Based on our proprietary electron gun and column technologies and highly effective defect inspection algorithms, we deliver multiple product lines, including eScan® Series / ePTM Series / eXplore® Series, for various R&D and production applications. HMI has been fully dedicated to the R&D, manufacturing, worldwide sales and service for its own products, presenting tough strength and strong will throughout the process. With our top technical professionals in Taiwan, US, China, and around the world, as well as its professional customer service, HMI has established its name not only for world-class cutting edge semiconductor process equipment, but also in the history of the semiconductor industry.
2. Milestones Year Major milestones
2003 - Established Hermes Microvision Precision Technology Co., Ltd., with a capital of
NT$1,000,000 at Hsinchu City, and provided semiconductor wafer manufacturing
fabs with more advanced inspection equipment and technology along with geometry
migration.
- Renamed the original company name to be Hermes Microvision, Inc.
2004 - Acquired 100% of the outstanding shares of Hermes Microvision, Inc., USA in Silicon
Valley and obtained the core technology required for EBI equipment.
- Sold our first EBI equipment product, penetrating the EBI market which had long
been monopolized by U.S. and Japanese companies.
- Established a branch in the Hsinchu Science Park.
- Established a production foothold at the Tainan Science Park to expand production
capacity.
- Increased the capital by cash by NT$ 499,000,000. The total paid-in capital after the
offering was NT$500,000,000.
2005 - Successfully extend our business to Korean and Japanese clients.
2006 - Set up a branch in Japan to expand the Company’s business.
- Successfully developed eScan 310 and eScan 380.
2007 - Increased the capital by cash by NT$280,000,000. The total paid-in capital after the
offering was NT$780,000,000.
2008 - Set up subsidiaries in Korea and Japan respectively to expand the Company’s
business in Korea and Japan markets.
- Reduced the capital by NT$650,000,000, followed by increasing the capital by
NT$280,000,000 through capital raising in cash, making the total paid-in capital to be
NT$410,000,000.
~4~
- The stock went public.
- Successfully developed eP2, eScan Lite and eScan 315.
2009 - Trans-invested in China’s third-tier subsidiary, making it an important module
production site.
- Closed the Japan branch
- Successfully developed eScan 400.
2010 - Raised the capital in cash by NT$190,000,000, making the total paid-in capital to be
NT$600,000,000.
- Successfully developed eScan 320, eXplore, eManager Workstation and Supernova.
2011 - Relocated the headquarters to Hsinchu City and set up a branch at the Hsinchu
Science Park
- Registered on Apr. 29 as an emerging-listed company.
- Successfully developed eP3.
2012
- Raised the capital in cash by NT$60,000,000, making the total paid-in capital to be
NT$660,000,000
- Officially listed its stock on the GTSM on May 21 for trading.
- Earned the 21st National SMEs award.
2013 - Participated in issuance of the overseas depositary receipt of NT$50,000,000 by
issuing the common stock, making the total paid-in capital to be NT$710,000,000
- Successfully developed eScan 500
- Received Potential Taiwan Mittelstand Award
2014 - Corporate Governance system Certified by CG6009.
- Successfully developed eP4.
~5~
III. Corporate Governance 1. Organization 1.1 Organization Chart
Shareholders’ Meeting
Board of Directors, Chariman
Vice Chairman
President
Compensation Committee
Audit Committee
Internal Audit
Corporate Sales and Marketing
Technology Development
Corporate Operations
Research and Development Intellectual Property Technical Support
Manufacturing and Sales Planning Customer Service Quality Control Sales Marketing Business Development Technology Marketing
Finance Supply Chain Management Human Resources Information Technology
~6~
1.2 Functions of Key Divisions
Division Functions
Internal Audit Internal audit and operational procedure management
Research and Development Product development and innovation
Intellectual Property In charge of accumulation and maintenance of intellectual properties and
application for patents.
Technical Support
In charge of overseas client technical support and consultation, reflection
of customers’ problems and dispatch of them to manufacturing and R&D
divisions as the reference for improvement.
Put forth project verification for the design problem of customer’s
terminals or other major problems, and execute the improvement scheme.
Provide product basic and advanced training courses for internal and
external customers.
Provide FCN and CIP service to customers.
Finance Prepare financial statements, provide management information, plan
working capital and long term financial planning.
Human Resource
Execution and planning of human resource related businesses covering
personnel recruitment, employment, promotion, educational training and
retirement, etc.
Supply Chain Management Purchase equipment, spare parts, raw materials, and office supplies, etc.,
and handle export, import and bonding businesses.
Information Technology Computer management, and information system development and
maintenance, etc.
Customer Service
In charge of product after-sales service and required technical support, so
as to ensure optimization of product effectiveness.
Provide customers with technology and product related information and
basic technical training.
Technology Marketing Promotion and marketing of technology and products.
Business Development Business development, new product applications, and market
development management.
Sales Marketing Sales and client relationship management.
Manufacturing and Sales
Planning
Produce and manufacture semiconductor E-beam equipment.
Improve product modules and spare parts as well as components.
Transfer and improve production technology.
Manufacturing and client demand management.
Quality Control
Establish the quality system.
Establish quality policies and execute quality auditing.
Manage technology and intellectual documents.
~7~
2. Directors and Independent Directors 2.1. Information Regarding Board Members & Independent Directors
Jan 31, 2015; Unit: 1,000 share; %
Position Name Date
Elected Term
Date First
Elected
Shareholding When Elected
Current Shareholding
Spouse and Minor Shareholding
Shareholding under
the title of a 3rd party
Selected Education & Past Positions
Current Positions at Other Companies
Shares % Shares % Shares % Shares %
Chairman Shu, Chin-Yung June 6, 2014
3 years Apr. 30,
2003 387 0.55 375 0.53 0 0 0 0
Master’s Degree of Institute of Electro-Optical Engineering (Science), National Chiao Tung University President of UMC Senior Vice President of TSMC
Director and President of Hermes-Epitek Corp. Director of Hermes Investment, Inc. Chairman of Hermes Testing Systems, Inc. Chairman of Hermes-Epitek (Shanghai) Inc. Director of Hermes-Epitek (Shanghai) Inc. Director of Advanced Ion Beam Technology INC. Director of EPISIL Director of HanShin Corp. Director of EPILEDS Co. Ltd. Director of Advanced System Technology Co., Ltd. Director of Hermes Microvision, Inc.(USA) Director of Hermes Microvision Korea Inc. Director of Hermes Microvision Japan Inc.
Director Jack Y. Jau June 6, 2014
3 years June 21,
2005 1,620 2.28 1,620 2.28 0 0 0 0
Doctoral degree in Electronic and Computer Engineering from University of Wisconsin, USA Executive Vice President Hermes-Epitek Corp. Senior Manager of Research and Development Division at KLA-Tencor Corporation USA Senior Researcher in Kodak Research Laboratories USA Special Assistant of Chairman of Hermes Microvision Inc.
CEO and Vice Chairman of Hermes Microvision Inc. Director of Hermes Microvision Korea Inc.
Director
Hermes-Epitek Corp.
June 6, 2014
3 years June 30,
2011 7,105 10.01 7,105 10.01 0 0 0 0
Director of HanShin Corp. Director of EPISIL Chairman of Hermes Investment, Inc. Director of Hermes-Epitek (Shanghai) Inc.
Director
Representative: Hwang, Ming-Chi
June 6, 2014
3 years June 30,
2011 1,973 2.78 1,973 2.78 1,486 2.09 0 0
Department of Electro-physics, National Chiao Tung University Chairman of Hermes Microvision Inc. President of Tokyo Electron Taiwan Ltd.
Chairman of Hermes-Epitek Corp. Chairman of EPISIL Chairman of Advanced Ion Beam Technology INC. Director of Hermes Investment, Inc. Chairman of Tokyo Electron Taiwan Ltd. Chairman of Pan Wen Yuan Foundation Director of Hermes Microvision Japan Inc. Director of Hermes Microvision Korea Inc. Chairman of Hermes Microvision, Inc.(USA)
Director Chen, Zhong-Wei June 6, 2014
3 years June 6, 2014
0 0 0 0 0 0 1,600 2.25
Department of Electrical Engineering from Tsinghua University Master Degree of Institute of Electron Beam from Shantong University Doctoral Degree in Philosophy from Cambridge University Cavendish Laboratory, England Senior Scientist of KLA-Tencor Corporation Chief Scientist of Cambridge Equipment Corporation, England Research Scientist of Cambridge University, England
President of Hermes Microvision, Inc.(USA) Chairman of Hermes Microvision Co., Ltd. (Beijing)
~8~
Position Name Date
Elected Term
Date First
Elected
Shareholding When Elected
Current Shareholding
Spouse and Minor Shareholding
Shareholding under
the title of a 3rd party
Selected Education & Past Positions
Current Positions at Other Companies
Shares % Shares % Shares % Shares %
Director Yang, Chyan June 6, 2014
3 years June 16,
2009 0 0 0 0 0 0 0 0
Doctoral Degree in Computer Science from Washington University, U.S.A. Professor of Institute of Business and Management of National Chiao Tung University Vice President (Deputy President), College of Management, National Chiao Tung University Associate Professor of Institute of Management Science, National Chiao Tung University Associate Professor in Computer Science at U.S. Naval Research Laboratory and Director of VLSI Laboratory
Professor of Institute of Business and Management of National Chiao Tung University Director of Penpower Technology Ltd. Supervisor of Chia Chang Co., Ltd. Independent Director of BestCom Infotech Corporation Independent Director of Aspeed Technology, Inc.
Independent director
Tu, Huai-Chi June 6, 2014
3 years June 30,
2011 0 0 0 0 0 0 0 0
Department of Economics, College of Law, National Taiwan University
Chairman of Glimmer Inc. Director and CEO of Promate Electronic Co., Ltd. Director of Chun Fung investment Co., Ltd. Chairman of Promote Solutions Corp. Chairman of Fung Shao Yi Investment Co., Ltd. Director of EVGA Corp.
Independent director
Hu, Han-Liang June 6, 2014
3 years June 30,
2011 0 0 0 0 0 0 0 0
Master Degree of Institute of Accounting, National Taiwan Unversity Taiwan Certified Public Accountant
Partner of C.J.S. CPAs & Co., Ltd. Supervisor of Genius, KYE Systems Corp. Director of Scientech Director of Godex International Co. Supervisor of Orient Pharma Co., Ltd. Director of Shamrock Micro Devices Corp. Supervisor of Life Technologies Co.
Independent director
Liang, Kai-Tai June 6, 2014
3 years June 30,
2011 0 0 0 0 0 0 0 0
Department of Electrophysics, National Chiao Tung University Director and President of Infinite Shanghai Communication Terminals Ltd. Director and President of Siemens Shanghai Mobile Communications Co., Ltd. General Manager of Global Mobile Communication Division at Metawave Communications Corp. World Trade (GSM).
President of Masstop Technology Inc.
Independent director
Kin, Lien-Fang June 6, 2014
3 years June 30,
2011 0 0 0 0 0 0 0 0
Department of Nuclear Engineering, National Tsing Hua University Master and Doctoral degree from Nuclear Engineering and Applied Physics, Columbia University Senior VP, Worldwide Sales & Services, TSMC Vice President of Microelectronics Global Business and Services, IBM Vice President of Motorola Computer Business- Asia Pacific
Counselor of Oak Hill Capital Partners Director of MediaTek Inc. Independent Director of eMemory Technology Inc., AzureWave Technologies Inc. and Vanguard International Semiconductor Corp. Vice Dean, College of Technology Management, National Tsing Hua University
~9~
2.2. Major Shareholders of Important Institutional Shareholders
Dec. 31, 2014
Institutional Shareholders Major Shareholders of Important Institutional Shareholders
2.4. Directors and Independent Directors’ Professional Qualifications and Independent Analysis Qualifications Name
Min. of 5-year work experience or having the following Professional Qualification
Independence Qualification (note)
Number of public
companies where the
person also acts as an
independent director
At least a lecturer from a private or public college or university in the discipline of business, law, finance, accounting or other subjects in demand by the Company
Passed the public examination and licensed in a special profession and technology, like that of a judge, public prosecutor, attorney, CPA or others as in demand by the Company
Required experience in business, law, finance, accounting and others as in demand by the Company
1 2 3 4 5 6 7 8 9 10
Shu, Chin-Yung √ √ √ √ √ √ √ None
Jack Y. Jau √ √ √ √ √ √ √ None Hermes-Epitek Corp. Representative: Hwang, Ming-Chi
Note: For those directors and supervisors meeting the following terms two years prior to be elected and during their term in office, a “” is put in the space under the applicable term. 1. Not the Company’s employee, or employee of the Company’s affiliated companies. 2. Those who are not a director or supervisor of the Company or its affiliated companies (however, it is not limited to
the independent director of the Company or its parent company or the subsidiary in which the Company directly or indirectly holds more than 50% of its voting shares).
3. The natural-person stockholder who does not hold more than 1% of the total outstanding stocks in their name or the name of their spouse, their minor children or others, or the shares held in their name or the name of their spouse, their minor children or others do not make them one of the Company’s top ten shareholders.
4. Not the spouse, or the 2nd level kin or the 3rd level lineal relative of the parties mentioned in the previous 3 paragraphs.
5. Neither an employee, a director, nor a supervisor of corporate shareholders directly holding shares more than 5% of the total outstanding stocks; neither nor of the Company’s top five shareholders.
6. Neither a director, supervisor, manager, nor stockholder holds over 5% shares of a company or institution that is financing or doing business with the Corporation.
7. The professional, proprietor of the sole proprietorship, partnership, company or institute, partner, director, supervisor, manager and their spouse who does not provide services or consultation for the Company or its affiliated enterprises in the sectors of business, legal affairs, finance and accounting, etc. However, it is not limited to the compensation committee members prescribed by Article 7 of the Regulations Governing the Appointment and Exercise of Powers by the Compensation Committee of a Company Whose Stock is Listed on the Stock Exchange or Traded over the Counter.
8. Those who do not have the spouse relationship or are not within the 2nd level of kinship with any other directors. 9. Those who are not subject to any of the conditions listed in Article 30 of the Company Act. 10. Those who are not in the circumstance regulated in Article 27 of the Company Act where the government agency,
juristic person or their representative is elected.
~11~
2.5. Compensation paid to Directors
Dec. 31, 2014; Unit: NT$ 1,000; 1,000 shares
Position Name
Compensations paid to Directors % of the total amount A, B, C and D to the net profit after tax Salary (A) Pension (B) Profit Sharing (C) Professional fees (D)
HMI Consolidated
Entities HMI
Consolidated Entities
HMI Consolidated
Entities HMI
Consolidated Entities
HMI Consolidated
Entities
Chairman Shu, Chin-Yung
0 0 0 0 8,000 8,000 283 283 0.25% 0.25%
Vice Chairman Jack Y. Jau
Director Hwang, Ying-Chi
Director Chen, Zhong-Wei
Director Yang, Chyan
Director Hu, Han-Liang
Director Tu, Huai-Chi
Director Liang, Kai-Tai
Director Kin, Lien-Fang
Position Name
Compensations Earned as Employee of HMI or of HMI Affiliates (A+B+C+D+E +F+G) as % of
3. Management Team 3.1. Information Regarding Management Team
Jan 31, 2015; Unit: 1,000 shares; %
Position Name On-board
Date Shareholding
Spouse and Minor Shareholding
Shareholding under the title of a 3rd
party Selected Education &
Past Positions Current Positions at Other Companies
Shares % Shares % Shares %
President and Administrative Center/RD Director
Jack Y. Jau (Note1)
Oct. 15, 2010
1,620 2.28 0 0 0 0
Doctoral degree in Electronic and Computer Engineering from University of Wisconsin, USA Executive vice president of Hermes-Epitek Corp. Senior Manager of Research and Development Division at KLA-Tencor Corporation, USA Senior researcher in Kodak Research Laboratories, USA Special Assistant of President of Hermes Microvision Inc.
CEO and Vice Chairman of Hermes Microvision Inc. Director of Hermes Microvision Korea Inc.
President/ Chief Operation Officer
Pan, Chung-Shih (Note2)
Oct 30, 2014
0 0 0 0 1,320 1.86
Doctoral degree in Mechanical Engineering from University of California, Berkeley, USA Senior R&D Engineer of KLA-Tencor Corporation, USA Senior Engineer of Tencor Intruments, USA Engineer of Dastek Corp, US
Supervisor of Hermes Microvision Co., Ltd. (Beijing) Director of HMI Holdings Inc. Director of HMI INVESMTENT CORP.
Vice President of Research and Development
Lin, Wen-Sheng
Apr. 29, 2013
0 0 0 0 0 0
Department of Electro-Mechanical Engineering, Oriental Institute of Technology Assistant Manager of Hermes-Epitek Corp. Senior Manager of Customer Service at Hermes Microvision, Inc.
None
Vice President of global business center
Su, Yung-Hang Mar. 1, 2013
18 0.03 0 0 0 0
Bachelor’s degree in Electronic & Computer Engineering from National Chiao Tung University Assistant Manager of Hermes-Epitek Corp. Engineer at Acer Inc. Sales Manager of Hermes Microvision Inc.
None
Vice President of Finance Center
Shen, Hsiao-Lien
Mar. 1, 2013
0 0 0 0 0 0
Master’s degree in management of technology from Chung Hua University Audit manager of Brilliance Semiconductor Inc. Audit manager of PwC Taiwan Senior finance manager of Hermes Microvision Inc.
Director of HMI Holdings Inc. Director of Hermes Microvision Co., Ltd. (Beijing) Director of HMI INVESMTENT CORP.
Vice President of Administration
Liang, Wen-Cheng (Note3)
Jun. 1, 2014
0 0 0 0 0 0
Department of Electro-Mechanical Engineering, Oriental Institute of Technology Assistant Manager of Hermes-Epitek Corp. Senior Manager of Customer Service at Hermes Microvision, Inc.
None
Vice President of New Business Development
Hu, Jui-Ching (Note4)
Apr. 29, 2013
0 0 0 0 0 0
EMBA degree from National Chiao Tung University Master’s Degree in Operations Research from Stanford University, USA Vice President of Metrodyne Microsystem Corp. Executive Director of Investment Division at Intel Corp.
Independent Director of Lotes Co., Ltd. Supervisor of Gudeng Precision Industrial Co., Ltd.
Note 1:Resigned on Oct. 30, 2014.
Note 2:On-board on Oct. 30, 2014.
Note 3:On-board on Jun. 1, 2014.
Note 4:Resigned on Jan. 20, 2014
~14~
3.2. Compensation Paid to President and Vice Presidents
Dec. 31, 2014; Unit: NT$ 1,000; 1,000 shares
Position Name
Salary (A) Pension (B) Bonus and
Allowances(C) Employee Profit Sharing (D)
(A+B+C+D) as % of 2014 Net Income
Employee Option Granted Employee
Restricted Stock Compensation Received from Non-consolidat
3.4. Employees’ bonus paid to President and Vice Presidents
Dec. 31, 2014; Unit: NT$ 1,000; 1,000 shares
Position Name Stock
dividend Cash
dividend Total
Total amount as % of 2014 Net Income
President Jack Y. Jau (Note 1)
0 3,074 3,074 0.095
President Pan, Chung-Shih (Note 2)
Vice President Lin, Wen-Sheng
Vice President Su, Yung-Hang
Vice President Shen, Hsiao-Lien
Vice President Liang, Wen-Cheng (Note 3)
Vice President Hu, Jui-Ching (Note 4)
Note 1:Resigned on Oct. 30, 2014.
Note 2:On-board on Oct. 30, 2014.
Note 3:On-board on Jun. 1, 2014.
Note 4:Resigned on Jan. 20, 2014
~16~
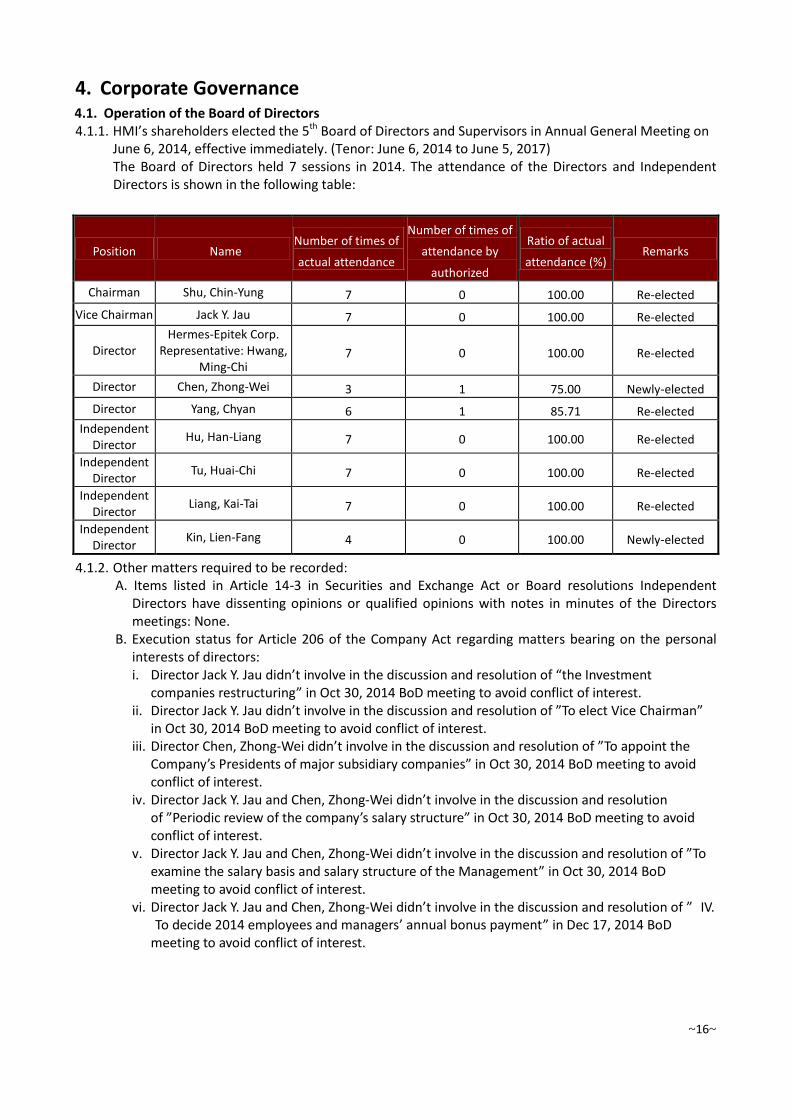
4. Corporate Governance 4.1. Operation of the Board of Directors 4.1.1. HMI’s shareholders elected the 5th Board of Directors and Supervisors in Annual General Meeting on
June 6, 2014, effective immediately. (Tenor: June 6, 2014 to June 5, 2017) The Board of Directors held 7 sessions in 2014. The attendance of the Directors and Independent Directors is shown in the following table:
Position Name Number of times of
actual attendance
Number of times of
attendance by
authorized
Ratio of actual
attendance (%) Remarks
Chairman Shu, Chin-Yung 7 0 100.00 Re-elected
Vice Chairman Jack Y. Jau 7 0 100.00 Re-elected
Director Hermes-Epitek Corp.
Representative: Hwang, Ming-Chi
7 0 100.00 Re-elected
Director Chen, Zhong-Wei 3 1 75.00 Newly-elected
Director Yang, Chyan 6 1 85.71 Re-elected
Independent Director
Hu, Han-Liang 7 0 100.00 Re-elected
Independent Director
Tu, Huai-Chi 7 0 100.00 Re-elected
Independent Director
Liang, Kai-Tai 7 0 100.00 Re-elected
Independent Director
Kin, Lien-Fang 4 0 100.00 Newly-elected
4.1.2. Other matters required to be recorded: A. Items listed in Article 14-3 in Securities and Exchange Act or Board resolutions Independent
Directors have dissenting opinions or qualified opinions with notes in minutes of the Directors meetings: None.
B. Execution status for Article 206 of the Company Act regarding matters bearing on the personal interests of directors: i. Director Jack Y. Jau didn’t involve in the discussion and resolution of “the Investment
companies restructuring” in Oct 30, 2014 BoD meeting to avoid conflict of interest. ii. Director Jack Y. Jau didn’t involve in the discussion and resolution of ”To elect Vice Chairman”
in Oct 30, 2014 BoD meeting to avoid conflict of interest. iii. Director Chen, Zhong-Wei didn’t involve in the discussion and resolution of ”To appoint the
Company’s Presidents of major subsidiary companies” in Oct 30, 2014 BoD meeting to avoid conflict of interest.
iv. Director Jack Y. Jau and Chen, Zhong-Wei didn’t involve in the discussion and resolution of ”Periodic review of the company’s salary structure” in Oct 30, 2014 BoD meeting to avoid conflict of interest.
v. Director Jack Y. Jau and Chen, Zhong-Wei didn’t involve in the discussion and resolution of ”To examine the salary basis and salary structure of the Management” in Oct 30, 2014 BoD meeting to avoid conflict of interest.
vi. Director Jack Y. Jau and Chen, Zhong-Wei didn’t involve in the discussion and resolution of ” IV. To decide 2014 employees and managers’ annual bonus payment” in Dec 17, 2014 BoD meeting to avoid conflict of interest.
~17~
C. Goals to enhance the Board’s operations: a. Establishment of the audit committee and compensation committee i. HMI set up its Audit Committee on Jun. 30, 2011 to exercise its powers prescribed by the
Securities and Exchange Act, Company Act and other statutory laws and regulations. ii. HMI set up its Compensation Committee on Aug. 23, 2011 to assist the Board of Directors in
periodically evaluating and setting up director and manager’s compensation standards, and periodically evaluate director and manager’s performance, and the compensation policy, system, standard and structure.
b. Enhancement of information transparency The company’s financial information and material resolutions have been put on the market observation post system as regulated, while the Company’s business information has also been disclosed on the Company’s website, so the public investors can all obtain the information in a timely manner.
4.2. Corporate Governance Implementation as Required by the Taiwan Financial Supervisory
Commission
Item Implementation Status Reason for
Non-implementation
1. Shareholding Structure & Shareholders’ Rights (1)Method of handling shareholder suggestions or
complaints
(2)The Company’s possession of a list of major
shareholders and a list of ultimate owners of these major shareholders
(3)Risk management mechanism and the “firewall”
between the Company and its affiliates
HMI has designated relevant departments, such as Investor Relations, Legal, etc. to handle shareholder suggestions or disputes. HMI tracks the shareholdings of Directors, Independent Directors, key managers, and shareholders holding more than 10% of the outstanding HMI shares. When designing the structure of its subsidiaries, HMI has implemented a firewall mechanism. HMI and its subsidiaries have established appropriate internal control systems.
None
2. Organization & Responsibilities of the Board: (1)Independent Directors
(2)Regular evaluation of external auditors’ independence
Hu, Han-Liang; Tu, Huai-Chi; Liang, Kai-Tai and Kin, Lien-Fang are the Independent Directors of HMI. The approval of the Board is required for employment or replacement of independent auditors. The board conduct evaluations of auditor independence regularly.
None
3. Communication Channels with Stakeholders HMI designates relevant departments to communicate with stakeholders on a case-by-case basis. HMI also lists contact information of the spokesperson and relevant departments on HMI’s website.
None
4. Information Disclosure: (1)Establishment of a corporate website to disclose
information regarding the Company’s financials, business, and corporate governance status
(2)Other information disclosure (e.g. maintaining an
Englishlanguage website, appointing responsible persons to handle information collection and disclosure, appointing spokesperson policy, video recordings of investor conferences)
1. HMI discloses information through its website: http://www.hermes-microvision.com/ 2. HMI has designated appropriate persons to handle information collection and disclosure. 3. HMI has established a spokesperson policy. Spokesperson: Leo Shen; Deputy Spokesperson: David Liang. 4. HMI provides investor conferences webcasts and presentation materials on its website 5. HMI discloses all information to shareholders and stakeholders through HMI’s website and the MOPS.
None
5. Operations of the Company’s Nomination Committee, Remuneration Committee, or other committees of the Board of Directors
HMI’s Board of Directors has established an Audit Committee and a Compensation Committee. Please refer to the "Corporate Governance" section in this annual report.
None
6. If the Company Has Established Corporate Governance Policies based on TSE Corporate Governance Best Practice Principles, Please Describe Any Discrepancies between the Policies and Their Implementation. HMI has already set up its corporate governance best-practice principles, and complied with the spirit of the principles in its practical corporate governance operation.
~18~
7. Other important information to Facilitate Better Understanding of the Company’s Corporate Governance Practices: (1) Employee’s rights and interests: HMI has established its employee welfare committee, carried out its pension system so as to protect the rights
and interests of its employees, and held a labor coordination committee meeting every quarter to coordinate the labor relations. (2) Employee care: HMI has planned the employee group insurance, provided its employees with regular physical examinations, and offered a
variety of employee educational training. It has placed a high premium on employee’s physical and mental health as well as learning development.
(3) Investor relations and the rights of interested parties: As regulated by statutory laws and regulations, HMI has honestly and publicly released its corporate information, so as to protect investor and interested party’s rights and interests and do its fair share of corporate responsibility for shareholders.
(4) Supplier relations: HMI has kept a good relationship with its suppliers. (5) Status of Director and Independent Director’s advanced studies: HMI’s Directors and Independent Directors all have professional background
and practical operating and management experience in the industry, and they have taken six hours of corporate governance related courses every year.
(6) Execution of the risk management policy, risk measurement standard: HMI’s internal control system and required management regulations have all been adopted by the Board of Directors or Shareholders’ Meeting.
(7) Execution of the customer policy: HMI strictly abides by the agreements it has signed with customers and related regulations, ensures customer’s rights and interests, and provides quality services.
(8)The liability insurance purchased by the Company for its Directors and Independent Directors: As prescribed by its Articles of Incorporation, HMI shall purchase liability insurance for its directors which shall be literally executed. Also, HMI has reviewed the content of the insurance policy every year, so as to reduce the risks assumed by directors and the Company and build a well-rounded corporate governance mechanism.
8. If the Company Has Performed a Corporate Governance Self-Assessment report or Has Authorized Any Other Professional Organization to Conduct Such an Evaluation, the Evaluation Results, Major Deficiencies or Suggestions, and Improvements are Stated as Follows:
HMI’s Corporate Governance System has been certified by CG6009 in the 3rd quarter of 2013, and will be reported in 2015 AGM.
4.3. Continued Education/Training of Directors in 2014 In order to fulfill the corporate governance system, HMI has taken initiative to pass its governance related information on advanced study opportunities to our Directors. HMI’s 4th and 5th term of directors all complied with the “Directions for the Implementation of Continuing Education for Directors and Supervisors of TWSE Listed and GTSM Listed Companies”.
Position Name Host by Training Title Hours of
study
Chairman Shu, Chin-Yung
Taiwan Corporate Governance Association
How to implement corporate governance system and further enhance corporate sustainability.
3
Taiwan Securities and Future Institute Practice of Compensation Committee 3
Vice Chairman Jack Y. Jau
Taiwan Corporate Governance Association
How to implement corporate governance system and further enhance corporate sustainability.
3
Taiwan Securities and Future Institute Practice of Compensation Committee 3
Representative of juristic person
Director
Hwang, Ming-Chi
Taiwan Corporate Governance Association
How to implement corporate governance system and further enhance corporate sustainability.
3
Taiwan Securities and Future Institute Practice of Compensation Committee 3
Director Chen,
Zhong-Wei Taiwan Securities and Future Institute Practice of Compensation Committee 3
Director Yang, Chyan
Taiwan Corporate Governance Association
How to implement corporate governance system and further enhance corporate sustainability.
3
Taiwan Securities and Future Institute Practice of Compensation Committee 3
How to implement corporate governance system and further enhance corporate sustainability.
3
Taiwan Securities and Future Institute Practice of Compensation Committee 3
~19~
4.4. Continued Education/Training of Management in 2014
Position Name Host by Training Title Hours of
study
President Pan, Chung-Shih
Taiwan Corporate Governance Association
How to implement corporate governance system and further enhance corporate sustainability.
3
Taiwan Securities and Future Institute Practice of Compensation Committee 3
Vice President Shen, Hsiao-Lien
Taiwan Corporate Governance Association
How to implement corporate governance system and further enhance corporate sustainability.
3
Accounting Research and Development Foundation
Advanced studies for Accounting Managers of a public company
12
Taiwan Securities and Future Institute Practice of Compensation Committee 3
Vice President Lin, Wen-Sheng
Taiwan Corporate Governance Association
How to implement corporate governance system and further enhance corporate sustainability.
3
Taiwan Securities and Future Institute Practice of Compensation Committee 3
Vice President Liang,
Wen-Cheng Taiwan Securities and Future Institute Practice of Compensation Committee 3
Vice President Su, Yung-Hang
Taiwan Corporate Governance Association
How to implement corporate governance system and further enhance corporate sustainability.
3
Taiwan Securities and Future Institute Practice of Compensation Committee 3
4.5. Operations of HMI’s Compensation Committee 4.5.1. Responsibilities of HMI’s Compensation Committee
The compensation committee aims at establishing and regularly reviewing the performance reviewmechanism for directors, supervisors and managers. Establish and set up the policy, system, standard and structure of compensation and regularly review the compensation of Directors, Independent Directors and Management.
4.5.2. Composition of HMI’s Compensation Committee Criteria
Title Name
Meet the Following Professional Qualification Requirements, Together with at Least Five Years Work Experience
Criteria (Note)
Number of other public
companies concurrently serving as an independent
director
An instructor or higher position in a department of commerce, law, finance, accounting, or other academic department related to the business needs of the company in a public or private junior college, college or university
A judge, public prosecutor, attorney, certified public accountant, or other professional or technical specialists who has passed a national examination and been awarded a certificate in a profession necessary for the business of the company
Have work experience in the area of commerce, law, finance, or accounting, or otherwise necessary for the business of the company
1 2 3 4 5 6 7 8
Hu, Han-Liang √ √ √ √ √ √ √ √ √ √ 0
Liang, Kai-Tai √ √ √ √ √ √ √ √ √ 0
Tu, Huai-Chi √ √ √ √ √ √ √ √ √ 0
Kin, Lien-Fang √ √ √ √ √ √ √ √ √ √ 3
Note : Directors or Supervisors with a "" sign meet the following criteria: 1. Not an employee of the company or any of its affiliates; 2. Not a director or supervisor of the company or any of its affiliates. The same does not apply, however, in
cases where the person is an independent director of the company, or any subsidiary in which the company holds, directly or indirectly, more than 50% of the voting shares;
3. Not a natural-person shareholder who holds shares, together with those held by the person’s spouse, minor children, or held by the person under others’ names, in an aggregate amount of 1% or more of the total number of outstanding shares of the company or ranking in the top 10 in holdings;
4. Not a spouse, relative within the second degree of kinship, or direct relative within the fifth degree of kinship, of any of the persons in the preceding three subparagraphs;
5. Not a director, supervisor, or employee of a corporate shareholder that directly holds 5% or more of the total number of outstanding shares of the company or that holds shares ranking in the top five in holdings;
6. Not a director, supervisor, or shareholder holding 5% or more of the shares, of a specified company or institution that has a financial or business relationship with the company;
~20~
7. Not a professional individual who, or an owner, partner, director, supervisor, or officer of a sole proprietorship, partnership, company, or institution that, provides commercial, legal, financial, accounting services or consultations to the company or to any affiliate of the company, or a spouse thereof; and
8. Not been a person of any conditions defined in Article 30 of the Company Act.
4.5.3. Operation status of the Compensation Committee The tenure of HMI’s 2
nd term compensation committee is from June 6, 2014 to June 5, 2017. The convener, Mr.
Hu. Han-Liang held 7(A) sessions in 2014 and the attendance of members is shown in the following table:
Position Name Number of times of
actual attendance (B) Number of times of
authorized attendance
Ratio of actual attendance (%)
(B/A) Remarks
Convenor Hu, Han-Liang 7 0 100% Re-Elected
Member Tu, Huai-Chi 7 0 100% Re-Elected
Member Liang, Kai-Tai 7 0 100% Re-Elected
Member Kin, Lien-Fang 4 0 100% Newly-Elected
4.5.4. Other Required Notes for Remuneration Committee:
A. In cases the Board doesn’t adopt or revise remuneration committee’s proposals, the Company shall list date/number of the Board meeting, agenda, the Board’s resolution and the Company’s response to remuneration committee’s proposal: None.
B. In cases remuneration committee members have dissenting opinions or qualified opinions against
the resolution and recorded with notes in paper, the Company shall list date/number of the remuneration committee meeting and agenda: None.
4.6. Operation of Audit Committee
The tenure of HMI’s 2nd
term Audit Committee is from June 6, 2014 to June 5, 2017. The convener, Mr. Hu. Han-Liang held 8(A) sessions in 2014 and the attendance of members is shown in the following table:
Position Name Number of times of
actual attendance (B) Number of times of
authorized attendance
Ratio of actual attendance (%)
(B/A) Remarks
Convenor Hu, Han-Liang 8 0 100% Re-Elected
Member Tu, Huai-Chi 8 0 100% Re-Elected
Member Liang, Kai-Tai 8 0 100% Re-Elected
Member Kin, Lien-Fang 4 0 100% Newly-Elected
4.6.1. Other Required Notes for Remuneration Committee:
A. For the matters listed in Article 14-5 of the Securities and Exchange Act and the resolutions which
were not adopted by the audit committee but approved by more than two-thirds of the entire body of directors, the board meeting date, term, bill content, audit committee’s resolution results, and the Company’s handling of the audit committee’s opinions: None.
B. For execution of independent director’s recusal for conflict-of-interest bills, the independent director’s name, bill content, the reason for entering recusal and resolution participation status shall be described: None.
C. Status of the communication of independent directors with the internal audit supervisor and CPAs (e.g. the matters, methods and results of the communication for the Company’s financial and business status): 1. HMI’s internal audit supervisor has periodically reported their audit status in audit committee
meetings. In case of any special situation, they shall promptly report to the audit committee. As of the date of printing of the annual report, no aforesaid special situation had occurred. HMI’s
~21~
audit committee has good communication with its internal audit supervisor. 2. The Company’s CPAs have periodically attended the Company’s audit committee meetings as a
guest. In case of any special situation, they shall promptly report to the audit committee. As of the date of printing of the annual report, no aforesaid special situation had occurred. The Company’s audit committee has good communication with its CPAs.
4.7. Status of Fulfilling Corporate Social Responsibility
Item Implementation Status Reason for
Non-implementation
1. Implementation of Corporate Governance (1) Corporate social responsibility policy
and performance evaluation (2) Dedicated organization for the
promotion and execution of corporate social responsibility
(3) Regular training and promotion of
corporate ethics among employees and the Board of Directors, and integration with the employee performance appraisal system
HMI has already set up its corporate social responsibility best practice principles. HMI’s Management reviews the social responsibility policy and evaluates the performance regularly. HMI’s administration department is in charge of the promotion and execution of corporate social responsibility, and reports to the Board periodically. The training and promotion of corporate ethics is commenced regularly. Relevent Corporate Social Responsibility details is disclosed on HMI’s website at http://www.hermes-microvision.com/CSR/
None
2. Sustainable Environment Development (1) Commitment to improving resources
utilization and the use of renewable materials
(2) Environmental management system
designed to industry characteristics. (3) Dedicated environmental management
unit or personnel (4) Company strategy for climate change,
energy conservation and greenhouse gas reduction
HMI has devoted its efforts to enhancing utilization efficiency of various resources, so as to reduce the quantity of raw materials and waste and lower the impact on the environment. HMI specializes in semiconductor equipment manufacturing so the pollution or negative impact on the environment is minimal. We are dedicated in continued improvement of environmental mangament throught our P-D-C-A methodology while manage production costs. Besides providing recycle bins for classification of resources, we also entrusted qualified firms for waste recycling. The personnel of the Company’s administrative management division are responsible for environmental management affairs. They designate dedicated employees to clean the environment and keep tidiness of the environment every day. HMI controls its air-conditioning temperatures in summer, in an attempt to effectively use energy and head for the goal of energy efficiency and carbon reduction.
None
3. Promotion of social welfare (1) Compliance with labor regulations,
protection of employee rights, and appropriate management measures and procedures
(2) Safety and health in working
environment
HMI abides by the related labor regulations, respects internationally recognized basic labor human right principles, and protects employees’ legal rights and interests. For promotion of the HMI’s policies and understanding of employees’ opinions, HMI has taken an open attitude for mutual communication. HMI has a health center, which arranges regular physical examinations for its employees every year. Employees shall attend environment safety and health related courses according to their tasks. In addition, HMI also has an emergency action team, which has routinely practiced every year.
None
~22~
Item Implementation Status Reason for
Non-implementation
(3) Regular employee internal communication channels establishment to ensure efficient communication for major company events
(4) Disclosure of consumer rights policy,
and official channel for consumer complaints
(5) Collaboration with suppliers (6) Participation in community
development and charities through commercial activities, donations or volunteers
HMI has set up an employee communication mechanism. It has periodically held labor meetings, in which meeting minutes has been made for every meeting, while it will notify its employees via e-mail of any business change which may cause material influence. HMI has set a dedicated division specifically for customer services, which can promptly handle customer’s problems and has dedicated personnel to take care of customer complaints. HMI’s procurement policy focuses on purchase of an appropriate quantity of raw materials at a proper price in due time, so production operation can be smoothly carried out. When purchasing, HMI shall follow the regulations to give priority to the qualified suppliers, and the procedure of price enquiry, comparison and negotiation shall be implemented in order to ensure rationality of the purchase price. Furthermore, a fluent communication channel between HMI and its suppliers shall be maintained, so, both sides can protect their deserved and reasonable rights and interests under reciprocation. HMI has actively participated in charity activities. It has set up “donation boxes” and periodically held charity activities to help underprivileged children. In addition, HMI also donated “E-beam scanning microscope equipment eScan310” to National Chiao Tung University for them to develop advanced semiconductor process, materials and related engineering technologies, in the hope of reinforcing the development of Taiwan’s high-tech industry. HMI also aggressively participated in the “high-tech industry international financial management credit program” sponsored by the Financial Supervisory Commission of Executive Yuan, which provided participating graduate students with visit activities, e.g. offering field visits and professional intern courses at Chiao Tung University, Changhua University of Education, Kaohsiung First University of Science and Technology and Soochow University. It is hoped that, by combining practice and theory, the Company will cultivate prominent professional talents required by the industry.
4. Enhancement of Information Disclosure (1) Disclosure of corporate social
responsibility related information with significance and reliability.
(2) Published corporate social responsibility report and disclosure of implementation of corporate social responsibility
HMI discloses social responsibility related information in the annual report. HMI has also published its 2014 Corporate Social Responsibility Report. The report is available for download at http://www.hermes-microvision.com/CSR/report.php
None
5. If the Company has set up its corporate social responsibility best practice principles in accordance with the “Corporate Social Responsibility Best Practice Principles for TWSE/GTSM-List Company”, please describe the difference between the operation and the instituted principles: HMI has already set up its corporate social responsibility best practice principles and is committed to carry out its corporate
social responsibility.
6. Other important information which may help understand the operation of corporate social responsibility (e.g. the systems and measures taken by the Company for its environmental protection, community participation, society contribution, social services, social welfare programs, protection of consumer rights and interests, human rights and safety as well as health and implementation of other activities related to social responsibility, and the fulfillment status):
In response to environmental protection, HMI has requested its employees to try to use e-mail documents instead of paper documents, reuse unneeded documents by making the best use of blank sides. In addition, it has long fulfilled its social responsibility and worked on social welfare programs, while making contribution to the public in due time.
7. Other information regarding products or “Corporate Social Responsibility Report” which are verified by certification bodies: None
~23~
4.8. Status of fulfilling operational integrity:
Item Implementation Status Reason for
Non-implementation
1. Set up operational integrity policy and programs
(1) Operational integrity policy (2) Plans and procedures to prevent
anti-integrity behaviors (3) Measures to avoid operational activities
with higher anti-integrity risks such as bribery , illegal political donations
HM has the following corporate governance guidelines and regulations in place: (1) Rules and Procedures of Shareholders’ Meeting (2) Rules and Procedures of Board of Directors’ Meeting (3) Rules for Election of Directors (4) Procedures Governing the Acquisition or Disposition of Assets (5) Procedures of Endorsement and Guarantee (6) Procedures of Outward Loans to Others (7) Corporate Governance Best-Practice Principles (8) Audit Committee Charter Available on the HMI’s website http://www.hermes-microvision.com/ Integrity is highly-valued and is the major principle for HMI’s Board of Directors and management. The Board of Directors and management will not vote in cases where they have a conflict of interest.
None
2. Fulfill operational integrity (1) The company shall prevent doing
business with whomever has unethical records and include business conduct and ethics related clauses in the business contracts.
(2) The company sets up dedicated unit in
charge of promotion and execution of the company’s corporate conduct and ethics. The Board of Directors supervises such execution and compliance of the policies.
(3) The company establishes policies to
prevent conflicts of interest and provides appropriate communication and complaint channels.
(4) The company establishes effective
accounting and internal control systems for the implementation of policies, and the internal auditors audit such execution and compliance.
In their employment period and after their departing from HMI, HMI’s employees shall sign the “employment contract” and “ex-service personnel non-disclosure confirmation statement” respectively, abide by the “regulations governing customer business information protection and management” and commit their liabilities and obligations for protection of trade secrets and business information, so as to carry out integrity operating. HMI’s personnel in its administrative management division are responsible for promoting corporate integrity operating related issues. HMI’s internal audit division also reports the status of promotion and execution of HMI’s corporate conduct and ethics to the Board of Directors periodically. In order to enhance operation efficiency and effects and reinforce interactions among the HMI’s employees, investors and other interested parties, in addition to adding a shareholder inbox to HMI’s website, the HMI has also set up a “communication” area on its internal website to offer a proper channel for opinion expression. In order to ensure its operating effects and efficiency, reliability of its financial reports and compliance with related laws and regulations, HMI has set up its accounting system and internal control system, so as to carry out its integrity operating spirit.
None
3. Channels to report anti-integrity behaviors and reprimand rules.
HMI has set up its “employee work rules”, with which, the employees are requested to follow the integrity principles in their business execution, whereas the award and punishment system has also been included in the rules to discipline employee’s violation of integrity operating.
None
~24~
4. Enhancement of information disclosure (1) To set up a corporate website that
publishesinformation relating to company’s corporate conduct and ethics.
(2) Other information disclosure channels (e.g. maintaining an English website, designating personnel to handle information collection and disclosure)
HMI’s website discloses operational integrity matters under the corporate governance section. HMI’s website also discloses relevancy and reliability of operational integrity in this annual report.
None
5. If the Company hasn’t established internal policy based on the “Ethical Corporate Management Best Practice Principles for TWSE/GTSM-Listed Companies”, please disclose the discrepancy between its operation and the “Ethical Corporate Management Best Practice Principles for TWSE/GTSM-Listed Companies”: HMI has already set up its integrity operating principles and has continued to aggressively abide by the principles.
6. Other important information to facilitate better understanding of the company’s corporate conduct and ethics compliance practices (e.g., promote and demonstrate the company’s commitment to ethical standard and provide training to its business partners; review the company’s corporate conduct and ethics policy). HMI has set up the “management operation procedures for handling material information and preventing insider trading” as the reference for handling its material information processing and disclosure mechanisms so as to avoid improper information leakage, ensure consistency and accuracy of the information externally released, and reinforce prevention of insider trading. HMI’s internal information dedicated unit will keep inspecting the operation procedure to make sure its compliance with laws and regulations and the demand for practical management. When instituting the procedure or conducting ensuing revisions, HMI will notify all of its employees by e-mail, and place the details on HMI’s internal website for managers and employees to review at any time. In addition, when giving new entrants orientation training, HMI will provide the courses regarding handling of material information and prevention of insider trading for promoting the issue. Furthermore, HMI will also non-periodically offer the related information to HMI internal personnel.
4.9. Corporate Governance Guidelines and Regulations
HMI has already set up its internal control system, internal auditing system and a variety of management regulations, for which the audit personnel and external professionals (such as the CPA) will non-periodically examine the execution status. In addition, a corporate website has also been set up for the public to better understand the Company. At the same time, HMI’s material financial and business information has all been disclosed on the public information website by law in a timely manner for the general investors to review. Furthermore, HMI also discloses the status of its execution of social responsibility in its annual report and its corporate social responsibility report.
~25~
4.10. Status of the Internal Control System Implementation 4.10.1. Declaration of Internal Control
Hermes Microvision, Inc. Statement of Internal Control System
Date: Mar. 4th
, 2015
Based on the results of self-examination, I would like to state the following regarding the Internal Control System of the Company for the year 2014:
1. The Company ascertains that the establishment, implementation and maintenance of the internal control system is the duty and responsibility of the Company's board of directors and managers and the Company has already established such a system. Its aim is to provide a reasonable assurance that the effectiveness and efficiency of business operations (including profitability, performance and security of assets), reliability of the financial reports, and compliance with the various regulatory requirements, and other targets were accomplished.
2. Any internal control system has its inherent limitations, no matter how well it was designed. An effective internal control system can only provide a reasonable assurance that the above mentioned three targets were accomplished and due to changes in environments and circumstances, the effectiveness of the internal control system may change as well. Provided that the Company's internal control system has a self-monitoring mechanism, and when a deficiency is identified, the Company immediately takes a corrective action.
3. Based on the items determining the effectiveness of the internal control system under the provisions of the "Regulations Governing Establishment of Internal Control Systems by Public Companies" (hereinafter called "Guidelines"), the Company determines whether the design and implementation of the internal control system are effective or not. The items determining the effectiveness of the internal control system adopted by the above mentioned "Guidelines" were based on the process of the management control, and divide the internal control system into five components: 1. Control environment, 2. Risk assessment, 3. Control operations, 4. Information and communication, and 5. Supervision. Each component contains several items. For the aforementioned items, please refer to the provisions of the "Guidelines".
4. The Company has already adopted the above mentioned items that determine the effectiveness of the internal control system and for it to examine the effectiveness of the Company's design and implementation of the internal control system.
5. Based on the findings of the preceding paragraph, the Company believes that, as of Dec. 31st
, 2014, the internal control system (including the supervision and management of the subsidiaries), including the degree of attainment of its operational effectiveness and efficiency goals, the reliability of the financial reports and related regulatory compliance related to the design and implementation of the internal control system, was effective and it can reasonably ensures the achievement of the above mentioned objectives.
6. This statement will become an important part of the Company's annual report and prospectus and it will be disclosed to the public. Should there be any false information, omissions or other illegalities in the above public disclosure, it will involve legal liabilities as cited in Article 20, Article 32, Article 171 and Article 174 of the Securities Exchange Act.
7. This statement was approved by the Board of Directors of this Company on Mar. 4th, 2015. Of the 9 Directors present, there were no dissenting votes and the contents of this statement was approved by all present and we are hereby making this declaration.
Hermes Microvision, Inc.
Chairman: Shu, Chin-Yung
President: Chung-Shih Pan
~26~
4.10.2. Disclose the review report of independent auditors if they are retained for reviewing the internal control system: None.
4.11. Reprimands on the Company and its staff
Reprimand on the Company and its Staff in Violation of Laws, or Reprimand on its Employees in Violation of Internal Control System and Other Internal Regulations, Major Shortcomings and Status of Correction: None.
4.12. Major resolutions of Shareholders’ Meeting and Board Meetings 4.12.1. Major Resolutions of Shareholders’ Meeting
Meeting date Major resolutions Implementation Status
June 6, 2014 Acknowledgements: (1) Adoption of the 2013 Business Report and Financial Statements (2) Adoption of the proposal for distribution of 2013 Profits
Resolutions: (1) Revision of the company’s “Article of Incorporation.” (2) Revision of the company’s “Procedures Governing Asset
Acquisition and Disposal.” (3) Election of nine Directors (including four independent directors) (4) Release of the prohibition on Directors from participation in
competitive business
All of the resolutions of the Shareholders’ Meeting had been fully implemented in accordance with the resolutions.
4.12.2 Major resolutions adopted by Board Meetings:
Meeting date Major resolutions
Jan. 10, 2014 1. 2014 budget and business plan. 2. Recommendations for release of employees and managers’ 2013 year-end bonuses. 3. Appointment of the spokesperson and deputy spokesperson. 4. Application to the Hsinchu Science Park Branch of Shin Kong Bank for extension of short-term
credit facilities. 5. Application to the Hsinchu Science Park Branch of Taiwan Cooperative Bank for extension of
short-term credit facilities
Feb. 5, 2014 1. The Company’s 2013 business report and financial statements. 2. The Company’s 2013 earnings distribution. 3. Amounts of the allocation for director compensation and employee bonus. 4. Revision of the Company’s “Procedures Governing Asset Acquisition and Disposal”. 5. Revision of the Company’s “Articles of Incorporation”. 6. Revision of the Company’s “Compensation committee charter”. 7. To elect nine Directors (including four independent directors). 8. Nomination and review of independent director candidates. 9. To Release the prohibition on Directors from participation in competitive busines. 10. Holding of the Company’s 2014 regular shareholders’ meeting and handling of the issues related
to the proposals from the shareholders holding more than 1% of the Company’s shares. 11. Internal control system statement
Apr 18, 2014
1. The appointment of Chief Operating Officer. 2. Application to the Hsinchu Branch of E.Sun Bank for short-term credit facilities and outward
documentary bills.
~27~
June 6, 2014
1. The election of the Chairman of the Company’s 5th Board of Directors.
2. Modification of the plan to retain key talent.
3. To discuss the compensation structure of the newly elected management team.
4. To designate the member of Compensation Committee.
5. Application to the Dongmen Branch of First Bank for short-term composite credit facilities.
6. Application to the Dongqiao Branch of Tai Hsin Bank for short-term composite credit facilities.
7. Application to the Hsinchu Science Park Zhucun Branch of Mega Bank for short-term composite credit facilities.
8. Application to the Hsinchu Branch of Chang Hwa Bank for short-term composite credit facilities.
9. Application to the Hsinchu Branch of Chinatrust Bank for short-term composite credit facilities.
July 29, 2014 1. Modification of the plan to retain key talent.
2. Discussion of Director compensation.
3. Recommendation for 2014 managers’ salary raise and bonus release.
4. Establishment of “The procedures performance evaluation of the Board of Directors”.
5. Establishment of” The procedures of performance evaluation of Independent Auditors”.
6. Application to six branches of Bank of Taiwan for short-term composite credit facilities.
7. Application to the Hsinchu Branch of E.Sun Bank for short-term credit facilities and outward documentary bills.
Oct. 30, 2014
1. Incorporation of a subsidiary of a subsidiary company in Samoa.
2. Investment companies restructuring.
3. To elect Vice Chairman.
4. To appoint the Company’s President.
5. To appoint the Company’s Presidents of major subsidiary companies.
6. Periodic review of the company’s salary structure.
7. To examine the salary basis and salary structure of the Management.
8. To establish “Corporate Social Responsibility Policies.”
9. To establish “Procedure of Verification and Disclosure of Occasional Material Information (including natural disaster)”.
10. The Company planned to start its business relationship with Citibank and apply to it for composite credit facilities.
11. Application to the Hsinchu Science Park Branch of Shin Kong Bank for short-term credit facilities.
12. Application to the Hsinchu Science Park Branch of Taiwan Cooperative Bank for or short-term credit facilities.
Dec. 17, 2014 1. 2015 budget and business plan.
2. The purchase of real estate and the increase of capital investment in Hermes-Microvision, Inc., a subsidiary of HMI.
3. To decide 2014 employees and managers’ annual bonus payment.
4. Institution of the Company’s 2015 audit plan.
5. To abandon and reestablish 12 internal control procedures including “Internal Control System Principles”.
6. To revise “Rules Governing Authorization and Deputy Systems” of the Company.
7. To revise “Procedures Governing Asset Acquisition and Disposal” of the Company.
8. To revise “Procedures of Authorization and Deputy Systems” of the Company.
9. To revise “Procedures Governing Subsidiaries Supervision and Management” of the Company.
10. To revise “Regulations Governing the Preparation of Financial Reports” of the Company.
11. To establish “Regulations Governing Personal Information Protection” of the Company.
4.13. Major Issues of Record or Written Statements Made by Any Director Dissenting to Important
Resolutions Passed by the Board of Directors: None.
~28~
4.14. Summary of resignation and dismissal status of financial report related personnel (including the chairman, president, accounting heads, financial heads, internal audit heads and R&D heads, etc.) in the latest year and as of the date of printing of the annual report
Position Name On-board Date Discharge Date Reason of Resignation or Discharge
President Jack Y. Jau Oct. 15, 2010 Oct. 30, 2014
To fulfill the increasing demand for HMI’s high resolution EBI tools along with semiconductor geometry migration, HMI is fully dedicated to developing EBI applications and diversifying our product offering. The former President Mr. Jau thus will dedicate the majority of his time in R&D. The discharge is approved by the Board of Directors on Oct. 30, 2014.
4.15. Certification details of employees whose jobs are related to the release of the Company’s financial
information Out of the personnel in the HMI’s financial division, one of them is a certificated public accountant (CPA) of the Republic of China, and one is an AICPA.
5. Information Regarding HMI’s Independent Auditors
5.1. Auditor Information The Name of the CPA firm The Name of the CPA Audit Period Remarks
5.2.1. Those that have paid more than 25% of their total audit fee to the CPA or the firm of the CPA or those
whose affiliated enterprises’ non-audit fee is more than 25% of their total audit fee shall disclose the amounts of their audit fee and non-audit fee and the content of their non-audit services: None
5.2.2. Those that have replaced their accounting firm and had less amount of their audit fee in the year after the replacement compared to the year prior to the replacement shall disclose the amounts of their audit fee incurred in the year prior to replacement and the year after replacement, and the reason for the decrease: None
5.2.3. Those whose audit fee reduced by more than 15% from the previous year shall disclose the amount and ratio of the decrease and the reason for it: 2013 audit fee was NT$ 10,480 higher than 2014 audit fee due to issuance of Global Depositary Shares in November 2013.
5.2. Replacement of independent auditors in the last two years and thereafter Due to accounting firm’s job rotation in accordance to relevant regulations, the Board approved to
replace the certified public accountants on Nov 1st, 2013. 5.3. The Company’s Chairman, President or managers in charge of finance or accounting has been under
current audit firm or its affiliates’ employment in 2014: None.
-29-
6. Net Changes in Shareholding
Net change in shareholding and net change in shares pledged by Directors, Independent Directors, Managent and Shareholders with 10% shareholding or more
Unit: shares
Position Name 2014 Jan. 1 to Jan 31, 2015
Net Change in Shareholding
Net Change in Shares Pledged
Net Change in Shareholding
Net Change in Shares Pledged
Chairman Shu, Chin-Yung (27,000) - (15,000) -
Vice Chairman Jack Y. Jau (Note 1) - - - -
Director Hermes-Epitek Corp.
- - - -
Representative of Director
Hwang, Ming-Chi - - - -
Director Chen, Zhong-Wei - - - -
Director Yang, Chyan - - - -
Independent Director Tu, Huai-Chi - - - -
Independent Director Hu, Han-Liang - - - -
Independent Director Liang, Kai-Tai - - - -
Independent Director Kin, Lien-Fang - - - -
President/ Chief Operation Officer
Pan, Chung-Shih (Note2)
- - - -
Vice President of Research and Development
Lin, Wen-Sheng - - - -
Vice President of global business center
Su, Yung-Hang (2,000) - - -
Vice President of Finance Center
Shen, Hsiao-Lien - - - -
Vice President of Administration
Liang, Wen-Cheng (Note3)
- - - -
Vice President of New Business Development
Hu, Jui-Ching (Note4)
- - - -
Note 1: Resigned on Oct. 30, 2014. Note 2: Promoted on Oct. 30, 2014. Note 3: Promoted on June 1, 2014. Note 4: Resigned on Jan. 20, 2014.
Stock Trade with Related Party: None.
Stock Pledge with Related Party: None.
-30-
7. Top 10 Shareholders Who are Related Parties to Each Other As of June 30, 2014; Unit: Shares; %
Name
Shareholding
Shareholding under spouse and minor
Shareholding under 3rd party
Top 10 Shareholders Who are Related Parties to Each Other
* : Pending shareholders’ approval in Annual General Shareholders’ Meeting.
** : Not applicable.
Note 1: Referred to TWSE website
Note 2: Price/Earnings Ratio = Average Market Price / Earnings Per Share
Note 3: Price/Dividend Ratio = Average Market Price / Cash Dividends Per Share
Note 4: Cash Dividend Yield = Cash Dividends Per Share / Average Market Price
-33-
1.7. Dividend policy and its execution status:
1.7.1. Dividend policy under the Article of Incorporation Considering that HMI is in a growth phase, the purpose of matching the overall environment and
characteristics of the industry, and for the goal of achieving sustainable operation and long-term interests of shareholders, the dividend policy shall take into consideration factors such as the Company’s current operating conditions and the capital budgeting plans of the subsequent year. In principle, dividends to shareholders shall be distributed in a combination of cash and shares, whereas the cash dividends shall not be less than 10% of the total dividends distributed to shareholders.
1.7.2. Proposal to distribute 2014 profits (approved by the Board and subject to Shareholders’ approval)
The Board adopted a proposal for 2014 profit distribution at its meeting on Mar. 4th, 2015 as follows:
The proposal is subject to shareholders’ approval at the Annual Shareholders’ Meeting. The Board will then determine a cash dividend record date.
1.8. Impact of Share Dividends to Operating Performance and EPS: Not applicable. 1.9. Employee Bonus & Compensation of Directors and Supervisors 1.9.1. The percentages or range of the employee bonus and compensation of Directors and Supervisors
stated in the Article of Incorporation: According to HMI’s Articles of Incorporation, If there is profit in the preceding fiscal year, HMI shall
provide for and pay taxes, offset its losses in previous years, set aside a legal reserve at 10% of the profits, and then, pay not more than 1% of the remaining profits as the remuneration to directors and not less than 1% of the remaining profits as the bonus to employees. HMI may issue stock bonuses to employees, including employees of an affiliated company, meeting the conditions set by the Board of Directors. As for the dividends distribution, a plan of distribution of dividends shall be proposed by the Board of Directors set forth in Paragraph 2 of Article 20 of the Article of Incorporation, and submitted to Shareholders’ Meeting for approval.
1.9.2. Proposed 2014 employee profit sharing plan and compensation to Directors and Supervisors
The Board adopted a proposal on Mar. 4th, 2015 for 2014 employee cash bonus and profit sharing of
NT$79,995,433 and compensation to Directors and Supervisors of NT$8,000,000. In accordance with accounting principles, employee cash bonus and profit sharing and compensation to Directors and Supervisors shall be fully expensed. HMI’s net profit is after expensing employee profit shares and compensation to Directors and Supervisors
Compensation to Directors and Supervisors was NT$8,000,000. There is a difference of NT$458 with the estimated Directors’ compensation of NT$7,999,542. The difference shall be accounted as “changes in accounting estimations” and be booked in the next fiscal year’s financial report, after approved by the annual shareholders’ meeting.
2014
Amount (NT$)
10% Legal reserve $ 323,792,834 Cash dividends 1,562,000,000 Compensation of directors and supervisors 8,000,000 Employee cash bonus and profit sharing 79,995,433
Total $ 1,973,788,267
-34-
1.9.3. Earnings retained in previous period (2013) allocated as employee bonus and Directors and Supervisors Compensation
Unit: NT$
Item of distribution AGM resolution Estimate Difference Reason for the difference
Employee cash bonus 91,131,950 91,131,950 - -
Compensation of
Directors and Supersivors 4,800,000 9,113,196 4,313,196
The difference was mainly because the actual
payment was less than the estimated amount, and
the difference shall be accounted as “changes in
accounting estimations” and be booked in 2014 fiscal
year’s financial report, after approved in the annual
shareholders’ meeting
1.10. Buyback of Commom Share: None.
2. Corporate Bond: None. 3. Preferred Stock: None. 4. Issuance of Global Depositary Shares Issuing date Nov. 12, 2013
Issuance and listing Luxembourg Stock Exchange
Total amount (US$) 291,700,000
Offering price per GDS (US$) 29.17
Units issued 10,000,000
Underlying securities Cash offering and HMI common shares from selling shareholders
Common shares represented 10,000,000
Rights and obligations of the GDS holders The same as those of common share holders
Trustee None
Depository bank BNY Mellon, U.S.A.
Custodian bank Mega International Commercial Bank
GDSs outstanding (As of Jan. 31, 2015) 731,308 units
Appointment of expenses for issuance and maintenance
All fees and expenses such as underwriting fees, legal fees, listing
fees and other expensed related to issuance of GDSs were borne by
the selling shareholders, while maintenance expenses such as
annual listing fees and accounting fees was borne by HMI.
Terms and conditions in the deposi agreement and custody
agreement
See depository agreement and custody agreement for details.
Closing price per GDS
(US$)
2014
Highest 51.39
Lowest 28.47
Average 41.32
As of Jan. 31,
2015
Highest 50.63
Lowest 44.60
Average 47.15
4.1. Use of Proceeds 4.1.1. Date approved by the industry competent authorities and doc. ref. No.:
The GDR offering was approved by the Financial Supervisory Commission on Sep. 3, 2013 with the doc. ref. Chin-Kuan-Cheng-Fa-Tzu No. 1020034994.
4.1.2. Total amount of the capital required: NT$ 4,500,000 thousand. 4.1.3. Capital sources:
Issuance of 5,000,000 units of the overseas depositary receipt (representing 5,000,000 shares of common stock) for a total of US$ 145,850 thousand which is equivalent to NT$ 4,300,000 thousand with exchange rate of US$ 1 = NT$ 29.48. The deficiency of the capital required by the plan will be made up by the HMI’s owned funds or other ways.
4.1.4. The issuance and placement of this plan were finished on Nov. 12, 2013 and the information has been disclosed on the Market Observation Post System.
Note: Exchange Rate of USD to NT$ (1:30) 4.1.6. Expected impact on business HMI’s EBI tools are designed to help semiconductor manufacturers manage their yeld rate, and are majorly used in the front end wafer manufacturing processs. By integrating the components of precision machinery, elelctrical engineering, electronic optical imaging, IPC, etc. from the up-stream suppliers, HMI has developed high performance EBI tools and is dedicated to increase the total addressable market by diversifying product offerings and applications. The use of proceeds in R&D is expected to increase of the annual sales value, gross profit margin and operating profit as the table below:
Unit: NT$1,000
Objective Year Sales value Gross profit margin Operating profit
Develop new products and
technologies
2014 6,150,000 3,997,500 2,460,000
2015 6,723,000 4,571,640 3,025,350
Total 12,873,000 8,569,140 5,485,350
Note: Estimated capital Payback period: about 1.67 years
4.2. Execution status 4.2.1. Execution schedule
Unit: USD1,000; NT$1,000
Plan’s items Execution status
Q4 of 2014 As of Q4 of 2014 Reasons for ahead of or
behind schedule and
improvement plan US$
NT$ equivalent
(Note) US$
NT$ equivalent
(Note)
Develop new
products and
technologies
Disbursement
amount
Expected 11,100 333,000 61,300 1,839,000 As affected by customer
demand, the overall product
conversion schedule was
slightly adjusted, which
resulted in revision of related
schedules. However, as a
whole, the adjusted schedule
does not have significant
difference from the annual
expected schedule.
Actual 13,785 413,546 73,157 2,194,721
Execution
schedule (%)
Expected 7.40% 7.40% 40.86% 40.86%
Actual 9.19% 9.19% 48.77% 48.77%
Total
Disbursement
amount
Expected 11,100 333,000 61,300 1,839,000
Actual 13,785 413,546 73,157 2,194,721
Execution
schedule (%)
Expected 7.40% 7.40% 40.87% 40.87%
Actual 9.19% 9.19% 48.77% 48.77%
Note: Exchange Rate of USD to NT$ (1:30)
HMI issued GDS shares by cash offering and secondary offering in 2013. The placement was finished on Nov. 12, 2013, and raised the amount of US$ 143,662 thousand, which is equivalent to NT$ 4,309,860 thousand. As of December 31, 2014, the actual disbursement amount was US$ 73,157 thousand, which is equivalent to NT$ 2,194,721 thousand, representing a completion rate of 48.77%. It was slightly ahead of original schedule as a result of adjustment of the overall product offering schedule driven by customer demand. In general, the adjustment in schedule does not have significant difference from the estimated schedule.
-36-
4.2.2. Since the Company’s new product and technology development project execution plan was slightly adjusted due to customer demand, the plan’s effect achievement rate was also slightly adjusted accordingly. However, the schedule of the annual execution plan still remains unchanged. After the delivery of Beta tool and mass production ramp up, it is expected that the positive impact on business shall still be achieved as originally scheduled. The effects shown as of Dec. 31, 2014 are as follows:
Unit: NT$1,000
Objective Year Sales value Gross profit margin Operating profit
Develop new products
and technologies
2013 Expected ─ ─ ─
Actual 187,036 121,573 74,814
Q4 of
2014
Expected 6,150,000 3,997,500 2,460,000
Actual 3,889,022 2,527,864 1,555,609
Total
Expected 6,150,000 3,997,500 2,460,000
Actual 4,076,058 2,649,437 1,630,423
Effectiveness 66.28% 66.28% 66.28%
4.2.3. Influence on shareholders’ equity and improvement plan The ceiling of the common stock issued by this time of seasoned equity offering was 5,000 thousand shares, which diluted the original shareholders’ shares by 7.04%. Even though this time of the Company’s participation in issuance of the overseas depositary receipt by processing seasoned equity offering would slightly expand its capital, the capital raised from seasoned equity offering will be used to pay for the new product and technology development project. Thus, it is a requisite for the Company to keep its future profits growing and shall have a positive effect on shareholders’ equity.
5. Employee Stock Option: None.
6. Employee Restricted Stock: None.
7. New share issuance in Connection with Mergers and Acquisitions: None.
V. Operational Highlights 1. Business Activities 1.1. Business scope 1.1.1. The main business activities of HMI
HMI’s the world’s leading provider of e-beam inspection, or EBI, tools and solutions for defect control and yield management in advanced semiconductor manufacturing process R&D and volume production. Since 1998, we have been committed to the research and design, manufacturing and sale of EBI tools and solutions. Today, we offer a wide range of EBI products based on our proprietary electron gun and column technologies and highly effective defect inspection algorithms to meet the various needs of our customers.
Our customers include many of the world’s largest semiconductor manufacturers, including top IDMs
(both logic and memory IC companies) and top foundries. Our EBI tools are used both by our customers’ R&D divisions in troubleshooting their advanced manufacturing processes under development and by their production divisions in defect control and yield improvement to achieve fast and profitable production volume ramp up.
Against the backdrop of increased architectural, manufacturing and material complexities at the
leading edge technology, it is increasingly difficult for manufacturers to achieve profitable yield rates timely to meet the demand and requirements of their customers. Manufacturers rely on high quality process control and yield management tools to overcome these challenges. We further expect EBI tools to gain market share from the mainstream optical inspection systems at the leading edge technology nodes, given their superior technical performance in resolution and sensitivity despite lower throughout.We believe the increasing adoption of EBI tools would help our customers save costs associated with yield loss and accelerate the learning curve of new processes by reducing setup and review time. 1.1.2. Revenue Split
Unit: NT$1,000; %
Main products 2013 2014
Revenue % Revenue %
E-beam Inspection Tool 5,035,270 94 6,905,683 96
Other 304,773 6 303,967 4
Total 5,340,043 100 7,209,650 100
1.1.3. Current Product Offering
A. eScan 300/310/315/320/500 B. eScan 380/Lite/400 C. Hot spot inspection series D. eXplore E. Supernova
1.1.4. New products planned to develop
A. Multi-column B.Jupiter C.Saturn
-38-
1.2. Inductry Outlook 1.2.1. The current industry status and development
Increasing demand for smaller form factor, high-performance and energy efficient consumer electronics worldwide is expected to drive the continued migration of semiconductor manufacturing processes to more advanced and finer geometry technology nodes. Recently, the advanced logic manufacturers started its geometry migration to 14/16 nm Fin Field Effect Transistors (FinFET) process; while DRAM (Dynamic Random Access Memory) migrating to 20nm process, and flash memory going three-dimensional (3D). The capital intensity of the advanced technologies are expected to increase coupled with technological difficulties and stronge end market demand. According to Gartner, Inc., Worldwide semiconductor capital equipment spending reached a total US$38.9 billion in 2014, an increase of 16.4 percent from 2013 spending of US$33.5 billion. Wafer fab equipment spending will increase 6 percent in 2015 and outgrow other sectors. Taiwan, Korea, and United States remained the top three in global regional semiconductor manufacturing equipment spending and largely will continue to expand the spending in 2015. According to SEMI, Taiwan regional spending on semiconductor equipment is expected to reach US$12.34 billion in 2015, a annual growth of 28% comparing to US$9.63 in 2014.
When the semiconductor advanced manufacturing process is undergoing evolution, the
semiconductor manufacturing companies have to shoulder several times more than ever before the research and development costs as well as the manufacturing plant construction costs. In addition, with an objective condition of the external environment, the maturity of the semiconductor materials, equipment, and the overall market are also challenges that have to be faced in the continuing scaling down or migration of the manufacturing process. How to master more advanced process technology and increase the manufacturing yield compared to competitors have always been core issues of concern for many in the semiconductor industry. In order to control the process quality and yield, the wafer fabrication (FAB) manufacturers use inspection equipment to first detect any wafer defects and then use back end equipments such as review SEM (scanning electron microscope) to do the defect review and classification. Currently, there are two main types of wafer inspection equipment: Optical (including darkfield and brightfield) and e-beam. Before the nanometer technology generation, optical technology was used to perform defect inspection. With the adoption of new semiconductor materials, new process technologies and the migration of semiconductor geometry to 90 nm and below, the traditional optical inspection technologies (darkfield, brightfield) started experiencing bottlenecks due to resolution limit. Therefore, fab users started to adopt e-beam inspection tools to control their manufacturing yield rate. Currently, optical inspection equipment still dominates the wafer inspection market. However, along with technology migration, we believe that e-beam inspection tools provide more supportive solution to trouble shooting defects due high sensitity and resolution. Comparison of wafer inspection tools
Bright Field Laser or visible light High Slow Highest
E-beam E-beam Highest Slowest High
-39-
To maintain HMI’s leading position in the e-beam inspection market, our strategies are as follow.
A. Provide immediate and highly efficient after-sales maintenance services to firmly secure our existing customer base.
As the semiconductor front-end inspection tools are ciritical for fab yield management, rapid response to customer needs, close cooperation with customers, and designing equipment that meets the needs of customers to meet the various needs of each customer are very important. In order to provide timely service, HMI has set up 100% wholly owned subsidiary companies in Japan and Korea known respectively as HMI Japan and HMI Korea. Aside from its functions of selling and distributing our inspection equipments, those subsidiaries are also involved in after-sales maintenance services.
B. Continuous R & D and innovation, develop new customers and improve product profitability
The manufacturing processes of the semiconductor industry are progressing rapidly, the fabrication technologies are also continuously improving and diversifying, and it is only by continuous innovation in technology that HMI cannot be eliminated or be left behind by the market. HMI's technical team has a deep knowledge of the semiconductor industry, highly skilled and experienced, and has successfully developed more than one hundred patents in Taiwan and other countries in the world. We were also verified and accredited by numerous world-class semiconductor manufacturers and we continue to receive direct inquiries from our sales customers to cooperate and help develop their related e-beam inspection systems. HMI has good key components and developed technologies, and together with our foresight to grasp keen insight into the future development of the industry, and continuing research, development and innovative technologies, we are able to introduce new products with better performance. We are commited to develpong more applications and advanced technologies to provide better solution to our clients.
C. Cooperate with the government industrial promotion policy
The Industrial Development Bureau, Ministry of Economic Affairs is actively promoting the localization of the semiconductor industry facilities. Localization of the equipment helps the wafer fabs reduce their manufacturing cost, shorten the delivery lead time, and improve the market share of the Taiwan branded equipment suppliers. HMI's business operation is in line with the government vision to accelerate the industrial upgrading and localization of the Taiwan process equipment industry and therefore, the government's drive to promote related industry assistance program will contribute to the future development of HMI. HMI will continue to support the government's industrial promotion strategy and expand the localization of our products and our market share in the global market for semiconductor equipment.
In summary, the increase in process complexity, it is expected that there will be a continued and increased demand for more effective and more sensitive process control and yield management equipment. Yield improvement has been the key issue for semiconductor manufacturers in migration to more advanced technology nodes, and poor yields and delay in yield improvement could directly impact profitability and ability to maintain or gain market share. In the near-term, optical inspection is expected to remain as the mainstream inspection tool while E-beam inspection will provide a complementary approach. However, with the development of nano-technology and the evolution of the semiconductor industry to smaller geometries, it is also expected that the adoption of E-beam will accelerate.
-40-
1.2.2. The industry upstream, midstream, and downstream relationship
HMI manufacturers fron-end wafer inspection tools and is positioned in the upstream in the semiconductor manufacturing cycle. We supply our equipments to the midstream wafer foundries for them to improve manufacturing yield rate.
1.2.3. Current product development
In the near-term, optical inspection is expected to remain as the mainstream inspection tool while E-beam inspection will provide a complementary approach. In 28 nanometer technology, the optical system is already experiencing a significant bottleneck of. The physical limits of the optics - diffraction phenomenon - restrict the imaging resolutions, leading to the significant drop of pattern identification rate for 28 nm or below. The lack of ability for optical inspection tools to clearly identify circuits and defects narrows its application in advanced nodes wafer inspection.
From cost of ownership perspective, e-beam inspection tools are with higher resolution and smaller pixel sizes, so it is currently not possible to achieve the same scanning speed as the optical system. However, the performance of an inspection tool is not merely measured by scanning speed. HMI’s proprietary LeapNScan technology allows users to scan only the areas with defects and to switch from one spot to the next directly. Not needing to run through the whole wafer as under the traditional continuous mode scan, the LeapNScan mode can increase the throughput and accelerate new product ramp-ups of our customers. The introduction of e-beam inspection in the new generation of technology provides cost effective solution in the market. We will use the eScan500 and eP4 to further illustrate: eScan500 is the latest generation model evolving from eScan320 and eScan400. To better capture defects along with geometry migration, the image resolution of the eScan500 is enhanced by more than 30% compared to the eScan320. At the same time, it combines our leap scan technology and together with the continuous scan and hot spot inspection system, it allows our clients to have more flexibility and efficiency when doing wafer inspection, and eventually increase productivity. eScan500 plays a very important role in the 14/16 nm technology development. In response to the continuing improvement in the semiconductor technology, the direction of HMI's future product strategy will advance towards the development of the semiconductor manufacturing processes and productions in order to continue to grasp the leading position in the semiconductor inspection tools market.
HMI also successfully developed eP4 in 2014. Aside from upgrading the image processing system, eP4 is equipped with the highest sensitivity of our e-beam products. The resolution of eP4 is 2nm, which is around 30% improvement comparing to its previous version product eP3. The mainstream application of eP4 will be in hotspot monitoring. The improvement in resolution opens the door for more application opportunities such as CDU (critical dimension monitoring) and OVL (Overlay) monitoring. As geometry migrates to 1X nm technology, the shrink in linewidth and process complexity pose even higher difficulties in in-line monitoring of hotspot, CDU, and OVL.
Moore’s Law states that processor speeds, or overall processing power for computers will double about every 18 month's. During the cadence, the semiconductor manufacturing companies invest related human resources and materials to research and develop the next generation of techonology and compete with each other. HMI designs the product roadmap to be in line with our clients’ technology roadmap to provide timely support and service to our clients. The product roadmap is as follow.
2013 2014 2015 2016
Machine model eScan500 eP4 In-line monitoring Multi-column Multi-column
HMI operates in coordination with the semiconductor manufacturing companies' advanced manufacturing processes and according to different manufacturing process stages, we develop products with different specifications or standards. Based on the above table, we can see that the present development progress and technologies of HMI are in line with the evolution of the semiconductor manufacturing processes. In the future, we shall continue to develop faster scanning speed, more sophisticated inspection ranges, and higher throughput machines to meet the demands of the market. In summary, with the semiconductor advanced manufacturing processes advancing towards the 14/16 nm and 10 nm geometry, the demands for wafer and mask inspection will increase substantially. Besides the current wafer inspection products, we also have a mask inspection system especially designed for EUV (Extreme Ultraviolet) mask inspection. HMI’s future product development and strategy will also be based on the development and volume production time schedule of the semiconductor manufacturing process as an important basis of consideration. At the same time, we shall observe the changes in the circumstances of the related manufacturing processes, and according to the changes, research and develop new technical levels for a machine that will meet the semiconductor inspection demands.
1.2.4. Competition
At the beginning, wafer inspection tools suppliers were such as Applied Materials, KLA-Tencor and the Hitachi High Tech, etc. all invested in R&D and production of e-beam inspection tools. However, due to the complex technology required, the need for a strong patent protection, and the need for a lot of capital investments, some of the market competitors had already withdrawn from the wafer inspection tools market one after another. At present, most companies had already disappeared from the inspection tools market except for KLA-Tencor and HMI. HMI’s global market share in e-beam inspection segment is more than 85%.
1.3. Technology and R&D Status 1.3.1. The technology level, and research and development of the business operations The conventional optical defect inspection technology is encountering a great challenge with new semiconductor materials, the use of new manufacturing process technologies, and the trend of migration of the semiconductor geometry. In order to improve the manufacturing yield rate timely, the new generation defect inspection technology must be able to capture and automatically classify various defects with faster throughput and higher sensitivity. The main defect inspection methods optical (including dark field and bright field) and electron beam (E-beam).
-42-
A. Dark Field Dark Field inspection tools usually use laser as the light source. The sensitivity is limited while the inspection speed is fast, and the cost is low. When installed in a lower position in an inclined angle, it can easily detect surface defects. It is more sensitive to the pattern and HAR defects when perpendicular or near perpendicular to the wafer surface.
B. Bright Field Bright Field inspection tools use visible light or laser as the light source. The sensitivity is decent, but the inspection speed is slower than Dark Field and the cost is higher. The incident lights and inspection signals of the bright field inspection tools are identical. They are all perpendicular to the wafer surface. When the incident light illuminates the defect areas, the defect signal will be darker than the brighter background formed by reflection. The pixel size (< 1 micron) during bright field inspection is very small. It is very sensitive to pattern defects, HAR defects and very small plane defects. It is usually used in FEOL, ADI, AEI and other inspection sites. Despite the fact that small pixels can improve the bright field inspection sensitivity, the inspection speed is slower due to the huge amount of data signals. Following the use of UV/DUV light source and the inspection pixels continuing to become smaller, the inspection sensitivity of the bright field inspection also continually improves. The new generation of bright field inspection tools can, under the situation where it is not going to affect the inspection speed, capture very small defects (20 x 40 nanometers) and satisfy the demands of the 65 nanometer and below manufacturing process technologies.
C. Electron Beam (E-beam)
E-beam inspection uses a focused electron beam as the inspection source. The sensitivity is the highest, but the inspection speed is the slowest and the cost is between cheaper than Bright Field but more expensive than Dark Field. When using an e-beam for inspection, the incident e-beam excites secondary electrons, and then through the collection of the secondary electrons signals and image processing, we can see a clear image of wafer. The scanned image presented by the machine is used to analyze and capture the defects that an optical inspection tool is unable to inspect. For example, when the Contact, VIA, HAR or such other structures weren't sufficiently etched (Contact Open), and due to the fact that the defects were in the bottom of the structure, it is therefore very hard for dark field or bright field inspection tools to detect. However, because the defects can impact the transmission of the incident electron, it will therefore form a Voltage Contrast image and detects the various defects affecting the electrical properties caused by the HAR structure abnormalities. Furthermore, since e-beam is the inspection source, the inspection results are not affected by certain surface physical properties such as color anomalies, changes in thickness, or front layer defects. Therefore, the e-beam inspection technology can also be used in inspecting small physical defects such as gate etching residue, etc.
In general, the defects that impact the yield are usually derived from the physical defects of the partial or entire component. As the pixel size of the e-beam is smaller than the optics, the e-beam inspection can detect very small physical defects that the optical inspection cannot. Aside from the physical defects, the e-beam inspection can also detect the voltage contrast caused by the abnormal current created by the electrical defects of part of the component or of the entire component. The e-beam caused the wafer surface to be electrically charged, so that a voltage difference will appear in the defective location and impact the wafer surface secondary electron escape rate. The resulting difference in image can then be detected. Typically such defects cannot be seen from an optical instrument but it can be found through an e-beam inspection system, especially in the Front-end-of-line (FEOL) manufacturing process of many cutting-edge components. Residual Poly, Contact Hole Etch Stopping, SAC Hole Punch-Through, Dielectric Gap-filling Void, defects in Substrate, abnormal Ion Implant, etc. are all considered these kinds of critical defects. These defects will cause component failures and will have a negative effect on the yield rate. Using conventional inspection methodologys to inspect these defects is a very difficult challenge. However, the general voltage contrast defects inspection, oftentimes, can only be carried out after the manufacturing
-43-
processes and the feedback time was usually very long. In contrast, the use of e-beam inspection technology not only shortens the feedback time, it can also effectively reduce the learning time to confirm and exclude the various manufacturing process issues as well as reduce the risk of wafer cost. After a problematic manufacturing process, the fab can use the e-beam inspection system to immediately collect critical information on the locations of the defects, feedback data of the optimized manufacturing processes, and such other crucial information to accelerate the development and trial production.
1.3.2. R&D expense overview
Unit: NT$1,000; %
Item 2014 As of Jan. 31, 2015
R&D espense (A) 961,186 103,501
Revenue (B) 7,209,650 535,974
Percentage (A)/(B) 13.33% 19.31%
1.3.3. Successfully developed products
Year Product Description
2006
eScan 310
eScan 310 is the upgraded model of eScan 300. It is the first and only leap scan system (Leap
Scan) in the industry. It expands the electro-optical system scanning field, achieving the
market's unique large-field scanner with 600 x 600 microns (Large FOV - Field of View). It
moves the wafer to the area to be scanned, allowing the wafer to be scanned in a stationary
state, and reached the market's highest resolution e-beam scanner imaging system and
under the same conditions, with a higher signal to noise ratio (S/N).
eScan 380
eScan 380 is a continuous scanning system (Continuous Scan). It was aimed at customers
manufacturing memory components and provided them with a large area continuous
scanning machine. Using a similar method like the optical defect inspection tools, it
proceeds to carry out scanning while the wafer is in a motion state. At the same time, the
high resolution electron gun (e-Gun) has a much higher signal to noise ratio (S/N ratio)
under the same conditions.
2008
2008
eScan 315
eScan 315 is the next generation model of eScan 310. It is an entirely new designed electro
optical and image processing system with a more convenient user interface and with a
unique leap scan type of scanning system (Leap Scan). It is the highest resolution e-beam
inspection system in the market and it helps improve the semiconductor product yield more
efficiently and became the world's semiconductor manufacturing companies' main models
of defect inspection tools.
eScan Lite
eScan Lite is the subsequent model after eScan 380. After improving the design, it has a
more stable scanned image and it was directed at the demands of the NAND Flash memory
manufacturers. With the exclusive patented Lightning Scan that we developed and under
the same defect inspection sensitivity conditions, it can reach 4 times the speed of other
equipment and effectively reduce the cost of the semiconductor manufacturing companies.
eP2
eP2 was aimed at the hot spot produced as a result of the lack of capabilities of the
designed components and the manufacturing process by the advanced manufacturing
processes. In connection with these hot spots, it uses the high resolution e-beam to carry
out high speed image capture or use the Gray Level to measure the divergence of the
measurement analysis produced by each manufacturing process between each wafer and
pattern matching, and then find the location of the abnormalities and proceed to monitor
the manufacturing process of the production line.
2009 eScan 400
eScan 400 is the next generation model of eScan Lite. Through the new generation electron
gun, the optical electronic lens system, more stable wafer carrier operating system and
powerful computing, the equipment now has a fast continuous scanning (Continuous Scan)
and very high resolution. It satisfies the customer's need for an equipment that has the
capability for the development of the new generation memory component manufacturing
process and yield enhancement while at the same time being economical and has an
inspection capability.
2010 eScan 320
eScan 320 is the next generation model of eScan 315. It has the world's highest resolution
e-beam defect inspection system. The wafer defect inspection rate was increased by 30% as
compared to the previous generation models, the speed was improved 1.7 times, and it has
efficiently helped the development of cutting-edge semiconductor and yield improvement.
-44-
Year Product Description
eManager
Workstation
eMW is an advanced computer analysis system developed and manufactured by the
Company. It has the capability of analyzing the hot spots of semiconductors, and assist
semiconductor manufacturing companies in effectively identifying the hot spots in order to
increase yield.
Supernova
Supernova is a world-class computing system developed and manufactured by the
Company. It has a formidable computing capability to compare and analyze the wafer
defects and design pattern matching and with the eScan, eP and eXplore systems of the
Company, it is an indispensable equipment for the analysis and improvement of the yield of
the advanced manufacturing processes.
eXplore
eXplore is the first design specially made for the mask manufacturing companies' e-beam
defect inspection system. Its defect inspection technology provides the highest resolution
and defect inspection rate for the extreme ultraviolet (EUV) mask and nanoimprint
lithography system. It provides the most immediate solution for the EUV mask defect
inspection technology needed by the future 16 nanometer wafer manufacturing process.
2011 eP3
eP3 is the next generation model of the eP2. It is the new generation electro optical system
and has a more stable wafer carrier operating system and has the industry's highest
resolution image. In connection with the hot spots generated by the lack of capabilities of
the designed components and the manufacturing process by the advanced manufacturing
processes, it uses the high resolution e-beam to carry out high speed image capture or use
the gray level to measure the divergence of the measurement analysis produced by each
manufacturing process between each wafer and pattern matching, and then find the
location of the abnormalities and proceed to monitor the manufacturing process of the
production line. By using it together with the Supernova system, it can be applied in
confirming the lithography optical pattern correction field.
2013 eScan500
eScan500 is the next generation model for the current flagship models eScan320 and
eScan400 of Hermes Microvision Inc. Along with the continuing geometry migration, the
semiconductor manufacturers are asking for superior technical performance in resolution
and sensitivity of wafer inspection tools. To fulfill their demand, the resolution of the
eScan500 is enhanced by more than 30% compared to the eScan320. At the same time, it is
bundled with a more flexible "LeapNScan" leap scanning system and together with the
Continuous Scan system, it will improve the efficiency of the wafer defect inspection and
hence, increase the FAB productivity.
2014 eP4
Aside from upgrading the image processing system, eP4 is equipped with the highest
sensitivity of our e-beam products. The resolution of eP4 is 2nm, which is around 30%
improvement comparing to its previous version product eP3. The mainstream application of
eP4 will be in hotspot monitoring. The improvement in resolution opens the door for more
application opportunities such as CDU (critical dimension monitoring) and OVL (Overlay)
monitoring. As geometry migrates to 1X nm technology, the shrink in linewidth and process
complexity pose even higher difficulties in in-line monitoring of hotspot, CDU, and OVL.
As of Dec. 31, 2014, the summary of HMI's approved and licensed patents and patent under applications are as follows:
Region
Status Taiwan USA China Japan Korea Singapore Israel PCT Total
Approved & Licensed 45 95 4 6 2 1 1 0 154
Under Application 12 51 0 1 0 0 2 3 69
Total 57 146 4 7 2 1 3 3 223
The above table shows that HMI's patent application strategy is to prioritize our applications in the United States and this was due to the fact that HMI's main competitor, KLA-Tencor, is based in the United States. As the protection of a patent is to prevent other parties from manufacturing without consent, using, offering for sale, or selling receives the protections of a patented product, or receives the protection of a product produced by a patented manufacturing process, so it is generally the practice to choose the place of competitor as a priority consideration for applying a patent. In order to avoid the advance patents owned by HMI be subjected to the infringement by the KLA-Tencor and other competitors and to keep abreast with the patent information on the related products of our competitors, HMI considered the most efficient and convenient place of law enforcement to apply for patent is in the United States.
-45-
In Taiwan, as US approved patents need to go through translation, proofreading, internal audit, consultation with lawyers and such other procedures, and it also needs to go through the review and approval of the competent government authorities before licensing, the application process is much slower. At present, we commissioned PriceWaterhouseCoopers Taiwan and Hitek International Patent and Trademark Office to handle these cases and they report back to us the status of these cases monthly. While in other countries like China, Japan, Korea, Europe and Singapore, as they are not the major manufacturing base of the Company and our competitors and the application procedures take a long time, our patent application cases in these countries are less but it is not going to have a material impact on the Company's operations.
1.4. HMI’s Long and Short Term Business Development Plans 1.4.1. Short Term Development Plan
A. Cultivate existing customers, and provide the customers with a total solution B. Enhance productivity and shorten the production cycle C. Continue to reduce production costs and enhance our competitiveness
1.4.2. Long Term Development Plan
A. Develop new technologies and products, in order to maintain our market competitiveness. B. To cultivate outstanding research and development, and production management personnel.
2. Market and Sales Status 2.1. Market Analysis 2.1.1. Sales by Region
Unit: NT$1,000; %
2012 2013 2014
Sales % Sales % Sales %
Export
Asia 1,219,012 29.16 1,678,772 31.44 1,682,441 23.34
America 1,386,036 33.16 1,791,602 33.55 3,136,454 43.50
Total 4,179,904 100.00 5,340,043 100.00 7,209,650 100.00
2.1.2. Market Share In the early years, optical inspection tools were the major inspection equipment used in production line while the e-beam inspection tools were used mainly in the research and development and ramp up processes. E-beam market share accounted for less than 5% of the entire wafer fab equipment market. However, in the 90 nm and below manufacturing process, the optical inspection tools started encountering bottlenecks. While in the 28 nm, it is very difficult for optical inspection tools to generate a clear image of the wafer and e-beam inpection tools are considered as a more supportive technology due to higher resolution and sensitivity. Therefore, the market for the e-beam inspection tools is increasing along with technology migration. HMI not only had successfully introduced advanced tools into the market, but also gained the recognition of a lot of world-class semiconductor manufacturers. Due to the difficulty of obtaining the statistical information of our competitors, we therefore made our own estimation of our market share. In 2014, based on the total e-beam inspection tools installed, we estimated that HMI’s market share for the overall e-beam inspection tools is about 85%.
-46-
2.1.3. The future market supply and demand situation and growth
Though the electronic products are turning towards the lighter, thinner and smaller trend, the demands for higher quality by Taiwan and other developed countries are now much higher. With the trend in the miniaturization of the semiconductor manufacturing processes, the semiconductor inspection tools will turn towards the development of more precise and higher speed equipment. As the conventional optical defect inspection tools are unable to effectively detect much smaller defects, the demand for more sophisticated e-beam defect inspection tools will definitely increase. For the past two years, the foundry industry has significantly increased their capital expenditures, and it is primarily related to the development and expansion of the advanced manufacturing processes capacities. The research and development expenses of the advanced manufacturing processes of the 40 nm and below technology are astonishingly high (it has a positive correlation with lithography equipment), and a significant portion of the capital expenditure increases in recent years were closely related to the advanced manufacturing processes. As the advanced manufacturing processes development and plant expansion require a large amount of funding, the industry leaders, by virtue of high profit and possessing a high capital expenditure condition, can increase capital expenditures to lay the ground for the advanced manufacturing processes. Through high profit margin and high market share gained from the expansion of advanced manufacturing processes, they further pressure the competitor's profitability and market share and eventually, force the competitors out of the market. We anticipate that, in the future, in considerations of obtaining leading technologies by the various foundries and cost considerations by customers, capital expenditures will continue to grow, enabling the future development of the semiconductor equipment industry.
2.1.4. Competitive strength
A. Experienced management team
HMI's management team members used to work with well-known semiconductor companies both locally and abroad. Each of the major department heads has more than 10 years of related industry work experience and qualifications. They have considerable experience in the semiconductor industry, IC equipment industry and related knowledge of software development and the development of international customers.
B. Strength of a strong R & D team
The research and development team includes the industry's outstanding talents in the applications of e-beam (E-beam) and image processing. They successfully developed the first unit of "E-beam inspection machine- eScan", leading the world with the exclusive leap scan inspection and stable electron gun technology, providing more advanced inspection tools and technologies, effectively improving the inspection instruments and equipment efficiencies, and enhancing the Asian semiconductor equipment technology level for it to be able to enter into the world of high technology equipment and components supply chain.
C. Fast and immediate efficient after-sales maintenance services
As the semiconductor front-end inspection tools are ciritical for fab yield management, rapid response to customer needs, close cooperation with customers, and designing equipment that meets the needs of customers to meet the various needs of each customer are very important. In order to provide timely service, HMI has set up 100% wholly owned subsidiary companies in Japan and Korea known respectively as HMI Japan and HMI Korea. Aside from its functions of selling and distributing our inspection equipments, those subsidiaries are also involved in after-sales maintenance services.
-47-
2.1.5. Advantages and Risks 2.1.5.1. Advantage factor
A. Inspection tool demands continued to expand
The flourishing global consumption for electronic devices results in a significant increase in the demands for IC products. With the application of new semiconductor materials, new manufacturing process and the miniaturization trend of semiconductor components, the conventional optical inspection technology will start experiencing bottlenecks. Both logic and memory semiconductor manufactureres will continue to invest in advanced technology nodes in order to lower the wafer cost, reduce risk and improve yields. The demand for inspection will continue to increase and the requirements for e-beam inspection tools will also increase. In recent years, Taiwan government has also actively promoted the localization of the semiconductor equipment. In order encourage the localization of semiconductor wafer front-end manufacturing equipment and allow the domestic semiconductor industry supply chain to be more robust and complete, the Council for Economic Planning and Development (CEPD) plans to provide a NT$ 330 million subsidy within 4 years starting 2013 to help the domestic equipment manufacturers strengthen their R&D capabilities, increase their scale of operations, and at the same time, the IC foundries and other manufacturers can take this opportunity to reduce the risk on supply chain concentration and achieve the goal of decentralizing procurement concentration, and strengthen their bargaining power with the leading equipment manufacturers and such other targets. Localization of FAB equipment not only helps to reduce the costs of the wafer fabrication companies, it also strengthens the partnerships, and also enhances the market share of Taiwan's branded equipment suppliers and the manufacturing capabilities of the OEM manufacturers. This is a positive factor in the future growth of the Company. The company is committed to the development of functional and superior quality e-beam inspection tools and will actively market our products to master the market trend.
B. High barriers to enter this industry
As the e-beam inspection tools need to integrate electronic, optical, mechanical, materials, software and hardware integration of information and system, application engineering and other areas of high-end technologies in order to complete the manufacturing of the equipment, it is necessary to recruit talents from all sectors and at the same time invest heavily in R&D. Therefore creates high entry barrier for the new comers.
C. Strong R&D team and command the ability to research and develop key technologies
HMI has already successfully filed of hundreds of patentes domestically and internationally. We were also verified and accredited by numerous world-class semiconductor manufacturers and we continue to receive direct inquiries from our customers to cooperate and help develop their own e-beam inspection system. The key components of wafer inspection tools such as electron gun, secondary electron detector (Detector) and electronic aperture (Aperture), etc. are the main core of our research and development technologies. For this reason, having the research and development capabilities to master the crucial technologies are the key factors in upgrading our technology levels and customization capabilities, and maintaining the favorable factors of competitive advantage and high profit margins.
2.1.5.2. Disadvantage factor & Countermeasures
A. Competition of foreign manufacturers Compared to other foreign semiconductor capital equipment providers who were involved in the development of relative technology, HMI started late and cannot compare in scale of operations with these large foreign companies as our financial resources are likewise relatively weaker.
-48-
Countermeasures: a. Take the advantage of flexible operations as the small-medium size enterprise. Use problem
solving as the direction of development, and cooperate with the semiconductor companies in the pursuit of research and development of the overall manufacturing processes.
b. Through superior technology and diversification of industry risk, develop the most optimized production model in order to achieve the advantage of cost reduction.
c. Provide products with short development time, fast delivery, high quality and strong integration capability. Provide the customers with diversified and comprehensive solutions, and with the most immediate and best quality service as the goal, build up a partnership with the customers.
B. Existing product line is confined within the semiconductor industry
After long term development of the semiconductor industry, and undergoing technological resolution, the industry development is likely to encounter a structural change.
Countermeasures: With the existing successful e-beam inspection technology, develop usage in different other industries such as the medical industry. Increase the types of applications in different industries and proceed to expand the sales of the products in the market.
2.2. Application of HMI’s main products and production process 2.2.1. Application of HMI’s main products HMI mainly produces e-beam inspection tools. Our product application areas include inspection of defects through scanning of the wafer, and feedback the defect density and distribution areas to the users so that manufacturing process monitoring and optimization can be carried out. 2.2.2. The manufacturing process of main products:
Customer order Design Materials
Assemble Inspection Package and transport
Establish the equipment specifications
Special function requests
Equipment frame design Special function
simulation
Purchase of parts Materials
management
Packaging materials
Wooden materials
Packaging materials
Wooden
materials
Critical module assembly
Specifications and functional tests
Repair and replacement of defective products
Clean and pack Cargo for export
IPA (for cleaning use)
N2&CDA N2&CDA&He Pure water (cleaning
use)
-49-
2.2.3. Supply for main materials HMI specializes in e-beam inspection tools and they are mainly used in the inspection of defects through scanning of the wafer. The e-beam related modules are the key modules of HMI. It mainly consists of the power supply and the electron gun module. We proprietary design 100% of our e-beam inspection system and manufacture 80% of our key components in-house. The main items of materials purchased are the wafer transfer mechanics module, e-beam assembly components, and the vacuum system components. HMI owns 94% and 100% of the shares of HMI USA and HMI Beijing respectively and we have complete control over our subsidiary companies. After we received orders from our customers, we will then coordinate HMI USA and HMI Beijing to produce the electron gun module and power supply module respectively. And upon receiving the orders from HMI, HMI USA and HMI Beijing will proceed on its own to plan and schedule the production. Since HMI has control over these two companies, we also have effective control over its production and supply situation. So far, the supply situation of the power supply devices and electron gun modules can meet the production demands of our e-beam inspection tools and the supply situation is stable and good. In order to control the risks with regard to the supply stability of the power supply device and the electron gun module, we also have a backup facility in our Tainan factory for the maintenance and production capability of power supply device and electron gun modules. This is in case HMI USA and HMI Beijing encountered any kind of production issue, we shall have back up plan and reduce the risk of supply shortage of these related modules. HMI’s purchases plan of materials and components based primarily on the sales forecasts, R&D production plan, the inventory level, and proceed to order from our suppliers. This is to avoid excessive or inadequate procurements from happening. When making any procurement, aside from following the normal procedure of price inquiries and comparisons to select the best quality products and good stable supply sources of vendors, HMI also always observes the changes in the market enviornmnet to observe reasonable market price. From time to time, we conduct price negotiations with our existing suppliers to reduce our purchase costs. Overall, the main raw material suppliers of HMI are our own subsidiary companies or companies with a good and long term cooperation with us. From the last three years up to the publication date of the annual report, we have not encountered any supply shortage or interruption situation and hence, our supply sources and the supply situation are stable and good. 2.2.4. Key suppliers and Customers 2.2.4.1. Key suppliers Names of suppliers accounting for more than 10% of the total purchase in any of the previous two years:
2013 2014
Supplier Amount
Purchased (NT$ 1,000)
% of total purchase
Relation Supplier Amount
Purchased (NT$ 1,000)
% of total purchase
Relation
Rorze Automation Inc. 94,824 10.59 * - - - *
Other 800,419 89.41 - Other 1,126,957 100.00 -
Total 895,243 100.00 - Total 1,126,957 100.00 -
*Not related parties
Reasons for change: HMI’s purchases from Rorze Automation Inc. are mainly wafer transmission modules, components and spare parts. Due to the strong market demand for HMI’s E-beam inspection equipment in the 4th quarter of 2013, HMI purchased more materials from Rorze Automation Inc. in the period. The annual purchase amount in 2014 was higher than 2013 due to robust sales growth. But there was no single supplier with the amount of purchase over 10% of the total purchase in credits to stable supply of materials and better control of inventory level.
-50-
2.2.4.2. Key customers Names of customers accounting for more than 10% of the total sales in any of the previous two years:
2013 2014
Name Sales
(NT$ 1,000) % of total Revenue
Relation Name Sales
(NT$ 1,000) % of total Revenue
Relation
B company 1,201,781 22.51 * S company 1,397,914 19.39 *
E company 1,080,427 20.23 * B company 1,343,920 18.64 *
F company 663,837 12.43 * - - - -
Other 2,393,998 44.83 - Other 4,467,816 61.97 -
Net sale 5,340,043 100.00 - Net sale 7,209,650 100.00 -
*Not related parties
Reasons for change: HMI’s e-beam inspection tools are majorly used in R&D and ramp up stage of new technology nodes. Since every semiconductor manufacturers with advance technologies (28nm and below) is our client, the change in key clients on a year basis is majorly driven by each of our client’s unique R&D and ramp up schedule and different product mix for differenct technology nodes.
2.2.5. Production Volume and value in the past 2 years
Note: Given that HMI manufacturers 80% of the key component in-house, the production capacity is more subject to clean room size and human resource capability in stead of production line capacity. Therefore the production capacity is not applicable.
Total 500 1,869,669 960 3,470,374 480 2,388,531 1,840 4,821,119
Note: The aforesaid “others” are mainly the income of sales of parts and components, and services for maintenance. Due to varying characteristics of the sales items, quantification of the volume is not applicable.
3. Personnel Information in the latest 2 years 2013 2014 As of Jan. 31, 2015
Number of employees
Manufacturing personnel 168 199 203
Management & sales personnel 173 199 200
R &D personnel 206 237 236
Total 547 635 639
Average age 36.10 37.00 37.02
Average year of service 6.14 5.31 5.35
Education (%)
Doctoral 8.59% 8.98% 8.92%
Master 34.92% 35.59% 35.52%
University / College 47.71% 47.09% 47.10%
High School 8.78% 7.56% 7.51%
Below high school - 0.79% 0.94%
Total 100% 100% 100%
-51-
4. Important Contracts Type Counterparty Term Summary Restriction
Technical Cooperation Agreement
Hermes Microvision, Inc. (USA) Jan. 1, 2015~ Dec. 31, 2016
Research & Development Contract - Hermes Microvision, Inc. (USA) to
perform all technology development, and the development results and
Southern Taiwan Science Park Administration land lease (new factory
building) None
Product Agency Agreement
Yarbrough Southwest Jan. 1, 2012~ Dec. 31, 2014
Product distribution agreement None
-52-
VI. Corporate Social Responsibilities As the leader in providing advanced e-beam defect inspection tools to leading-edge semiconductor manufacturing processes, HMI have renewed our commitment to sustainability and global corporate citizenship. As our customers using HMI’s advanced e-beam systems to further improve the yield in their production lines, we are helping our customers to reduce their wastes in chip production and to improve the sustainability of the semiconductor industry as a whole. Furthermore, we are continuously driving the energy efficiency of our products through engineering improvements and design innovations. As a result, our new generation tools have achieved more than 70% higher energy efficiency. At HMI, we recognize our social responsibility as a corporate citizen, and we believe in being proactive to contribute back to the society. We value innovation, quality and continuous improvement in our products to be sustainable and environmentally responsible to the industry we served. We are committed to ethical business practices to cultivate a productive, safe, supportive working environment to our employees. By nurturing sustainability business practices, we also create values to our employees, our customers, and our shareholders.
1. Employee Relations HMI establish all systems in accordance with laws and regulations. HMI also established the EICC (Electronic Industry Citizenship Coalition) management system in accordance with the Electronic Industry Code of Conduct. HMI is committed to offering our employees an environment to develop their capabilities. Our employee welfare measures, advanced studies, training, retirement system and other measures to protect employees’ rights and interests as as follows. 1.1. Welfare system HMI has worked hand in hand with its employees, and both sides have developed a consensus on joint growth. As such, employees are making every effort to do their job and create good performance, whereas HMI is providing sound compensation to return hard-working employees’ contribution. In addition, HMI has also set up its employee welfare committee, and has monthly contributed the welfare fund and taken care of related welfare issues. HMI’s major employee welfare benefits include: the annual traveling activity, monthly birthday gifts, festival bonuses and gifts, year-end lucky draws, employee educational training and subsidies, wedding, funeral and birth allowances, and group insurance, etc.
2. Continuing educaton and training system In order to elevate HMI’s employees’ capability and enhance their working efficiency and quality, HMI has provided orientation training for its new entrants. Also, during the employment period, HMI has also non-periodically provided our employees with professional education training (including internal training and external training) or the opportunity for advanced studies. In addition, HMI has also registered all the educational training actually received by employees for management, in the hope of cultivating
professional talent, effectively developing its employee’s potential and making the best use of the talent.
Genre Class No. of
attendance
No. of trained
personnel
Training hours
Training expense
Rate of trained
personnel
Average training
hour/ppl
Average training
expense/ppl
Internal training
Professional 49 288 285 7,728 297,864 99%
69.5 1,865
Occupational 35 579 575 2,077 0 99%
Language 7 9 6 255 28,800 67%
Sub Total 91 876 866 10,060 326,664 99%
External training
Professional 54 82 65 12,079 254,925 79%
Occupational 12 17 15 100 14,240 88%
Sub Total 66 99 80 12,179 269,165 81%
Total 157 975 946 22,238 595,829 97%
-53-
3. Retirement System In order to protect employees’ rights and interests, care for their retirement lives, and enhance labor relations, HMI has established its “labor pension supervision committee” and monthly contributed the pension reserve to Standard Chartered Bank for exclusive use. In addition, starting from July 2005, HMI has also followed the “Labor Pension Act” to monthly contribute the pension for its employees and deposit it in the labor pension personal account set up by the Bureau of Labor Insurance, in the hope of providing more protection for its employees’ retirement lives. No employees have retired since HMI’s establishment.
4. Labor Agreements & Employees’ Right Protection HMI has set up an internal control system – the payroll cycle, which gives integrated planning ranging from employee recruitment, employment, promotion and transfer to retirement, and is used as the common rules of HMI and our employees. In addition, HMI has also non-periodically held meetings to have opinion exchanges with its employees. As such, HMI has harmonious labor relations and, with which, no disputes with its employees have ever occurred.
5. Protection measures applied to the working environment and personnel
Item Content
Access security
1. Around the clock strict monitoring system 2. All colleagues must use identification cards to gain passage in going in and out of the office or important
storehouse or warehouse. 3. We contracted a private security company to secure and maintain the safety of the Company premises
during night time and holidays. 4. We cooperate with the community management committee (CMC) and coordinate with the building
security to have a direct alert communication link.
Maintenance and inspection of all facilities
1. In accordance with the building public safety attestation and report related regulations, the landlord, Hermes-Epitek Corp., shall commission a professional company to conduct a public safety inspection every two years.
2. Based on the provisions of the Fire Services Act, the Company shall commission a qualified company to conduct an annual fire inspection of the leased premises.
3. Based on the automatic inspection method and provisions of the Company "Factory Service Facilities Management Program", we shall conduct inspection and maintenance of all our facilities like electrical power system, air conditioning, fire-fighting facilities, dangerous machineries and equipment on a daily, monthly, semi-annual or annual basis.
4. Based on the provisions of the Labor Safety and Health Act, the Company shall commission a qualified inspection company to conduct operational environment evaluation of the Company including noise, lighting, CO2 concentration, chemical concentration, etc. every six months.
Disaster preparedness and response measures
1.The company has established the "Emergency Preparedness and Response Program Manual", "Event Processing and Investigation Procedures", "Code of Practice on Occupational Safety and Health", "Hazard Identification and Risk Assessment Procedures", and "Health and Safety Operational Control Procedures" and such other disaster prevention, event handling, and incident reporting procedures and clear standards for all personnel of the Company on the roles they have to play and the task contents when faced with an emergency, major event, general accident and other unexpected situations. We conduct emergency evacuation drills once every six months.
2. We established a self-defense firefighting group subdivided into firefighting, fire reporting, evacuation guidance, safety and protection, and first aid groups. Together with the emergency evacuation drills, we carry out practice every six months and invite competent firefighting authorities to conduct disaster preparedness workshops.
3. To maintain employee safety and health, and to implement safety and health management, we set up the Occupational Safety Office as an organizational unit. To promote environmental health and safety services, we appointed two persons in charge of the labor safety matters (on a part-time position) and a Labor Health Management Officer (full-time) and have submitted to the Northern Region Labor Inspection Office and the Tainan Administration Bureau for approval.
Reporting the damage caused by operations of the contractors
The company has set up the "Contractor Environment Safety and Health Management Regulations" and supervises the contractors to comply with the following: 1. The contractor shall, according to the scale and nature of its operations, put up a qualified safety and
health management officer or an on-site person in charge of implementing safety and health management.
2. All the personnel employed by the contractor entering the Company premises to work shall be insured with the labor insurance policy and the National Health Insurance.
3. The laborers employed by the contractor or its subcontractors shall go through the Company's "Contractor Hazard Information Training Course" first before they are allowed to start work in the
-54-
Item Content
Company. 4. Only properly trained and qualified personnel shall operate any dangerous machineries or equipment.
They should prepare the "Machine and Equipment Inspection Certificate" and the "Operator Training Certificate" ready for inspection.
5. The contractor shall conduct construction safety assessment first when they enter our factory before performing any construction and they shall provide a construction application form (and shall clearly fill out the job classifications, job sites, and the names of the construction workers).
Environment Management And Occupational Health and Safety Assessment Series (OHSAS) Certification
1. The company passed the ISO 140001 and the OHSAS 18001 international certification in 2011 and 2012 respectively. During the operational procedures in the performance of the Company's manufacturing processes, products and services, the Company was able to effectively manage any negative impact on the environment, the unacceptable risks involved in safety and health, or the matters that do not conform to the demands of the environment, safety and health regulations. The company also continues to improve the overall environment, safety and health performance of the Company.
2. The business commitment of the Company is to actively implement our promise to protect the environment, safety and health of our personnel. Our environment, safety and health policies are: to comply with the regulations, implement energy conservation, promote safety and health, and continue to improve our performance in these areas.
Physical Health
1. Physical check-up: provide assistance for the physical check-up of new employees; annual regular physical checkups in accordance with the Occupational Safety and Health Act for all regular employees.
2. Work Environmental Health: hired a full-time cleaning staff to clean the premises, banned smoking in the place of work, set up a smoking area, hold health lectures, CPR first aid training, regular carpet cleaning and disinfection in the office area.
Psychological Health
1. Educational Training: provide pressure (emotional) management and communication skills courses, publicize related counseling activities and articles
2. Expression of opinions: Set up a dedicated discussion forum on the internet website. Aside from providing information for the retrieval of our colleagues, it also provides a learning channel for the discussions, expression of opinions, venting of emotions, and interactions.
3. Employees Assistance Program (EAP): In cooperation with the Hsinchu Lifeline Association and through third party professional consulting service, our colleagues can request for assistance in handling psychological, legal, financial, medical, management, and other matters related to the daily life or work activities of the employees. Each employee is given three consultation service opportunities for free.
Insurance and Medical Benefits
1. In accordance with the provisions of the Labor Insurance Act, we insure all our employees with the government labor insurance (including occupational accident insurance) and health insurance. We arrange with private insurance companies to provide our employees with life insurance, accident insurance and medical insurance, hospital and cancer medical insurance and other group insurance protection and the Company pays the whole amount of the insurance policy premium.
2. The insurance company provides hospitalization and cancer treatment insurance for the employees' spouses and children, and hospitalization daily allowance insurance for the employees' parents, and the Company provides subsidy of up to 66% of the insurance premium. If the employees' spouses, children and parents become sick, then the insurance claims will provide relief and help to the employees and their dependents.
3. The company insured all the employees with an accident insurance coverage of NT$ 3 million. If the employees became disabled or died because of an accident while in the performance of duties, the insurance claims will provide relief and help to the employees or their heirs.
2. Environmental Conservation Expense 2.1. The total amount of the losses (including compensation) and penalties resulting from environmental
pollution in the latest year and as of the date of printing of the annual report: None. 2.2. Countermeasures (including improvement measures) and the total estimated amount of the possible
expenditures (including possible losses, penalties and compensation resulting from not taking countermeasures, for which, if the amount cannot be reasonably estimated, its reason shall be explained): The Company’s major product is E-beam inspection equipment and no environmental pollution has occurred in the product process, so this issue is not applicable to the Company.
-55-
3. Code of Conduct HMI has prepared and established an employee code of conduct or code of ethics for the compliance of the employees and observance of proper behavior during their daily work. We advocate this in the course of new employee training and to our regular employees from time to time. This is to strengthen the employees' integrity and values and for each and everyone to observe. Both the employers and the employees of this company use the Labor Standards Act as the basis. We adopt humane management system in our organization and the relationship between labor and management is harmonious and there were no labor disputes that created losses for the Company. From here on, with the labor and management maintaining a mutual cooperation and growth to nurture the relationship, we expect that there will be no labor disputes and should see no danger of suffering any losses.
VII. Financial Status, Operating Results and Status of Risk Management 1. Financial Status 1.1. Consolidate Report
Unit: NT$1,000
Item 2013 2014 Change % of Change
Current assets 11,444,474 14,297,574 2,853,100 25%
Funds and investments 4,412 7,450 3038 69%
Property, plant and equipment 334,590 749,531 414,941 124%
Intangible assets 10,632 12,357 1,725 16%
Other assets 57,429 59,564 2,135 4%
Total assets 11,851,537 15,126,476 3,274,939 28%
Current liabilities 2,034,405 3,162,439 1,128,034 55%
Non-current liabilities 84,100 89,073 4,973 6%
Total liabilities 2,118,505 3,251,512 1,133,007 53%
Analysis of deviation over 20%: (1) Increase in current assets: Mainly due to increase in cash and cash equivalents. (2) Increase in funds and investments: Mainly due to increase in available for sale financial asset- non current. (3) Increase in property, plant and equipment: Mainly due to capital expenditure of the new manufacturing
facility. (4) Increase in total assets: Mainly due to increase in current assets. (5) Increase in current liabilities: Mainly due to increase in other payables and provisions for liabilities- current. (6) Increase in total liabilities: Mainly due to increase in current liabilities. (7) Increase in retained earnings: Mainly due to increase in net income. (8) Increase in other equity: Mainly due to foreign exchange fluctuation. (9) Increase in minority interest: Mainly due to increase in net income. (10) Increase in total equity: Mainly due to increase in net income.
-56-
1.2. Parent Company Unit: NT$1,000
Item 2013 2014 Change % of Change
Current asset 10,716,351 13,141,462 2,425,111 23%
Funds and investments 820,448 947,430 126,982 15%
Property, plant and equipment 268,730 681,954 413,224 154%
Intangible assets 5,028 8,392 3,364 67%
Other assets 48,746 52,179 3,433 7%
Total assets 11,859,303 14,831,417 2,972,114 25%
Current Liabilities 2,080,797 2,914,483 833,686 40%
Analysis of deviation over 20%: (1) Increase in current assets: Mainly due to increase in cash and cash equivalents and accounts receivable. (2) Increase in property, plant and equipment: Mainly due to capital expenditure of the new manufacturing
facility. (3) Increase in intangible assets: Mainly due to acquisision of intangible assets. (4) Increase in total assets: Mainly due to increase in current assets. (5) Increase in current liabilities: Mainly due to increase in other payables and provisions for liabilities- current. (6) Increase in total liabilities: Mainly due to increase in current liabilities. (7) Increase in retained earnings: Mainly due to increase in net income. (8) Increase in other equity: Mainly due to foreign exchange fluctuation. (9) Increase in total equity: Mainly due to increase in net income.
Non-operating income and expenses 144,010 426,263 282,253 196%
Net income before income tax 2,555,531 3,654,543 1,099,012 43%
Income tax expense 208,256 412,607 204,351 98%
Net income 2,347,275 3,241,936 894,661 38%
Other comprehensive income, net of tax 34,003 30,011 -3,992 -12%
Total comprehensive income 2,381,278 3,271,947 890,669 37%
Analysis of deviation over 20%: (1) Increase in net sales: Mainly due to increase in market demand. (2) Increase in operating costs: Mainly due to increase in operating costs associated with higher sales. (3) Increase in gross margin and operating income: Mainly due to increase in market demand. (4) Increase in operating expenses: Mainly due to increase in R&D expenses (5) Increase in non-operating income and expenses: Mainly due to favorable foreign exchange fluctuation. (6) Increase in net income before income tax, net income, and total comprehensive income: Mainly due to
revenue growth. (7) Increase in income tax expense: Mainly due to increase in net income.
Non-operating income and expenses 144,010 490,005 210,706 75%
Net income before income tax 2,555,531 3,591,298 1,070,713 42%
Income tax expense 208,256 353,370 176,385 100%
Net income 2,347,275 3,237,928 894,328 38%
Other comprehensive income, net of tax 34,003 27,354 -5,745 -17%
Total comprehensive income 2,381,278 3,265,282 888,583 37%
Analysis of deviation over 20%: (1) Increase in net sales: Mainly due to increase in market demand. (2) Increase in operating costs: Mainly due to increase in operating costs associated with higher sales. (3) Increase in gross margin and operating income: Mainly due to increase in market demand. (4) Increase in operating expenses: Mainly due to increase in R&D expenses (5) Increase in non-operating income and expenses: Mainly due to favorable foreign exchange fluctuation. (6) Increase in net income before income tax, net income, and total comprehensive income: Mainly due to
revenue growth. (7) Increase in income tax expense: Mainly due to increase in net income.
3. Cash Flow Analysis
3.1 Consolidate Report Unit: NT$1,000
Cash balance on
Dec. 31, 2013
Net cash provided by
operating activities in
2014
Net cash used in
investing and financing
activities
Cash balance on
Dec. 31, 2014
Remedy for cash
shortfall (investment
and financing plan)
5,370,702 3,129,610 ( 1,103,841) 7,396,471 Not Applicable
3.1.1. Analysis of change in cashflow in 2014 Operating activities: Net cash inflow of NT$3,129,961 thousand was mainly from operating profits. Investing activities: Net cash inflow of NT$32,159 thousand, mainly due to disposals of bond investment;
partly offset by acquisition of financial assets and, property, plant and equipment. Financing activities: Net cash outflow of NT$ 1,136,000 due to the distribution of earnings. 3.1.2. Remedial Actions for Cash Shortfall: HMI has ample cash on-hand; remedial actions are not required. 3.1.3. Cash Flow Projection for Next Year: Not applicable. 3.2 Parent Company
Unit: NT$1,000
Cash balance on
Dec. 31, 2013
Net cash provided by
operating activities in
2014
Net cash used in
investing and financing
activities
Cash balance on
Dec. 31, 2014
Remedy for cash
shortfall (investment
and financing plan)
5,189,811 3,132,299 ( 1,091,927) 7,230,183 Not Applicable
3.2.1. Analysis of change in cashflow in 2014 Operating activities: Net cash inflow of NT$3,132,299 thousand was mainly from operating profits. Investing activities: Net cash inflow of NT$44,073 thousand, mainly due to disposals of bond investment;
partly offset by acquisition of financial assets and, property, plant and equipment. Financing activities: Net cash outflow of NT$ 1,136,000 due to the distribution of earnings. 3.2.2. Remedial Actions for Cash Shortfall: HMI has ample cash on-hand; remedial actions are not required. 3.2.3. Cash Flow Projection for Next Year: Not applicable.
-58-
4. Major Capital Expenditure
Major Capital Expenditure and Source of Funding Unit: NT$1,000
Plan Actual or
planned source
of capital
Estimated Capital
Requirement
(as of Dec 31, 2014)
Status of actual or projected use of capital
2011 2012 2013 2014
Production
facilities, R&D and
production
equipment
Cash flow
generated from
operations
734,574 52,499 46,416 146,627 489,032
Intangible Assets
- Software, IPs
and Patents
Cash flow
generated from
operations
26,879 8,420 5,601 6,240 6,618
The construction of HMI’s new manufacturing plant located in Tainan Science Park was started in 2013 and will be completed in March 2015. This is expected to substantially increase the production capacity of HMI and will meet the demands for the e-beam inspection tools of the advanced semiconductor processes.
5. Investment Policies HMI’s investment plan is in accordance with the Company's internal control system and the "Acquisition or Disposition of Assets Handling Procedures". On the trans-investment management policies, the finance department regularly collects and analyzes the financial statements of the invested enterprises, understands the working conditions of the invested enterprises, and is responsible for the management of matters related to the invested enterprises. Also, HMI has established the "Regulations for the Supervision and Management of Subsidiaries", "Related Party Transaction Policies and Procedures" and "Specific Companies, Conglomerates, and Related Party Transaction Operation Procedures" as the standards to follow with regard to the operation management of the invested enterprises. Following the standards of the "Guidelines for the Establishment of Internal Control Systems of Public Companies", implement the monitoring and management operation of the invested enterprises.
Unit: NT$1,000
Subsidiaries Investment policy 2014 Investment
Profit & Loss
Main Reasons for
Profit or Loss
Improvement
Plans
Future Investment
Plans
HMI
Holdings Inc. Investment 77,973
Profit & loss in investing HMI Korea,
HMI Japan, HMI Investment Corp.,
and Ansing International LLC. -
Depends on operating
conditions
HMI Investment
Corp. Investment 60,359
Profit & loss in investing in Hermes
Microvision, Inc.(USA) - Depends on operating
conditions
Hermes
Microvision,
Inc.(USA)
Research and
Development Center 60,359
Mainly due to increase in operating
revenue and good cost control,
resulting in HMI USA gaining profit -
Depends on operating
conditions
Hermes Microvision
Korea Inc.
Sales & support services
for e-beam inspection
tools & components 4,790
Mainly due to increase in operating
revenue and good cost control,
resulting in HMI Korea gaining profit -
Depends on operating
conditions
Hermes Microvision
Japan Inc.
Sales & support services
for e-beam inspection
tools & components 5,761
Mainly due to increase in operating
revenue and good cost control,
resulting in HMI Japan gaining profit -
Depends on operating
conditions
Ansing International
LLC. Investment 7,063 Profit & loss in investing HMI Beijing -
Depends on operating
conditions
Hermes Microvision
Co., Ltd.
(Beijing)
Research, development,
production and technical
support services of
semiconductor machines
and equipment
7,063
Mainly due to increase in operating
revenue and good cost control,
resulting in HMI Beijing gaining profit -
Depends on operating
conditions
-59-
6. Risk Management 6.1. Risks Associated with Interest Rate Fluctuation, Foreign Exchange Volatility, and Inflation
6.1.1. Interest rate: In terms of changes in interest rates, the main impact on HMI is the cash flow risk due to interest rate changes. The main reason is the floating rate of fixed-term deposits. With regards to the time period of the fixed-term deposits, HMI normally uses the shorter days of deposit to minimize the impact of floating interest rate and safeguard the assets and maintain its liquidity. Overall, HMI's risk due to changes in the interest rate is minimal.
6.1.2. Exchange Rate: With regards to changes in the exchange rate, the foreign exchange risks came mainly from the U.S. dollars denominated purchases and sales. Aside from using a natural offsetting principle, HMI maintains close contact with the banks and assigned specific persons to gather related information for judging the future trend of exchange rate. HMI also regularly reviews the difference between assets and liabilities in USD and if necessary, undertake a forward foreign exchange contract at the appropriate time or hedging instruments like foreign currency swaps in order to reduce the impact of exchange rate changes on the Company. Please refer to the financial statements for the disclosure regarding foreign exchange sensitivity and risk exposure.
6.1.3. Inflation: In the aspect of inflation, as of the date of printing of the annual report, it did not have significant impact on the Company’s business operation. However, the Company will keep a keen eye on any change of the circumstance, and take countermeasures whenever required.
6.2. Risks Associated with High-Risk/High-Leveraged Investment; Lending, Endorsements, and Guarantees
for Other Parties; and Financial Derivative Transactions The Company has prudent financial management, and has never engaged in high risk and high leverage investment. In addition, the Company has already set up its “regulations governing management of lending capital to others”, “regulations governing management of endorsements and guarantees” and “asset acquisition and disposal handling procedure” for its personnel across the Company to comply with. Also, as of the date of printing of the annual report, the Company had not engaged in any high-risk and high-leverage investment, lent its capital to others and given any endorsements or guarantees. In addition, for the derivative products engaged by the Company, instead of the trading purpose, the Company has held currency forward contracts to hedge the currency risk which may arise from business operations. Furthermore, the Company only deals with qualified banks, so it shall have no material credit risk. Also, the gain or loss on exchange and hedge items can cancel each other out, so the Company shall have no material market risk.
6.3. Future R&D plans and expected R&D spending In response to the demands of the FAB manufacturing process diversification and dimensional shrinkage, the constant upgrading of inspection methods to effectively inspect the increasingly smaller defects, immediately and promptly reflect the present situations and analyze the cause of failure hidden within the structure, and thus accelerate the development pace and quickly reach a higher production with high yields. This is the objective of the Company's future development of the next generation e-beam inspection tools and equipment. The Company's future research and development emphasis will focus on the following directions: 1. Continue to improve the image resolution and defect detection rate: Strengthen the electron optical
system capability, strengthen the stability of the wafer movement, and strengthen the defect signal to noise ratio (S/N ratio).
2. Continue to improve the defect inspection speed: Enhance the electron optical system processing speed, and improve the computing power of the computer.
-60-
3. Continue to improve the computing capability of the advanced pattern matching: With a high resolution e-beam imaging coupled with semiconductor design pattern comparison, the defects can be detected at a glance. The Company will focus on enhancing the computing capability of pattern matching in order to satisfy the stringent demands of the customer for a higher production yield in an advanced manufacturing process.
4. Development of the next generation inspection tools and equipment: In order to comply with the future large demands of the semiconductor companies to use the e-beam inspection technology in replacing the present optical inspection tools, the Company will also develop a breakthrough e-beam inspection technology to satisfy the market application demands for a higher speed and higher resolution inspection tool.
5. The development of newly emerging application of semiconductor technology: The new generation of machines will take into considerations the future cutting-edge technology needed and its application by the semiconductor industry, such as the extreme ultraviolet (EUV) mask defect inspection system, the nanoimprint lithography (NIL) imprint defect inspection, the FinFET 3D transistor structure defect inspection, and other potential technologies that could become the mainstream technology.
Through constant innovation and R&D, the Company mastered the key technology of wafer inspection tools. In order to maintain its competitiveness in the industry, the R&D expenses for the year 2013 and 2014 was more than NT$ 700 million and NT$ 950 million respectively. This shows that the Company attaches great importance to the development of technologies. The amount of R&D in the future is forecasted to be maintained for at least 13 to 15% of the operating revenues annually. Depending on the operating conditions and industry trends, the Company will make appropriate adjustment in order to strengthen its competitive advantage in the market. 6.4. Risk Associated with Changes in the Political and Regulatory Environment On Apr. 16, 2002, the Executive Yuan, through order Yuan-Tai-Chin-Tzu No. 0910083707, directed the Ministry of Economic Affairs to establish the Semiconductor Industry Promotion Office (SIPO) to be in charge of the overall planning, promotion, and evaluation of the country's semiconductor industry development. At the same time, establish a single window responsible for inter-ministerial coordination, investment promotions, and understand the difficulties being encountered by the investment plans of companies, and actively coordinate at all levels to exclude the investment barriers. At the present stage, the government is actively promoting the domestic semiconductor industry to proceed in producing high added value products and to undertake technology research and development. It is advocating the domestic self-development of semiconductor facilities, in order to enhance the self-sufficiency capability of the country's semiconductor equipment manufacturers, reducing the degree of reliance on foreign semiconductor equipment, and assist in the technology industrialization and help push the industry momentum. The Company produces the e-beam inspection tools using exclusive leap type scanning inspection and stable electron gun technology and provides the semiconductor manufacturers with a more advanced inspection tool and technology. This assists them in effectively improving the front-end manufacturing process performance. The focus of the Company's future research and development will continue to center on the next generation inspection tools needed by the semiconductor manufacturing companies. This, in turn, will fit in with the direction of the government's present and future promotion of the semiconductor industry. The Company's business operation complements with the industrial policy of the government. It has a positive effect on the Company's financial operations and it also works together to create a win-win situation. Furthermore, in accordance with the provisions of the Financial Supervisory Commission, starting 2013, all publicly traded companies shall use the interpretations and announcements of the International Financial Reporting Standards, International Accounting Standards (hereinafter referred to as IFRS) as well as the Regulations Governing the Preparation of Financial Reports by Securities Issuers in preparing their financial reports. The effects of adopting the IFRS include changing the ways of expressing certain parts of the accounting treatment and financial reporting. The Company has completed the switch over to the IFRS
-61-
reporting according to regulations since 2013. Please refer to the applicable 2013 Consolidated Annual Financial Reports for all the new and revised standards and interpretations. In summary, the Company's daily operations are in compliance with relevant laws and regulations at home and abroad, and the Company always pays attention to the development trend of domestic and foreign policies and the situation changes in laws and regulations. The Company also collects relevant information and disseminates this information to all levels for their policy decision reference in order to adjust the Company's underlying business strategy. So far, the Company has not experienced any significant impact on the Company's financial operations due to important domestic and foreign policy and legal changes. 6.5. Impact of New Technology and Industry Changes 6.5.1 . Impact of new technology In order to reduce production costs and let the ICs have higher levels of functionalities and processing speed, the design node of the semiconductor industry will evolve towards the trend of miniaturization.
The technology roadmap announced by Intel
Source: Published in June 2011 Intel Technology Roadmap
Based on the Intel published technology roadmap in June 2011, it is estimated that by 2013, 2015 and 2017, the manufacturing capabilities will evolve towards the 14 nm, 10 nm and 7 nm geometry respectively. This shows that the manufacturing process line width will become thinner and the demand for better accuracy will increase following the reduction of the manufacturing process line width. As the line width is already thinner than the inspection limits of the conventional optical inspection methods can inspect, and with the increasing density of the IC patterns and complexities of the manufacturing process, it is making the manufacturing process yields of the 45 nm and below geometry face an enormous challenge. Consequently, with the high resolution e-beam inspection system possessed by the Company, the importance to the future advanced manufacturing process development of large semiconductor companies will be especially important.
-62-
Source: the Company
Currently, the wafer defect inspection of the FAB production line uses mostly the optical detection tools. However, with the advent of nanotechnology generation, the optical inspection tool starts experiencing bottlenecks in the 90 nm and below manufacturing process. As shown above, using the 25 nm DRAM manufacturing process as an example, 10% of the defects need to be assisted by e-beam inspection tools before the deep ultraviolet (DUV) inspection machines can detect the defects; there are 10% defects that only an e-beam inspection system can detect; and there is another 5% that needs the Company's manufacturing process monitoring system eP3 before it can be detected. Therefore, in the continuing miniaturization of the semiconductor advanced manufacturing processes, the e-beam inspection tools of the Company will have considerable growth potential.
Defect inspection plans as proposed by large advanced semiconductor manufacturers
Source: the Company
From the defect inspection plans proposed by the large advanced semiconductor manufacturers, we can see that from the design node of 65 nm of 2006 all the way to the 45/40 nm of 2008, 32/28 nm of 2010, and in the coming years of 2012, 2014, and 2016, the design nodes will continue to shrink to the 22/20 nm, 16/14 nm, and 11/10 nm geometry. Due to the fact that, from 45 nm and below manufacturing processes, the conventional optical image inspection method cannot already clearly detect the wafer defects, plus the
Defects that the e-beam scanning
inspection system cannot detect (the
target market of our company’s eP3
equipment)
Defects that can only be detected by
the e-beam inspection system
Only through the assistance of the
e-beam inspection system that the
DUV bright field inspection machines
can detect the defects
Applications of the conventional
bright field inspection machines
Design Node /Year
The e-beam scanning inspection system starts assisting the DUV bright field inspection machine to detect defects
eScan320 has become the only inspection machine for some important manufacturing process site
There are more micro physical defects that the DUV inspection machine cannot detect
Multiple types of e-beam scanning inspection machines will replace the DUV bright field inspection machines in advance manufacturing processes
Multiple types of e-beam scanning inspection platform
-63-
density of the IC design and manufacturing processes becoming increasingly complex, therefore the e-beam inspection tools with high resolution functions produced by the Company will become an indispensable important weapon for the manufacturing process development of the large semiconductor manufacturing companies. 6.5.2. The Company's response measures Due to the advances in technology and in response to the e-beam scanning pixel size and design node going towards the trend of miniaturization, the Company has already provided a number of different models of products with special characteristics to cope with the industry technology changes and meet the different needs of the customers.
Source: the Company
From the above chart, we can see that in the continuous scanning series, the Company has introduced the eScan 400, which was heavily adopted by memory manufacturers; in the leap scans series, the Company has already launched the eScan 310, eScan 315, eScan 315xp and the eScan 320 one after another, providing customers with e-beam scan pixel size of 5 nm leading technology equipment to help fab users to manage yield rate effectively in 28/20nm node; in hotspot inspection series, HMI provided eP3 with 3nm resolution to address advanced technology nodes in-line monitoring market. Nevertheless, the combined leap scans and continuous type integrated system equipment eScan 500 and NGP (Next Generation Platform) were also successfully introduced into the market in late 2013. eScan 500 is the new flagship model directed at the design node of 16/14 nm manufacturing process wafer inspection machine and it shows that the R&D technology and machine integration capability of the Company is remarkable. The Company can also respond to technology changes and continue to introduce new models of e-beam scanning machines with higher resolutions that meet the demand for a continually growing smaller pixel size machine in the market. In summary, the Company's industry leading high resolution e-beam scanning machine development time frame fully supports, and even exceeds, the technology development blueprint of the large semiconductor manufacturing companies. Therefore, when large semiconductor manufacturing companies study the advanced manufacturing process development in the future, they will rely more on the e-beam scanning inspection machines launched by the Company. However, for the semiconductor manufacturers to maintain their technological leadership during the economic downturn, they will have to unceasingly develop more advanced manufacturing processes in order to continue their competitiveness and pull away from their competitors when the economy improves. Therefore, the R&D trend of the semiconductor
-64-
manufacturers will not stop their development of new manufacturing processes during fluctuations of the economy. The economic cycles of the industry will not produce significant fluctuations for the Company. The Company already has a plan in response to the future technology changes in the industry. The tools and equipment produced by the Company are in line with the future development of the semiconductor manufacturing processes and in accordance with its plans, research, development and manufacture, so that the financial operations of the Company will not be greatly affected by any changes in the technology industry. The main products of the Company have been widely accepted by our customers and the market demand continues to expand. The Company is also actively increasing its production capacity and R&D capability and we also have in our grasp the industry developments and the information of our peers in the market. We adopt prudent financial management strategy in order to maintain our market competitiveness. The Company will continue to pay attention to the future science and technology related changes and situations, and to assess its impact on Company's operations, and make corresponding adjustments to strengthen the Company's business development and financial position.
6.6. Changes in Corporate Image and Impact on Company’s Crisis Management The Company always upholds the principles of integrity and professional management, attach great importance to the corporate image and risk management, and there were no major events that affected the Company's corporate image.
6.7. Risks Associated with Mergers and Acquisitions The Company has no present plans of mergers and acquisitions. Should there be any merger and acquisition plans in the future, the Company shall maintain an attitude founded on the basis of intrinsic careful assessment, taking into considerations whether the mergers or acquisitions will bring specific and comprehensive benefits to the Company in order to protect the interests of the Company and the shareholders' rights and interests.
6.8. Risks Associated with Plant Expansion In response to the industry needs and in coordination with the Company's growth plans and to fit in with the Company's expected target, starting the 3rd quarter of 2013, the construction of a new factory building had begun in the Southern Taiwan Science Park and installation of the factory systems and facilities was initiated. If there is no corresponding increase in revenues for the increase in engineering, personnel and other operating costs, it is going to create a negative impact on the Company's finances. Consequently, aside from working closely together with the customers and maximizing the value of the technology in order to strengthening the customer relationship and the market share, the Company also continues to strive to develop the most advanced technology in order to meet the increasingly sophisticated market demands of the semiconductor industry and maintain its leading position in the advance technology of the semiconductor front-end manufacturing process equipment. As of the annual report publication date, the Company's factory expansion plan is progressing normally according to schedule.
6.9. Risks Associated with Purchase Concentration and Sales Concentration The product of the Company is the e-beam inspection tool and it is mainly used in the inspection of defects through scanning of the wafer. The e-beam related modules are the key modules of the Company. It mainly consists of the power supply and the electron gun module. The e-beam inspection tools system was the original design of the Company and more than 80% of the key modules are manufactured within our own group of companies. The main items of materials purchased are the wafer transfer or carrier module, e-beam assembly, and the vacuum system components. The purchase amount of the Company in the recent three years coming from a single supplier accounting for more than 10% of the total purchases consists of only one supplier and the purchased amount was less than 15% of the annual consolidated net purchases. This doesn't constitute a purchase concentration and there were no significant unusual transactions. If it is ordinary components, the Company will always maintain 2 or more suppliers in principle and they will be those who have frequent contacts with us and are the more stable cooperative
-65-
suppliers. When making any procurement, aside from following the normal procedure of price inquiries and comparisons to select the best quality products and good stable supply sources of vendors, the Company also always observes the changes in the market situation and tries to understand the market price. We also conduct price negotiations with our existing suppliers to reduce our purchase costs from time to time. The Company is an upstream semiconductor equipment supplier. In response to the different needs of the equipment users, the Company needs to plan and design special machines based on their key technologies, plant configurations and manufacturing processes. The Company has the experience of integrating hardware and software systems and after sales maintenance capabilities that meet the needs of the users. Due to the fact that the equipment produced by the Company are customized, with high precision and high price characteristics, it is easy to have a situation where sales concentration may happen if during the current year the customer has a plant expansion and capital expenditure plans and then accordingly purchase related equipment in big volumes. However since 2013, the Company already has a good understanding and grasp of important American customers, and there were no customers, including the semiconductor manufacturing companies with advanced manufacturing processes, who have the situation of sales concentration. In addition to the establishment of good working relationship with the existing customer base, the Company also actively develops new customers at home and abroad in order to reduce the risks of sales concentration. 6.10. Risks Associated with Sales of Significant Numbers of Shares by HMI’s Directors and Major
Shareholders Who Own 10% or More of HMI’s Total Outstanding Shares All the transfers or replacements of the Company's equity shares by the directors follow the relevant laws and regulations for equity trading and they don't have any significant impact on the Company's operations.
6.11. Risks Associated with Change in Management The Company's management team is committed to the sustainable development of the Company and in the recent years up to the publication of the annual report, there were no changes in the management team of the Company.
6.12. Risks Associated with Litigations 6.12.1. From the recent years up until the annual report publication date, legal cases of the Company with
decisions rendered or presently still under litigation, non-litigation, or administrative litigation where the results of which may impact materially the rights and interests of the shareholders or the price of the securities, then the facts of the disputes, the amount involved in the litigation, the start date of the litigation, the major parties involved in the suit, and how it is presently being handled should be disclosed: None.
6.12.2. The Company directors, supervisors, president, and the real person in charge of the Company holding more than 10% of the Company's equity shares or its affiliated companies, who are with legal cases with decisions already rendered or presently still under litigation, non-litigation, or administrative litigation, the results of which may impact materially the rights and interests of the stockholder or the price of the securities: None.
6.13. Other material risks: None.
-66-
VIII. Other Special Notes 1. HMI Affiliates 1.1. HMI affiliated companies chart
1.2. HMI Affiliated Companies
As of Dec. 31, 2014; Unit: Foreign Currency 1,000
Company Name Date of
Incorporation Address Capital Stock Major Business
Hermes Microvision,
Inc.(USA)
Mar. 29, 2004 1762 Automation Parkway, San Jose,
CA95131 USA
US$ 31,179 Research and
Development Center
HMI Holdings Inc. June 16, 2008 Level 2, Lotemau Centre, Vaea Street,
Ansing International LLC. Dec. 22, 2008 113, Barksdale Professional Center,
Newark DE 19711-3258, Delaware, U.S.A.
* Investment
Hermes Microvision Co.,
Ltd. (Beijing)
May 18, 2009 3rd Floor, No. 8 Liye Road, Beijing
International Information Industry Base,
Dingsi Road, Changping District, Beijing
* Research, development,
production and technical
support services of
semiconductor machines
and equipment
HMI Investment Corp. Oct 31, 2014 Portcullis TrustNet Chambers, Maxkar
Building, P.O.Box 1225, Apia, Samoa.
US$ 21,547 Investment
* A limited company, capital shares not available.
Hermes Microvision, Inc.
HMI Holdings Inc.
Hermes Microvision Korea Inc.
Hermes Microvision Japan Inc.
Ansing International LLC.
HMI Investment Corp.
Hermes Microvision, Inc. (USA)
Hermes Microvision Co., Ltd. (Beijing)
94 %
100%
100% 100% 100% 100%
100%
-67-
1.3. Common Shareholders of HMI and Its Subsidiaries or Its Affiliates with Actual of Deemed Control: None.
1.4. Business Scope of HMI and Its Affiliated Companies Business scope of HMI and its affiliates include research, development, design, manufacturing and sales of e-beam inspection tools as well as providing the technical support and services.
1.5. List of Directors, Supervisors and Presidents of HMI’s Affiliated Companies
As of Dec. 31, 2014; Unit: share; %
Company Name Title Name or representative Shares % of holding
Hermes Microvision,
Inc.(USA)
Responsible Person
Director
Director
President
Hwang, Ming-Chi
Shu, Chin-Yung
Jack Y. Jau
Chen, Chung-Wei
-
-
27,500
12,500
-
-
0.04
0.01
HMI Holdings Inc. Director
Director
Pan, Chung-Shih
Shen, Hsiao-Lien
-
-
-
-
Hermes Microvision
Korea Inc.
Responsible Person
Director
Director
Supervisor
Hwang, Ming-Chi
Shu, Chin-Yung
Jack Y. Jau
Chen, Ming
-
-
-
-
-
-
-
-
Hermes Microvision
Japan Inc.
Responsible Person
Director
Director
Supervisor
Eguchi Naoya
Hwang, Ming-Chi
Shu, Chin-Yung
Chen, Ming
-
-
-
-
-
-
-
-
Ansing International
LLC. Director Hmi Holdings Inc. - 100
Hermes Microvision Co.,
Ltd. (Beijing)
Chairman
Director
Director
Supervisor
Chen, Chung-Wei
Wang, Yi-Hsiang
Shen, Hsiao-Lien
Pan, Chung-Shih
-
-
-
-
-
-
-
-
HMI Investment Corp. Director
Director
Pan, Chung-Shih
Shen, Hsiao-Lien - 100
-68-
1.6. Operating status of respective affiliated enterprises As of Dec. 31, 2014; Unit: NT$1,000
Name Capital Assets Liabilities Net worth Net sales Operating
Note: The amount of capital, asset, liabilities and net worth in this table were calculated using the exchange rate at end of 2014. The net sales,
operating income, net income and EPS numbers were calculated using the average exchange rate in 2014.
2. Private placement of securities: None.
3. Holding or Disposition of HMI Stocks by Subsidiaries: None.
4. Any Events that Had Significant Impacts on Shareholders’ Rights or Security Prices as Stated in Item 2 Paragraph 2 of Article 36 of Securities and Exchange Law of Taiwan: None.
5. Other Necessary Supplement: None.
-69-
IX. Financial Information 1. Consolidated Balance Sheet 1.1. 2012-2014 Condensed balance sheet of HMI and subsidiaries
Unit: NT$1,000
2012 2013 2014
Current asset 4,971,559 11,444,474 14,297,574
Funds and investments - 4,412 7,450
Property, plant and equipment 170,246 334,590 749,531
Intangible assets 10,717 10,632 12,357
Other assets 35,137 57,429 59,564
Total assets 5,187,659 11,851,537 15,126,476
Current Liabilities Before appropriation 1,198,662 2,034,405 3,162,439
After appropriation 1,990,662 3,170,405 (Note)
Non-current liabilities 88,954 84,100 89,073
Total liabilities Before appropriation 1,287,616 2,118,505 3,251,512
After appropriation 2,079,616 3,254,505 (Note)
Equity attributable to owners of the parent company 3,867,032 9,694,406 11,827,861
Capital stock 660,000 710,000 710,000
Capital surplus 1,234,348 5,427,023 5,431,196
Retained earnings Before appropriation 1,980,820 3,542,426 5,637,015
After appropriation 1,188,820 2,406,426 (Note)
Other equity ( 8,136) 14,957 49,650
Treasury Stock - - -
Non-controlling interest 33,011 38,626 47,103
Total equity Before appropriation 3,900,043 9,733,032 11,874,964
After appropriation 3,108,043 8,597,032 (Note)
Note: Pending on approval of shareholders at Annual General Shareholders’ Meeting. 1.2. 2010-2011 Condensed Balance Sheet of HMI and subsidiaries by ROC GAAP
Unit: NT$1,000
2010 2011
Current asset 2,586,099 2,523,151
Funds and investments 0 0
Property, plant and equipment 132,117 149,988
Intangible assets 29,664 27,080
Other assets 28,254 56,292
Total assets 2,776,134 2,756,521
Current Liabilities Before appropriation 2,007,502 1,291,480
After appropriation 2,007,502 1,555,480
Long-term liabilities 26,480 37,123
Other liabilities 0 0
Total liabilities Before appropriation 2,033,982 1,328,603
After appropriation 2,033,982 1,592,603
Capital stock 600,000 600,000
Capital surplus 0 0
Retained earnings Before appropriation 149,616 797,137
After appropriation 149,616 533,137
Unrealized gains from financial instruments 0 0
Accumulated conversion adjustment (18,186) 9,690
Net loss not recognized as pension cost (2,598) 0
Total equity Before appropriation 742,152 1,427,918
After appropriation 742,152 1,163,918
-70-
1.3. 2012-2014 Condensed Balance Sheet – Parent Company Unit: NT$1,000
2012 2013 2014
Current asset 4,607,056 10,716,351 13,141,462
Funds and investments 584,338 820,448 947,430
Property, plant and equipment 110,596 268,730 681,954
Intangible assets 5,467 5,028 8,392
Other assets 27,267 48,746 52,179
Total assets 5,334,724 11,859,303 14,831,417
Current Liabilities Before appropriation 1,382,210 2,080,797 2,914,483
After appropriation 2,174,210 3,216,797 (Note)
Non-current liabilities 85,482 84,100 89,073
Total liabilities Before appropriation 1,467,692 2,164,897 3,003,556
After appropriation 2,259,692 3,300,897 (Note)
Equity attributable to owners of the parent company Not Applicable Not Applicable Not Applicable
Capital stock 660,000 710,000 710,000 Capital surplus 1,234,348 5,427,023 5,431,196
Retained earnings Before appropriation 1,980,820 3,542,426 5,637,015
After appropriation 1,188,820 2,406,426 (Note)
Other equity ( 8,136) 14,957 49,650
Total equity Before appropriation 3,867,032 9,694,406 11,827,861
After appropriation 3,075,032 8,558,406 (Note)
Note: Pending on approval of shareholders at Annual General Shareholders’ Meeting. 1.4. 2010-2011 Condensed Balance Sheet – Parent Company by ROC GAAP
2010 2011
Current asset 2,179,545 2,237,300
Funds and investments 495,643 479,107
Property, plant and equipment 102,111 100,919
Intangible assets 26,354 22,615
Other assets 23,163 49,030
Total assets 2,826,816 2,888,971
Current Liabilities Before appropriation 2,072,628 1,446,148
After appropriation 2,072,628 1,710,148
Long-term liabilities - -
Other liabilities 25,356 35,996
Total liabilities Before appropriation 2,097,984 1,482,144
After appropriation 2,097,984 1,746,144
Capital stock 600,000 600,000
Capital surplus - -
Retained earnings Before appropriation 149,616 797,137
After appropriation 149,616 533,137
Unrealized gains from financial instruments - -
Accumulated conversion adjustment (18,186) 9,690
Net loss not recognized as pension cost (2,598) -
Total equity Before appropriation 728,832 1,406,827
After appropriation 728,832 1,142,827
-71-
2. Condensed Income Statement 2.1. 2012-2014 Condensed income statement of HMI and subsidiaries
Unit: NT$1,000
2012 2013 2014
Net sales 4,179,904 5,340,043 7,209,650
Operating costs 1,199,056 1,581,584 2,143,885
Gross margin 2,980,848 3,758,459 5,065,765
Operating expenses 1,273,532 1,346,938 1,837,485
Operating income 1,707,316 2,411,521 3,228,280
Non-operating income and expenses ( 40,247) 144,010 426,263
Net income before income tax 1,667,069 2,555,531 3,654,543
Income tax expense 146,640 208,256 412,607
Net income 1,520,429 2,347,275 3,241,936
Other comprehensive income, net of tax (35,846) 34,003 30,011
Total comprehensive income 1,484,583 2,381,278 3,271,947
Net income attributable to:
Owners of the parent 1,517,166 2,343,600 3,237,928
Non-controlling interest 3,263 3,675 4,008
Total comprehensive income attributable to:
Owners of the parent 1,482,618 2,376,699 3,265,282
Non-controlling interest 1,965 4,579 6,665
Earnings per share (NT$) 23.34 35.09 45.60
2.2. 2010-2011 Condensed income statement of HMI and subsidiaries by ROC GAAP
Unit: NT$1,000
2010 2011
Net sales 1,545,309 2,677,955
Operating costs 594,436 869,826
Gross margin 950,873 1,808,129
Operating expenses 830,669 1,118,444
Operating income 120,204 689,685
Non-operating income and gains 36,442 95,310
Non-operating expenses and losses 64,753 39,673
Income from continuing operations before income tax 91,893 745,322
Net income 251,140 654,232
Earnings per share (NT$) 5.69 10.87
-72-
2.3. 2012-2014 Condensed income statement– Parent Company Unit: NT$1,000
2012 2013 2014
Net sales 4,174,028 5,487,228 7,390,177
Operating costs 1,330,571 1,938,262 2,496,856
Gross margin 2,843,457 3,548,866 4,893,321
Operating expenses 1,235,610 1,307,580 1,792,028
Operating income 1,607,847 2,241,286 3,101,293
Non-operating income and expenses 38,002 279,299 490,005
Net income before income tax 1,645,849 2,520,585 3,591,298
Income tax expense 128,683 176,985 353,370
Net income 1,517,166 2,343,600 3,237,928
Other comprehensive income, net of tax ( 34,548) 33,099 27,354
Total comprehensive income 1,482,618 2,376,699 3,265,282
Earnings per share (NT$) 23.34 35.09 45.60
2.4. 2010-2011 Condensed income statement– Parent Company by ROC GAAP
Unit: NT$1,000
2010 2011
Net sales 1,523,060 2,646,436
Operating costs 692,470 985,460
Gross margin 830,590 1,660,976
Operating expenses 775,810 917,479
Operating income 54,780 743,497
Non-operating income and gains 235,188 124,310
Non-operating expenses and losses 38,828 139,713
Income from continuing operations before income tax 251,140 728,094
Net income 251,140 652,242
Earnings per share (NT$) 5.69 10.87
3. Independent Auditors’ Opinions Consolidated
Year Name of Auditors (CPA) CPA Firm Audit Opinion
Ratio of long-term investment to property, plant and equipment
2,343 2,934 1,596
Liquidity %
Current ratio 414.76 562.55 452.11
Quick ratio 305.3 486.17 393.95
Times interest earned 287.2 9,535,546 -
Operating performance
Receivables turnover ratio (times) 5.54 4.42 3.39
Average collection days 66 83 108
Inventory turnover ratio (times) 0.97 1.13 1.31
Payables turnover ratio (times) 15.65 13.01 13.09
Average selling days 376 322 278
Property, plant and equipment turnover ratio (times)
24.55 15.96 9.62
Total assets turnover ratio (times) 0.81 0.45 1.91
Profitability
Return on assets (%) 31.96 22.87 24.03
Return on shareholders’ equity (%) 57.64 34.44 30.01
Ratio of net income before tax to paid-in capital (%) (note 7)
252.59 359.93 514.72
Net profit ratio (%) 36.37 43.96 44.97
EPS (NT$) 23.30 35.04 45.55
Cash flows
Cash flow ratio (%) 155 106.70 98.96
Cash flow adequacy ratio (%) 118.53 133.79 152.96
Cash re-investment ratio (%) 38.49 13.84 16.40
Leverage Degree of operational leverage 1.04 1.02 1.02
Degree of financial leverage 1.00 1.00 1.00
Changes that exceed 20% in the past two years and explanation for those changes: (1) Ratio of long-term investment to property, plant and equipment: Mainly due to capital expenditure in new
manufacturing plant in Tainan. (2) Liquidity: Mainly due to increase in sales reveune and no bank borrowing in 2014. (3) Operating performance: Due to the significant increase in sales revenue in 4Q14, the amount of account
receivables also increased by magnitudes. Thus result in the increase in average collection days. The sales revenue of 2014 increased 35% annually comparing to 2013, result in the decrease in receivables turnover ratio and average selling days. The construction of the new manufacturing plant caused the decrease in total asset turnover ratio.
(4)Profitability: The better profitabilitu ratios were mainly due to the growth in sales revenue and operating profitability.
Financial structure (%) Ratio of liabilities to assets 73.27 48.20
Ratio of long-term investment to property, plant and equipment 581.78 976.71
Liquidity %
Current ratio 128.82 195.37
Quick ratio 74.51 100.87
Times interest earned 3.77 43.76
Operating performance
Receivables turnover ratio (times) 1.98 3.85
Average collection days 184 95
Inventory turnover ratio (times) 0.48 0.77
Payables turnover ratio (times) 4.67 12.31
Average selling days 765 474
Property, plant and equipment turnover ratio (times) 11.70 17.85
Total assets turnover ratio (times) 0.56 0.97
-74-
Profitability
Return on assets (%) 9.41 20.15
Return on shareholders’ equity (%) 100.63 60.30
Ratio of operating income to paid-in capital (%) (note 7) 20.03 114.95
Ratio of net income before tax to paid-in capital (%) (note 7) 15.32 124.22
Net profit ratio (%) 16.25 24.43
EPS (NT$) 5.69 10.87
Cash flows
Cash flow ratio (%) 0 63.59
Cash flow adequacy ratio (%) 0 812.01
Cash re-investment ratio (%) 0 52.42
Leverage Degree of operational leverage 1.37 1.07
Degree of financial leverage 1.38 1.03
4.3. 2012-2014 Financial Analysis – Parent Company
2012 2013 2014
Financial structure (%)
Ratio of liabilities to assets 27.51 18.25 20.25
Ratio of long-term investment to property, plant and equipment
3,574 3,639 1,747
Liquidity %
Current ratio 333.31 515.01 450.90
Quick ratio 267.6 473.23 422.27
Times interest earned 283.6 9,405,169 -
Operating performance
Receivables turnover ratio (times) 4.12 3.66 3.32
Average collection days 89 100 110
Inventory turnover ratio (times) 1.51 2.22 2.98
Payables turnover ratio (times) 6.37 6.34 9.22
Average selling days 242 165 123
Property, plant and equipment turnover ratio (times)
37.74 20.42 10.84
Total assets turnover ratio (times) 0.78 0.46 0.50
Profitability
Return on assets (%) 30.82 27.26 24.26
Return on shareholders’ equity (%) 58.12 34.56 30.09
Ratio of net income before tax to paid-in capital (%) (note 7)
249.37 355.01 505.82
Net profit ratio (%) 36.35 42.71 43.81
EPS (NT$) 23.30 35.04 45.55
Cash flows
Cash flow ratio (%) 118.15 112.88 107.47
Cash flow adequacy ratio (%) 316.20 284.63 240.79
Cash re-investment ratio (%) 33.68 15.78 16.59
Leverage Degree of operational leverage 1.03 1.02 1.01
Degree of financial leverage 1.00 1.00 1.00
Changes that exceed 20% in the past two years and explanation for those changes: (1) Ratio of long-term investment to property, plant and equipment: Mainly due to capital expenditure in new
manufacturing plant in Tainan. (2) Liquidity: Mainly due to increase in sales reveune and no bank borrowing in 2014. (3) Inventory turnover ratio: Mainly due to the improvement in profitability and higher inventory level comparing to
2013. (4) Property, plant and equipment turnover ratio: Mainly due to capital expenditure in new manufacturing plant in
Tainan. (5) Payables turnover ratio: Mainly due to the improvement in profitability and liquidity. (6) Average selling days: Mainly due to the increase in the amount of sales revenue and account receivables. (7) Profitability: The better profitabilitu ratios were mainly due to the growth in sales revenue and operating
profitability. (8) Cash flows: The rowth in sales revenue and operating profitability resulted in better cashflow ratios.
-75-
4.3. 2010-2011 Financial Analysis – Parent Company by ROC GAAP
2010 2011
Financial structure (%) Ratio of liabilities to assets 74.22 51.30
Ratio of long-term investment to property, plant and equipment 713.76 1,394.02
Liquidity %
Current ratio 105.16 154.71
Quick ratio 69.12 93.13
Times interest earned 32.87 42.77
Operating performance
Receivables turnover ratio (times) 2.49 3.57
Average collection days 146 102
Inventory turnover ratio (times) 0.90 1.07
Payables turnover ratio (times) 3.28 6.17
Average selling days 405 341
Property, plant and equipment turnover ratio (times) 14.92 26.07
Total assets turnover ratio (times) 0.54 0.93
Profitability
Return on assets (%) 11.38 23.37
Return on shareholders’ equity (%) 103.39 61.08
Ratio of operating income to paid-in capital (%) (note 7) 9.13 123.92
Ratio of net income before tax to paid-in capital (%) (note 7) 41.86 121.35
Net profit ratio (%) 16.49 24.65
EPS (NT$) 5.69 10.87
Cash flows
Cash flow ratio (%) (70.07) 55.85
Cash flow adequacy ratio (%) (198.54) (108.34)
Cash re-investment ratio (%) (179.20) 53.38
Leverage Degree of operational leverage 10.51 3.00
Degree of financial leverage 1.17 1.02
The calculation formulae below shall be listed at the end of the annual financial report:
1.Financial structure
(1)Ratio of liabilities to assets = Total liabilities / Total Assets
(2)Ratio of long-term investment to property, plant and equipment = (Total equity + Non-current Liabilities) / Net property, plant and
equipment
2.Solvency
(1)Current Ratio = Current asset / Current Liabilities
(2)Quick Ratio = (Current asset – Inventory - Prepaid expense) / Current Liabilities
(3)Times interest earned = Net profit before income tax and interest expense / Interest expenses of the period
3.Operation ability
(1) Turnover of receivables (including receivables and accounts/notes receivable from sales) = net sales / average receivables for each
period (including receivables and accounts/notes receivable from sales)
(2)Average collection days = 365 / Receivables turnover ratio
(3)Inventory turnover ratio = sales cost / Average inventory
(4) Payables (including accounts payable and notes payable from business) turnover ratio = Sales cost / Balance of average payables
(including accounts payable and notes payable from business)
(5)Average Selling days = 365 / Inventory turnover ratio
(6) Property, plant and equipment turnover ratio = Net sales / Net average property, plant and equipment
(7)Total assets turnover ratio = Net sales / average total assets
4.Profitability
(1)Return on assets = [Profit or loss after tax + Interest expense × (1 - Tax rate)] / average total assets
(2)Return on shareholders’ equity = Profit or loss after tax / Average total shareholders’ equity
(3)Net profit ratio = Profit or loss after tax / Net sales
(4)EPS = (Equity attributable to owners of the parent company - Dividends of preferred stock) / Weighted average shares issued (Note 4)
5.Cash flows
(1)Cash flow ratio = Net cash flows of operating activities / Current Liabilities
(2) Net cash flow adequacy ratio = Net cash flows of operating activities in latest 5 years / (Capital expense + Increase in inventories +
Cash Dividends) in last 5 years
(3)Cash re-investment ratio = (Net cash flows of operating activities - Cash Dividends) / (Gross of property, plant and equipment +
Long-term investments + Other non-current asset + Working capital) (Note 5)
6.Leverage:
(1)Degree of operational leverage = (Net operating revenue - Variable operating costs and expenses) / Operating profit (Note 6).
Note 4: For the aforesaid EPS calculation formula, please pay special attention to the following matters in calculation:
1. Instead of using the number of the shares issued before the end of the year as the basis, the weighted average number of the shares of
the common stock shall prevail
2. Those that have seasoned equity offering or treasury stock transactions shall take their circulation period into account in calculation of
the weighted average number of the shares.
3. For those that have capital increase by earnings recapitalization or by capital surplus as stock dividend, the calculation of the EPS for the
past year or past half year shall be adjusted according to the ratio of the capital increase without considering the issuance period of the
increased capital.
4. In the case that the preferred stock is a non-convertible accumulated preferred stock, its dividend (no matter whether it is released or not)
of the year in question shall be deducted from the net income after tax or added to the after-tax net loss. If the preferred stock is not in
the accumulative character and there is a net income after tax, its dividend shall be deducted from the net income after tax whereas no
adjustment is required if there is a loss.
Note 5: When giving the cash flow analysis, please pay special attention to the following matters:
1. Operating activity net cash flow refers to the amount of the operating activity net cash flow shown in the cash flow statement.
2. Capital expenditure refers to the amount of the cash outflow from each year’s capital investment.
3. The amount of inventory increase shall not be calculated unless the amount of the ending balance is greater than that of the beginning
balance. If the inventory reduces at the end of the year, it shall be calculated as zero.
4. Cash dividend covers the cash dividends of common stock and preferred stock.
5. The gross amount of property, plant and equipment refers to the total amount of property, plant and equipment before deducting
accumulated depreciation.
Note 6: The issuer shall divide a variety of operating costs and expenses into fixed and current amounts according to their characteristics. In case
of involving estimation or subjective judgment, attention shall be paid to their rationality and consistency.
Note 7: If a company’s stock is a no-par stock, or its face value is not at NT$10 per share, calculation of the ratio of it to the paid-in capital shall be
replaced by the ratio of the owner of parent shown in the balance sheet.
5. Key performance indicators for HMI’s business 2012 2013 2014
The ratio of operating revenue of the advanced process (2Xnm and below) 43% 56% 68%
Annual growth rate of Sales 56% 28% 35%
Annual growth rate of operating income 147% 41% 34%
Annual growth rate of net income after tax 132% 54% 38%
-77-
6. Audit Committee’s Review Report
Hermes Microvision, Inc. Audit Committee’s Review Report
The Financial Statements of Hermes Microvision, Inc. in fiscal year 2014 have been duly audited by PricewaterhouseCoopers and are believed to fairly represent the financial standing, operation results and cash flows of Hermes Microvision, Inc.. The Audit Committee has duly reviewed the Financial Statements along with the Business Report and proposal for profits distribution and hereby verify that they comply with the requirements of Company Law and relevant regulations. This report is duly submitted in accordance with Article 219 of the Company Law, and I, as the Chairman of the Audit Committee hereby submit this report.
To Hermes Microvision, Inc. 2015 Annual General Shareholders’ Meeting Hermes Microvision, Inc. Chairman of the Audit Committee: Han-Liang Hu March 4, 2015
Financial Statements
~1~
REPORT OF INDEPENDENT ACCOUNTANTS
PWCR14000186
To Hermes Microvision, Inc.
We have audited the accompanying consolidated balance sheets of Hermes Microvision, Inc. and its subsidiaries
as of December 31, 2014 and 2013, and the related consolidated statements of comprehensive income, of
changes in equity and of cash flows for the years then ended. These consolidated financial statements are the
responsibility of the Company’s management. Our responsibility is to express an opinion on these consolidated
financial statements based on our audits.
We conducted our audits in accordance with the “Regulations Governing Auditing and Attestation of Financial
Statements by Certified Public Accountants” and generally accepted auditing standards in the Republic of China.
Those standards require that we plan and perform the audit to obtain reasonable assurance about whether the
financial statements are free of material misstatement. An audit includes examining, on a test basis, evidence
supporting the amounts and disclosures in the financial statements. An audit also includes assessing the
accounting principles used and significant estimates made by management, as well as evaluating the overall
financial statement presentation. We believe that our audits provide a reasonable basis for our opinion.
In our opinion, the accompanying consolidated financial statements referred to above present fairly, in all
material respects, the financial position of Hermes Microvision, Inc. and its subsidiaries as of December 31,
2014 and 2013, and the results of their operations and their cash flows for the years then ended in conformity
with the “Rules Governing the Preparation of Financial Statements by Securities Issuers” and the International
Financial Reporting Standards, International Accounting Standards, IFRIC Interpretations, and SIC
Interpretations as endorsed by the Financial Supervisory Commission.
We have also audited the parent company only financial statements of Hermes Microvision, Inc. as of the years
ended December 31, 2014 and 2013. In our report dated March 4, 2015 we expressed an unqualified opinion on
these financial statements.
PricewaterhouseCoopers, Taiwan
Hsinchu, Taiwan
Republic of China
March 4, 2015 ------------------------------------------------------------------------------------------------------------------------------------------------- The accompanying consolidated financial statements are not intended to present the financial position and results of operations and cash flows in accordance with accounting principles generally accepted in countries and jurisdictions other than the Republic of China. The standards, procedures and practices in the Republic of China governing the audit of such financial statements may differ from those generally accepted in countries and jurisdictions other than the Republic of China. Accordingly, the accompanying consolidated financial statements and report of independent accountants are not intended for use by those who are not informed about the accounting principles or auditing standards generally accepted in the Republic of China, and their applications in practice.
HERMES MICROVISION, INC. AND SUBSIDIARIES CONSOLIDATED BALANCE SHEETS
DECEMBER 31 (Expressed in thousands of New Taiwan dollars)
(Expressed in thousands of New Taiwan dollars, except as otherwise indicated)
Notes 2014 2013
The accompanying notes are an integral part of these consolidated financial statements.
~6~
CASH FLOWS FROM OPERATING ACTIVITIES Profit before tax for the year $ 3,654,543 $ 2,555,531 Adjustments to reconcile profit before tax to net cash provided by operating
activities
Income and expenses having no effect on cash flows (Reversal of allowance) provision for doubtful accounts 7,505 ( 67,806 ) Depreciation 6(7)(20) 57,322 53,766 Amortization 6(8)(20) 5,110 6,440 Revaluation of financial assets at fair value ( 1,805 ) - (Gain)loss on disposal of property, plant, equipment and intangible
assets
( 27 ) 42 Compensation cost of employee stock option 6(11)(21) 2,817 2,827 Compensation cost of stock appreciation right 6(11)(21) 573,702 112,465 Interest income 6(18) ( 70,115 ) ( 24,284 ) Changes in assets/liabilities relating to operating activities Net changes in assets relating to operating activities Accounts receivable 6(5) ( 1,104,891 ) ( 640,660 ) Accounts receivable - related parties 7 ( 6,767 ) ( 13,063 ) Other receivables 10,302 7,050 Inventories 6(6) ( 192,628 ) ( 229,323 ) Prepayments ( 56,734 ) ( 4,816 ) Other current assets 28,900 ( 30,597 ) Net changes in liabilities relating to operating activities Accounts payable 27,856 56,591 Accounts payable - related parties 7 ( 328 ) 328 Other payables ( 129,957 ) 110,726 Other payables - related parties 7 ( 9,446 ) 6,606 Provisions for liabilities 6(12) 498,879 395,002 Other current liabilities 82,114 2,066 Other non - current liabilities ( 2,132 ) ( 3,237 ) Cash generated from operations 3,374,220 2,295,654 Interest received 69,844 24,284 Income tax paid ( 314,454 ) ( 149,292 ) Net cash provided by operating activities 3,129,610 2,170,646 CASH FLOWS FROM INVESTING ACTIVITIES Increase in financial assets at fair value through profit or loss ( 1,100,000 ) - Proceeds from disposal (acquisition) of bond investments without active
markets-current
1,625,085 ( 2,891,085 ) Acquisition of available - for - sales financial assets - non - current ( 3,038 ) ( 4,412 ) Acquisition of property, plant and equipment 6(7)(24) ( 489,032 ) ( 146,627 ) Proceeds from disposal of property, plant, equipment and intangible assets 38 612 Acquisition of intangible assets 6(8) ( 6,618 ) ( 6,240 ) Proceeds from disposal of intangible assets - 47 Increased in deposits - out ( 632 ) ( 686 ) Net cash provided by (used in) investing activities 25,803 ( 3,048,391 ) CASH FLOWS FROM FINANCING ACTIVITIES Cash dividends paid ( 1,136,000 ) ( 792,000 ) Proceeds from issuance of common stock - 4,302,575 Cost of acquisition of capital - ( 64,539 ) Net cash (used in) provided by financing activities ( 1,136,000 ) 3,446,036 Effect of exchange rate 6,356 26,103 Increase in cash and cash equivalents 2,025,769 2,594,394 Cash and cash equivalents at beginning of year 6(1) 5,370,702 2,776,308 Cash and cash equivalents at end of year 6(1) $ 7,396,471 $ 5,370,702
~7~
HERMES MICROVISION, INC. AND SUBSIDIARIES
NOTES TO THE CONSOLIDATED FINANCIAL STATEMENTS
FOR THE YEARS ENDED DECEMBER 31, 2014 AND 2013
(EXPRESSED IN THOUSANDS OF NEW TAIWAN DOLLARS,
EXCEPT AS OTHERWISE INDICATED)
1. HISTORY AND ORGANIZATION
Hermes Microvision, Inc. (the “Company”) was incorporated on May 19, 2003. The Company and its
subsidiaries (collectively referred herein as the “Group”) are engaged in the research, development,
design, manufacturing and sale of precision instruments and machinery (electronic inspection
equipment.) The Company’s stock was listed on the GreTai Securities Market, effective from May 21,
2012. The Company obtained the certification of Corporate Governance Assessment 6009 by Taiwan
Corporate Governance Association on December 31, 2014.
2. THE DATE OF AUTHORIZATION FOR ISSUANCE OF THE CONSOLIDATED FINANCIAL
STATEMENTS AND PROCEDURES FOR AUTHORIZATION
These consolidated financial statements were authorized for issuance by the Board of Directors on
March 4, 2015.
3. APPLICATION OF NEW STANDARDS, AMENDMENTS AND INTERPRETATIONS
(1) Effect of the adoption of new issuances of or amendments to International Financial Reporting
Standards (“IFRS”) as endorsed by the Financial Supervisory Commission (“FSC”)
None.
(2) Effect of new issuances of or amendments to IFRSs as endorsed by the FSC but not yet adopted by
the Group
According to Financial-Supervisory-Securities-Auditing No. 1030010325 issued on April 3, 2014,
commencing 2015, companies with shares listed on the TWSE or traded on the Taiwan GreTai
Securities Market or Emerging Stock Market shall adopt the 2013 version of IFRS (not including
IFRS 9, ‘Financial instruments’) as endorsed by the FSC and the "Regulations Governing the
Preparation of Financial Reports by Securities Issuers " effective January 1, 2015 (collectively
referred herein as the “2013 version of IFRSs) in preparing the consolidated financial statements.
The related new standards, interpretations and amendments are listed below:
New Standards, Interpretations and Amendments
Effective Date by
International
Accounting
Standards Board
Limited exemption from comparative IFRS 7 disclosures for first-time
adopters (amendment to IFRS 1)
July 1, 2010
~8~
Based on the Group’s assessment, the adoption of the 2013 version of IFRS has no significant
impact on the consolidated financial statements of the Group, except for the following:
A.IAS 19 (revised), ‘Employee benefits’
The revised standard the eliminates the corridor approach and requires actuarial gains and losses
to be recognised immediately in other comprehensive income. Past service costs will be
recognised immediately in the period incurred. Net interest expense or income, calculated by
applying the discount rate to the net defined benefit asset or liability, replace the finance charge
and expected return on plan assets. The return of plan assets, excluding net interest expense, is
recognised in other comprehensive income. An entity is required to recognise termination
benefits at the earlier of when the entity can no longer withdraw an offer of those benefits or
when it recognises any related restructuring costs. Additional disclosures are required to present
how defined benefit plans may affect the amount, timing and uncertainty of the entity’s future
cash flows.
New Standards, Interpretations and Amendments
Effective Date by
International
Accounting
Standards Board
Government loans (amendment to IFRS 1) January 1, 2013
Disclosures - transfers of financial assets (amendment to IFRS 7) July 1, 2011
Disclosures—Offsetting financial assets and financial liabilities
(amendment to IFRS 7)
January 1, 2013
IFRS 10, ‘Consolidated financial statements’ January 1, 2013
(Investment entities:
January 1, 2014)
IFRS 11,‘Joint arrangements’ January 1, 2013
IFRS 12,‘Disclosure of interests in other entities’ January 1, 2013
IFRS 13, ‘Fair value measurement’ January 1, 2013
Presentation of items of other comprehensive income (amendment to IAS 1) July 1, 2012
Deferred tax: recovery of underlying assets (amendment to IAS 12) January 1, 2012
IAS 19 (revised),‘Employee benefits’ January 1, 2013
IAS 27,‘Separate financial statements’ (as amended in 2011) January 1, 2013
IAS 28,‘Investments in associates and joint ventures’(as amended in 2011) January 1, 2013
Offsetting financial assets and financial liabilities (amendment to IAS 32) January 1, 2014
IFRIC 20, ‘Stripping costs in the production phase of a surface mine’ January 1, 2013
Improvements to IFRSs 2010 January 1, 2011
Improvements to IFRSs 2009-2011 January 1, 2013
Severe hyperinflation and removal of fixed dates for first-time adopters
(amendment to IFRS 1)
July 1, 2011
~9~
The Group expected to recognise previously unrecognised past service cost and as a consequence
of elimination of the corridor approach to recognise prior unrecognised actuarial losses by
decreasing operating expenses $32 and other comprehensive income would be increased by $32
for the year ended December 31, 2014.
B.IAS 1, ‘Presentation of financial statements’
The amendment requires entities to separate items presented in OCI classified by nature into two
groups on the basis of whether they are potentially reclassifiable to profit or loss subsequently
when specific conditions are met. If the items are presented before tax then the tax related to each
of the two groups of OCI items (those that might be reclassified and those that will not be
reclassified) must be shown separately. Accordingly, the Group will adjust its presentation of the
statement of comprehensive income.
C.IFRS 12, ‘Disclosure of interests in other entities’
The standard integrates the disclosure requirements for subsidiaries, joint arrangements,
associates and unconsolidated structured entities. And the Group will disclose additional
information about its interests in consolidated entities and unconsolidated entities accordingly.
D.IFRS 13, ‘Fair value measurement’
The standard defines fair value as the price that would be received to sell an asset or paid to
transfer a liability in an orderly transaction between market participants at the measurement date.
The standard sets out a framework for measuring fair value using the assumptions that market
participants would use when pricing the asset or liability; for non-financial assets, fair value is
determined based on the highest and best use of the asset. And, the standard requires disclosures
about fair value measurements. Based on the Group’s assessment, the adoption of the standard
has no significant impact on its consolidated financial statements, and the Group will disclose
additional information about fair value measurements accordingly.
(3) IFRSs issued by IASB but not yet endorsed by the FSC
New standards, interpretations and amendments issued by IASB but not yet included in the 2013
version of IFRS as endorsed by the FSC:
New Standards, Interpretations and Amendments
Effective Date by
International Accounting
Standards Board
IFRS 9, ‘Financial instruments' January 1, 2018
Sale or contribution of assets between an investor and its associate or
joint venture (amendments to IFRS 10 and IAS 28)
January 1, 2016
Investment entities: applying the consolidation exception (amendments
to IFRS 10, IFRS 12 and IAS 28)
January 1, 2016
~10~
The Group is assessing the potential impact of the new standards, interpretations and amendments
above and has not yet been able to reliably estimate their impact on the consolidated financial
statements.
4. SUMMARY OF SIGNIFICANT ACCOUNTING POLICIES
The principal accounting policies applied in the preparation of these consolidated financial statements
are set out below. These policies have been consistently applied to all the periods presented, unless
otherwise stated.
(1) Compliance statement
The consolidated financial statements of the Group have been prepared in accordance with the
“Regulations Governing the Preparation of Financial Reports by Securities Issuers” and the
International Financial Reporting Standards, International Accounting Standards, IFRIC
Interpretations, and SIC Interpretations as endorsed by the FSC (collectively referred herein as the
“IFRSs”).
(2) Basis of preparation
A.Except for the following items, these consolidated financial statements have been prepared under
the historical cost convention:
(a)Financial assets and financial liabilities (including derivative insturments) at fair value through
New Standards, Interpretations and Amendments
Effective Date by
International Accounting
Accounting for acquisition of interests in joint operations
(amendments to IFRS 11)
January 1, 2016
IFRS 14, 'Regulatory deferral accounts' January 1, 2016
IFRS 15, ‘Revenue from contracts with customers' January 1, 2017
Disclosure initiative (amendments to IAS 1) January 1, 2016
Clarification of acceptable methods of depreciation and amortisation
(amendments to IAS 16 and IAS 38)
January 1, 2016
Agriculture: bearer plants (amendments to IAS 16 and IAS 41) January 1, 2016
Defined benefit plans: employee contributions
(amendments to IAS 19R)
July 1, 2014
Equity method in separate financial statements (amendments to IAS 27) January 1, 2016
Recoverable amount disclosures for non-financial assets
(amendments to IAS 36)
January 1, 2014
Novation of derivatives and continuation of hedge accounting
(amendments to IAS 39)
January 1, 2014
IFRIC 21, ‘Levies’ January 1, 2014
Improvements to IFRSs 2010-2012 July 1, 2014
Improvements to IFRSs 2011-2013 July 1, 2014
Improvements to IFRSs 2012-2014 January 1, 2016
~11~
profit or loss.
(b)Available-for-sale financial assets measured at fair value.
(c)Liabilities on cash-settled share-based payment arrangement measured at fair value.
(d)Defined benefit liabilities recognized based on the net amount of pension fund assets less
unrecognized actuarial gains and present value of defined benefit obligation.
B. The preparation of financial statements in conformity with International Financial Reporting
Standards, International Accounting Standards, IFRIC Interpretations, and SIC Interpretations as
endorsed by the FSC (collectively referred herein as the “IFRSs”) requires the use of certain
critical accounting estimates. It also requires management to exercise its judgment in the
process of applying the Group’s accounting policies. The areas involving a higher degree of
judgment or complexity, or areas where assumptions and estimates are significant to the
consolidated financial statements are disclosed in Note 5.
(3) Basis of consolidation
A. Basis for preparation of consolidated financial statements:
(a)All subsidiaries are included in the Group’s consolidated financial statements. Subsidiaries are
all entities (including special purpose entities) over which the Group has the power to govern
the financial and operating policies. In general, control is presumed to exist when the parent
owns, directly or indirectly through subsidiaries, more than half of the voting power of an
entity. The existence and effect of potential voting rights that are currently exercisable or
convertible have been considered when assessing whether the Group controls another entity.
Subsidiaries are fully consolidated from the date on which control is transferred to the Group.
They are de-consolidated from the date that control ceases.
(b)Inter-company transactions, balances and unrealized gains or losses on transactions between
companies within the Group are eliminated. Accounting policies of subsidiaries have been
adjusted where necessary to ensure consistency with the policies adopted by the Group.
(c)Profit or loss and each component of other comprehensive income are attributed to the owners
of the parent and to the non-controlling interests. Total comprehensive income is attributed to
the owners of the parent and to the non-controlling interests even if this results in the
non-controlling interests having a deficit balance.
(d)Changes in a parent’s ownership interest in a subsidiary that do not result in the parent losing
control of the subsidiary (transactions with non-controlling interests) are accounted for as
equity transactions, i.e. transactions with owners in their capacity as owners. Any difference
between the amount by which the non-controlling interests are adjusted and the fair value of
the consideration paid or received is recognized directly in equity.
(e)When the Group loses control of a subsidiary, the Group remeasures any investment retained
in the former subsidiary at its fair value. Any difference between fair value and carrying
~12~
amount is recognized in profit or loss. All amounts previously recognized in other
comprehensive income in relation to the subsidiary are reclassified to profit or loss, on the
same basis as would be required if the related assets or liabilities were disposed of. That is,
when the Group loses control of a subsidiary, all gains or losses previously recognized in other
comprehensive income in relation to the subsidiary should be reclassified from equity to profit
or loss, if such gains or losses would be reclassified to profit or loss when the related assets or
liabilities are disposed of.
B. Subsidiaries included in the consolidated financial statements:
Note: Considering the operation of group organization, the Board of Directors had approved the
adjustment of the organization. That is, invests subsidiaries through HMI Holdings Inc.
C. Subsidiaries not included in the consolidated financial statements: None.
D. Adjustments for subsidiaries with different balance sheet dates: None.
E. Nature and extent of the restrictions on fund remittance from subsidiaries to the parent company:
None.
(4) Foreign currency translation
Items included in the financial statements of each of the Group’s entities are measured using the
currency of the primary economic environment in which the entity operates (the “functional
currency”). The consolidated financial statements are presented in New Taiwan Dollars, which is
December 31, 2014 December 31, 2013 Note
Hermes
Microvision Inc.
HMI Holdings Inc. Investment holdings 100% 100% -
HMI Holdings Inc. Hermes Microvision
Korea Inc.
Marketing of e-Beam inspection
equipment and its components and
related technical support services
100% 100% -
HMI Holdings Inc. Hermes Microvision
Japan Inc.
Marketing of e-Beam inspection
equipment and its components and
related technical support services
100% 100% -
HMI Holdings Inc. Ansing International
LLC.
Investment holdings 100% 100% -
HMI Holdings Inc. HMI Investment
Corp.
Investment holdings 100% - -
Ansing
International LLC.
Hermes Microvision,
Co., Ltd. (Beijing)
Research, development and
manufacturing of semiconductor
machinery and equipment and
related technical support services
100% 100% -
HMI Investment
Corp.
Hermes Microvision,
Inc. (USA)Research and development center
94% - Note
Hermes
Microvision Inc.
Hermes Microvision,
Inc. (USA)Research and development center
- 94% Note
Name of Investor Name of subsidiary
Main Business
Activities
Percentage of Ownership
~13~
the Company’s functional currency and the Group’s presentation currency.
A.Foreign currency transactions and balances
(a)Foreign currency transactions are translated into the functional currency using the exchange
rates prevailing at the dates of the transactions or valuation where items are remeasured.
Foreign exchange gains and losses resulting from the settlement of such transactions are
recognized in profit or loss in the period in which they arise.
(b)Monetary assets and liabilities denominated in foreign currencies at the period end are
re-translated at the exchange rates prevailing at the balance sheet date. Exchange differences
arising upon re-translation at the balance sheet date are recognized in profit or loss.
(c)Non-monetary assets and liabilities denominated in foreign currencies held at fair value
through profit or loss are re-translated at the exchange rates prevailing at the balance sheet
date; their translation differences are recognized in profit or loss. Non-monetary assets and
liabilities denominated in foreign currencies held at fair value through other comprehensive
income are re-translated at the exchange rates prevailing at the balance sheet date; their
translation differences are recognized in other comprehensive income. However,
non-monetary assets and liabilities denominated in foreign currencies that are not measured at
fair value are translated using the historical exchange rates at the dates of the initial
transactions.
(d)All foreign exchange gains and losses are presented in the statement of comprehensive income
within “other gains and losses”.
B.Translation of foreign operations
(a)The operating results and financial position of all the group entities, associates and jointly
controlled entities that have a functional currency different from the presentation currency are
translated into the presentation currency as follows:
i. Assets and liabilities for each balance sheet presented are translated at the closing
exchange rate at the date of that balance sheet;
ii. Income and expenses for each statement of comprehensive income are translated at
average exchange rates of that periods; and
iii. All resulting exchange differences are recognized in other comprehensive income.
(b)When the foreign operation partially disposed of or sold is a subsidiary, cumulative exchange
differences that were recorded in other comprehensive income are proportionately transferred
to the non-controlling interest in this foreign operation.
(5) Classification of current and non-current items
A.Assets that meet one of the following criteria are classified as current assets; otherwise they are
~14~
classified as non-current assets:
(a)Assets arising from operating activities that are expected to be realized, or are intended to be
sold or consumed within the normal operating cycle;
(b)Assets held mainly for trading purposes;
(c)Assets that are expected to be realized within twelve months from the balance sheet date;
(d)Cash and cash equivalents, excluding restricted cash and cash equivalents and those that are to
be exchanged or used to pay off liabilities more than twelve months after the balance sheet
date.
B.Liabilities that meet one of the following criteria are classified as current liabilities; otherwise
they are classified as non-current liabilities:
(a)Liabilities that are expected to be paid off within the normal operating cycle;
(b)Liabilities arising mainly from trading activities;
(c)Liabilities that are to be paid off within twelve months from the balance sheet date;
(d)Liabilities for which the repayment date cannot be extended unconditionally to more than
twelve months after the balance sheet date. Terms of a liability that could, at the option of the
counterparty, result in its settlement by the issue of equity instruments do not affect its
classification.
(6) Cash and cash equivalents
Cash equivalents refer to short-term, highly liquid investments that are readily convertible to
known amount of cash and which are subject to an insignificant risk of changes in value.
(7) Financial asset at fair value through profit or loss
A.Financial assets at fair value through profit or loss are financial assets held for trading or financial
assets designated as at fair value through profit or loss on initial recognition. Financial assets
are classified in this category of held for trading if acquired principally for the purpose of selling
in the short-term. Derivatives are also categorized as financial assets held for trading unless they
are designated as hedges. Financial assets that meet one of the following criteria are designated as
at fair value through profit or loss on initial recognition:
(a)Hybrid (combined) contracts; or
(b)They eliminate or significantly reduce a measurement or recognition inconsistency; or
(c)They are managed and their performance is evaluated on a fair value basis, in accordance with
a documented risk management or investment strategy.
B.On a regular way purchase or sale basis, financial assets at fair value through profit or loss are
recognised and derecognised using trade date accounting.
C.Financial assets at fair value through profit or loss are initially recognised at fair value. Related
~15~
transaction costs are expensed in profit or loss. These financial assets are subsequently
remeasured and stated at fair value, and any changes in the fair value of these financial assets are
recognised in profit or loss.
(8) Loans and receivables
A.Accounts receivable
Accounts receivable are loans and receivables originated by the entity. They are created by the
entity by selling goods or providing services to customers in the ordinary course of business.
Accounts receivable are initially recognized at fair value and subsequently measured at amortized
cost using the effective interest method, less provision for impairment. However, since short-term
accounts receivable without bearing interest, are subsequently measured at initial invoice amount
as the effect of discounting is immaterial.
B.Bond investments without active market
(a) Bond investments without active market are loans and receivables not originated by the
entity. They are bond investments with fixed or determinable payments that are not quoted in
an active market, and also meet all of the following conditions:
i. Not designated on initial recognition as at fair value through profit or loss;
ii. Not designated on initial recognition as available-for-sale;
iii. Not for which the holder may not recover substantially all of its initial investment, other
than because of credit deterioration.
(b) On a regular way purchase or sale basis, bond investments without active market are
recognized and dercognized using trade date accounting.
(c) Bond investments without active market are initially recognized at fair value on the trade
date plus transaction costs and subsequently measured at amortized cost using the effective
interest method, less provision for impairment. Amortization of a premium or a discount on
such assets is recognized in profit or loss.
(d) Bond investments without active market held by the Group are those time deposits with a
short maturity period but do not qualify as cash equivalents, and they are measured at initial
investment amount as the effect of discounting is immaterial.
(9) Available-for-sale financial assets
A.Available-for-sale financial assets are non-derivatives that are either designated in this category
or not classified in any of the other categories.
B.On a regular way purchase or sale basis, available-for-sale financial assets is recognized and
derecognized using trade date accounting.
C.Available-for-sale financial assets are initially recognized at fair value plus transaction costs.
These financial assets are subsequently remeasured and stated at fair value, and any changes in
the fair value of these financial assets are recognized in other comprehensive income.
~16~
(10) Impairment of financial assets
A.The Group assesses at each balance sheet date whether there is objective evidence that a financial
asset or a group of financial assets is impaired as a result of one or more events that occurred
after the initial recognition of the asset (a ‘loss event’) and that loss event (or events) has an
impact on the estimated future cash flows of the financial asset or group of financial assets that
can be reliably estimated.
B.The criteria that the Group uses to determine whether there is objective evidence of an
impairment loss is as follows:
(a)Significant financial difficulty of the issuer or debtor;
(b)A breach of contract, such as a default or delinquency in interest or principal payments;
(c)The Group, for economic or legal reasons relating to the borrower’s financial difficulty,
granted the borrower a concession that a lender would not otherwise consider;
(d)It becomes probable that the borrower will enter bankruptcy or other financial reorganization;
(e)The disappearance of an active market for that financial asset because of financial difficulties;
(f)Observable data indicating that there is a measurable decrease in the estimated future cash
flows from a group of financial assets since the initial recognition of those assets, although the
decrease cannot yet be identified with the individual financial asset in the group, including
adverse changes in the payment status of borrowers in the group or national or local economic
conditions that correlate with defaults on the assets in the group;
(g)Information about significant changes with an adverse effect that have taken place in the
technology, market, economic or legal environment in which the issuer operates, and indicates
that the cost of the investment in the equity instrument may not be recovered; or
(h)A significant or prolonged decline in the fair value of an investment in an equity instrument
below its cost.
C.When the Group assesses that there has been objective evidence of impairment and an
impairment loss has occurred, accounting for impairment is made as follows according to the
category of financial asset:
(a)Financial assets measured at amortized cost
The amount of the impairment loss is measured as the difference between the asset’s carrying
amount and the present value of estimated future cash flows discounted at the financial asset’s
original effective interest rate, and is recognized in profit or loss. If, in a subsequent periods,
the amount of the impairment loss decreases and the decrease can be related objectively to an
event occurring after the impairment loss was recognized, the previously recognized
impairment loss is reversed through profit or loss to the extent that the carrying amount of the
asset does not exceed its amortized cost that would have been at the date of reversal had the
~17~
impairment loss not been recognized previously. Impairment loss is recognized and reversed
by adjusting the carrying amount of the asset through the use of an impairment allowance
account.
(b)Available-for-sale financial assets
The amount of the impairment loss is measured as the difference between the asset’s
acquisition cost (less any principal repayment and amortisation) and current fair value, less
any impairment loss on that financial asset previously recognized in profit or loss and is
reclassified from “other comprehensive income” to “profit or loss”. Impairment loss of an
investment in an equity instrument recognized in profit or loss shall not be reversed through
profit or loss. Impairment loss is recognized and reversed by adjusting the carrying amount of
the asset through the use of an impairment allowance account.
(11) Derecognition of financial assets
The Group derecognizes a financial asset only when the contractual rights to receive cash flows
expire.
(12) Inventories
Inventories are stated at the lower of cost and net realizable value. Cost is determined using the
weighted-average method. The cost of finished goods and work-in-process comprises raw
materials, direct labor, other direct costs and related production overheads (allocated based on
normal operating capacity). The item by item approach is used in applying the lower of cost and
net realizable value. Net realizable value is the estimated selling price in the ordinary course of
business, less the estimated cost of completion and applicable variable selling expenses.
(13) Property, plant and equipment
A.Property, plant and equipment are initially recorded at cost. Borrowing costs incurred during the
construction periods are capitalized.
B.Subsequent costs are included in the asset’s carrying amount or recognized as a separate asset,
as appropriate, only when it is probable that future economic benefits associated with the item
will flow to the Group and the cost of the item can be measured reliably. The carrying amount of
the replaced part is derecognized. All other repairs and maintenance are charged to profit or loss
during the financial periods in which they are incurred.
C.Property, plant and equipment cost are measured at cost, and are depreciated using the
straight-line method to allocate their cost over their estimated useful lives. Significant
components are depreciated separately.
D.The assets’ residual values, useful lives and depreciation methods are reviewed, and adjusted if
appropriate, at each balance sheet date. If expectations for the assets’ residual values and useful
lives differ from previous estimates or the patterns of consumption of the assets’ future
~18~
economic benefits embodied in the assets have changed significantly, any change is accounted
for as a change in estimate under IAS 8, ‘Accounting Policies, Changes in Accounting Estimates
and Errors’, from the date of the change. The estimated useful lives of property, plant and
equipment are as follows:
(14) Leased assets/ leases (lessee)
Payments made under an operating lease (net of any incentives received from the lessor) are
recognized in profit or loss on a straight-line basis over the lease term.
(15) Intangible assets
Computer software is stated at cost and amortized on a straight-line basis over its estimated useful
life of 3 to 5 years.
(16) Impairment of non-financial assets
The Group assesses at each balance sheet date the recoverable amounts of those assets where there
is an indication that they are impaired. An impairment loss is recognized for the amount by
which the asset’s carrying amount exceeds its recoverable amount. The recoverable amount is the
higher of an asset’s fair value less costs to sell and value in use. When the circumstances or
reasons for recognizing impairment loss for an asset in prior years no longer exist, the impairment
loss shall be reversed to the extent of the loss previously recognized in profit or loss. The
increased carrying amount of an asset attributable to a reversal of an impairment loss shall not
exceed the carrying amount that would have been determined (net of amortization or depreciation )
had no impairment loss been recognized for the asset in prior years.
(17) Notes and accounts payable
Notes and accounts payable are obligations to pay for goods or services that have been acquired in
the ordinary course of business from suppliers. They are recognized initially at fair value and
subsequently measured at amortised cost using the effective interest method. However, since short
- term accounts payable without bearing interest are subsequently measured at initial invoice
amount as the effect of discounting is immaterial.
(18) Derecognition of financial liabilities
Financial liability is derecognized when the obligation under the liability specified in the contract
is discharged or cancelled or expires.
Machinery and equipment 3 ~ 8 years
Computer and communication equipment 5 years
Transportation equipment 5 ~ 10 years
Furniture and fixtures 3~ 7 years
Leasehold improvements 3~ 7 years
Other equipment 3~ 6 years
~19~
(19) Provisions
Provisions for warranties are recognized when the Group has a present legal or constructive
obligation as a result of past events, and it is probable that an outflow of economic resources will
be required to settle the obligation and the amount of the obligation can be reliably estimated.
Provisions are measured at the present value of the expenditures expected to be required to settle
the obligation on the balance sheet date. Provisions are not recognized for future operating losses.
(20) Employee benefits
A.Short-term employee benefits
Short-term employee benefits are measured at the undiscounted amount of the benefits expected
to be paid in respect of service rendered by employees in a period and should be recognized as
expenses in that period when the employees render service.
B.Pensions
a)Defined contribution plans
For defined contribution plans, the contributions are recognized as pension expenses when
they are due on an accrual basis. Prepaid contributions are recognized as an asset to the extent
of a cash refund or a reduction in the future payments.
b)Defined benefit plans
i. Net obligation under a defined benefit plan is defined as the present value of an amount
of pension benefits that employees will receive on retirement for their services with the
Group in current period or prior periods. The liability recognized in the balance sheet in
respect of defined benefit pension plans is the present value of the defined benefit
obligation at the balance sheet date less the fair value of plan assets, together with
adjustments for unrecognized past service costs. The defined benefit net obligation is
calculated annually by independent actuaries using the projected unit credit method. The
rate used to discount is determined by using interest rates of government bonds (at the
balance sheet date).
ii. Actuarial gains and losses arising on defined benefit plans are recognized in other
comprehensive income in the periods in which they arise.
iii. Pension cost for an interim period is calculated on a year-to-date basis by using the
actuarially determined pension cost rate at the end of the prior financial year, adjusted
for significant market fluctuations since that time and for significant curtailments,
settlements, or other significant one-off events. Additionally, the related information is
disclosed accordingly.
~20~
C.Employees’ bonus and directors’ and supervisors’ remuneration
Employees’ bonus and directors’ and supervisors’ remuneration are recognized as expenses and
liabilities, provided that such recognition is required under legal or constructive obligation and
those amounts can be reliably estimated. However, if the accrued amounts for employees’ bonus
and directors’ and supervisors’ remuneration are different from the actual distributed amounts as
resolved by the stockholders at their stockholders’ meeting subsequently, the differences should
be recognized based on the accounting for changes in estimates. The Group calculates the
number of shares of employees’ stock bonus based on the fair value per share at the previous
day of the stockholders’ meeting held in the year following the financial reporting year, and
after taking into account the effects of ex-rights and ex-dividends.
(21) Employee share-based payment
A.For the equity-settled share-based payment arrangements, the employee services received are
measured at the fair value of the equity instruments granted at the grant date, and are recognized
as compensation cost over the vesting periods, with a corresponding adjustment to equity. The
fair value of the equity instruments granted shall reflect the impact of market vesting conditions
and non-market vesting conditions. Compensation cost is subject to adjustment based on the
service conditions that are expected to be satisfied and the estimates of the number of equity
instruments that are expected to vest under the non-market vesting conditions at each balance
sheet date. And ultimately, the amount of compensation cost recognized is based on the number
of equity instruments that eventually vest.
B.For the cash-settled share-based payment arrangements, the employee services received are
measured at the fair value of the liability to pay for those services, and are recognized as
compensation cost and liability over the vesting period. The fair value of the liability shall be
remeasured at each balance sheet date until settled at the settlement date, with any changes in
fair value recognized in profit or loss.
(22) Income tax
A.The tax expense for the periods comprises current and deferred tax. Tax is recognized in profit
or loss, except to the extent that it relates to items recognized in other comprehensive income or
items recognized directly in equity, in which cases the tax is recognized in other comprehensive
income or equity.
B.The current income tax charge is calculated on the basis of the tax laws enacted or substantively
enacted at the balance sheet date in the countries where the Company and its subsidiaries
operate and generate taxable income. Management periodically evaluates positions taken in tax
returns with respect to situations in accordance with applicable tax regulations. It establishes
provisions where appropriate based on the amounts expected to be paid to the tax authorities.
An additional 10% tax is levied on the unappropriated retained earnings and is recorded as
income tax expense in the year the stockholders resolve to retain the earnings.
~21~
C.Deferred tax is recognized, using the balance sheet liability method, on temporary differences
arising between the tax bases of assets and liabilities and their carrying amounts in the
consolidated balance sheet. Deferred tax is provided on temporary differences arising on
investments in subsidiaries, except where the timing of the reversal of the temporary difference
is controlled by the Group and it is probable that the temporary difference will not reverse in the
foreseeable future. Deferred tax is determined using tax rates (and laws) that have been enacted
or substantially enacted by the balance sheet date and are expected to apply when the related
deferred tax asset is realized or the deferred income tax liability is settled.
D.Deferred tax assets are recognized only to the extent that it is probable that future taxable profit
will be available against which the temporary differences can be utilized. At each balance sheet
date, unrecognized and recognized deferred tax assets are reassessed.
E.Current income tax assets and liabilities are offset and the net amount reported in the balance
sheet when there is a legally enforceable right to offset the recognized amounts and there is an
intention to settle on a net basis or realize the asset and settle the liability simultaneously.
Deferred tax assets and liabilities are offset on the balance sheet when the entity has the legally
enforceable right to offset current tax assets against current tax liabilities and they are levied by
the same taxation authority on either the same entity or different entities that intend to settle on a
net basis or realize the asset and settle the liability simultaneously.
(23) Share capital
Ordinary shares are classified as equity. Incremental costs directly attributable to the insurance of
new shares or stock options are shown in equity as a deduction, net of tax, from the proceeds.
(24) Dividends
Dividends are recorded in the Company’s financial statements in the periods in which they are
approved by the Company’s shareholders. Cash dividends are recorded as liabilities.
(25) Revenue recognition
The Group manufactures and sells precision instruments and machinery. Revenue is measured at
the fair value of the consideration received or receivable taking into account value-added tax,
returns, rebates and discounts for the sale of goods to external customers in the ordinary course of
the Group’s activities. Revenue arising from the sales of goods should be recognized when the
Group has delivered the goods to the customer, the amount of sales revenue can be measured
reliably and it is probable that the future economic benefits associated with the transaction will
flow to the entity. The delivery of goods is completed when the significant risks and rewards of
ownership have been transferred to the customer, the Group retains neither continuing managerial
involvement to the degree usually associated with ownership nor effective control over the goods
sold, and the customer has accepted the goods based on the sales contract or there is objective
evidence showing that all acceptance provisions have been satisfied.
~22~
(26) Operating segments
Operating segments are reported in a manner consistent with the internal reporting provided to the
chief operating decision-maker. The Group’s chief operating decision-maker, who is responsible
for allocating resources and assessing performance of the operating segments, has been identified
as the Board of Directors that makes strategic decisions.
5. CRITICAL ACCOUNTING JUDGEMENTS, ESTIMATES AND KEY SOURCES OF
ASSUMPTION UNCERTAINTY
The preparation of these consolidated financial statements requires management to make critical
judgements in applying the Group’s accounting policies and make critical assumptions and estimates
concerning future events. Assumptions and estimates may differ from the actual results and are
continually evaluated and adjusted based on historical experience and other factors. Such assumptions
and estimates have a significant risk of causing a material adjustment to the carrying amounts of assets
and liabilities within the next financial year; and the related information is addressed below:
(1) Critical judgments in applying the Group’s accounting policies
None.
(2) Critical accounting estimates and assumptions
The Group makes estimates and assumptions based on the expectation of future events that are
believed to be reasonable under the circumstances at the end of the reporting periods. The resulting
accounting estimates might be different from the related actual results. The estimates and
assumptions that have a significant risk of causing a material adjustment to the carrying amounts of
assets and liabilities within the next financial year are addressed below:
A.Evaluation of inventories
As inventories are stated at the lower of cost and net realizable value, the Group must determine
the net realizable value of inventories on balance sheet date using judgments and estimates.
Due to the rapid technological innovation, the Group evaluates the amounts of normal inventory
consumption, obsolete inventories or inventories without market selling value on balance sheet
date, and writes down the cost of inventories to the net realizable value. Such an evaluation of
inventories is principally based on the demand for the products within the specified periods in the
future. Therefore, there might be material changes to the evaluation.
As of December 31, 2014, the carrying amount of inventories was $1,744,812.
~23~
B.Realisability of deferred income tax assets
Deferred tax assets are recognized only to the extent that it is probable that future taxable profit
will be available against which the deductible temporary differences can be utilized.
Assessment of the realisability of deferred tax assets involves critical accounting judgements and
estimates of the management, including the assumptions of expected future sales revenue growth
rate and profit rate, tax exempt duration, available tax credits, tax planning, etc. Any variations in
global economic environment, industrial environment, and laws and regulations might cause
material adjustments to deferred tax assets.
As of December 31, 2014, the Group recognized deferred tax assets amounting to $50,129.
C.Provision for warranty liability
Warranty liabilities are primarily arising from sales of equipment. The amount of the obligation is
estimated based on the sufficient objective evidences, including the historical warranty records.
As of December 31, 2014, the carrying amount of accrued warranty liabilities was $1,471,138.
6. DETAILS OF SIGNIFICANT ACCOUNTS
(1) Cash and cash equivalents
A.The Group transacts with a variety of financial institutions all with high credit quality to disperse
credit risk, so it expects that the probability of counterparty default is remote. The Group’s
maximum exposure to credit risk at balance sheet date is the carrying amount of all cash and cash
equivalents.
B.The Group has no cash and cash equivalences pledged to others.
(2) Financial assets at fair value through profit or loss
A.The Group recognized net gain of $1,805 and $0 on financial assets held for trading for the years
ended December 31, 2014 and 2013, respectively.
B.The Group has no financial assets at fair value through profit or loss pledged to others.
December 31, 2014 December 31, 2013
Cash on hand 447$ 564$
Checking accounts and demand deposits 2,272,324 2,419,466
Time deposits 5,123,700 2,950,672
7,396,471$ 5,370,702$
Items December 31, 2014 December 31, 2013
Current items:
Financial assets held for trading
Beneficiary certificates 1,100,000$ -$
Valuation 1,805 -
Total 1,101,805$ -$
~24~
(3) Available-for-sale financial assets
The Group did not recognize any other comprehensive income for fair value change for the years
ended December 31, 2014 and 2013.
(4) Investments in bonds without active markets
A.The Group listed the time deposits more than 90 days in this account.
B.The Group recognized interest of $6,654 and $1,595 in profit or loss for the years ended
December 31, 2014 and 2013, respectively.
C.The counterparties of the Group’s investments have good credit quality. The maximum exposure
to credit risk at balance sheet date is the carrying amount of investments in bonds without active
markets.
(5) Accounts receivable
A. Analysis of movement of impaired accounts receivable:
(a)As of December 31, 2014 and 2013, the Group had no provisions for impairment of accounts
receivable.
(b)Movements on the Group provision for impairment of accounts receivable are as follows:
Item December 31, 2014 December 31, 2013
Non-listed and emerging stocks 7,450$ 4,412$
Valuation adjustment of available-for-sale
financial assets - -
Total 7,450$ 4,412$
Item December 31, 2014 December 31, 2013
Time deposits 1,266,000$ 2,891,085$
December 31, 2014 December 31, 2013
Accounts receivable 2,661,783$ 1,556,892$
Less: allowance for bad debts - -
2,661,783$ 1,556,892$
Individual provision Group provision Total
At January 1 -$ -$ -$
Reversal of impairment - - -
Write off during the period - - -
Effect of exchange rate changes - - -
At December 31 -$ -$ -$
For the year ended December 31, 2014
~25~
B.The Group’s accounts receivable that were neither past due nor impaired were fully performing in
line with the credit standards prescribed based on counterparties’ industrial characteristics, scale
of business and profitability, which had good credit quality.
C.As of December 31, 2014 and 2013, the maximum exposure to credit risk was the carrying
amount of accounts receivable.
D.The Group does not hold any collateral as security.
E.On April 1, 2013, the Company’s subsidiary – Hermes Microvision Japan Inc. entered into an
agreement with Merrill Lynch Japan Finance Co., Ltd. to sell its accounts receivable of Elpida
Memory Inc. (“Elpida”) for JPY 218,007 thousand. Under the agreement, Hermes Microvision
Japan Inc. is not required to bear the uncollectibility risk of the underlying accounts receivable.
The original accounts receivable amounted to JPY 445,607 thousand, but it had been provided
with 100% allowance for bad debts. Therefore, Hermes Microvision Japan Inc. had reversed the
allowance for bad debts previously provided, and had written off the balance of outstanding
accounts receivable.
(6) Inventories
Individual provision Group provision Total
At January 1 149,902$ -$ 149,902$
Reversal of impairment 67,806)( - 67,806)(
Write-offs during the period 70,790)( - 70,790)(
Effect of exchange rate changes 11,306)( - 11,306)(
At December 31 -$ -$ -$
For the year ended December 31, 2013
Cost
Allowance for
valuation loss Book value
Raw materials 801,210$ 204,582)($ 596,628$
Work - in - process 1,204,431 125,020)( 1,079,411
Finished goods 236,738 167,965)( 68,773
Total 2,242,379$ 497,567)($ 1,744,812$
December 31, 2014
Cost
Allowance for
valuation loss Book value
Raw materials 754,899$ 184,878)($ 570,021$
Work - in - process 875,060 96,009)( 779,051
Finished goods 282,321 115,236)( 167,085
Total 1,912,280$ 396,123)($ 1,516,157$
December 31, 2013
~26~
The cost of inventories recognized as expense for the period:
I. As of December 31, 2014 and 2013, the balance of the imputation tax credit account was
$254,759 and $137,913, respectively. The creditable tax rate was 4.17% for 2013 and was
estimated to be 4.93% for the year ended December 31, 2014.
(23) Earnings per share
Weighted average number of Earnings
Amount ordinary shares per share
after tax outstanding (share in thousands) (in dollars)
Basic earnings per share
Profit attributable to equity
holders of the parent company 3,237,928$ 71,000 45.60$
Diluted earnings per share - Profit attributable to equity
holders of the parent company 3,237,928$ 71,000 Assumed conversion of all
dilutive potential ordinary shares
Employees’ bonus - 83
Profit attributable to equity
holders of the parent company
plus assumed conversion of
all dilutive potential ordinary
shares 3,237,928$ 71,083 45.55$
For the year ended December 31, 2014
Weighted average number of Earnings
Amount ordinary shares per share
after tax outstanding (share in thousands) (in dollars)
Basic earnings per share
Profit attributable to equity
holders of the parent company 2,343,600$ 66,780 35.09$
Diluted earnings per share Profit attributable to equity
holders of the parent company 2,343,600$ 66,780 Assumed conversion of all
dilutive potential ordinary shares
Employees’ bonus - 95
Profit attributable to equity
holders of the parent company
plus assumed conversion of
all dilutive potential ordinary
shares 2,343,600$ 66,875 35.04$
For the year ended December 31, 2013
~47~
(24) Non-cash transactions
Investing activities with partial cash payments:
7. RELATED PARTY TRANSACTIONS
(1) Significant transactions and balances with related parties
A.Operating revenue:
There are no significant differences in sale prices and collection terms between related parties and
third parties.
B.Purchases of services:
The above transactions are under normal commercial terms and conditions.
For the year ended For the year ended
December 31, 2014 December 31, 2013
Purchase of fixed assets 457,175$ 224,022$
Add: opening balance of payable
on equipment 77,395 -
Less: ending balance of payable
on equipment 45,538)( 77,395)(
Cash paid during the period 489,032$ 146,627$
For the year ended For the year ended
December 31, 2014 December 31, 2013
Sales of goods:
The entity with significant
influence over the Group $ 42,284 $ 15,494
For the year ended For the year ended
December 31, 2014 December 31, 2013
Technology service charge -
The entity with significant
influence over the Group $ 18,463 $ 19,751
Commission expense -
The entity with significant
influence over the Group $ 38,155 $ 21,213
Other expenses -
The entity with significant
influence over the Group $ 34 $ 29
~48~
C.Accounts receivable:
The receivables from the entity with significant influence over the Group arise mainly from sale
transactions. The receivables are due from 30~60 day after the date of sales. The receivables are
unsecured in nature and bear no interest. There are no provisions accrued against receivables
from related parties.
D.Other payables:
E.Leases
(2) Key management compensation
8. PLEDGED ASSETS
None.
9. SIGNIFICANT CONTINGENT LIABILITIES AND UNRECOGNIZED CONTRACT
COMMITMENTS
(1) Contingencies
None.
(2) Commitments
A.Operating leases commitments
The Group leases offices and plant assets under non-cancellable operating lease agreements.
Rental expense of $90,740 and $73,854 were recognized for the years ended December 31, 2014
and 2013, respectively.
The majority of lease agreements are renewable at the end of the lease periods at market rates.
December 31, 2014 December 31, 2013
Receivables from the entity with significant
influence over the Group 20,134$ 13,367$
December 31, 2014 December 31, 2013
Payables from the entity with significant
influence over the Group 78,177$ 68,731$
For the year ended For the year ended
December 31, 2014 December 31, 2013
Rental expense-
The entity with significant
influence over the Group 22,409$ 21,891$
For the year ended For the year ended
December 31, 2014 December 31, 2013
Salaries and other short-term
employee benefits 54,030$ 42,910$
Share-based payment 46,211 15,259
100,241$ 58,169$
~49~
The future aggregate minimum lease payments under non-cancellable operating leases are as
follows:
B. Capital commitments
Capital expenditure contracted for at the balance sheet date but not yet incurred is as follows:
10. SIGNIFICANT DISASTER LOSS
None.
11. SIGNIFICANT EVENTS AFTER THE BALANCE SHEET DATE
None.
12. OTHERS
(1) Capital risk management
In order to safeguard the Group’s ability to adapt to the changes in the industry and to accelerate
the new product development, the Group’s objectives when managing capital are to maintain
sufficient financial resources to support the operating capital, capital expenditures, research and
development activities and dividends paid to shareholders.
The Group monitors capital through the ratio of total liabilities divided by total assets. The
Group's strategy is to maintain the ratio within 50%. As of December 31, 2014 and 2013, the
Group's ratios of total liabilities divided by total assets were as follows:
(2) Financial instruments
A. The carrying amounts of the Group’s financial instruments measured at amortized cost
approximate their fair values. These include cash and cash equivalents, notes payable, accounts
receivable, other receivables, short-term loans, notes payable, accounts payable and other
payables.
December 31, 2014 December 31, 2013
Not later than one year 42,287$ 62,170$
Later than one year but not later than five years 141,639 145,180
Later than five years 76,098 99,121
Total 260,024$ 306,471$
December 31, 2014 December 31, 2013
Future payments for plant and equipment 210,643$ 640,892$
December 31, 2014 December 31, 2013
Total liabilities 3,251,512$ 2,118,505$
Total assets 15,126,476$ 11,851,537$
Total liabilities/total assets ratio 21% 18%
~50~
B. Financial risk management policies
a) The Group’s activities expose it to a variety of financial risks: market risk (including foreign
exchange risk, interest rate risk and price risk), credit risk and liquidity risk. The Group’s
overall risk management program focuses on the unpredictability of financial markets and
seeks to minimize potential adverse effects on the Group’s financial position and financial
performance.
b) Risk management is carried out by the finance department (the “Group finance”) under
policies approved by the Board of Directors. Group finance identifies, evaluates and hedges
financial risks in close co-operation with the Group’s operating units. The Board provides
written principles for overall risk management, as well as written policies covering specific
areas and matters, such as foreign exchange risk, interest rate risk, credit risk, and investment
of excess liquidity.
C. Significant financial risks and degrees of financial risks
Except for the following, there is no significant change in this period.
a) Market risk
Foreign exchange risk
The Group operates internationally and is exposed to foreign exchange risk arising from
various currency exposures, primarily with respect to the USD and RMB. Foreign
exchange risk arises from future commercial transactions, recognized assets and liabilities
and net investments in foreign operations.
Management has set up a policy to require group companies to manage their foreign
exchange risk against their functional currency. Foreign exchange risk arises when future
commercial transactions or recognized assets or liabilities are denominated in a currency
that is not the entity’s functional currency.
The Group has certain investments in foreign operations, whose net assets are exposed to
foreign currency translation risk.
The Group’s businesses involve some non-functional currency operations (the Company’s
and certain subsidiaries’ functional currency: NTD; other certain subsidiaries’ functional
currency: USD, RMB, KRW and JPY). The information on assets and liabilities
denominated in foreign currencies whose values would be materially affected by the
exchange rate fluctuations is as follows:
~51~
Foreign Currency
Amount (In Thousands) Exchange Rate Book Value (NTD)
(Foreign currency: functional
currency)
Financial assets
Monetary items
USD:NTD 195,290$ 31.65 6,180,932$
USD:JPY 479 119.62 15,149
USD:CNY 1,330 6.22 42,091
Financial liabilities
Monetary items
USD:NTD 10,089$ 31.65 319,318$
USD:KRW 232 1,082.98 251,670
December 31, 2014
Foreign Currency
Amount (In Thousands) Exchange Rate Book Value (NTD)
(Foreign currency: functional
currency)
Financial assets
Monetary items
USD:NTD 213,128$ 29.805 6,352,280$
USD:JPY 1,730 105.390 51,563
Financial liabilities
Monetary items
USD:NTD 14,133$ 29.805 421,234$
USD:JPY 568 105.390 16,929
December 31, 2013
~52~
Analysis of foreign currency market risk arising from significant foreign exchange variation
is as follows:
Price risk
The Group’s investments in equity securities consist of unlisted stocks, which are classified
on the consolidated balance sheet as available-for-sale financial assets. The price of equity
securities would change due to the change of the future value of investee companies. If the
prices of these equity securities had increased / decreased by 5% with all other variables
held constant, total equity for the year ended December 31, 2014 would have increased /
decreased by $373, as a result of gains / losses on equity securities classified as
available-for-sale.
Extent of Variation
Effect on Profit or
Loss
Effect on Other
Comprehensive Income
(Foreign currency: functional
currency)
Financial assets
Monetary items
USD:NTD 1% 61,809$ -$
USD:JPY 1% 151 -
USD:CNY 1% 421 -
Financial liabilities
Monetary items
USD:NTD 1% 3,193$ -$
USD:KRW 1% 2,517 -
For the year ended December 31, 2014
Sensitivity Analysis
Extent of Variation
Effect on Profit or
Loss
Effect on Other
Comprehensive Income
(Foreign currency: functional
currency)
Financial assets
Monetary items
USD:NTD 1% 63,523$ -$
USD:JPY 1% 516 -
Financial liabilities
Monetary items
USD:NTD 1% 4,212$ -$
USD:JPY 1% 169 -
For the year ended December 31, 2013
Sensitivity Analysis
~53~
Interest rate risk
At December 31, 2014 and 2013, if interest rates on NTD-denominated time deposits had
been 0.25% higher/lower with all other variables held constant, post-tax profit for the years
ended December 31, 2014 and 2013 would have been $15,974 and $14,604 lower / higher,
respectively, mainly as a result of higher/lower interest revenue on floating rate time
deposits.
b) Credit risk
i. Credit risk refers to the risk of financial loss to the Group arising from default by the
clients or counterparties of financial instruments on the contract obligations.
According to the Group’s credit policy, each local entity in the Group is responsible for
managing and analyzing the credit risk for each of their new clients before standard
payment and delivery terms and conditions are offered. Internal risk control assesses the
credit quality of the customers, taking into account their financial position, past
experience and other factors. Individual risk limits are set based on internal or external
ratings in accordance with limits set by the Board of Directors. The utilization of credit
limits is regularly monitored. Credit risk arises from deposits with banks and financial
institutions, as well as credit exposures to wholesale and retail customers, including
outstanding receivables and committed transactions.
ii.No credit limits were exceeded during the reporting periods, and management does not
expect any significant losses from non-performance by these counterparties.
c) Liquidity risk
i. Cash flow forecasting is performed in the operating entities of the Group and aggregated
by Group finance. Group finance monitors rolling forecasts of the Group’s liquidity
requirements to ensure it has sufficient cash to meet operational needs while
maintaining sufficient headroom on its undrawn committed borrowing facilities at all
times so that the Group does not breach borrowing limits or covenants on any of its
borrowing facilities. Such forecasting takes into consideration the Group’s debt
financing plans, covenant compliance, and compliance with internal balance sheet ratio
targets.
ii. Surplus cash held by the operating entities over and above balance required for working
capital management are transferred to the Group finance. Group finance invests
surplus cash in interest bearing current accounts that are expected to readily generate
cash inflows for managing liquidity risk.
iii. The table below analyses the Group’s non-derivative financial liabilities into relevant
maturity groupings based on the remaining periods at the balance sheet date to the
contractual maturity date. The amounts disclosed in the table are the contractual
undiscounted cash flows.
~54~
d) Fair value estimation
A. The table below analyses financial instruments measured at fair value, by valuation
method.
The different levels have been defined as follows:
Level 1: Quoted prices (unadjusted) in active markets for identical assets or liabilities.
Level 2: Inputs other than quoted prices included within level 1 that are observable for
the asset or liability, either directly (that is, as prices) or indirectly (that is,
derived from prices).
Level 3: Inputs for the asset or liability that are not based on observable market data.
The following table presents the Group’s financial assets and liabilities that are measured
at fair value as of December 31, 2014 and 2013.
Non-derivative financial liabilities:
December 31, 2014 Less than 1 year
Accounts payable 177,559$
Other payables 1,080,525
Other payables - related parties 78,177
Non-derivative financial liabilities:
December 31, 2013 Less than 1 year
Accounts payable 149,703$
Accounts payable - related parties 328
Other payables 678,687
Other payables - related parties 68,731
December 31, 2014 Level 1 Level 2 Level 3 Total
Financial assets:
Held for trading financial assets 1,101,805$ -$ -$ 1,101,805$
Equity securities - - 7,450 7,450
Total 1,101,805$ -$ 7,450$ 1,109,255$
December 31, 2013 Level 1 Level 2 Level 3 Total
Financial assets:
Equity securities -$ -$ 4,412$ 4,412$
Total -$ -$ 4,412$ 4,412$
~55~
B. The fair value of financial instruments traded in active markets is based on quoted market
prices at the balance sheet date. A market is regarded as active if quoted prices are
readily and regularly available from an exchange, dealer, broker, industry group, pricing
service, or regulatory agency, and those prices represent actual and regularly occurring
market transactions on an arm’s length basis. The quoted market price used for financial
assets held by the Group is the closing price or the current bid price. These instruments
are included in level 1. Instruments included in level 1 comprise primarily equity
instruments and debt instruments classified as financial assets/financial liabilities at fair
value through profit or loss or available - for - sale financial assets.
C. The fair value of financial instruments that are not traded in an active market (for
example, over-the-counter derivatives) is determined by using valuation techniques.
These valuation techniques maximise the use of observable market data where it is
available and rely as little as possible on entity specific estimates. If all significant inputs
required to fair value an instrument are observable, the instrument is included in level 2.
D. If one or more of the significant inputs is not based on observable market data, the
instrument is included in level 3.
E. Specific valuation techniques used to value financial instruments include:
a) Quoted market prices or dealer quotes for similar instruments.
b) The fair value of interest rate swaps is calculated as the present value of the estimated
future cash flows based on observable yield curves.
c) The fair value of forward foreign exchange contracts is determined using forward
exchange rates at the balance sheet date, with the resulting value discounted back to
present value.
d) Other techniques, such as discounted cash flow analysis, are used to determine fair
value for the remaining financial instruments.
F. The following table presents the changes in level 3 instruments as of December 31, 2014
and 2013.
2014
Equity securities
A t J a n u a r y 1 4 , 4 1 2$
A c q u i s i t i o n 3 , 0 3 8
A t D e c e m b e r 3 1 7 , 4 5 0$
2013
Equity securities
A t J a n u a r y 1 -$
A c q u i s i t i o n 4 , 4 1 2
A t D e c e m b e r 3 1 4 , 4 1 2$
~56~
13. SUPPLEMENTARY DISCLOSURES
(1) Significant transactions information
(Information on investee companies is disclosed based on investee companies’ financial statements, which were reviewed by independent auditors. The following transactions had
been eliminated in the consolidated financial statements; they are disclosed for reference purpose only.)
a) Loans granted: None.
b) Endorsements and guarantees provided by the Company to others: None.
c) Holding of securities as of December 31, 2014:
Number of shares
Book value
(Note 3) Ownership (%) Fair value
Hermes Microvision, Inc. TransPacific Medtech Fund, LP. Available-for -sale financial
assets-noncurrent- 7,450$ 25% 7,450$ None
" Jih Sun Money Market Financial assets at fair value
through profit or loss-current17,223,705 250,429 - 250,429 "
" Union Money Market " 7,715,275 100,135 - 100,135 "
Footnote
(Note 4)Securities held by
Marketable securities
(Note 1)
General
ledger account
As of December 31, 2014
~57~
d) Aggregate purchase or sales of the same securities reaching $300,000 or 20% of paid-in capital or more for the year ended December 31, 2014:
Note 1: Marketable securities in the table refer to stocks, bonds, beneficiary certificates and other related derivative securities.
Note 2: Fill in the columns the counterparty and relationship if securities are accounted for under the equity method; otherwise leave the columns blank.
Note 3: Aggregate purchases and sales amounts should be calculated separately at their market values to verify whether they individually reach NT$300 million or 20% of paid-in capital or more.
Note 4: Paid-in capital referred to herein is the paid-in capital of parent company. In the case that shares were issued with no par value or a par value other than NT$10 per share, the 20 % of paid-in capital shall be replaced by
10% of equity attributable to owners of the parent in the calculation.
e) Acquisition of real estate reaching $300,000 or 20% of paid-in capital or more for the year ended December 31, 2014: None.
f) Disposal of real estate reaching $300,000 or 20% of paid-in capital or more for the year ended December 31, 2014: None.
Note 1: The numbers filled in for the transaction company in respect of inter-company transactions are as follows:
(1) Parent company is ‘0’.
(2) The subsidiaries are numbered in order starting from ‘1’.
Note 2: Relationship between transaction company and counterparty is classified into the following three categories;
(1) Parent company to subsidiary.
(2) Subsidiary to parent company.
(3) Subsidiary to subsidiary.
Note 3: Regarding percentage of transaction amount to consolidated total operating revenues or total assets, it is computed based on periods-end balance of transaction to
consolidated total assets for balance sheet accounts and based on accumulated transaction amount for the periods to consolidated total operating revenues for income
statement accounts.
Note 4: Only transactions with amount equal to or higher than NT$10,000 thousand are disclosed.
Note 5: Transactions between these related parties are not disclosed separately.
~61~
(2) Information of investees as of December 31, 2014:
(3) Information on investment in Mainland China:
(a) Basic information
Investor Investee Location Main business activities December 31, 2014 December 31, 2013 In Shares Percentage Book value
For the convenience of readers and for information purpose only, the auditors’ report and the accompanying
financial statements have been translated into English from the original Chinese version prepared and used in
the Republic of China. In the event of any discrepancy between the English version and the original
Chinese version or any differences in the interpretation of the two versions, the Chinese-language auditors’
report and financial statements shall prevail.
~1~
REPORT OF INDEPENDENT ACCOUNTANTS TRANSLATED FROM CHINESE
To Hermes Microvision, Inc.
We have audited the accompanying parent company only balance sheets of Hermes Microvision, Inc. as of
December 31, 2014 and 2013, and the related parent company only statements of comprehensive income, of
changes in equity and of cash flows for the years then ended. These parent company only financial statements
are the responsibility of the Company’s management. Our responsibility is to express an opinion on these
financial statements based on our audits.
We conducted our audits in accordance with the “Regulations Governing Auditing and Attestation of Financial
Statements by Certified Public Accountants” and generally accepted auditing standards in the Republic of China.
Those standards require that we plan and perform the audit to obtain reasonable assurance about whether the
financial statements are free of material misstatement. An audit includes examining, on a test basis, evidence
supporting the amounts and disclosures in the financial statements. An audit also includes assessing the
accounting principles used and significant estimates made by management, as well as evaluating the overall
financial statement presentation. We believe that our audits provide a reasonable basis for our opinion.
In our opinion, the parent company only financial statements referred to above present fairly, in all material
respects, the financial position of Hermes Microvision, Inc. as of December 31, 2014 and 2013, and its financial
performance and cash flows for the years then ended in conformity with the “Rules Governing the Preparation
of Financial Statements by Securities Issuers”.
PricewaterhouseCoopers, Taiwan
Hsinchu, Taiwan
Republic of China
March 4, 2015 ------------------------------------------------------------------------------------------------------------------------------------------------- The accompanying non-consolidated financial statements are not intended to present the financial position and results of operations and cash flows in accordance with accounting principles generally accepted in countries and jurisdictions other than the Republic of China. The standards, procedures and practices in the Republic of China governing the audit of such financial statements may differ from those generally accepted in countries and jurisdictions other than the Republic of China. Accordingly, the accompanying non-consolidated financial statements and report of independent accountants are not intended for use by those who are not informed about the accounting principles or auditing standards generally accepted in the Republic of China, and their applications in practice. As the financial statements are the responsibility of the management, PricewaterhouseCoopers cannot accept any liability for the use of, or reliance on, the English translation or for any errors or misunderstandings that may derive from the translation.
HERMES MICROVISION, INC. PARENT COMPANY ONLY BALANCE SHEETS
DECEMBER 31 (Expressed in thousands of New Taiwan dollars)
~2~
December 31, 2014 December 31, 2013 Assets Notes AMOUNT % AMOUNT %
Adjustments arising from changes in percentages of ownership in subsidiary
6(15) - 4,173 - - - - 4,173
Other comprehensive income for the year 6(17) - - - - ( 7,339 ) 34,693 27,354
Balance at December 31, 2014 $ 710,000 $ 5,431,196 $ 466,206 $ - $ 5,170,809 $ 49,650 $ 11,827,861
HERMES MICROVISION, INC.
PARENT COMPANY ONLY STATEMENTS OF CASH FLOWS
FOR THE YEARS ENDED DECEMBER 31
(Expressed in thousands of New Taiwan dollars)
Notes 2014 2013
The accompanying notes are an integral part of these non-consolidated financial statements.
~6~
CASH FLOWS FROM OPERATING ACTIVITIES Profit before tax for the year $ 3,591,298 $ 2,520,585 Adjustments to reconcile profit before tax to net cash provided by
operating activities
Income and expenses having no effect on cash flows Provision for doubtful accounts 7,505 - Depreciation 6(8)(21) 36,396 35,328 Amortization 6(9)(21) 3,254 4,108 Revaluation of financial assests at fair value ( 1,805 ) - Compensation cost of stock appreciation right 6(12)(22) 306,057 62,790 Share of profits of subsidiaries ( 77,973 ) ( 200,902 ) Interest income 6(19) ( 69,909 ) ( 23,997 ) Changes in assets/liabilities relating to operating activities Net changes in assets relating to operating activities Accounts receivable ( 1,268,051 ) ( 546,681 ) Accounts receivable - related parties 312,283 46,053 Other receivables 4,858 ( 1,670 ) Other receivables - related parties 668 17,454 Inventories 31,138 36,268 Prepayments ( 8,200 ) 10,079 Net changes in liabilities relating to operating activities Accounts payable 18,074 36,008 Accounts payable - related parties ( 144,253 ) 20,260 Other payables 28,677 47,179 Other payables - related parties 33,865 ( 10,146 ) Provisions for liabilities 498,879 395,002 Other current liabilities 2,616 2,068 Other non- current liabilities ( 2,132 ) 235 Cash generated from operations 3,303,245 2,450,021 Interest received 69,638 23,997 Income tax paid ( 240,584 ) ( 125,235 ) Net cash provided by operating activities 3,132,299 2,348,783 CASH FLOWS FROM INVESTING ACTIVITIES Increase in financial assests at fair value through profit or loss ( 1,100,000 ) - Proceeds from disposal (acquisition) of bond investments without
active markets - current
1,625,085 ( 2,891,085 ) Acquisition of available-for-sales financial assets - non - current ( 3,038 ) ( 4,412 ) Acquisition of property, plant and equipment 6(8)(25) ( 469,437 ) ( 123,843 ) Proceeds from disposal of property, plant, equipment and
intangible assets
11 3 Acquisition of intangible assets 6(9) ( 6,618 ) ( 3,669 ) (Increase) decrease in refundable deposits ( 1,930 ) 127 Net cash provided by (used in) investing activities 44,073 ( 3,022,879 ) CASH FLOWS FROM FINANCING ACTIVITIES Proceeds from issuance of common stock - 4,302,575 Cost of acquisition of capital - ( 64,539 ) Cash dividends paid ( 1,136,000 ) ( 792,000 ) Net cash (used in) provided by financing activities ( 1,136,000 ) 3,446,036 Increase in cash and cash equivalents 2,040,372 2,771,940 Cash and cash equivalents at beginning of year 6(1) 5,189,811 2,417,871 Cash and cash equivalents at end of year 6(1) $ 7,230,183 $ 5,189,811
~7~
HERMES MICROVISION, INC.
NOTES TO THE PARENT COMPANY ONLY FINANCIAL STATEMENTS
FOR THE YEARS ENDED DECEMBER 31, 2014 AND 2013
(EXPRESSED IN THOUSANDS OF NEW TAIWAN DOLLARS,
EXCEPT AS OTHERWISE INDICATED)
1. HISTORY AND ORGANIZATION
Hermes Microvision, Inc. (the “Company”) was incorporated on May 19, 2003. The Company engages
in the research, development, design, manufacturing and sale of precision instruments and machinery
(electronic inspection equipment.) The Company’s stock was listed on the GreTai Securities Market,
effective from May 21, 2012. The Company obtained the certification of Corporate Governance
Assessment 6009 by Taiwan Corporate Governance Association on September 30, 2014.
2. THE DATE OF AUTHORIZATION FOR ISSUANCE OF THE PARENT COMPANY ONLY
FINANCIAL STATEMENTS AND PROCEDURES FOR AUTHORIZATION
These parent company only financial statements were authorized for issuance by the Board of Directors
on March 4, 2015.
3. APPLICATION OF NEW STANDARDS, AMENDMENTS AND INTERPRETATIONS
(1) Effect of the adoption of new issuances of or amendments to International Financial Reporting
Standards (“IFRS”) as endorsed by the Financial Supervisory Commission (“FSC”)
None.
(2) Effect of new issuances of or amendments to IFRSs as endorsed by the FSC but not yet adopted by
the Company
According to Financial-Supervisory-Securities-Auditing No. 1030010325 issued on April 3, 2014,
commencing 2015, companies with shares listed on the TWSE or traded on the Taiwan GreTai
Securities Market or Emerging Stock Market shall adopt the 2013 version of IFRS (not including
IFRS 9, ‘Financial instruments’) as endorsed by the FSC and the "Regulations Governing the
Preparation of Financial Reports by Securities Issuers " effective January 1, 2015 (collectively
referred herein as the “2013 version of IFRSs) in preparing the consolidated financial statements.
The related new standards, interpretations and amendments are listed below:
~8~
Based on the Company’s assessment, the adoption of the 2013 version of IFRS has no significant
impact on the parent company only financial statements of the Company, except for the following:
A.IAS 19 (revised), ‘Employee benefits’
The revised standard the eliminates the corridor approach and requires actuarial gains and losses
to be recognised immediately in other comprehensive income. Past service costs will be
recognised immediately in the period incurred. Net interest expense or income, calculated by
applying the discount rate to the net defined benefit asset or liability, replace the finance charge
and expected return on plan assets. The return of plan assets, excluding net interest expense, is
recognised in other comprehensive income. An entity is required to recognise termination
benefits at the earlier of when the entity can no longer withdraw an offer of those benefits or
when it recognises any related restructuring costs. Additional disclosures are required to present
how defined benefit plans may affect the amount, timing and uncertainty of the entity’s future
New Standards, Interpretations and Amendments
Effective Date by
International
Accounting
Standards Board
Limited exemption from comparative IFRS 7 disclosures for first-time
adopters (amendment to IFRS 1)
July 1, 2010
Government loans (amendment to IFRS 1) January 1, 2013
Disclosures - transfers of financial assets (amendment to IFRS 7) July 1, 2011
Disclosures—Offsetting financial assets and financial liabilities
(amendment to IFRS 7)
January 1, 2013
IFRS 10, ‘Consolidated financial statements’ January 1, 2013
(Investment entities:
January 1, 2014)
IFRS 11,‘Joint arrangements’ January 1, 2013
IFRS 12,‘Disclosure of interests in other entities’ January 1, 2013
IFRS 13, ‘Fair value measurement’ January 1, 2013
Presentation of items of other comprehensive income (amendment to IAS 1) July 1, 2012
Deferred tax: recovery of underlying assets (amendment to IAS 12) January 1, 2012
IAS 19 (revised),‘Employee benefits’ January 1, 2013
IAS 27,‘Separate financial statements’ (as amended in 2011) January 1, 2013
IAS 28,‘Investments in associates and joint ventures’(as amended in 2011) January 1, 2013
Offsetting financial assets and financial liabilities (amendment to IAS 32) January 1, 2014
IFRIC 20, ‘Stripping costs in the production phase of a surface mine’ January 1, 2013
Improvements to IFRSs 2010 January 1, 2011
Improvements to IFRSs 2009-2011 January 1, 2013
Severe hyperinflation and removal of fixed dates for first-time adopters
(amendment to IFRS 1)
July 1, 2011
~9~
cash flows.
The Company expected to recognise previously unrecognised past service cost and as a
consequence of elimination of the corridor approach to recognise prior unrecognised actuarial
losses by decreasing operating expenses by $32 and other comprehensive income would be
increased by $32 for the year ended December 31, 2014.
B.IAS 1, ‘Presentation of financial statements’
The amendment requires entities to separate items presented in OCI classified by nature into two
groups on the basis of whether they are potentially reclassifiable to profit or loss subsequently
when specific conditions are met. If the items are presented before tax then the tax related to each
of the two groups of OCI items (those that might be reclassified and those that will not be
reclassified) must be shown separately. Accordingly, the Company will adjust its presentation of
the statement of comprehensive income.
C.IFRS 12, ‘Disclosure of interests in other entities’
The standard integrates the disclosure requirements for subsidiaries, joint arrangements,
associates and unconsolidated structured entities. Also, the Company will disclose additional
information about its interests in consolidated entities and unconsolidated entities accordingly.
D.IFRS 13, ‘Fair value measurement’
The standard defines fair value as the price that would be received to sell an asset or paid to
transfer a liability in an orderly transaction between market participants at the measurement date.
The standard sets out a framework for measuring fair value using the assumptions that market
participants would use when pricing the asset or liability; for non-financial assets, fair value is
determined based on the highest and best use of the asset. Also, the standard requires disclosures
about fair value measurements. Based on the Company’s assessment, the adoption of the standard
has no significant impact on its parent company only financial statements, and the Company will
disclose additional information about fair value measurements accordingly.
(3) IFRSs issued by IASB but not yet endorsed by the FSC
New standards, interpretations and amendments issued by IASB but not yet included in the 2013
version of IFRS as endorsed by the FSC:
New Standards, Interpretations and Amendments
Effective Date by
International Accounting
Standards Board
IFRS 9, ‘Financial instruments’ January 1, 2018
Sales or contribution of assets between an investor and its associate or
joint venture (amendments to IFRS 10 and IAS 28)
January 1, 2016
Accounting for acquisition of interests in joint operations
(amendments to IFRS 11)
January 1, 2016
IFRIC 14 ‘Regulatory deferral accounts’ January 1, 2016
~10~
The Company is assessing the potential impact of the new standards, interpretations and
amendments above and has not yet been able to reliably estimate their impact on the parent
company only financial statements.
4. SUMMARY OF SIGNIFICANT ACCOUNTING POLICIES
The principal accounting policies applied in the preparation of these parent company only statements
are set out below. These policies have been consistently applied to all the periods presented, unless
otherwise stated.
(1) Compliance statement
These parent company only financial statements are prepared by the Company in accordance with
the “Rules Governing the Preparation of Financial Statements by Securities Issuers”.
(2) Basis of preparation
A. Except for the following items, these parent company only financial statements have been
prepared under the historical cost convention:
(a)Financial assets and financial liabilities (including derivative instruments) at fair value through
profit or loss.
(b)Available-for-sale financial assets measured at fair value.
(c)Liabilities on cash-settled share-based payment arrangement measured at fair value.
(d)Defined benefit liabilities recognized based on the net amount of pension fund assets plus
New Standards, Interpretations and Amendments
Effective Date by
International Accounting
Standards Board
IFRS 15, ‘Revenue from contracts with customers’ January 1, 2017
Clarification of acceptable methods of depreciation and
amortisation (amendments to IAS 16 and IAS 38)
January 1, 2016
Agriculture: bearer plants (amendments to IAS 16 and
IAS 41)
January 1, 2016
Defined benefit plans: employee contribution (amendments
to IAS 19R)
July 1, 2014
Equity method in separate financial statements (amendments
to IAS 27)
January 1, 2016
Recoverable amount disclosures for non-financial assets
(amendments to IAS 36)
January 1, 2014
Novation of derivatives and continuation of hedge accounting
(amendments to IAS 39)
January 1, 2014
IFRIC 21, ‘Levies’ January 1, 2014
Improvements to IFRSs 2010-2012 July 1, 2014
Improvements to IFRSs 2011-2013 July 1, 2014
Improvements to IFRSs 2012-2014 January 1, 2016
~11~
unrecognized past service cost and unrecognized actuarial losses, and less unrecognized
actuarial gains and present value of defined benefit obligation.
B.The preparation of financial statements in compliance with IFRSs requires the use of certain
critical accounting estimates. It also requires management to exercise its judgment in the process
of applying the Company’s accounting policies. The areas involving a higher degree of judgment
or complexity, or areas where assumptions and estimates are significant to the parent company
only financial statements are disclosed in Note 5.
(3) Foreign currency translation
Items included in the financial statements of the Company are measured using the currency of the
primary economic environment in which the Company operates (the “functional currency”). The
parent company only financial statements are presented in New Taiwan Dollars, which is the
Company’s functional and presentation currency.
A.Foreign currency transactions and balances
(a)Foreign currency transactions are translated into the functional currency using the exchange
rates prevailing at the dates of the transactions or valuation where items are remeasured.
Foreign exchange gains and losses resulting from the settlement of such transactions are
recognized in profit or loss in the period in which they arise.
(b)Monetary assets and liabilities denominated in foreign currencies at the period end are
re-translated at the exchange rates prevailing at the balance sheet date. Exchange differences
arising upon re-translation at the balance sheet date are recognized in profit or loss.
(c)Non-monetary assets and liabilities denominated in foreign currencies held at fair value
through profit or loss are re-translated at the exchange rates prevailing at the balance sheet
date; their translation differences are recognized in profit or loss as part of the fair value gain
or loss. Non-monetary assets and liabilities denominated in foreign currencies held at fair
value through other comprehensive income are re-translated at the exchange rates prevailing at
the balance sheet date; their translation differences are recognized in other comprehensive
income. However, non-monetary assets and liabilities denominated in foreign currencies that
are not measured at fair value are translated using the historical exchange rates at the dates of
the initial transactions.
(d)All foreign exchange gains and losses are all presented in the statement of comprehensive
income within “other gains and losses”.
B.Translation of foreign operations
(a)The operating results and financial position of all the Group entities that have a functional
currency different from the presentation currency are translated into the presentation currency
as follows:
~12~
i. Assets and liabilities for each balance sheet presented are translated at the closing
exchange rate at the date of that balance sheet;
ii. Income and expenses for each statement of comprehensive income are translated at
average exchange rates of that period; and
iii. All resulting exchange differences are recognized in other comprehensive income.
(b)When the foreign operation partially disposed of or sold is a subsidiary, cumulative exchange
differences that were recorded in other comprehensive income are proportionately transferred
to the non-controlling interest in this foreign operation.
(4) Classification of current and non-current items
A. Assets that meets one of the following criteria are classified as current assets; otherwise they are
classified as non-current assets:
(a)Assets arising from operating activities that are expected to be realized, or are intended to be
sold or consumed within the normal operating cycle;
(b)Assets held mainly for trading purposes;
(c)Assets that are expected to be realized within twelve months from the balance sheet date;
(d)Cash and cash equivalents, excluding restricted cash and cash equivalents and those that are to
be exchanged or used to pay off liabilities more than twelve months after the balance sheet
date.
B.Liabilities that meets one of the following criteria are classified as current liabilities; otherwise
they are classified as non-current liabilities:
(a)Liabilities that are expected to be paid off within the normal operating cycle;
(b)Liabilities arising mainly from trading activities;
(c)Liabilities that are to be paid off within twelve months from the balance sheet date;
(d)Liabilities for which the repayment date cannot be extended unconditionally to more than
twelve months after the balance sheet date. Terms of a liability that could, at the option of the
counterparty, result in its settlement by the issue of equity instruments do not affect its
classification.
(5) Cash and cash equivalents
Cash equivalents are short-term, highly liquid investments that are readily convertible to known
amount of cash and which are subject to an insignificant risk of changes in value.
(6) Financial assets at fair value through profit or loss
A.Financial assets at fair value through profit or loss are financial assets held for trading or financial
assets designated as at fair value through profit or loss on initial recognition. Financial assets
~13~
are classified in this category of held for trading if acquired principally for the purpose of selling
in the short-term. Derivatives are also categorized as financial assets held for trading unless they
are designated as hedges. Financial assets that meet one of the following criteria are designated as
at fair value through profit or loss on initial recognition:
(a)Hybrid (combined) contracts; or
(b)They eliminate or significantly reduce a measurement or recognition inconsistency; or
(c)They are managed and their performance is evaluated on a fair value basis, in accordance with
a documented risk management or investment strategy.
B.On a regular way purchase or sale basis, financial assets at fair value through profit or loss are
recognised and derecognised using trade date accounting.
C.Financial assets at fair value through profit or loss are initially recognised at fair value. Related
transaction costs are expensed in profit or loss. These financial assets are subsequently
remeasured and stated at fair value, and any changes in the fair value of these financial assets are
recognised in profit or loss.
(7) Loans and receivables
A.Accounts receivable
Accounts receivable are loans and receivables originated by the entity. They are created by the
entity by selling goods or providing services to customers in the ordinary course of business.
Accounts receivable are initially recognised at fair value and subsequently measured at
amortised cost using the effective interest method, less provision for impairment.
However, short-term accounts receivable without bearing interest are subsequently measured at
initial invoice amount as the effect of discounting is immaterial.
B.Bond investments without active market
(a)Bond investments without active market are loans and receivables not originated by the entity.
They are bond investments with fixed or determinable payments that are not quoted in an
active market, and also meet all of the following conditions:
i. Not designated on initial recognition as at fair value through profit or loss;
ii. Not designated on initial recognition as available-for-sale;
iii. Not for which the holder may not recover substantially all of its initial investment, other
than because of credit deterioration.
(b)On a regular way purchase or sale basis, bond investments without active market are
recognised and derecognised using trade date accounting.
(c)Bond investments without active market are initially recognised at fair value on the trade date
plus transaction costs and subsequently measured at amortised cost using the effective
interest method, less provision for impairment. Amortisation of a premium or a discount on
such assets is recognised in profit or loss.
(d)Bond investments without active market held by the Company are those time deposits with a
~14~
short maturity period but do not qualify as cash equivalents, and they are measured at initial
investment amount as the effect of discounting is immaterial.
(8) Available-for-sale financial assets
A.Available-for-sale financial assets are non-derivatives that are either designated in this category
or not classified in any of the other categories.
B.On a regular way purchase or sale basis, available-for-sale financial assets is recognized and
derecognized using trade date accounting.
C.Available-for-sale financial assets are initially recognized at fair value plus transaction costs.
These financial assets are subsequently remeasured and stated at fair value, and any changes in
the fair value of these financial assets are recognized in other comprehensive income.
(9) Impairment of financial assets
A.The Company assesses at each balance sheet date whether there is objective evidence that a
financial asset or a group of financial assets is impaired as a result of one or more events that
occurred after the initial recognition of the asset (a ‘loss event’) and that loss event (or events)
has an impact on the estimated future cash flows of the financial asset or group of financial assets
that can be reliably estimated.
B.The criteria that the Company uses to determine whether there is objective evidence of
impairment loss is as follows:
(a)Significant financial difficulty of the issuer or debtor;
(b)A breach of contract, such as a default or delinquency in interest or principal payments;
(c)The Company, for economic or legal reasons relating to the borrower’s financial difficulty,
granted the borrower a concession that a lender would not otherwise consider;
(d)It becomes probable that the borrower will enter bankruptcy or other financial reorganization;
(e)The disappearance of an active market for that financial asset because of financial difficulties;
(f)Observable data indicating that there is a measurable decrease in the estimated future cash
flows from a group of financial assets since the initial recognition of those assets, although the
decrease cannot yet be identified with the individual financial asset in the group, including
adverse changes in the payment status of borrowers in the group or national or local economic
conditions that correlate with defaults on the assets in the group;
(g)Information about significant changes with an adverse effect that have taken place in the
technology, market, economic or legal environment in which the issuer operates, and indicates
that the cost of the investment in the equity instrument may not be recovered; or
(h)A significant or prolonged decline in the fair value of an investment in an equity instrument
below its cost.
C.When the Company assesses that there has been objective evidence of impairment and an
~15~
impairment loss has occurred, accounting for impairment is made as follows:
(a)Financial assets measured at amortized cost
The amount of the impairment loss is measured as the difference between the asset’s carrying
amount and the present value of estimated future cash flows discounted at the financial asset’s
original effective interest rate, and is recognized in profit or loss. If, in a subsequent periods,
the amount of the impairment loss decreases and the decrease can be related objectively to an
event occurring after the impairment loss was recognized, the previously recognized
impairment loss is reversed through profit or loss to the extent that the carrying amount of the
asset does not exceed its amortized cost that would have been at the date of reversal had the
impairment loss not been recognized previously. Impairment loss is recognized and reversed
by adjusting the carrying amount of the asset through the use of an impairment allowance
account.
(b)Available-for-sale financial assets
The amount of the impairment loss is measured as the difference between the asset’s
acquisition cost (less any principal repayment and amortisation) and current fair value, less
any impairment loss on that financial asset previously recognized in profit or loss and is
reclassified from “other comprehensive income” to “profit or loss”. If, in a subsequent period,
the fair value of an investment in a debt instrument increases, and the increase can be related
objectively to an event occurring after the impairment loss was recognized, then such
impairment loss is reversed through profit or loss. Impairment loss of and investment in an
equity instrument recognized in profit or loss shall not be reversed through profit or loss.
Impairment loss is recognized and reversed by adjusting the carrying amount of the asset
through the use of an impairment allowance account.
(10) Derecognition of financial assets
The Company derecognizes a financial asset only when the contractual rights to receive cash flows
expire.
(11) Inventories
Inventories are stated at the lower of cost and net realizable value. Cost is determined using the
weighted - average method. The cost of finished goods and work - in - process comprises raw
materials, direct labor, other direct costs and related production overheads (allocated based on
normal operating capacity). The item - by - item approach is used in applying the lower of cost and
net realizable value. Net realizable value is the estimated selling price in the ordinary course of
business, less the estimated cost of completion and applicable variable selling expenses.
(12) Property, plant and equipment
A.Property, plant and equipment are initially recorded at cost. Borrowing costs incurred during the
~16~
construction periods are capitalized.
B.Subsequent costs are included in the asset’s carrying amount or recognized as a separate asset,
as appropriate, only when it is probable that future economic benefits associated with the item
will flow to the Company and the cost of the item can be measured reliably. The carrying
amount of the replaced part is derecognized. All other repairs and maintenance are charged to
profit or loss during the financial periods in which they are incurred.
C.Property, plant and equipment cost are measured at cost, and are depreciated using the
straight-line method to allocate their cost over their estimated useful lives. Significant
components are depreciated separately.
D.The assets’ residual values, useful lives and depreciation methods are reviewed, and adjusted if
appropriate, at each balance sheet date. If expectations for the assets’ residual values and useful
lives differ from previous estimates or the patterns of consumption of the assets’ future
economic benefits embodied in the assets have changed significantly, any change is accounted
for as a change in estimate in accordance with IAS 8, ‘Accounting Policies, Changes in
Accounting Estimates and Errors’, from the date of the change. The estimated useful lives of
property, plant and equipment are as follows:
Machinery and equipment 3 ~ 8 years
Transportation equipment 5 years
Furniture and fixtures 3~ 5 years
Leasehold improvements 3~ 4 years
Other equipment 6 years
(13) Leased assets/ leases (lessee)
Payments made under an operating lease (net of any incentives received from the lessor) are
recognized in profit or loss on a straight-line basis over the lease term.
(14) Intangible assets
Computer software is stated at cost and amortised on a straight - line basis over its estimated
useful life of 3 to 5 years.
(15) Investments accounted for using the equity method
A.Subsidiaries are all entities over which the Company has control and governs the financial and
operating policies of the entity under a statute or an agreement (including Special Purpose
Entities ). In general, it is presumed that the investor has control, if an investor holds, directly
or indirectly 50 percent or more of the voting rights of the entity. Investment in subsidiaries are
accounted for using the equity method in the parent company only financial statements.
B.When the Company transacts with its subsidiaries, profits and losses resulting from the
transactions with the subsidiaries are recognized in the Company’s parent company only
financial statements only to the extent of interests in the subsidiaries that are not owned by the
~17~
Company. Accounting policies of subsidiaries have been adjustment where necessary to ensure
consistency with the policies adopted by the Company.
C.Under the equity method, an investment in a subsidiary is initially recognized at cost and
adjusted thereafter to recognize the Company’s share of profit or loss and other comprehensive
income of the subsidiary as well as the distribution received. The Company also recognized its
share in the changes in the equity of subsidiaries.
D.Changes in the Company’s ownership interests in subsidiaries that do not result in the Company
losing control over the subsidiaries are accounted for as equity transactions. Any difference
between the carrying amount of the subsidiary and the fair value of the consideration paid or
received is recognized directly in equity.
E.When the Company loses control of a subsidiary, any retained investment of the former
subsidiary is measured at the fair value at that date. A gain or loss is recognized in profit or loss
and calculated as the difference between (a) the aggregate of the fair value of consideration
received and the fair value of any retained interest at the date when control is lost; and (b) the
previous carrying amount of the investments in such subsidiary. In addition, the Company shall
account for all amounts previously recognized in other comprehensive income in relation to the
subsidiary on the same basis as would be required if the Company had directly disposed of the
related assets and liabilities.
F. In accordance with the “Rules Governing the Preparation of Financial Statements by Securities
Issuers”, profit and other comprehensive income in the parent company only financial
statements are the same with the profit and other comprehensive income which are attributable
to equity holders of the parent company in the consolidated financial statements. Also, the
equity in the parent company only financial statements is equal to equity attributable to owners
of the parent company in the consolidated financial statements.
(16) Impairment of non-financial assets
The Company assesses at each balance sheet date the recoverable amounts of those assets where
there is an indication that they are impaired. An impairment loss is recognized for the amount by
which the asset’s carrying amount exceeds its recoverable amount. The recoverable amount is the
higher of an asset’s fair value less costs to sell and value in use. When the circumstances or
reasons for recognizing impairment loss for an asset in prior years no longer exist, the impairment
loss shall be reversed to the extent of the loss previously recognized in profit or loss. The
increased carrying amount of an asset attributable to a reversal of an impairment loss shall not
exceed the carrying amount that would have been determined (net of amortization or depreciation )
had no impairment loss been recognized for the asset in prior years.
(17) Notes and accounts payable
Notes and accounts payable are obligations to pay for goods or services that have been acquired in
~18~
the ordinary course of business from suppliers. They are recognized initially at fair value and
subsequently measured amortised cost using the effective interest method. However, since
short-term accounts payable bear no interest, and considering that the effects of discounting would
not be significant, the Company subsequently measures those payables at the invoice amount.
(18) Derecognition of financial liabilities
A financial liability is derecognised when the obligation under the liability specified in the contract
is discharged or cancelled or expires.
(19) Provisions
Provisions (including warranties, etc.) are recognized when the Company has a present legal or
constructive obligation as a result of past events, and it is probable that an outflow of economic
resources will be required to settle the obligation and the amount of the obligation can be reliably
estimated. Provisions are measured at the present value of the expenditures expected to be
required to settle the obligation on the balance sheet date, which is discounted using a pre-tax
discount rate that reflects the current market assessments of the time value of money and the risks
specific to the obligation. Provisions are not recognized for future operating losses.
(20) Employee benefits
A.Short-term employee benefits
Short-term employee benefits are measured at the undiscounted amount of the benefits expected
to be paid in respect of service rendered by employees in a period and should be recognized as
expenses in that period when the employees render service.
B.Pensions
(a)Defined contribution plans
For defined contribution plans, the contributions are recognized as pension expenses when
they are due on an accrual basis. Prepaid contributions are recognized as an asset to the extent
of a cash refund or a reduction in the future payments.
(b)Defined benefit plans
i. Net obligation under a defined benefit plan is defined as the present value of an amount
of pension benefits that employees will receive on retirement for their services with the
Company in current period or prior periods. The liability recognized in the balance sheet
in respect of defined benefit pension plans is the present value of the defined benefit
obligation at the balance sheet date less the fair value of plan assets, together with
adjustments for unrecognized past service costs. The defined benefit net obligation is
calculated annually by independent actuaries using the projected unit credit method. The
rate used to discount is determined by using interest rates of high-quality corporate
bonds that are denominated in the currency in which the benefits will be paid, and that
~19~
have terms to maturity approximating to the terms of the related pension liability; when
there is no deep market in high-quality corporate bonds, the Company uses interest rates
of government bonds (at the balance sheet date) instead.
ii. Actuarial gains and losses arising on defined benefit plans are recognized in other
comprehensive income in the periods in which they arise.
C.Employees’ bonus and directors’ and supervisors’ remuneration
Employees’ bonus and directors’ and supervisors’ remuneration are recognized as expenses and
liabilities, provided that such recognition is required under legal or constructive obligation and
those amounts can be reliably estimated. However, if the accrued amounts for employees’ bonus
and directors’ and supervisors’ remuneration are different from the actual distributed amounts as
resolved by the stockholders at their stockholders’ meeting subsequently, the differences should
be recognized based on the accounting for changes in estimates. The Company calculates the
number of shares of employees’ stock bonus based on the fair value per share at the previous
day of the stockholders’ meeting held in the year following the financial reporting year, and
after taking into account the effects of ex-rights and ex-dividends.
(21) Employee share-based payment
A.For the equity-settled share-based payment arrangements, the employee services received are
measured at the fair value of the equity instruments granted at the grant date, and are recognized
as compensation cost over the vesting periods, with a corresponding adjustment to equity. The
fair value of the equity instruments granted shall reflect the impact of market vesting conditions
and non-market vesting conditions. Compensation cost is subject to adjustment based on the
service conditions that are expected to be satisfied and the estimates of the number of equity
instruments that are expected to vest under the non-market vesting conditions at each balance
sheet date. And ultimately, the amount of compensation cost recognized is based on the number
of equity instruments that eventually vest.
B.For the cash-settled share-based payment arrangements, the employee services received and the
liability incurred are measured at the fair value of the liability to pay for those services, and are
recognized as compensation cost and liability over the vesting period. The fair value of the
liability shall be remeasured at each balance sheet date until settled at the settlement date, with
any changes in fair value recognized in profit or loss.
(22) Income tax
A.The tax expense for the periods comprises current and deferred tax. Tax is recognized in profit
or loss, except to the extent that it relates to items recognized in other comprehensive income or
items recognized directly in equity, in which cases the tax is recognized in other comprehensive
income or equity.
B.The current income tax charge is calculated on the basis of the tax laws enacted or substantively
~20~
enacted at the balance sheet date in the countries where the Company operates and generates
taxable income. Management periodically evaluates positions taken in tax returns with respect
to situations in accordance with applicable tax regulations. It establishes provisions where
appropriate based on the amounts expected to be paid to the tax authorities. An additional 10%
tax is levied on the unappropriated retained earnings and is recorded as income tax expense in
the year the stockholders resolve to retain the earnings.
C.Deferred income tax is recognized, using the balance sheet liability method, on temporary
differences arising between the tax bases of assets and liabilities and their carrying amounts in
the consolidated balance sheet. Deferred income tax is provided on temporary differences
arising on investments in subsidiaries, except where the timing of the reversal of the temporary
difference is controlled by the Company and it is probable that the temporary difference will not
reverse in the foreseeable future. Deferred income tax is determined using tax rates (and laws)
that have been enacted or substantially enacted by the balance sheet date and are expected to
apply when the related deferred income tax asset is realized or the deferred income tax liability
is settled.
D.Deferred income tax assets are recognized only to the extent that it is probable that future
taxable profit will be available against which the temporary differences can be utilized. At each
balance sheet date, unrecognized and recognized deferred income tax assets are reassessed.
E.Current income tax assets and liabilities are offset and the net amount reported in the balance
sheet when there is a legally enforceable right to offset the recognized amounts and there is an
intention to settle on a net basis or realize the asset and settle the liability simultaneously.
Deferred income tax assets and liabilities are offset on the balance sheet when the entity has the
legally enforceable right to offset current tax assets against current tax liabilities and they are
levied by the same taxation authority on either the same entity or different entities that intend to
settle on a net basis or realize the asset and settle the liability simultaneously.
(23) Share capital
Ordinary shares are classified as equity. Incremental costs directly attributable to the issuance of
new shares or stock options are shown in equity as a deduction, net of tax, from the proceeds.
(24) Dividends
Dividends are recorded in the Company’s financial statements in the periods in which they are
approved by the Company’s shareholders. Cash dividends are recorded as liabilities.
(25) Revenue recognition
The Company manufactures and sells precision instruments and machinery. Revenue is measured
at the fair value of the consideration received or receivable taking into account value-added tax,
returns, rebates and discounts for the sale of goods to external customers in the ordinary course of
~21~
the Company’s activities. Revenue arising from the sales of goods should be recognized when the
Company has delivered the goods to the customer, the amount of sales revenue can be measured
reliably and it is probable that the future economic benefits associated with the transaction will
flow to the entity. The delivery of goods is completed when the significant risks and rewards of
ownership have been transferred to the customer, the Company retains neither continuing
managerial involvement to the degree usually associated with ownership nor effective control over
the goods sold, and the customer has accepted the goods based on the sales contract or there is
objective evidence showing that all acceptance provisions have been satisfied.
5. CRITICAL ACCOUNTING JUDGEMENTS, ESTIMATES AND KEY SOURCES OF
ASSUMPTION UNCERTAINTY
The preparation of these financial statements requires management to make critical judgements in
applying the Company’s accounting policies and make critical assumptions and estimates concerning
future events. Judgements and estimates are continually evaluated and adjusted based on historical
experience and other factors.
(1) Critical judgements in applying the Company’s accounting policies
None.
(2) Critical accounting estimates and assumptions
The Company makes estimates and assumptions based on the expectation of future events that are
believed to be reasonable under the circumstances at the end of the reporting periods. The resulting
accounting estimates might be different from the related actual results. The estimates and
assumptions that have a significant risk of causing a material adjustment to the carrying amounts of
assets and liabilities within the next financial year are addressed below:
A.Valuation of inventories
As inventories are stated at the lower of cost and net realizable value, the Company must
determine the net realizable value of inventories on balance sheet date using judgements and
estimates. Due to the rapid technological innovation, the Company evaluates the amounts of
normal inventory consumption, obsolete inventories or inventories without market selling value
on balance sheet date, and writes down the cost of inventories to the net realizable value. Such
a valuation of inventories is principally based on the demand for the products within the specified
periods in the future. Therefore, there might be material changes to the valuation.
As of December 31, 2014, the carrying amount of inventories was $816,609.
B.Realisability of deferred income tax assets
Deferred income tax assets are recognized only to the extent that it is probable that future taxable
profit will be available against which the deductible temporary differences can be utilized.
Assessment of the realisability of deferred income tax assets involves critical accounting
~22~
judgements and estimates of the management, including the assumptions of expected future sales
revenue growth rate and profit rate, tax exempt duration, available tax credits, tax planning, etc.
Any variations in global economic environment, industrial environment, and laws and regulations
might cause material adjustments to deferred income tax assets.
As of December 31, 2014, the Company recognized deferred income tax assets amounting to
$50,129.
C.Provision for warranty liability
Warranty liabilities are primarily arising from sales of equipment. The amount of the obligation is
estimated based on the sufficient objective evidences, including the historical warranty records.
As of December 31, 2014, the carrying amount of accrued warranty liabilities was $1,471,138.
6. DETAILS OF SIGNIFICANT ACCOUNTS
(1) Cash and cash equivalents
A.The Company transacts with a variety of financial institutions all with high credit quality to
disperse credit risk, so it expects that the probability of counterparty default is remote. The
Company’s maximum exposure to credit risk at balance sheet date is the carrying amount of all
cash and cash equivalents.
B.The Company has no cash pledged to others.
(2) Financial assets at fair value through profit or loss
A.The Company recognised net gain of $1,805 and $0 on financial assets held for trading for the
years ended December 31, 2014 and 2013, respectively.
B.The Company has no financial assets at fair value through profit or loss pledged to others.
December 31, 2014 December 31, 2013
Cash on hand 228$ 261$
Checking accounts and
demand deposits 2,106,255 2,238,877
Time deposits 5,123,700 2,950,673
7,230,183$ 5,189,811$
Items December 31, 2014 December 31, 2013
Current items:
Financial assets held for trading
Beneficiary certificates 1,100,000$ -$
Valuation 1,805 -
Total 1,101,805$ -$
~23~
(3) Available-for-sale financial assets
The Company did not recognize any other comprehensive income for fair value change for the years
ended December 31, 2014.
(4) Investments in bonds without active markets
A.The Company listed the time deposits with maturities exceeding 90 days in this account.
B.The Company recognized interest of $6,654 and $1,595 in profit for the years ended December
31, 2014 and 2013, respectively.
C.The counterparties of the Company’s investments have good credit quality. The maximum
exposure to credit risk at balance sheet date is the carrying amount of investments in bonds
without active markets.
(5) Accounts receivable
A.The credit rating of accounts receivable that were neither past due nor impaired had good credit
quality.
B.As of December 31, 2014 and 2013, the maximum exposure to credit risk was the carrying
amount of accounts receivable.
C.The Company does not hold any collateral as security.
(6) Inventories
Item December 31, 2014 December 31, 2013
Noncurrent
Non-listed and emerging stocks 7,450$ 4,412$
Valuation adjustment of available-for-sale
financial assets - -
Total 7,450$ 4,412$
Item December 31, 2014 December 31, 2013
Time deposit 1,266,000$ 2,891,085$
December 31, 2014 December 31, 2013
Accounts receivable 2,633,803$ 1,365,752$
Less: allowance for bad debts - -
2,633,803$ 1,365,752$
Cost
Allowance for
valuation loss Book value
Raw materials 476,107$ 120,712)($ 355,395$
Work - in - process 392,441 - 392,441
Finished goods 236,738 167,965)( 68,773
Total 1,105,286$ 288,677)($ 816,609$
December 31, 2014
~24~
The cost of inventories recognised as expense for the period:
(7) Investment accounted for using the equity method
A.Investments in subsidiaries:
(a)The information of the subsidiaries: please refer to Note 4(3) of the consolidated financial
statements for the year ended December 31, 2014.
Note: In consideration of the operations of the group, the Board of Directors had approved the
adjustment in the group structure. As a result, investments in subsidiaries are made through
" Union Money Market " 7,715,275 100,135 - 100,135 "
Footnote
(Note 4)Securities held by
Marketable securities
(Note 1)
General
ledger account
As of December 31, 2014
~50~
d) Aggregate purchase or sales of the same securities reaching $300,000 or 20% of paid-in capital or more for the year ended December 31, 2014:
Note 1: Marketable securities in the table refer to stocks, bonds, beneficiary certificates and other related derivative securities.
Note 2: Fill in the columns the counterparty and relationship if securities are accounted for under the equity method; otherwise leave the columns blank.
Note 3: Aggregate purchases and sales amounts should be calculated separately at their market values to verify whether they individually reach NT$300 million or 20% of paid-in capital or more.
Note 4: Paid-in capital referred to herein is the paid-in capital of parent company. In the case that shares were issued with no par value or a par value other than NT$10 per share, the 20 % of paid-in capital shall be replaced by
10% of equity attributable to owners of the parent in the calculation.
e) Acquisition of real estate reaching $300,000 or 20% of paid-in capital or more for the year ended December 31, 2014: None.
f) Disposal of real estate reaching $300,000 or 20% of paid-in capital or more for the year ended December 31, 2014: None.
g) Purchases or sales of goods from or to related parties reaching $100,000 or 20% of paid-in capital or more for the year ended December 31, 2014:
h) Receivables from related parties reaching $100,000 or 20% of paid-in capital or more as of December 31, 2014: None.
i) Derivative financial instruments undertaken during 2014: None.
Purchaser / Seller Counterparty
Relationship with the
counterparty
Purchases /
(sales) Amount
Percentage of
purchases/(sales) Credit term Unit price Term Amount
Percentage of accounts
(payable)/ receivable
Hermes
Microvision, Inc.
Hermes Microvision
Japan Inc.
Subsidiary Sales ($ 169,509) (2%) 30 days after
delivery
Approximately
the same with
third party
transactions
Approximately the
same with third
party transactions
$ 3,161 -
″ Hermes Microvision,
Inc.
″ Sales ( 291,680) (4%) 30 days after
delivery
″ ″ 38,498 1%
″ Hermes Microvision,
Co., Ltd. (Beijing)
″ Purchases 116,484 8% 30 days after
acceptance
″ ″ ( 12,299) (6%)
″ Hermes Microvision,
Inc.
″ Purchases 663,902 46% 30 days after
acceptance
″ ″ ( 73,667) (35%)
Difference in transaction terms
Transactions compared to third party transactions Accounts receivable / (payable)
~52~
j) Significant inter-company transactions during the year ended December 31, 2014:
General ledger
account Amount (Note 4) Terms
Percentage of
consolidated revenues
or total assets (Note 3)
0 Hermes Microvision, Inc. Hermes Microvision, Inc. (1) Sales 291,680$ The price and terms were based on the ordinary
course of business.
4.05%
0 " " (1) Purchases 663,902 The price and terms were based on the ordinary
course of business.
9.21%
0 " " (1) Contracted research expense 885,592 No similar types of transactions for comparison as
these transactions were based on mutually agreed
price and terms
12.28%
0 " " (1) Other expenses 89,539 " 1.24%
0 " " (1) Accounts receivable 38,498 Net 30 days, after delivery 0.25%
0 " " (1) Accounts payable 73,667 Net 30 days, after acceptance 0.49%
0 " " (1) Other payables 105,257 No similar types of transactions for comparison as
these transactions were based on mutually agreed
price and terms
0.69%
0 " Hermes Microvision
Japan Inc.
(1) Sales 169,509 The price and terms were based on the ordinary
course of business.
2.35%
0 " Hermes Microvision
Korea Inc.
(1) Sales 34,898 " 0.48%
0 " " (1) Other expenses 14,909 No similar types of transactions for comparison as
these transactions were based on mutually agreed
price and terms
0.21%
0 " " (1) Contracted research expense 24,377 " 0.34%
0 " Hermes Microrision Co.,
Ltd. (Beijing)
(1) Sales 116,484 The price and terms were based on the ordinary
course of business.
1.62%
0 " " (1) Accounts payable 12,299 Net 30 days, after acceptance 0.08%
" " (3) Sales 33,663 The price and terms were based on the ordinary
course of business.
0.47%
1 Hermes Microvision, Inc.
(USA)
" (3) Purchases 82,192 " 1.14%
1 " " (3) Contracted research expense 112,738 No similar types of transactions for comparison as
these transactions were based on mutually agreed
price and terms
1.56%
1 " " (3) Accounts payable 29,789 Net 30 days, after acceptance 0.20%
Number
(Note 1) Company Counterparty
Relationship
(Note 2)
Transactions
~53~
Note 1: The numbers filled in for the transaction company in respect of inter-company transactions are as follows:
(1) Parent company is ‘0’.
(2) The subsidiaries are numbered in order starting from ‘1’.
Note 2: Relationship between transaction company and counterparty is classified into the following three categories;
(1) Parent company to subsidiary.
(2) Subsidiary to parent company.
(3) Subsidiary to subsidiary.
Note 3: Regarding percentage of transaction amount to consolidated total operating revenues or total assets, it is computed based on periods-end balance of transaction to total
assets for balance sheet accounts and based on accumulated transaction amount for the periods to total operating revenues for income statement accounts.
Note 4: Only transactions with amount equal to or higher than NT$10,000 thousand are disclosed.
Note 5: Transactions between these related parties are not disclosed separately.
~54~
(2) Information of investees as of December 31, 2014:
(3) Information on investment in Mainland China:
(a) Basic information
Investor Investee Location Main business activities December 31, 2014 December 31, 2013 In Shares Percentage Book value
Note 1:Hermes Microvision, Inc. holds shares amounting to 24,500,000 shares of preferred stock and 37,285,000 shares of common stock.
Note 2:Considering the operation of group organization, the Board of Directors had approved the adjustment of the organization. Invests subsidiaries through HMI Holdings Inc.
~63~
HERMES MICROVISION, INC
STATEMENT OF ACCOUNT PAYABLE
DECEMBER 31, 2014
(EXPRESS IN THOUSAND OF NEW TAIWAN DOLLARS)
Vendor Name Amount
Note
Non related parties
A $ 18,426
B
16,614
C
15,571
D
8,868
E
7,038
Others 49,845
The amount of
individual clients
included in others
does not exceed 5%
of the account
balance
116,362
Related parties
Hermes Microvision, Inc.
73,667
Hermes Microvision Co., Ltd
( Beijing )
12,299
Others 5,360
91,326
Total $ 207,688
~64~
ERMES MICROVISION, INC
STATEMENT OF NET OPERATING REVENUE
FOR THE YEAR ENDED DECEMBER 31, 2014
(EXPRESS IN THOUSAND OF NEW TAIWAN DOLLARS)
Item
Amount
Machine
$ 6,851,072
Other operating revenue
539,614
7,390,686
Less: Sales return and allowance
( 509)
$ 7,390,177
~65~
HERMES MICROVISION, INC
STATEMENT OF OPERATING COST
FOR THE YEAR ENDED DECEMBER 31, 2014
(EXPRESS IN THOUSAND OF NEW TAIWAN DOLLARS)
Items
Amount
Raw materials
Add : Balance, beginning of year
$ 456,285
Raw materials purchased
1,322,432
Transferred from work -in - process
3,444,594
Transferred from expenses
16,433
Less : Raw material, end of year
( 476,107)
Inventory loss on material
( 1,264)
Scrapped loss on material
( 70,887)
Sales of raw materials
( 396,336)
Transferred to property, plant and equipment
( 3,318)
Raw materials used
4,291,832
Manufacturing expenses
290,685
Manufacturing cost
4,582,517
Add : Work - in - process, beginning of year
413,306
Work - in - process purchased
41,068
Transferred from finished goods
286,002
Less : Work - in - process, end of year
( 392,441)
Transferred to raw materials
( 4,787,531)
Transferred to expenses
( 33,373)
Cost of finished goods
109,548
Add : Finished goods, beginning of year
217,171
Finished goods purchased
95,132
Transferred from property, plant and equipment
1,342,937
Less : Finished goods, end of year
( 236,738)
Transferred to work-in-process
( 286,002)
Transferred to expenses
( 8,412)
Subtotal
1,233,636
Sales of raw materials
396,336
Provision for inventory valuation and obsolescence
86,128
Others
780,756
Total
$ 2,496,856
~66~
HERMES MICROVISION, INC
STATEMENT OF MANUFACTURING EXPENSES
FOR THE YEAR ENDED DECEMBER 31, 2014
(EXPRESS IN THOUSAND OF NEW TAIWAN DOLLARS)
Items
Amount
Note
Payroll expenses
$ 217,775
Depreciation
23,740
Rental expenses
21,375
Miscellaneous expenses
20,465
Others
7,330
The amount of each
item in others does not
exceed 5% of the
account balance.
$ 290,685
~67~
HERMES MICROVISION, INC
STATEMENT OF OPERATING EXPENSES
FOR THE YEAR ENDED DECEMBER 31, 2014
(EXPRESS IN THOUSAND OF NEW TAIWAN DOLLARS)
Items
Amount
Note
Selling expenses
Payroll expenses
$ 130,484
Commission expenses
145,186
Business promotion expenses
47,078
Service expenses
47,307
Import and export expenses
23,240
Others
618
The amount of each item in
others does not exceed 5% of
the account balance.
Total
$ 393,913
General and administrative expenses
Payroll expenses
$ 146,631
Depreciation
11,431
Miscellaneous expenses
25,252
Others
38,133
The amount of each item in
others does not exceed 5% of
the account balance.
Total
$ 221,447
Research and development expenses
Contracted research expenses
$ 885,592
Payroll expenses
204,698
Others
86,378
The amount of each item in
others does not exceed 5% of
the account balance.
Total
$ 1,176,668
~68~
HERMES MICROVISION, INC
SUMMARY OF LABOR, DEPRECIATION, AMORTIZATION EXPENSES BY FUNCTION