Page 1
1/18/2017
1
High Yield Soybeans
Chad Lee, Ph.D.Grain Crops Extension | University of Kentucky
[email protected] | www.uky.edu/Ag/GrainCrops
1/18/2017 1© 2011-2017 Chad Lee, Univ. of Kentucky
Soybean Yield
• Seed Number x Seed Size = Yield
• Plants/A x Pods/Plant x Seeds/Pod = Seed Number
• Seeds/lb x lb/bu = Seed Size
1/18/2017 © 2011-2017 Chad Lee, Univ. of Kentucky 7
Page 2
1/18/2017
2
Soybean Yield
Plants /APods/ Plant
Seeds /Pod
Seed Size,
seeds/lb
Test Weight, lb/bu
Yield, lb/A
( 140,000 x 40 x 2.5 ) / ( 5,000 x 60 ) = 47
( 140,000 x 60 x 2.5 ) / ( 5,000 x 60 ) = 70
( 140,000 x 40 x 2.5 ) / ( 4,000 x 60 ) = 58
( 140,000 x 60 x 2.5 ) / ( 4,000 x 60 ) = 88
1/18/2017 © 2011-2017 Chad Lee, Univ. of Kentucky 9
Soybean Yield
Plants /APods/ Plant
Seeds /Pod
Seed Size, seeds/lb
Test Weight, lb/bu
Yield, lb/A
( 140,000 x 40 x 2.5 ) / ( 5,000 x 60 ) = 47
( 140,000 x 83 x 2.5 ) / ( 3,000 x 60 ) = 161
( 140,000 x 88 x 2.5 ) / ( 3,000 x 60 ) = 171
1/18/2017 © 2011-2017 Chad Lee, Univ. of Kentucky 10
Page 3
1/18/2017
3
Common practices of high yield soybean plots
• Irrigate• Manure• Fertigate, including N• Fungicide• Insecticide• Other products mentioned
– Inoculants– Stimulants– Stress reducers– Stress inducers– Sugar
1/18/2017 © 2011-2017 Chad Lee, Univ. of Kentucky 11
108.759 bu/A
• Perry Galloway
• Pioneer 46T21 RR
• 4/30/15
• 140,000 seeds/A
• 38 inch twin rows
• Dubbs soil
• PPST, Graph EX SA
• 2 tons poultry litter
• BioForge, Ureamate, Sugar Mover
• Valor, Gramoxone
• Pre-Fix, Dual, Blazer
• Lambda, Prevathon
• Priaxor, Quadris Top
• 6 x furrow irrigation
• Paraquat 0.5 pt/A
1/18/2017 © 2011-2017 Chad Lee, Univ. of Kentucky 13
Chicken Litter: 55-55-45(Highly variable)
Page 4
1/18/2017
4
108.717 bu/A
• Matt Miles• Pioneer 47T46 RR• 4/7/15• 160,000 seeds/A• 38 inch twin• Silt loam soil• Cruiser Max• 1.75 T Chicken Litter,
150 lb K2O/A, AMS at R3
• Leadoff, Touchdown• Verdict, Touchdown• Prefix, Touchdown• Tundra, Acephate• Priaxor, twice• Furrow irrigation, 7x• Salt + Sharpen harvest
aid
1/18/2017 © 2011-2017 Chad Lee, Univ. of Kentucky 15
Chicken Litter: 55-55-45(Highly variable)
1/18/2017 © 2011-2017 Chad Lee, Univ. of Kentucky 16
90
180
270
360
450
3366
99132
165
0
100
200
300
400
500
30 60 90 120 150
lbs N/acre
Yield, Bu/A
Soybean Seed Nitrogen RemovalN P2O5 K2O Zn S
Page 5
1/18/2017
5
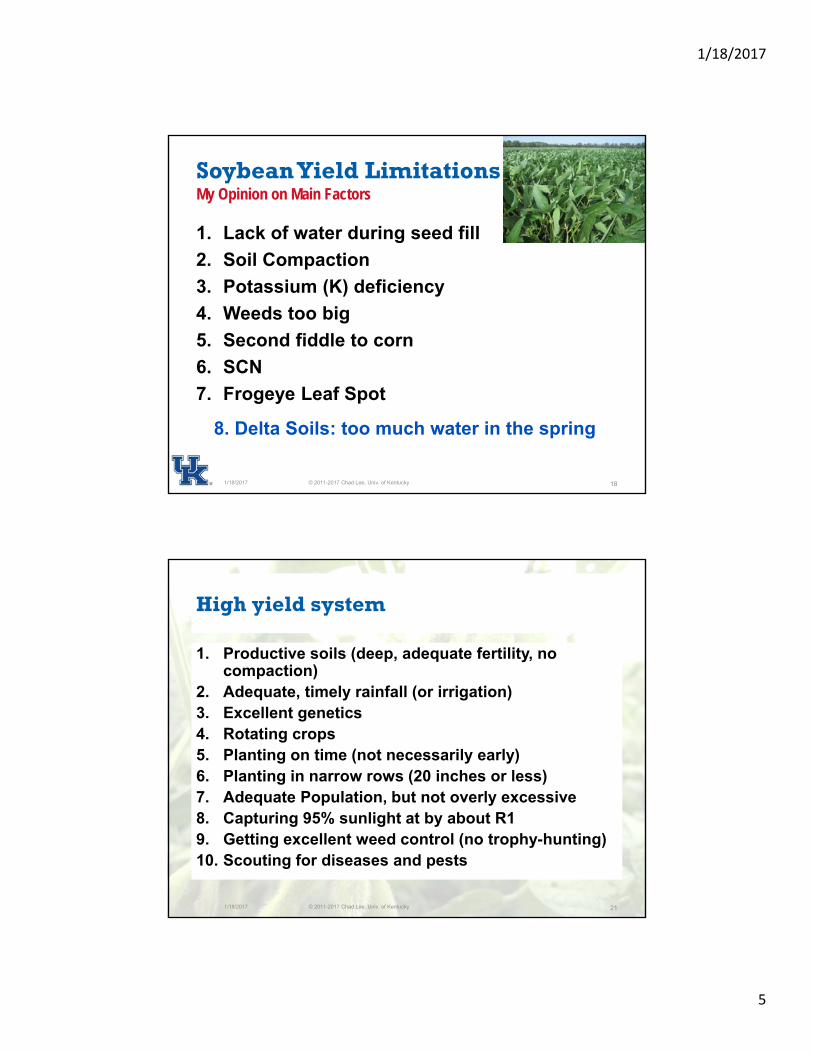
Soybean Yield LimitationsMy Opinion on Main Factors
1. Lack of water during seed fill
2. Soil Compaction
3. Potassium (K) deficiency
4. Weeds too big
5. Second fiddle to corn
6. SCN
7. Frogeye Leaf Spot
1/18/2017 © 2011-2017 Chad Lee, Univ. of Kentucky 18
8. Delta Soils: too much water in the spring
High yield system
1. Productive soils (deep, adequate fertility, no compaction)
2. Adequate, timely rainfall (or irrigation)3. Excellent genetics4. Rotating crops5. Planting on time (not necessarily early)6. Planting in narrow rows (20 inches or less)7. Adequate Population, but not overly excessive8. Capturing 95% sunlight at by about R19. Getting excellent weed control (no trophy-hunting)10. Scouting for diseases and pests
© 2011-2017 Chad Lee, Univ. of Kentucky 211/18/2017
Page 6
1/18/2017
6
Agronomic Maximization of Soybean Yield and Quality
1/18/2017 © 2011-2017 Chad Lee, Univ. of Kentucky 23
USB 1 “SOYA” – Adding Inputs
1/18/2017 © 2011-2017 Chad Lee, Univ. of Kentucky 34
Page 7
1/18/2017
7
USB 1 “SOYA”: Systematic Optimization of Yield-Enhancing Applications
• Seed Treatements (ST):– Untreated control (UTC)
– Fungicide seed treatment (Fung ST) Acceleron®(45ml/100 lb)
– Fung ST + Insecticide ST + Nematicide & Biological ST AcceleronTM IX-409 (w/ Imidacloprid) (118ml/100 lb) + Poncho®/VOTiVO® (P/V) (59ml/100 lb)
– Fung ST + Insecticide ST + Nematicide & Biological ST + LCO ST + LCO (at V4-V6) AcceleronTM IX-409 (w/ Imidacloprid) (118ml/100 lb) + P/V® (59ml/100 lb) + Optimize® (83ml/100 lb) + RatchetTM (4oz/a)
1/18/2017 © 2011-2017 Chad Lee, Univ. of Kentucky 35
USB 1 “SOYA”: Systematic Optimization of Yield-Enhancing Applications
• FOLIAR OR OTHER TREATMENTS:– Nitrogen Urea (75 lb/a) w/ Agrotain (3 qt/ton) +
ESN®(75 lb/a) @ V4
– Defoliant Cobra® (12 fl oz/a) @ V4
– Foliar fertilizer Task Force®2 (64 fl oz/a) @ R1
– Antioxidant Bio-Forge® (16 fl oz/a) @ R3
– Foliar fungicide Headline® (6 fl oz/a) @ R3
– Foliar insecticide Warrior II® (1.92 fl oz/a) @ R3• F and I - Priaxor and Endigo in 2013 and 2014
1/18/2017 © 2011-2017 Chad Lee, Univ. of Kentucky 36
Page 8
1/18/2017
8
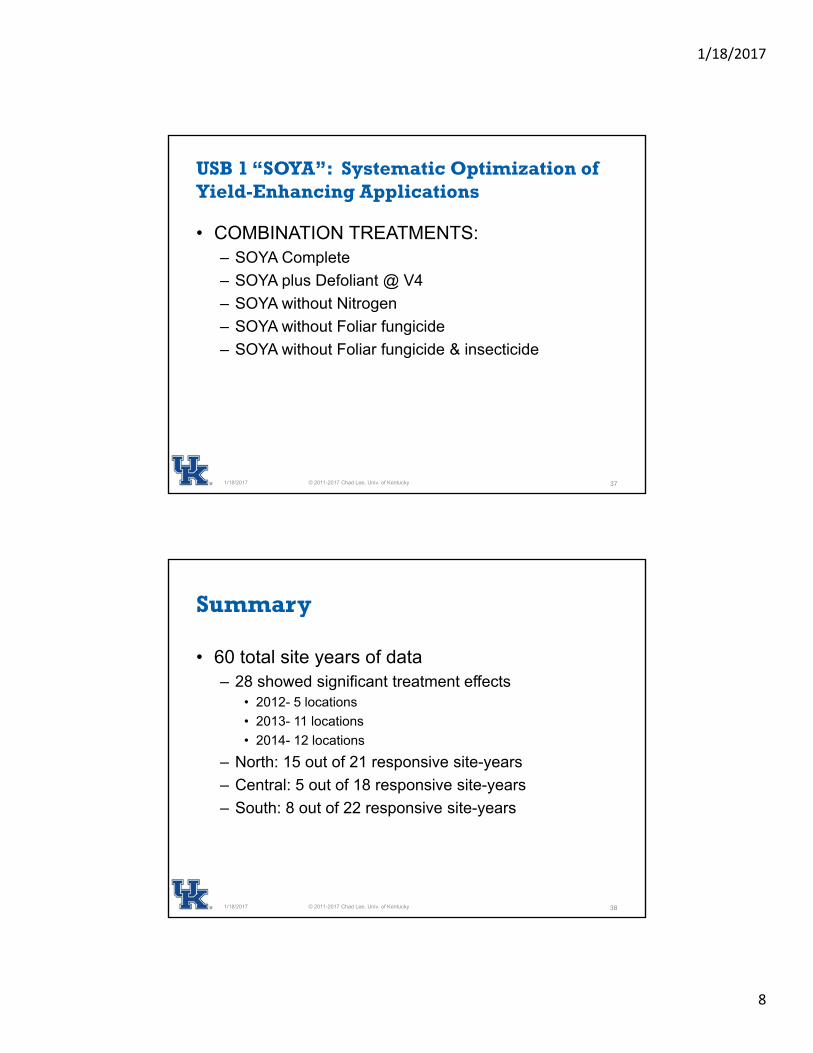
USB 1 “SOYA”: Systematic Optimization of Yield-Enhancing Applications
• COMBINATION TREATMENTS:– SOYA Complete
– SOYA plus Defoliant @ V4
– SOYA without Nitrogen
– SOYA without Foliar fungicide
– SOYA without Foliar fungicide & insecticide
1/18/2017 © 2011-2017 Chad Lee, Univ. of Kentucky 37
Summary
• 60 total site years of data– 28 showed significant treatment effects
• 2012- 5 locations
• 2013- 11 locations
• 2014- 12 locations
– North: 15 out of 21 responsive site-years
– Central: 5 out of 18 responsive site-years
– South: 8 out of 22 responsive site-years
1/18/2017 © 2011-2017 Chad Lee, Univ. of Kentucky 38
Page 9
1/18/2017
9
80.4
84.4
70 75 80 85
UTCBio-forgeFung ST
Fung and Inst. STFung, Inst and Bio…
Foliar FertilizerCobra
Foliar FungicideFoliar Insecticide
Foliar Fung and InstNitrogen
SOYA - CobraSOYA + Cobra
SOYA - NitrogenSOYA - Foliar Fung
SOYA - Foliar Fung + Inst
Yield (Bu/A)
High‐Yield Environments (>75.9 Bu/A)
*Red bars indicate statistically greater than UTC at p ≤ 0.05
ARcol13, ARcol14, ARnew14, ILurb14, INwla14, KYlex13, WIjan13, WIjan141/18/2017 © 2011-2017 Chad Lee, Univ. of Kentucky 40
59.8
64.4
54 56 58 60 62 64 66
UTCBio-forgeFung ST
Fung and Inst. STFung, Inst and Bio ST+Ratchet
Foliar FertilizerCobra
Foliar FungicideFoliar Insecticide
Foliar Fung and InstNitrogen
SOYA - CobraSOYA + Cobra
SOYA - NitrogenSOYA - Foliar Fung
SOYA - Foliar Fung + Inst
Yield (Bu/A)
Average Yielding Environments (n = 46)
Red bars indicate statistically greater than UTC at p ≤ 0.051/18/2017 © 2011-2017 Chad Lee, Univ. of Kentucky 41
Page 10
1/18/2017
10
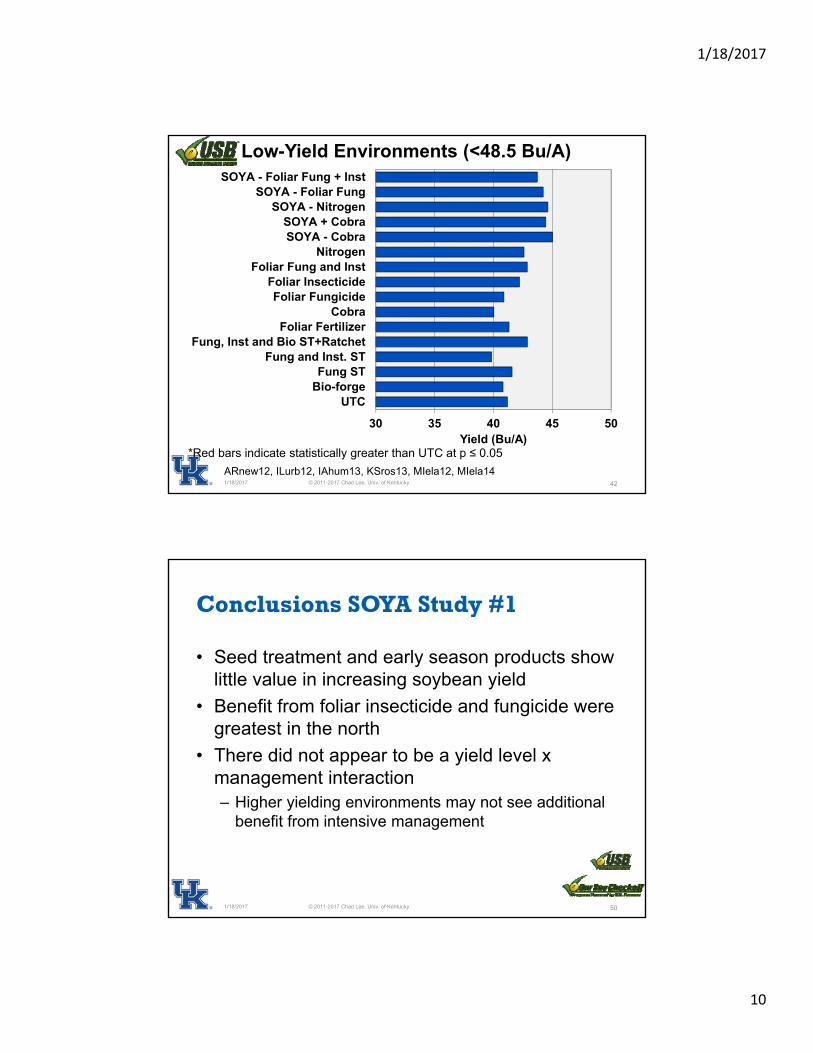
30 35 40 45 50
UTCBio-forgeFung ST
Fung and Inst. STFung, Inst and Bio ST+Ratchet
Foliar FertilizerCobra
Foliar FungicideFoliar Insecticide
Foliar Fung and InstNitrogen
SOYA - CobraSOYA + Cobra
SOYA - NitrogenSOYA - Foliar Fung
SOYA - Foliar Fung + Inst
Yield (Bu/A)
Low-Yield Environments (<48.5 Bu/A)
*Red bars indicate statistically greater than UTC at p ≤ 0.05
ARnew12, ILurb12, IAhum13, KSros13, MIela12, MIela141/18/2017 © 2011-2017 Chad Lee, Univ. of Kentucky 42
Conclusions SOYA Study #1
• Seed treatment and early season products show little value in increasing soybean yield
• Benefit from foliar insecticide and fungicide were greatest in the north
• There did not appear to be a yield level x management interaction– Higher yielding environments may not see additional
benefit from intensive management
1/18/2017 © 2011-2017 Chad Lee, Univ. of Kentucky 50
Page 11
1/18/2017
11
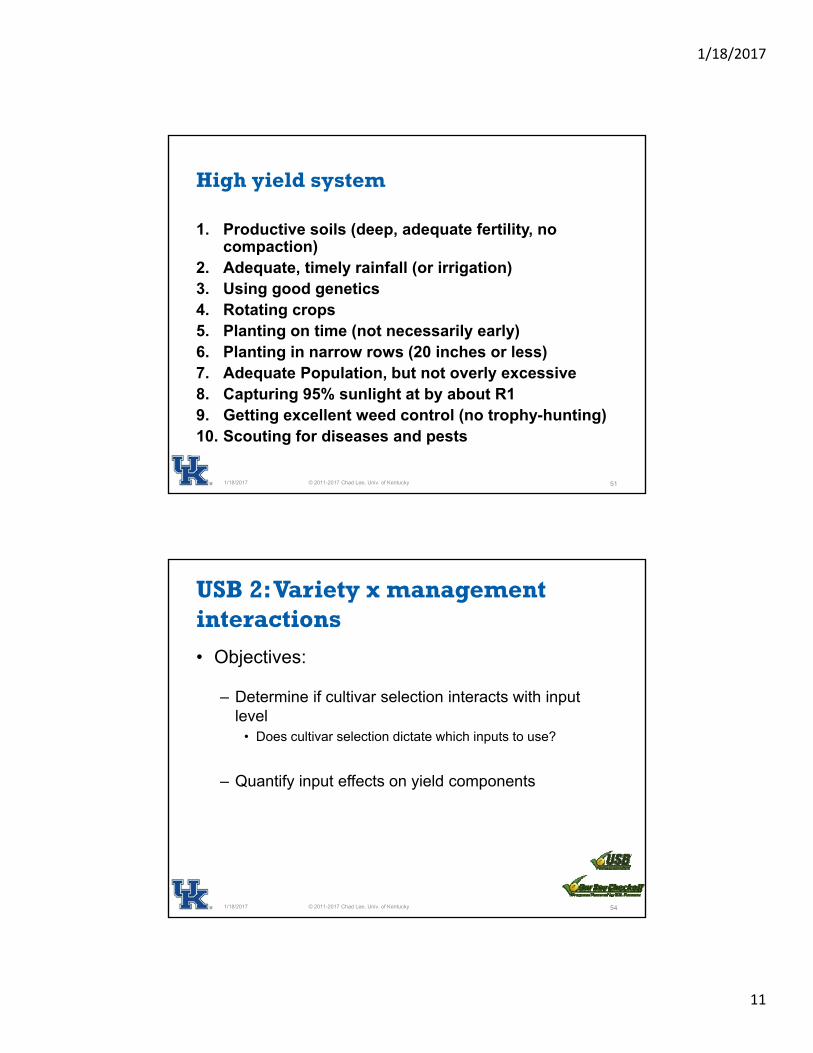
High yield system
1. Productive soils (deep, adequate fertility, no compaction)
2. Adequate, timely rainfall (or irrigation)3. Using good genetics4. Rotating crops5. Planting on time (not necessarily early)6. Planting in narrow rows (20 inches or less)7. Adequate Population, but not overly excessive8. Capturing 95% sunlight at by about R19. Getting excellent weed control (no trophy-hunting)10. Scouting for diseases and pests
© 2011-2017 Chad Lee, Univ. of Kentucky 511/18/2017
USB 2: Variety x management interactions
• Objectives:
– Determine if cultivar selection interacts with input level
• Does cultivar selection dictate which inputs to use?
– Quantify input effects on yield components
1/18/2017 © 2011-2017 Chad Lee, Univ. of Kentucky 54
Page 12
1/18/2017
12
Treatments• 6 cultivars
– High-yield potential suitable for each location
• 3 input levels:1. Standard practice (UTC)
• University recommendations for fertilizer and weed control
• No other external inputs
2. SOYA complete • “complete” seed treatment
• Ratchet® + nitrogen fertilizer @ V4
• Foliar fertilizer @ R1
• BioForge®, foliar fungicide, foliar insecticide @ R3
3. SOYA minus foliar fungicide
1/18/2017 © 2011-2017 Chad Lee, Univ. of Kentucky 55
2012-2014 YieldSouthern Region
(Arkansas, Kansas, Kentucky)
Columns with the same letter are not statistically different at P ≤ 0.05
Input level
1/18/2017 © 2011-2017 Chad Lee, Univ. of Kentucky 58
Page 13
1/18/2017
13
SOYA Study #2 Preliminary Conclusions
• A good cultivar is a good cultivar.– Cultivar interacted w/ management at less than
6% of the sites.
• Biggest yield increase to SOYA in the northern region.
• Yield increases were from BOTH seed number AND seed size.
1/18/2017 © 2011-2017 Chad Lee, Univ. of Kentucky 63
USB 3: Population x management interactions
• Objective:
– Is there an interaction between soybean population and management
• Do high-input systems require higher plant populations to maximize yield?
-or-
• Can high-input systems compensate for a low plant population?
1/18/2017 © 2011-2017 Chad Lee, Univ. of Kentucky 67
Page 14
1/18/2017
14
Analysis• Harvest plant populations were used for analysis
• Yield was standardized as a % of the maximum for each environment– 56 Environments total
• The “yield environment” variable was determined by comparison of location the mean to the grand mean (High>1 Std. Dev, Average±1 Std. Dev., Low<1 Std. Dev.)
• Mixed analysis was conducted to determine the effects of yield environment, population and management– SAS V9.3 (P<0.05)
1/18/2017 © 2011-2017 Chad Lee, Univ. of Kentucky 71
Harvest Plant Population (PPA)
0K 50K 100K 150K 200K 250K
% o
f Max
Yie
ld
0.0
0.2
0.4
0.6
0.8
1.0
2012‐2014 Average Yield Env.(43 Envs.)
UTC: %Max=0.7916(1-e(-0.000059x)) R2= 0.98
SOYA: %Max=0.8524(1-e(-0.000059x)) R2= 0.98
UTCSOYA
95% - 50775 ppa
99% - 78053 ppa
1/18/2017 © 2011‐2017 Chad Lee, Univ. of Kentucky 73
Page 15
1/18/2017
15
Harvest Plant Population (PPA)
0K 50K 100K 150K 200K 250K
% o
f Max
Yie
ld
0.0
0.2
0.4
0.6
0.8
1.0
2012‐2014 High Yield Env.(8 Envs.)
%Max=0.8644(1-e(-0.000062x)) R2= 0.99
95% - 48318 ppa
99% - 74276 ppa
1/18/2017 © 2011‐2017 Chad Lee, Univ. of Kentucky 74
Grouping N 95% ofMax
99% of Max
Plants/A Plants/A
High Yield 8 48,000 74,000
Average 43 51,000 78,000
Low Yield 5 88,000 135,000
Responsive 17 UTC 50,000 77,000
SOYA 53,000 82,000
1/18/2017 © 2011-2017 Chad Lee, Univ. of Kentucky 80
Populations rounded to the nearest thousand.
Page 16
1/18/2017
16
SOYA Study#3 Conclusions
• No interaction between population and management– Separate analysis of 17 management responsive sites confirmed
no interaction between population and management
• High yield environments achieved maximum yields at only slightly lower plant stands in comparison to average yield environments– 99% of Maximum at 74K compared with 78K (High and Average)
• Yield response to population was very small (non-existent) in low yielding environments indicating the presence of other yield limiting factors
1/18/2017 © 2011-2017 Chad Lee, Univ. of Kentucky 81
Evaluation ofSoybean Stress and Yield
Gary L. Gregg, Chad D. Lee, and John Orlowski
University of Kentucky | Department of Plant and Soil Sciences
Lexington, Kentucky
1021/18/2017 © 2011-2017 Chad Lee, Univ. of Kentucky
Page 17
1/18/2017
17
2012 Soybean Response to Various Herbicides
Herbicide Rate Timing Yield Contrast
untreated ……. …….. 58.7 NS
Cobra 1x V4 61.8 NS
Cobra 2x V4 60.5 NS
Reflex 2x V4 59.7 NS
Blazer 2x V4 62.7 NS
Cobra 1x V2 66.7 0.004 *****
meristem removal ….. V4 58.2 NS
© 2011-2017 Chad Lee, Univ. of Kentucky 104
Data averaged over 2 locations: Spindletop Farm, Lexington and Larue County, KY, 2012.
1/18/2017
Experiment Design
• Two Years: 2013 & 2014
• Three Locations– Lexington (Spindletop Research Farm)
– LaRue Co.
– Princeton (UKREC)
• Two Maturity Groups – 2.8 RM
– 4.5 RM
• 14 different treatments
1/18/2017 © 2011-2017 Chad Lee, Univ. of Kentucky 106
UKRECLaRue
Spindletop
Page 18
1/18/2017
18
Results, 2013-2014, 6 site-years, 2 maturity groups
© 2011-2017 Chad Lee, Univ. of Kentucky 1121/18/2017
*=treatments significantly different from the UTC. p <0.10
*
*
50
55
60
65
70
75
80
85
90
95
Bu/A
Yield Environment x Treatment Intreactions
High Yield Environments (n=4)
Discussion
• Treatment– Light interception equal during reproductive growth
• 2013, R3, Hodgenville– 26 DAT, 2.8 RM
– 33 DAT, 4.5 RM
• 2013, R3, Lexington– 26 DAT, 2.8 RM
– 34 DAT, 4.5 RM
• Lee, et al., 2008
– Lack of late season stress• Very low pressure from insects and disease
1/18/2017 © 2011-2017 Chad Lee, Univ. of Kentucky 116
Page 19
1/18/2017
19
Conclusion: 2 seasons with good rainfall, reasonable temperatures
• Early season stress ineffective for increasing yield
• Attempting to relieve early season stress was ineffective for increasing yield
• Prescribed application of fungicide and insecticide was ineffective for increasing yield
1/18/2017 © 2011-2017 Chad Lee, Univ. of Kentucky 118