Highlights Census of Population and Housing - 2012 North Central Province Indicator Unit North Central Province Anuradhapura District Polonnaruwa District Total population Number 1,266,663 860,575 406,088 By Sex Male Number 620,880 420,100 200,780 Female Number 645,783 440,475 205,308 By Sector Urban Percent 4.0 5.9 0.0 Rural Percent 96.0 94.1 100.0 Estate Percent 0.0 0.0 0.0 By Ethnicity Sinhalese Percent 90.9 91.0 90.7 Tamil Percent 1.0 0.6 1.8 Sri Lanka Moor Percent 8.0 8.2 7.4 Other Percent 0.1 0.2 0.1 By Religion Buddhist Percent 90.0 90.1 89.7 Hindu Percent 0.8 0.4 1.7 Islam Percent 8.0 8.3 7.5 Other Percent 1.2 1.2 1.1 By Education Status No schooling Percent 3.5 3.4 3.9 Passed primary Percent 25.6 25.2 26.4 Passed secondary Percent 46.6 46.1 47.7 Passed G.C.E. O/L or equivalent Percent 14.1 14.5 13.1 Passed G.C.E. A/L or equivalent Percent 8.6 9.1 7.7 Degree or above Percent 1.5 1.7 1.2 By Economic status Total Active Number 509,797 353,004 156,793 Male Active Number 366,202 245,647 120,555 Female Active Number 143,595 107,357 36,238 Total Inactive Number 419,865 276,660 143,205 Male Inactive Number 85,520 58,684 26,836 Female Inactive Number 334,345 217,976 116,369 Literacy Rate 95.4 95.7 94.8 Computer Literacy Rate 17.7 18.3 16.4
Transcript
Highlights
Census of Population and Housing - 2012 North Central Province
Indicator Unit North Central
Province Anuradhapura
District Polonnaruwa
District
Total population Number 1,266,663 860,575 406,088
By Sex Male Number 620,880 420,100 200,780
Female Number 645,783 440,475 205,308
By Sector Urban Percent 4.0 5.9 0.0
Rural Percent 96.0 94.1 100.0
Estate Percent 0.0 0.0 0.0
By Ethnicity Sinhalese Percent 90.9 91.0 90.7
Tamil Percent 1.0 0.6 1.8
Sri Lanka Moor Percent 8.0 8.2 7.4
Other Percent 0.1 0.2 0.1
By Religion Buddhist Percent 90.0 90.1 89.7
Hindu Percent 0.8 0.4 1.7
Islam Percent 8.0 8.3 7.5
Other Percent 1.2 1.2 1.1
By Education Status
No schooling Percent 3.5 3.4 3.9
Passed primary Percent 25.6 25.2 26.4
Passed secondary Percent 46.6 46.1 47.7
Passed G.C.E. O/L or equivalent
Percent 14.1 14.5 13.1
Passed G.C.E. A/L or equivalent
Percent 8.6 9.1 7.7
Degree or above Percent 1.5 1.7 1.2
By Economic status
Total Active Number 509,797 353,004 156,793
Male Active Number 366,202 245,647 120,555
Female Active Number 143,595 107,357 36,238
Total Inactive Number 419,865 276,660 143,205
Male Inactive Number 85,520 58,684 26,836
Female Inactive Number 334,345 217,976 116,369
Literacy Rate 95.4 95.7 94.8
Computer Literacy Rate 17.7 18.3 16.4
Census of Population and Housing - 2012 North Central Province
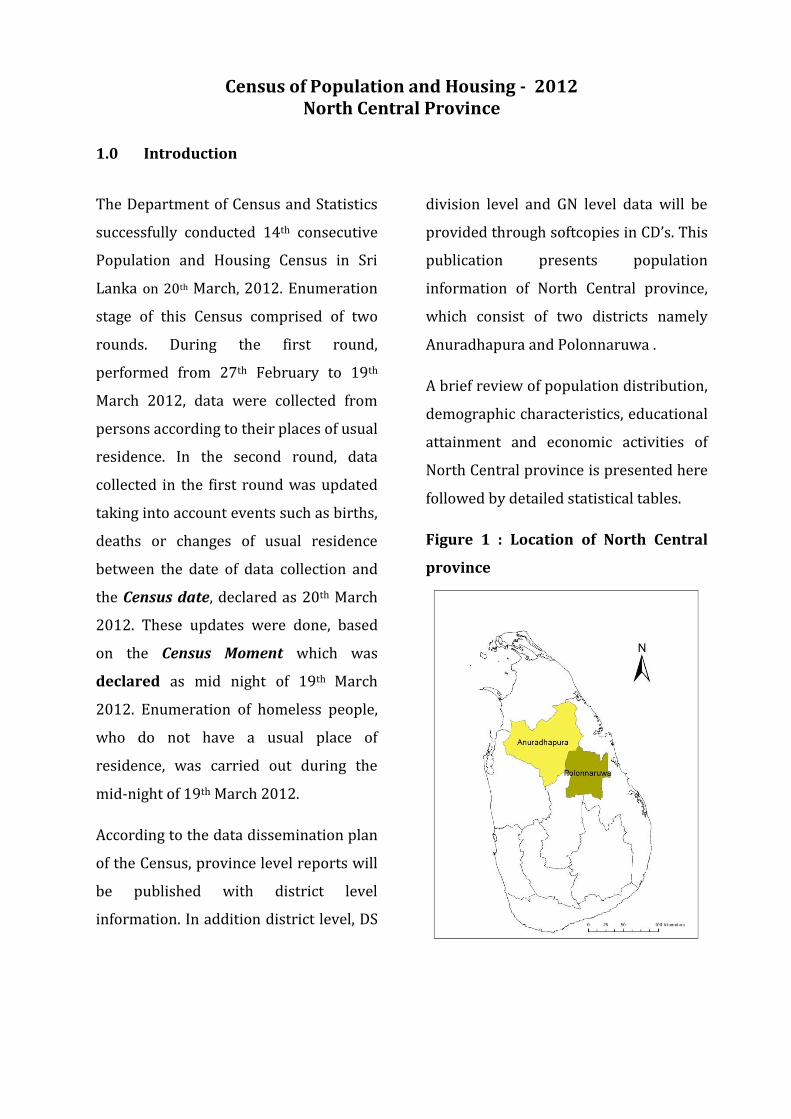
1.0 Introduction
The Department of Census and Statistics
successfully conducted 14th consecutive
Population and Housing Census in Sri
Lanka on 20th March, 2012. Enumeration
stage of this Census comprised of two
rounds. During the first round,
performed from 27th February to 19th
March 2012, data were collected from
persons according to their places of usual
residence. In the second round, data
collected in the first round was updated
taking into account events such as births,
deaths or changes of usual residence
between the date of data collection and
the Census date, declared as 20th March
2012. These updates were done, based
on the Census Moment which was
declared as mid night of 19th March
2012. Enumeration of homeless people,
who do not have a usual place of
residence, was carried out during the
mid-night of 19th March 2012.
According to the data dissemination plan
of the Census, province level reports will
be published with district level
information. In addition district level, DS
division level and GN level data will be
provided through softcopies in CD’s. This
publication presents population
information of North Central province,
which consist of two districts namely
Anuradhapura and Polonnaruwa .
A brief review of population distribution,
demographic characteristics, educational
attainment and economic activities of
North Central province is presented here
followed by detailed statistical tables.
Figure 1 : Location of North Central
province
2.0 Population distribution
Six percent (or 1,266,663) of Sri Lankan
population lived in North Central
province. Almost 77 percent of population
in this province live in the same Province
since birth. However, in Polonnaruwa
district, percentage of population since
birth is 69.1 percent. This means 30
percent of population was migrated to
Polonnaruwa district from other districts.
Out of the total population in the
province, 860,575 (67.9 %) belongs to
Anuradhapura district. Polonnaruwa
district population is 406,088 (32.1%).
Population density (or number of persons
per square km) of the Province is 130.
Population density of Polonnaruwa
district (132) is higher than
Anuradhapura district (129).
2.1 Population distribution by DS
division
There are 22 DS divisions in
Anuradhapura district and 7 DS divisions
in Polonnaruwa district. The highest and
the lowest population in Anuradhapura
district is reported from Nuwaragam
Palatha East DS division (69,737) and
Palugaswewa DS division (15,582)
respectively. In Polonnaruwa district the
highest and the lowest population is
reported from Thamankaduwa DS
division (82,426) and Welikanda DS
division (33,770).
Figure 2 and Figure 3 present population
distribution by DS division in
Anuradhapura district and Polonnaruwa
district.
Total Population of Sri Lanka
20,359,439
North Central Province
1,266,663
Anuradhapura
860,575
67.9 %
Polonnaruwa
406,088
32.1 %
2.2 Population distribution by sector
Majority of population in North Central
province (96%), is in Rural sector.
According to the definition no Urban
areas are in Polonnaruwa district and no
Estate areas in Anuradhapura district. In
Anuradhapura district, Urban sector is
located in Nuwaragam Palatha Central,
Mihintale and Nuwaragam Palatha West.
Almost all population in Polonnaruwa
district is in Rural sector. Percentage
distribution of population by sector is
given in Table1.
Table 1 : Percentage distribution of population by sector
Population Sector
Total Urban Rural Estate
Sri Lanka 20,359,439 100.0 18.2 77.4 4.4
North Central 1,266,663 100.0 4.0 96.0 0.0
Anuradhapura 860,575 100.0 5.9 94.1 -
Polonnaruwa 406,088 100.0 - 100.0 0.0
2.3 Population distribution by Municipal and Urban councils
Areas of Municipal councils and Urban
councils are defined as urban areas in Sri
Lanka. Municipal council population in
Anuradhapura district is 50,595 and no
Urban areas in Polonnaruwa district.
3.0 Demographic characteristics of population
3.1 Population distribution by sex
Out of the total population of North
Central province, 620,880 (or 49.0%)
are males and 645,783 (or 51.0%) are
females. Table 2 presents percentage
distribution of population by sector and
sex.
3.2 Sex ratio
Sex ratio is defined as the number of
males per 100 females. Census 2012
reports that there are 94 males for every
100 females in Sri Lanka. According to
the data Polonnaruwa district sex ratio
(98) is higher than that ratio in
Anuradhapura district (95).
Table 2 : Percentage distribution of population by sector and sex
Population Total
Sector
Urban Rural Estate
Male
Sri Lanka 9,856,634 100.0 18.3 77.3 4.4
North Central 620,880 100.0 4.0 96.0 0.0
Anuradhapura 420,100 100.0 6.0 94.0 -
Polonnaruwa 200,780 100.0 - 100.0 0.0
Female
Sri Lanka 10,502,805 100.0 18.1 77.4 4.5
North Central 645,783 100.0 4.0 96.0 0.0
Anuradhapura 440,475 100.0 5.8 94.2 -
Polonnaruwa 205,308 100.0 - 100.0 0.0
3.3 Population by age group and sex
Age–sex composition of a population
describes the patterns of the distribution
of a population in a different age-sex
categories. Age-sex distribution reflects
important demographic composition of
sub populations such as child population,
elderly population and working
population.
Figure 4 and Figure 5 shows age – sex
pyramids for Anuradhapura and
Polonnaruwa district respectively.
According to the figure 4 and 5, the
highest population is seen in 0-4 age
group for both sexes. The lowest
population is seen in 80 and over age
group for both sexes.
11 10 9 8 7 6 5 4 3 2 1 0 1 2 3 4 5 6 7 8 9 10 11
00-04
10-14
20 - 24
30 - 34
40 - 44
50 - 54
60 - 64
70 - 74
80 & over
Percentage
Ag
e g
rou
p
Figure 4: Age- sex distribution of population in Anuradhapura district
Male Female
11 10 9 8 7 6 5 4 3 2 1 0 1 2 3 4 5 6 7 8 9 10 11
00-04
10-14
20 - 24
30 - 34
40 - 44
50 - 54
60 - 64
70 - 74
80 & over
Percentage
Ag
e g
rou
p
Figure 5: Age- sex distribution of population in
Polonnaruwa district
Male Female
3.4 Population distribution by ethnicity
Majority of population in North Central
province is Sinhalese (90.9%). The
second highest ethnic group is Sri Lanka
Moors (8.0%) and Tamil population is
1.0 percent. Other ethnic groups namely
Burgher, Malay, Sri Lanka Chetty and
Bharatha form 0.1 percent. Table 3
presents ethnic distribution in two
districts.
Table 3: Percentage distribution of population by ethnic group
Population Total
Ethnic group
Sinhalese Tamil Sri Lanka
Moor Other
Sri Lanka 20,359,439 100.0 74.9 15.3 9.3 0.5
North Central 1,266,663 100.0 90.9 1.0 8.0 0.1
Anuradhapura 860,575 100.0 91.0 0.6 8.2 0.2
Polonnaruwa 406,088 100.0 90.7 1.8 7.4 0.1
Total Sinhalese population in Sri Lanka is
15,250,081 and total Tamil population
and Sri Lanka Moor population are
3,108,770 and 1,892,638. Among the
Sinhalese population 7.5 percent of them
live in North Central Province. Among
the Sri Lankan Moor population 5.3
percent live in North Central province.
3.5 Population distribution by religion
Almost 90 percent of North Central
province population is Buddhist
followed by Hindus (0.8 %), Islam (8.0%)
and Roman Catholic and Other religions
(1.2%).
Table 4: Percentage distribution of population by religion
Population Total Religion
Buddhist Hindu Islam Other
Sri Lanka 20,359,439 100.0 70.1 12.6 9.7 7.6
North Central 1,266,663 100.0 90.0 0.8 8.0 1.2
Anuradhapura 860,575 100.0 90.1 0.4 8.3 1.2
Polonnaruwa 406,088 100.0 89.7 1.7 7.5 1.1
Among the total Buddhists in Sri Lanka
8.0 percent lives in North Central
Province. While 0.4 percent consist of
Hindus and 5.2 percent are the followers
of Islam religion.
3.6 Population distribution by marital status
Marital status is another important
demographic characteristic of a
population. Table 5 shows that 71.2
percent of 15 years and above
population is married and almost 22.1
percent is never married in North
Central province. Males percentage of
never married population is higher than
females. However, divorced and
separated population is higher among
females than males. Percentage of
widowed females is seven times higher
than percentage of widowed males.
Table 5: Percentage distribution of population (aged 15 years and above)
by sex and marital status
Population aged 15
years and above
Total
Marital status
Ne
ve
r m
arr
ied
Ma
rrie
d
Wid
ow
ed
Div
orc
ed
Se
pa
rate
d
Both Sexes
Sri Lanka 15,227,773 100.0 25.8 67.8 5.2 0.3 0.9
North Central 929,662 100.0 22.1 71.2 5.2 0.3 1.1
Anuradhapura 629,664 100.0 22.4 70.8 5.3 0.3 1.2
Polonnaruwa 299,998 100.0 21.5 72.1 5.1 0.2 1.1
Male
Sri Lanka 7,266,234 100.0 30.0 67.7 1.3 0.2 0.7
North Central 451,722 100.0 26.8 70.7 1.2 0.2 1.0
Anuradhapura 304,331 100.0 27.1 70.4 1.2 0.3 1.0
Polonnaruwa 147,391 100.0 26.1 71.4 1.3 0.2 1.0
Female
Sri Lanka 7,961,539 100.0 22.0 67.8 8.7 0.3 1.1
North Central 477,940 100.0 17.7 71.7 9.0 0.3 1.3
Anuradhapura 325,333 100.0 18.1 71.2 9.0 0.4 1.3
Polonnaruwa 152,607 100.0 17.0 72.7 8.8 0.3 1.2
4.0 Educational attainment
Through the Census 2012, information
on the highest educational attainment,
the highest professional/vocational
qualifications were collected from
persons who were aged 5 years and
above. Information on involvement in
any educational activity during 30 days
prior to the date of Census was collected
from population aged 3 years and above.
Purpose of having these data is to collect
information on current involvement of
educational activity of a person. In
addition, information on ability to speak,
read and write in Sinhala, Tamil and
English languages and ability to use
computers were also collected from
those who were aged 10 years and
above.
In North Central province percentages of
passed primary (including those who are
studying in grade 1 at the time of the
Census), passed secondary, passed
G.C.E.O/L or equivalent, passed G.C.E.
A/L or equivalent and degree or above
are 25.6, 46.6, 14.1, 8.6 and 1.5 percent
respectively. These figures show that
majority of the population completed
education up to secondary level. Those
who have completed the highest
education level which is degree and
above (1.5%) is significantly low in
North Central province. Nearly 4
percent of the population in
Polonnaruwa district reported that they
have never attended in a school.
4.1 Language ability
Information on ability of speaking,
reading and writing of population aged
10 years and above were collected in the
Census 2012. According to the data 96.2
percent of people in North Central
province speak Sinhala while 90.4
percent can read and write Sinhala.
Figure 6 shows the percentages of
speaking, reading and writing abilities of
population aged 10 years and above for
both districts.
4.2 Literacy rate
Literacy rate is a key indicator to
measure the level of reading and writing
ability of persons in a country. The
definition of literate person is given as “If
a person can both read and write a short
statement with understanding is
considered as literate”. According to the
results shown in the Table 6 literacy rate
of the population aged 10 years and
above in North Central province stands
at 95.4 percent. The corresponding rates
for males and females are 96.6 and 94.3
percent respectively.
Table 6 : Percentages of literate population (aged 10 years and above) by sex
Population
aged 10 years
and above
Both sexes
Sex
Male Female
Sri Lanka 16,867,825 95.7 96.9 94.6
North Central 1,029,994 95.4 96.6 94.3
Anuradhapura 698,281 95.7 97.0 94.6
Polonnaruwa 331,713 94.8 96.0 93.7
4.3 Computer literacy by sex
According to the Table 7, computer
literacy of the population aged 10 years
and above in North Central province
stands at 17.7 percent. The
corresponding percentages for males
and females are 19.2 and 16.3 percent
respectively.
96
.2
90
.4
12
.8
12
.1
14
.1
20
.3
96
.8
91
.0
12
.9
12
.7
15
.2
21
.9
94
.9
89
.0
12
.6
10
.7
11
.8
16
.9
0
25
50
75
100
Speaking Reading & Writing
Speaking Reading & Writing
Speaking Reading & Writing
Sinhala Tamil English
Pe
rce
nta
ge
Language ability
Figure 6 : Percentages of population (aged 10 years and above) by ability of speaking, reading and writing
North Central Anuradhapura Polonnaruwa
Table 7: Percentages of population able to use computer (aged 10 years and above) by sex
Population
aged 10 years
and above
Both sexes
Sex
Male Female
Sri Lanka 16,867,825 24.2 26.5 22.1
North Central 1,029,994 17.7 19.2 16.3
Anuradhapura 698,281 18.3 20.0 16.8
Polonnaruwa 331,713 16.4 17.5 15.3
5.0 Economic activities
Economic activities that people engaged
for their livelihood are very important
characteristic in a population. Census
2012 gathered information on economic
status of population aged 15 years and
above considering 52 weeks prior to the
Census date. Therefore, the indicators
reflect usual economic status of the
population rather than current economic
status.
5.1 Economically active population
Economically active population or the
labour force comprised of employed and
unemployed persons. According to the
data 54.8 percent of aged 15 years and
above population is economically active
in this province. Polonnaruwa district
(52.3%) is reported lower economically
active percentage than that of
Anuradhapura district (56.1%). Table 8
present percentages of economically
active population by sector and sex.
5.2 Employed and unemployed population
Total employed and unemployed
population in North Central province is
484,697 and 25,100 respectively. In
Anuradhapura district total employed
population is reported as 336,930 while
that figure is 147,767 in Polonnaruwa
district. Among the employed population
in Anuradhapura district, one in every
five person(21.5 %) is engaged in
government sector employment. Table 9
present percentages of employed
population by sector of employment and
sex.
Table 8: Percentages of economically active population (aged 15 years and above) by sector and sex
Economically active
Population aged 15 years and above
Sex
Total Male Female
Sri Lanka
Total 7,857,370 100.0 69.9 30.1
Urban 1,416,955 100.0 69.8 30.2
Rural 6,048,095 100.0 70.8 29.2
Estate 392,320 100.0 55.7 44.3
North Central
Total 509,797 100.0 71.8 28.2
Urban 20,708 100.0 65.0 35.0
Rural 489,073 100.0 72.1 27.9
Estate 16 100.0 100.0 0.0
Anuradhapura
Total 353,004 100.0 69.6 30.4
Urban 20,708 100.0 65.0 35.0
Rural 332,296 100.0 69.9 30.1
Estate - - - -
Polonnaruwa
Total 156,793 100.0 76.9 23.1
Urban - - - -
Rural 156,777 100.0 76.9 23.1
Estate 16 100.0 100.0 0.0
65.0 72.1
100.0
35.0 27.9
0.0 0
25
50
75
100
Urban Rural Estate
Pe
rce
nta
ge
Sector
Figure 7: Percentages of economically active population in North Central Province by sector and sex
Male Female
Table 9: Percentages of employed population (aged 15 years and above) by sector of employment and sex
Employed Population
Total Sex
Male Female
Sri Lanka
Total 7,335,432 100.0 70.8 29.2
Government employee 1,122,734 100.0 64.4 35.6
Semi government employee 244,989 100.0 62.0 38.0
Private sector employee 2,980,361 100.0 70.5 29.5
Employer 190,680 100.0 86.2 13.8
Own account worker 2,414,258 100.0 79.8 20.2
Unpaid family worker 382,410 100.0 31.9 68.1
North Central
Total 484,697 100.0 72.6 27.4
Government employee 100,045 100.0 76.1 23.9
Semi government employee 9,737 100.0 69.4 30.6
Private sector employee 84,916 100.0 72.7 27.3
Employer 7,176 100.0 83.9 16.1
Own account worker 231,848 100.0 80.4 19.6
Unpaid family worker 50,975 100.0 28.9 71.1
Anuradhapura
Total 336,930 100.0 70.2 29.8
Government employee 72,554 100.0 76.3 23.7
Semi government employee 6,238 100.0 69.3 30.7
Private sector employee 53,161 100.0 72.2 27.8
Employer 4,966 100.0 82.6 17.4
Own account worker 158,990 100.0 77.8 22.2
Unpaid family worker 41,021 100.0 26.0 74.0 Polonnaruwa
Total 147,767 100.0 78.0 22.0
Government employee 27,491 100.0 75.5 24.5
Semi government employee 3,499 100.0 69.7 30.3
Private sector employee 31,755 100.0 73.5 26.5
Employer 2,210 100.0 86.8 13.2
Own account worker 72,858 100.0 86.1 13.9
Unpaid family worker 9,954 100.0 40.9 59.1
5.3 Economically inactive population
Students, those who are engaged in
household work, income recipient/
pensioners, unable to work, unpaid
social worker, children not attending
school and other non-economic
activities are considered as
economically inactive population.
Economically inactive population in
North Central province is reported as
45.2 percent. Data shows that the
percentage of economically inactive
population in Polonnaruwa district
(47.7%) is higher than that in
Anuradhapura district (43.9%).
Figure 9 shows the percentages of
economically inactive by sex.
15.3 20.6 21.5 18.6
40.6 17.5 15.8 21.5
32.9
47.8 47.2 49.3
5.2 10.5 12.2 6.7
0
25
50
75
100
Sri Lanka North Central Province
Anuradhapura Polonnaruwa
Pe
rce
nta
ge
Government employee Semi government employee Private sector employee Employer Own account worker Unpaid family worker
Figure 8 : Percentage distribution of employed population (aged 15 years and above) by sector of employment
18.9 19.3 18.2
70.0 67.0
76.3
0
20
40
60
80
100
North Central Anuradhapura Polonnaruwa
Pe
rce
nta
ge
Figure 9: Percentages of economically inactive population(aged 15 years and above) by sex