HIV outbreak among injecting drug users in Greece An updated report for the EMCDDA on the recent outbreak of HIV infections among drug injectors in Greece 31 October 2012 Contributors: Anastasios Fotiou* Greek Reitox focal point of the EMCDDA Katernina Micha Greek Organisation Against Drugs Dimitris Paraskevis National Retrovirus Reference Centre, Athens University Medical School Manina Terzidou Greek Reitox focal point of the EMCDDA Melpomeni M. Malliori Greek Organisation Against Drugs Angelos Hatzakis National Retrovirus Reference Centre, Athens University Medical School * Correspondence: Anastasios Fotiou; Epidemiology Unit; Greek Reitox focal point of the EMCDDA +302106170014; [email protected]31 October 2012 Athens, Greece
Transcript
HIV outbreak among injecting drug users in Greece
An updated report for the EMCDDA on the recent outbreak of HIV infections among drug injectors in Greece 31 October 2012
Contributors:
Anastasios Fotiou* Greek Reitox focal point of the EMCDDA Katernina Micha Greek Organisation Against Drugs Dimitris Paraskevis National Retrovirus Reference Centre, Athens University Medical School Manina Terzidou Greek Reitox focal point of the EMCDDA Melpomeni M. Malliori Greek Organisation Against Drugs Angelos Hatzakis National Retrovirus Reference Centre, Athens University Medical School
* Correspondence: Anastasios Fotiou; Epidemiology Unit; Greek Reitox focal point of the EMCDDA
HIV outbreak among injecting drug users in Greece – An updated report to the EMCDDA 2012
2
Report submitted to the European Monitoring Centre for Drugs and Drug Addiction in partial fulfilment of
contract CC.12.EPI.020 to update the brief report for the EMCDDA on a recent outbreak of HIV infection
among drug injectors in Greece.
Athens, 2012
HIV outbreak among injecting drug users in Greece – An updated report to the EMCDDA 2012
3
REPORT OUTLINE
List of Figures and Tables......................................................................................................................... 4 Abbreviations ......................................................................................................................................... 5 Acknowledgements................................................................................................................................. 5 1. SUMMARY .......................................................................................................................................... 6 2. HIV SITUATION.................................................................................................................................... 7
HIV/AIDS monitoring among IDUs in Greece................................................................................................7 IDUs among HIV cases ..................................................................................................................................7 HIV among IDU samples: routine data from treatment settings..................................................................8 HIV among IDU samples: serobehavioural surveys ......................................................................................9
3. OTHER EPIDEMIOLOGICAL DATA........................................................................................................ 10 HCV among IDU samples: routine data from treatment settings...............................................................10 Molecular epidemiology.............................................................................................................................10
4. DRUG USE: SITUATION AND RISK BEHAVIOURS.................................................................................. 12 Problem drug use and treatment demand .................................................................................................12 Changes in drug use patterns among IDUs.................................................................................................12 Socio‐demographic characteristics of treatment demands........................................................................13 Condom use (DRID data) ............................................................................................................................13 Drug markets ..............................................................................................................................................13
5. TREATMENT AND HARM REDUCTION ................................................................................................ 15 Drug treatment system...............................................................................................................................15 Harm reduction...........................................................................................................................................15
6. POSSIBLE HYPOTHESES FOR THE OUTBREAK ...................................................................................... 19 Increasing risk behaviours among IDUs in Athens......................................................................................19 Low coverage of prevention services .........................................................................................................21 Low (estimated) ART uptake by HIV‐positive IDUs.....................................................................................22
7. RESPONSES ....................................................................................................................................... 23 OST programme expansion ........................................................................................................................23 Scaling up of the needle and syringe programme ......................................................................................23 Scaling up of other harm reduction interventions .....................................................................................24 Screening ....................................................................................................................................................25 Vaccinations................................................................................................................................................25 Infectious diseases treatment ....................................................................................................................25 Targeted interventions ...............................................................................................................................26 The ARISTOTLE study ..................................................................................................................................27 Inter‐organisational cooperation has been strengthened..........................................................................27
8. PROBLEMS AND FUTURE THREATS..................................................................................................... 28 Economic recession and budgetary cuts ....................................................................................................28 Bureaucracy and governmental instability .................................................................................................28 Opposition to the idea of harm reduction..................................................................................................28 Lack of common understanding and coordination.....................................................................................28 Lack of additional data on important indicators ........................................................................................29
9. FURTHER STEPS ................................................................................................................................. 30 ANNEX 1 ‐ FIGURES AND TABLES ........................................................................................................... 32
HIV outbreak among injecting drug users in Greece – An updated report to the EMCDDA 2012
4
List of Figures and Tables
Figures
Figure 1. HIV reported cases by probable route of transmission in Greece (2006‐Aug2012)............................................33 Figure 2. IDUs as a proportion among HIV cases in Greece (2006‐Aug2012) ....................................................................33 Figure 3. HIV cases attributed to IDU in Greece, by sex (2006‐August 2012) ....................................................................33 Figure 4. Percentage of males and females among HIV cases attributed to IDU in Greece (2006‐August 2012) ..............34 Figure 5. HIV cases attributed to IDU in Greece, by nationality (Jan/Aug 2011 – Jan/Aug 2012)......................................34 Figure 6. Percentage HIV cases attributed to IDU in Greece, by nationality (Jan/Aug ’11‐Jan/Aug ‘12) ...........................34 Figure 7. HIV prevalence among IDUs tested in Greece, by source reporting to the NFP (2002‐2011).............................35 Figure 8. HIV tests conducted and HIV prevalence in IDUs tested at MAVY Athens (2011‐September 2012)...................35 Figure 9. Monthly HIV prevalence among IDUs tested at MAVY Athens, by gender (2011‐September 2012) ..................35 Figure 10. Trends in HCV antibody prevalence among IDUs, in Athens and in other areas (data source 1; 2002‐2011) ..36 Figure 11. Trends in HCV antibody prevalence among IDUs, in Athens and in other areas (data source 1; 2002‐2011) ..36 Figure 12. Trends in HCV antibody prevalence among young IDUs (<25 years of age) (data source 1; 2008‐2011) .........36 Figure 13. Trends in HCV antibody prevalence among ‘new’ IDUs (<2 years of injection) (data source 1; 2008‐2011) ....37 Figure 14. Trends in HCV antibody prevalence among IDUs also injecting cocaine/crack (data source 1; 2008‐2011).....37 Figure 15. Trends in the number of drug treatment demands in Greece, by primary substance 2002‐2011 (TDI) ...........37 Figure 16. Trends in drug treatment demands in Greece, by nationality 2002‐2011 (TDI) ...............................................38 Figure 17. Trends drug treatment demands in Greece, by work status 2002‐2011 (TDI)..................................................38 Figure 18. Trends in drug treatment demands in Greece, by living status 2002‐2011 (TDI)..............................................38 Figure 19. Percentage of IDUs reporting ‘always’ use of condom with steady partner.....................................................39 Figure 20. Percentage of IDUs reporting ‘always’ use of condom with casual partner .....................................................39 Figure 21. Expansion of OST units in Greece between August 2011 and August 2012......................................................39 Figure 22. Number of individuals receiving OST in Greece on a given day of the year/month (2005‐ August 2012) ........40 Figure 23. Mean monthly number of applications for OST (2005‐ August 2012) ..............................................................40 Figure 24. Number of applicants on waiting list for OST in a given day of the year/month (2005‐ August 2012).............40 Figure 25. Mean waiting time for receiving OST (in months) (Jul ‘11‐ Aug ‘12).................................................................41 Figure 26. OST coverage in Athens 2005‐2012 ..................................................................................................................41 Figure 27. Number of syringes exchanged/distributed in Athens (2009‐2012) .................................................................41 Figure 28. NSP coverage in Athens 2004‐2012 ..................................................................................................................42 Figure 29. Number of condoms handed‐out to street users (2009‐2012*) .......................................................................42 Figure 30. Number of HIV tests performed at MAVY‐OKANA (2009‐2012*) .....................................................................43 Figure 31. Number of drug users tested for HIV at MAVY‐OKANA (2009‐2012*)..............................................................43 Figure 32. OST coverage among estimated problematic opioid users in the EU, 2009 or most recent year available......44 Figure 33. Syringes distributed through specialised programmes per estimated IDU per year (2004–09, EU, Croatia and Norway) .............................................................................................................................................................................44
Tables
Table 1. HIV prevalence in IDUs tested at ARISTOTLE, by demographic characteristics (2012) ........................................45 Table 2. HCV antibody prevalence in IDUs accessing treatment, by IDU characteristics (2011) .......................................45 Table 3. Differences in the characteristics of treatment demands between Athens and other areas (TDI 2011).............46 Table 4. Prevalence of HIV‐1 subtypes...............................................................................................................................47 Table 5. Phylogenetic clusters of IDUs HIV‐1 sequences sampled over the years 1998‐2012 in Greece...........................47 Table 6. Description of clusters..........................................................................................................................................47 Table 7. Changes between 2008 and 2011 in the drug use patterns in Athens, all users, only IDUs and only IDUs mainly injecting the main substance (TDI).....................................................................................................................................48 Table 8. Changes between 2008 and 2011 in the characteristics of the out‐of‐treatment IDUs in Athens (n=636; TDI) ..48 Table 9. Changes between 2008 and 2011 in the injecting patterns among IDUs in Athens who reported injecting as the main route of administration (TDI 2008, 2011) .................................................................................................................49 Table 10. ART Initiations by transmission group and year (2008‐2012) ............................................................................50
HIV outbreak among injecting drug users in Greece – An updated report to the EMCDDA 2012
5
Abbreviations
AIDS Acquired immunodeficiency syndrome ART Antiretroviral therapy DRID Drug‐related infectious diseases (indicator) ECDC European Centre for Disease Prevention and Control EMCDDA European Monitoring Centre for Drugs and Drug Addiction EU/EEA European Union / European Economic Area EWS Early Warning System HCDCP Hellenic Centre for Disease Prevention and Control HBV Hepatitis B virus HCV Hepatitis C virus HIV Human immunodeficiency virus IDUs Injecting drug users; or injecting drug use KETHEA Therapy Centre for Dependent Individuals MAVY‐OKANA Direct Aid & Support Unit (low‐threshold) MSM Men who have sex with men NGOs Non‐governmental organisations NFP Greek Reitox focal point of the EMCDDA NRRC National Retrovirus Reference Centre NSRF National Strategic Reference Framework NSP Needle and syringe programme OKANA Organisation Against Drugs OST Opioid substitution treatment PDUs Problem drug users POUs Problem opioid users RDS Respondent driven sampling SFEA Drug‐Addicts Care Facility TB Tuberculosis TDI Treatment demand indicator UMHRI University Mental Health Research Institute WHO World Health Organisation 18 ANO 18 ANO Dependence Treatment Unit (Attica Psychiatric Hospital)
Acknowledgements We are grateful to: Anastasia Drimousi (MAVY, Direct Aid & Support Unit OKANA); Giorgos Nikolopoulos and Foteini Yiannou (HIV office of HCDCP); Argyro Andaraki; Ioanna Siamou; and Ioulia Bafi (national focal point of the EMCDDA); Maria Katsimicha (NRRC Secretariat).
We also acknowledge the contribution of the drug‐treatment and harm‐reduction services which provide data to the Greek focal point and all other governmental and non‐governmental organisations that have contributed with their data to the compilation of the present report.
HIV outbreak among injecting drug users in Greece – An updated report to the EMCDDA 2012
6
1. SUMMARY
Despite a decreasing trend of HIV cases among injecting drug users (IDUs) in most of the EU/EEA countries, Greece reported in 2011 a significant increase in the HIV case reports and the HIV prevalence among IDUs, a trend which continued also throughout the first 8 months in 2012.
In 2012, IDUs have become the most affected population, representing 41% of all reported HIV infections (HCDCP data).
HIV prevalence rate in Athens exceeds 5% among IDUs entering treatment (NFP data) and reaches 20% among out‐of‐treatment populations (ARISTOTLE study). The outbreak is ‘concentrated’, and high HIV prevalence is becoming established in this population.
The HIV outbreak among IDUs has a local character, i.e. it is restricted to the capital city, Athens.
80% of the 2011 HIV cases with injecting drug use as a probable route of transmission were men and in a similar proportion they were Greek nationals. The majority (56%) were aged 25 to 34 (HCDCP data).
One in every three people whose probable route of HIV infection was IDU in 2011‐2012 is on antiretroviral therapy (ART), a lower proportion compared to other groups affected (HCDCP data). There is no information available about IDUs’ adherence to ART.
Despite a substantial scaling up of the responses since the beginning of 2011, opioid substitution treatment (OST) and needle and syringe programme (NSP) coverage of prevention services addressed to IDUs remain short and significantly lower compared to international standards (NFP and EMCDDA data).
The emergence of the HIV outbreak coincides with the economic downturn that the country is being currently undergoing, budgetary cuts in the health system (especially the field of drug treatment and harm reduction), the deteriorating socio‐economic environment of the Athens city centre, and changes in injecting behaviours among IDUs.
The intensification of indicated interventions within the existing NSP and OST programmes, the extension of the availability of testing, and the scaling up of ART uptake and adherence remain essential if the emergence of new HIV cases among IDUs in Athens and the expansion of the outbreak beyond the capital city are to be prevented. Pilot implementation of harm reduction services for IDUs in the Greek prisons should also be encouraged and their outcome evaluated.
State financing cutbacks threaten the sustainability of the provision of HIV prevention programmes and potentially increases the risk for establishing high prevalence of HIV in the IDU population. Harm reduction programmes and ART treatment should be provisionally excluded from public spending cuts in order to protect the health of IDUs and public health.
Guidance given by the EMCDDA, ECDC and other experts in the field has contributed substantially in better appraising the situation and setting priorities in planning the responses.
HIV outbreak among injecting drug users in Greece – An updated report to the EMCDDA 2012
7
2. HIV SITUATION
HIV/AIDS monitoring among IDUs in Greece
Case reporting
The HIV Office of the Hellenic Centre for Disease Prevention and Control (HCDCP) coordinates the HIV/AIDS surveillance in Greece. According to HCDCP, the data coverage of its surveillance system is estimated to be high given that HIV/AIDS case reporting is mandatory, anonymous and confidential, while also antiretroviral therapy is prescribed free of charge. The HIV/AIDS surveillance system includes injecting drug use (IDU) among the possible transmission categories (the other being MSM, heterosexuals and unknown). Aggregated HIV/AIDS data from the HCDCP are presented annually in the HCDCP’s Annual Report,1 and reference to HCDCP’s data on IDUs is also made in the NFP’s yearly national report to the EMCDDA.2
Routine data from treatment and low‐threshold settings
Since 2000, the NFP has been monitoring annually the prevalence of infectious diseases among IDUs who either enter drug‐related treatment or access low‐threshold services seeking help for drug‐related problems. Data on HIV, HBV, HCV and TB infections among IDUs are collected in line with the DRID protocol (hereafter referred to as DRID data).3 DRID data originate from within the wider drug treatment system, including low‐threshold settings. Only the state accredited health and treatment settings are included in the monitoring system. Nationwide (non‐representative) DRID data come in two forms: as individual (anonymous) cases and as aggregated data (data from KETHEA and 18 ANO). No checks for double counting can be conducted between individual and aggregated data. Data on biological indicators are collected through diagnostic tests, while data on socio‐demographic and behavioural indicators are collected via face‐to‐face interviews upon entry in treatment. DRID data are collected only for IDUs who enter/access treatment services during a calendar year – not for people in treatment, i.e. seroconversion is not reported.
Data from community based testing: serobehavioural studies and mobile medical units
No serobehavioural surveys involving IDU samples were known to the NFP to be conducted until 2012. As of August 2012, the ARISTOTLE study is being conducted in the Athens city centre. The ARISTOTLE research and prevention programme aims to decrease HIV transmission among IDUs in the Athens metropolitan area. The research component of the programme is serobehavioural and uses RDS methodology. Its preventive component lies in that it links HIV cases into care. ARISTOTLE is a collaborative project (National Retrovirus Reference Centre, Athens University Medical School, OKANA and HCDCP) and it is funded by the EC 2007‐2013 NSRF programme for development.
Data on HIV tests involving out‐of‐treatment IDUs are also provided though the mobile medical units currently run by HCDCP and PRAKSIS‐NGO.
IDUs among HIV cases
Data from the national HIV/AIDS surveillance system (HCDCP)
The HIV situation in Greece before 2011 has been characterised as a low‐level, concentrated epidemic. During the previous 5 years between 9 and 16 cases which had IDU as a probable source of transmission
1 HCDCP (2012). HIV/AIDS surveillance in Greece (Data reported through 31.12.2011). Athens: HCDCP. 2 Greek Reitox focal point (2011). 2011 National Report (2010 data) to the EMCDDA by the Reitox national focal point. Athens: UMHRI. 3 See: http://www.emcdda.europa.eu/publications/methods/drid‐overview
HIV outbreak among injecting drug users in Greece – An updated report to the EMCDDA 2012
8
were reported annually (Figure 1). IDUs never represented more than 2–3% of all reported cases (Figure 2).4
In 2011, a total of 256 HIV cases were attributed to IDU, with this route of transmission representing 26.8% of all reported cases of that year (Figure 1 and Figure 2).5
Between January 1st and August 31st 2012, 768 HIV cases have already been recorded in HCDCP’s surveillance system, 314 of which (40.8%) were reported as IDU cases (Note: for 20.9% of the cases the route of transmission was unknown) (Figure 1 and Figure 2).6
Among the IDU cases, between January 1st and August 31st 2012, 79.0% were males and 55.6% aged between 25‐34 years. The male to female ratio remained constant in the first eight months within 2012 at about 4:1 (compared the same period in 2011) (Figure 3 and Figure 4). No changes were observed in the age distribution among IDUs (not shown in figure).
Greek nationals represent a higher proportion compared to non‐Greeks among the IDU HIV cases (Figure 5 and Figure 6). In 2011, 80.9% and 16.4% of the IDU cases were Greeks and non‐Greeks, respectively. Between January 1st and August 31st 2012, a significant increase has been observed in the number of non‐Greek IDU cases (a 60% increase compared to 2011) (Figure 5). By implication the proportion of non‐Greeks increased from 16.4% in 2011 to 21.3% in 2012 and that of Greeks decreased from 80.9% to 66.0% in 2012 (Figure 6). Changes in testing policy may have resulted in increased numbers of non‐Greeks being tested for infectious diseases in 2012.
Data from HIV testing by mobile medical units
Mobile medical units (HCDCP) reported data on 2,312 blood tests which have been conducted between September 2011 and June 2012 in downtown Athens. 113 cases (4.9%) were HIV‐positive. Four in every five HIV‐positive cases, for which the probable route of administration was known, were injecting drug users.7
According to data reported by PRAKSIS on the results from a total of 1,332 rapid HIV tests that the NGO conducted from June 2010‐November 2011 on individuals from vulnerable groups in Athens, 24 cases were found HIV‐positive (3.2%). One in every six HIV‐positive cases, for which the probable route of administration was known, was an injecting drug user.8
HIV among IDU samples: routine data from treatment settings
The NFP’s data corroborate HCDCP’s evidence for sharp increases in the number of HIV cases involving IDU and possible rise in the infection in this group. Before 2011, the HIV prevalence among IDUs annually tested in the drug treatment system never exceeded 2% in Greece (DRID data, Figure 7). In 2011, data reported from all sources showed a sharp increase in the number of IDUs diagnosed with HIV and a significant increase in the HIV prevalence in this population reaching levels as high as 4.4% at the national level (Figure 7), even higher in Athens (around 8%).
98.3% of the 2011 HIV‐positive IDUs were HCV co‐infected.
As for the period January 1st and August 31st 2012, HIV prevalence data are available from MAVY‐OKANA9 (mainly Athens sample, in‐ and out‐of‐treatment IDUs, non‐representative), KETHEA10 (national sample,
4 HCDCP HIV/AIDS surveillance in Greece (Data reported through 31.12.2011). Athens: HCDCP. 5 Nikolopoulos, G. The epidemiology of HIV infection in Greece: HIV/AIDS reporting system. Presented at the ECDC Technical Mission held in Athens on September 10, 2012. 6 Nikolopoulos, G. The epidemiology of HIV infection in Greece: HIV/AIDS reporting system. Presented at the ECDC Technical Mission held in Athens on September 10, 2012. 7 Mobile Medical Units‐HCDCP data presented at the ECDC Technical Mission held in Athens on September 10, 2012. 8 Data presented at the ECDC/EMCDDA Technical Meeting held in Athens, May 25, 2012. 9 MAVY‐OKANA (Direct Aid & Support Unit): a low‐threshold medical setting which also conducts the majority of tests on behalf of OKANA in Athens and some for OST units in Thessaloniki. 10 Therapy Centre for Dependent Individuals, conducting annually tests to about 750 IDUs.
HIV outbreak among injecting drug users in Greece – An updated report to the EMCDDA 2012
9
non‐representative), and the ARISTOTLE study (Athens sample, mostly out‐of‐treatment IDUs; see next paragraph).
According to MAVY (Athens data), out of the total 2,573 tests which have been conducted11 for problem drug users12 until September 2012, 220 cases were found HIV‐positive (8.6%) (Figure 8).13 A breakdown of data by month in 2012 suggests sustained transmission among IDUs, as positivity rate among those tested has been over 5% in most months during the year (in some months even reaching 10%). Although this type of information is not available yet, it is expected that HIV positivity among out‐of‐treatment IDUs tested at MAVY is significantly higher compared to those entering OST or drug‐free treatment. No differences have been observed in the prevalence of HIV between male and female IDUs tested at MAVY (Figure 9).
According to national data from KETHEA, out of the total 577 injecting drug users who had been tested for infectious diseases until August 2012, 23 cases of were found HIV‐positive (4.0%).14 Only one out of the 23 cases was detected in treatment settings outside Athens.
HIV among IDU samples: serobehavioural surveys
In the context of the ARISTOTLE study conducted in samples of (primarily) street users in Athens city centre using RDS, more than 1,000 tests have been conducted since August 2012. According to the preliminary results (and without the sample having reached equilibrium in terms of its characteristics), 225 IDUs were found with antibodies to HIV‐1 (22.5%).15 Out of the first 108 HIV‐positive IDUs identified, 65 (60.2%) were new cases. The characteristics of the study sample are presented in Table 1. As it is also shown in Table 1, IDUs from Afghanistan had a higher risk (compared to Greek IDUs) of testing HIV‐positive.
11 There is no quantitative information on how many users these tests concern. However, informal communication with MAVY on this
matter suggests that almost all tests that had been conducted refer to as many different drug users. 12 Until the day in which this report was compiled, there was no quantitative information about the number of ever‐injectors among
those drug users tested. However, it was verbally confirmed by MAVY that almost all tests had been conducted to ever‐injecting drug users. 13 There is no quantitative information on how many of the HIV‐positive cases are newly diagnosed infections (i.e. are not known
positives who have for some reason repeated testing during the reference period). 14 There is no quantitative information on how many of the HIV‐positive cases are newly diagnosed infections (i.e. are not known
positives who have for some reason repeated testing during the reference period). 15 Sypsa V, Malliori M, Hatzakis A. An integrated prevention initiative to stop HIV‐1 outbreak among IDUs in Athens Metropolitan Area:
Preliminary data of the RDS study: Presentation at IDU outbreaks meeting 12th October 2012, Lisbon. Athens: University of Athens and OKANA2012.
HIV outbreak among injecting drug users in Greece – An updated report to the EMCDDA 2012
10
3. OTHER EPIDEMIOLOGICAL DATA
HCV among IDU samples: routine data from treatment settings
Significant changes in the HCV antibody prevalence in IDU samples during the last years in Athens is an indicator of injecting risk in the IDU population. 16, 17
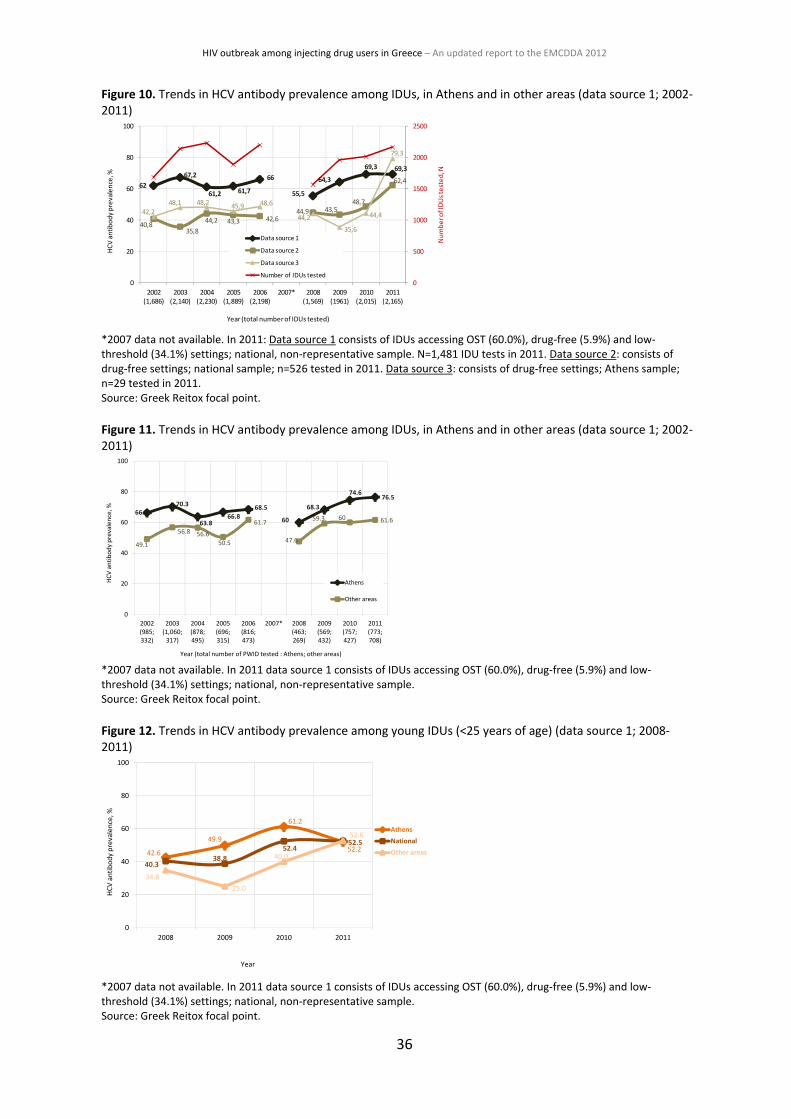
In Greece, HCV antibody prevalence in IDUs has been consistently high and increasing over the last 10 years. In 2011, prevalence rates ranged between 62.4% and 79.3%, depending on the source of data (Figure 10). Compared to 2010, in 2011 HCV infection rates remained stable in data source 1 (national sample), but increased significantly in data sources 2 (national sample) and 3 (Athens sample) (Figure 10).
Table 2 shows the HCV status by IDU characteristics (2011 sample n=1,481; source 1). As expected, HCV antibody prevalence was significantly higher among older IDUs (compared to the ‘young’ IDUs), in Athens compared to the other areas (76.6% and 61.6%, respectively), and among long‐term injectors compared to ‘new’ injectors (71.3% and 52.4%, respectively).
IDU samples between Athens and other areas differ in many respects; the former pursuing health risk injecting behaviours in higher proportions compared to the latter (see Table 3 for an overview for 2011). By implication, the Athens IDU samples show consistently higher rates of HCV infection compared to other areas, suggesting that the IDU populations in Athens were at an elevated risk for acquiring HIV through risky injection practices.
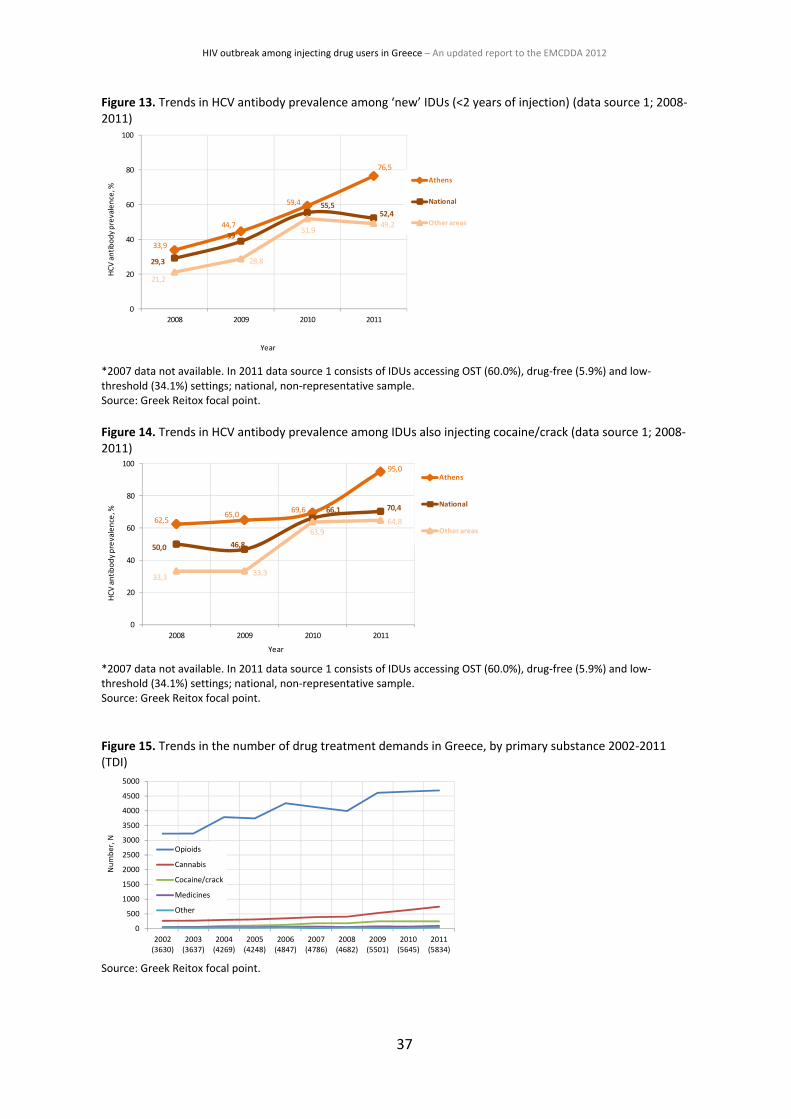
Analyses of Athens data show that between 2008 and 2010 there has been a significant increase in the rate of HCV infection, suggesting a higher risk for an HIV outbreak (source 1; national sample) (Figure 11). The same trend is observed also for young injectors (<25 years of age, Figure 12), ‘new’ injectors (Figure 13), and among IDUs who also inject cocaine (Figure 14). Especially for the ‘new’ and the cocaine injecting users the increases continued also in 2011 (Figure 13 and Figure 14). Significant increases in HCV antibody prevalence among ‘young’ and ‘new’ IDUs suggest that the incidence of HCV increased in these subgroups. This is indicative of an increasing incidence also among all IDUs given that new IDUs are likely mostly being infected by longer‐term IDUs. This suggests that the observed increase in the prevalence of HCV in IDUs is very likely to be due to an increase in incidence rather than an increase in mortality or out‐migration of HCV negative IDUs.18
Molecular epidemiology
To identify whether the HIV‐1 epidemic spreads among IDUs through local IDU transmission networks, phylogenetic analyses were performed on HIV‐1 sequences sampled from IDUs (n=159) collected from 1998 until July 2011. Analyses included sequences from the Hellenic HIV‐1 Sequence Database of National Retrovirus Reference Centre (approximately n=2,327) sampled during 1998‐2009 and HIV‐1 isolates sampled globally (n=2,715 sequences). Phylogenetic analysis was performed using the maximum likelihood method. A preliminary molecular epidemiological analysis of this outbreak was recently published.19
16 Vickerman, P.H., May, M. Kretzschmar, M. Wiessing, L. (2010). Can hepatitis C virus prevalence be used as a measure of injection‐
related human immunodeficiency virus risk in populations of injecting drug users? An ecological analysis. Addiction, 105, 311‐318. 17 Wiessing, L., Likatavicius, G., Hedrich, D., Guarita, B., van de Laar, M. J., Vicente, J. (2011). Trends in HIV and hepatitis C virus
infections among injecting drug users in Europe, 2005 to 2010. Euro surveillance, 16(48). 18 Comment by Lucas Wiessing, EMCDDA.
19 Paraskevis, D., Nikolopoulos, G., Tsiara, C., Paraskeva, D., Antoniadou, A., Lazanas, M., Gargalianos, P., Psychogiou, M., Malliori, M.,
Kremastinou, J., Hatzakis, A. (2011). Hiv‐1 outbreak among injecting drug users in Greece, 2011: a preliminary report. Eurosurveillance 16 (36).
HIV outbreak among injecting drug users in Greece – An updated report to the EMCDDA 2012
11
The results of the analysis including reference strains from different subtypes20 21 on the prevalence of HIV‐1 clades in IDUs in different time periods are presented in Table 4 and of the patterns of HIV‐1 spread in Tables 5 and 6. The study concluded: The distribution of HIV‐1 subtypes in IDUs changed during 2010‐7/2011. The majority (69%) of IDUs
are infected by ‘new’ HIV‐1 strains Up to 2009, clustered HIV‐1 transmission among IDUs was rare, suggesting that sexual transmission
was prevailing During 2011‐7/2011, clustered HIV‐1 transmission was dominant, suggesting parenteral transmission
with contaminated needles, syringes or other equipment Four major HIV‐1 clusters (sub‐outbreaks) were identified during the 2011 outbreak One of the major clusters (45% of the clustered infections) originated from Afghanistan/Iran. The
potential index case was identified as an IDU of Iranian nationality Combination of high resolution molecular typing with phylogeographic and phylodynamic methods
may be proven a powerful public health tool.
20 Paraskevis, D., Magiorkinis, E., Magiorkinis, G., Sypsa, V., Paparizos, V., Lazanas, M., Gargalianos, P., Antoniadou, A., Panos, G.,
Chrysos, G., Sambatakou, H., Karafoulidou, A., Skoutelis, A., Kordossis, T., Koratzanis, G., Theodoridou, M., Daikos, G.L., Nikolopoulos, G., Pybus, O.G., Hatzakis, A. (2007). Increasing prevalence of HIV‐1 sub‐type A in Greece: estimating epidemic history and origin. Journal of Infectious Diseases, 196, 1167–76. 21 Paraskevis, D., Pybus, O., Magiorkinis, G., Hatzakis, A., Wensing, A.M., van de Vijver, D.A., Albert, J., Angarano, G., Asjö, B., Balotta,
C., Boeri, E., Camacho, R., Chaix, M.L., Coughlan, S., Costagliola, D., De Luca, A., de Mendoza, C., Derdelinckx, I., Grossman, Z., Hamouda, O., Hoepelman, I., Horban, A., Korn, K., Kücherer, C., Leitner, T., Loveday, C., Macrae, E., Maljkovic‐Berry, I., Meyer, L., Nielsen, C., Op de Coul, E.L., Ormaasen, V., Perrin, L., Puchhammer‐Stöckl, E., Ruiz, L., Salminen, M.O., Schmit, J.C., Schuurman, R., Soriano, V., Stanczak, J., Stanojevic, M., Struck, D., Van Laethem, K., Violin, M., Yerly, S., Zazzi, M., Boucher, C.A., Vandamme, A.M. (2009). Spread. Tracing the HIV‐1 sub‐type B mobility in Europe: a phylogeographic approach’, Retrovirology, 6, 49.
HIV outbreak among injecting drug users in Greece – An updated report to the EMCDDA 2012
12
4. DRUG USE: SITUATION AND RISK BEHAVIOURS
Problem drug use and treatment demand
Problem drug users
The central estimate for the number of problem drug users (PDUs)22 at national level was 20,473 (18,529–22,688)23 in 2011 (2.7 per 1,000 population aged 15‐64), with 8,056 (7,000–9,337) (39.3%) residing in Athens. The central estimate for injecting drug users (IDUs)24 nationally was 7,847 in 2011 (6,904–9,951), with 2,803 (2,330–3,630) (35.7%) living in Athens. The 25‐34 age group represents the largest proportion of IDUs (52% in 2010), while 28.5% are older.25 Almost all PDUs in Greece are opioid users.
Drug treatment demand
In 2011, the TDI system in Greece26 recorded 5,834 individuals entering treatment for drug‐related problems, 6.3% accessing low‐threshold settings. 44% of the 2011 demands were first‐ever treatments. Most of the demands were for opioids (80.6%), 4.3% reported problems with cocaine/crack. Sniffing is the most prevalent route of administration (41.8%), followed by injection (34.2%). More than half of the treatment entries (56.5%) reported daily use of the primary substance, 72.7% reported use of more than one drug, 36.2% reported current injection, and 8.7% current sharing.27
Between 2008 and 2011, a 24.6% increase in treatment demands was observed (15.6% among first‐ever treatments and 21.6% among injecting users). During the same period there was an overall 17.5% increase in the number of opioid users (6.0% among first‐ever treatments), but also a 34.1% increase in cocaine/crack use (Figure 15) (although, not among first‐ever treatments who had a 3.5% decrease). The number of those injecting (main route) has increased compared to 2008 (unlike those who sniff which have been levelled off since 2009), while also the number of those reporting daily use increased by 14% (levelled off in 2011). Compared to 2009, an increasing trend in the percentage of users reporting use of multiple substances was also observed in 2011. Increases were most notable among those reporting 3 or more substances of use. After 2008, increases have been also observed in the numbers of current injectors (increase by 18.9%) and in current sharing (5.6% increase between 2008 and 2011).28
Changes in drug use patterns among IDUs
This section focuses on the ever‐IDUs in Athens who also report injection as the main route of administration. Using Pearson’s chi‐square tests, significant changes in the proportions of different groups of IDUs reporting a range of drug use behaviours were examined between 2008 and 2011. The behaviours examined were: use of opioids (primary only substance); use of cocaine/crack (primary only substance); use of cocaine/crack (primary or secondary substance); use of stimulants other than cocaine/crack (primary or secondary substance); frequent use of primary substance (at least 2 days a week); current injecting (last 30 days); and current sharing of used syringes (last 30 days). The results for the different subgroups of IDUs are presented in Tables 7‐9. Compared to 2008, in 2011:
opioids use decreased in almost all IDU groups, including out‐of‐treatments,29
22 Persons addicted to opioids; method used capture‐recapture.
23 Refer to the lower and upper bounds of the prevalence estimate.
24 Persons addicted to opioids and have injected in the last 30 days (based on the EMCDDA definition).
25 Greek Reitox focal point (2012). 2012 National Report (2011data) to the EMCDDA by the Reitox national focal point. Athens: UMHRI.
26 Data on drug treatment demand come from 82 treatment units that provided data to the NFP in 2011 in the context of the TDI
system (82% coverage at treatment level). 100 treatment and low‐threshold settings were expected to provide data to the NFP in 2011. The number of drug users demanding treatment in GPs or private clinics (i.e. settings other than those included in the state‐accredited treatment system of service providers) is unknown to the NFP. 27 Greek Reitox focal point (2012). 2012 National Report (2011data) to the EMCDDA by the Reitox national focal point. Athens: UMHRI.
28 Greek Reitox focal point (2012). 2012 National Report (2011data) to the EMCDDA by the Reitox national focal point. Athens: UMHRI.
29 IDUs accessing low‐threshold settings in Athens.
HIV outbreak among injecting drug users in Greece – An updated report to the EMCDDA 2012
13
cocaine/crack use increased in almost all IDU groups – also among out‐of‐treatments (Table 8) and among current injectors and those currently sharing (Table 9),
stimulants other than cocaine/crack show no changes, except for out‐of‐treatment IDUs who show a significant increase (Table 8), and
frequent use of the primary substance showed no increases overall or only decreases among some IDU subgroups,
current injecting shows no change overall or even decreases, except for the out‐of‐treatment IDUs where a significant increase is observed (Table 8), and
current sharing shows no increases or decreases overall, except for ‘new’ injectors (13.5% and 31.9%
in 2008 and 2011, respectively) and ‘young’ injectors (31.7% and 47.4% in 2008 and 2011, respectively) (Table 9).
Socio‐demographic characteristics of treatment demands
Non‐Greeks
The vast majority of entries in the drug treatment system are Greek nationals. Since 2008, non‐Greek treatment demands have steadily increased both in numbers and proportions (Figure 16). In 2011, one in every 13 treatment entries were of non‐Greek nationality (7.0%; 10.1% among the first‐ever treatments). Compared to other areas (3.9%), a significantly higher percentage treatment demands were reported by non‐Greek nationals in Athens (9.4%) in 2011 (Table 3).
Unemployment
Most of the 2011 treatment entries were unemployed (64.3%, significantly lower among the first‐ever treatments, 56.0%). From 2009 onwards, a significant increase in the number of unemployed users seeking treatment was observed (Figure 17). Compared to other areas (62.5%), a significantly higher percentage of unemployed users were reported in Athens (65.8%) in 2011 (Table 3).
Homelessness
Nine in 10 (90.9%) reported stable accommodation and 8.8% report unstable accommodation or homelessness in 2011 (Figure 18). Compared to other areas (6.3%), those entering treatment in Athens reported a significantly higher level of unstable accommodation or homelessness (11.0%) in 2011 (Table 3).
Condom use (DRID data)
According to DRID data, about 80% and 25% of IDUs entering treatment in 2011 would not ‘always’ use condoms with their steady and casual partners, respectively (Figure 19 and Figure 20). In addition, a decreasing trend was evident between 2009 and 2010 in the proportion of IDUs reporting ‘always’ use irrespective of the type of partner, although this decreasing trend levelled off only for the Athens sample (possibly due to the health alerts channelled via street‐work).
Drug markets
Heroin shortage
Evidence suggests that heroin shortages may be associated with changes in drug use patterns, i.e., changes from sniffing to injection, more frequent injection and injecting of synthetic opioids and stimulants (crack, amphetamines and other injectable stimulants).30 31 32 Unlike other areas in the European region that
30 Joint EMCDDA and ECDC rapid risk assessment.
HIV outbreak among injecting drug users in Greece – An updated report to the EMCDDA 2012
14
reported heroin shortages between late 2010 and early 2011, in Greece there is no clear indication of heroin shortage recently; certainly not in Athens. Evidence published by the EMCDDA in 201133 and 201234 (based on expert opinion), refers to a rather unclear picture for Greece. Personal communication with Hellenic Police officials confirm that there is no heroin shortage in Athens in recent years (although heroin purity has declined, see below).
Purity of heroin and cocaine
According to the Greek General Chemical State Laboratory,35 based on data from analyses carried out in samples seized36 by law enforcement units in Greece,37 the purity of heroin is low, both at trafficking level (mean value 10‐15%) and at user level (5%). Frequent adulterants are reported to be paracetamol and caffeine, while individual cases of detection of benzodiazepines (diazepam, flunitrazepam, alprazolam) strychnine, barbiturates, cocaine, sulpiride and dextromethorphan have been reported. The last substance appears to show an increasing trend, especially in samples originating from India (as per law enforcement information), and recently in big quantities it is combined with alprazolam and/or diazepam. Samples containing dextromethorphan differ also in physical appearance (light beige colour).
The purity of cocaine is also decreasing (mean value 50%). Phenacetin and lidocaine appear to be the most frequent adulterants. Other adulterants are, levamisole (increasing trend), while diltiazem and mirtazapine are not seen any more. Occasionally phenobarbital, ecstasy, ketamine, methamphetamine and heroin are reported among the adulterants of cocaine, while a number of multiple combinations are observed (cocaine in mixture with heroin, alprazolam and dextromethorphan –probably ‘speedball’ with heroin originating from India, as described above).
Methamphetamine (SISA) in the downtown Athens drug scenes
In the beginning of 2011, the NFP’s early warning system (EWS) was notified by outreach street‐workers38 about an allegedly dangerous (according to the drug users) substance called SISA that emerged in the open drug scenes of downtown Athens. The General Chemical State Laboratory verified the presence of a methamphetamine type drug with the street‐name SISA seized in the illegal market. This substance comes in crystal form, and it has been found commonly in seizures with heroin. In a few cases, combinations with TFMPP, MDMA and cocaine have also been identified. Anecdotal information suggests that SISA is locally produced.
KETHEA‐EXELIXIS39 conducted a survey on this substance involving IDUs both from the open drug scenes and its low‐threshold setting. Respondents verified that SISA is widely available and used in downtown Athens, especially (some argued) among immigrant drug users from Afghanistan, Iran, Iraq, Pakistan and India. SISA is also available at relatively low prices (i.e. €2‐3 a shot40 compared to €8‐20/gram of brown heroin and €40‐100 /gram of cocaine).41 SISA was evaluated as highly toxic with severe side effects such as aggression, psychotic symptoms, emaciation etc. SISA is primarily smoked and less commonly injected, however, increased injecting risks can occur even when the substance is smoked, if this practice is combined with the injection of other drugs.42
31 Suhrcke, M., Stuckler, D., Suk, J.E., Desai, M., Senek, M., McKee, M., et al. (2011). The impact of economic crises on communicable
disease transmission and control: a systematic review of the evidence. PLoS One, 6, e2072. 32 Friedman, S. R., Rossi, D., Braine, N. (2009). Theorizing Big Events as a potential risk environment for drug use, drug‐related harm
and HIV epidemic outbreaks. International Journal of Drug Policy, 20, 283–91. 33 EMCDDA (2011). Trendspotter summary report: Recent shock in the European heroin market: explanations and ramifications.
EMCDDA, 15 November 2011. 34 Griffiths, P., Mounteney, J., & Laniel, L. (2012). Understanding changes in heroin availability in Europe over time: emerging evidence
for a slide, a squeeze and a shock. Addiction, 107, 1539–1540. 35 General Chemical State Laboratory, 3rd Chemical Service of Athens, Department of Narcotics.
36 Data refer to seizures at all levels: user, trafficking and points of entry. Data refer to a total of ~65 000 samples per year.
37 Police, Customs, Financial Crime Unit and Coast Guard.
38 Run by OKANA and KETHEA.
39 Street work programme in Athens.
40 Reported in the Seminar ‘New substances, New challenges…’ organised by the NFP, 20 March 2012.
41 Source: Hellenic Police 2011.
42 Personal communication, street‐worker.
HIV outbreak among injecting drug users in Greece – An updated report to the EMCDDA 2012
15
5. TREATMENT AND HARM REDUCTION
Drug treatment system
In 2011, 92 drug treatment units offered treatment services in Greece, providing all treatment modalities. 43 These include 42 OST units, 45 psychosocial interventions (drug‐free) units, one detoxification unit and 4 treatment units in prison settings. Not accounting for possible double counting,44 a total of 9,721 users received treatment services (main phase) in any single treatment unit in 201145 (19% and 21% increase in the treatment slots compared to 2010 and 2009, respectively). Approximately three in every four treatments (70%) were in OST. 46 Just like with the treatment demand data, the number of the drug users receiving treatment in GPs or private clinics (i.e., settings other than those included in the state‐authorised treatment system of service providers) is unknown to the NFP.
Harm reduction
Except for the OST programme which aims also at reducing illicit opioid use, interventions implemented by low‐threshold and harm reduction services in Greece focus primarily on dealing with the management of overdoses and other health‐related problems of drug users, and on the prevention of blood‐borne infections. They include exchange and free distribution of syringes and other injecting paraphernalia, condom distribution, screening, vaccination, treatment, information campaigns, referrals, and psychosocial support. Low‐threshold and harm reduction services are available primarily through the official drug treatment system and other health services accredited by the state. A sizeable amount of work in the field of harm reduction is also provided by non‐governmental, non‐profit organisations (NGOs) especially with regard to the needs of socially marginalised groups (most of the times including drug users).
Opioid substitution treatment (OST) and coverage
Organisation Against Drugs (OKANA) is the only agency in Greece accredited to provide OST services. According to OKANA, as of August 2012, 52 units provided OST in Greece, half of which (23, 44.5%) were in Athens (Figure 21). 7,620 individuals were receiving OST services on August 31st 2012 (2,848, 37.4% in Athens) (Figure 22).47
Since August 2011, OKANA has launched 27 new OST units, primarily in Athens and Thessaloniki, operating in collaboration with public hospitals. Another 13 units are planned (Figure 21), according to OKANA, in cities other than Athens and Thessaloniki in an effort to respond to local needs.
The expansion of the OST programme since August 2011 has resulted in significant progress:
Increases in the number of IDUs entering substitution treatment (35% increase nationally, 26% in Athens and 64% in Thessaloniki) (Figure 22).
Increases in the mean monthly number of drug users applying for OST. As it is shown in Figure 23, between 2010 and 2011, the mean monthly number of OST applicants has doubled in Athens and has almost tripled in Thessaloniki (where the increasing trend is expected to continue also for 2012).
Decreases in the number of problem opioid users on the waiting list for OST in Greece (decrease by 43%, 30% Athens/Attica region and 80% in Thessaloniki) (Figure 24).
Decreases in the mean waiting time for entering OST in Athens/Attica region from about 8 years (90 months) in September 2011 to almost 4 years (46 months) in August 2012. For the same period, the
43 Greek Reitox focal point (2012). 2012 National Report (2011data) to the EMCDDA by the Reitox national focal point. Athens: UMHRI.
44 The exact number of clients moving from one treatment unit to another during any reporting year is not known, however it is not
expected to be high. 45 Low‐threshold units excluded.
46 Greek Reitox focal point (2012). 2012 National Report (2011data) to the EMCDDA by the Reitox national focal point. Athens: UMHRI.
47 Micha, K. Greek Organisation against Drugs: Update and Response to the HIV/IDU epidemic, Presentation to ECDC Technical
Meeting, 10 September 2012. Athens: OKANA.
HIV outbreak among injecting drug users in Greece – An updated report to the EMCDDA 2012
16
waiting list for OST in Thessaloniki has been almost eliminated (from an average of 48 months in August 2011 to a maximum of 2 months in August 2012) (Figure 25).
According to OST coverage data for Athens,48 one in every 5 (20.7%) estimated problem drug user would receive OST in 2010. In 2011, OST coverage has increased to 28.1%, while as of August 2012 it was estimated to be around 35%, following the rapid expansion of the OST programme from mid‐2011 onwards (Figure 26).
Needle and syringe programmes (NSP) and coverage
Five (5) sites currently implement syringe exchange/distribution programmes (NSP) in Greece, all situated in Athens; i.e. there are no such services outside the capital (an NSP is about to be launched in Thessaloniki). In Athens, NSP services are provided by OKANA’s low‐threshold/harm reduction services (MAVY and SFEA ‐ Drug‐Addicts Care Facility), Medecins du Monde and more recently by HCDCP. It is worth noting that as of October 2012, KETHEA‐EXELIXIS49 introduced a (pilot) syringe exchange programme in the open drug scenes of Athens.
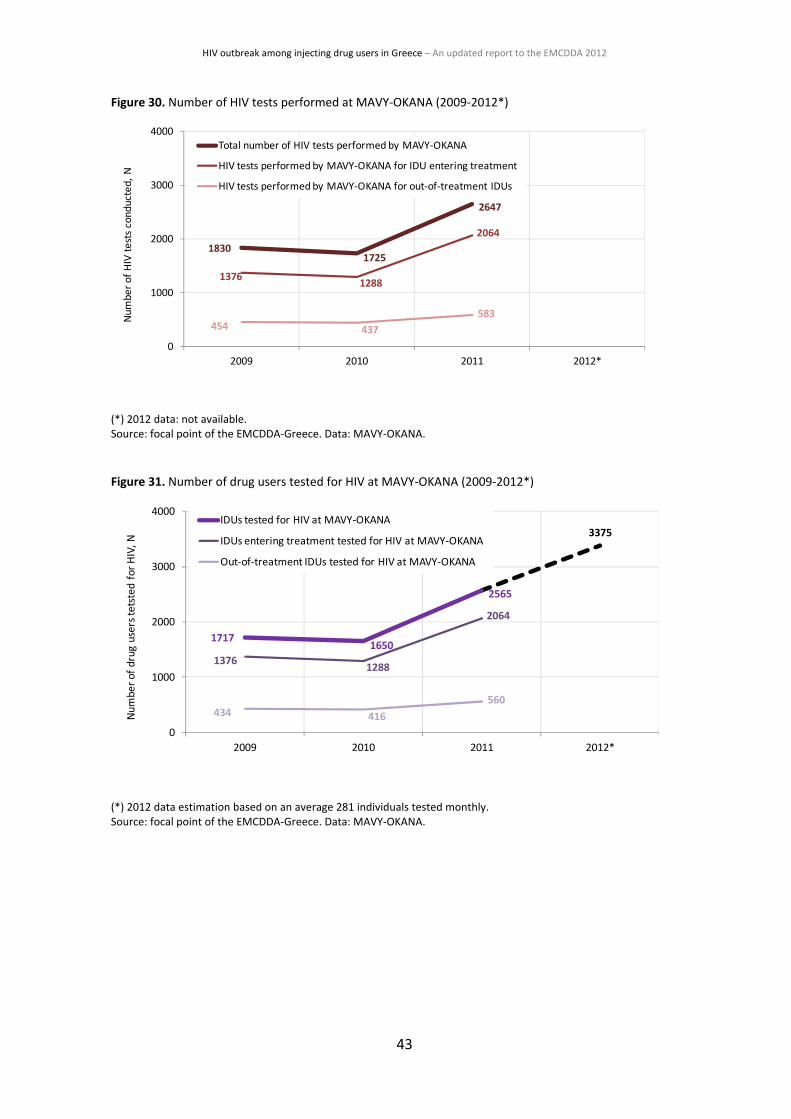
In 2011, approximately 120,000 syringes were either exchanged (74.5%) or distributed (25.5%). As shown in Figure 27, a significantly higher number of syringes were handed out in 2011 compared to previous years (doubled compared to 2010). Until August 2012, only by OKANA’s harm reduction services, approximately 130,000 syringes had been exchanged or distributed to IDUs. As of May 2011, ΜΑVΥ‐ΟΚΑΝΑ increased the number of syringes allowed for exchange (from 25 to 40 per client weekly).
In addition, between December 2011 and July 2012, the HCDCP mobile medical units (Department of Community Intervention‐HCDCP) distributed more than 100,000 syringes, 95,000 sterile tissues and 95,000 serums and condoms. Furthermore, its street work programme for IDUs has distributed more than 1,100 kits and 3,300 syringes and other injecting paraphernalia.
Note that quantitative information regarding the number of the recipients of the clean syringes is not available to the NFP.
According to NSP coverage data, the annual number of syringes available per estimated IDU in Greece was less than 20 until 2011.50 Only in Athens about 43 syringes per IDU were available in 2011 (almost tripled compared to 2010), while according to the recent trends in NSP provision presented above, this number is expected to be higher for 2012 (Figure 28).
Condom distribution programmes
Six (6) sites implement condom distribution programmes explicitly targeting active drug users, all situated in Athens. Condom programmes are run by OKANA, KETHEA, Medecins du Monde, and ATHINA‐YGEIA Prevention Centres. In 2011, approximately 25,000 condoms were distributed in total. As shown in Figure 29, a significantly higher number of condoms were handed out in 2011 compared to the previous years. It should be noted nonetheless that another 50,000 condoms had been distributed by PRAKSIS‐NGO and HCDCP to socially marginalised groups, including drug users, in 2011 (not shown in Figure). In 2012 (as of August 2012), OKANA’s harm reduction services alone handed out approximately 43,000 condoms to street users. As of May 2011, ΜΑVΥ‐ΟΚΑΝΑ increased the number of condoms distributed to active users (from 7 weekly to 25 or even 40 for injecting sex workers). Quantitative data regarding the number of out‐of‐treatment IDUs receiving condoms are not available to the NFP.
48 OST treatments as percentage of the central PDU estimate (PDUs in Greece are almost exclusively opioid users).
49 Low‐threshold setting of the Therapy Centre for Dependent Individuals (KETHEA), a treatment agency offering drug‐free only
treatment. 50 Estimates are based on data on syringes distributed that it was known that the recipient was a drug users, i.e., exclude the number
of syringes handed‐out to vulnerable groups in general.
HIV outbreak among injecting drug users in Greece – An updated report to the EMCDDA 2012
17
Screening for HIV and other infections
Outside the drug‐treatment system, IDU testing for HIV and other infections takes place in an ad‐hoc manner in specialised public and private laboratories, hospitals and reference centres. Testing is also provided in an ad‐hoc manner through outreach mobile units (e.g. HCDCP and PRAKSIS). More specifically, the mobile medical units of HCDCP51 provide primary health care, HIV and other infectious diseases screening, health promotion and distribution of syringes to IDUs in downtown Athens. The HCDCP mobile medical units conducted 2,312 tests have been between September 2011 and June 2012 also involving an unknown number of IDUs. In addition, PRAKSIS52 through its programmes (polyclinics and, especially, its mobile units) provides among other services rapid HIV testing for vulnerable groups, also for IDUs in Athens, Thessaloniki and other cities. PRAKSIS conducted 1,332 rapid HIV tests between June 2010 and November 2011 on individuals from vulnerable groups also involving an unknown number of IDUs. 53
Within the drug‐treatment system, laboratory testing for HIV and other infections (i.e. HCV, HBV, and TB) is more or less a required condition for admission to all drug treatment services in Greece (but not a prerequisite for access to low‐threshold services). Laboratory tests are performed either by specialised units within the drug treatment system or through a network of collaborating authorised laboratories situated in public hospitals and other health services. Diagnosed HIV cases are reported into official HIV/AIDS surveillance system. The number of tests conducted and the number of IDUs tested at MAVY‐OKANA are shown in Figure 30 and Figure 31, respectively. The number of users tested in first eight months of 2012 has already overhauled the total for 2011 (Figure 31).
As from August 2012, HIV testing is being conducted as part of the ARISTOTLE, Seek‐Test‐Treat‐Retain (STTR) research and prevention intervention which aims to decrease HIV transmission among IDUs in the Athens metropolitan area. 1,000 tests had been conducted as of 31 September 2012.
Treatment for HIV and other infections
The NFP collects no data on infectious diseases treatment uptake or adherence by HIV‐positive IDUs.
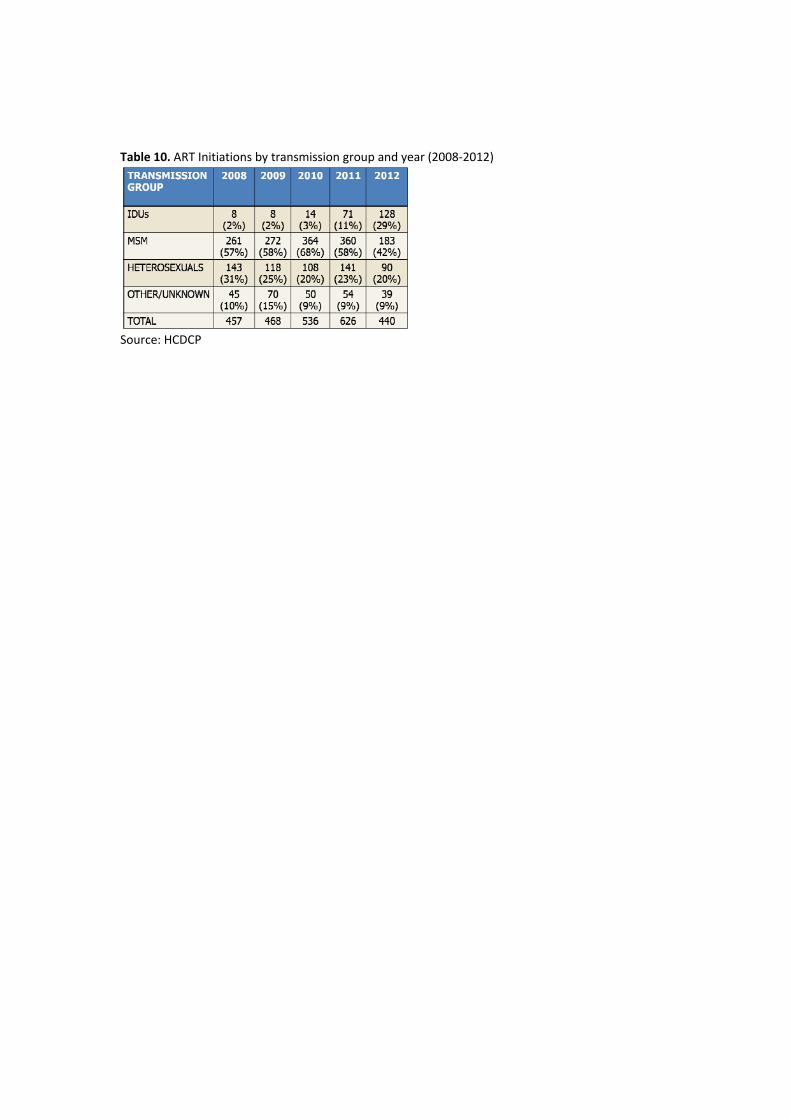
According to HCDCP data, 35% of people whose probable route of HIV infection was IDU in 2011‐2012 are on ART, a lower proportion compared to other groups affected. HIV‐positive IDUs were 11% of the ART treatment initiates in 2011, while as of August 2012, this proportion has been almost tripled (29%) (Table 10). There is no information available about IDUs’ adherence to ART.
Health promotion
Harm reduction programmes which address their services directly to drug users distributed around 8,000 printed leaflets in 2011 (data from 4 out of the 6 sites run by OKANA, KETHEA, Medecins du Monde, and ATHINA‐YGEIA Prevention Centres).54 Information leaflets included information on disease prevention, on safer injecting behaviour, sexual health, testing and treatment. The number of the printed leaflets distributed in 2011, albeit higher compared to 2009 (about 5,200), was nonetheless lower compared to 2010 (about 11,800).
Another 140,000 copies of printed information material were distributed in 2011 to socially marginalised groups in Athens, including active users by outreach programmes of HCDCP and PRAKSIS. Note that the HCDCP material was produced also in 4 languages other than Greek, while also PRAKSIS’s material has been produced in 12 languages.
51 HCDCP’s Department of Community Intervention; records and treats health problems in groups that lack access to health and social
services, including IDUs. 52 Non‐governmental, non‐profit organisation; supports vulnerable groups including IDUs by providing inter alia medial and
psychosocial services. 53 Data presented at the ECDC/EMCDDA Technical Meeting held in Athens, May 25, 2012.
54 Greek Reitox focal point (2012). 2012 National Report (2011data) to the EMCDDA by the Reitox national focal point. Athens: UMHRI.
HIV outbreak among injecting drug users in Greece – An updated report to the EMCDDA 2012
18
The number of the recipients of information leaflets is not known to the NFP.
Additional health promotion interventions/services related to HIV and other blood‐borne infections include: campaigns, helplines, training of professionals; public speeches and seminars, practical advice and individual counselling conducted by a wide variety of agencies (e.g. OKANA, KETHEA, HCDCP, PRAKSIS, and Centre For Life) with the involvement also of a large number of volunteers.
HIV outbreak among injecting drug users in Greece – An updated report to the EMCDDA 2012
19
6. POSSIBLE HYPOTHESES FOR THE OUTBREAK
Multiple factors may have interacted for the HIV outbreak and the subsequent possible establishment of high prevalence among IDUs in Greece (Athens).
Based only on the available55 epidemiological data, evidence from behavioural and market indicators and qualitative input and other anecdotal information, the conditions for the outbreak lie primarily within increasing risk behaviours among IDUs in Athens from 2008 onwards. At the meso‐level, the observed changes in injecting patterns occurred in a context of consistently low OST and NSP provision (low coverage) and low uptake of antiretroviral therapy by IDUs. At a higher level, the observed changes emerged in parallel with the economic recession which has also mostly affected the Athens downtown area.
Increasing risk behaviours among IDUs in Athens
Evidence from behavioural indicators suggests that increasing numbers of IDUs in Athens have adopted health‐risking injecting behaviours in the last 4 years. Proportions of opioid using IDUs decreased in parallel with increases in cocaine injection in almost all IDU groups (also among out‐of‐treatments, current injectors and among those currently sharing, Table 8 and Table 9). Injecting cocaine, albeit not riskier compared to opioids, is associated with more frequent injecting.56 57 58 During the same period, albeit referring to a comparatively small proportion of the studied population, the use of stimulants other than cocaine/crack show also significant increases among out‐of‐treatment IDUs. The same group also reported significant increases in current injecting (injecting in the last 30 days) between 2008 and 2011. Finally, current sharing (sharing in the last 30 days) increased among ‘new’ and ‘young’ injectors (Table 9).
Evidence from other countries and cities in the world suggests that periods of economic crises and dominance of poor heroin quality or shortage may be associated with changes in drug use patterns, i.e., changes from sniffing to injection, more frequent injection and injecting of synthetic opioids (buprenorphine, fentanyl, methadone) and, increasingly, stimulant drugs (crack, amphetamines and other injectable amphetamine‐type stimulants).59 60 61
There is no evidence for a heroin shortage in Athens, corroborated also by the fact that the numbers of heroin injectors seeking help increase annually (Figure 15). However, there is considerable evidence from confiscations and laboratory analyses, as well as from personal communications, of low purity (adulterated) heroin dominating drug markets in Athens.
Heroin purity levels have not been much higher before: national mean rates of purity ranged between 12.8% and 23.0% in the period 2003‐2011 (lowest, 12.8% in 2011). However, the reported increases in the proportions of out‐of‐treatment IDUs reporting current injecting may be related to the combined effect of
55Note that there is lack of information on additional indicators such as: changes in other risk behaviours (e.g., unprotected sex,
engagement in transactional sex); changes in the composition of the IDUs networks (e.g. increased number of injectors, increased number of sharing partners, infusion of immigrants); IDU network mixings with other networks (e.g. expansion of IDU networks with sex‐workers and other mixings); low –or no‐risk perceptions held by IDUs over e.g., injecting new substances, sharing used needles or being engaged in unprotected sex; lack of awareness and knowledge of e.g. the risks and the ways to circumvent them and of the seriousness of HIV infection; and deteriorating socioeconomic conditions of the IDUs themselves and their immediate living environments (family, neighbourhood, wider area, etc.). 56 Tyndalla, M. W., Currie, S., Spittal, P., Li, K., Wood, E., O’Shaughnessy, M. V., & Schechter, M.T. (2003). Intensive injection cocaine
use as the primary risk factor in the Vancouver HIV‐1 epidemic. AIDS, 17, 887–893. 57 Kaye, S., & Darke, S. (2004). Injecting and non‐injecting cocaine use in Sydney, Australia: physical and psychological morbidity. Drug
and Alcohol Review, 23, 391–398. 58 Leri, F., Bruneau, J., & Stewart, J. (2003). Understanding polydrug use: review of heroin and cocaine co‐use. Addiction, 98, 7–22.
59 Joint EMCDDA and ECDC rapid risk assessment.
60 Suhrcke, M., Stuckler, D., Suk, J. E., Desai, M., Senek, M., McKee, M., et al. (2011). The impact of economic crises on communicable
disease transmission and control: a systematic review of the evidence. PLoS One, 6, e2072. 61 Friedman, S. R., Rossi, D., & Braine, N. (2009). Theorizing ‘Big Events’ as a potential risk environment for drug use, drug‐related harm
and HIV epidemic outbreaks. International Journal of Drug Policy. 20, 283–91.
HIV outbreak among injecting drug users in Greece – An updated report to the EMCDDA 2012
20
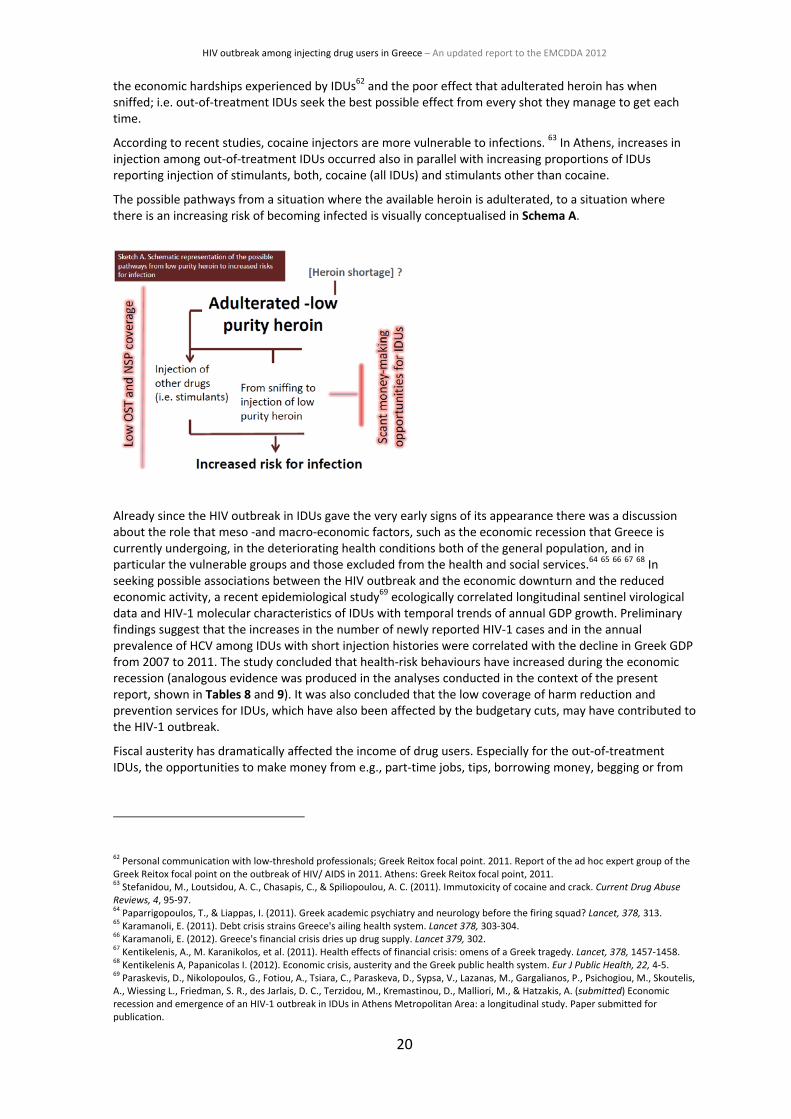
the economic hardships experienced by IDUs62 and the poor effect that adulterated heroin has when sniffed; i.e. out‐of‐treatment IDUs seek the best possible effect from every shot they manage to get each time.
According to recent studies, cocaine injectors are more vulnerable to infections. 63 In Athens, increases in injection among out‐of‐treatment IDUs occurred also in parallel with increasing proportions of IDUs reporting injection of stimulants, both, cocaine (all IDUs) and stimulants other than cocaine.
The possible pathways from a situation where the available heroin is adulterated, to a situation where there is an increasing risk of becoming infected is visually conceptualised in Schema A.
Already since the HIV outbreak in IDUs gave the very early signs of its appearance there was a discussion about the role that meso ‐and macro‐economic factors, such as the economic recession that Greece is currently undergoing, in the deteriorating health conditions both of the general population, and in particular the vulnerable groups and those excluded from the health and social services.64 65 66 67 68 In seeking possible associations between the HIV outbreak and the economic downturn and the reduced economic activity, a recent epidemiological study69 ecologically correlated longitudinal sentinel virological data and HIV‐1 molecular characteristics of IDUs with temporal trends of annual GDP growth. Preliminary findings suggest that the increases in the number of newly reported HIV‐1 cases and in the annual prevalence of HCV among IDUs with short injection histories were correlated with the decline in Greek GDP from 2007 to 2011. The study concluded that health‐risk behaviours have increased during the economic recession (analogous evidence was produced in the analyses conducted in the context of the present report, shown in Tables 8 and 9). It was also concluded that the low coverage of harm reduction and prevention services for IDUs, which have also been affected by the budgetary cuts, may have contributed to the HIV‐1 outbreak.
Fiscal austerity has dramatically affected the income of drug users. Especially for the out‐of‐treatment IDUs, the opportunities to make money from e.g., part‐time jobs, tips, borrowing money, begging or from
62 Personal communication with low‐threshold professionals; Greek Reitox focal point. 2011. Report of the ad hoc expert group of the
Greek Reitox focal point on the outbreak of HIV/ AIDS in 2011. Athens: Greek Reitox focal point, 2011. 63 Stefanidou, M., Loutsidou, A. C., Chasapis, C., & Spiliopoulou, A. C. (2011). Immutoxicity of cocaine and crack. Current Drug Abuse
Reviews, 4, 95‐97. 64 Paparrigopoulos, T., & Liappas, I. (2011). Greek academic psychiatry and neurology before the firing squad? Lancet, 378, 313.
65 Karamanoli, E. (2011). Debt crisis strains Greece's ailing health system. Lancet 378, 303‐304.
66 Karamanoli, E. (2012). Greece's financial crisis dries up drug supply. Lancet 379, 302.
67 Kentikelenis, A., M. Karanikolos, et al. (2011). Health effects of financial crisis: omens of a Greek tragedy. Lancet, 378, 1457‐1458.
68 Kentikelenis A, Papanicolas I. (2012). Economic crisis, austerity and the Greek public health system. Eur J Public Health, 22, 4‐5.
69 Paraskevis, D., Nikolopoulos, G., Fotiou, A., Tsiara, C., Paraskeva, D., Sypsa, V., Lazanas, M., Gargalianos, P., Psichogiou, M., Skoutelis,
A., Wiessing L., Friedman, S. R., des Jarlais, D. C., Terzidou, M., Kremastinou, D., Malliori, M., & Hatzakis, A. (submitted) Economic recession and emergence of an HIV‐1 outbreak in IDUs in Athens Metropolitan Area: a longitudinal study. Paper submitted for publication.
HIV outbreak among injecting drug users in Greece – An updated report to the EMCDDA 2012
21
getting pocket money from their families have become scant.70 Evidence from this is reflected to some extent in the TDI data on the employment status. These show that the number of unemployed drug users has increased since 2006 (Figure 17, significantly increased, p<0.001, among the Athens IDU samples), interestingly, this occurred at about the same time when the first infections in the clusters as well as the increase in risk behaviour (HCV prevalence) were observed.
In a 2011 expert meeting on the HIV outbreak, professionals agreed that drug users engage in larger numbers and in increased frequency in paid sex to support their addiction financially. 71 72 No quantitative data are available on the percentage of IDUs who engage in paid sex. According to DRID data presented in previous sections, one in every four IDUs (25%) entering treatment in 2011 would not use ‘always’ condoms with their casual partners (Figure 20). In April 2012, police arrested 17 women with HIV who allegedly worked illegally as prostitutes, many of whom were also allegedly drug users. What this case indicated is that transactional sex and, more specifically, the possible interchange or even overlap between sex‐work and IDU networks forms a potentially proximal source of new infections within and between the existing networks in Athens.
Low coverage of prevention services
The current HIV outbreak in Athens has occurred within the context of a long‐term low coverage of service provision in the field of harm reduction.
Despite improvements in OST coverage of late (owing to the rapid expansion of the OST units from mid‐2011 onwards, Figure 22), OST provision in Athens and Thessaloniki has been for many years characterised by extensive waiting lists and lengthy periods (several years) of waiting time between initial demand and admission to the programme. According to the most recent data available from the EMCDDA on OST coverage rates for 2009/2010 (18 countries), Greece was among those few countries (with Cyprus, Latvia, Lithuania, Poland and Slovakia) that were characterised by low coverage rates (ranging between 2% and 27%) (Figure 32).73 Low OST coverage for many years in Athens did not help in reducing the health‐related risks within the IDU population as relatively few IDUs were offered the chance to replace their opioid injecting by oral OST and be tested for HIV and other infections.74 75 76 77 78 79 80 81 82
Similarly, despite recent increases in the number of needles distributed to IDU populations in downtown Athens, NSP coverage remains low (currently estimated at about 45 syringes per IDU per year). According to international standards, an annual distribution of 100 syringes per IDU is considered low for HIV
70 Greek Reitox focal point. 2011. Report of the ad hoc expert group of the Greek Reitox focal point on the outbreak of HIV/ AIDS in
2011. Athens: Greek Reitox focal point, 2011. 71 Greek Reitox focal point. 2011. Report of the ad hoc expert group of the Greek Reitox focal point on the outbreak of HIV/ AIDS in
2011. Athens: Greek Reitox focal point, 2011. 72 Malliori et al (2011). HIV/AIDS among IDUs in Greece: Report of a recent outbreak and initial response policies. EMCDDA, Lisbon
73 Joint EMCDDA and ECDC rapid risk assessment; EMCDDA. Annual Report 2011: The state of the drugs problem in Europe.
Publications Office of the European Union, Luxembourg, 2011. 74 Sullivan LE, Metzger DS, Fudala PJ, Fiellin DA. Decreasing international HIV transmission: the role of expanding access to opioid
agonist therapies for injection drug users. Addiction 2005;100(2):150‐58. 75 Metzger DS, Woody GE, McLellan AT, O'Brien CP, Druley P, Navaline H, et al. Human immunodeficiency virus seroconversion among
intravenous drug users in‐ and out‐of‐treatment: an 18‐month prospective follow‐up. Journal of Acquired Immune Deficiency Syndrome 1993;6:1049‐56. 76 Marsch LA. The efficacy of methadone maintenance interventions in reducing illicit opiate use, HIV risk behavior and criminality: a
meta‐analysis. Addiction 1998;93(4):515‐32. 77 Gowing LR, Farrell M, Bornemann R, Sullivan L, Ali, R. Methadone treatment of injecting opioid users for prevention of HIV
infection. J Gen Intern Med. 2006; 21(2): 193–195. 78 Gowing, L. R. (2012). ‘The role of opioid substitution treatment in reducing HIV transmission.’ BMJ 345: e6425.
79 Roux, P., M. P. Carrieri, et al. (2009). ‘Retention in opioid substitution treatment: a major predictor of long‐term virological success
for HIV‐infected injection drug users receiving antiretroviral treatment.’ Clin Infect Dis 49(9): 1433‐1440. 80 Weber, R., M. Huber, et al. (2009). ‘Uptake of and virological response to antiretroviral therapy among HIV‐infected former and
current injecting drug users and persons in an opiate substitution treatment programme: the Swiss HIV Cohort Study.’ HIV Med 10(7): 407‐416. 81 Lawrinson, P., R. Ali, et al. (2008). ‘Key findings from the WHO collaborative study on substitution therapy for opioid dependence
and HIV/AIDS.’ Addiction 103(9): 1484‐1492. 82 Gowing, L., M. Farrell, et al. (2008). ‘Substitution treatment of injecting opioid users for prevention of HIV infection.’ Cochrane
Database Syst Rev(2): CD004145.
HIV outbreak among injecting drug users in Greece – An updated report to the EMCDDA 2012
22
prevention,83 while it is considered inadequate during outbreaks. The average number of syringes per IDU distributed by specialised programmes in Greece was less than 20 until 2011. According to the estimate for the PDU population size in Athens in 2011 (about 8,000), the minimum number of syringes distributed annually should be more than 200 per IDU (i.e., at least 1.6 million syringes per year). However, given the characteristics of the outbreak, at least twice this number of syringes would be required for Athens alone (note that only about 120 000 syringes were distributed in 2011). It should be noted, nonetheless, that the prevention potential of NSPs in outbreaks like the one in Athens can be increased only if there is a plan for one syringe per injection. To this end, detailed data on the average injecting frequency per IDU is required.
Low (estimated) ART uptake by HIV‐positive IDUs
HCDCP has some data for ART uptake by IDUs which show increases in the proportion of IDUs receiving ART treatment (Table 10). There are no data on the percentage of HIV‐positive IDUs receiving ART treatment (prevalence). Personal communications with physicians from the drug treatment system, nonetheless, suggest that there are overall low levels of ART uptake and, especially, adherence to treatment by HIV‐positive IDUs.84
83 WHO, UNODC, UNAIDS. Technical guide for countries to set targets for universal access to HIV prevention, treatment and care for
injecting drug users. WHO, Geneva, 2009. 84 Reported during an ad‐hoc seminar organised by the NFP and OKANA on DRID monitoring system. Pathologists from the OST units in
Greece participated in the seminar.
HIV outbreak among injecting drug users in Greece – An updated report to the EMCDDA 2012
23
7. RESPONSES
Since the detection of the increase in cases at the beginning of 2011, a series of actions have been taken.
OST programme expansion
Since August 2011, OKANA has launched 27 new OST units, primarily in Athens and Thessaloniki, operating in collaboration with public hospitals. Another 13 units are planned to be established particularly in cities other than Athens and Thessaloniki (Figure 21) in an effort to cover local needs for treatment and harm reduction.
In 2012, further actions were taken by OKANA towards the restructuring and further expansion of its OST programme. Among the main priorities were to eliminate the waiting time for IDUs for entering the OST programme, especially in Athens. Additional priorities included the geographical and organisational decentralisation of OST units (especially within the Attica region, which includes Athens and Piraeus, areas with high population density) together with the cutback of treatment slots per OST unit, in an effort to reduce public nuisance and ease down possible reactions from local communities.85
As a result:
More IDUs enter treatment: The rapid expansion of the OST programme has significantly increased the number of drug users (predominantly IDUs) entering substitution treatment thereby significantly reducing the risk of health‐related problems. More specifically, within a year (August 2011 to August 2012) there was a 35% increase in the number of IDUs entering substitution treatment nationally (26% in Athens and 64% in Thessaloniki) (Figure 22).
Demand for OST has been increased: The expansion of the OST system in 2011 and in the first nine months of 2012 has eventually resulted in the increase in the mean monthly number of IDUs applying for OST. More specifically, between 2010 and 2011, the mean monthly number of OST applicants has doubled in Athens and has almost tripled in Thessaloniki (where the increasing trend is expected to continue also for 2012) (Figure 23).
Waiting lists for OST have been shortened: The rapid expansion of the OST programme has significantly reduced the number of problem users waiting to enter OST treatment in the two largest cities of Greece, Athens (including Piraeus) and Thessaloniki. More specifically, since August 2011, the waiting list has decreased by 43% nationally (30% in Athens and 80% in Thessaloniki) (Figure 24).
The mean waiting time for entering OST has been significantly reduced: The OST programme expansion also resulted in the reduction of the mean waiting time for entering treatment in the Athens–Piraeus area. More specifically, the mean waiting time for entering OST in Athens decreased from about 8 years in September 2011 to almost 4 years in August 2012 and in Thessaloniki from about 48 months to maximum 2 months (Figure 25).
Scaling up of the needle and syringe programme
Albeit concentrated only in Athens,86 the number of syringes distributed or exchanged through low‐threshold settings and outreach work has been substantially increased since 2010.
More specifically:
85 Micha K. 2012. Greek Organisation against Drugs: Update and Response to the HIV/IDU epidemic, Presentation to ECDC Technical
Meeting, 10 September 2012. Athens: OKANA. 86 As of September 2012.
HIV outbreak among injecting drug users in Greece – An updated report to the EMCDDA 2012
24
Between 2010 and 2011, there was an almost 100% increase in the number of syringes that were handed out by all sites to active users, while the number of syringes already distributed in the first 8 months within 2012 has already overhauled that of the entire 2011 (Figure 27).
ΜΑVΥ‐ΟΚΑΝΑ increased, as of May 2011, the number of syringes allowed for exchange (from 25 to 40 per IDU weekly).
HCDCP intensified its mobile prevention services via the missions of its mobile medical units (Department of Community Intervention) targeting marginalised groups in downtown Athens
As of October 2012, KETHEA introduced a pilot syringe exchange programme in the open drug scenes of Athens.
OKANA is ready to launch a streetwork programme in Thessaloniki (the 2nd largest city in Greece after Athens), while also put pressure towards the setting up of a supervised drug injection facility in the Athens city centre.
As stated earlier in this report, about 43 syringes per IDU were available only in Athens in 2011 (almost tripled compared to 2010). However, according to the recent trends in NSP provision presented above, this number is expected to be higher for 2012 (Figure 28), albeit nowhere near to the coverage levels required in cases of outbreaks.
Scaling up of other harm reduction interventions
In an effort to reduce the risks for blood‐borne infections and in full accordance with the WHO guidelines, OKANA has, since September 2011, replaced the high dead space syringes handed‐out in the context of its NSP programme with low dead space syringes.
The ‘Use Instructions’ intervention has been running in the Athens city centre since January 2012 targeting out‐of‐treatment IDUs and aiming at raising awareness and increasing knowledge on the health‐related harms involved in injecting. The intervention is run jointly by OKANA, HCDCP, PRAKSIS‐NGO, Positive Voice‐NGO, ATHENA‐YGEIA Prevention Centres, and Medecins du Monde‐NGO.87
An estimated 5,400 active drug users are expected to be approached, through snowballing, and offered prevention messages about HIV risks, information about safe use, means of prevention etc. in the context of the implementation of ‘Education and Promotion of Health of Active Drug Users’ programme run by OKANA (Funded through European Cohesion Policy Fund – NSRF 2007‐2013). It is expected that through the information networks that will be created in the hidden population of drug users, the relevant prevention messages will be diffused in a geometric progression.
The ARISTOTLE programme is expected to reach an estimated 7,000 IDUs and offer HIV prevention and health promotion services. ARISTOTLE aims inter alia at controlling the HIV‐1 outbreak among IDUs and their high risk contacts in Athens. The project forms a collaborative effort between Athens University, OKANA and HCDCP and is funded through European Cohesion Policy Fund (NSRF 2007‐2013).
OKANA alone, increased its campaigns aiming at disseminating through its outreach programs information on the health‐related risks involved in high risk injecting practices, the use of new substances also providing individual counselling on prevention of infectious diseases including training in safer drug use and harm reduction.
HCDCP expanded its ‘Outreach Programme on Health Care for socially vulnerable groups’ addressed also to active drug users providing inter alia HIV screening and information on infectious diseases.
OKANA plans the implementation of a campaign with the primary aim inter alia to highlight the importance of harm reduction programmes and change misconceptions about harm reduction’s effectiveness in combating the drug problem in Greece.
87 Quantitative information regarding the number of street/active users approached by this intervention was not available by the time
this report was compiled.
HIV outbreak among injecting drug users in Greece – An updated report to the EMCDDA 2012
25
KETHEA implemented a number of activities in the context of the H‐CUBE project (www.hcube‐project.eu) which aims to identify and disseminate good practices, contents and tools about hepatitis B virus (HBV), hepatitis C virus (HCV) and HIV training programmes and prevention campaigns aiming to help public administrations and NGOs in Greece.
Screening
HIV/AIDS anonymous screening and counselling, as well as antiretroviral therapy for HIV‐positive people and their sexual partners are provided for by law and are widely available. This also holds true for prevention interventions targeting AIDS or other infectious diseases, i.e. hepatitis B and C and tuberculosis.
Anecdotal evidence suggests that, owing to primarily the continuous raising of awareness both within and outside the networks of active users, the requests for screening for infectious diseases, most notably HIV, have been substantially increased of late by both problem users outside the treatment system and from those offered services in the OST programme. It is indicative that the number of tests conducted by MAVY‐OKANA for active users approaching the unit for health‐related problems increased by 1/3 (34% percentage change) between 2010 and 2011, while data from the first eight months in the present year suggest that the increase is expected to be significantly higher in 2012 (Figure 30 and Figure 31).
Within the drug treatment system, systematic HIV screening of IDUs in treatment programs was initiated (September 2011).
As of October 2012, more than 1,200 IDUs in Athens had been screened in the context of the ARISTOTLE study. Between September 2011 and June 2012, 2,312 blood tests have been conducted by the HCDCP mobile medical units in downtown Athens.88
PRAKSIS‐NGO finally intensified screening tests for HIV/AIDS for vulnerable social groups in Athens (1,332 rapid HIV tests were conducted between June 2010 and November 2011), while also strengthening partnerships with other NGOs and drug treatment services.
Vaccinations
OKANA increased the numbers of vaccinations for hepatitis A and B, tetanus and influenza for both individuals currently receiving OST and active users approaching low‐threshold services for health problems (Note: no quantitative data are available).
Infectious diseases treatment
Already before the HIV outbreak became evident, the protocols of OKANA pertinent to OST admission would foresee that all HIV‐positive problem drug users are offered prioritised OST and antiretroviral therapy. With the expansion of the OST programme through primarily the network of public hospitals (most OST units operate now within hospital premises) the treatment referral system is deemed to have been improved (Note: quantitative data regarding any change in the effectiveness of the new referral system are not available).
88 Mobile Medical Units‐HCDCP data presented at the ECDC Technical Mission held in Athens on September 10, 2012.
HIV outbreak among injecting drug users in Greece – An updated report to the EMCDDA 2012
26
Targeted interventions
A number of projects addressed to drug‐related problems among vulnerable groups are currently in progress, involving a wide array of governmental and non‐governmental organisations in Greece and abroad. EU funding has played an important role to this end.
Immigrants
Relatively low coverage in service provision (most notably in harm reduction) combined with a lower access of migrant drug users to these services render this group of the population as highly vulnerable for being infected by HIV. Several agencies have directed their interventions to address health‐related issues of migrant populations, concentrated nonetheless in Athens (i.e., HCDCP, KETHEA, OKANA, PRAKSIS‐NGO, Medecins Du Monde and other NGOs). OKANA, in particular, has put efforts towards adjusting its low‐threshold services to the needs of migrant drug users. More specifically, SFEA OKANA offers services to immigrants. Many of these services pertain to HIV and other infectious diseases issues. Twenty seven percent of those attending SFEA OKANA in 2010 were immigrants, 40% in 2011, and expected to be 30% in 2012. Services currently provided by SFEA‐OKANA to immigrants include:
legal assistance and support, mostly cooperation with the Immigration Agency for the provision of legal stay permits or IDs;
medical assistance and referrals (including escort) to health services;
treatment motivation and referrals to therapeutic programmes.
In order to upgrade services targeted at immigrants, OKANA participated in the EXASS NET‐network linking policy levels with front‐line professional experience, Pompidou Group 2011. Moreover, OKANA conducted an empirical study entitled ‘Immigrant drug users in Greece’, in collaboration with the National Centre for Social Research (EKKE), in June 2011 (European Integration Fund for Third Country Nationals: Action 2.4/09).
Arrested for drug‐related offences
Interventions are planned in order to have a continuity of treatment and risk reduction services within the police and judicial systems. These include:
Actions for the intensification of the cooperation and interaction between treatment and police and judicial systems;
Implementation of measures alternative to imprisonment as an effective way to reduce crime and other substance‐related problems including HIV risk;
Police staff training and sensitisation to drug‐related problems.
These interventions will be implemented in the framework of projects financed by the EU Fund (NSRF 2007‐2013): Pilot Project for Measures Alternative to Imprisonment (OKANA), Police‐staff Training in Drug‐related Issues (OKANA).
Prisoners
Title of programme: HIV services to prisoners & prison staff (NSRF 2007‐2013). The programme includes: Pilot Project for Measures Alternative to Imprisonment (OKANA); Pilot Project for the Launching Planned interventions for HIV prevention in prisons include:
Situation and needs assessment study regarding HIV in Korydallos Prison Complex and in Patra’s Male Judicial Prison;
Offering voluntary screening tests and counselling to prisoners and prison staff, distribution of information material in all correctional facilities;
Implementation of OST, condom provision, needles and syringe programmes.
HIV outbreak among injecting drug users in Greece – An updated report to the EMCDDA 2012
27
These interventions will be implemented in the framework of projects financed by the EU Fund (NSRF 2007‐2013): Pilot Project for Measures Alternative to Imprisonment (OKANA) Pilot Project for the Launching of 2 OST Units in Prison Setting (OKANA) Education and Promotion of Health of the Active Drug Users (OKANA).
Pregnant women
In an effort to better address issues pertaining to the prevention of the transmission of HIV to the children of pregnant and nursing mothers, as well as specialised reproductive health care issues, a special OST unit for pregnant women and mothers was launched in March 2012 in Athens.
The ARISTOTLE study
A new molecular epidemiological surveillance programme was initiated to describe the transmission networks, the origin of HIV strains and to identify index cases (May 2011). The programme is being currently linked to the ARISTOTLE study.
Inter‐organisational cooperation has been strengthened
Cooperation between organisations and agencies operating in the field of drug use and harm reduction has been intensified.
More specifically:
Since January 2012, OKANA, HCDCP, PRAKSIS‐NGO , Positive Voice‐NGO, ATHENA‐YGEIA Prevention Centres, and Medecins du Monde‐NGO have been jointly implementing the ‘Use Instructions’ intervention run in Athens with the aim of alerting street users in the health‐related harms involved in injecting. Similarly, Athens University, OKANA and HCDCP collaborate in the implementation of ‘A Seek‐Test‐Treat‐Retain (STTR) Intervention to Decrease HIV/AIDS Transmission among IDU in Athens metropolitan area’ research and prevention initiative that aims at controlling the HIV‐1 outbreak among IDUs in Athens.
In spring 2102, the Greek Reitox focal point, OKANA and HCDCP in collaboration with ECDC translated into Greek ‘The Joint European Guidelines on the Prevention of HIV and other Infections among Drug Injectors’ which were launched in October 2011 by ECDC and the EMCDDA.
The Greek Reitox focal point, OKANA, the HCDCP and Athens University (many times under the guidance of the EMCDDA and ECDC) increased their collaboration in an effort to improve monitoring (Greek focal point, OKANA), data analysis (Greek focal point, OKANA, the HCDCP and Athens University) and data interpretation (all).
HIV outbreak among injecting drug users in Greece – An updated report to the EMCDDA 2012
28
8. PROBLEMS AND FUTURE THREATS
Economic recession and budgetary cuts
Reductions in public health spending like those currently reported in the context of the implementation of the Memorandum89 may have undesirable effects on HIV prevention among IDUs. Due to the ongoing economic crisis, public health expenditure has already been affected, most notably the part foreseen for vulnerable populations including IDUs. For OKANA alone, public financing fell in 2011 by almost 40% compared to 2010, while similar cuts have also been reported for other treatment services. The lack of financial and human resources available for treatment and harm reduction services threatens to undermine the implementation of the planned interventions that rely on state funding.
Bureaucracy and governmental instability
An additional threat is that, although a number of the planned interventions foreseen to combat the epidemic are EU funded, this funding is nonetheless channelled through the state bureaucracy. Serious delays have already been reported in the progress of several projects owing to slow processes in the national bureaucratic mechanisms. In addition, owing to the political situation of late, delays have also been noticed in legislative revisions that are required in order for targeted interventions to come into force.
Opposition to the idea of harm reduction
Despite the explicit scientific evidence and the international – institutional – recognition of harm reduction as a strategy to reduce harm and especially prevent HIV, there is still much opposition to implementing harm reduction policies in Greece. Opposition is most commonly expressed through a lack of interest for cooperation between treatment services of different treatment philosophies and through community mobilisations against the establishment of OST units and other types of harm reduction facilities.90 The process of designing and implementing harm reduction interventions includes also investment on overcoming collegial and community fears and government concerns about the proposed interventions.
Lack of common understanding and coordination
There seems to be a lack of coordination at both the policy and operational level. At the policy level, HIV testing for IDUs is available free of charge upon entry in drug treatment settings; in AIDS reference centres; the HCDCP’s mobile units; and the NGO polyclinics. However, for all other health settings, fees for HIV testing have recently been introduced 91 (€2 for people with insurance and €9 for those uninsured), albeit not everywhere implemented. The introduction of HIV testing fees counteracts prevention considering that IDUs are likely to lack insurance and to be unable to pay the fee.
At the operational level, there is a lack of coordination between law enforcement and harm reduction services in Athens, which threatens to render many of the ongoing interventions in Athens highly ineffective. The lack of coordination results, inter alia, also from the lack of a common understanding over the idea of harm reduction. Police sweeping operations targeting mostly immigrants, but also IDUs, have increased in the last year resulting in the displacement of drug scenes where outreach work could have access. Cases of police confiscations on clean syringes from IDUs have also been anecdotally reported by
89 The agreement between Greece, the IMF, the EC and the European Central Bank.
90 Micha K. Greek Organisation against Drugs: Update and Response to the HIV/IDU epidemic, Presentation to ECDC 10 September
2012. Athens: OKANA2012. 91 Government Gazette of the Hellenic Republic; Issue 2; Number31100; December 30, 2011.
HIV outbreak among injecting drug users in Greece – An updated report to the EMCDDA 2012
29
street workers.92 However, for interventions to be effective they need to be implemented in locations where drug users meet, often within the criminalised context of drug use. It is in these contexts that harm reduction programmes must be allowed to operate without interference.
Lack of additional data on important indicators
There is lack of data from surveillance or formative research on various additional indicators such as:
risk behaviours other than injecting use (e.g., unprotected sex, sexual orientation engagement in transactional sex); IDU networks composition (e.g. increased number of injectors, increased number of sharing partners, population mixings);
IDU networks mixings with other networks of vulnerable groups (e.g. IDU networks; sex‐work; immigrants and other mixings); IDU risk perceptions over, e.g., injecting unknown substances, sharing used needles or being engaged in unprotected sex;
levels of awareness and knowledge on, e.g., the risks and the ways to circumvent them and of the seriousness of HIV infection; and socioeconomic conditions of the IDUs themselves and their immediate living environments (family, neighbourhood, wider area, etc.).
In addition, there are no data on the number of IDUs requiring ART or the number of IDUs receiving ART treatment (HCDCP has some data for ART uptake by IDUs).
Note, nonetheless, that the monitoring systems currently in operation in Greece (NFP, HCDCP, the ARISTOTLE study) are being reviewed in light of the emergent needs for surveillance.
92 Personal communication with street workers.
HIV outbreak among injecting drug users in Greece – An updated report to the EMCDDA 2012
30
9. FURTHER STEPS
Among the primary aims should be to contain the outbreak in Athens and within the IDU networks. One of the big challenges amidst economic crisis is how to best reallocate the already limited budgetary and human resources in order to maximise their impact in holding back the HIV outbreak. Among the encouraging aspects of the HIV outbreak in Greece is that, so far, it shows a considerable socio‐cultural and geographical concentration: the vast majority of the HIV cases involve IDUs and are reported in Athens. This allows for the development of rapid assessments and the implementation of cost‐effective responses that are geographically and logistically focused and manageable, as they are addressed to a theoretically definite population.
Immediate steps should include:
1. Further increases in the number of syringes distributed both by fixed sites and through outreach work in parts of the city where the highest levels of health‐risking behaviours are observed. An availability level of at least 200 syringes per IDU per year should be expected to be effective. However, syringe provision should also take into account – and meet – the actual needs for syringes as these are reported by the IDUs in the different parts of the city (studies are necessary to record the local needs for syringes). Extending the provision of out‐of‐hours syringe exchange and distribution should also be considered.
2. Further scaling up of the volume of services offered by OST sites in the Attica region with the aim to cover the needs of at least one in every two problem users seeking OST within a less than two months time period.
3. Increase awareness and referrals to screening via outreach work: support and further intensify outreach interventions in drugs scenes in Athens (and if logistically possible in other cities) with the aim to refer high risk groups to screening (especially immigrants) and to raise awareness on the health‐risking injecting behaviours, the use of unknown substances, and the engagement in unprotected sex.
4. Increase screening, ART treatment initiation, retention and adherence. Extending the availability of blood borne virus testing in NSP settings and through mobile health units should be considered.
All four key priorities presuppose close links and partnerships between the different agencies and different levels of administration. In addition, by providing a broad range of services it is likely to attract a diverse range of IDUs, including immigrants many of whom may lack formal documentation. Harm reduction and ART treatment programmes should be prepared to address the needs of these groups, i.e. immigrant IDUs should be able to access services in a variety of ways and at various times irrespective of their documentation status. Finally, harm reduction services are not available for IDUs in prisons in Greece. Attempts to pilot interventions of this kind in prisons should be encouraged and the outcomes of any such pilots should be evaluated.
Additional actions should include:
1. Increase awareness in IDUs already in treatment: networks of IDUs outside treatment and IDUs in treatments are very likely to be cross‐cutting. Contacts and treatment sessions with in‐treatment populations should include alerts over: the status of the HIV outbreak in Athens; the health risks involved in casual injecting behaviour (e.g., syringe sharing, injecting of stimulants, etc.); the importance of HIV screening, abstaining from injecting behaviour and, most importantly, taking up and adhering to ART treatment. To this end, a specialised training for treatment personnel may be necessary and it could be done within the existing budgets of each treatment agency in the country.
2. Encourage multi‐agency collaboration towards the implementation of behavioural indicators that are meaningful for monitoring and evaluating HIV interventions for IDUs. Collaboration should involve drug treatment and harm reduction centres and NGOs working with high risk groups.
HIV outbreak among injecting drug users in Greece – An updated report to the EMCDDA 2012
31
3. Implement thematic, trend‐spotting discussions: with the guidance and the active involvement of the Greek focal point (epidemiology, EWS), plan and implement thematic, trend‐spotting discussions (focus‐groups) involving, e.g., out‐of‐treatment IDUs, treatment personnel, GPs within the drug‐treatment system who work with HIV‐positive IDUs, and police personnel involved in street‐level/user‐level seizures in Athens, in order to better understand the processes currently taking place in the drug scenes in downtown Athens, better interpret epidemiological data and validate anecdotal evidence.
4. Advance analysis of sentinel data: with regard to improving the monitoring system and the understanding of trends, the following steps should be taken in the short term:
Advancing analyses of the existing data;
Increase efforts to persuade data providers to provide their infectious diseases data to the focal point monitoring system on a monthly basis, while also maintaining high coverage;
Improve existing indicators and add new indicators in the DRID monitoring system;
Join evidence from different indicators (drug‐related and non‐drug related indicators);
Add ‘qualitative’ input via trend‐spotting; focus groups or interviews with IDUs, treatment and street‐work staff); and,
Study of risk perceptions in IDU samples.
HIV outbreak among injecting drug users in Greece – An updated report to the EMCDDA 2012
32
ANNEX 1 ‐ FIGURES AND TABLES
HIV outbreak among injecting drug users in Greece – An updated report to the EMCDDA 2012
33
Figure 1. HIV reported cases by probable route of transmission in Greece (2006‐Aug2012)
256
314
362
206183
161157
87
0
50
100
150
200
250
300
350
400
2006 2007 2008 2009 2010 2011 2012(Aug '12)
HIV+ reported
cases, N IDUs
MSM
Unknown
Heterosexuals
Source: HCDCP, Data presented at the ECDC Technical Mission held in Athens on September 10, 2012
Figure 2. IDUs as a proportion among HIV cases in Greece (2006‐Aug2012)
27%
41%
38%
27%
19%21%
16%11%
0%
10%
20%
30%
40%
50%
60%
2006 2007 2008 2009 2010 2011 2012(as of
Aug '12)
HIV+ by transm
ission route, %
IDUs
MSM
Unknown
Hetero
Source: HCDCP, Data presented at the ECDC Technical Mission held in Athens on September 10, 2012
Figure 3. HIV cases attributed to IDU in Greece, by sex (2006‐August 2012)
256
314
208
249
48
65
0
50
100
150
200
250
300
350
2006 2007 2008 2009 2010 2011 2012
Number of HIV+ cases, N
Total
Males
Females
Source: HCDCP, Data presented at the ECDC Technical Mission held in Athens on September 10, 2012
HIV outbreak among injecting drug users in Greece – An updated report to the EMCDDA 2012
34
Figure 4. Percentage of males and females among HIV cases attributed to IDU in Greece (2006‐August 2012)
81% 79%
19%
21%
0%
10%
20%
30%
40%
50%
60%
70%
80%
90%
2006 2007 2008 2009 2010 2011 2012
Percentage, %
Males
Females
Source: HCDCP, Data presented at the ECDC Technical Mission held in Athens on September 10, 2012
Figure 5. HIV cases attributed to IDU in Greece, by nationality (Jan/Aug 2011 – Jan/Aug 2012)
256
314
207 207
4267
7
40
0
50
100
150
200
250
300
350
2011 Jan‐Aug 2012
Number, N
Total
Greek
Non‐Greek
Unknown
Source: HCDCP, Data presented at the ECDC Technical Mission held in Athens on September 10, 2012
Figure 6. Percentage HIV cases attributed to IDU in Greece, by nationality (Jan/Aug ’11‐Jan/Aug ‘12)
80.9
66.0
16.4
21.3
2.7
12.7
0
10
20
30
40
50
60
70
80
90
2011 Jan‐Aug 2012
Percentage, %
Greek
Non‐Greek
Unknown
Source: HCDCP, Data presented at the ECDC Technical Mission held in Athens on September 10, 2012
HIV outbreak among injecting drug users in Greece – An updated report to the EMCDDA 2012
35
Figure 7. HIV prevalence among IDUs tested in Greece, by source reporting to the NFP (2002‐2011)
0.40.7
4.4
8.5
0.5
0.8
3.74.0
1.5
0.0
5.6
0123456789
101112131415
2002(1,695)
2003(2,113)
2004(2,229)
2005(1,834)
2006(2,168)
2007* 2008(1,563)
2009(1,941)
2010(2,028)
2011(2,269)
2012*(2,827)
HIV+ves am
ong IDUs, %
Year (number of IDUs tested)
Data source 1
Data source 2
Data source 3
Notes: *2007 data not available. For 2011: Data source 1: consists of IDUs accessing OST (60.0%), drug‐free (5.9%) and low‐threshold (34.1%) settings; national sample; n=1,557 IDU tests in 2011 and n=2,550 in 2012 (only in Athens). Data source 2: consists of drug‐free settings; national sample; n=592 tested in 2011 and n=577 in 2012. Data source 3: consists of drug‐free settings; Athens sample; n=89 tested in 2011 and no data available as yet for 2012. Source: Greek Reitox focal point.
Figure 8. HIV tests conducted and HIV prevalence in IDUs tested at MAVY Athens (2011‐September 2012)
140112
143 155
230
162187
123
329 339363 360
309
187
582
196
262 283 296
135
323
0
100
200
300
400
500
600
700
800
900
1000
0
10
20
30
40
50
Jan '11(N=140)
Feb '11(N=112)
Mar '11(N=143)
Apr '11(N=155)
May '11(N=230)
June '11(N=162)
July '11(N=187)
Aug '11(N=123)
Sep '11(N=329)
Oct '11(N=339)
Nov '11(N=363)
Dec '11(N=360)
Jan '12(N=309)
Feb '12(N=187)
Mar '12(N=582)
Apr '12(N=196)
May '12(N=262)
June '12(N=283)
July '12(N=296)
Aug '12(N=135)
Sep' 12(N=323)
Number of tests conducted
, N
HIV positivity rate, %
Month (Number of tests conducted)
% HIV positive IDUs tested at MAVY‐OKANA
Number of tests conducted in MAVY‐OKANAHIV prevalence in 2012; 8.6%
HIV outbreak among injecting drug users in Greece – An updated report to the EMCDDA 2012
36
Figure 10. Trends in HCV antibody prevalence among IDUs, in Athens and in other areas (data source 1; 2002‐2011)
62
67,2
61,2 61,7
66
55,5
64,3
69,3 69,3
40,835,8
44,2 43,3 42,644,9 43,5
48,7
62,4
42,248,1 48,2 45,9 48,6
44,2
35,6
44,4
79,3
0
500
1000
1500
2000
2500
0
20
40
60
80
100
2002(1,686)
2003(2,140)
2004(2,230)
2005(1,889)
2006(2,198)
2007* 2008(1,569)
2009(1961)
2010(2,015)
2011(2,165)
Number of IDUs tested, N
HCV antibody prevalence, %
Year (total number of IDUs tested)
Data source 1
Data source 2
Data source 3
Number of IDUs tested
*2007 data not available. In 2011: Data source 1 consists of IDUs accessing OST (60.0%), drug‐free (5.9%) and low‐threshold (34.1%) settings; national, non‐representative sample. N=1,481 IDU tests in 2011. Data source 2: consists of drug‐free settings; national sample; n=526 tested in 2011. Data source 3: consists of drug‐free settings; Athens sample; n=29 tested in 2011. Source: Greek Reitox focal point.
Figure 11. Trends in HCV antibody prevalence among IDUs, in Athens and in other areas (data source 1; 2002‐2011)
66.370.3
63.866.8
68.5
60
68.3
74.676.5
49.1
56.8 56.6
50.5
61.7
47.6
59.3 60 61.6
0
20
40
60
80
100
2002(985;332)
2003(1,060;317)
2004(878;495)
2005(696;315)
2006(816;473)
2007* 2008(463;269)
2009(569;432)
2010(757;427)
2011(773;708)
HCV antibody prevalence, %
Year (total number of PWID tested : Athens; other areas)
Athens
Other areas
*2007 data not available. In 2011 data source 1 consists of IDUs accessing OST (60.0%), drug‐free (5.9%) and low‐threshold (34.1%) settings; national, non‐representative sample. Source: Greek Reitox focal point.
Figure 12. Trends in HCV antibody prevalence among young IDUs (<25 years of age) (data source 1; 2008‐2011)
42.6
49.9
61.2
52.2
40.338.8
52.452.5
34.8
25.0
40.0
52.6
0
20
40
60
80
100
2008 2009 2010 2011
HCV antibody prevalence, %
Year
Athens
National
Other areas
*2007 data not available. In 2011 data source 1 consists of IDUs accessing OST (60.0%), drug‐free (5.9%) and low‐threshold (34.1%) settings; national, non‐representative sample. Source: Greek Reitox focal point.
HIV outbreak among injecting drug users in Greece – An updated report to the EMCDDA 2012
37
Figure 13. Trends in HCV antibody prevalence among ‘new’ IDUs (<2 years of injection) (data source 1; 2008‐2011)
33,9
44,7
59,4
76,5
29,3
39
55,552,4
21,2
28,8
51,949,2
0
20
40
60
80
100
2008 2009 2010 2011
HCV antibody prevalence, %
Year
Athens
National
Other areas
*2007 data not available. In 2011 data source 1 consists of IDUs accessing OST (60.0%), drug‐free (5.9%) and low‐threshold (34.1%) settings; national, non‐representative sample. Source: Greek Reitox focal point.
Figure 14. Trends in HCV antibody prevalence among IDUs also injecting cocaine/crack (data source 1; 2008‐2011)
62,565,0
69,6
95,0
50,0 46,8
66,1 70,4
33,333,3
63,964,8
0
20
40
60
80
100
2008 2009 2010 2011
HCV antibody prevalence, %
Year
Athens
National
Other areas
*2007 data not available. In 2011 data source 1 consists of IDUs accessing OST (60.0%), drug‐free (5.9%) and low‐threshold (34.1%) settings; national, non‐representative sample. Source: Greek Reitox focal point.
Figure 15. Trends in the number of drug treatment demands in Greece, by primary substance 2002‐2011 (TDI)
0
500
1000
1500
2000
2500
3000
3500
4000
4500
5000
2002(3630)
2003(3637)
2004(4269)
2005(4248)
2006(4847)
2007(4786)
2008(4682)
2009(5501)
2010(5645)
2011(5834)
Number, N
Opioids
Cannabis
Cocaine/crack
Medicines
Other
Source: Greek Reitox focal point.
HIV outbreak among injecting drug users in Greece – An updated report to the EMCDDA 2012
38
Figure 16. Trends in drug treatment demands in Greece, by nationality 2002‐2011 (TDI)
Source: Greek Reitox focal point.
Figure 17. Trends drug treatment demands in Greece, by work status 2002‐2011 (TDI)
0
500
1000
1500
2000
2500
3000
3500
4000
0
10
20
30
40
50
60
70
80
90
100
2002(3,630)
2003(3,637)
2004(4,269)
2005(4,248)
2006(4,847)
2007(4,786)
2008(4,682)
2009(5,501)
2010(5,645)
2011(5,834)
Occupational status, N
Occupational status, %
Year (number of treatment demands)
Unemployed (%) Other status (%)
Unemployed (n) Other status (n)
Source: Greek Reitox focal point.
Figure 18. Trends in drug treatment demands in Greece, by living status 2002‐2011 (TDI)
Source: Greek Reitox focal point.
HIV outbreak among injecting drug users in Greece – An updated report to the EMCDDA 2012
39
Figure 19. Percentage of IDUs reporting ‘always’ use of condom with steady partner
20,623,2 23,5
31,4
27 20,921 ,6
26 ,5
2 0 ,9
39 ,536 ,9
22 ,2
1 7
18 ,9
26 ,6
19 ,4
15 ,920 ,5
0
20
40
60
80
100
2005(1,011)
2006(1,289)
2007* 2008(732)
2009(971)
2010(1,184)
2011(1,481)
IDU
S w
ho a
lway
s us
e co
ndo
ms,
%
Year (number of IDUs asked)
National sample
Athens
Other areas
(*) Data for 2007: not available. In 2011 data source 1 consists of IDUs accessing OST (60.0%), drug‐free (5.9%) and low‐threshold (34.1%) settings. Source: Greek Reitox focal point.
Figure 20. Percentage of IDUs reporting ‘always’ use of condom with casual partner
46,347,7
53,9
63,9
59,3 53,449 ,3
55 ,8
48 ,9
75 ,57 1 ,3
7 4 ,7
3 9 ,84 0 ,4
57 ,454 ,4
50 ,4 48 ,5
0
20
40
60
80
100
2005(1,011)
2006(1,289)
2007* 2008(732)
2009(971)
2010(1,184)
2011(1,481)
IDU
S w
ho a
lway
s us
e co
ndom
s, %
Year (number of IDUs asked)
National sample
Athens
Other areas
(*) Data for 2007: not available. In 2011 data source 1 consists of IDUs accessing OST (60.0%), drug‐free (5.9%) and low‐threshold (34.1%) settings. Source: Greek Reitox focal point.
Figure 21. Expansion of OST units in Greece between August 2011 and August 2012
25
42
51 52
65
7
18
23 2326
1313
17 17
27
511 11 12
12
0
10
20
30
40
50
60
70
80
90
100
Aug '11 Oct '11 May '12 Aug '12 Expected in the near future
Number of OST units, N
Total OST units
Athens
Other cities
Thessaloniki
Source: OKANA.
HIV outbreak among injecting drug users in Greece – An updated report to the EMCDDA 2012
40
Figure 22. Number of individuals receiving OST in Greece on a given day of the year/month (2005‐ August 2012)
27793193
3439
4068
47715101
5659
74117620
1450 16121735 1947 2058 2098 2267
2795 2845
696790
8921015 1182
1236 1262 20632075
633791
812
11061531
1767 21302553
2700
0
1000
2000
3000
4000
5000
6000
7000
8000
9000
2005 2006 2007 2008 2009 2010 Aug '11 May '12 Aug '12
OST clients, N
Total OST clients
Athens
Thessaloniki
Other cities
Source: OKANA.
Figure 23. Mean monthly number of applications for OST (2005‐ August 2012)
132133
146
184 187
155
231
192
57 54 5157 60 56
110
76
5353
68
102 10681
72 69
22 26 28 2522
1849 55
0
30
60
90
120
150
180
210
240
270
300
2005 2006 2007 2008 2009 2010 2011 Aug '12
Mean num
ber of dem
ands for OST, N
Total demands (mean)
Athens
Other cities
Thessaloniki
Source: OKANA.
Figure 24. Number of applicants on waiting list for OST in a given day of the year/month (2005‐ August 2012)
38503875
4681
52615558 5394 5290
3006 3012
27572828
31573569
37713689
3770
2708 2643
585 739996 930
1117 1072 1062
147217
508308
528762
670 633 458 151152
0
1000
2000
3000
4000
5000
6000
7000
2005 2006 2007 2008 2009 2010 Aug '11 May '12 Aug '12
Drug users waiting for OST, N
Total in waiting OST
Athens
Thessaloniki
Other cities
Source: OKANA.
HIV outbreak among injecting drug users in Greece – An updated report to the EMCDDA 2012
41
Figure 25. Mean waiting time for receiving OST (in months) (Jul ‘11‐ Aug ‘12)
88
9084
44.5 46.548
51 2 2
0
10
20
30
40
50
60
70
80
90
100
Jul '11 Sep '11 Oct '11 May '12 Aug '12
Months, N
Athens
Thessaloniki
Source: OKANA.
Figure 26. OST coverage in Athens 2005‐2012
16.8 17.320.8
26.3
17.0
20.728.1
34.7 35.3
0
10
20
30
40
50
60
70
80
90
100
2005 2006 2007 2008 2009 2010 Aug '11 May '12* Aug '12*
OST coverage, %
Coverage refers to the percentage of problem drug users (estimate) offered OST in Athens in a given year (where applicable in the graph). OST data have been provided by OKANA. In Greece, problem drug users are almost exclusively problem opioid users. (*) Figures for May and August 2012 are based on the 2011 central estimate in Athens. Source: Greek Reitox focal point.
Figure 27. Number of syringes exchanged/distributed in Athens (2009‐2012)
6857961515
119397
127313
5548348546
88958
13096 12970
30439
0
30000
60000
90000
120000
150000
2009 2010 2011 August '12*
Num
ber of syringes, N
Total number of syringes exchanged / distributed
Syringes exchanged
Syringes distributed
(*) 2012 data as of August 31 and only by OKANA. Figures shown for 2011 and 2012 do not include syringes that have potentially reached IDUs through interventions targeting vulnerable groups in Athens. Source: focal point of the EMCDDA‐Greece. Data from OKANA, Medecins du Monde.
HIV outbreak among injecting drug users in Greece – An updated report to the EMCDDA 2012
42
Figure 28. NSP coverage in Athens 2004‐2012
5.9 8.4 10.7
20.3 19.3 21.515.7
42.645.4
0
10
20
30
40
50
60
70
80
90
100
2004 2005 2006 2007 2008 2009 2010 2011 Aug '12*
Syringes per estim
ated
IDU in Athens, N
Coverage refers to the annual number of syringes available per problem injecting drug user in Athens (estimate). The number of syringes used for the calculations for the years 2011 and 2012 do not include syringes that have potentially reached IDUs through interventions targeting vulnerable groups in Athens. (*) Based on 2011 central estimate for IDUs in Athens Source: Greek focal point
Figure 29. Number of condoms handed‐out to street users (2009‐2012*)
18703
14239
24184
43410
0
5000
10000
15000
20000
25000
30000
35000
40000
45000
50000
2009 2010 2011 2012*
Num
ber of condoms, N
(*) 2012 data as of August 31 and only by OKANA. Source: focal point of the EMCDDA‐Greece. Data from OKANA, KETHEA Medecins du Monde, and ATHINA‐YGEIA Prevention Centres.
HIV outbreak among injecting drug users in Greece – An updated report to the EMCDDA 2012
43
Figure 30. Number of HIV tests performed at MAVY‐OKANA (2009‐2012*)
18301725
2647
13761288
2064
454 437
583
0
1000
2000
3000
4000
2009 2010 2011 2012*
Number of HIV tests conducted, N
Total number of HIV tests performed by MAVY‐OKANA
HIV tests performed by MAVY‐OKANA for IDU entering treatment
HIV tests performed by MAVY‐OKANA for out‐of‐treatment IDUs
(*) 2012 data: not available. Source: focal point of the EMCDDA‐Greece. Data: MAVY‐OKANA.
Figure 31. Number of drug users tested for HIV at MAVY‐OKANA (2009‐2012*)
17171650
2565
3375
13761288
2064
434 416
560
0
1000
2000
3000
4000
2009 2010 2011 2012*
Num
ber of drug users tetsted for HIV, N
IDUs tested for HIV at MAVY‐OKANA
IDUs entering treatment tested for HIV at MAVY‐OKANA
Out‐of‐treatment IDUs tested for HIV at MAVY‐OKANA
(*) 2012 data estimation based on an average 281 individuals tested monthly. Source: focal point of the EMCDDA‐Greece. Data: MAVY‐OKANA.
HIV outbreak among injecting drug users in Greece – An updated report to the EMCDDA 2012
44
Figure 32. OST coverage among estimated problematic opioid users in the EU, 2009 or most recent year available
0
10
20
30
40
50
60
70
80
90
Slova
kia
Polan
d
Lithuan
ia
Greec
e
Cypru
s
Hungar
y
Czech
Rep
.
Finla
ndIta
ly
Irela
nd
Austri
a
Germ
any
Norway
The Net
herla
nds
Luxem
bourg
Mal
ta
Op
ioid
ma
inte
na
nce
tre
atm
en
t clie
nts
(%
)
Source: EMCDDA
Figure 33. Syringes distributed through specialised programmes per estimated IDU per year (2004–09, EU, Croatia and Norway)
0
50
100
150
200
250
300
350
400
Cypru
s
Sweden
Greec
e
Slovak
ia
Latvi
a
Hunga
ry
Croat
ia
Czech
Rep
ublic
Portu
gal
Estonia
Mal
ta
Luxe
mbo
urg
Norway
Nu
mb
er o
f sy
rin
ges
Source: EMCDDA
HIV outbreak among injecting drug users in Greece – An updated report to the EMCDDA 2012
45
Table 1. HIV prevalence in IDUs tested at ARISTOTLE, by demographic characteristics (2012)
Table 2. HCV antibody prevalence in IDUs accessing treatment, by IDU characteristics (2011)
HIV outbreak among injecting drug users in Greece – An updated report to the EMCDDA 2012
46
Table 3. Differences in the characteristics of treatment demands between Athens and other areas (TDI 2011)
HIV outbreak among injecting drug users in Greece – An updated report to the EMCDDA 2012
47
Table 4. Prevalence of HIV‐1 subtypes
Subtypes (n, %) Populations
A CRF35_AD
B CRF14_BG
CRF02_AG
Others Total
Total sampled HIV‐1 infected population (1998‐2009)
572 (24.6%)
0 1,396 (60.0%)
0 44 (1.9%)
315 (13.5%)
2,327
IDUs (1998‐2009) 22 (28.9%)
0 43 (56.6%)
0 4 (5.3%)
7 (9.2%)
76
IDUs (2010‐7/2011) 10 (12.0%)
36 (43.4%)
16 (19.3%)
19 (22.9%)
1 (1.2%)
1 (1.2%)
83
Source: National Retrovirus Reference Centre, Department of Hygiene, Epidemiology and Medical Statistics, Medical School, University of Athens Table 5. Phylogenetic clusters of IDUs HIV‐1 sequences sampled over the years 1998‐2012 in Greece
HIV spread (n, %) Populations
Clustered infections Non‐clustered infections Total
IDUs 1998‐2009 4 (5.3%) 72 (94.7%) 76
IDUs 2010 5 (50.0%) 5 (50.0%) 10
IDUs 2011 71 (97.3%) 2 (2.7%) 73
Source: National Retrovirus Reference Centre, Department of Hygiene, Epidemiology and Medical Statistics, Medical School, University of Athens
Table 6. Description of clusters
IDU Clusters Number of IDUs within the cluster
Sampling period
Ethnic origin of potential founder
Geographic origin
CRF35_AD 36 (45%) 2011 Iran Afghanistan/Iran
CRF14_BG 19 (24%) 2010‐2011 Bulgaria S.W. Europe
Subtype B 12 (15%) 2011 Greece Greece
Subtype A 5 (6%) 2011 Greece Greece
AFSU 2 (3%) 2010 NA FSU countries
CRF02_AG 2 (3%) 2005‐2010 NA NA
Subtype B 2 (3%) 2002‐2010 NA NA
Subtype B 2 (3%) 2002‐2003 NA NA
Source: National Retrovirus Reference Centre, Department of Hygiene, Epidemiology and Medical Statistics, Medical School, University of Athens
HIV outbreak among injecting drug users in Greece – An updated report to the EMCDDA 2012
48
Table 7. Changes between 2008 and 2011 in the drug use patterns in Athens, all users, only IDUs and only IDUs mainly injecting the main substance (TDI)
Table 8. Changes between 2008 and 2011 in the characteristics of the out‐of‐treatment IDUs in Athens (n=636; TDI)
HIV outbreak among injecting drug users in Greece – An updated report to the EMCDDA 2012
49
Table 9. Changes between 2008 and 2011 in the injecting patterns among IDUs in Athens who reported injecting as the main route of administration (TDI 2008, 2011)
Table 10. ART Initiations by transmission group and year (2008‐2012)
Source: HCDCP
HIV outbreak in injecting drug users in Greece – Updated report to the EMCDDA 2012
51
HIV outbreak among injecting drug users in Greece: An updated report for the EMCDDA on the recent outbreak of HIV infections among drug injectors in Greece Athens, Greece 31 October 2012